Embed Size (px)
Citation preview
THE BRITISH SURVEY OF
Fertiliser Practice
FERTILISER USE ON FARM CROPS FOR CROP YEAR 2015
© Crown Copyright 2016 First published 2016 British Library Cataloguing in Publication Data. A catalogue record for this book is available from the British Library. ISBN 978-0-99297-351-3 The United Kingdom Statistics Authority has designated these statistics as National Statistics, in accordance with the Statistics and Registration Service Act 2007 and signifying compliance with the Code of Practice for Official Statistics. Designation can be broadly interpreted to mean that the statistics:
• meet identified user needs; • are well explained and readily accessible; • are produced according to sound methods; and • are managed impartially and objectively in the public interest.
Once statistics have been designated as National Statistics it is a statutory requirement that the Code of Practice shall continue to be observed.
Limited extracts from this publication may be reproduced provided that the source is acknowledged. Further statistical analyses of the survey results are also available. For details and other enquiries please contact: Alison Wray Defra Room 201, Foss House Peasholme Green York YO1 7PX Email: [email protected] Tel: +44 (0) 20 802 66119 https://www.gov.uk/government/collections/fertiliser-usage
i
FOREWORD
The British Survey of Fertiliser Practice provides information on fertiliser and manure use on the major crops and grass grown in mainland Britain. The 2015 Survey was funded by the Department for Environment, Food and Rural Affairs (Defra) and the Scottish Government. The Survey has the full support of the Farmers' Unions in England, Scotland and Wales. The Survey is carried out annually and is based upon returns from a sample of farms. In 2015, the Survey was co-ordinated by GfK Kynetec, who was responsible for the survey design, data collection, statistical analysis and quality control monitoring. Data uses and comparison to the EU The information in this publication is widely used by the UK government and the EU, industry and researchers and collects data on trends in usage and application rates of nitrogen, phosphate, potash, sulphur, organic manures and lime on agricultural crops and grassland in Great Britain. The Survey data provide important evidence to assess greenhouse gas emissions from agriculture, informing the ammonia and greenhouse gas inventories and for the development of possible mitigation measures. Additionally the data provide information on fertiliser use in NVZs (nitrate vulnerable zones) and for developing and assessing the impact of policy on water quality, particularly the Nitrates Directive (Council Directive 91/676/EEC). The data have also been used for indicators on nutrient balances, other indicators relating to environmental impacts and other cross cutting work looking at links between fertiliser use and productivity (benchmarking) and economic performance. Industry and government use the data to monitor best practice.
Information on all of these topics are available from the Gov.UK website and includes information on, greenhouse gas emissions, agriculture and climate change, NVZs and soil nutrient balances which are of particular relevance.
The data contribute to the meeting of certain legislative obligations at a national and EU level. Information on the use of fertilisers across the EU is available from the Eurostat website. It includes a summary report with a comparison of the usage and links to detailed data for the individual countries. Other information Defra also run other surveys which may be of relevance to fertiliser use and related practices through its Farm Practices Survey for England, which is available on the Defra website. Contact information and feedback Contact details are available at the front of this publication for feedback or for questions about the information provided. Data revisions See section A2.6 for details of revisions made in 2015. April 2016
ii
ACKNOWLEDGEMENTS
The sponsors gratefully acknowledge the co-operation of all farmers taking part in the 2015 British Survey of Fertiliser Practice. We wish to thank all those involved for their assistance and support in the design, conduct and analysis of the Survey. The agronomic interpretation of the Survey results benefited from advice from Chris Dawson (Chris Dawson and Associates), agronomic consultant to the Agricultural Industries Confederation (AIC). Kate Benford1
1 GfK Kynetec, Weston Court, Weston, Newbury, Berkshire RG20 8JE
iii
CONTENTS LIST OF TABLES AND FIGURES v
EXECUTIVE SUMMARY viii
SECTION A The British Survey of Fertiliser Practice 1
A1 Introduction and structure of the report 1 A1.1 History
1
A2 Survey methodology 2 A2.1 Sample 2 A2.2 Data collection 4 A2.3 Data quality assurance 4 A2.4 Accuracy and reliability of the information 5 A2.5 Methodology for total fertiliser use 5 A2.6 Revisions 6 A2.7 Definitions of terms 7 A2.8 Types of fertiliser
9
A3 General trends and issues 10 A3.1 Crop areas and weather conditions 10
SECTION B Commentary on fertiliser use in Great Britain 12
B1 2015 results for Great Britain and changes in recent years 13 B1.1 Overview of fertiliser use on all crops and grass 13 B1.1.1 Nitrogen 13 B1.1.2 Phosphate, potash and sulphur
15
B1.2 Fertiliser use on major tillage crops 16 B1.2.1 Nitrogen 20 B1.2.2 Phosphate and potash 23 B1.2.3 Sulphur
23
B1.3 Fertiliser use on grassland 24 B1.3.1 Nitrogen 25 B1.3.2 Phosphate and potash 27 B1.3.3 Sulphur
28
iv
B2 Longer term trends for Great Britain 29 B2.1 Nitrogen use 29 B2.1.1 Nitrogen use on major tillage crops 31 B2.1.2 Autumn and winter applications of nitrogen fertiliser 32 B2.2 Phosphate and potash use 33 B2.2.1 Phosphate and potash use on major tillage crops 37 B2.3 Straw removal 39 B2.4 Total quantities of nitrogen phosphate and potash, UK 40 SECTION C Tables of data derived from the 2015 survey Contents 42Tables 44
SECTION D Use of organic manures 78 D1 Farms handling organic manure 78 D2 Use of organic manure 82 D3 Fertiliser value of organic manure 87
SECTION E Farming practices 91 E1 Spreading precision, record keeping, soil testing 91
APPENDICES Appendix 1 95App 1.1 Sampling variation 95App 1.2 Response rate 96App 1.3 Information on holdings below 20 hectares
97
Appendix 2 98App 2.1 English counties within BSFP and Government Office Regions
98
Appendix 3 99App 3.1 UK farm classification system 99
v
LIST OF TABLES AND FIGURES
Table ES1 Nutrient and dressing cover, current and five year mean overall application rate for all crops and grass, Great Britain 2015
viii
Table A2.1 Derivation of the stratified random sample for the 2015 survey, England & Wales 3Table A2.2 Derivation of the stratified random sample for the 2015 survey, Scotland 4Table A3.1 Cropping and grassland areas, Great Britain 2013/2014 - 2014/2015 10Table B1.1 Overall nitrogen use, Great Britain 2011 – 2015 13Table B1.2a Overall phosphate and potash use, Great Britain 2011 - 2015 15Table B1.2b Overall sulphur use, Great Britain 2011 - 2015 16Table B1.3a Overall fertiliser use on major tillage crops, Great Britain 2011 - 2015 17Table B1.3b Average field rates on major tillage crops, Great Britain 2011 - 2015 18Table B1.4 Dressing cover on major tillage crops, Great Britain 2011 - 2015 19Table B1.5 Average field application rates of nitrogen on cereals by market use,
Great Britain 2011 - 2015 20
Table B1.6 Percentage distribution of cereal crop areas by market use, Great Britain 2011 - 2015
20
Table B1.7 Average field application rates of nitrogen on winter and spring oilseed rape, Great Britain 2011 - 2015
22
Table B1.8 Dressing cover and average application rate of sulphur on cereals and oilseed rape, Great Britain 2011 – 2015
23
Table B1.9 Dressing cover of sulphur on cereals and oilseed rape by region, 2011 - 2015 24Table B1.10 Overall fertiliser use on grassland, Great Britain 2011 - 2015 24Table B1.11 Dressing cover and average application rate of fertiliser on grassland,
Great Britain 2011 – 2015 25
Table B1.12 Grassland utilisation, Great Britain 2011 – 2015 25Table B1.13 Nitrogen application rates by grassland utilisation, Great Britain 2011 – 2015 26Table B1.14 Phosphate and potash use by grassland utilisation, Great Britain 2011 - 2015 27Table B1.15 Sulphur use on grassland, Great Britain 2011 – 2015 28Table B2.1 Total overall nitrogen application rates, England & Wales 1974 - 2015 and Scotland
and Great Britain 1983 – 2015 29
Table B2.2 Dressing cover of autumn or winter-applied (August to January) nitrogen on winter cereals and winter oilseed rape and average application rate for winter oilseed rape, England & Wales 1984 – 1998 and Great Britain 1999 – 2015
32
Table B2.3 Total overall phosphate application rates, England & Wales 1969 - 2015 and Scotland and Great Britain 1983 – 2015
34
Table B2.4 Total overall potash application rates, England & Wales 1969 - 2014 and Scotland and Great Britain 1983 – 2015
35
Table B2.5a Phosphate dressing covers (%), Great Britain 2004 - 2015 36Table B2.5b Potash dressing covers (%), Great Britain 2004 - 2015 36Table B2.6 Quantities of major nutrients used, UK 1965 – 2015 40Table D1.1a Numbers and percentage of farms using each type of manure in Great Britain, 2015 78Table D1.1b Percentage of farms using each type of manure in Great Britain, 2011 - 2015 78Table D1.1c Dressing cover of organic manure in Great Britain, 2011 - 2015 79
vi
Table D1.2 Number and percentage of farms using each type of application method by slurry type, Great Britain 2015
79
Table D1.3 Percentage of organic manure incorporated (volume and area) on tillage fields by incorporation time and manure/slurry type, Great Britain 2015
80
Table D1.4a Use of contractors to spread manure/slurry in current season, Great Britain 2015 80Table D1.4b Use of contractors to spread manure/slurry, Great Britain 2011 - 2015 80Table D2.1a Percentage of sown area receiving each organic manure type, Great Britain 2011
- 2015 83
Table D2.1b Percentage distribution of each organic manure type on manured sown area, Great Britain 2011 - 2015
83
Table D2.2 Typical dry matter and nutrient content of different organic manure types 84Table D2.3a Treated areas and average field application rates to winter sown and spring sown
crops and grassland by manure type, Great Britain 2015 84
Table D2.3b Cattle FYM treated areas and average field application rates to winter sown and spring sown crops and grassland by farm type, Great Britain 2015
85
Table D2.4 Percentage of each organic manure type applied by sowing season and timing, Great Britain 2015
86
Table D3.1a Dressing cover and application rates of manufactured fertiliser to tillage crops in Great Britain, with and without applications of organic manure, 2015
87
Table D3.1b Overall application rate of manufactured fertiliser application to tillage crops in Great Britain, with and without applications of organic manure, 2011 - 2015
88
Table D3.2 Average field rates of manufactured fertiliser application on grassland with and without applications of organic manure by robust type group, Great Britain 2015
89
Table D3.3a Average field rates of manufactured fertiliser application on dairy grassland with and without applications of organic manure, Great Britain 2015
90
Table D3.3b Average field rates of manufactured fertiliser application on dairy grassland with and without applications of organic manure, Great Britain 2011 - 2015
90
Table E1.1 Frequency of spread pattern checks using a catch tray, Great Britain 2011 - 2015 91Table E1.2a
Record keeping methods for fertiliser and manure applications on farms where each respective nutrient type was applied during the 2014/15 crop year, Great Britain 2015
91
Table E1.2b
Record keeping methods for fertiliser and manure applications on farms where each respective nutrient type was applied during the 2014/15 crop year, by farm type, Great Britain 2015
92
Table E1.2c Record keeping methods for fertiliser and manure applications on farms where each respective nutrient type was applied during the crop year, Great Britain 2011 - 2015
93
Table E1.3 Soil testing for tillage and grass, Great Britain 2015 93Table App1.1 Standard errors of application rates for the major crops in 2015 95Table App1.2 Response to main and reserve samples in 2015 96Table App1.3 Response to main and reserve samples for 2011 - 2015 96Figure ES1 Overall fertiliser use (kg/ha) on all crops and grass, Great Britain 1983 - 2015 ixFigure A3.1 Monthly rainfall as a percentage of the long term average 11Figure B1.1 Overall fertiliser use on all crops and grass, Great Britain 2011 - 2015 13Figure B1.2 Overall straight and compound nitrogen use, Great Britain 2011 - 2015 14Figure B2.1 Overall application rates of total nitrogen on tillage crops and grassland,
Great Britain 1983 – 2015 30
vii
Figure B2.2 Overall application rates of straight and compound nitrogen, on tillage crops and grassland, Great Britain 1992 – 2015
31
Figure B2.3 Overall application rates of total nitrogen, on major arable crops, Great Britain 1983 – 2015
31
Figure B2.4 Overall application rates of phosphate and potash, on tillage crops and grassland, Great Britain 1983 – 2015
33
Figure B2.5 Overall application rates of phosphate and potash, on major arable crops and grassland, Great Britain 1983 – 2015
37
Figure B2.6 Percentage of straw removed from wheat and barley fields, harvest years 1984 – 2014
39
Figure D1.5a Temporary field heaps of manure, establishment and spreading, Great Britain 2015 81Figure D1.5b Temporary field heaps of manure, duration of storage, Great Britain 2015 81Figure E1.4a Security guidance unprompted awareness, Great Britain 2015 94Figure E1.4b Security guidance prompted awareness, Great Britain 2015 94
viii
EXECUTIVE SUMMARY
The British Survey of Fertiliser Practice is an annual, nationally representative interview survey based on the selection of a random stratified sample of farms from mainland Britain. The main purpose of the survey is to estimate average application rates of nitrogen, phosphate and potash used for agricultural crops and grassland. The data provide important evidence to assess greenhouse gas emissions from agriculture and for developing possible mitigation measures. Information is also collected on applications of sulphur fertilisers, organic manures and lime. The main findings from the 2015 Survey on the use of the nutrients nitrogen, phosphorus, potassium and sulphur in Great Britain are summarised below (Table ES1). Cropping patterns can influence fertiliser rates and dressing covers observed. In 2015 there was a 0.9% decrease in the total area of tillage crops planted, with the areas of winter wheat and winter oilseed rape both down on the previous year. Conversely, the area of legumes grown increased by just over 55%. The weather is discussed more fully in Section A3.1 with a more detailed overview of the data in Section B and crop level information summarised in tables GB1.1-1.3 of Section C. Table ES1 Nutrient dressing cover, current and five year mean overall application rates for all
crops and grass, Great Britain 2015 All Tillage All Grass All Crops and Grass Total Nitrogen - N Overall application rate, 2015 (kg/ha) 146 56 98
Mean overall application rate, 2011-2015 (kg/ha) 144 57 97
Crop area receiving dressing, 2015 (%) 91 60 75
Average field rate, 2015 (kg/ha) 161 93 132 Total Phosphate - P2O5 Overall application rate, 2015 (kg/ha) 29 9 18
Mean overall application rate, 2011-2015 (kg/ha) 29 9 18
Crop area receiving dressing, 2015 (%) 49 41 45
Average field rate, 2015 (kg/ha) 60 22 41 Total Potash - K2O Overall application rate, 2015 (kg/ha) 38 12 24
Mean overall application rate, 2011-2015 (kg/ha) 39 13 24
Crop area receiving dressing, 2015 (%) 50 42 46
Average field rate, 2015 (kg/ha) 75 30 53 Total Sulphur - SO3 Overall application rate, 2015 (kg/ha) 31 3 16
Mean overall application rate, 2011-2015 (kg/ha) 29 3 14
Crop area receiving dressing, 2015 (%) 52 10 30
Average field rate, 2015 (kg/ha) 59 31 54
ix
Figure ES1 Overall fertiliser use (kg/ha) on all crops and grass, Great Britain 1983 - 2015
0102030405060708090
100110120130140150160
1983
1984
1985
1986
1987
1988
1989
1990
1991
1992
1993
1994
1995
1996
1997
1998
1999
2000
2001
2002
2003
2004
2005
2006
2007
2008
2009
2010
2011
2012
2013
2014
2015
kg/h
a nu
trien
t
Nitrogen Phosphate Potash
Nitrogen • Nitrogen usually has a large immediate effect on crop growth, yield and quality. Most agricultural soils
contain too little naturally occurring plant-available nitrogen to meet the needs of a crop so supplementary nitrogen applications have to be made each year.
• The 1 kg/ha decrease in total nitrogen use on all crops and grassland in 2015 resulted from a 4 kg/ha decrease in the overall rate on grass, as the overall rate on tillage crops was unchanged at 146 kg/ha. The rate on tillage crops remains in the typical 145-150 kg/ha range which has been observed for the majority of the 30 years of the survey. The previous lows for 2008 and 2009 were attributed mainly to the high fertiliser prices.
• Nitrogen levels applied to grassland have been consistently lower than tillage crops. Whereas overall nitrogen rates on tillage have remained constant, since 2000 the overall applications made to grass have seen a significant decline. However this trend changed after 2009 and since then the overall nitrogen rate on grassland has remained relatively steady. The decline in cattle numbers is thought to have contributed to this reduction in the nitrogen rate on grassland, possibly in conjunction with some improvement in manure use efficiency.
• Overall application rates of nitrogen on winter wheat and winter barley increased 5 kg/ha and 3 kg/ha respectively. The overall nitrogen rate on spring barley decreased by 1 kg/ha to 105 kg/ha, with the 2013 rate being the highest recorded since 2002. Total nitrogen on oilseed rape and sugar beet increased by 2 kg/ha in 2015, to 193 and 98 kg/ha respectively.
Phosphate and potash • Phosphate and potash are applied in fertilisers and manures, particularly to replace the quantities
removed in harvested crops. Most British soils can hold large quantities of these nutrients for crop uptake over several years. Consequently the timing of maintenance application tends to be less time critical compared to nitrogen or sulphur. This may help to explain the trend seen for overall declining dressing cover on combinable crops, especially in England.
• Overall rates of phosphate and potash applied to tillage crops are about three times those used on grassland. However there is greater use of applied manures on grassland (33% cover) than on tillage crops (23% cover) and grazed grassland also receives manure as it is grazed.
x
• Overall phosphate use on tillage crops declined gradually between 1984 and 1996. Thereafter the decline in rates became more marked until 2009, after which there was some recovery and relative stability, with an overall rate of 29 kg/ha in 2015. This is the third lowest rate since Great Britain records began. The overall rate of phosphate on grassland was highest in 1983, at 28 kg/ha, and remained relatively stable between 1984 and 1998. Overall application rates have declined more rapidly between 1999 and 2009, but remained relatively stable since then, with a rate of 9 kg/ha in 2015.
• Overall potash application rates on tillage crops declined slightly between 1983 and 1997, with the rates in the 60-68 kg/ha range. Like phosphate, overall application rates reduced at a greater rate after this time, dropping to their lowest levels of 33 kg/ha in 2009 when fertiliser prices were high. Between 2011 and 2015 overall potash application rates have been apparently stable in the range 37-40 kg/ha.
• Whilst the pattern of use of potash on grassland has been more variable, this has also shown a net decline between 1983 and 2015. Overall potash rates were relatively stable at 31-33 kg/ha during the mid-late 1980s but, since then, tended to decline, although achieving some stability in the range 12-14 kg/ha since 2008.
• It is of note that in Scotland the phosphate and potash application rates on tillage land have largely been maintained, relative to the decline seen in England, and although there has been a slight reduction in dressing covers and overall rates since 2003 they are relatively stable again on tillage by 2015. However there was a significant reduction in dressing cover and overall rate of phosphate and potash on grassland between 2004 and 2011, although more recent data indicate a return to stability.
Sulphur • Sulphur is an essential plant nutrient and is a component of most proteins as well as activating certain
enzyme systems. In the past sulphur demand was satisfied through atmospheric deposition but this has reduced significantly. Therefore there is a need for sulphur application to crops and grass; with crops such as oilseed rape being particularly sensitive to sulphur deficiency. Elemental sulphur can also be used as a soil acidifier for potatoes which can offer some protection against scab although sulphur as a nutrient is usually applied in the sulphate form.
• The Survey has collected detailed information on sulphur (SO3) fertiliser use since 1993, when only 3-6% of the cereal crop areas and 8% of the oilseed rape area received a sulphur application. By 1997, these proportions had increased markedly to 13-14% for cereals and 30% for oilseed rape. Dressing covers for sulphur generally remained fairly static until 2002, and then increased steadily to 2007. Dressing covers reduced in 2008 and 2009 for all cereals except winter barley. In 2015 cereals sulphur dressing covers were in the 48%-62% range. The 73% dressing cover for winter oilseed rape was a 3% decrease from 2014.
• In 2015, 30% of all crops and grass received a dressing of sulphur, this figure was 52% for tillage crops. On tillage crops the overall application rate for sulphur was 31 kg/ha, unchanged from 2014. Applications on grass decreased in 2015 to 3 kg/ha, this low overall rate is caused by the low dressing cover, with only 10% of grass receiving a sulphur dressing.
Organic manures • Historically, the Survey has focussed on the application of manufactured fertilisers although in recent
years (since 2007) it has also collected information on the use of organic manures. The nutrient levels in organic manures vary according to the type of manure but provide a valuable source of nitrogen, phosphorus and potassium. Where used, applications of manufactured fertiliser can usually be reduced.
• In 2015, around 65% of farms in the survey used organic manures on at least one field on the farm. Cattle manure from beef and dairy farms is by far the largest volume of manure type generated in Great Britain. 34% of cattle manure and 65% of slurry applications were made to grassland, reflecting the practice of utilising the manure on the farm on which it is produced.
• Fields of winter sown crops mainly receive a manure dressing in August and September, prior to drilling, whereas spring sown and grass fields are predominantly dressed between November and April.
1
SECTION A
THE BRITISH SURVEY OF FERTILISER PRACTICE
A1 INTRODUCTION AND STRUCTURE OF THE REPORT
The British Survey of Fertiliser Practice (BSFP) is the primary source of data on organic and inorganic fertiliser use in Great Britain. The results from the Survey are used by the British fertiliser industry, by Government and by the wider agricultural community. It is essential that the claims made from the Survey are underpinned by an effective methodology. Section A2 describes this methodology, detailing measures undertaken to avoid bias and unreliability. National changes in relative cropping areas are discussed in Section A3. Section B provides a commentary of recent changes in survey data and longer term trends. It includes estimates of total fertiliser which are given in Table B2.6. These data are derived from BSFP findings, confidential trade and sales data and HMRC import/export statistics. Section C presents the main tables of results from the Survey, grouped by geographic coverage. They include major crop groups, grassland, product types and farm types plus information on timing of applications. Figures for estimates of 'total', 'straight' and 'compound' nutrient rates are presented in separate tables. Section D provides an analysis of the application of organic manures and manufactured fertilisers. Section E contains more general information on farm practices such as spreader checking, record keeping and soil testing. Datasets for key data series are available via the Defra website. A1.1 HISTORY The survey has been in existence, in various forms, since 1942 for England & Wales. It was extended to Scotland in 1983. Historical data from 1942 to 1997 have been summarised in several reviews spanning this period of time.2, 3, 4, 5 The current methods of survey design and implementation are the result of adaptation of the original design from Rothamsted Experimental Station, undertaken by Edinburgh Data Library at the University of Edinburgh between 1992 and 1998. From 1999 until 2003 design and analysis was undertaken by the Rural Business Unit at the University of Cambridge and from 2004 by GfK Kynetec (formerly Kynetec Limited), who also retained responsibility for conducting the fieldwork.
2 Yates, F. and Boyd, D.A. (1965). Two decades of Surveys of Fertiliser Practice. Outlook on Agriculture 5, 203-210. 3 Church, B.M. and Lewis, D.A. (1977). Fertiliser use on farm crops, England and Wales: Information from the Survey of
Fertiliser Practice, 1942-1976. Outlook on Agriculture 9, 186-193. 4 Chalmers, A.G., Kershaw, C.D. and Leech, P.K. (1990). Fertiliser use on farm crops in Great Britain: Results from the
Survey of Fertiliser Practice, 1969-1988. Outlook on Agriculture 19, 269-278. 5 Chalmers, A.G., Renwick, A.W., Johnston, A.E. and Dawson, C.J. (1999). Design, development and use of a national
survey of fertiliser applications. Proceedings International Fertiliser Society 437.
2 2
A2 SURVEY METHODOLOGY
A2.1 SAMPLE This survey is based on a sample of holdings in order to reduce burdens and manage resources. The Survey sample is selected from the population of agricultural holdings compiled using the June Agricultural Survey (a sample survey conducted annually which records information on farm size, cropping, stocking and employment). In each year, two samples are extracted from the June Survey, one for England & Wales and one for Scotland. Holdings less than 20 hectares in size are excluded from the BSFP sample. These smaller farms account for a significant proportion of the number of holdings but a much smaller proportion of the area of crops and grass. At Great Britain level, holdings below this size account for 4% of the total crop area and 10% of the total grass area. Further information is provided in Appendix 1.3. Using this threshold reduces the number of farms which need to be sampled so reducing burdens and costs without significant adverse impact on the quality of the data. The data for the medium and large farms will be representative of the very small farms which are excluded, meaning that the overall figures are representative of all farms. Standard errors are reported in Appendix 1.1. In England & Wales, farms are classified into one of three types, cropping, livestock and horticulture. Farms are then further classified into four size groups. In Scotland, a similar number of size groups are used but farms are classified into only two types, mainly cropping and mainly livestock. These higher level farm types are based on groupings of the standard UK (and EU) farm classifications (called ‘robust’ types). Farms with a robust type of ‘Other’ (robust type 10) are not included in the sample. See A2.7 paragraph 9 for more details. The target sample size is 1500 farms. This sample size has been designed in order to achieve a statistically representative sample at the national level. The farms are allocated to each of the combinations of farm type and size in proportion to the total area of crops and grass recorded in the June Survey (the latest available data). The exception to this is that in England & Wales the number of farms in the horticultural group are sampled at a higher rate to ensure sufficient numbers for a robust estimate to be made. See Tables A2.1 and A2.2 for the number of farms selected. Three reserves are selected for each farm in the main sample. The reserves will be the nearest holding (using the County/Parish/Holding (CPH) number) and of the same farm type and size. The survey is voluntary. Each farm in the main sample is contacted; if for whatever reason a farm is not able to take part in the survey, the first reserve for that farm is then contacted. If this farm also refuses then the second and if necessary the third reserve is contacted. If all four farms refuse then no farm is recruited into the survey. This resulted in an achieved sample size of 1,343 holdings in 2015, which is consistent with the previous year. More information on response rates is given in Appendix 1, in Tables App 1.2 and App 1.3. It should be noted that the underlying sample design is constructed to measure manufactured fertiliser usage and may not wholly represent the population of farmers using organic manures so some of these data, especially where sample sizes are small, need to be treated with appropriate caution. To help improve the survey response and to reduce the year-on-year variability, a core of respondents complete the survey each year. This was introduced in 2000 when approximately one third of the sample agreed to stay in the survey for a number of years. Between 2006 and 2007 a review of the panel structure was undertaken to ensure that the proportion of respondents who had participated on the panel for five consecutive years or more constituted no more than 20% of the total sample. In 2015, 69% of the sample had responded in the previous year. The profile of the panel in terms of farm size was 71% >200ha, 66% 100-200ha, 67% 50-100 ha and 69% >20-50 ha. The sample responses are raised to be representative of the national population by using the inverse of the achieved sampling fraction (i.e. the number of holdings in the population divided by the achieved sample size in each strata) as the weight. The validity of the derived weights are assessed by calculating a weighted crop area for the most extensively grown crops by this method and comparing this to the latest
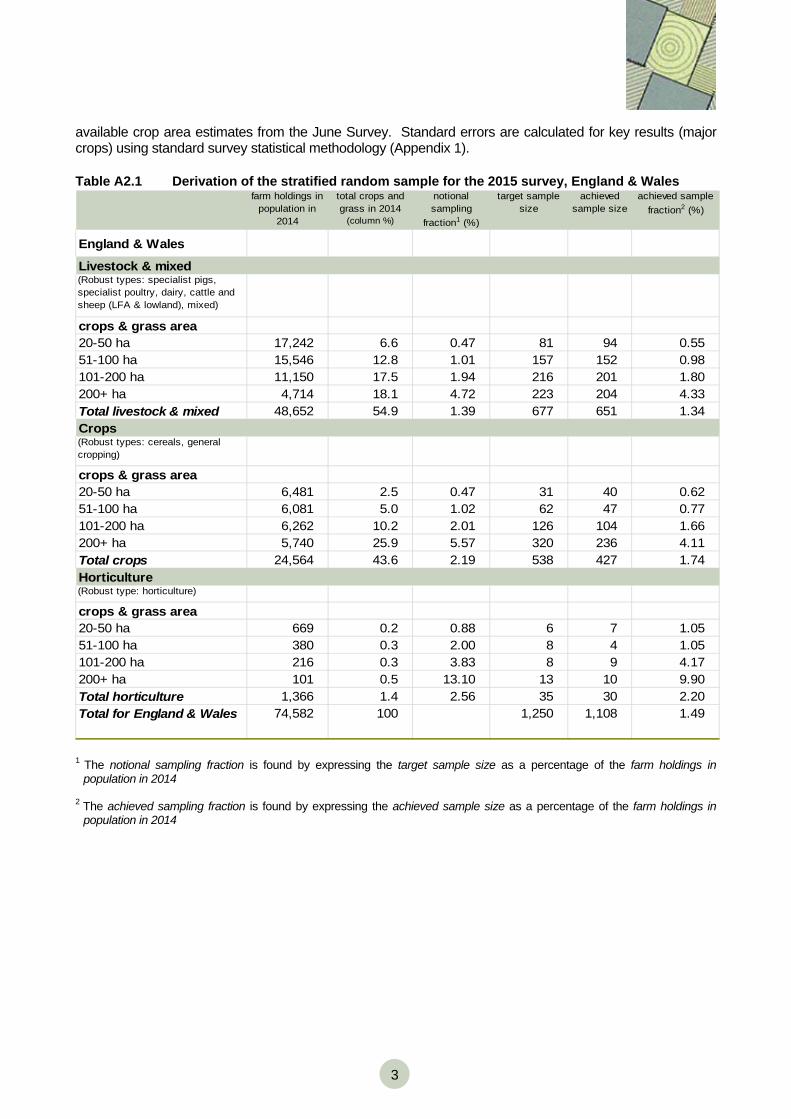
3
available crop area estimates from the June Survey. Standard errors are calculated for key results (major crops) using standard survey statistical methodology (Appendix 1).
Table A2.1 Derivation of the stratified random sample for the 2015 survey, England & Wales farm holdings in
population in 2014
total crops and grass in 2014
(column %)
notional sampling
fraction1 (%)
target sample size
achieved sample size
achieved sample fraction2 (%)
England & Wales
Livestock & mixed(Robust types: specialist pigs, specialist poultry, dairy, cattle and sheep (LFA & lowland), mixed)
crops & grass area20-50 ha 17,242 6.6 0.47 81 94 0.5551-100 ha 15,546 12.8 1.01 157 152 0.98101-200 ha 11,150 17.5 1.94 216 201 1.80200+ ha 4,714 18.1 4.72 223 204 4.33Total livestock & mixed 48,652 54.9 1.39 677 651 1.34Crops(Robust types: cereals, general cropping)
crops & grass area20-50 ha 6,481 2.5 0.47 31 40 0.6251-100 ha 6,081 5.0 1.02 62 47 0.77101-200 ha 6,262 10.2 2.01 126 104 1.66200+ ha 5,740 25.9 5.57 320 236 4.11Total crops 24,564 43.6 2.19 538 427 1.74Horticulture(Robust type: horticulture)
crops & grass area20-50 ha 669 0.2 0.88 6 7 1.0551-100 ha 380 0.3 2.00 8 4 1.05101-200 ha 216 0.3 3.83 8 9 4.17200+ ha 101 0.5 13.10 13 10 9.90Total horticulture 1,366 1.4 2.56 35 30 2.20Total for England & Wales 74,582 100 1,250 1,108 1.49
1 The notional sampling fraction is found by expressing the target sample size as a percentage of the farm holdings in
population in 2014 2 The achieved sampling fraction is found by expressing the achieved sample size as a percentage of the farm holdings in
population in 2014
4 4
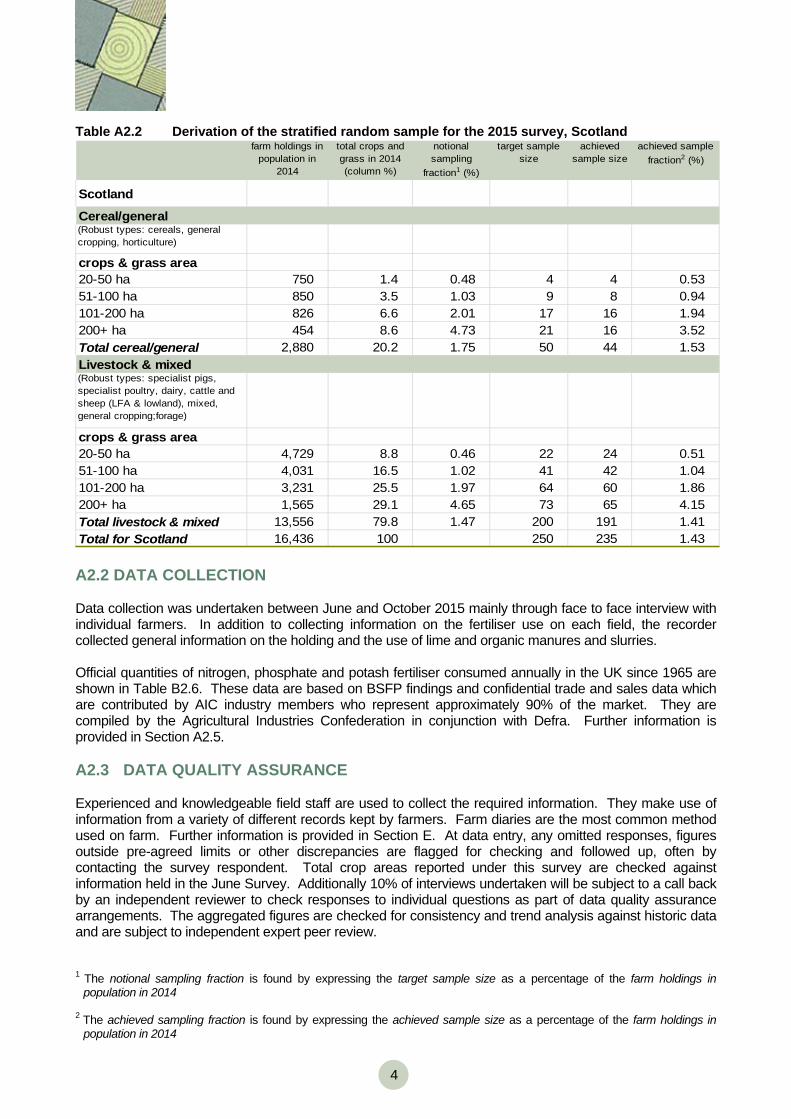
Table A2.2 Derivation of the stratified random sample for the 2015 survey, Scotland farm holdings in
population in 2014
total crops and grass in 2014 (column %)
notional sampling
fraction1 (%)
target sample size
achieved sample size
achieved sample fraction2 (%)
Scotland
Cereal/general (Robust types: cereals, general cropping, horticulture)
crops & grass area20-50 ha 750 1.4 0.48 4 4 0.5351-100 ha 850 3.5 1.03 9 8 0.94101-200 ha 826 6.6 2.01 17 16 1.94200+ ha 454 8.6 4.73 21 16 3.52Total cereal/general 2,880 20.2 1.75 50 44 1.53Livestock & mixed(Robust types: specialist pigs, specialist poultry, dairy, cattle and sheep (LFA & lowland), mixed, general cropping;forage)
crops & grass area20-50 ha 4,729 8.8 0.46 22 24 0.5151-100 ha 4,031 16.5 1.02 41 42 1.04101-200 ha 3,231 25.5 1.97 64 60 1.86200+ ha 1,565 29.1 4.65 73 65 4.15Total livestock & mixed 13,556 79.8 1.47 200 191 1.41Total for Scotland 16,436 100 250 235 1.43 A2.2 DATA COLLECTION Data collection was undertaken between June and October 2015 mainly through face to face interview with individual farmers. In addition to collecting information on the fertiliser use on each field, the recorder collected general information on the holding and the use of lime and organic manures and slurries. Official quantities of nitrogen, phosphate and potash fertiliser consumed annually in the UK since 1965 are shown in Table B2.6. These data are based on BSFP findings and confidential trade and sales data which are contributed by AIC industry members who represent approximately 90% of the market. They are compiled by the Agricultural Industries Confederation in conjunction with Defra. Further information is provided in Section A2.5. A2.3 DATA QUALITY ASSURANCE Experienced and knowledgeable field staff are used to collect the required information. They make use of information from a variety of different records kept by farmers. Farm diaries are the most common method used on farm. Further information is provided in Section E. At data entry, any omitted responses, figures outside pre-agreed limits or other discrepancies are flagged for checking and followed up, often by contacting the survey respondent. Total crop areas reported under this survey are checked against information held in the June Survey. Additionally 10% of interviews undertaken will be subject to a call back by an independent reviewer to check responses to individual questions as part of data quality assurance arrangements. The aggregated figures are checked for consistency and trend analysis against historic data and are subject to independent expert peer review. 1 The notional sampling fraction is found by expressing the target sample size as a percentage of the farm holdings in
population in 2014 2 The achieved sampling fraction is found by expressing the achieved sample size as a percentage of the farm holdings in
population in 2014
5
A2.4 ACCURACY AND RELIABILITY OF THE INFORMATION The use of sampling in this survey means that there will be certain limitations associated with the data associated with this. The sampling methodology used is described more fully in Section A2.1 but essentially uses a random stratified sampling strategy approach, with an element of a core panel, to obtain a representative sample. A response rate of 53% was achieved in 2015, which was a 1% increase from 2014. Sampling errors arise because even with careful selection, the sample cannot be exactly representative of all the population. The size of the sampling error will depend on the size of the sample (the larger the sample the smaller the error) but also on the variance of the data. An indication of the extent to which the sample result deviates from the population can be obtained from measuring the standard error associated with the data. A fuller description of this standard statistical measure with the sampling variation/standard errors for the main arable crops, all tillage crops and all grass are reported in Appendix 1, Table App1.1. These can be used to help judge whether apparent changes may be real or attributable to sampling variation alone. The standard errors are relatively small for all tillage crops, all crops and the main arable crops of wheat, oilseed rape and barley. The standard errors are higher for sugar beet and potatoes where sample sizes (crop area, number of respondents) are smaller. Figures reported for some of the smaller crops, where the sample size is relatively low, need to be treated with appropriate caution. Sample size information is provided in the tables in Section C and help to provide an indication of reliability. For crops where the sample size is relatively small it is advisable to use data from several years and to assess trends over a longer time period rather than just considering year on year changes. For potatoes in particular, part of the reason for apparent fluctuations in estimates of nutrient application rates may be because fewer numbers of fields of potatoes are covered by the Survey than would be expected from a sample survey. This is due to the fact that fields of potatoes on respondent’s farms may be let out and grown by a third party so it is not possible to record information in the Survey. Furthermore, fields of potatoes grown by a respondent but not on his own farm are not captured in the Survey. The statistics on the pattern of fertiliser practice reported for Great Britain largely reflect practice in England and Wales due to its greater area of total crops and grassland: about 9.2 million hectares in England and Wales and about 1.9 million hectares in Scotland. The estimates of the average field rates provide a better indication than overall application rates of actual usage levels and also of any annual variation in fertiliser practice on farms. The overall application rate takes into account both the average field rate and the proportion of the crop area treated, giving an overview of the crop as a whole. The definitions of the terms used are set out in Section A2.7 of this report. Additionally, the survey design has been constructed to measure use of manufactured fertilisers so may not be wholly representative of manure use so some of these data, especially where sample sizes are small, need to be treated with caution. A2.5 METHODOLOGY FOR TOTAL FERTILISER USE Official quantities of nitrogen, phosphate and potash fertiliser consumed annually in the UK since 1965 are shown in Table B2.6. These data are based on BSFP findings, HMRC import data and confidential trade and sales data which are contributed by AIC industry members who represent approximately 90% of the market. They are compiled by the Agricultural Industries Confederation with input and peer review by an expert group convened by the AIC and in liaison with Defra. It would be possible to use BSFP data alone to estimate total fertiliser use by taking the average rate for each individual crop and multiplying by the June crop area estimate and summing these to give an overall usage. However the relatively low coverage of the BSFP survey for some crops, means that the alternative approach of combining BSFP data with trade and sales data provides more robust total usage estimates than using BSFP data alone. This method also takes into account use on small farms (<20 ha) and use in Northern Ireland.
6 6
The AIC survey their members (16 businesses) monthly to collect information on fertiliser deliveries. The BSFP fertiliser statistics published and used in the industry and agricultural sector are by fertiliser year (growing season, July to June), not by calendar year. They are available at the AIC website. Individual returns are quality assured by trend analysis against historic data and also against the aggregate trend. Any omitted data or anomalous figures outside trend or other pre-defined limits are checked and followed up, usually by contacting the survey respondent. The AIC also purchase monthly HMRC trade statistics on imports and exports of fertilisers; these data are actively used and scrutinised, and where appropriate challenged by the trade. Twice a year, in December and June, and on an annual basis, aggregated figures for total fertiliser deliveries for the main types of fertiliser are calculated, together with nutrient contents. These are assessed with the import and export figures to derive the base total fertiliser usage figures. The N:P:K ratio from the BSFP survey is compared with the AIC derived figures to confirm the nutrient quantities relative to each other. Further small adjustments may be made based on other confidential information on stocks or non-fertiliser use of imported urea. These AIC usage figures are compared to usage figures derived from BSFP and June crop area figures and the relationship between the ratios of N, P and K from both sets of data are checked and compared. Any inconsistencies or anomalies identified in the data are identified and followed up and any necessary corrections are made to ensure comparability and consistency across all data. Each year the AIC figures are reviewed and quality assured for credibility and consistency across sources by a group of experts contributing knowledge on production, use and trade. The final agreed aggregated total UK usage figures are subject to independent peer review and checked for consistency and trend analysis, taking into account known agronomic and market factors. The total fertiliser use is then split by country. The figures for Northern Ireland are taken from their fertiliser survey and the remaining GB figures are split between England plus Wales and Scotland by applying the proportions derived from the BSFP data. The NI Survey provides data by quarter amalgamated by calendar year. A2.6 REVISIONS The figures presented in this report are finalised. The dressing cover percentage of sulphur on grassland for 2014 (Table B1.11) has been corrected. We will provide information on any further revisions we make to the report or the datasets if any inaccuracies or errors occur.
7
A2.7 DEFINITIONS OF TERMS 1. For the purpose of the Survey, the term Great Britain (or Britain) is defined to cover England
(including the Isle of Wight), Wales (including Anglesey) and mainland Scotland. 2. The survey year ran from autumn 2014 to autumn 2015, corresponding to the 2015 season or
harvest year. The recording period for fertiliser applications varied for different crop and grass groups on farms of not less than 20 hectares (ha) in size.
3. For the purposes of this survey, a field is defined as any single area of land measuring more
than 0.2 ha (half an acre) which had a uniform cropping and fertiliser history from autumn 2014. For data collection and processing purposes, separate fields with identical cropping and fertiliser management on the same farm are blocked together as one ‘field’, to represent the total combined area of those fields. Areas within the same natural boundary receiving different treatments (crops on fertilisers) were recorded separately. Agricultural land which had been set-aside under the Single Payment Scheme was recorded, but was not included in analyses unless it was used to grow an industrial crop. Fallow land other than set-aside has always been collected by the survey, but is not included in the calculations of this report.
4. In the report, tillage is defined as all crops except grass, forestry, glasshouse crops and
uncropped land designated as ‘set-aside’ under the Single Payment Scheme. Grass refers to all forms of grassland which may be grazed, conserved or grown for seed production; rough grazing is excluded.
5. The abbreviation N is used for nitrogen; P2O5 for phosphate; K2O for potash, SO3 for sulphur
and FYM for all types of organic manure e.g. slurries and solid manures. The phrase total use includes both straight (single nutrient) and compound (multi nutrient) products. Fertiliser products containing nitrogen and sulphur only are classified with straight nitrogen. Rates are expressed in terms of the equivalent nutrient content, taking into account the nutrient content in the product used. The nutrient content of the common fertiliser products including the dry matter content and nutrient content of various organic manures used are given in the Fertiliser Manual, RB 209 which is available on the Defra website.
6. For each fertiliser nutrient, the average field rate (of application) is defined as the sum of
nutrient applied divided by the total area of those fields which received any dressing of the nutrient and is calculated based on the sown area rather than the total field area. Crop area without any application of the nutrient is excluded from the calculation of the average field rates of application. These field-specific application rates provide direct evidence on the level and variation in farming practice.
7. The term dressing cover is used to describe the proportion of crop area treated with any
dressing of the fertiliser nutrient in question, and is stated as a percentage. 8. The overall application rate is defined as the total quantity of nutrient used, in kilograms (kg),
divided by the total extent of crop area, in hectares (ha) (including any areas without application of the nutrient). The application rate is calculated on the basis of the sown area rather than the total field area.
Any change in an overall application rate is due to a change in either the (actual) field rate of application used on farms, or to a change in the dressing cover, or to changes in both. Arithmetically, overall application rate is equivalent to the result of multiplying the average field rate of application by the proportion of crop area that receives any nutrient dressing. The overall application rate of a nutrient on a crop, by definition, cannot be greater than the average field rate of application.
8 8
9. The UK farm type system, which is based on the EU system, aggregates a wide range of defined farm types into ten 'robust' types: (1) Cereals (2) General Cropping (3) Horticulture (4) Specialist Pigs (5) Specialist Poultry (6) Dairy (7) Cattle and Sheep (LFA) (8) Cattle and Sheep (lowland) (9) Mixed (10) Other
Prior to 2004, the UK agricultural departments amalgamated the robust types ‘Specialist Pigs’ and ‘Specialist Poultry’ as the single robust type ‘Pigs and Poultry’. 2006 was the first year that the BSFP adopted the revised classification following analysis that showed this would not lead to under-representation of either of these farm types through marginalisation. The composition of ‘robust’ types is presented in greater detail in Appendix 3. The sampling framework outlined in Section A2.1 can be related to robust types as set out below. Revisions to the definitions of farm types can be found at the following link: https://www.gov.uk/structure-of-the-agricultural-industry-survey-notes-and-guidance
Data presented in tables GB4.1 to GB4.5 are derived from the robust types shown below.
table number robust group in table title robust type name robust number GB4.1 cereal farms Cereals 1
GB4.2 general cropping General cropping and horticulture 2, 3
GB4.3 dairy farms Dairy 6
GB4.4 other livestock LFA and lowland grazing livestock 7, 8
GB4.5 mixed farms Mixed 9
These robust type groupings are also used in tables D2.3b, D3.2 and E1.2b. Due to the small number of specialist pigs and poultry farms interviewed in the survey, data collected from these robust types have not been presented in any of the tables listed above.
10. Regional analysis of the Survey data for England was classified in two ways in 2015. Table EW4.1a is based on the Government Office Regions (GORs) in common with other Defra surveys. Table EW4.1b is based on the former MAFF administrative regions, which were revised in 1996 to take account of changes to county boundaries and nomenclature resulting from the introduction of Unitary Local Authorities between April 1995 and April 1998. These revised regions, termed BSFP regions, have been the basis for regional analysis within the survey historically and are detailed in Appendix 2.
9
A2.8 TYPES OF FERTILISER Of the 16 essential plant nutrients, the four key ones required in relatively large amounts in order for crops to achieve their maximum yield potential are nitrogen, phosphorus, potassium and sulphur. Where nutrients are not available in sufficient quantity in the soil, fertiliser products are applied to supply the nutrient needs of the plant. Plant roots take up the nutrients dissolved in the water in the soil. The nutrients must be in the correct chemical form so that they are in a suitable water soluble form in order for plants to be able to use them. There are two broad types of fertiliser. Manufactured fertilisers tend to be relatively concentrated and supply essential nutrients in a mineral form which are immediately available for plant use. The other type is organic fertilisers which can be plant or animal based such as manure, slurry, compost or poultry litter. They are in their natural form or have undergone minimal processing. They are usually less concentrated than manufactured fertilisers, and often the nutrients they contain may need further breaking down in the soil by bacteria and other soil organisms before they are in a form available to plants. The chemical composition can vary greatly and they tend to be slower acting and less predictable in their action. Nitrogen is important for building DNA and proteins in plants. It encourages growth of stems and leaves by promoting protein and chlorophyll. Provided there are adequate supplies of water and other nutrients, nitrogen usually has a large effect on crop growth, yield and quality. Whatever the source, to be usable by plants, it has to be in the form of inorganic ammonium or nitrate ions. The main forms of inorganic nitrogen fertilisers are ammonium nitrate, urea, ammonium phosphates and ammonium sulphate. Phosphorus is essential for photosynthesis and respiration. It promotes early root formation and growth and enhances seed and fruit production. It is also important for energy production and storage. In the context of fertilisers it is measured and defined as P2O5 . Phosphate fertilisers include ammonium phosphate and superphosphate. The majority of phosphorus in most soil is in essentially insoluble forms, and unavailable to plants. Phosphorus is very immobile in soil and the forms that are created and their availability are dependent on factors such the soil pH, temperature and moisture. Plant roots take up nearly all phosphorus as either the primary or secondary orthophosphate anion (H2PO4
- or HPO4-2, respectively). Generally the maximum availability of
phosphorus occurs in soils within a pH range of 6.0-7.0. Potassium contributes to many plant functions apart from managing the water status, including shoot and root tip growth, cell extension, photosynthesis and the reduction of drought and disease stress. It is used in the process of building and transporting starches, sugars and proteins so is important for grain and fruit yield. Potassium chloride (commonly called muriate of potash) is the most common form of potassium fertiliser used in agriculture. Other forms include potassium sulphate, potassium magnesium sulphate and potassium nitrate. In the context of fertilisers it is measured and defined as K2O. It is usually taken up from the soil in greater quantities than the other main fertilisers and crops which are harvested green such as grass and green vegetables will remove relatively large quantities of potassium from the soil. Sulphur is an essential plant nutrient. It is a component of most proteins and it activates certain enzyme systems. In the past sulphur demand was satisfied through atmospheric deposition. With the significant decline of sulphur from the atmosphere, there is a need for sulphur application to crops and grass and it is often applied together with nitrogen fertilisers. Crops such as oilseed rape are particularly sensitive to sulphur deficiency and consequently require a relatively high input of sulphur. More details are provided in The Fertiliser Manual (RB209) which is available on the website of the Agriculture and Horticulture Development Board (AHDB)
10 10
A3 GENERAL TRENDS AND ISSUES
A3.1 CROP AREAS AND WEATHER CONDITIONS Annual changes in relative cropping areas, as well as any changes in fertiliser practice for individual crops, may affect nutrient application rates when aggregated across the main crop groupings. Table A3.1 provides a summary of June Agricultural Survey estimates for areas of individual major crops, crop groupings and total tillage and grassland categories in 2013/14 and 2014/15, and illustrates percentage changes in relative cropping areas over the past five years. There were about 11 million hectares of managed agricultural land in Britain in 2015, of which 4.6 million hectares (42%) were cultivated for tillage cropping and the remainder, 6.4 million hectares, were grassland (excluding rough grazing). The Single Farm Payment was introduced on 1 January 2005, replacing all the previous main Common Agricultural Policy (CAP) payment schemes with a single payment. To obtain this single payment, farmers must demonstrate compliance with a number of measures designed to protect the environment. One potential impact of cross-compliance, and of environmental schemes, is that margins of fields will remain un-cropped. In this report, as was the case in for the last 8 years, all calculations of fertiliser rates have been made on the basis of sown area rather than field size. Table A3.1 Cropping and grassland areas (‘000 ha) in Great Britain, 2014 – 2015 Crops June 2014
’000s ha June 2015 ’000s ha
% change since 2014
% change since 2010
2015 crop areas as % of total tillage
areaWheat 1928 1825 -5.3 -5.3 39.5 Barley – winter 422 435 3.1 15.7 9.4 – spring 634 644 1.6 23.6 13.9 Total cereals1 3144 3066 -2.5 3.1 66.4 Oilseed rape – total 675 652 -3.4 1.6 14.2 Oilseed rape – winter 660 645 -2.3 2.5 14.0 Oilseed rape – spring 15 7 -53.3 -46.2 0.2 Sugar beet 116 90 -22.4 -23.7 1.9 Potatoes2 136 125 -8.1 -6.0 2.7 Linseed 15 15 0 -65.9 0.3 Peas/beans3 137 213 55.5 2.4 4.6 Maize/other fodder 255 259 1.6 16.1 5.6 Vegetables 146 157 7.5 30.8 3.4 Total tillage4 4661 4618 -0.9 1.6 100.0 Set-aside and bare fallow5 159 213 34.0 23.1
Grassland 2015 grass areas as % of total grass
areaLess than 5 years old 1249 1017 -18.6 -8.7 15.8 5 years and older 5182 5428 4.7 3.1 84.2 Total grass6 6431 6444 0.2 1.0 100.0 Total crops and grass7 11092 11063 -0.26 1.3
1 including minor cereals (oats, rye, triticale, mixed corn). 2 early + maincrop potatoes. 3 harvested dry for animal consumption or, for peas, human consumption. 4 including other crops, but not bare fallow or set-aside. 5 the obligatory set-aside rate for the 2014 and 2015 Single Payment Years was set at 0%. 6 managed grassland, excluding rough grazing. 7 total tillage + total grassland. Source: Annual Defra/Scottish Government/Welsh Assembly Government (WAG) June Agricultural Survey data
11
Comparing the 2014 and 2015 cropping years, the most marked changes were the increase in the area of peas and beans and the decrease in the area of sugar beet. The area of both winter and spring oilseed rape decreased. The area of wheat reduced by 5%, and the barley area increased by 4.7%. The total area under tillage crops decreased by 0.9% in 2015, whilst the total area of uncropped land (bare fallow and set-aside) increased by 34% in 2015. This was predominantly caused by an increase in land left as bare fallow in England, with the obligatory set aside area remaining at zero in all three countries. Unusual seasonal weather conditions can influence fertiliser usage in some years. For example:
• A very wet (or very dry) autumn might delay the establishment of winter sown crops, or alter the ratio of winter to spring sown crops, with their different fertiliser requirements.
• Prolonged wet weather can increase leached losses of some nutrients, particularly nitrogen and sulphur. Weather conditions also affect other aspects of soil chemistry and nutrient availability.
• Adverse weather conditions can disrupt planned activities, such as fertiliser spreading.
• Growing conditions determine plant growth and can therefore affect nutrient requirements. Rainfalls were below average in September with large parts of the country receiving less than 20% of the average (1961-1990). By contrast rainfall totals in October were mainly average or above as it was wet across Scotland, Cumbria and eastern England. November was very wet in south east England and eastern Scotland. The rainfall pattern for the three winter months was similar, with the wettest weather in western and northern Scotland and the eastern counties of England and Scotland being the driest. Spring 2015 was fairly unexceptional overall, with March bringing typical early spring weather. April had some notably dry and sunny days, whereas in May conditions were unsettled leading to cold conditions with above average rainfall. Spring rainfall totals across western Scotland were more than 130% of the average compared to less than 70% of the average across southern England. The summer was both cooler and wetter than the previous two summers. Rainfall totals were above average for most areas, but June was a dry month. Most of the country was wetter than average in July and August, with approaching double the normal rainfall for parts of Scotland and East Anglia in July. The timing of fertiliser applications was very similar to the pattern observed in the previous cropping year, with the peak months being March and April. (Table GB3.0). Figure A3.1 Monthly rainfall as a % of the long term average6
0
25
50
75
100
125
150
175
200
225
250
Sep-14 Oct-14 Nov-14 Dec-14 Jan-15 Feb-15 Mar-15 Apr-15 May-15 Jun-15 Jul-15 Aug-15
% o
f 196
1-19
90 a
vera
ge
England Wales Scotland
6 www.metoffice.gov.uk/climate/uk
12 12
SECTION B
COMMENTARY ON FERTILISER USE IN GREAT BRITAIN
This commentary refers to rates of application in mainland Britain of fertilisers containing nitrogen (N), phosphate (P2O5), potash (K2O) and sulphur (SO3) on tillage crops and grassland (excluding rough grazing). Section B1 of the report covers the five-year period 2011-15. Comments on longer term trends are made in Section B2. The estimates of overall application rates from the survey relate to usage on farms during the 2014-15 growing season: they form a basis for estimating quantities of fertiliser used in Great Britain. The estimates of the average field rates provide a better indication than overall application rates of actual usage levels and also of any annual variation in fertiliser practice on farms. The overall application rate takes into account both the average field rate and the proportion of the crop area treated, giving an overview of the crop as a whole. The definitions of the terms used are set out in Section A of this report. The statistics on the pattern of fertiliser practice reported for Great Britain largely reflect practice in England & Wales due to its greater area of total crops and grassland: about 9.6 million hectares in England & Wales and about 1.9 million hectares in Scotland. In what is otherwise a commentary on Britain as a whole, remarks on the separate regions are only made to highlight particular trends of interest. Readers interested in more detailed recent trends for individual crops in England & Wales or in Scotland can refer to tables presented in Section C. A summary of data from earlier years is available in Chalmers 20017 and historic data for the key data series are also available on the Defra web site.
7 Chalmers A. G. (2001) A Review of fertiliser, lime and organic manure use on farm crops in Great Britain from 1983 to
1997. Soil Use and Management 17, 254-262.
13
B1 2015 RESULTS FOR GREAT BRITAIN AND CHANGES IN RECENT YEARS
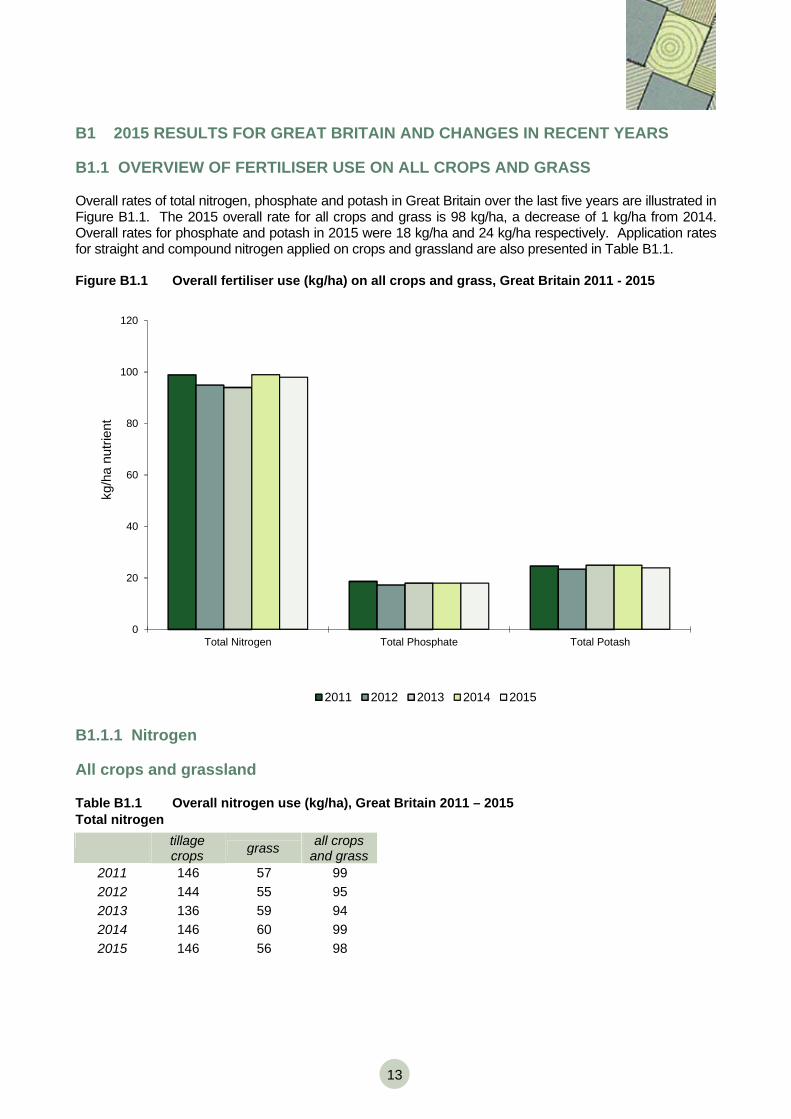
B1.1 OVERVIEW OF FERTILISER USE ON ALL CROPS AND GRASS Overall rates of total nitrogen, phosphate and potash in Great Britain over the last five years are illustrated in Figure B1.1. The 2015 overall rate for all crops and grass is 98 kg/ha, a decrease of 1 kg/ha from 2014. Overall rates for phosphate and potash in 2015 were 18 kg/ha and 24 kg/ha respectively. Application rates for straight and compound nitrogen applied on crops and grassland are also presented in Table B1.1. Figure B1.1 Overall fertiliser use (kg/ha) on all crops and grass, Great Britain 2011 - 2015
0
20
40
60
80
100
120
Total Nitrogen Total Phosphate Total Potash
kg/h
a nu
trien
t
2011 2012 2013 2014 2015
B1.1.1 Nitrogen All crops and grassland Table B1.1 Overall nitrogen use (kg/ha), Great Britain 2011 – 2015 Total nitrogen
tillage crops grass all crops
and grass 2011 146 57 99 2012 144 55 95 2013 136 59 94 2014 146 60 99 2015 146 56 98
14 14
Straight nitrogen Compound nitrogen tillage
crops grass all crops and grass
tillage crops grass all crops
and grass 2011 132 28 77 2011 14 29 22 2012 131 25 72 2012 13 31 23 2013 121 28 69 2013 16 31 24 2014 132 30 76 2014 14 30 23 2015 134 27 77
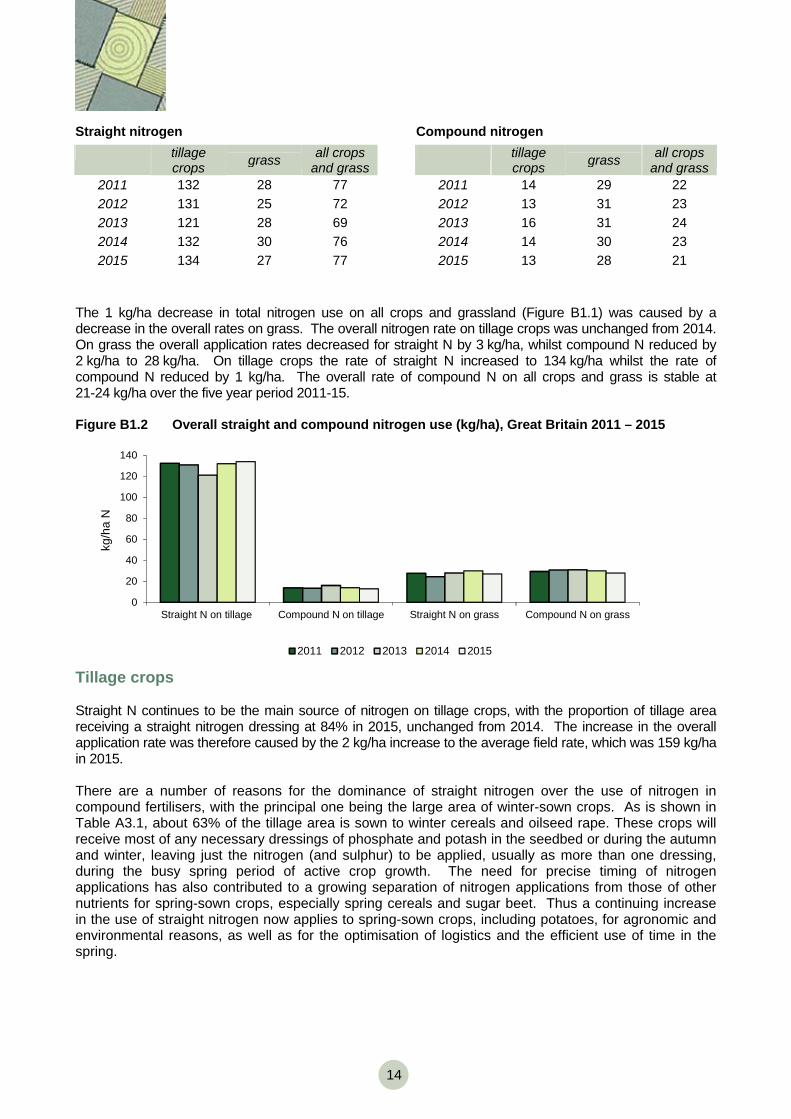
2015 13 28 21 The 1 kg/ha decrease in total nitrogen use on all crops and grassland (Figure B1.1) was caused by a decrease in the overall rates on grass. The overall nitrogen rate on tillage crops was unchanged from 2014. On grass the overall application rates decreased for straight N by 3 kg/ha, whilst compound N reduced by 2 kg/ha to 28 kg/ha. On tillage crops the rate of straight N increased to 134 kg/ha whilst the rate of compound N reduced by 1 kg/ha. The overall rate of compound N on all crops and grass is stable at 21-24 kg/ha over the five year period 2011-15. Figure B1.2 Overall straight and compound nitrogen use (kg/ha), Great Britain 2011 – 2015
0
20
40
60
80
100
120
140
Straight N on tillage Compound N on tillage Straight N on grass Compound N on grass
kg/h
a N
2011 2012 2013 2014 2015
Tillage crops Straight N continues to be the main source of nitrogen on tillage crops, with the proportion of tillage area receiving a straight nitrogen dressing at 84% in 2015, unchanged from 2014. The increase in the overall application rate was therefore caused by the 2 kg/ha increase to the average field rate, which was 159 kg/ha in 2015. There are a number of reasons for the dominance of straight nitrogen over the use of nitrogen in compound fertilisers, with the principal one being the large area of winter-sown crops. As is shown in Table A3.1, about 63% of the tillage area is sown to winter cereals and oilseed rape. These crops will receive most of any necessary dressings of phosphate and potash in the seedbed or during the autumn and winter, leaving just the nitrogen (and sulphur) to be applied, usually as more than one dressing, during the busy spring period of active crop growth. The need for precise timing of nitrogen applications has also contributed to a growing separation of nitrogen applications from those of other nutrients for spring-sown crops, especially spring cereals and sugar beet. Thus a continuing increase in the use of straight nitrogen now applies to spring-sown crops, including potatoes, for agronomic and environmental reasons, as well as for the optimisation of logistics and the efficient use of time in the spring.
15
Grassland The 4 kg/ha decrease to the overall N application rate in 2015 was mainly due to changes in the average field rates as the proportion of the grass area receiving a dressing of straight N and compound N were largely unchanged. The average field rate of straight N decreased by 4 kg/ha to 100 kg/ha, whilst the compound N average field rate decreased by 2 kg/ha to 70 kg/ha. B1.1.2 Phosphate, Potash and Sulphur Phosphate Table B1.2a shows overall phosphate applications for the past five years. The 2015 phosphate rate on tillage was unchanged in 2015 at 29 kg/ha, with the same proportion receiving a dressing (49%) and a slightly increased average field rate (60 kg/ha). For grassland the overall rate has been more stable, and 2015 saw an unchanged dressing cover and a decrease in the average field rate to 22 kg/ha. The five year means for overall phosphate rates for tillage crops and grass were 29 and 9 kg/ha respectively. Table B1.2a Overall phosphate and potash use (kg/ha), Great Britain 2011 – 2015 Total phosphate Total potash
tillage crops grass all crops
and grass tillage
crops grass all crops and grass
2011 29 9 19 2011 39 12 25 2012 28 9 17 2012 37 12 23 2013 28 9 18 2013 40 13 25 2014 29 10 18 2014 39 14 25 2015 29 9 18 2015 38 12 24
Potash In line with the recent average, in 2015 the overall potash rate was 38 kg/ha on tillage crops, and on grassland the overall rate decreased by 2 kg/ha to 12 kg/ha. On tillage crops the proportion of the area receiving a dressing of potash was unchanged at 50%, whilst the average field rate decreased by 3 kg/ha to 75 kg/ha. On grass dressing cover decreased slightly to 42% and the average field rate decreased to 30 kg/ha. Sulphur Table B1.2b shows overall sulphur applications for the past five years. The overall rate on tillage crops has varied between 26 and 31 kg/ha over the period, with the highest rates recorded in the last two years. The proportion of the tillage area receiving a sulphur dressing was also at its highest over the five year period at 52% in 2015. The average field rate on tillage crops decreased by 1 kg/ha in 2015 to 59 kg/ha. The overall rate of sulphur on grass has been more stable; albeit with a 1 kg/ha decrease between 2014 and 2015. The low overall rate of sulphur on grass is caused by lower dressing cover percentages and lower average field rates on grass than on tillage crops.
16 16
Table B1.2b Overall sulphur use (kg/ha), Great Britain 2011 – 2015 Total sulphur
tillage crops grass all crops
and grass 2011 26 2 13 2012 29 2 14 2013 27 2 13 2014 31 4 16 2015 31 3 16
B1.2 FERTILISER USE ON MAJOR TILLAGE CROPS Overall and average field rates of fertiliser application for major tillage crops in Great Britain over the past five years are summarised in Tables B1.3a and B1.3b. Dressing cover percentages for the same period are shown in Table B1.4. More detailed statistics for 2015 are presented in Section C. Longer term trends in overall application rates of nitrogen, phosphate and potash since 1983 are summarised in Section B2. Small apparent changes in fertiliser use on individual crops should be treated with caution as these estimates are based on a smaller number of farms and fields than the aggregate estimates for all tillage crops. Information on sampling errors, which help in judging whether apparent changes may be real or attributable to sampling variation alone, is given in Appendix 1.
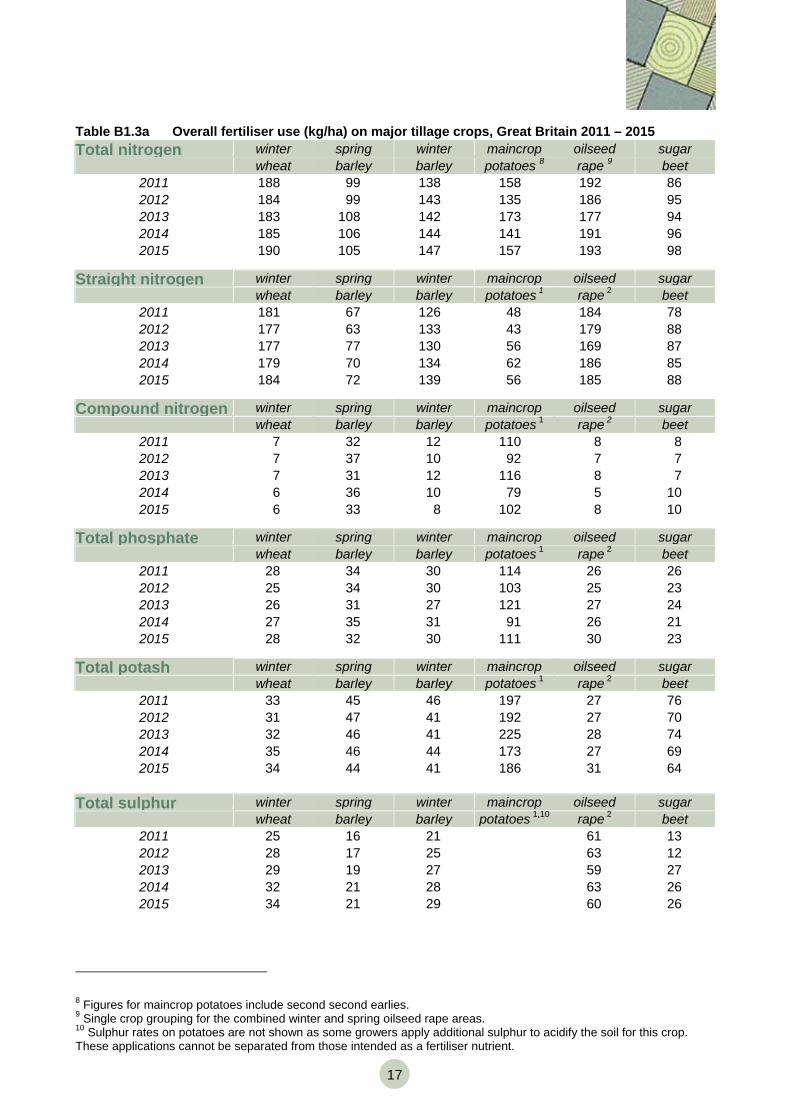
17
Table B1.3a Overall fertiliser use (kg/ha) on major tillage crops, Great Britain 2011 – 2015 Total nitrogen winter spring winter maincrop oilseed sugar
wheat barley barley potatoes 8 rape 9 beet 2011 188 99 138 158 192 86 2012 184 99 143 135 186 95 2013 183 108 142 173 177 94 2014 185 106 144 141 191 96 2015 190 105 147 157 193 98
Straight nitrogen winter spring winter maincrop oilseed sugar wheat barley barley potatoes 1 rape 2 beet
2011 181 67 126 48 184 78 2012 177 63 133 43 179 88 2013 177 77 130 56 169 87 2014 179 70 134 62 186 85 2015 184 72 139 56 185 88
Compound nitrogen winter spring winter maincrop oilseed sugar wheat barley barley potatoes 1 rape 2 beet
2011 7 32 12 110 8 8 2012 7 37 10 92 7 7 2013 7 31 12 116 8 7 2014 6 36 10 79 5 10 2015 6 33 8 102 8 10
Total phosphate winter spring winter maincrop oilseed sugar wheat barley barley potatoes 1 rape 2 beet
2011 28 34 30 114 26 26 2012 25 34 30 103 25 23 2013 26 31 27 121 27 24 2014 27 35 31 91 26 21 2015 28 32 30 111 30 23
Total potash winter spring winter maincrop oilseed sugar wheat barley barley potatoes 1 rape 2 beet
2011 33 45 46 197 27 76 2012 31 47 41 192 27 70 2013 32 46 41 225 28 74 2014 35 46 44 173 27 69 2015 34 44 41 186 31 64
Total sulphur winter spring winter maincrop oilseed sugar wheat barley barley potatoes 1,10 rape 2 beet
2011 25 16 21 61 13 2012 28 17 25 63 12 2013 29 19 27 59 27 2014 32 21 28 63 26 2015 34 21 29 60 26
8 Figures for maincrop potatoes include second second earlies. 9 Single crop grouping for the combined winter and spring oilseed rape areas. 10 Sulphur rates on potatoes are not shown as some growers apply additional sulphur to acidify the soil for this crop. These applications cannot be separated from those intended as a fertiliser nutrient.
18 18
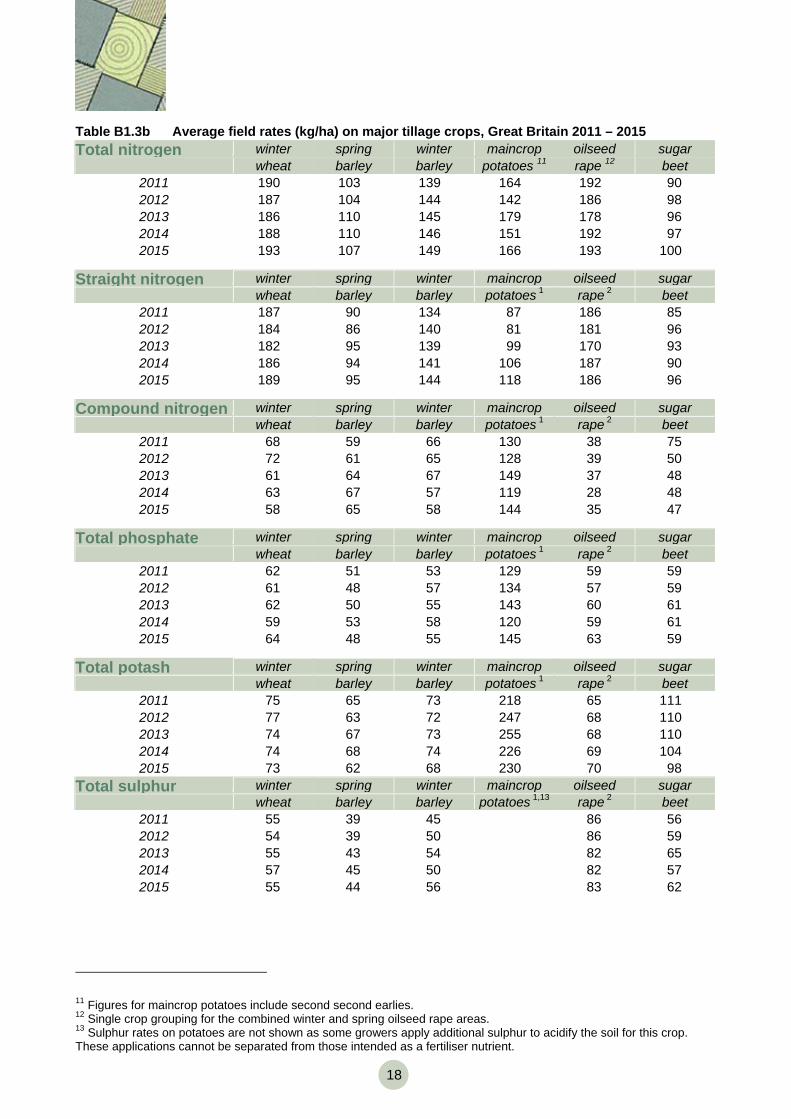
Table B1.3b Average field rates (kg/ha) on major tillage crops, Great Britain 2011 – 2015 Total nitrogen winter spring winter maincrop oilseed sugar wheat barley barley potatoes 11 rape 12 beet
2011 190 103 139 164 192 90 2012 187 104 144 142 186 98 2013 186 110 145 179 178 96 2014 188 110 146 151 192 97 2015 193 107 149 166 193 100
Straight nitrogen winter spring winter maincrop oilseed sugar wheat barley barley potatoes 1 rape 2 beet
2011 187 90 134 87 186 85 2012 184 86 140 81 181 96 2013 182 95 139 99 170 93 2014 186 94 141 106 187 90 2015 189 95 144 118 186 96
Compound nitrogen winter spring winter maincrop oilseed sugar wheat barley barley potatoes 1 rape 2 beet
2011 68 59 66 130 38 75 2012 72 61 65 128 39 50 2013 61 64 67 149 37 48 2014 63 67 57 119 28 48 2015 58 65 58 144 35 47
Total phosphate winter spring winter maincrop oilseed sugar wheat barley barley potatoes 1 rape 2 beet
2011 62 51 53 129 59 59 2012 61 48 57 134 57 59 2013 62 50 55 143 60 61 2014 59 53 58 120 59 61 2015 64 48 55 145 63 59
Total potash winter spring winter maincrop oilseed sugar wheat barley barley potatoes 1 rape 2 beet
2011 75 65 73 218 65 111 2012 77 63 72 247 68 110 2013 74 67 73 255 68 110 2014 74 68 74 226 69 104 2015 73 62 68 230 70 98
Total sulphur winter spring winter maincrop oilseed sugar wheat barley barley potatoes 1,13 rape 2 beet
2011 55 39 45 86 56 2012 54 39 50 86 59 2013 55 43 54 82 65 2014 57 45 50 82 57 2015 55 44 56 83 62
11 Figures for maincrop potatoes include second second earlies. 12 Single crop grouping for the combined winter and spring oilseed rape areas. 13 Sulphur rates on potatoes are not shown as some growers apply additional sulphur to acidify the soil for this crop. These applications cannot be separated from those intended as a fertiliser nutrient.
19
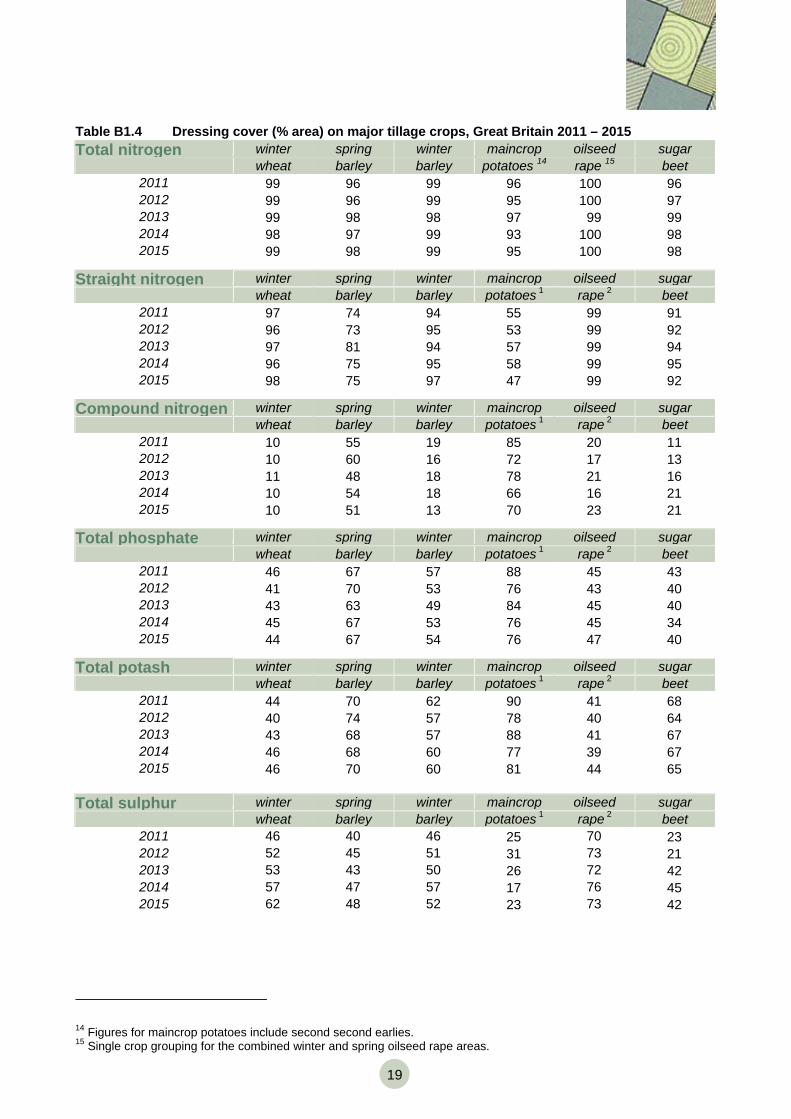
Table B1.4 Dressing cover (% area) on major tillage crops, Great Britain 2011 – 2015 Total nitrogen winter spring winter maincrop oilseed sugar wheat barley barley potatoes 14 rape 15 beet
2011 99 96 99 96 100 96 2012 99 96 99 95 100 97 2013 99 98 98 97 99 99 2014 98 97 99 93 100 98 2015 99 98 99 95 100 98
Straight nitrogen winter spring winter maincrop oilseed sugar wheat barley barley potatoes 1 rape 2 beet
2011 97 74 94 55 99 91 2012 96 73 95 53 99 92 2013 97 81 94 57 99 94 2014 96 75 95 58 99 95 2015 98 75 97 47 99 92
Compound nitrogen winter spring winter maincrop oilseed sugar wheat barley barley potatoes 1 rape 2 beet
2011 10 55 19 85 20 11 2012 10 60 16 72 17 13 2013 11 48 18 78 21 16 2014 10 54 18 66 16 21 2015 10 51 13 70 23 21
Total phosphate winter spring winter maincrop oilseed sugar wheat barley barley potatoes 1 rape 2 beet
2011 46 67 57 88 45 43 2012 41 70 53 76 43 40 2013 43 63 49 84 45 40 2014 45 67 53 76 45 34 2015 44 67 54 76 47 40
Total potash winter spring winter maincrop oilseed sugar wheat barley barley potatoes 1 rape 2 beet
2011 44 70 62 90 41 68 2012 40 74 57 78 40 64 2013 43 68 57 88 41 67 2014 46 68 60 77 39 67 2015 46 70 60 81 44 65
Total sulphur winter spring winter maincrop oilseed sugar wheat barley barley potatoes 1 rape 2 beet
2011 46 40 46 25 70 23 2012 52 45 51 31 73 21 2013 53 43 50 26 72 42 2014 57 47 57 17 76 45 2015 62 48 52 23 73 42
14 Figures for maincrop potatoes include second second earlies. 15 Single crop grouping for the combined winter and spring oilseed rape areas.
20 20
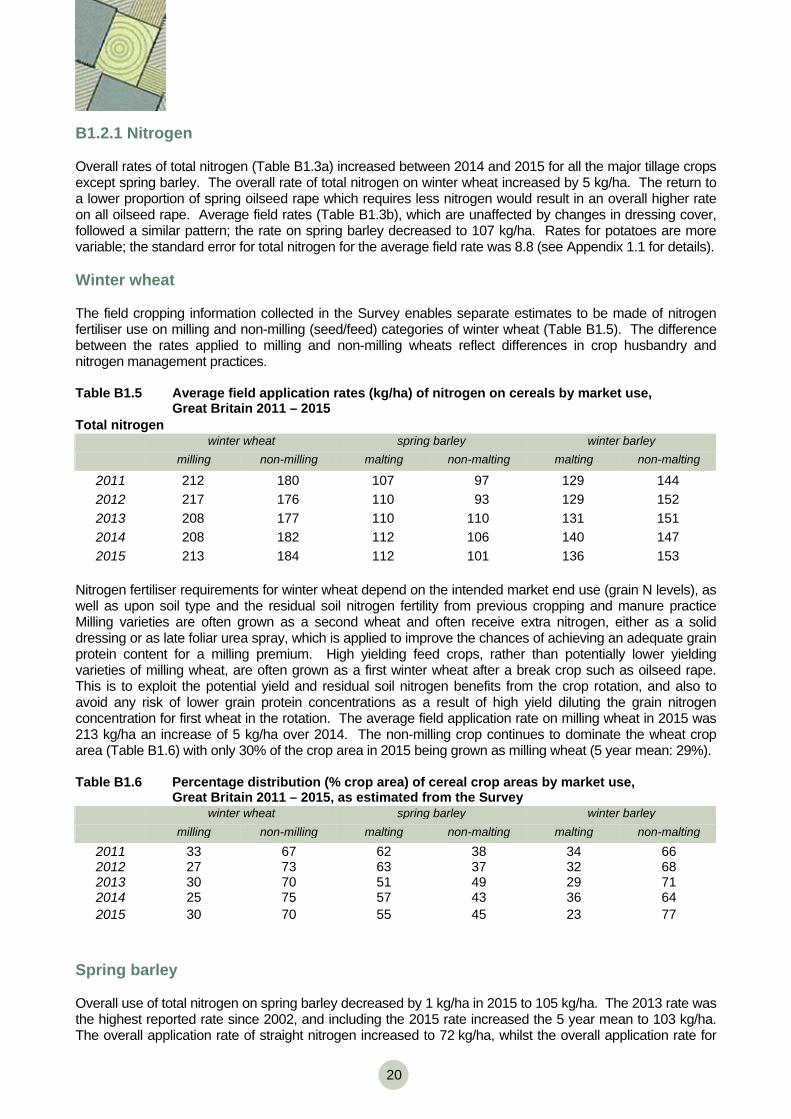
B1.2.1 Nitrogen Overall rates of total nitrogen (Table B1.3a) increased between 2014 and 2015 for all the major tillage crops except spring barley. The overall rate of total nitrogen on winter wheat increased by 5 kg/ha. The return to a lower proportion of spring oilseed rape which requires less nitrogen would result in an overall higher rate on all oilseed rape. Average field rates (Table B1.3b), which are unaffected by changes in dressing cover, followed a similar pattern; the rate on spring barley decreased to 107 kg/ha. Rates for potatoes are more variable; the standard error for total nitrogen for the average field rate was 8.8 (see Appendix 1.1 for details). Winter wheat The field cropping information collected in the Survey enables separate estimates to be made of nitrogen fertiliser use on milling and non-milling (seed/feed) categories of winter wheat (Table B1.5). The difference between the rates applied to milling and non-milling wheats reflect differences in crop husbandry and nitrogen management practices. Table B1.5 Average field application rates (kg/ha) of nitrogen on cereals by market use,
Great Britain 2011 – 2015 Total nitrogen
winter wheat spring barley winter barley milling non-milling malting non-malting malting non-malting
2011 212 180 107 97 129 144 2012 217 176 110 93 129 152 2013 208 177 110 110 131 151 2014 208 182 112 106 140 147 2015 213 184 112 101 136 153
Nitrogen fertiliser requirements for winter wheat depend on the intended market end use (grain N levels), as well as upon soil type and the residual soil nitrogen fertility from previous cropping and manure practiceMilling varieties are often grown as a second wheat and often receive extra nitrogen, either as a solid dressing or as late foliar urea spray, which is applied to improve the chances of achieving an adequate grain protein content for a milling premium. High yielding feed crops, rather than potentially lower yielding varieties of milling wheat, are often grown as a first winter wheat after a break crop such as oilseed rape. This is to exploit the potential yield and residual soil nitrogen benefits from the crop rotation, and also to avoid any risk of lower grain protein concentrations as a result of high yield diluting the grain nitrogen concentration for first wheat in the rotation. The average field application rate on milling wheat in 2015 was 213 kg/ha an increase of 5 kg/ha over 2014. The non-milling crop continues to dominate the wheat crop area (Table B1.6) with only 30% of the crop area in 2015 being grown as milling wheat (5 year mean: 29%). Table B1.6 Percentage distribution (% crop area) of cereal crop areas by market use,
Great Britain 2011 – 2015, as estimated from the Survey winter wheat spring barley winter barley milling non-milling malting non-malting malting non-malting
2011 33 67 62 38 34 66 2012 27 73 63 37 32 68 2013 30 70 51 49 29 71 2014 25 75 57 43 36 64 2015 30 70 55 45 23 77
Spring barley Overall use of total nitrogen on spring barley decreased by 1 kg/ha in 2015 to 105 kg/ha. The 2013 rate was the highest reported rate since 2002, and including the 2015 rate increased the 5 year mean to 103 kg/ha. The overall application rate of straight nitrogen increased to 72 kg/ha, whilst the overall application rate for
21
compound N decreased to 33 kg/ha. The overall decrease was caused by a decreased percentage of the spring barley area receiving a dressing of compound N (51% in 2015 compared to 54% in 2014, shown in table B1.4). The average field rate for total nitrogen was 107 kg/ha in 2015, in line with the five year average. Further analysis of the data by crop type (Table B1.5) shows the average rate applied to the spring malting crop was unchanged in 2015 at 112 kg/ha. For non-malting crops the nitrogen application rate decreased to 101 kg/ha, with a five year mean of 101 kg/ha. Estimated nitrogen rates on spring barley crops has been consistently slightly higher on malting than non-malting crops, with a mean difference of 9 kg/ha over the last five years. This slightly higher use of nitrogen on malting than non-malting crops may seem anomalous, since lower rates of nitrogen are recommended for malting barley, under the same conditions of soil type and nitrogen fertility level, than for the feed varieties of barley. This recommendation is made to avoid the risk of high grain nitrogen content, which could adversely affect subsequent malt quality. However, malting crops are normally grown on soils with low nitrogen fertility and the average field rates of nitrogen reported for malting varieties in Table B1.5 are generally in the range recommended for mineral soil types with low nitrogen residues (70 - 120 kg/ha)16. Feed crops on the other hand are often grown within mixed rotations, which tend to have a higher soil nitrogen fertility, with consequently less need for nitrogen fertiliser. In 2013 the average field rate of nitrogen was the same on malting and non malting crops, which was unusual, with the difference in rates in 2015 showing a return to more normal practice. The proportion of spring barley grown for malting has fluctuated during the last five years (Table B1.6). The mean for the period 2011-15 is 58%, but increased from the low proportion in 2013 to 55% in 2015. Winter barley In the period 2002-08 overall total nitrogen use on winter barley decreased from year to year, down to 132 kg/ha in 2008. This rate has increased albeit with some fluctuations to 147 kg/ha in 2015. The straight nitrogen rate increased by 5 kg/ha whereas the compound nitrogen rate decreased by 2 kg/ha in 2015. Nitrogen requirements for winter barley, as with the spring sown crop, depend on a range of agronomic factors, including the intended market for the grain. Average field rates of nitrogen on malting crops decreased by 4 kg/ha to 136 kg/ha in 2015 giving a five year mean of 133 kg/ha. For non malting crops the average field rate increased by 6 kg/ha to 153 kg/ha in 2015 (Table B1.5), with the 5 year average being 149 kg/ha. The higher application rates of nitrogen (five-year mean of +16 kg/ha) on non-malting, compared to malting winter barley crops, reflect typical agronomic practice, and the gap between malting and non malting crops was comparable with previous years. The majority of winter barley crops (both feed and malting) are grown in England in arable rotations, usually after a previous cereal crop, when the soil nitrogen fertility status is low. Higher nitrogen rates are recommended for feed crops. The proportion of relative crop area grown for malting was 23% in 2015, which was less than in the recent past, with the five year mean calculated as 31%. (Table B1.6).
8 Anon. (2010). Fertiliser Manual (RB209), Defra, 8th edition. The Stationery Office, London. ISBN 978-0-11-243286-9. For the latest release see the AHDB web site
22 22
Maincrop potatoes Total nitrogen use on maincrop potatoes has fluctuated over the last five years. Part of the reason for recent apparent fluctuations in the estimates of nutrient application rates may be because proportionally fewer fields of potatoes are covered by the Survey. This is due to the fact that fields of potatoes on respondent’s farms may be let out and grown by a third party, so it is not possible to record information in the Survey. Furthermore, fields of potatoes grown by a respondent, but not on the farm being surveyed are not captured in the Survey. In 2015 the overall rate was 157 kg/ha, above the five year mean of 153 kg/ha. (Table B1.3a). The increase in 2015 is due to increases in the dressing cover percentage and average field rate of compound nitrogen (Table B1.3b, B1.4), compared to the previous year (70% and 66%) and (144 kg/ha and 119 kg/ha in 2014). Oilseed rape In 2015, overall total nitrogen use on oilseed rape, as a combined category for both the autumn and spring sown crop, increased by 2 kg/ha to 193 kg/ha (five year mean 188 kg/ha). This slight increase is a continued recovery from the low rate observed in 2013, when more spring oilseed rape was planted, due to poor weather conditions in the autumn. A more detailed breakdown of the data for oilseed rape (Table B1.7) shows that the average field rate of nitrogen on winter oilseed rape increased by 1 kg/ha between 2014 and 2015 to 193 kg/ha. The rate for the spring crop decreased by 39 kg/ha to 115 kg/ha. In a normal year spring oilseed rape represents only about 2% of the total oilseed rape area, so the average field rate for total nitrogen on these spring-sown crops should be treated with extreme caution. Table B1.7 Average field application rates of nitrogen (kg/ha) on winter and spring oilseed rape,
Great Britain 2011 – 2015
Total nitrogen (kg/ha)
winter oilseed rape spring oilseed rape* 2011 193 142 2012 187 119 2013 188 121 2014 192 154 2015 193 115
* Spring oilseed rape data are more variable due to smaller crop area . Sugar beet The overall nitrogen use on sugar beet increased by 2 kg/ha in 2015 to 98 kg/ha, slightly over the five year mean (94 kg/ha). The proportion of crop area receiving a nitrogen dressing was 98%, which is consistent with recent years. The average field rate of compound nitrogen was slightly lower than in 2014, although dressing cover with compound nitrogen is low at 21% of the sugar beet area in comparison to 92% dressing cover with straight N. The average field rate of straight nitrogen increased by 6 kg/ha to 96 kg/ha in 2015.
23
B1.2.2 Phosphate and Potash Phosphate In 2015 the overall phosphate rate increased on winter wheat, oilseed rape and sugar beet, with decreases observed for both winter and spring barley. Higher overall rates were caused by increases to average field rates and increased dressing covers on oilseed rape and sugar beet (Table B1.3b and B1.4). Lower overall rates were also caused by reduced average field rates on winter and spring barley. The overall phosphate rate of 29 kg/ha for tillage crops is in line with the 2011-15 five year average (Table B1.2a). There are indications that the declining trend in overall usage of phosphate (and potash) which has been apparent since the late 1990s, driven by reducing annual dressing cover, may have ceased (Figure B2.4). Potash Overall potash use on tillage crops decreased in 2015 by 1 kg/ha, to 38 kg/ha. This is in line with the 2011-15 five year average (Table B1.2a). The decrease in overall potash rate on tillage crops in 2015 was caused by a decrease in the average field rate as the proportion of the crop area receiving a dressing was unchanged at 50%. The average field rates for potash decreased on all the major tillage crops except potatoes and sugar beet. As noted for nitrogen, part of the reason for recent apparent fluctuations in values for nutrient application rates for potatoes may be because of the many fields which are grown by third parties and are not recorded, thereby reducing the robustness of the estimates. The potash dressing cover percentages increased in 2015 for spring barley, potatoes and oilseed rape, but were unchanged or reduced on the other major tillage crops. B1.2.3 Sulphur The Survey has collected detailed information on sulphur fertiliser use since 1993, when only 3-6% of the cereal crop area and 8% of the oilseed rape area received an application of sulphur. By 1997, the proportions of these crop areas which were treated with sulphur had increased markedly to 13-14% for cereals and 30% for oilseed rape. Dressing covers for sulphur then generally remained fairly static until 2002 when the areas increased steadily until 2007. 2008 saw reductions in dressing covers for cereals at 35%-43%, a pattern that continued in 2009, except in winter barley where sulphur dressing cover increased to 45%. In 2015 cereals dressing covers with sulphur were in the 48-62% range. In oilseed rape the 3% decrease in dressing cover makes it in line with the five year average, 73% (Table B1.8). In 2015 average field rates increased in winter barley and oilseed rape, but decreased on winter wheat and spring barley. Table B1.8 Dressing cover (% area) and average application rate (kg/ha SO3) of sulphur on cereals
and oilseed rape, Great Britain 2011 – 2015 Dressing cover (%)
winter wheat
winter barley
spring barley
oilseed rape
all tillage
2011 46 46 40 70 42 2012 52 51 45 73 47 2013 53 50 43 72 47 2014 57 57 47 76 51 2015 62 52 48 73 52
Average field rate (kg/ha SO3) winter
wheat winter barley
spring barley
oilseed rape
all tillage
2011 55 45 39 86 60 2012 54 50 39 86 61 2013 55 54 43 82 58 2014 57 50 45 82 60 2015 55 56 44 83 59
24 24
Table B1.9 shows the proportion of major tillage crops receiving a sulphur dressing in England & Wales compared with Scotland. Historically a higher proportion of cereal and oilseed crops was treated with sulphur in Scotland than in England & Wales which may have been due to the greater awareness of the risk of sulphur deficiency in Scotland due to historically extremely low levels of atmospheric sulphur deposition, compared to most other areas of Britain. Arable farmers in England & Wales became more aware of the need to apply sulphur and there has been an increase in the percentage dressing cover figures for all major tillage crops. By 2015 dressing covers in England & Wales have reached parity with, or even exceeded, those in Scotland (Table B1.9). Table B1.9 Dressing cover (% area) of sulphur on cereals and oilseed rape by region, 2011 – 2015
winter wheat
winter barley
spring barley
oilseed rape
England & Wales 2011 45 45 40 70 2012 52 50 45 74 2013 53 50 46 73 2014 56 58 50 77 2015 61 51 53 82
Scotland* 2011 58 50 39 68 2012 61 54 44 49 2013 45 45 39 53 2014 61 46 43 69 2015 65 58 41 72
* Greater variability in the Scottish data may be due to smaller sample sizes. B1.3 FERTILISER USE ON GRASSLAND Overall fertiliser usage on grassland in Great Britain in the last five years, as previously shown (Tables B1.1 and B1.2), is summarised again in Table B1.10. The corresponding estimates of dressing cover and average field rates for each nutrient are shown in Table B1.11. Table B1.10 Overall fertiliser use (kg/ha) on grassland, Great Britain 2011 – 2015
straight nitrogen
compound nitrogen
total nitrogen
total phosphate
total potash
total sulphur
2011 28 29 57 9 12 2 2012 25 31 55 9 12 2 2013 28 31 59 9 13 2 2014 30 30 60 10 14 4 2015 27 28 56 9 12 3
Dressing cover for total nitrogen on grass decreased in 2015 to 60% (Table B1.11). The long term trend has been for declining dressing cover for total nitrogen and the proportion receiving a dressing remains just above the 58% low reported in 2008. As in previous years, a higher proportion of grass received compound N as opposed to straight N, but the average field rate for compound N was 70% of the straight N rate of 100 kg/ha. Overall application rates for phosphate and potash on grass were 9 and 12 kg/ha respectively, a slight decrease from 2014.
25
Table B1.11 Dressing cover (%) and average application rate (kg/ha) of fertiliser on grassland, Great Britain 2011 – 2015
Dressing cover (%) straight
nitrogen compound nitrogen
total nitrogen
total phosphate
total potash
total sulphur
2011 28 41 61 41 42 6 2012 26 41 61 41 42 7 2013 28 42 62 42 43 8 2014 29 41 62 41 43 11 2015 27 41 60 41 42 10
Average field rate (kg/ha) straight
nitrogen compound nitrogen
total nitrogen
total phosphate
total potash
total sulphur
2011 98 72 93 22 29 36 2012 94 75 91 22 29 32 2013 100 74 96 22 29 33 2014 104 72 96 24 32 33 2015 100 70 93 22 30 31
The proportion of the grass area receiving a straight nitrogen dressing decreased by 2%, to 27% and the compound N dressing cover was unchanged at 41% in 2015. The dressing cover percentage of phosphate on grass was the same as in 2014 at 41%, with the potash decreasing by 1%. The five year means are 41% and 42% respectively. Average field rates for in 2015 decreased to 22 kg/ha for phosphate and 30 kg/ha for potash, up from the historic low rates reported between 2011 and 2013. B1.3.1 Nitrogen Cutting and grazing management Fertiliser requirements for grassland vary according to the type of livestock enterprise, intensity of production and the associated cutting and grazing regimes used for sward management. Fertiliser use on dairy, other livestock and mixed farms in Great Britain in 2015 are presented in Section C. The Survey estimates of annual distributions of the total grassland area between grazing and cutting management regimes since 2011 are summarised in Table B1.12. These should not be taken as authoritative national estimates of grassland utilisation, as the Survey is designed to estimate fertiliser application rates, not to derive accurate crop areas, although these may still be the best available estimates of grassland utilisation by area. Table B1.12 Grassland utilisation (% of grass area), Great Britain 2011 – 2015 grazed 1 silage 2 hay 2
2011 90 29 11 2012 90 28 10 2013 90 28 12 2014 88 29 11 2015 90 29 11
Nearly all grassland is grazed at some stage during the season (Table B1.12) and the proportion in 2015 is the same as the five year mean of 90%.
1 May also be cut 2 May also be grazed
26 26
Fertiliser usage for the different cutting and grazing categories is presented in Table B1.13. The differences in average field rates for nitrogen illustrate the influence of grassland management practice on fertiliser inputs with rates being lowest in grass cut for hay, higher in grass which is grazed and higher still in grass cut for silage. Table B1.13 Nitrogen application rates (kg/ha) by grassland utilisation, Great Britain 2011 – 2015 Total nitrogen
overall application rate average field rate grazed 1 silage 2 hay 2 grazed 1 silage 2 hay 2
2011 52 99 40 2011 89 121 71 2012 51 99 47 2012 87 117 75 2013 55 106 44 2013 91 124 77 2014 54 104 44 2014 90 124 76 2015 51 100 37 2015 87 121 75
Straight nitrogen overall application rate average field rate grazed 1 silage 2 hay 2 grazed 1 silage 2 hay 2
2011 26 46 21 2011 95 115 75 2012 22 43 25 2012 91 105 79 2013 26 50 21 2013 94 112 78 2014 26 52 22 2014 98 119 79 2015 24 49 17 2015 95 114 76
Compound nitrogen overall application rate average field rate grazed 1 silage 2 hay 2 grazed 1 silage 2 hay 2
2011 26 53 18 2011 68 94 55 2012 28 56 22 2012 71 97 64 2013 29 57 23 2013 71 96 64 2014 28 52 22 2014 70 94 64 2015 26 51 21 2015 67 91 64
In 2015 the overall total nitrogen rate for the grazed category decreased by 3 kg/ha to 51 kg/ha, with the rate on the silage category decreasing by 4 kg/ha to 100 kg/ha. The average field rates of straight nitrogen decreased on all categories of grass in 2015. Compound nitrogen rates also decreased except on grass fields cut for hay. The five year means for the overall compound nitrogen rate are 27, 54 and 21 kg/ha for grazed grass, silage and hay respectively, a slight decrease on last year’s five year means. The fall in nitrogen use over the long term on grassland is likely to be related in part to decreases in ruminant livestock numbers which may have reduced herbage production requirements.
1 May also be cut 2 May also be grazed
27
B1.3.2 Phosphate and Potash Phosphate and potash requirements for grassland depend, as for nitrogen, on the system of sward management with overall application and field rates for both phosphate and potash being higher in grass cut for silage. Table B1.14 Phosphate and potash use (kg/ha) by grassland utilisation, Great Britain 2011 – 2015 Total phosphate
overall application rate average field rate grazed 1 silage 2 hay 2 grazed 1 silage 2 hay 2
2011 8 15 7 2011 21 27 21 2012 8 15 8 2012 20 27 21 2013 9 16 8 2013 21 28 22 2014 9 15 9 2014 23 28 27 2015 8 15 8 2015 21 27 23
Total potash overall application rate average field rate grazed 1 silage 2 hay 2 grazed 1 silage 2 hay 2
2011 11 24 10 2011 27 41 27 2012 11 25 9 2012 27 41 26 2013 11 27 11 2013 27 44 29 2014 12 26 14 2014 29 44 36 2015 11 25 11 2015 27 42 33
The overall phosphate rate was unchanged on silage grass in 2015, and reduced by 1 kg/ha on grazed grass and that cut for hay. The decrease reported on grass cut for hay needs to be treated with caution due to the relatively small numbers of grass fields being managed this way (Table B1.14). The corresponding five-year means for grazed grass, silage and hay were 8, 15 and 8 kg/ha, respectively. While average field rates decreased on all categories of grass recent data suggest that the long term decline in application rates may be coming to an end. Overall potash rates in 2015 decreased by 1 kg/ha on grazed and silage grass and decreased by 3 kg/ha on grass cut for hay. The average field rate on grazed and silage grass decreased by 2 kg/ha, with the rate on the cut for hay category decreasing to 33 kg/ha.
1 May also be cut 2 May also be grazed
28 28
B1.3.3 Sulphur In 2015, 10% of the total grassland area received a sulphur dressing (mean 8% for 2011-15 period). Of this, a higher proportion of grassland cut for silage is treated with sulphur compared to grazed grass or grass cut for hay (Table B1.15). Estimated dressing covers have fluctuated slightly in the past five years, with the all grass categories decreasing by 1 or 5% in 2015. The significant proportion of heavier textured soil types which occur in the main grassland farming areas, and assumed inputs of sulphur from slurry applications to silage fields, are among possible influences on the consistently low level of sulphur fertiliser use on grassland. Table B1.15 Sulphur use on grassland, Great Britain 2011 – 2015 Dressing cover (%)
grazed 1 silage 2 hay 2 all grass 2011 6 11 3 6 2012 6 14 7 7 2013 7 16 8 8 2014 10 18 11 11 2015 9 17 6 10
Average application rate per year (kg/ha SO3) grazed 1 silage 2 hay 2 all grass
2011 36 39 39 36 2012 31 34 23 32 2013 31 37 32 33 2014 32 34 28 33 2015 30 34 37 31
Estimated average field rates of sulphur application peaked for grazed and silage grass in 2007 at 45 kg/ha and 47 kg/ha and for hay in 2008 at 47 kg/ha. In 2015 average field rates decreased on grazed grass, were unchanged on that cut for silage and increased on hay fields. The five year means are 32, 36 and 32 kg/ha SO3 for grazed, silage and hay grassland, respectively (Table B1.15). Note that the average application rates in Table B1.15 are annual totals, not rates per cut.
1 May also be cut 2 May also be grazed
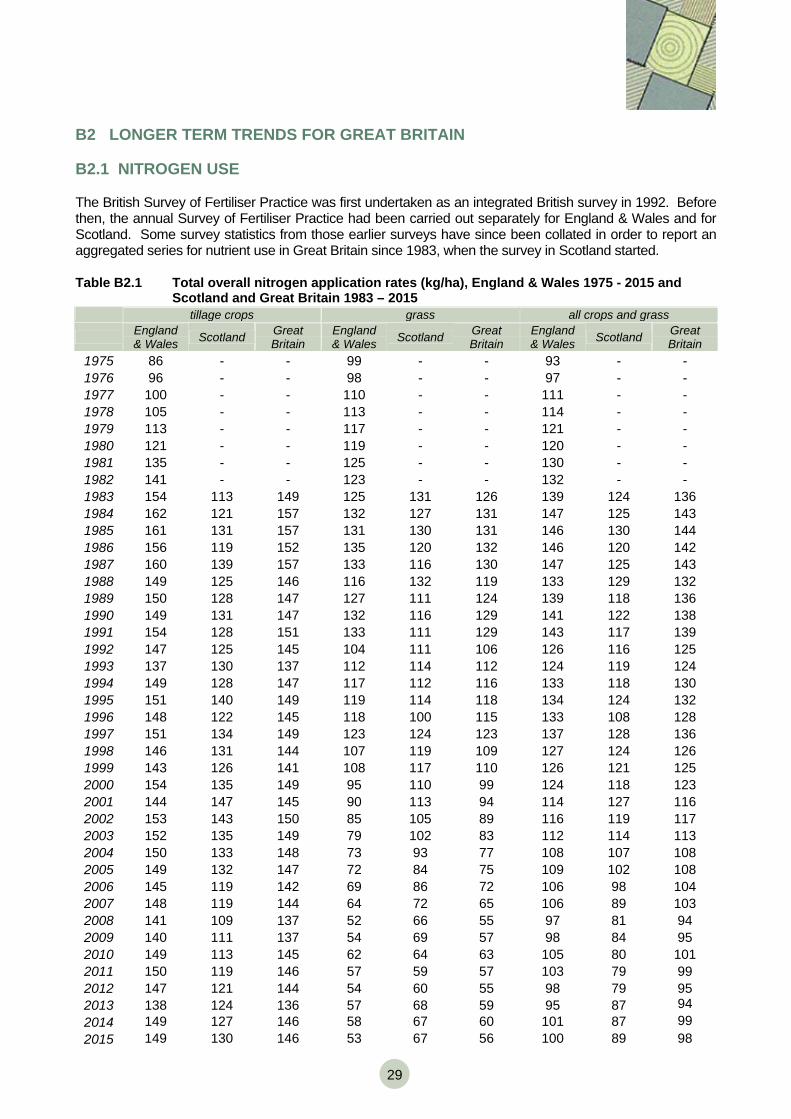
29
B2 LONGER TERM TRENDS FOR GREAT BRITAIN
B2.1 NITROGEN USE The British Survey of Fertiliser Practice was first undertaken as an integrated British survey in 1992. Before then, the annual Survey of Fertiliser Practice had been carried out separately for England & Wales and for Scotland. Some survey statistics from those earlier surveys have since been collated in order to report an aggregated series for nutrient use in Great Britain since 1983, when the survey in Scotland started. Table B2.1 Total overall nitrogen application rates (kg/ha), England & Wales 1975 - 2015 and
Scotland and Great Britain 1983 – 2015 tillage crops grass all crops and grass
England & Wales Scotland Great
Britain England& Wales Scotland Great
Britain England & Wales Scotland Great
Britain 1975 86 - - 99 - - 93 - - 1976 96 - - 98 - - 97 - - 1977 100 - - 110 - - 111 - - 1978 105 - - 113 - - 114 - - 1979 113 - - 117 - - 121 - - 1980 121 - - 119 - - 120 - - 1981 135 - - 125 - - 130 - - 1982 141 - - 123 - - 132 - - 1983 154 113 149 125 131 126 139 124 136 1984 162 121 157 132 127 131 147 125 143 1985 161 131 157 131 130 131 146 130 144 1986 156 119 152 135 120 132 146 120 142 1987 160 139 157 133 116 130 147 125 143 1988 149 125 146 116 132 119 133 129 132 1989 150 128 147 127 111 124 139 118 136 1990 149 131 147 132 116 129 141 122 138 1991 154 128 151 133 111 129 143 117 139 1992 147 125 145 104 111 106 126 116 125 1993 137 130 137 112 114 112 124 119 124 1994 149 128 147 117 112 116 133 118 130 1995 151 140 149 119 114 118 134 124 132 1996 148 122 145 118 100 115 133 108 128 1997 151 134 149 123 124 123 137 128 136 1998 146 131 144 107 119 109 127 124 126 1999 143 126 141 108 117 110 126 121 125 2000 154 135 149 95 110 99 124 118 123 2001 144 147 145 90 113 94 114 127 116 2002 153 143 150 85 105 89 116 119 117 2003 152 135 149 79 102 83 112 114 113 2004 150 133 148 73 93 77 108 107 108 2005 149 132 147 72 84 75 109 102 108 2006 145 119 142 69 86 72 106 98 104 2007 148 119 144 64 72 65 106 89 103 2008 141 109 137 52 66 55 97 81 94 2009 140 111 137 54 69 57 98 84 95 2010 149 113 145 62 64 63 105 80 101 2011 150 119 146 57 59 57 103 79 99 2012 147 121 144 54 60 55 98 79 95 2013 138 124 136 57 68 59 95 87 94 2014 149 127 146 58 67 60 101 87 99 2015 149 130 146 53 67 56 100 89 98
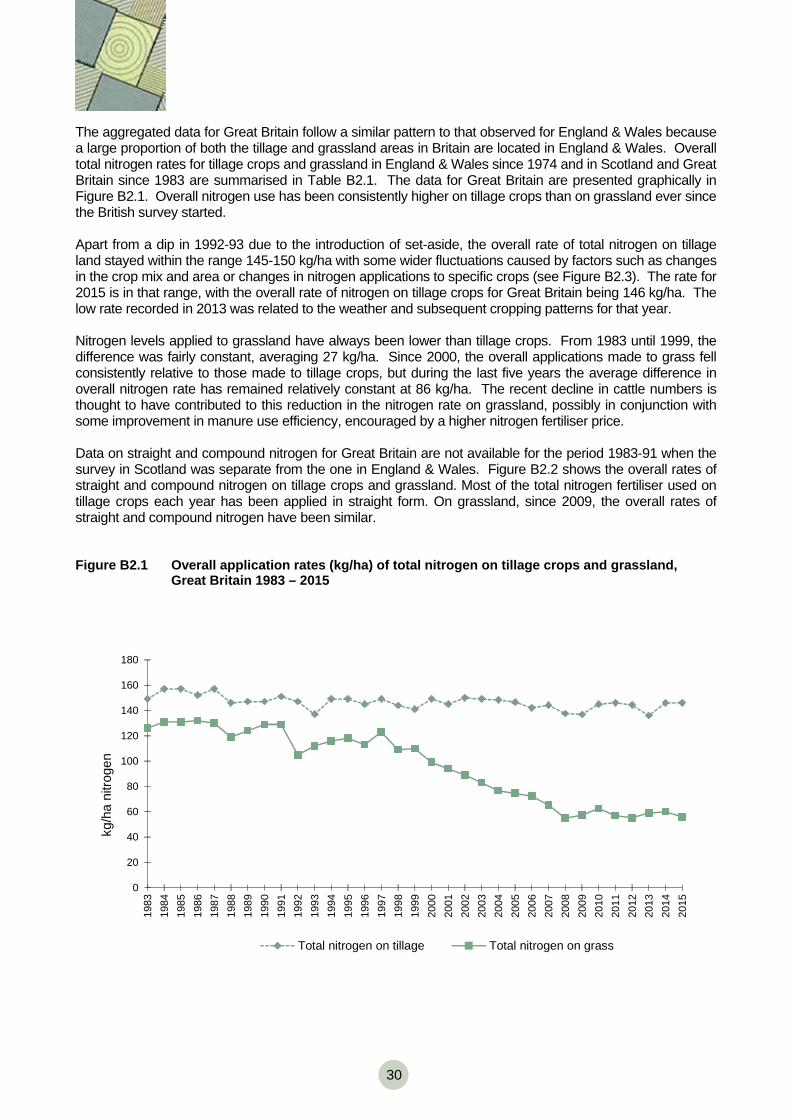
30 30
The aggregated data for Great Britain follow a similar pattern to that observed for England & Wales because a large proportion of both the tillage and grassland areas in Britain are located in England & Wales. Overall total nitrogen rates for tillage crops and grassland in England & Wales since 1974 and in Scotland and Great Britain since 1983 are summarised in Table B2.1. The data for Great Britain are presented graphically in Figure B2.1. Overall nitrogen use has been consistently higher on tillage crops than on grassland ever since the British survey started. Apart from a dip in 1992-93 due to the introduction of set-aside, the overall rate of total nitrogen on tillage land stayed within the range 145-150 kg/ha with some wider fluctuations caused by factors such as changes in the crop mix and area or changes in nitrogen applications to specific crops (see Figure B2.3). The rate for 2015 is in that range, with the overall rate of nitrogen on tillage crops for Great Britain being 146 kg/ha. The low rate recorded in 2013 was related to the weather and subsequent cropping patterns for that year. Nitrogen levels applied to grassland have always been lower than tillage crops. From 1983 until 1999, the difference was fairly constant, averaging 27 kg/ha. Since 2000, the overall applications made to grass fell consistently relative to those made to tillage crops, but during the last five years the average difference in overall nitrogen rate has remained relatively constant at 86 kg/ha. The recent decline in cattle numbers is thought to have contributed to this reduction in the nitrogen rate on grassland, possibly in conjunction with some improvement in manure use efficiency, encouraged by a higher nitrogen fertiliser price. Data on straight and compound nitrogen for Great Britain are not available for the period 1983-91 when the survey in Scotland was separate from the one in England & Wales. Figure B2.2 shows the overall rates of straight and compound nitrogen on tillage crops and grassland. Most of the total nitrogen fertiliser used on tillage crops each year has been applied in straight form. On grassland, since 2009, the overall rates of straight and compound nitrogen have been similar. Figure B2.1 Overall application rates (kg/ha) of total nitrogen on tillage crops and grassland,
Great Britain 1983 – 2015
0
20
40
60
80
100
120
140
160
180
1983
1984
1985
1986
1987
1988
1989
1990
1991
1992
1993
1994
1995
1996
1997
1998
1999
2000
2001
2002
2003
2004
2005
2006
2007
2008
2009
2010
2011
2012
2013
2014
2015
kg/h
a ni
troge
n
Total nitrogen on tillage Total nitrogen on grass
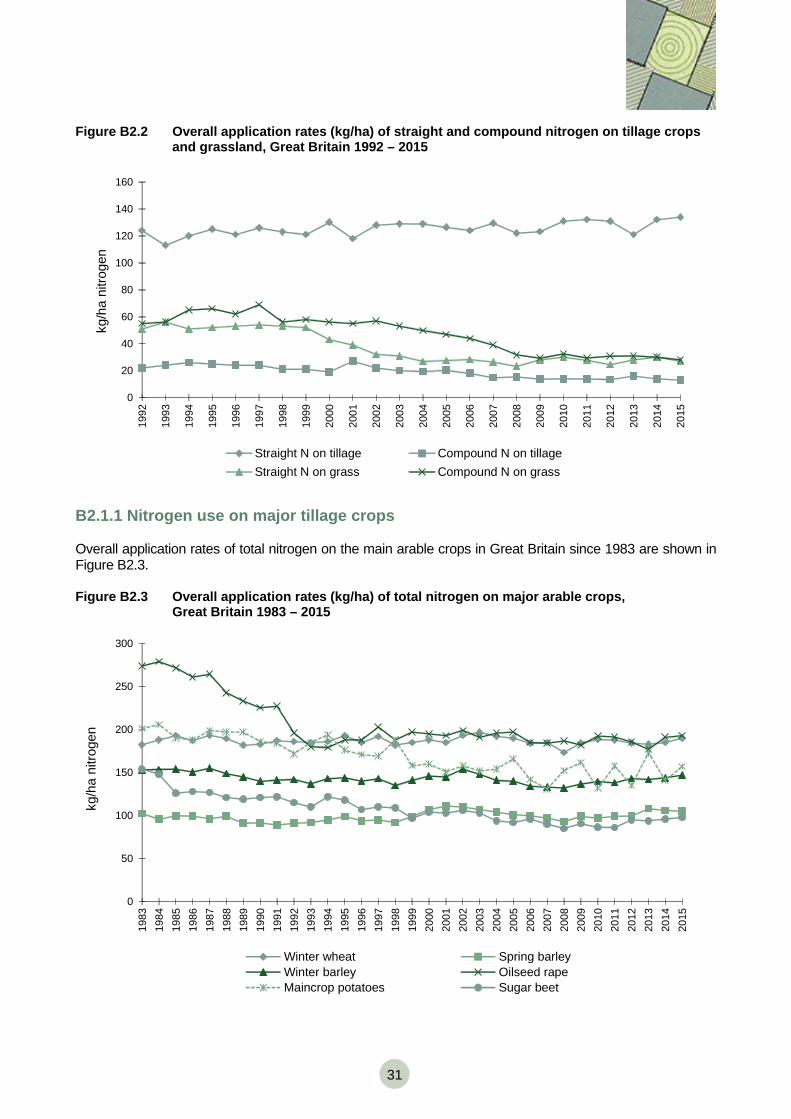
31
Figure B2.2 Overall application rates (kg/ha) of straight and compound nitrogen on tillage crops and grassland, Great Britain 1992 – 2015
0
20
40
60
80
100
120
140
160
1992
1993
1994
1995
1996
1997
1998
1999
2000
2001
2002
2003
2004
2005
2006
2007
2008
2009
2010
2011
2012
2013
2014
2015
kg/h
a ni
troge
n
Straight N on tillage Compound N on tillageStraight N on grass Compound N on grass
B2.1.1 Nitrogen use on major tillage crops Overall application rates of total nitrogen on the main arable crops in Great Britain since 1983 are shown in Figure B2.3. Figure B2.3 Overall application rates (kg/ha) of total nitrogen on major arable crops,
Great Britain 1983 – 2015
0
50
100
150
200
250
300
1983
1984
1985
1986
1987
1988
1989
1990
1991
1992
1993
1994
1995
1996
1997
1998
1999
2000
2001
2002
2003
2004
2005
2006
2007
2008
2009
2010
2011
2012
2013
2014
2015
kg/h
a ni
troge
n
Winter wheat Spring barleyWinter barley Oilseed rapeMaincrop potatoes Sugar beet
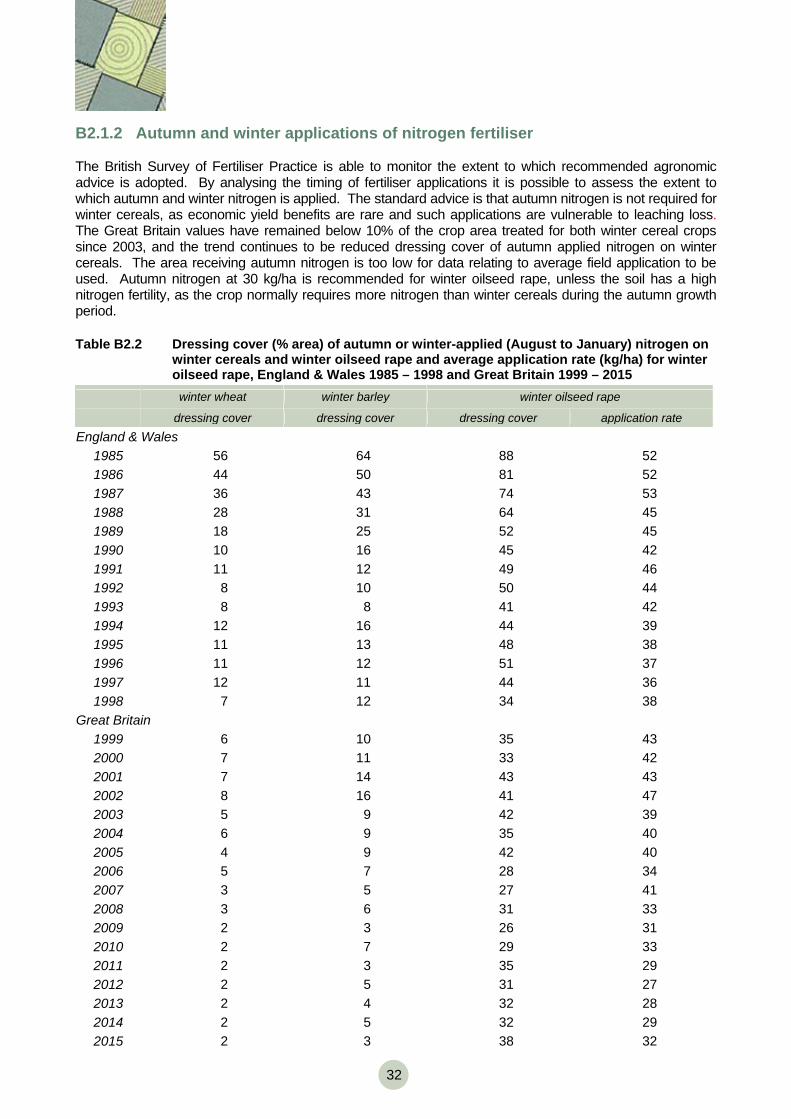
32 32
B2.1.2 Autumn and winter applications of nitrogen fertiliser The British Survey of Fertiliser Practice is able to monitor the extent to which recommended agronomic advice is adopted. By analysing the timing of fertiliser applications it is possible to assess the extent to which autumn and winter nitrogen is applied. The standard advice is that autumn nitrogen is not required for winter cereals, as economic yield benefits are rare and such applications are vulnerable to leaching loss. The Great Britain values have remained below 10% of the crop area treated for both winter cereal crops since 2003, and the trend continues to be reduced dressing cover of autumn applied nitrogen on winter cereals. The area receiving autumn nitrogen is too low for data relating to average field application to be used. Autumn nitrogen at 30 kg/ha is recommended for winter oilseed rape, unless the soil has a high nitrogen fertility, as the crop normally requires more nitrogen than winter cereals during the autumn growth period.
Table B2.2 Dressing cover (% area) of autumn or winter-applied (August to January) nitrogen on winter cereals and winter oilseed rape and average application rate (kg/ha) for winter oilseed rape, England & Wales 1985 – 1998 and Great Britain 1999 – 2015
winter wheat winter barley winter oilseed rape
dressing cover dressing cover dressing cover application rate England & Wales
1985 56 64 88 52 1986 44 50 81 52 1987 36 43 74 53 1988 28 31 64 45 1989 18 25 52 45 1990 10 16 45 42 1991 11 12 49 46 1992 8 10 50 44 1993 8 8 41 42 1994 12 16 44 39 1995 11 13 48 38 1996 11 12 51 37 1997 12 11 44 36 1998 7 12 34 38
Great Britain 1999 6 10 35 43 2000 7 11 33 42 2001 7 14 43 43 2002 8 16 41 47 2003 5 9 42 39 2004 6 9 35 40 2005 4 9 42 40 2006 5 7 28 34 2007 3 5 27 41 2008 3 6 31 33 2009 2 3 26 31 2010 2 7 29 33 2011 2 3 35 29 2012 2 5 31 27 2013 2 4 32 28 2014 2 5 32 29 2015 2 3 38 32
33
B2.2 PHOSPHATE AND POTASH USE Annual overall rates of phosphate and potash on tillage crops and on grassland in Great Britain since 1983 are illustrated in Figure B2.4, using the data presented in Tables B2.3 and B2.4. Figure B2.4 Overall application rates (kg/ha) phosphate and potash on tillage crops and grassland,
Great Britain 1983 – 2015
0
10
20
30
40
50
60
70
80
1983
1984
1985
1986
1987
1988
1989
1990
1991
1992
1993
1994
1995
1996
1997
1998
1999
2000
2001
2002
2003
2004
2005
2006
2007
2008
2009
2010
2011
2012
2013
2014
2015
kg/h
a nu
trien
t
Phosphate on tillage Potash on tillage
Phosphate on grass Potash on grass
Overall phosphate use on tillage crops declined gradually between 1984 and 1996, from 62 kg/ha to 52 kg/ha. Thereafter the decline in rates became more marked to 2010, with the dip in use in 2009 being caused by a major price increase for the nutrient. The data suggest that, since 2010, overall application rates of phosphate and potash have remained relatively constant. Overall phosphate rates on tillage crops have been consistently higher than those recorded on grass. The overall rate of phosphate on grassland was highest in 1983, at 28 kg/ha, and then application remained relatively stable at 21-26 kg/ha between 1984 and 1998. Overall application rates have declined more rapidly in the period between 1999 and 2009, where the rates were 20 kg/ha and 9 kg/ha respectively. Since then, the overall rates have remained stable at 9-10 kg/ha. Overall potash use on tillage crops declined slightly between 1983 and 1997, with the rates in the 60-68 kg/ha range. Like phosphate, overall application rates reduced at a greater rate after this time to 33 kg/ha in 2009. The potash rate in 2009 was the lowest since 1983 and again was thought to be a reaction to the price of the nutrient. Since then, the overall rates of potash on tillage have been in the 37-40 kg/ha range. The pattern of overall potash use on grassland has been more variable, compared to tillage crops, but has also shown a net decline between 1983 and 2015. Overall potash rates were relatively stable at 31-33 kg/ha during the mid-late 1980s and in the last five years have been in the 12-14 kg/ha range.
34 34
Table B2.3 Overall phosphate application rates (kg/ha), England & Wales 1969 - 2015 and Scotland and Great Britain 1983 – 2015
tillage crops grass all crops and grass
England & Wales
Scotland Great Britain
England& Wales
Scotland Great Britain
England & Wales
Scotland Great Britain
1969 53 - - 34 - - - - - 1970 56 - - 32 - - - - - 1971 54 - - 34 - - - - - 1972 56 - - 34 - - - - - 1973 54 - - 34 - - - - - 1974 51 - - 27 - - 39 - - 1975 46 - - 27 - - 34 - - 1976 50 - - 29 - - 38 - - 1977 51 - - 26 - - 37 - - 1978 49 - - 28 - - 39 - - 1979 49 - - 27 - - 38 - - 1980 49 - - 27 - - 37 - - 1981 51 - - 25 - - 38 - - 1982 55 - - 24 - - 39 - - 1983 54 63 55 26 36 28 39 47 40 1984 61 68 62 25 33 26 42 48 42 1985 56 70 58 24 30 25 40 46 41 1986 56 63 57 22 27 23 40 42 40 1987 56 71 58 23 28 24 39 45 40 1988 54 65 56 21 31 23 38 45 39 1989 52 67 54 23 31 24 38 45 39 1990 51 68 53 24 28 25 38 43 39 1991 53 65 54 23 24 23 38 40 38 1992 51 67 54 19 30 22 35 43 38 1993 49 65 52 19 28 21 33 41 35 1994 51 69 53 23 28 24 37 43 38 1995 50 68 53 22 31 24 36 45 37 1996 51 65 52 22 26 23 36 40 36 1997 53 69 55 24 32 25 38 46 39 1998 49 66 51 20 27 21 34 43 35 1999 43 64 45 19 27 20 31 42 32 2000 44 60 47 18 30 20 31 42 32 2001 40 60 43 16 29 19 27 41 29 2002 41 62 44 18 26 20 29 39 31 2003 37 61 40 16 26 18 26 39 28 2004 38 63 41 15 27 17 25 40 28 2005 37 56 40 15 22 16 25 35 27 2006 32 53 35 14 22 16 23 33 25 2007 32 53 34 12 19 14 22 32 23 2008 28 50 30 9 16 10 18 28 20 2009 19 49 23 7 15 9 13 27 15 2010 27 50 30 9 16 10 18 27 19 2011 27 50 29 8 14 9 17 25 19 2012 25 50 28 8 14 9 16 25 17 2013 25 51 28 8 14 9 16 27 18 2014 26 50 29 8 15 10 17 26 18 2015 26 51 29 8 13 9 17 27 18
35
Table B2.4 Overall potash application rates (kg/ha), England & Wales 1969 - 2015 and Scotland and Great Britain 1983 – 2015
tillage crops grass all crops and grass
England & Wales
Scotland Great Britain
England& Wales
Scotland Great Britain
England & Wales
Scotland Great Britain
1969 61 - - 23 - - - - - 1970 61 - - 26 - - - - - 1971 59 - - 21 - - - - - 1972 63 - - 20 - - - - - 1973 60 - - 22 - - - - - 1974 56 - - 20 - - 36 - - 1975 51 - - 21 - - 34 - - 1976 56 - - 23 - - 37 - - 1977 56 - - 23 - - 39 - - 1978 56 - - 25 - - 41 - - 1979 53 - - 27 - - 40 - - 1980 54 - - 26 - - 40 - - 1981 56 - - 26 - - 41 - - 1982 61 - - 28 - - 44 - - 1983 60 62 60 28 36 29 44 46 43 1984 68 67 68 33 35 33 50 49 49 1985 63 67 64 32 34 32 48 47 48 1986 62 61 62 33 30 33 48 43 47 1987 63 70 64 33 31 33 48 47 48 1988 63 66 63 30 34 31 47 47 47 1989 60 73 62 34 36 34 48 51 48 1990 62 74 64 36 35 36 49 50 49 1991 62 72 63 35 31 34 49 47 49 1992 59 72 63 26 34 28 43 48 45 1993 58 72 60 27 34 29 42 47 43 1994 62 74 63 31 31 31 46 46 46 1995 59 72 61 30 34 31 44 48 45 1996 59 73 61 31 28 30 45 44 44 1997 66 74 67 35 36 35 50 50 50 1998 63 73 64 28 36 29 45 51 46 1999 55 71 57 27 32 28 41 48 42 2000 54 67 55 24 33 26 39 47 40 2001 48 72 52 23 33 24 34 49 37 2002 55 72 57 24 30 25 38 46 40 2003 51 73 54 20 31 22 34 46 36 2004 52 72 55 21 30 22 35 46 37 2005 51 65 53 19 26 20 34 40 35 2006 46 68 48 19 28 21 32 42 33 2007 44 69 47 17 23 18 30 40 32 2008 40 67 43 12 20 13 26 37 27 2009 29 64 33 10 20 12 19 35 22 2010 33 67 38 13 19 14 23 35 25 2011 35 65 39 11 16 12 23 32 25 2012 34 68 37 11 17 12 22 33 23 2013 36 68 40 11 19 13 22 36 25 2014 35 67 39 12 20 14 23 35 25 2015 33 65 38 11 17 12 22 34 24
36 36
Overall rates of phosphate and potash applied to tillage crops are nearly three times those used on grassland. However there is greater use of applied manures on grassland (33% cover) than on tillage crops (23% cover) and grazed grassland also receives manure as it is grazed. Dressing covers of phosphate and potash on tillage and grass for the period 2004-15 are presented in Tables B2.5a and B2.5b. On tillage crops the phosphate dressing cover has declined in all countries since 2004. However the decline in England and Wales has been much higher (30% reduction) in comparison to Scotland where the reduction was 9% for the period. Despite this long term trend dressing covers have been relatively stable in the last 5 years. On grass, phosphate dressing covers have also declined since 2004, but these too have stabilised in more recent years. Potash dressing covers follow a similar pattern to phosphate, with a marked decline on tillage crops in England and Wales since 2004 followed by stabilisation during the last 5 years. Table B2.5a Phosphate dressing covers (%), Great Britain 2004 – 2015 tillage crops grass all crops and grass
England & Wales Scotland Great
Britain England& Wales Scotland Great
BritainEngland & Wales Scotland Great
Britain2004 61 93 65 55 77 59 58 83 61 2005 60 88 63 50 75 55 55 80 59 2006 52 89 57 52 75 56 52 79 57 2007 50 86 54 47 67 51 48 74 52 2008 46 88 52 37 61 42 42 71 47 2009 34 86 40 33 59 38 34 69 39 2010 45 87 50 37 64 43 41 71 46 2011 45 82 49 36 58 41 41 66 45 2012 42 87 47 37 57 41 39 67 44 2013 43 86 48 38 59 42 40 68 45 2014 44 85 49 36 61 41 40 69 45 2015 43 85 49 35 65 41 39 72 45
Table B2.5b Potash dressing covers (%), Great Britain 2004 – 2015 tillage crops grass all crops and grass
England & Wales Scotland Great
Britain England& Wales Scotland Great
BritainEngland & Wales Scotland Great
Britain2004 63 93 67 56 75 59 59 82 63 2005 61 90 65 51 71 55 56 78 60 2006 56 91 60 52 71 56 54 78 58 2007 54 90 58 47 65 51 51 74 54 2008 50 90 55 38 61 42 44 71 48 2009 37 88 43 34 61 39 35 71 41 2010 44 89 50 39 63 44 42 72 47 2011 46 84 50 38 57 42 42 66 46 2012 42 90 47 38 58 42 40 68 44 2013 46 87 51 39 59 43 42 69 47 2014 45 86 50 37 63 43 41 70 46 2015 45 88 50 35 65 42 40 73 46
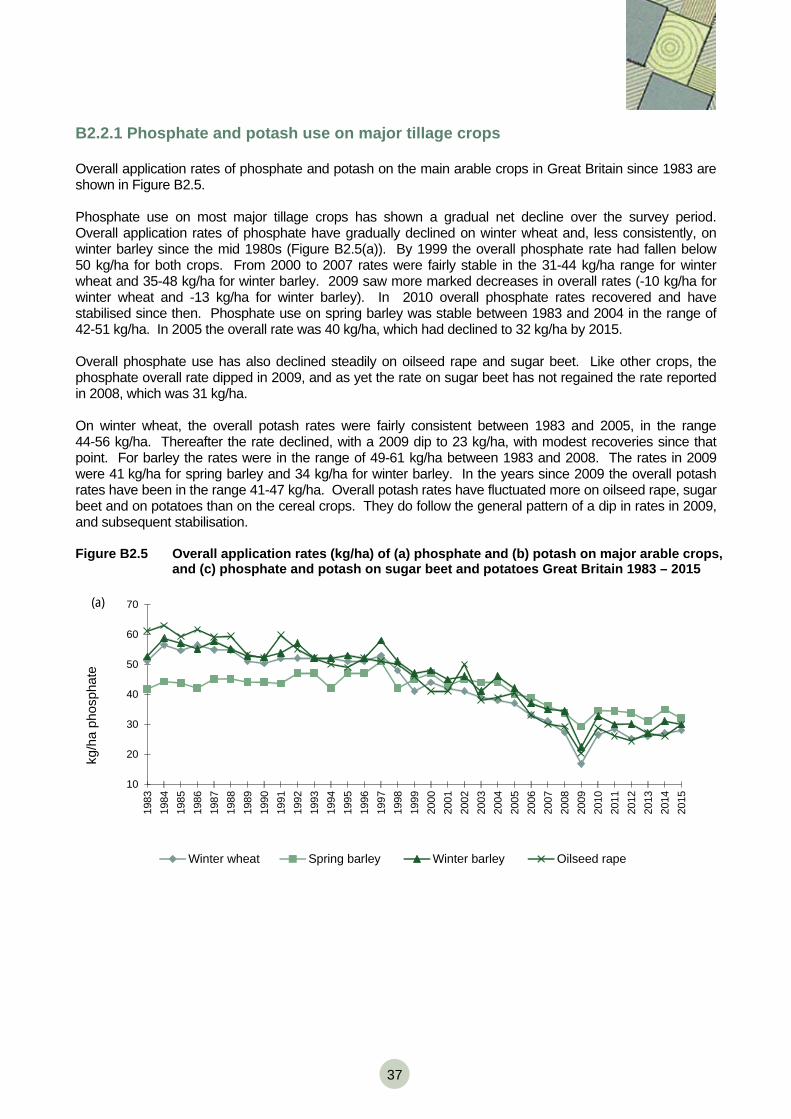
37
B2.2.1 Phosphate and potash use on major tillage crops Overall application rates of phosphate and potash on the main arable crops in Great Britain since 1983 are shown in Figure B2.5. Phosphate use on most major tillage crops has shown a gradual net decline over the survey period. Overall application rates of phosphate have gradually declined on winter wheat and, less consistently, on winter barley since the mid 1980s (Figure B2.5(a)). By 1999 the overall phosphate rate had fallen below 50 kg/ha for both crops. From 2000 to 2007 rates were fairly stable in the 31-44 kg/ha range for winter wheat and 35-48 kg/ha for winter barley. 2009 saw more marked decreases in overall rates (-10 kg/ha for winter wheat and -13 kg/ha for winter barley). In 2010 overall phosphate rates recovered and have stabilised since then. Phosphate use on spring barley was stable between 1983 and 2004 in the range of 42-51 kg/ha. In 2005 the overall rate was 40 kg/ha, which had declined to 32 kg/ha by 2015. Overall phosphate use has also declined steadily on oilseed rape and sugar beet. Like other crops, the phosphate overall rate dipped in 2009, and as yet the rate on sugar beet has not regained the rate reported in 2008, which was 31 kg/ha. On winter wheat, the overall potash rates were fairly consistent between 1983 and 2005, in the range 44-56 kg/ha. Thereafter the rate declined, with a 2009 dip to 23 kg/ha, with modest recoveries since that point. For barley the rates were in the range of 49-61 kg/ha between 1983 and 2008. The rates in 2009 were 41 kg/ha for spring barley and 34 kg/ha for winter barley. In the years since 2009 the overall potash rates have been in the range 41-47 kg/ha. Overall potash rates have fluctuated more on oilseed rape, sugar beet and on potatoes than on the cereal crops. They do follow the general pattern of a dip in rates in 2009, and subsequent stabilisation. Figure B2.5 Overall application rates (kg/ha) of (a) phosphate and (b) potash on major arable crops,
and (c) phosphate and potash on sugar beet and potatoes Great Britain 1983 – 2015
10
20
30
40
50
60
70
1983
1984
1985
1986
1987
1988
1989
1990
1991
1992
1993
1994
1995
1996
1997
1998
1999
2000
2001
2002
2003
2004
2005
2006
2007
2008
2009
2010
2011
2012
2013
2014
2015
kg/h
a ph
osph
ate
(a)
Winter wheat Spring barley Winter barley Oilseed rape
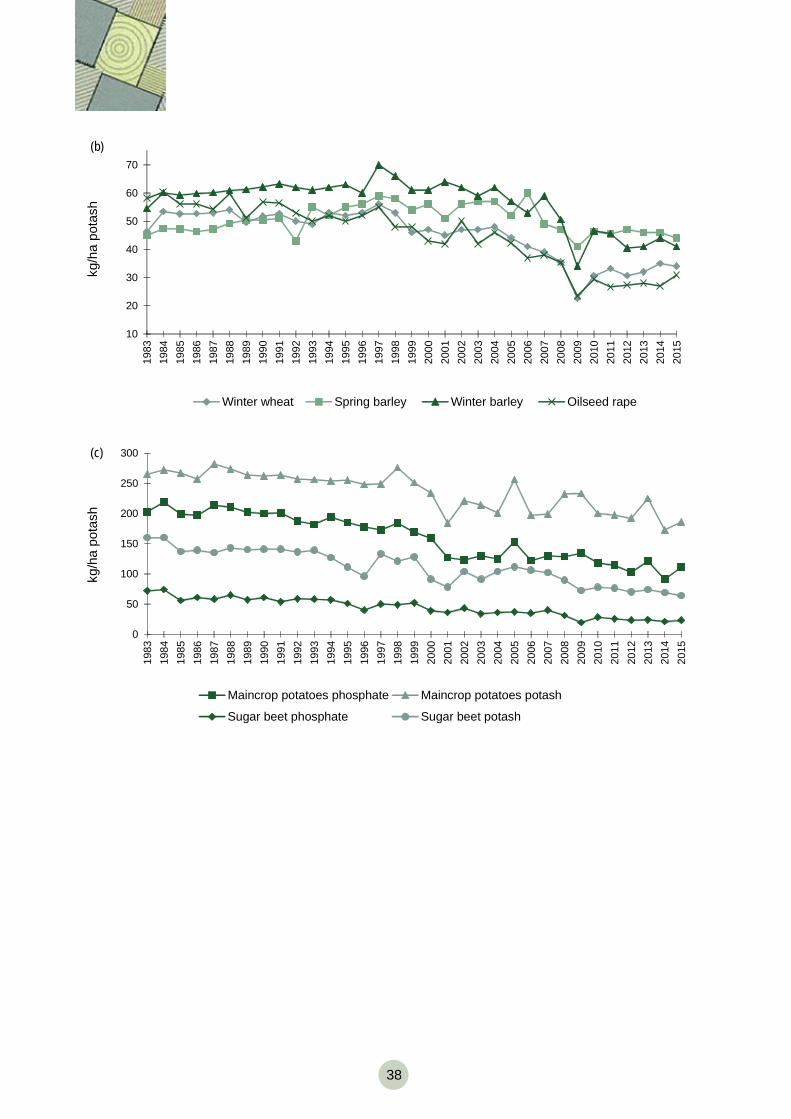
38 38
10
20
30
40
50
60
70
1983
1984
1985
1986
1987
1988
1989
1990
1991
1992
1993
1994
1995
1996
1997
1998
1999
2000
2001
2002
2003
2004
2005
2006
2007
2008
2009
2010
2011
2012
2013
2014
2015
kg/h
a po
tash
(b)
Winter wheat Spring barley Winter barley Oilseed rape
0
50
100
150
200
250
300
1983
1984
1985
1986
1987
1988
1989
1990
1991
1992
1993
1994
1995
1996
1997
1998
1999
2000
2001
2002
2003
2004
2005
2006
2007
2008
2009
2010
2011
2012
2013
2014
2015
kg/h
a po
tash
(c)
Maincrop potatoes phosphate Maincrop potatoes potash
Sugar beet phosphate Sugar beet potash
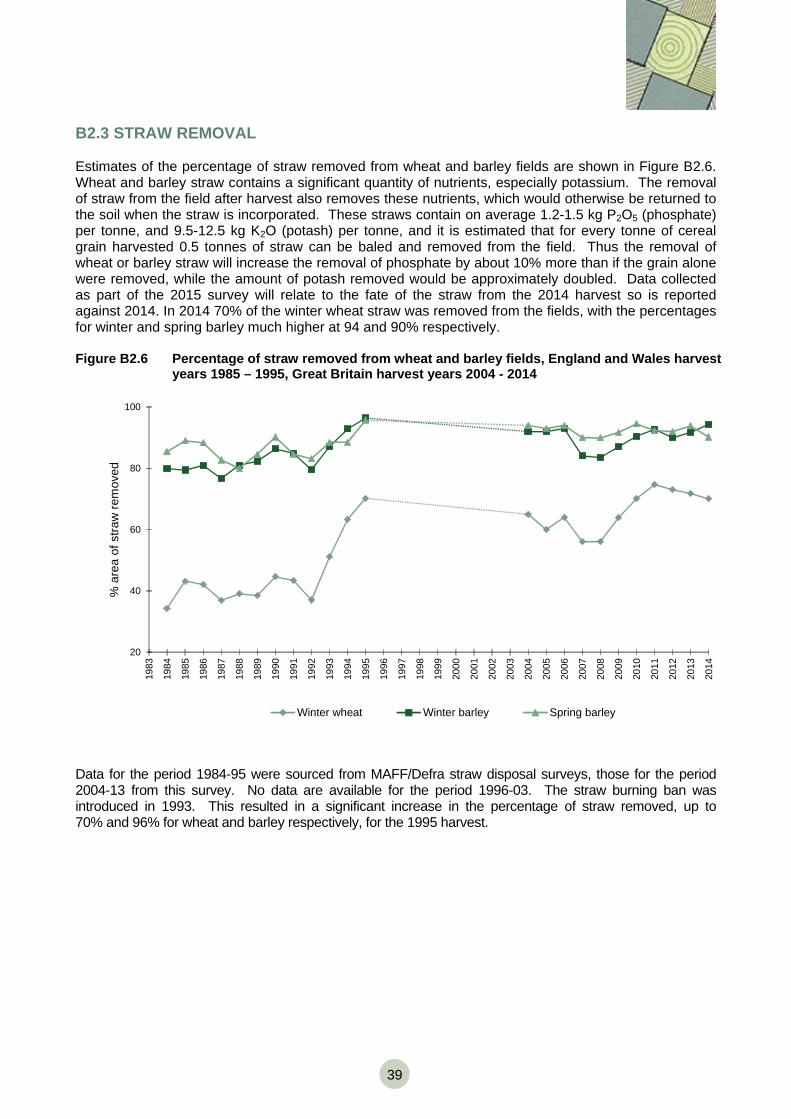
39
B2.3 STRAW REMOVAL Estimates of the percentage of straw removed from wheat and barley fields are shown in Figure B2.6. Wheat and barley straw contains a significant quantity of nutrients, especially potassium. The removal of straw from the field after harvest also removes these nutrients, which would otherwise be returned to the soil when the straw is incorporated. These straws contain on average 1.2-1.5 kg P2O5 (phosphate) per tonne, and 9.5-12.5 kg K2O (potash) per tonne, and it is estimated that for every tonne of cereal grain harvested 0.5 tonnes of straw can be baled and removed from the field. Thus the removal of wheat or barley straw will increase the removal of phosphate by about 10% more than if the grain alone were removed, while the amount of potash removed would be approximately doubled. Data collected as part of the 2015 survey will relate to the fate of the straw from the 2014 harvest so is reported against 2014. In 2014 70% of the winter wheat straw was removed from the fields, with the percentages for winter and spring barley much higher at 94 and 90% respectively. Figure B2.6 Percentage of straw removed from wheat and barley fields, England and Wales harvest
years 1985 – 1995, Great Britain harvest years 2004 - 2014
20
40
60
80
100
1983
1984
1985
1986
1987
1988
1989
1990
1991
1992
1993
1994
1995
1996
1997
1998
1999
2000
2001
2002
2003
2004
2005
2006
2007
2008
2009
2010
2011
2012
2013
2014
% a
rea
of s
traw
rem
oved
Winter wheat Winter barley Spring barley
Data for the period 1984-95 were sourced from MAFF/Defra straw disposal surveys, those for the period 2004-13 from this survey. No data are available for the period 1996-03. The straw burning ban was introduced in 1993. This resulted in a significant increase in the percentage of straw removed, up to 70% and 96% for wheat and barley respectively, for the 1995 harvest.
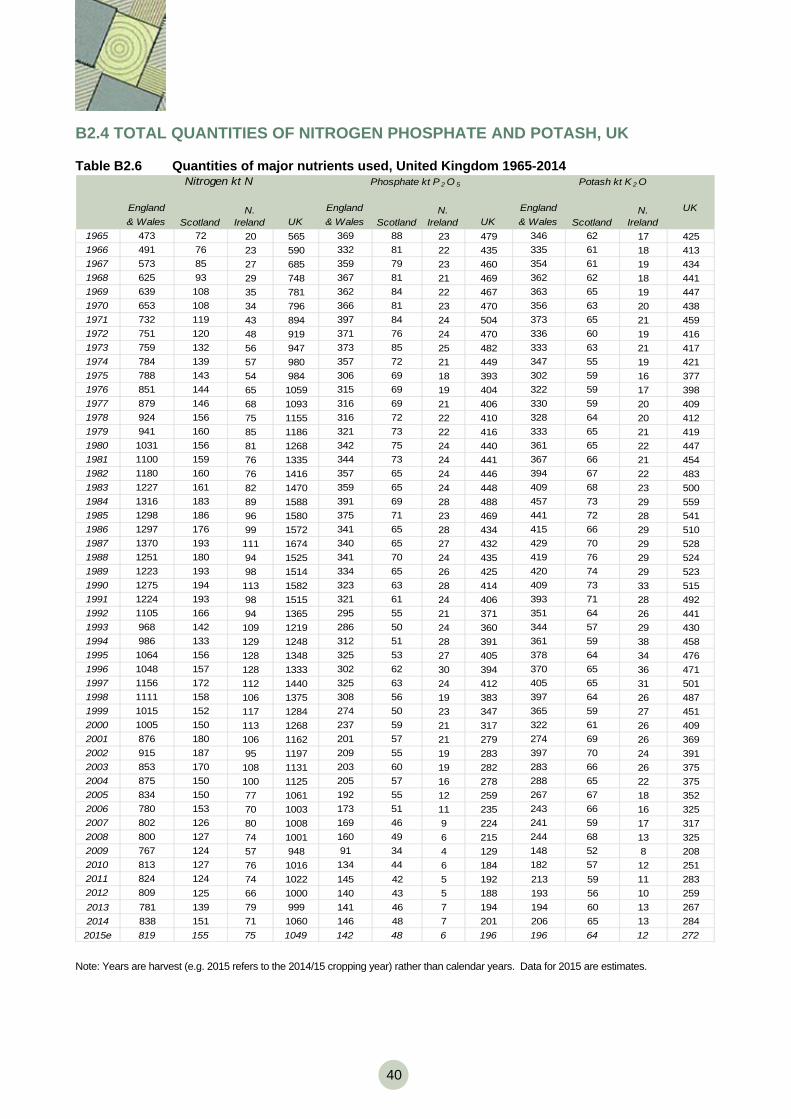
40 40
B2.4 TOTAL QUANTITIES OF NITROGEN PHOSPHATE AND POTASH, UK Table B2.6 Quantities of major nutrients used, United Kingdom 1965-2014
England England England UK& Wales UK & Wales UK & Wales
1965 473 72 20 565 369 88 23 479 346 62 17 4251966 491 76 23 590 332 81 22 435 335 61 18 4131967 573 85 27 685 359 79 23 460 354 61 19 4341968 625 93 29 748 367 81 21 469 362 62 18 4411969 639 108 35 781 362 84 22 467 363 65 19 4471970 653 108 34 796 366 81 23 470 356 63 20 4381971 732 119 43 894 397 84 24 504 373 65 21 4591972 751 120 48 919 371 76 24 470 336 60 19 4161973 759 132 56 947 373 85 25 482 333 63 21 4171974 784 139 57 980 357 72 21 449 347 55 19 4211975 788 143 54 984 306 69 18 393 302 59 16 3771976 851 144 65 1059 315 69 19 404 322 59 17 3981977 879 146 68 1093 316 69 21 406 330 59 20 4091978 924 156 75 1155 316 72 22 410 328 64 20 4121979 941 160 85 1186 321 73 22 416 333 65 21 4191980 1031 156 81 1268 342 75 24 440 361 65 22 4471981 1100 159 76 1335 344 73 24 441 367 66 21 4541982 1180 160 76 1416 357 65 24 446 394 67 22 4831983 1227 161 82 1470 359 65 24 448 409 68 23 5001984 1316 183 89 1588 391 69 28 488 457 73 29 5591985 1298 186 96 1580 375 71 23 469 441 72 28 5411986 1297 176 99 1572 341 65 28 434 415 66 29 5101987 1370 193 111 1674 340 65 27 432 429 70 29 5281988 1251 180 94 1525 341 70 24 435 419 76 29 5241989 1223 193 98 1514 334 65 26 425 420 74 29 5231990 1275 194 113 1582 323 63 28 414 409 73 33 5151991 1224 193 98 1515 321 61 24 406 393 71 28 4921992 1105 166 94 1365 295 55 21 371 351 64 26 4411993 968 142 109 1219 286 50 24 360 344 57 29 4301994 986 133 129 1248 312 51 28 391 361 59 38 4581995 1064 156 128 1348 325 53 27 405 378 64 34 4761996 1048 157 128 1333 302 62 30 394 370 65 36 4711997 1156 172 112 1440 325 63 24 412 405 65 31 5011998 1111 158 106 1375 308 56 19 383 397 64 26 4871999 1015 152 117 1284 274 50 23 347 365 59 27 4512000 1005 150 113 1268 237 59 21 317 322 61 26 4092001 876 180 106 1162 201 57 21 279 274 69 26 3692002 915 187 95 1197 209 55 19 283 397 70 24 3912003 853 170 108 1131 203 60 19 282 283 66 26 3752004 875 150 100 1125 205 57 16 278 288 65 22 3752005 834 150 77 1061 192 55 12 259 267 67 18 3522006 780 153 70 1003 173 51 11 235 243 66 16 3252007 802 126 80 1008 169 46 9 224 241 59 17 3172008 800 127 74 1001 160 49 6 215 244 68 13 3252009 767 124 57 948 91 34 4 129 148 52 8 2082010 813 127 76 1016 134 44 6 184 182 57 12 2512011 824 124 74 1022 145 42 5 192 213 59 11 2832012 809 125 66 1000 140 43 5 188 193 56 10 2592013 781 139 79 999 141 46 7 194 194 60 13 2672014 838 151 71 1060 146 48 7 201 206 65 13 2842015e 819 155 75 1049 142 48 6 196 196 64 12 272
Nitrogen kt N Phosphate kt P 2 O 5
N. Ireland
N. Ireland
Potash kt K 2 O
Scotland Scotland ScotlandN.
Ireland
Note: Years are harvest (e.g. 2015 refers to the 2014/15 cropping year) rather than calendar years. Data for 2015 are estimates.
41
Quantities of nitrogen, phosphate and potash used in the UK since 1965 are shown in Table B2.6. These data are based on BSFP findings and trade and sales data. They are compiled by the Agricultural Industries Confederation in conjunction with Defra using the methodology described in Section A2.5. They are the official figures for fertiliser usage. Total nitrogen use in the UK increased from 565 thousand tonnes in 1965 up to 1674 thousand tonnes in 1987 before declining gradually to 1001 thousand tonnes in 2008. The drop in 2009 was related to high fertiliser prices. Between 2010 and 2015 nitrogen use has remained relatively stable.From the peak in 1987, nitrogen use since 2010 has fallen by approximately 40%. Phosphate use in the UK has fallen since the mid 1980s but since 2007 this decline has slowed and total phosphate use has been more stable between 2010 and 2015 at 184-201 thousand tonnes, but use is still approximately half that compared to use between 1965 and 1985. The low use of 129 thousand tonnes in 2009 was price related. Potash use in the UK was highest in the mid 1980s through to 1999 after which there has been a more sustained decline. Potash use between 2010 and 2015 has been between 251-284 thousand tonnes, which is around half that used at its peak. The low use of 208 thousand tonnes in 2009 was price related.
42 42
SECTION C – TABLES
CONTENTS
GREAT BRITAIN TABLES 2015
GB 1.1 Total fertiliser use, Great Britain 44
GB 1.2 Use of straight fertiliser, Great Britain 45
GB 1.3 Use of compound fertiliser, Great Britain 46
GB 1.4 Use of lime, Great Britain 47
GB 2.1 Average fertiliser practice by grassland utilisation, Great Britain 48
GB 3.0 Product and nutrient use by month of application, Great Britain 49
GB 3.1 Product type as percentage of all product used by crop group, Great Britain 50
GB 3.2 Use of product type by crop group, Great Britain 50
GB 3.3 Product use by month of application, Great Britain 51
GB 4.1 Average fertiliser practice on cereal farms, Great Britain 52
GB 4.2 Average fertiliser practice on general cropping and horticultural farms, Great Britain 53
GB 4.3 Average fertiliser practice on dairy farms, Great Britain 54
GB 4.4 Average fertiliser practice on other livestock farms, Great Britain 55
GB 4.5 Average fertiliser practice on mixed farms, Great Britain 56
ENGLAND AND WALES TABLES 2015
EW 1.1 Total fertiliser use, England & Wales 57
EW 1.2 Use of straight fertiliser, England & Wales 58
EW 1.3 Use of compound fertiliser, England & Wales 59
EW 1.4 Use of lime, England & Wales 60
EW 1.5 Percentage of crop area by field application rate - N, England & Wales 61
EW 1.6 Percentage of crop area by field application rate - P2O5, England & Wales 62
EW 1.7 Percentage of crop area by field application rate - K2O, England & Wales 63
Note: 1. Row percentages may not sum to exactly to 100 due to rounding.
2. No estimates are shown for crops with fewer than 5 fields in the sample. Nevertheless, some estimates are based on very few fields in the sample and should be treated with great caution.
3. FYM refers to any form of organic manure applied.
43
EW 2.1 Average fertiliser practice by grassland utilisation, England & Wales 64
EW 2.2 Percentage of grass area by field application rate - N, England & Wales 64
EW 2.3 Percentage of grass area by field application rate - P2O5, England & Wales 65
EW 2.4 Percentage of grass area by field application rate - K2O, England & Wales 65
EW 3.0 Product and nutrient use by month of application, England & Wales 66
EW 3.1 Product type as percentage of all product used by crop group, England & Wales 67
EW 3.2 Use of product type by crop group, England & Wales 67
EW 3.3 Product use by month of application, England & Wales 68
EW 4.1a Average fertiliser practice on tillage and grassland by GOR, England & Wales 69
EW 4.1b Average fertiliser practice on tillage and grassland by BSFP region, England & Wales 70
SCOTLAND TABLES 2015
SC 1.1 Total fertiliser use, Scotland 71
SC 1.2 Use of straight fertiliser, Scotland 71
SC 1.3 Use of compound fertiliser, Scotland 72
SC 1.4 Use of lime, Scotland 72
SC 1.5 Percentage of crop area by field application rate - N, Scotland 73
SC 1.6 Percentage of crop area by field application rate - P2O5, Scotland 73
SC 1.7 Percentage of crop area by field application rate - K2O, Scotland 74
SC 2.1 Average fertiliser practice by grassland utilisation, Scotland 74
SC 2.2 Percentage of grass area by field application rate - N, Scotland 75
SC 2.3 Percentage of grass area by field application rate - P2O5, Scotland 75
SC 2.4 Percentage of grass area by field application rate - K2O, Scotland 76
SC 3.0 Product and nutrient use by month of application, Scotland 77 Note: 1. Row percentages may not sum to exactly to 100 due to rounding.
2. No estimates are shown for crops with fewer than 5 fields in the sample. Nevertheless, some estimates are based on very few fields in the sample and should be treated with great caution.
3. FYM refers to any form of organic manure applied.
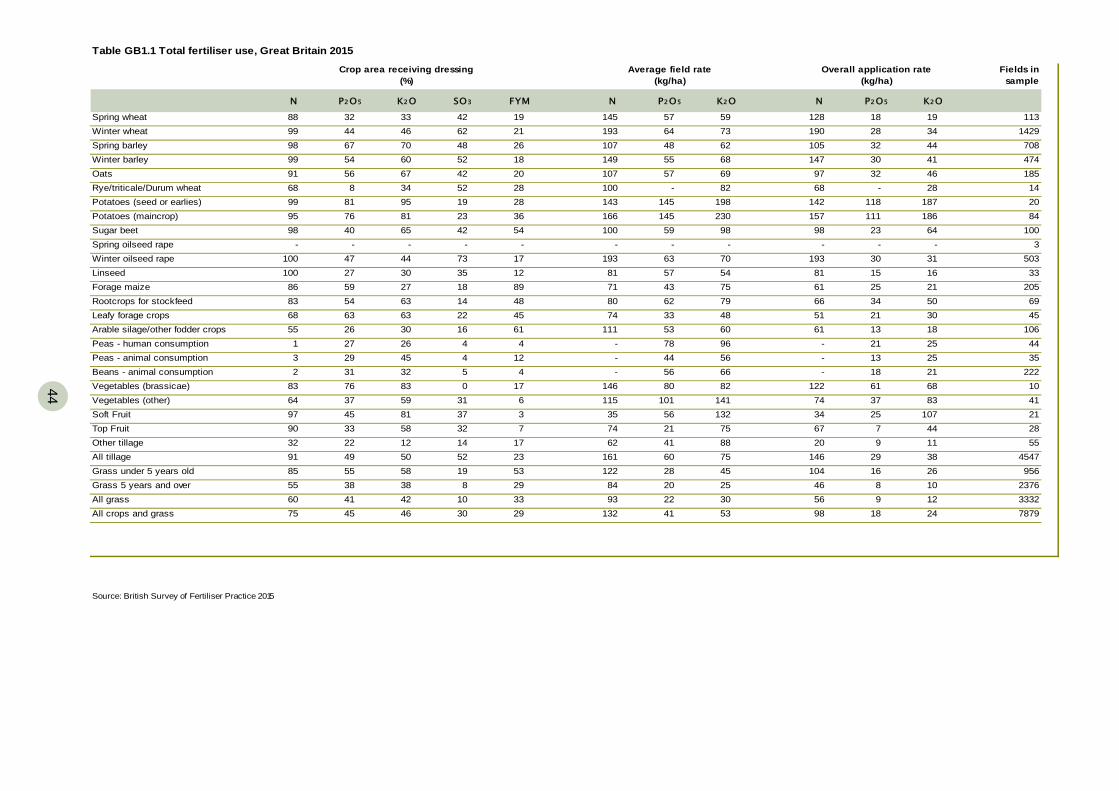
44
44
Fields in sample
N P2O5 K2O SO3 FYM N P2O5 K2O N P2O5 K2O
Spring wheat 88 32 33 42 19 145 57 59 128 18 19 113 Winter wheat 99 44 46 62 21 193 64 73 190 28 34 1429 Spring barley 98 67 70 48 26 107 48 62 105 32 44 708 Winter barley 99 54 60 52 18 149 55 68 147 30 41 474 Oats 91 56 67 42 20 107 57 69 97 32 46 185 Rye/triticale/Durum wheat 68 8 34 52 28 100 - 82 68 - 28 14 Potatoes (seed or earlies) 99 81 95 19 28 143 145 198 142 118 187 20 Potatoes (maincrop) 95 76 81 23 36 166 145 230 157 111 186 84 Sugar beet 98 40 65 42 54 100 59 98 98 23 64 100 Spring oilseed rape - - - - - - - - - - - 3 Winter oilseed rape 100 47 44 73 17 193 63 70 193 30 31 503 Linseed 100 27 30 35 12 81 57 54 81 15 16 33 Forage maize 86 59 27 18 89 71 43 75 61 25 21 205 Rootcrops for stockfeed 83 54 63 14 48 80 62 79 66 34 50 69 Leafy forage crops 68 63 63 22 45 74 33 48 51 21 30 45 Arable silage/other fodder crops 55 26 30 16 61 111 53 60 61 13 18 106 Peas - human consumption 1 27 26 4 4 - 78 96 - 21 25 44 Peas - animal consumption 3 29 45 4 12 - 44 56 - 13 25 35 Beans - animal consumption 2 31 32 5 4 - 56 66 - 18 21 222 Vegetables (brassicae) 83 76 83 0 17 146 80 82 122 61 68 10 Vegetables (other) 64 37 59 31 6 115 101 141 74 37 83 41 Soft Fruit 97 45 81 37 3 35 56 132 34 25 107 21 Top Fruit 90 33 58 32 7 74 21 75 67 7 44 28 Other tillage 32 22 12 14 17 62 41 88 20 9 11 55 All tillage 91 49 50 52 23 161 60 75 146 29 38 4547 Grass under 5 years old 85 55 58 19 53 122 28 45 104 16 26 956 Grass 5 years and over 55 38 38 8 29 84 20 25 46 8 10 2376 All grass 60 41 42 10 33 93 22 30 56 9 12 3332 All crops and grass 75 45 46 30 29 132 41 53 98 18 24 7879
Table GB1.1 Total fertiliser use, Great Britain 2015
Crop area receiving dressing(%)
Average field rate(kg/ha)
Overall application rate(kg/ha)
Source: British Survey of Fertiliser Practice 2015
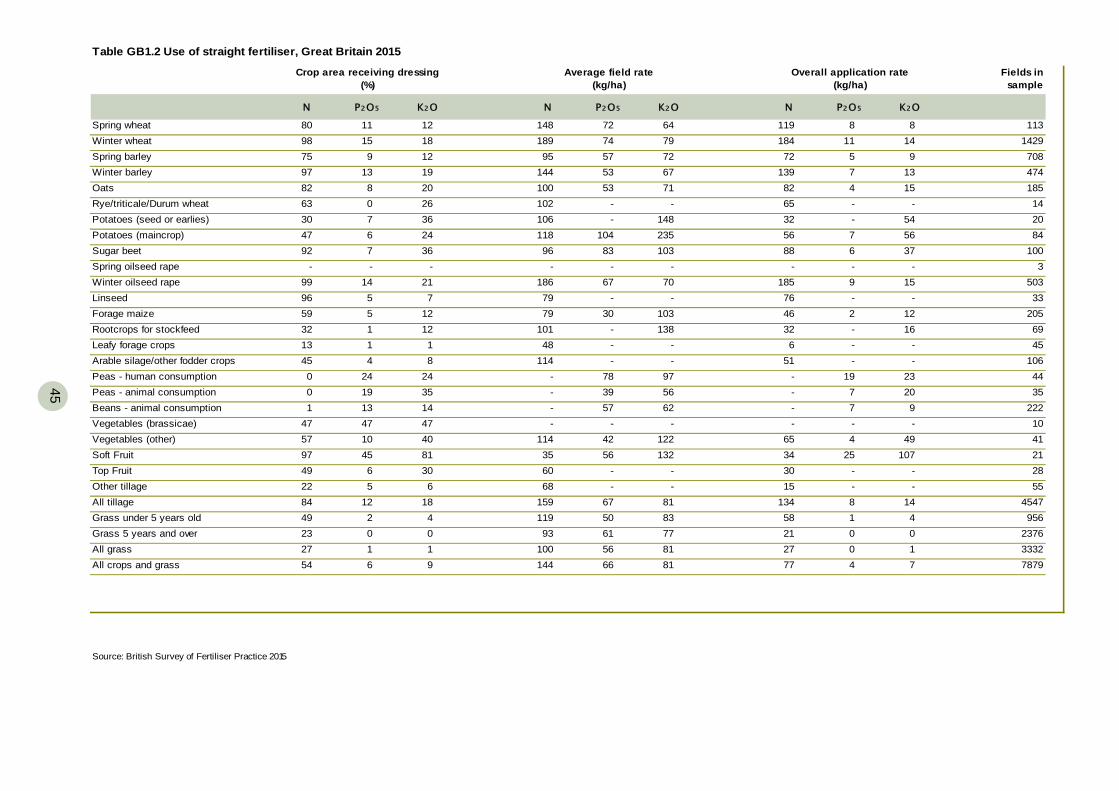
45
Fields in sample
N P2O5 K2O N P2O5 K2O N P2O5 K2O
Spring wheat 80 11 12 148 64 119 8 8 113Winter wheat 98 15 18 189 79 184 11 14 1429Spring barley 75 9 12 95 72 72 5 9 708Winter barley 97 13 19 144 67 139 7 13 474Oats 82 8 20 100 71 82 4 15 185Rye/triticale/Durum wheat 63 0 26 102 - 65 - - 14Potatoes (seed or earlies) 30 7 36 106 148 32 - 54 20Potatoes (maincrop) 47 6 24 118 235 56 7 56 84Sugar beet 92 7 36 96 103 88 6 37 100Spring oilseed rape - - - - - - - - 3Winter oilseed rape 99 14 21 186 70 185 9 15 503Linseed 96 5 7 79 - 76 - - 33Forage maize 59 5 12 79 103 46 2 12 205Rootcrops for stockfeed 32 1 12 101 138 32 - 16 69Leafy forage crops 13 1 1 48 - 6 - - 45Arable silage/other fodder crops 45 4 8 114 - 51 - - 106Peas - human consumption 0 24 24 - 97 - 19 23 44Peas - animal consumption 0 19 35 - 56 - 7 20 35Beans - animal consumption 1 13 14 - 62 - 7 9 222Vegetables (brassicae) 47 47 47 - - - - - 10Vegetables (other) 57 10 40 114 122 65 4 49 41Soft Fruit 97 45 81 35 132 34 25 107 21Top Fruit 49 6 30 60 - 30 - - 28Other tillage 22 5 6 68 - 15 - - 55All tillage 84 12 18 159 81 134 8 14 4547Grass under 5 years old 49 2 4 119 83 58 1 4 956Grass 5 years and over 23 0 0 93 77 21 0 0 2376All grass 27 1 1 100 81 27 0 1 3332All crops and grass 54 6 9 144 81 77 4 7 7879
Source: British Survey of Fertiliser Practice 2015
5666
-675061
-4256
-
-783957
-30
--
10483
-67
5353
--
Overall application rate(kg/ha)
727457
Table GB1.2 Use of straight fertiliser, Great Britain 2015
Crop area receiving dressing(%)
Average field rate(kg/ha)

46
46
Fields in sample
N P2O5 K2O N P2O5 N P2O5 K2O
Spring wheat 13 21 22 71 50 9 10 12 113Winter wheat 10 30 28 58 59 6 17 19 1429Spring barley 51 58 59 65 47 33 27 35 708Winter barley 13 42 43 58 56 8 23 29 474Oats 24 48 47 66 57 15 28 32 185Rye/triticale/Durum wheat 4 8 8 - - - - - 14Potatoes (seed or earlies) 93 81 62 118 144 110 117 133 20Potatoes (maincrop) 70 70 66 144 149 102 104 130 84Sugar beet 21 33 37 47 54 10 18 26 100Spring oilseed rape - - - - - - - - 3Winter oilseed rape 23 34 23 35 60 8 20 16 503Linseed 8 22 22 - 45 - 10 11 33Forage maize 56 55 17 26 43 15 24 9 205Rootcrops for stockfeed 53 53 54 63 62 34 33 34 69Leafy forage crops 61 61 61 72 33 44 20 29 45Arable silage/other fodder crops 19 22 23 50 49 10 11 12 106Peas - human consumption 1 3 2 - - - - - 44Peas - animal consumption 3 10 10 - 52 - 5 5 35Beans - animal consumption 0 18 18 - 56 - 10 13 222Vegetables (brassicae) 36 29 36 48 - 17 - 21 10Vegetables (other) 17 27 24 50 121 9 33 34 41Soft Fruit 0 0 0 - - - - - 21Top Fruit 54 27 54 69 - 37 - 27 28Other tillage 16 17 6 34 44 5 7 5 55All tillage 22 37 33 59 57 13 21 23 4547Grass under 5 years old 52 53 54 87 27 45 14 22 956Grass 5 years and over 38 38 38 65 19 25 7 9 2376All grass 41 40 41 70 21 28 9 11 3332All crops and grass 32 39 37 66 37 21 14 17 7879
Source: British Survey of Fertiliser Practice 2015
2846
85704125
59141
-50
53-
5569
48506348
-70
6668
-216
Table GB1.3 Use of compound fertiliser, Great Britain 2015
Crop area receiving dressing(%)
Average field rate(kg/ha)
19570
Overall application rate(kg/ha)
K2O
536860
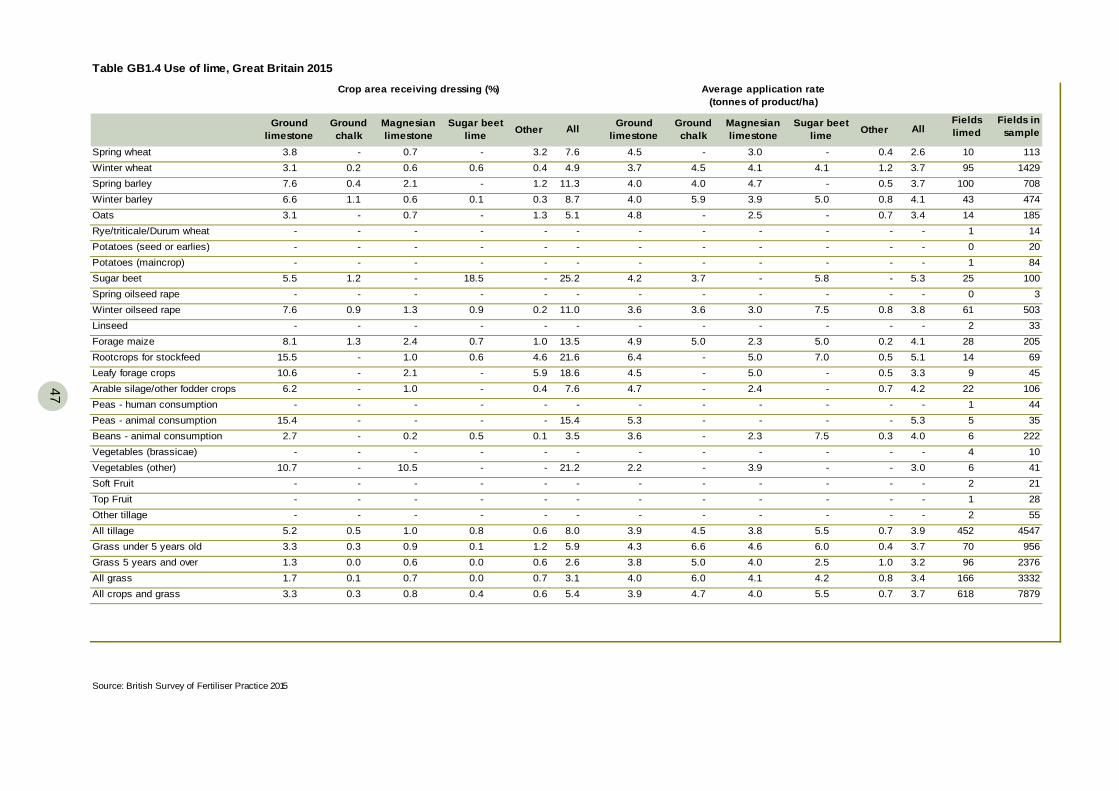
47
Ground limestone
Ground chalk
Magnesian limestone
Sugar beet lime Other Ground
limestoneGround chalk
Magnesian limestone
Sugar beet lime Other
Fields limed
Fields in sample
Spring wheat 3.8 - 0.7 - 3.2 4.5 - 3.0 - 0.4 2.6 10 113Winter wheat 3.1 0.2 0.6 0.6 0.4 3.7 4.5 4.1 4.1 1.2 3.7 95 1429Spring barley 7.6 0.4 2.1 - 1.2 4.0 4.0 4.7 - 0.5 3.7 100 708Winter barley 6.6 1.1 0.6 0.1 0.3 4.0 5.9 3.9 5.0 0.8 4.1 43 474Oats 3.1 - 0.7 - 1.3 4.8 - 2.5 - 0.7 3.4 14 185Rye/triticale/Durum wheat - - - - - - - - - - - 1 14Potatoes (seed or earlies) - - - - - - - - - - - 0 20Potatoes (maincrop) - - - - - - - - - - - 1 84Sugar beet 5.5 1.2 - 18.5 - 4.2 3.7 - 5.8 - 5.3 25 100Spring oilseed rape - - - - - - - - - - - 0 3Winter oilseed rape 7.6 0.9 1.3 0.9 0.2 3.6 3.6 3.0 7.5 0.8 3.8 61 503Linseed - - - - - - - - - - - 2 33Forage maize 8.1 1.3 2.4 0.7 1.0 4.9 5.0 2.3 5.0 0.2 4.1 28 205Rootcrops for stockfeed 15.5 - 1.0 0.6 4.6 6.4 - 5.0 7.0 0.5 5.1 14 69Leafy forage crops 10.6 - 2.1 - 5.9 4.5 - 5.0 - 0.5 3.3 9 45Arable silage/other fodder crops 6.2 - 1.0 - 0.4 4.7 - 2.4 - 0.7 4.2 22 106Peas - human consumption - - - - - - - - - - - 1 44Peas - animal consumption 15.4 - - - - 5.3 - - - - 5.3 5 35Beans - animal consumption 2.7 - 0.2 0.5 0.1 3.6 - 2.3 7.5 0.3 4.0 6 222Vegetables (brassicae) - - - - - - - - - - - 4 10Vegetables (other) 10.7 - 10.5 - - 2.2 - 3.9 - - 3.0 6 41Soft Fruit - - - - - - - - - - - 2 21Top Fruit - - - - - - - - - - - 1 28Other tillage - - - - - - - - - - - 2 55All tillage 5.2 0.5 1.0 0.8 0.6 3.9 4.5 3.8 5.5 0.7 3.9 452 4547Grass under 5 years old 3.3 0.3 0.9 0.1 1.2 4.3 6.6 4.6 6.0 0.4 3.7 70 956Grass 5 years and over 1.3 0.0 0.6 0.0 0.6 3.8 5.0 4.0 2.5 1.0 3.2 96 2376All grass 1.7 0.1 0.7 0.0 0.7 4.0 6.0 4.1 4.2 0.8 3.4 166 3332All crops and grass 3.3 0.3 0.8 0.4 0.6 3.9 4.7 4.0 5.5 0.7 3.7 618 7879
Table GB1.4 Use of lime, Great Britain 2015
Crop area receiving dressing (%)
5.1--
8.7
All
7.64.9
11.3
Source: British Survey of Fertiliser Practice 2015
-
-
25.2-
11.0-
13.521.618.67.6
-15.4
All
Average application rate (tonnes of product/ha)
5.4
8.05.92.63.1
3.5
21.2---
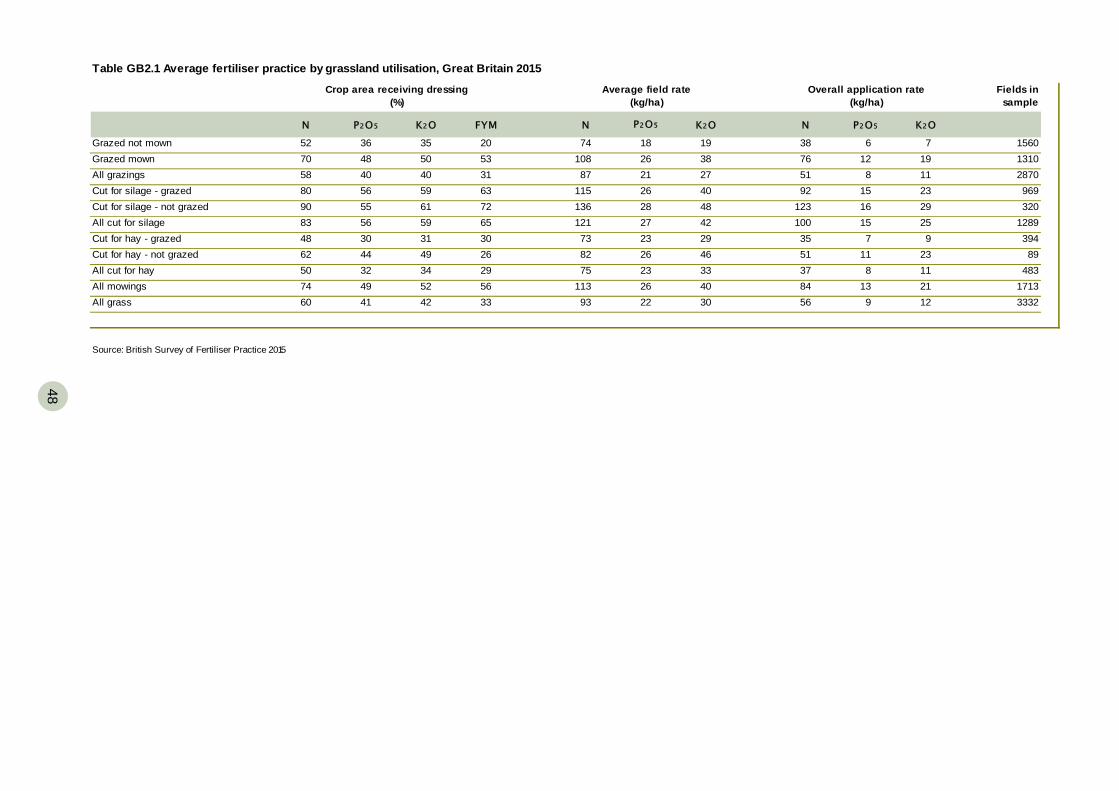
48
48
Fields in sample
N P2O5 K2O FYM N K2O N P2O5 K2O
Grazed not mown 52 36 35 20 74 19 38 6 7 1560 Grazed mown 70 48 50 53 108 38 76 12 19 1310 All grazings 58 40 40 31 87 27 51 8 11 2870 Cut for silage - grazed 80 56 59 63 115 40 92 15 23 969 Cut for silage - not grazed 90 55 61 72 136 48 123 16 29 320 All cut for silage 83 56 59 65 121 42 100 15 25 1289 Cut for hay - grazed 48 30 31 30 73 29 35 7 9 394 Cut for hay - not grazed 62 44 49 26 82 46 51 11 23 89 All cut for hay 50 32 34 29 75 33 37 8 11 483 All mowings 74 49 52 56 113 40 84 13 21 1713 All grass 60 41 42 33 93 30 56 9 12 3332
Source: British Survey of Fertiliser Practice 2015
26232622
282723
P2O5
182621
Table GB2.1 Average fertiliser practice by grassland utilisation, Great Britain 2015
Crop area receiving dressing(%)
Average field rate(kg/ha)
Overall application rate(kg/ha)
26
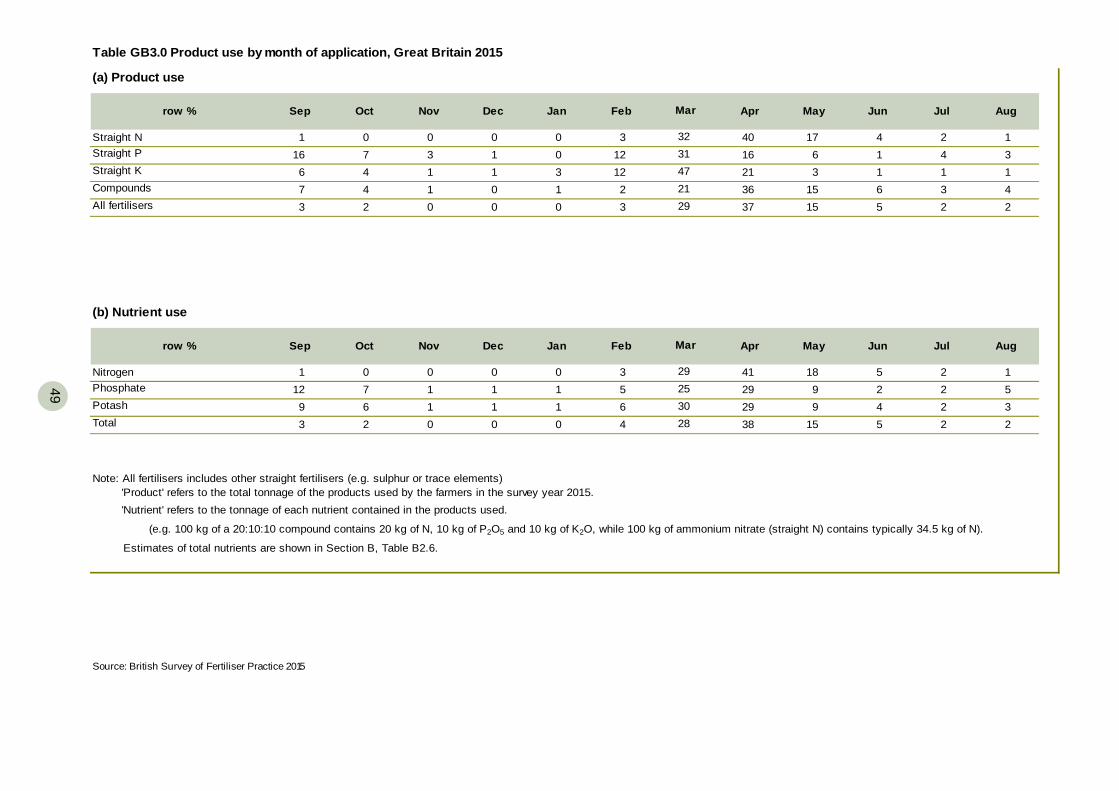
49
(a) Product use
row % Sep Oct Nov Dec Jan Feb Apr May Jun Jul Aug
Straight N 1 0 0 0 0 3 40 17 4 2 1Straight P 16 7 3 1 0 12 16 6 1 4 3Straight K 6 4 1 1 3 12 21 3 1 1 1Compounds 7 4 1 0 1 2 36 15 6 3 4All fertilisers 3 2 0 0 0 3 37 15 5 2 2
(b) Nutrient use
row % Sep Oct Nov Dec Jan Feb Apr May Jun Jul Aug
Nitrogen 1 0 0 0 0 3 41 18 5 2 1Phosphate 12 7 1 1 1 5 29 9 2 2 5Potash 9 6 1 1 1 6 29 9 4 2 3Total 3 2 0 0 0 4 38 15 5 2 2
Source: British Survey of Fertiliser Practice 2015
'Product' refers to the total tonnage of the products used by the farmers in the survey year 2015. 'Nutrient' refers to the tonnage of each nutrient contained in the products used.
(e.g. 100 kg of a 20:10:10 compound contains 20 kg of N, 10 kg of P2O5 and 10 kg of K2O, while 100 kg of ammonium nitrate (straight N) contains typically 34.5 kg of N).
Estimates of total nutrients are shown in Section B, Table B2.6.
28
Mar
292530
Note: All fertilisers includes other straight fertilisers (e.g. sulphur or trace elements)
Table GB3.0 Product use by month of application, Great Britain 2015
Mar
3231472129
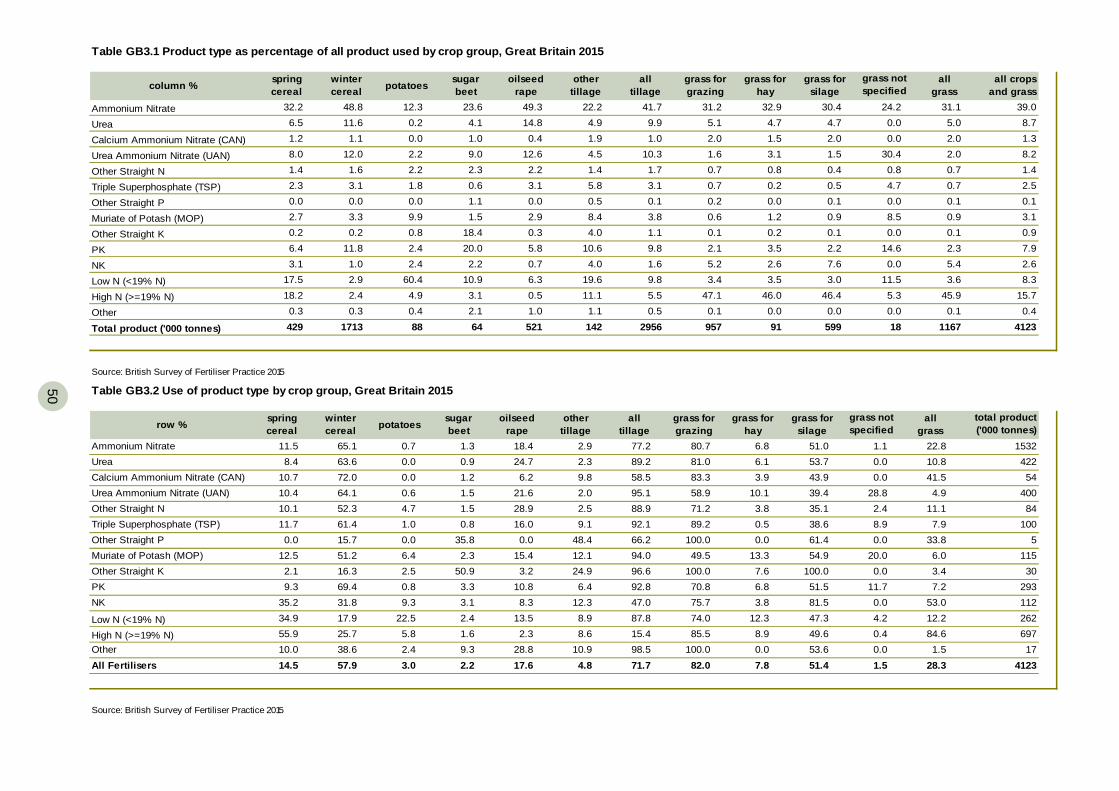
50
50
column % spring cereal
winter cereal potatoes sugar
beetoilseed
rapeother
tillagegrass for grazing
grass for hay
grass for silage
grass not specified
all grass
all crops and grass
Ammonium Nitrate 32.2 48.8 12.3 23.6 49.3 22.2 41.7 31.2 32.9 30.4 24.2 31.1 39.0
Urea 6.5 11.6 0.2 4.1 14.8 4.9 9.9 5.1 4.7 4.7 0.0 5.0 8.7
Calcium Ammonium Nitrate (CAN) 1.2 1.1 0.0 1.0 0.4 1.9 1.0 2.0 1.5 2.0 0.0 2.0 1.3
Urea Ammonium Nitrate (UAN) 8.0 12.0 2.2 9.0 12.6 4.5 10.3 1.6 3.1 1.5 30.4 2.0 8.2
Other Straight N 1.4 1.6 2.2 2.3 2.2 1.4 1.7 0.7 0.8 0.4 0.8 0.7 1.4
Triple Superphosphate (TSP) 2.3 3.1 1.8 0.6 3.1 5.8 3.1 0.7 0.2 0.5 4.7 0.7 2.5
Other Straight P 0.0 0.0 0.0 1.1 0.0 0.5 0.1 0.2 0.0 0.1 0.0 0.1 0.1
Muriate of Potash (MOP) 2.7 3.3 9.9 1.5 2.9 8.4 3.8 0.6 1.2 0.9 8.5 0.9 3.1
Other Straight K 0.2 0.2 0.8 18.4 0.3 4.0 1.1 0.1 0.2 0.1 0.0 0.1 0.9
PK 6.4 11.8 2.4 20.0 5.8 10.6 9.8 2.1 3.5 2.2 14.6 2.3 7.9
NK 3.1 1.0 2.4 2.2 0.7 4.0 1.6 5.2 2.6 7.6 0.0 5.4 2.6
Low N (<19% N) 17.5 2.9 60.4 10.9 6.3 19.6 9.8 3.4 3.5 3.0 11.5 3.6 8.3
High N (>=19% N) 18.2 2.4 4.9 3.1 0.5 11.1 5.5 47.1 46.0 46.4 5.3 45.9 15.7
Other 0.3 0.3 0.4 2.1 1.0 1.1 0.5 0.1 0.0 0.0 0.0 0.1 0.4
Total product ('000 tonnes) 429 1713 88 64 521 142 2956 957 91 599 18 1167 4123
all tillage
Table GB3.1 Product type as percentage of all product used by crop group, Great Britain 2015
Source: British Survey of Fertiliser Practice 2015
row % spring cereal
winter cereal potatoes sugar
beetoilseed
rapeother
tillagegrass for grazing
grass for hay
grass for silage
grass not specified
all grass
total product('000 tonnes)
Ammonium Nitrate 11.5 65.1 0.7 1.3 18.4 2.9 77.2 80.7 6.8 51.0 1.1 22.8 1532Urea 8.4 63.6 0.0 0.9 24.7 2.3 89.2 81.0 6.1 53.7 0.0 10.8 422Calcium Ammonium Nitrate (CAN) 10.7 72.0 0.0 1.2 6.2 9.8 58.5 83.3 3.9 43.9 0.0 41.5 54Urea Ammonium Nitrate (UAN) 10.4 64.1 0.6 1.5 21.6 2.0 95.1 58.9 10.1 39.4 28.8 4.9 400Other Straight N 10.1 52.3 4.7 1.5 28.9 2.5 88.9 71.2 3.8 35.1 2.4 11.1 84Triple Superphosphate (TSP) 11.7 61.4 1.0 0.8 16.0 9.1 92.1 89.2 0.5 38.6 8.9 7.9 100Other Straight P 0.0 15.7 0.0 35.8 0.0 48.4 66.2 100.0 0.0 61.4 0.0 33.8 5Muriate of Potash (MOP) 12.5 51.2 6.4 2.3 15.4 12.1 94.0 49.5 13.3 54.9 20.0 6.0 115Other Straight K 2.1 16.3 2.5 50.9 3.2 24.9 96.6 100.0 7.6 100.0 0.0 3.4 30PK 9.3 69.4 0.8 3.3 10.8 6.4 92.8 70.8 6.8 51.5 11.7 7.2 293NK 35.2 31.8 9.3 3.1 8.3 12.3 47.0 75.7 3.8 81.5 0.0 53.0 112
Low N (<19% N) 34.9 17.9 22.5 2.4 13.5 8.9 87.8 74.0 12.3 47.3 4.2 12.2 262
High N (>=19% N) 55.9 25.7 5.8 1.6 2.3 8.6 15.4 85.5 8.9 49.6 0.4 84.6 697Other 10.0 38.6 2.4 9.3 28.8 10.9 98.5 100.0 0.0 53.6 0.0 1.5 17All Fertilisers 14.5 57.9 3.0 2.2 17.6 4.8 71.7 82.0 7.8 51.4 1.5 28.3 4123
Table GB3.2 Use of product type by crop group, Great Britain 2015
all tillage
Source: British Survey of Fertiliser Practice 2015
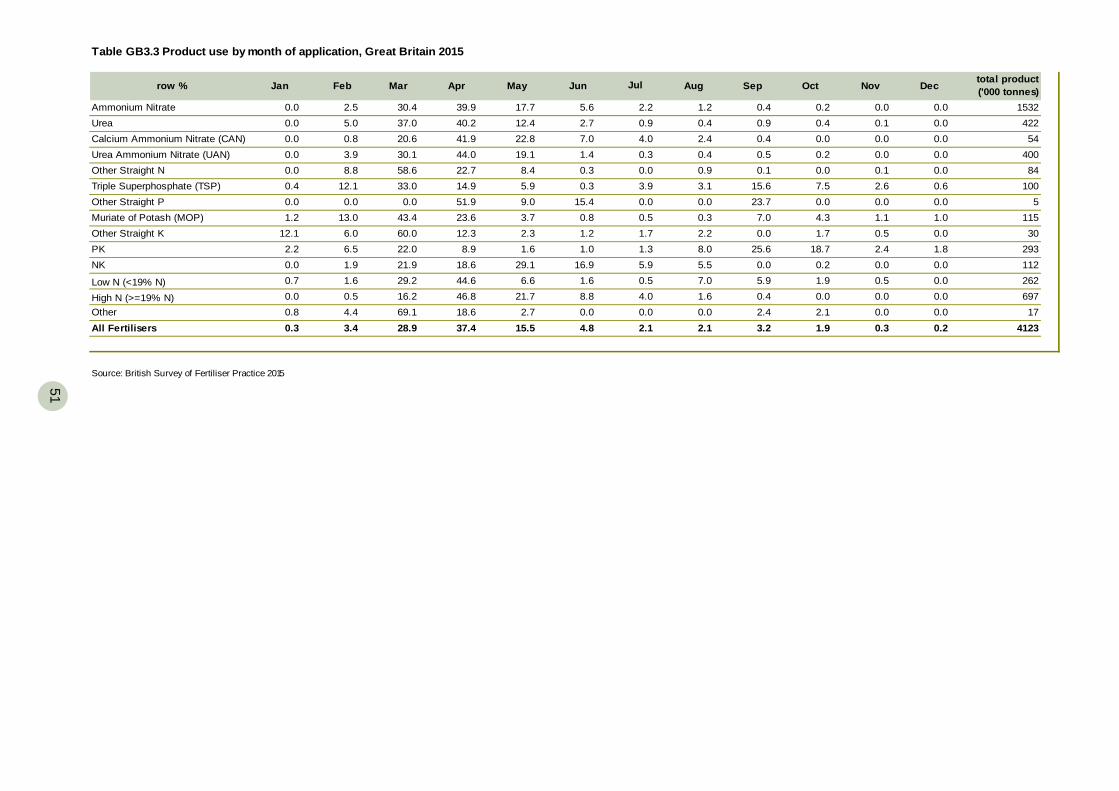
51
row % Jan Feb Mar Apr May Jun Aug Sep Oct Nov Dec total product('000 tonnes)
Ammonium Nitrate 0.0 2.5 30.4 39.9 17.7 5.6 2.2 1.2 0.4 0.2 0.0 0.0 1532Urea 0.0 5.0 37.0 40.2 12.4 2.7 0.9 0.4 0.9 0.4 0.1 0.0 422Calcium Ammonium Nitrate (CAN) 0.0 0.8 20.6 41.9 22.8 7.0 4.0 2.4 0.4 0.0 0.0 0.0 54Urea Ammonium Nitrate (UAN) 0.0 3.9 30.1 44.0 19.1 1.4 0.3 0.4 0.5 0.2 0.0 0.0 400Other Straight N 0.0 8.8 58.6 22.7 8.4 0.3 0.0 0.9 0.1 0.0 0.1 0.0 84Triple Superphosphate (TSP) 0.4 12.1 33.0 14.9 5.9 0.3 3.9 3.1 15.6 7.5 2.6 0.6 100Other Straight P 0.0 0.0 0.0 51.9 9.0 15.4 0.0 0.0 23.7 0.0 0.0 0.0 5Muriate of Potash (MOP) 1.2 13.0 43.4 23.6 3.7 0.8 0.5 0.3 7.0 4.3 1.1 1.0 115Other Straight K 12.1 6.0 60.0 12.3 2.3 1.2 1.7 2.2 0.0 1.7 0.5 0.0 30PK 2.2 6.5 22.0 8.9 1.6 1.0 1.3 8.0 25.6 18.7 2.4 1.8 293NK 0.0 1.9 21.9 18.6 29.1 16.9 5.9 5.5 0.0 0.2 0.0 0.0 112
Low N (<19% N) 0.7 1.6 29.2 44.6 6.6 1.6 0.5 7.0 5.9 1.9 0.5 0.0 262
High N (>=19% N) 0.0 0.5 16.2 46.8 21.7 8.8 4.0 1.6 0.4 0.0 0.0 0.0 697Other 0.8 4.4 69.1 18.6 2.7 0.0 0.0 0.0 2.4 2.1 0.0 0.0 17All Fertilisers 0.3 3.4 28.9 37.4 15.5 4.8 2.1 2.1 3.2 1.9 0.3 0.2 4123
Table GB3.3 Product use by month of application, Great Britain 2015
Jul
Source: British Survey of Fertiliser Practice 2015
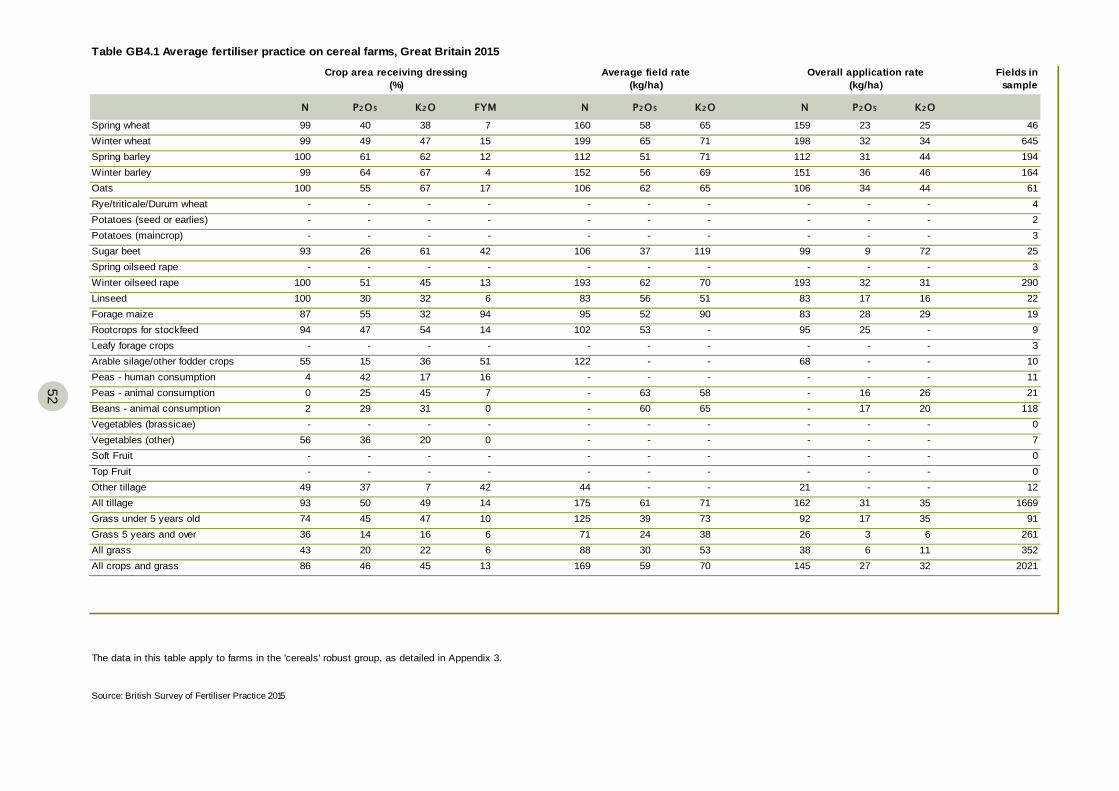
52
52
Fields in sample
N P2O5 K2O FYM N P2O5 K2O N P2O5 K2O
Spring wheat 99 40 38 7 160 65 159 23 25 46Winter wheat 99 49 47 15 199 71 198 32 34 645Spring barley 100 61 62 12 112 71 112 31 44 194Winter barley 99 64 67 4 152 69 151 36 46 164Oats 100 55 67 17 106 65 106 34 44 61Rye/triticale/Durum wheat - - - - - - - - - 4Potatoes (seed or earlies) - - - - - - - - - 2Potatoes (maincrop) - - - - - - - - - 3Sugar beet 93 26 61 42 106 119 99 9 72 25Spring oilseed rape - - - - - - - - - 3Winter oilseed rape 100 51 45 13 193 70 193 32 31 290Linseed 100 30 32 6 83 51 83 17 16 22Forage maize 87 55 32 94 95 90 83 28 29 19Rootcrops for stockfeed 94 47 54 14 102 - 95 25 - 9Leafy forage crops - - - - - - - - - 3Arable silage/other fodder crops 55 15 36 51 122 - 68 - - 10Peas - human consumption 4 42 17 16 - - - - - 11Peas - animal consumption 0 25 45 7 - 58 - 16 26 21Beans - animal consumption 2 29 31 0 - 65 - 17 20 118Vegetables (brassicae) - - - - - - - - - 0Vegetables (other) 56 36 20 0 - - - - - 7Soft Fruit - - - - - - - - - 0Top Fruit - - - - - - - - - 0Other tillage 49 37 7 42 44 - 21 - - 12All tillage 93 50 49 14 175 71 162 31 35 1669Grass under 5 years old 74 45 47 10 125 73 92 17 35 91Grass 5 years and over 36 14 16 6 71 38 26 3 6 261All grass 43 20 22 6 88 53 38 6 11 352All crops and grass 86 46 45 13 169 70 145 27 32 2021
The data in this table apply to farms in the 'cereals' robust group, as detailed in Appendix 3.
Source: British Survey of Fertiliser Practice 2015
3059
-613924
----
--
6360
565253
-
-37
-62
5662
--
Overall application rate(kg/ha)
586551
Table GB4.1 Average fertiliser practice on cereal farms, Great Britain 2015
Crop area receiving dressing(%)
Average field rate(kg/ha)
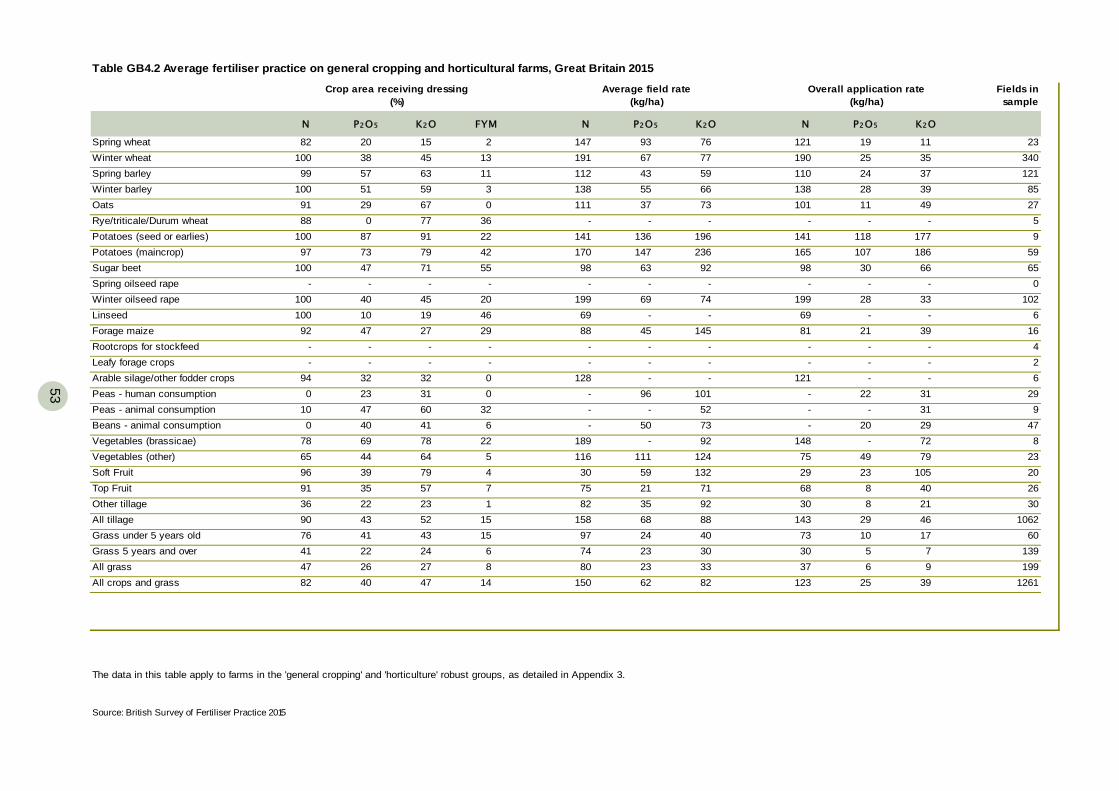
53
Table GB4.2 Average fertiliser practice on general cropping and horticultural farms, Great Britain 2015
Fields in sample
N P2O5 K2O FYM N P2O5 K2O N P2O5 K2O
Spring wheat 82 20 15 2 147 76 121 19 11 23Winter wheat 100 38 45 13 191 77 190 25 35 340Spring barley 99 57 63 11 112 59 110 24 37 121Winter barley 100 51 59 3 138 66 138 28 39 85Oats 91 29 67 0 111 73 101 11 49 27Rye/triticale/Durum wheat 88 0 77 36 - - - - - 5Potatoes (seed or earlies) 100 87 91 22 141 196 141 118 177 9Potatoes (maincrop) 97 73 79 42 170 236 165 107 186 59Sugar beet 100 47 71 55 98 92 98 30 66 65Spring oilseed rape - - - - - - - - - 0Winter oilseed rape 100 40 45 20 199 74 199 28 33 102Linseed 100 10 19 46 69 - 69 - - 6Forage maize 92 47 27 29 88 145 81 21 39 16Rootcrops for stockfeed - - - - - - - - - 4Leafy forage crops - - - - - - - - - 2Arable silage/other fodder crops 94 32 32 0 128 - 121 - - 6Peas - human consumption 0 23 31 0 - 101 - 22 31 29Peas - animal consumption 10 47 60 32 - 52 - - 31 9Beans - animal consumption 0 40 41 6 - 73 - 20 29 47Vegetables (brassicae) 78 69 78 22 189 92 148 - 72 8Vegetables (other) 65 44 64 5 116 124 75 49 79 23Soft Fruit 96 39 79 4 30 132 29 23 105 20Top Fruit 91 35 57 7 75 71 68 8 40 26Other tillage 36 22 23 1 82 92 30 8 21 30All tillage 90 43 52 15 158 88 143 29 46 1062Grass under 5 years old 76 41 43 15 97 40 73 10 17 60Grass 5 years and over 41 22 24 6 74 30 30 5 7 139All grass 47 26 27 8 80 33 37 6 9 199All crops and grass 82 40 47 14 150 82 123 25 39 1261
The data in this table apply to farms in the 'general cropping' and 'horticulture' robust groups, as detailed in Appendix 3.
35682423
Source: British Survey of Fertiliser Practice 2015
2362
-1115921
-96
-50
-45
--
14763
-69
-136
936743
Crop area receiving dressing(%)
Average field rate(kg/ha)
Overall application rate(kg/ha)
5537
54
54
Fields in sample
N P2O5 K2O FYM N P2O5 K2O N P2O5 K2O
Spring wheat 70 38 42 82 92 34 65 12 14 14Winter wheat 91 30 31 63 189 73 172 18 23 83Spring barley 93 65 71 76 83 43 77 26 31 60Winter barley 100 36 51 47 130 73 130 17 38 35Oats 55 32 32 65 91 - 50 - - 14Rye/triticale/Durum wheat - - - - - - - - - 1Potatoes (seed or earlies) - - - - - - - - - 4Potatoes (maincrop) - - - - - - - - - 2Sugar beet - - - - - - - - - 2Spring oilseed rape - - - - - - - - - 0Winter oilseed rape 100 58 45 35 206 - 206 - - 8Linseed - - - - - - - - - 1Forage maize 85 63 23 97 67 55 57 27 13 98Rootcrops for stockfeed 91 19 19 93 - - - - - 5Leafy forage crops 87 57 57 76 63 28 55 7 16 8Arable silage/other fodder crops 44 21 13 79 111 35 49 11 5 50Peas - human consumption - - - - - - - - - 0Peas - animal consumption - - - - - - - - - 1Beans - animal consumption 0 25 25 33 - - - - - 8Vegetables (brassicae) - - - - - - - - - 2Vegetables (other) - - - - - - - - - 3Soft Fruit - - - - - - - - - 0Top Fruit - - - - - - - - - 0Other tillage - - - - - - - - - 1All tillage 83 47 38 73 118 59 98 22 22 400Grass under 5 years old 91 44 52 85 159 55 144 13 28 232Grass 5 years and over 85 49 53 61 132 33 113 11 17 371All grass 87 47 53 68 140 39 122 11 20 603All crops and grass 86 47 49 69 136 42 117 14 21 1003
The data in this table apply to farms in the 'dairy' robust group, as detailed in Appendix 3.
31
Table GB4.3 Average fertiliser practice on dairy farms, Great Britain 2015
Crop area receiving dressing(%)
Average field rate(kg/ha)
Overall application rate(kg/ha)
43
604047
--------
48
-1353
--------
2922
Source: British Survey of Fertiliser Practice 2015
2429
55
Fields in sample
N P2O5 K2O FYM N P2O5 K2O N P2O5 K2O
Spring wheat 45 31 34 71 60 28 27 8 10 14Winter wheat 81 37 38 46 158 66 128 19 25 58Spring barley 95 82 83 56 89 52 84 38 44 133Winter barley 88 53 53 56 142 58 124 25 31 55Oats 80 68 63 50 93 61 74 34 38 34Rye/triticale/Durum wheat - - - - - - - - - 0Potatoes (seed or earlies) - - - - - - - - - 0Potatoes (maincrop) - - - - - - - - - 1Sugar beet - - - - - - - - - 0Spring oilseed rape - - - - - - - - - 0Winter oilseed rape - - - - - - - - - 3Linseed - - - - - - - - - 0Forage maize 86 73 26 98 55 47 47 28 12 33Rootcrops for stockfeed 67 65 65 47 62 56 41 33 36 30Leafy forage crops 69 67 67 44 80 49 55 24 33 24Arable silage/other fodder crops 63 50 54 62 91 43 57 20 23 21Peas - human consumption - - - - - - - - - 0Peas - animal consumption - - - - - - - - - 0Beans - animal consumption 0 45 45 45 - - - - - 8Vegetables (brassicae) - - - - - - - - - 0Vegetables (other) - - - - - - - - - 1Soft Fruit - - - - - - - - - 0Top Fruit - - - - - - - - - 0Other tillage - - - - - - - - - 1All tillage 83 64 60 58 104 54 86 29 32 416Grass under 5 years old 85 67 67 52 97 34 82 18 23 363Grass 5 years and over 51 40 39 30 67 22 34 8 8 1255All grass 54 43 41 32 72 24 39 9 10 1618All crops and grass 57 44 43 34 75 27 43 10 11 2034
The data in this table apply to farms in the 'LFA grazing livestock' and 'lowland grazing livestock' robust groups, as detailed in Appendix 3.
-462719
Source: British Survey of Fertiliser Practice 2015
2023
----
40---
-385236
----
50--
245146
Table GB4.4 Average fertiliser practice on other livestock farms, Great Britain 2015
Crop area receiving dressing(%)
Average field rate(kg/ha)
Overall application rate(kg/ha)
48
56
56
Fields in sample
N P2O5 K2O FYM N P2O5 K2O N P2O5 K2O
Spring wheat 85 24 40 34 125 57 107 13 22 15Winter wheat 98 45 51 42 179 77 176 26 39 277Spring barley 97 76 80 30 110 64 107 38 51 195Winter barley 100 48 59 40 156 71 156 28 42 127Oats 87 75 76 18 113 77 98 43 58 48Rye/triticale/Durum wheat - - - - - - - - - 4Potatoes (seed or earlies) 96 96 96 23 - - - - - 5Potatoes (maincrop) 85 86 86 12 159 220 135 121 190 19Sugar beet 100 15 29 71 91 - 91 - - 6Spring oilseed rape - - - - - - - - - 0Winter oilseed rape 100 40 41 31 190 75 190 24 31 90Linseed - - - - - - - - - 4Forage maize 85 39 43 86 71 89 60 16 38 37Rootcrops for stockfeed 99 67 77 69 82 97 81 64 75 21Leafy forage crops 45 42 42 21 50 - 22 - - 8Arable silage/other fodder crops 62 33 46 63 102 56 64 20 26 18Peas - human consumption - - - - - - - - - 4Peas - animal consumption - - - - - - - - - 3Beans - animal consumption 4 27 26 7 - 66 - 14 17 41Vegetables (brassicae) - - - - - - - - - 0Vegetables (other) 90 20 90 5 - - - - - 6Soft Fruit - - - - - - - - - 0Top Fruit - - - - - - - - - 1Other tillage 1 0 0 27 - - - - - 9All tillage 93 53 58 36 150 77 140 31 45 938Grass under 5 years old 83 59 60 34 117 44 96 16 27 206Grass 5 years and over 59 39 39 8 82 28 48 8 11 332All grass 66 45 45 15 94 34 62 10 15 538All crops and grass 80 49 52 27 129 60 103 21 31 1476
The data in this table apply to farms in the 'mixed' robust group, as detailed in Appendix 3.
Source: British Survey of Fertiliser Practice 2015
2343
-592820
----
61--
53
-4296
-
141--
61
5758
--
Overall application rate(kg/ha)
535950
Table GB4.5 Average fertiliser practice on mixed farms, Great Britain 2015
Crop area receiving dressing(%)
Average field rate(kg/ha)

57
Fields in sample
N P2O5 K2O FYM N P2O5 K2O N P2O5 K2O
Spring wheat 91 32 31 16 146 59 133 19 18 104 Winter wheat 98 42 43 21 193 72 190 27 31 1312 Spring barley 97 46 50 23 109 60 106 21 30 452 Winter barley 99 50 57 19 146 67 144 26 38 417 Oats 91 49 59 22 105 68 96 27 40 141 Rye/triticale/Durum wheat 68 8 34 28 100 82 68 - 28 14 Potatoes (seed or earlies) 100 76 100 39 174 244 174 135 244 11 Potatoes (maincrop) 95 77 83 46 162 224 153 110 185 74 Sugar beet 98 39 64 54 100 98 98 23 63 99 Spring oilseed rape - - - - - - - - - 3 Winter oilseed rape 100 45 42 18 192 70 192 28 29 465 Linseed 100 27 30 12 81 54 81 15 16 33 Forage maize 86 59 27 89 71 75 61 25 21 204 Rootcrops for stockfeed 80 47 57 47 83 74 66 22 42 50 Leafy forage crops 47 36 36 72 62 31 29 9 11 24 Arable silage/other fodder crops 48 21 25 61 111 67 53 11 17 89 Vining peas (for human consumption) 1 28 26 5 - 100 - 22 26 37 Field peas (harvested dry) 3 30 47 13 - 56 - 13 26 34 Field beans (harvested dry) 2 31 31 5 - 66 - 18 20 215 Vegetables (brassicae) 83 76 83 17 146 82 122 61 68 10 Vegetable Other 63 35 58 6 119 132 75 36 76 39 Soft Fruit 96 27 75 5 46 128 44 21 96 14 Top Fruit 90 33 58 7 74 75 67 7 44 27 Other tillage 33 23 13 18 62 88 21 9 11 52 All tillage 90 43 45 23 165 75 149 26 33 3920 Grass less than five years old 83 45 49 54 121 47 100 12 23 707 Grass five years and over 51 33 33 31 87 27 44 7 9 1972 All grass 56 35 35 35 94 31 53 8 11 2679 All crops and grass 73 39 40 29 138 56 100 17 22 6599
Source: British Survey of Fertiliser Practice 2015
2243
41602821
801048022
53804457
57434624
14459
-62
5254
-177
Overall application rate(kg/ha)
596345
Table EW1.1 Total fertiliser use, England & Wales 2015
Crop area receiving dressing(%)
Average field rate(kg/ha)
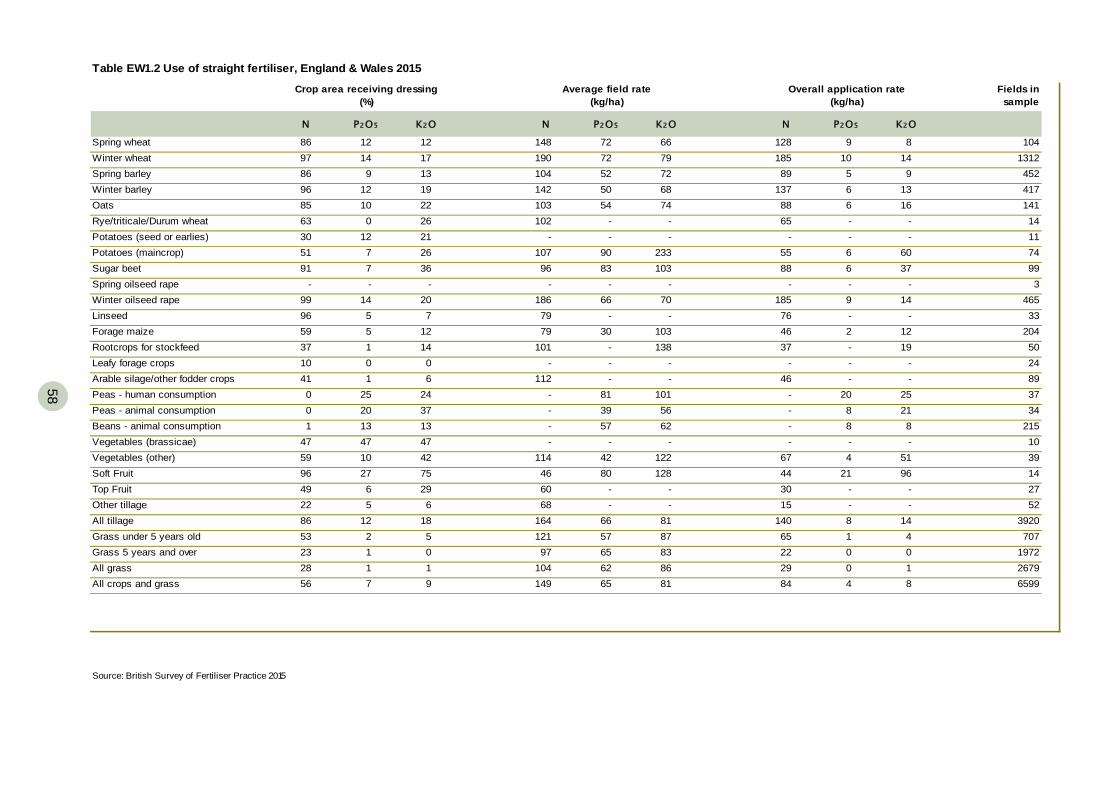
58
58
Fields in sample
N P2O5 K2O N P2O5 K2O N P2O5 K2O
Spring wheat 86 12 12 148 66 128 9 8 104Winter wheat 97 14 17 190 79 185 10 14 1312Spring barley 86 9 13 104 72 89 5 9 452Winter barley 96 12 19 142 68 137 6 13 417Oats 85 10 22 103 74 88 6 16 141Rye/triticale/Durum wheat 63 0 26 102 - 65 - - 14Potatoes (seed or earlies) 30 12 21 - - - - - 11Potatoes (maincrop) 51 7 26 107 233 55 6 60 74Sugar beet 91 7 36 96 103 88 6 37 99Spring oilseed rape - - - - - - - - 3Winter oilseed rape 99 14 20 186 70 185 9 14 465Linseed 96 5 7 79 - 76 - - 33Forage maize 59 5 12 79 103 46 2 12 204Rootcrops for stockfeed 37 1 14 101 138 37 - 19 50Leafy forage crops 10 0 0 - - - - - 24Arable silage/other fodder crops 41 1 6 112 - 46 - - 89Peas - human consumption 0 25 24 - 101 - 20 25 37Peas - animal consumption 0 20 37 - 56 - 8 21 34Beans - animal consumption 1 13 13 - 62 - 8 8 215Vegetables (brassicae) 47 47 47 - - - - - 10Vegetables (other) 59 10 42 114 122 67 4 51 39Soft Fruit 96 27 75 46 128 44 21 96 14Top Fruit 49 6 29 60 - 30 - - 27Other tillage 22 5 6 68 - 15 - - 52All tillage 86 12 18 164 81 140 8 14 3920Grass under 5 years old 53 2 5 121 87 65 1 4 707Grass 5 years and over 23 1 0 97 83 22 0 0 1972All grass 28 1 1 104 86 29 0 1 2679All crops and grass 56 7 9 149 81 84 4 8 6599
Source: British Survey of Fertiliser Practice 2015
6265
-665765
-4280
-
-813957
-30
--
9083
-66
5054
--
Overall application rate(kg/ha)
727252
Table EW1.2 Use of straight fertiliser, England & Wales 2015
Crop area receiving dressing(%)
Average field rate(kg/ha)
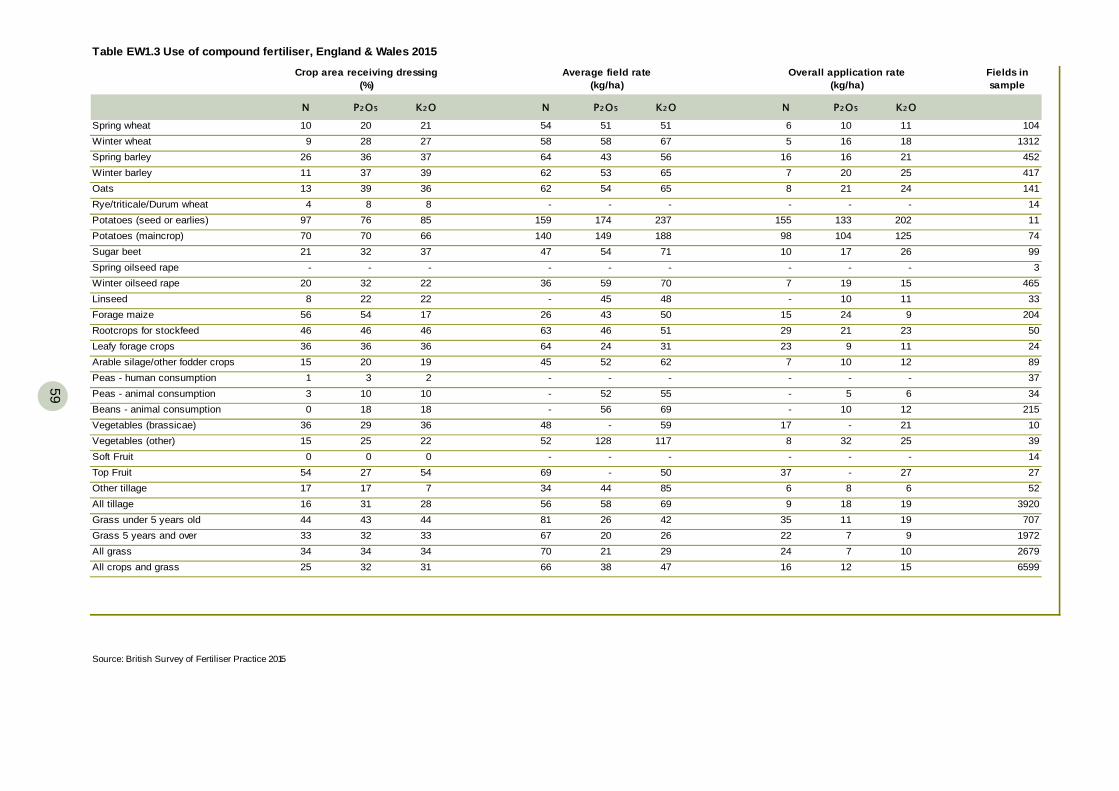
59
Fields in sample
N P2O5 K2O N P2O5 K2O N P2O5 K2O
Spring wheat 10 20 21 54 51 6 10 11 104Winter wheat 9 28 27 58 58 5 16 18 1312Spring barley 26 36 37 64 43 16 16 21 452Winter barley 11 37 39 62 53 7 20 25 417Oats 13 39 36 62 54 8 21 24 141Rye/triticale/Durum wheat 4 8 8 - - - - - 14Potatoes (seed or earlies) 97 76 85 159 174 155 133 202 11Potatoes (maincrop) 70 70 66 140 149 98 104 125 74Sugar beet 21 32 37 47 54 10 17 26 99Spring oilseed rape - - - - - - - - 3Winter oilseed rape 20 32 22 36 59 7 19 15 465Linseed 8 22 22 - 45 - 10 11 33Forage maize 56 54 17 26 43 15 24 9 204Rootcrops for stockfeed 46 46 46 63 46 29 21 23 50Leafy forage crops 36 36 36 64 24 23 9 11 24Arable silage/other fodder crops 15 20 19 45 52 7 10 12 89Peas - human consumption 1 3 2 - - - - - 37Peas - animal consumption 3 10 10 - 52 - 5 6 34Beans - animal consumption 0 18 18 - 56 - 10 12 215Vegetables (brassicae) 36 29 36 48 - 17 - 21 10Vegetables (other) 15 25 22 52 128 8 32 25 39Soft Fruit 0 0 0 - - - - - 14Top Fruit 54 27 54 69 - 37 - 27 27Other tillage 17 17 7 34 44 6 8 6 52All tillage 16 31 28 56 58 9 18 19 3920Grass under 5 years old 44 43 44 81 26 35 11 19 707Grass 5 years and over 33 32 33 67 20 22 7 9 1972All grass 34 34 34 70 21 24 7 10 2679All crops and grass 25 32 31 66 38 16 12 15 6599
Source: British Survey of Fertiliser Practice 2015
2947
85694226
59117
-50
62-
5569
48505131
18871
-70
6565
-237
Overall application rate(kg/ha)
516756
Table EW1.3 Use of compound fertiliser, England & Wales 2015
Crop area receiving dressing(%)
Average field rate(kg/ha)
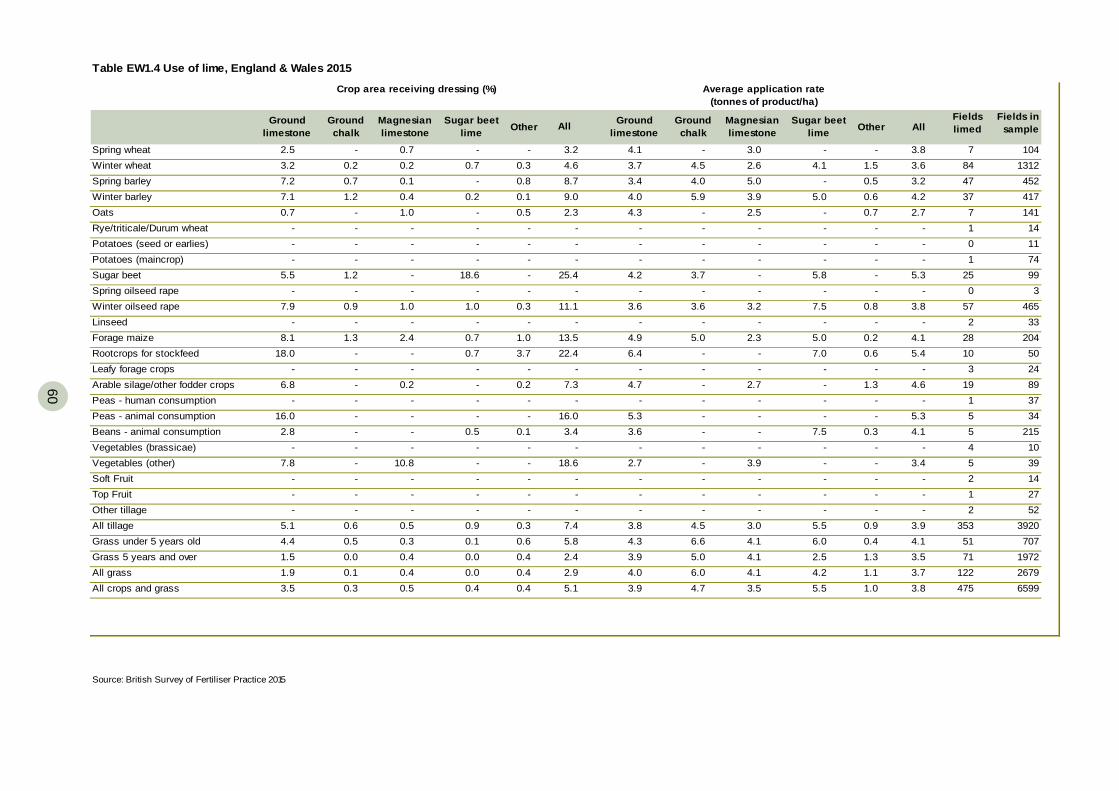
60
60
Ground limestone
Ground chalk
Magnesian limestone
Sugar beet lime Other Ground
limestoneGround chalk
Magnesian limestone
Sugar beet lime Other All
Fields limed
Fields in sample
Spring wheat 2.5 - 0.7 - - 4.1 - 3.0 - - 3.8 7 104Winter wheat 3.2 0.2 0.2 0.7 0.3 3.7 4.5 2.6 4.1 1.5 3.6 84 1312Spring barley 7.2 0.7 0.1 - 0.8 3.4 4.0 5.0 - 0.5 3.2 47 452Winter barley 7.1 1.2 0.4 0.2 0.1 4.0 5.9 3.9 5.0 0.6 4.2 37 417Oats 0.7 - 1.0 - 0.5 4.3 - 2.5 - 0.7 2.7 7 141Rye/triticale/Durum wheat - - - - - - - - - - - 1 14Potatoes (seed or earlies) - - - - - - - - - - - 0 11Potatoes (maincrop) - - - - - - - - - - - 1 74Sugar beet 5.5 1.2 - 18.6 - 4.2 3.7 - 5.8 - 5.3 25 99Spring oilseed rape - - - - - - - - - - - 0 3Winter oilseed rape 7.9 0.9 1.0 1.0 0.3 3.6 3.6 3.2 7.5 0.8 3.8 57 465Linseed - - - - - - - - - - - 2 33Forage maize 8.1 1.3 2.4 0.7 1.0 4.9 5.0 2.3 5.0 0.2 4.1 28 204Rootcrops for stockfeed 18.0 - - 0.7 3.7 6.4 - - 7.0 0.6 5.4 10 50Leafy forage crops - - - - - - - - - - - 3 24Arable silage/other fodder crops 6.8 - 0.2 - 0.2 4.7 - 2.7 - 1.3 4.6 19 89Peas - human consumption - - - - - - - - - - - 1 37Peas - animal consumption 16.0 - - - - 5.3 - - - - 5.3 5 34Beans - animal consumption 2.8 - - 0.5 0.1 3.6 - - 7.5 0.3 4.1 5 215Vegetables (brassicae) - - - - - - - - - - - 4 10Vegetables (other) 7.8 - 10.8 - - 2.7 - 3.9 - - 3.4 5 39Soft Fruit - - - - - - - - - - - 2 14Top Fruit - - - - - - - - - - - 1 27Other tillage - - - - - - - - - - - 2 52All tillage 5.1 0.6 0.5 0.9 0.3 3.8 4.5 3.0 5.5 0.9 3.9 353 3920Grass under 5 years old 4.4 0.5 0.3 0.1 0.6 4.3 6.6 4.1 6.0 0.4 4.1 51 707Grass 5 years and over 1.5 0.0 0.4 0.0 0.4 3.9 5.0 4.1 2.5 1.3 3.5 71 1972All grass 1.9 0.1 0.4 0.0 0.4 4.0 6.0 4.1 4.2 1.1 3.7 122 2679All crops and grass 3.5 0.3 0.5 0.4 0.4 3.9 4.7 3.5 5.5 1.0 3.8 475 6599
Source: British Survey of Fertiliser Practice 2015
18.6---
7.45.82.42.95.1
-
25.4-
11.1-
13.522.4
-7.3
-16.03.4
-
Table EW1.4 Use of lime, England & Wales 2015
Crop area receiving dressing (%) Average application rate (tonnes of product/ha)
All
3.24.68.79.02.3
--
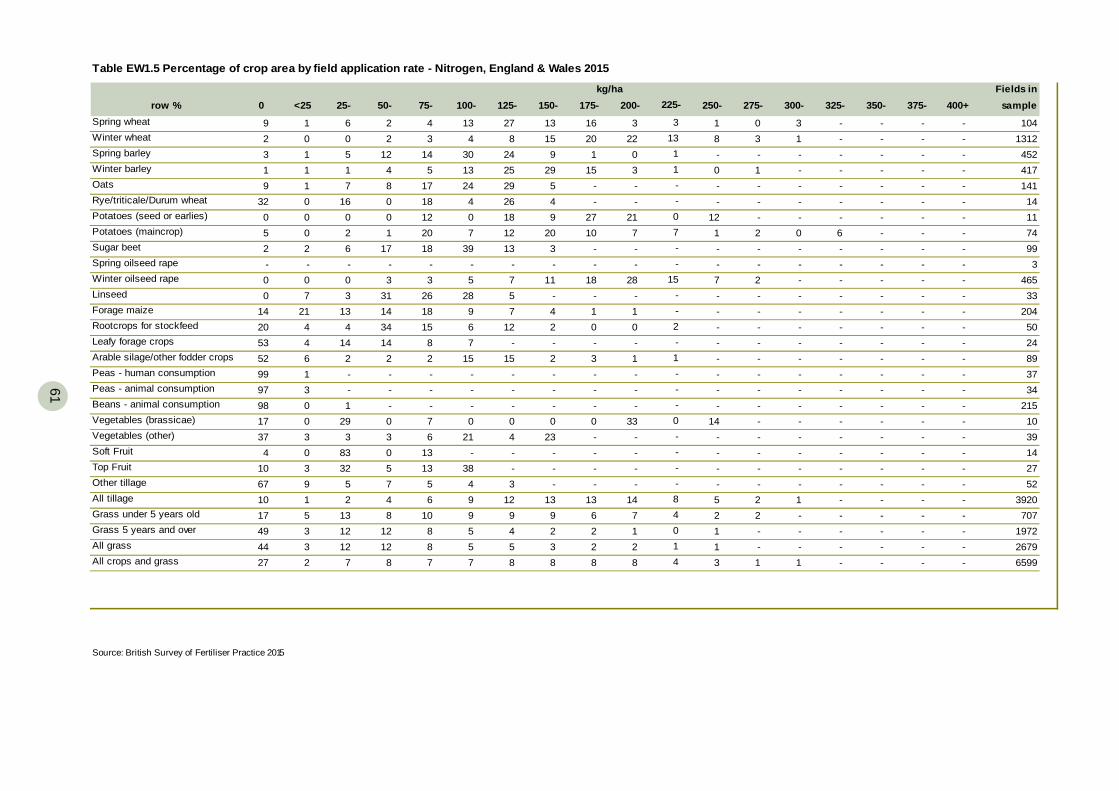
61
Fields inrow % 0 <25 25- 50- 75- 100- 125- 150- 175- 200- 250- 275- 300- 325- 350- 375- 400+ sample
Spring wheat 9 1 6 2 4 13 27 13 16 3 1 0 3 - - - - 104Winter wheat 2 0 0 2 3 4 8 15 20 22 8 3 1 - - - - 1312Spring barley 3 1 5 12 14 30 24 9 1 0 - - - - - - - 452Winter barley 1 1 1 4 5 13 25 29 15 3 0 1 - - - - - 417Oats 9 1 7 8 17 24 29 5 - - - - - - - - - 141Rye/triticale/Durum wheat 32 0 16 0 18 4 26 4 - - - - - - - - - 14Potatoes (seed or earlies) 0 0 0 0 12 0 18 9 27 21 12 - - - - - - 11Potatoes (maincrop) 5 0 2 1 20 7 12 20 10 7 1 2 0 6 - - - 74Sugar beet 2 2 6 17 18 39 13 3 - - - - - - - - - 99Spring oilseed rape - - - - - - - - - - - - - - - - - 3Winter oilseed rape 0 0 0 3 3 5 7 11 18 28 7 2 - - - - - 465Linseed 0 7 3 31 26 28 5 - - - - - - - - - - 33Forage maize 14 21 13 14 18 9 7 4 1 1 - - - - - - - 204Rootcrops for stockfeed 20 4 4 34 15 6 12 2 0 0 - - - - - - - 50Leafy forage crops 53 4 14 14 8 7 - - - - - - - - - - - 24Arable silage/other fodder crops 52 6 2 2 2 15 15 2 3 1 - - - - - - - 89Peas - human consumption 99 1 - - - - - - - - - - - - - - - 37Peas - animal consumption 97 3 - - - - - - - - - - - - - - - 34Beans - animal consumption 98 0 1 - - - - - - - - - - - - - - 215Vegetables (brassicae) 17 0 29 0 7 0 0 0 0 33 14 - - - - - - 10Vegetables (other) 37 3 3 3 6 21 4 23 - - - - - - - - - 39Soft Fruit 4 0 83 0 13 - - - - - - - - - - - - 14Top Fruit 10 3 32 5 13 38 - - - - - - - - - - - 27Other tillage 67 9 5 7 5 4 3 - - - - - - - - - - 52All tillage 10 1 2 4 6 9 12 13 13 14 5 2 1 - - - - 3920Grass under 5 years old 17 5 13 8 10 9 9 9 6 7 2 2 - - - - - 707Grass 5 years and over 49 3 12 12 8 5 4 2 2 1 1 - - - - - - 1972All grass 44 3 12 12 8 5 5 3 2 2 1 - - - - - - 2679All crops and grass 27 2 7 8 7 7 8 8 8 8 3 1 1 - - - - 6599
Table EW1.5 Percentage of crop area by field application rate - Nitrogen, England & Wales 2015
kg/ha225-
3
-07-
1311-
2-1-
-15
--
---8
--0-
Source: British Survey of Fertiliser Practice 2015
4014
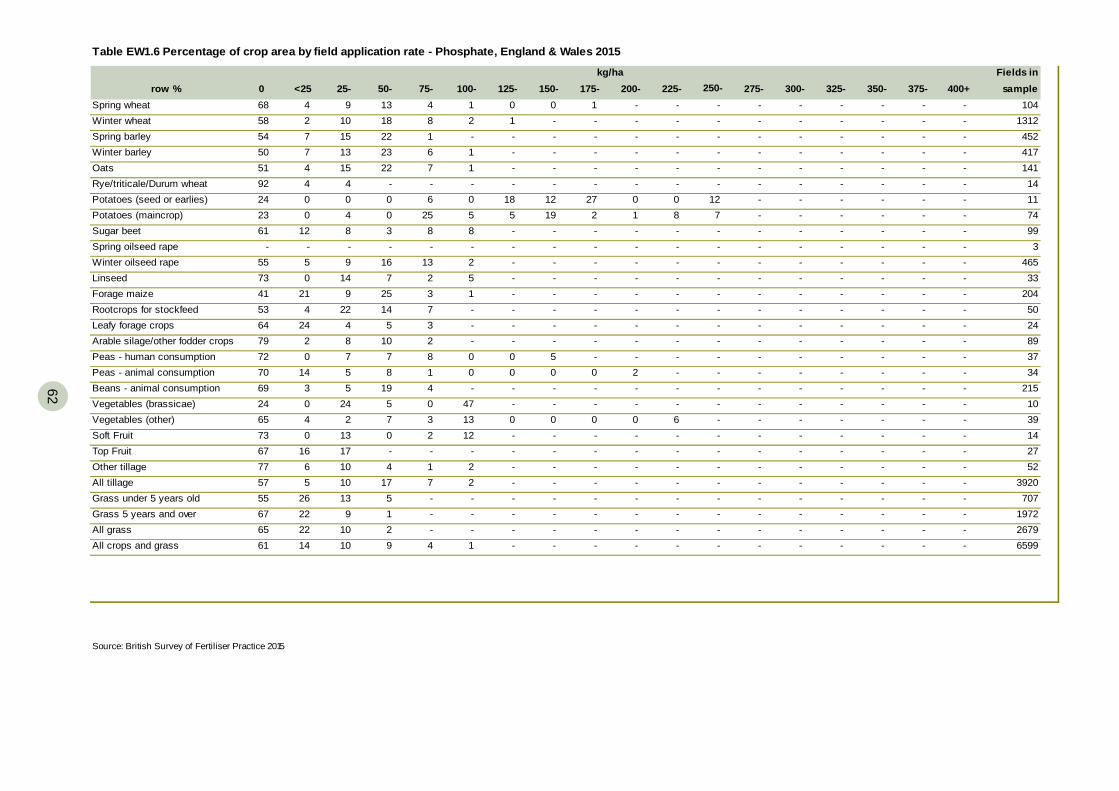
62
62
Fields inrow % 0 <25 25- 50- 75- 100- 125- 150- 175- 200- 225- 275- 300- 325- 350- 375- 400+ sample
Spring wheat 68 4 9 13 4 1 0 0 1 - - - - - - - - 104Winter wheat 58 2 10 18 8 2 1 - - - - - - - - - - 1312Spring barley 54 7 15 22 1 - - - - - - - - - - - - 452Winter barley 50 7 13 23 6 1 - - - - - - - - - - - 417Oats 51 4 15 22 7 1 - - - - - - - - - - - 141Rye/triticale/Durum wheat 92 4 4 - - - - - - - - - - - - - - 14Potatoes (seed or earlies) 24 0 0 0 6 0 18 12 27 0 0 - - - - - - 11Potatoes (maincrop) 23 0 4 0 25 5 5 19 2 1 8 - - - - - - 74Sugar beet 61 12 8 3 8 8 - - - - - - - - - - - 99Spring oilseed rape - - - - - - - - - - - - - - - - - 3Winter oilseed rape 55 5 9 16 13 2 - - - - - - - - - - - 465Linseed 73 0 14 7 2 5 - - - - - - - - - - - 33Forage maize 41 21 9 25 3 1 - - - - - - - - - - - 204Rootcrops for stockfeed 53 4 22 14 7 - - - - - - - - - - - - 50Leafy forage crops 64 24 4 5 3 - - - - - - - - - - - - 24Arable silage/other fodder crops 79 2 8 10 2 - - - - - - - - - - - - 89Peas - human consumption 72 0 7 7 8 0 0 5 - - - - - - - - - 37Peas - animal consumption 70 14 5 8 1 0 0 0 0 2 - - - - - - - 34Beans - animal consumption 69 3 5 19 4 - - - - - - - - - - - - 215Vegetables (brassicae) 24 0 24 5 0 47 - - - - - - - - - - - 10Vegetables (other) 65 4 2 7 3 13 0 0 0 0 6 - - - - - - 39Soft Fruit 73 0 13 0 2 12 - - - - - - - - - - - 14Top Fruit 67 16 17 - - - - - - - - - - - - - - 27Other tillage 77 6 10 4 1 2 - - - - - - - - - - - 52All tillage 57 5 10 17 7 2 - - - - - - - - - - - 3920Grass under 5 years old 55 26 13 5 - - - - - - - - - - - - - 707Grass 5 years and over 67 22 9 1 - - - - - - - - - - - - - 1972All grass 65 22 10 2 - - - - - - - - - - - - - 2679All crops and grass 61 14 10 9 4 1 - - - - - - - - - - - 6599
Table EW1.6 Percentage of crop area by field application rate - Phosphate, England & Wales 2015
kg/ha250-
-
-127-
----
----
----
----
----
Source: British Survey of Fertiliser Practice 2015
----
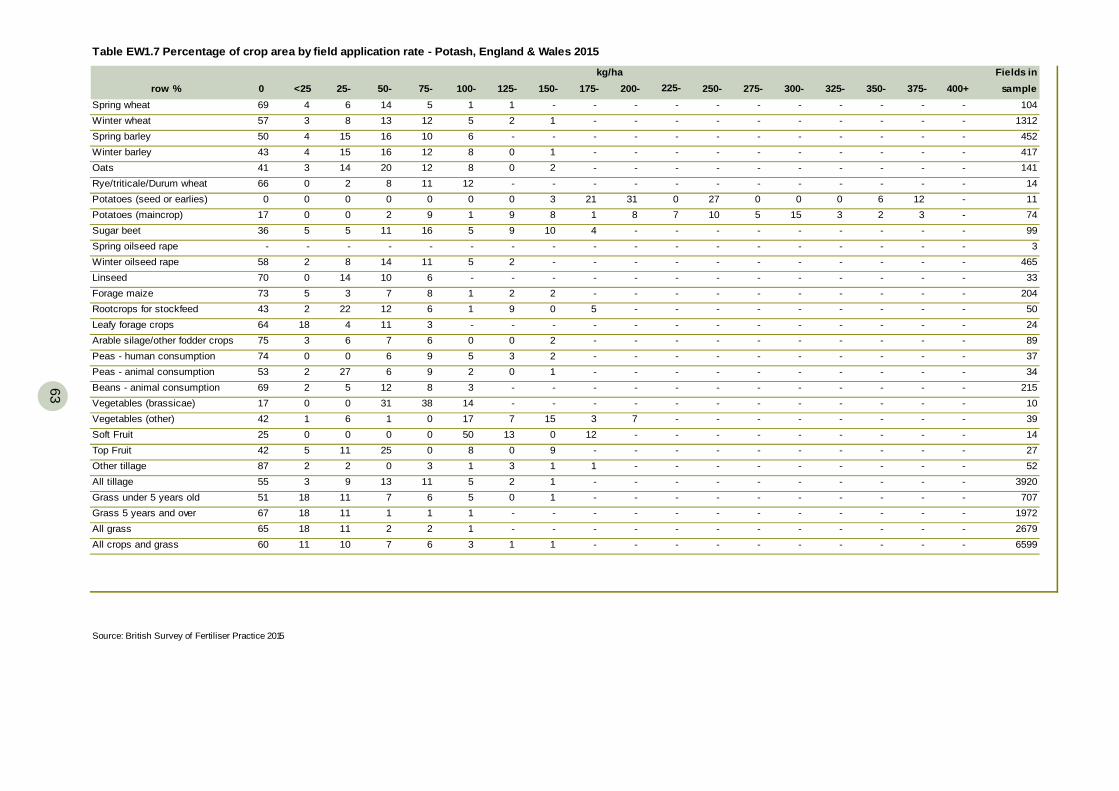
63
Fields inrow % 0 <25 25- 50- 75- 100- 125- 150- 175- 200- 250- 275- 300- 325- 350- 375- 400+ sample
Spring wheat 69 4 6 14 5 1 1 - - - - - - - - - - 104Winter wheat 57 3 8 13 12 5 2 1 - - - - - - - - - 1312Spring barley 50 4 15 16 10 6 - - - - - - - - - - - 452Winter barley 43 4 15 16 12 8 0 1 - - - - - - - - - 417Oats 41 3 14 20 12 8 0 2 - - - - - - - - - 141Rye/triticale/Durum wheat 66 0 2 8 11 12 - - - - - - - - - - - 14Potatoes (seed or earlies) 0 0 0 0 0 0 0 3 21 31 27 0 0 0 6 12 - 11Potatoes (maincrop) 17 0 0 2 9 1 9 8 1 8 10 5 15 3 2 3 - 74Sugar beet 36 5 5 11 16 5 9 10 4 - - - - - - - - 99Spring oilseed rape - - - - - - - - - - - - - - - - - 3Winter oilseed rape 58 2 8 14 11 5 2 - - - - - - - - - - 465Linseed 70 0 14 10 6 - - - - - - - - - - - - 33Forage maize 73 5 3 7 8 1 2 2 - - - - - - - - - 204Rootcrops for stockfeed 43 2 22 12 6 1 9 0 5 - - - - - - - - 50Leafy forage crops 64 18 4 11 3 - - - - - - - - - - - - 24Arable silage/other fodder crops 75 3 6 7 6 0 0 2 - - - - - - - - - 89Peas - human consumption 74 0 0 6 9 5 3 2 - - - - - - - - - 37Peas - animal consumption 53 2 27 6 9 2 0 1 - - - - - - - - - 34Beans - animal consumption 69 2 5 12 8 3 - - - - - - - - - - - 215Vegetables (brassicae) 17 0 0 31 38 14 - - - - - - - - - - - 10Vegetables (other) 42 1 6 1 0 17 7 15 3 7 - - - - - - - 39Soft Fruit 25 0 0 0 0 50 13 0 12 - - - - - - - - 14Top Fruit 42 5 11 25 0 8 0 9 - - - - - - - - - 27Other tillage 87 2 2 0 3 1 3 1 1 - - - - - - - - 52All tillage 55 3 9 13 11 5 2 1 - - - - - - - - - 3920Grass under 5 years old 51 18 11 7 6 5 0 1 - - - - - - - - - 707Grass 5 years and over 67 18 11 1 1 1 - - - - - - - - - - - 1972All grass 65 18 11 2 2 1 - - - - - - - - - - - 2679All crops and grass 60 11 10 7 6 3 1 1 - - - - - - - - - 6599
Table EW1.7 Percentage of crop area by field application rate - Potash, England & Wales 2015
kg/ha225-
-
-07-
----
----
----
----
----
Source: British Survey of Fertiliser Practice 2015
----
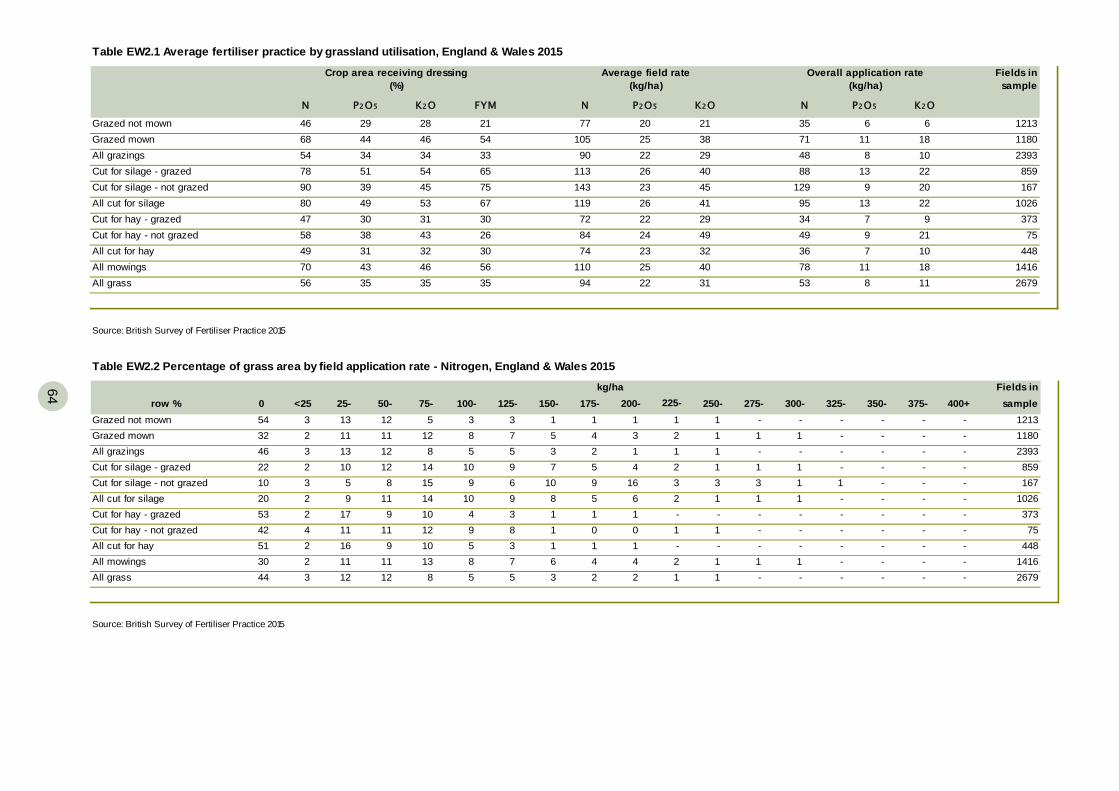
64
64
Fields in sample
N P2O5 K2O FYM N P2O5 K2O N P2O5 K2O
Grazed not mown 46 29 28 21 77 21 35 6 6 1213 Grazed mown 68 44 46 54 105 38 71 11 18 1180 All grazings 54 34 34 33 90 29 48 8 10 2393 Cut for silage - grazed 78 51 54 65 113 40 88 13 22 859 Cut for silage - not grazed 90 39 45 75 143 45 129 9 20 167 All cut for silage 80 49 53 67 119 41 95 13 22 1026 Cut for hay - grazed 47 30 31 30 72 29 34 7 9 373 Cut for hay - not grazed 58 38 43 26 84 49 49 9 21 75 All cut for hay 49 31 32 30 74 32 36 7 10 448 All mowings 70 43 46 56 110 40 78 11 18 1416 All grass 56 35 35 35 94 31 53 8 11 2679
Table EW2.1 Average fertiliser practice by grassland utilisation, England & Wales 2015
Crop area receiving dressing(%)
Average field rate(kg/ha)
Overall application rate(kg/ha)
26232622
202522
Source: British Survey of Fertiliser Practice 2015
24232522
Fields inrow % 0 <25 25- 50- 75- 100- 125- 150- 175- 200- 250- 275- 300- 325- 350- 375- 400+ sample
Grazed not mown 54 3 13 12 5 3 3 1 1 1 1 - - - - - - 1213Grazed mown 32 2 11 11 12 8 7 5 4 3 1 1 1 - - - - 1180All grazings 46 3 13 12 8 5 5 3 2 1 1 - - - - - - 2393Cut for silage - grazed 22 2 10 12 14 10 9 7 5 4 1 1 1 - - - - 859Cut for silage - not grazed 10 3 5 8 15 9 6 10 9 16 3 3 1 1 - - - 167All cut for silage 20 2 9 11 14 10 9 8 5 6 1 1 1 - - - - 1026Cut for hay - grazed 53 2 17 9 10 4 3 1 1 1 - - - - - - - 373Cut for hay - not grazed 42 4 11 11 12 9 8 1 0 0 1 - - - - - - 75All cut for hay 51 2 16 9 10 5 3 1 1 1 - - - - - - - 448All mowings 30 2 11 11 13 8 7 6 4 4 1 1 1 - - - - 1416All grass 44 3 12 12 8 5 5 3 2 2 1 - - - - - - 2679
Table EW2.2 Percentage of grass area by field application rate - Nitrogen, England & Wales 2015
kg/ha225-
1
2-1-
2123
Source: British Survey of Fertiliser Practice 2015
21
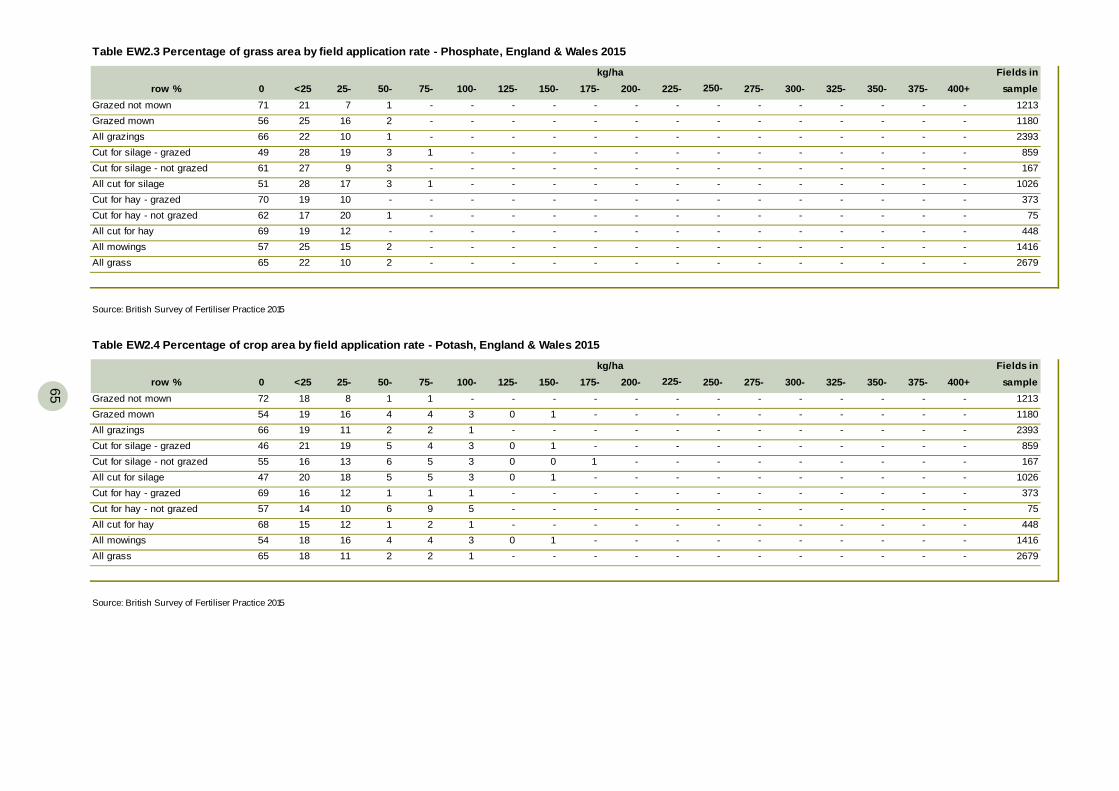
65
Fields inrow % 0 <25 25- 50- 75- 100- 125- 150- 175- 200- 225- 275- 300- 325- 350- 375- 400+ sample
Grazed not mown 71 21 7 1 - - - - - - - - - - - - - 1213Grazed mown 56 25 16 2 - - - - - - - - - - - - - 1180All grazings 66 22 10 1 - - - - - - - - - - - - - 2393Cut for silage - grazed 49 28 19 3 1 - - - - - - - - - - - - 859Cut for silage - not grazed 61 27 9 3 - - - - - - - - - - - - - 167All cut for silage 51 28 17 3 1 - - - - - - - - - - - - 1026Cut for hay - grazed 70 19 10 - - - - - - - - - - - - - - 373Cut for hay - not grazed 62 17 20 1 - - - - - - - - - - - - - 75All cut for hay 69 19 12 - - - - - - - - - - - - - - 448All mowings 57 25 15 2 - - - - - - - - - - - - - 1416All grass 65 22 10 2 - - - - - - - - - - - - - 2679
Table EW2.3 Percentage of grass area by field application rate - Phosphate, England & Wales 2015
kg/ha250-
-
----
----
Source: British Survey of Fertiliser Practice 2015
--
Fields inrow % 0 <25 25- 50- 75- 100- 125- 150- 175- 200- 250- 275- 300- 325- 350- 375- 400+ sample
Grazed not mown 72 18 8 1 1 - - - - - - - - - - - - 1213 Grazed mown 54 19 16 4 4 3 0 1 - - - - - - - - - 1180 All grazings 66 19 11 2 2 1 - - - - - - - - - - - 2393 Cut for silage - grazed 46 21 19 5 4 3 0 1 - - - - - - - - - 859 Cut for silage - not grazed 55 16 13 6 5 3 0 0 1 - - - - - - - - 167 All cut for silage 47 20 18 5 5 3 0 1 - - - - - - - - - 1026 Cut for hay - grazed 69 16 12 1 1 1 - - - - - - - - - - - 373 Cut for hay - not grazed 57 14 10 6 9 5 - - - - - - - - - - - 75 All cut for hay 68 15 12 1 2 1 - - - - - - - - - - - 448 All mowings 54 18 16 4 4 3 0 1 - - - - - - - - - 1416 All grass 65 18 11 2 2 1 - - - - - - - - - - - 2679
Table EW2.4 Percentage of crop area by field application rate - Potash, England & Wales 2015
kg/ha225-
-
----
----
Source: British Survey of Fertiliser Practice 2015
--
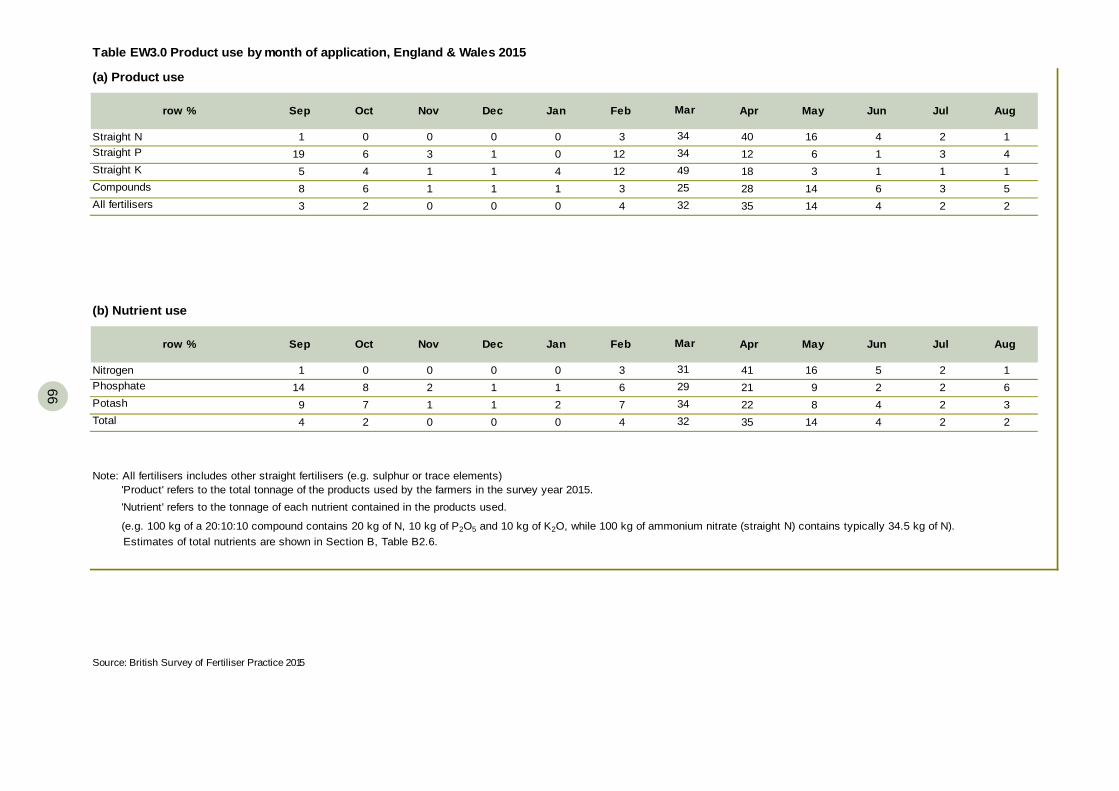
66
66
(a) Product use
row % Sep Oct Nov Dec Jan Feb Apr May Jun Jul Aug
Straight N 1 0 0 0 0 3 40 16 4 2 1Straight P 19 6 3 1 0 12 12 6 1 3 4Straight K 5 4 1 1 4 12 18 3 1 1 1Compounds 8 6 1 1 1 3 28 14 6 3 5All fertilisers 3 2 0 0 0 4 35 14 4 2 2
(b) Nutrient use
row % Sep Oct Nov Dec Jan Feb Apr May Jun Jul Aug
Nitrogen 1 0 0 0 0 3 41 16 5 2 1Phosphate 14 8 2 1 1 6 21 9 2 2 6Potash 9 7 1 1 2 7 22 8 4 2 3Total 4 2 0 0 0 4 35 14 4 2 2
Note: All fertilisers includes other straight fertilisers (e.g. sulphur or trace elements)
Source: British Survey of Fertiliser Practice 2015
'Product' refers to the total tonnage of the products used by the farmers in the survey year 2015. 'Nutrient' refers to the tonnage of each nutrient contained in the products used.
(e.g. 100 kg of a 20:10:10 compound contains 20 kg of N, 10 kg of P2O5 and 10 kg of K2O, while 100 kg of ammonium nitrate (straight N) contains typically 34.5 kg of N). Estimates of total nutrients are shown in Section B, Table B2.6.
32
Table EW3.0 Product use by month of application, England & Wales 2015
Mar
3434492532
Mar
312934
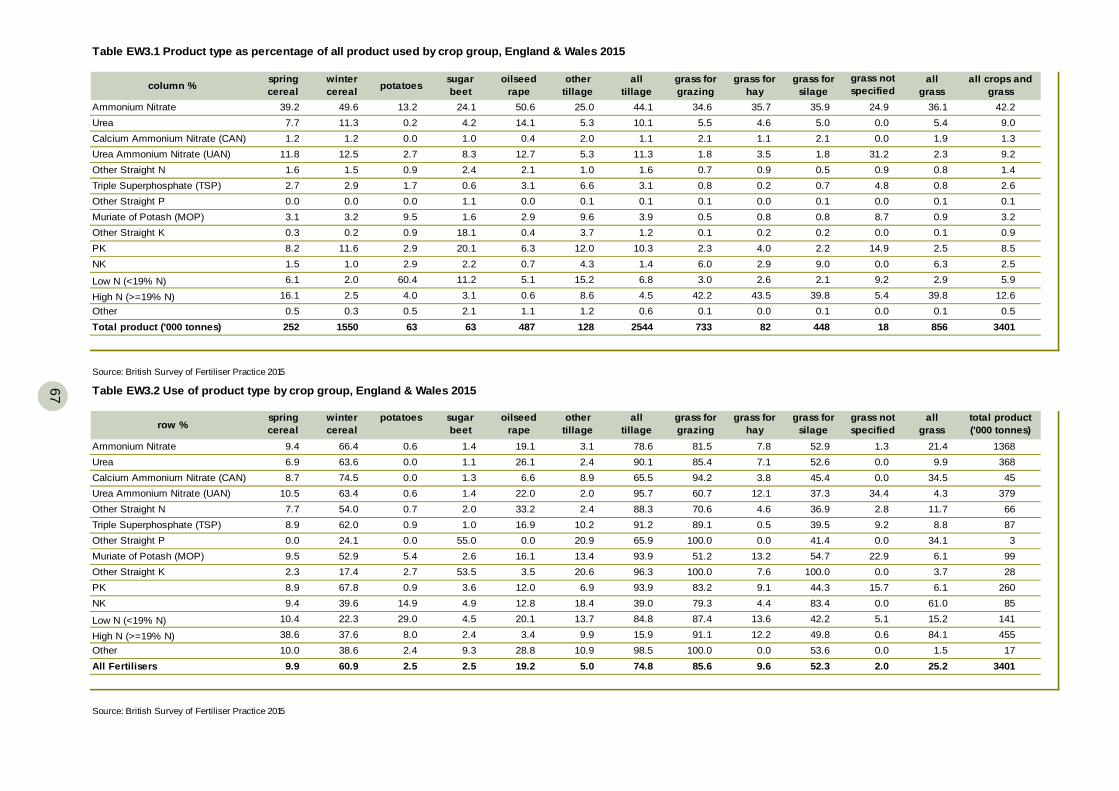
67
column % spring cereal
winter cereal potatoes sugar
beetoilseed
rapeother
tillagegrass for grazing
grass for hay
grass for silage
grass not specified
all grass
all crops and grass
Ammonium Nitrate 39.2 49.6 13.2 24.1 50.6 25.0 44.1 34.6 35.7 35.9 24.9 36.1 42.2Urea 7.7 11.3 0.2 4.2 14.1 5.3 10.1 5.5 4.6 5.0 0.0 5.4 9.0Calcium Ammonium Nitrate (CAN) 1.2 1.2 0.0 1.0 0.4 2.0 1.1 2.1 1.1 2.1 0.0 1.9 1.3Urea Ammonium Nitrate (UAN) 11.8 12.5 2.7 8.3 12.7 5.3 11.3 1.8 3.5 1.8 31.2 2.3 9.2Other Straight N 1.6 1.5 0.9 2.4 2.1 1.0 1.6 0.7 0.9 0.5 0.9 0.8 1.4Triple Superphosphate (TSP) 2.7 2.9 1.7 0.6 3.1 6.6 3.1 0.8 0.2 0.7 4.8 0.8 2.6Other Straight P 0.0 0.0 0.0 1.1 0.0 0.1 0.1 0.1 0.0 0.1 0.0 0.1 0.1Muriate of Potash (MOP) 3.1 3.2 9.5 1.6 2.9 9.6 3.9 0.5 0.8 0.8 8.7 0.9 3.2Other Straight K 0.3 0.2 0.9 18.1 0.4 3.7 1.2 0.1 0.2 0.2 0.0 0.1 0.9PK 8.2 11.6 2.9 20.1 6.3 12.0 10.3 2.3 4.0 2.2 14.9 2.5 8.5NK 1.5 1.0 2.9 2.2 0.7 4.3 1.4 6.0 2.9 9.0 0.0 6.3 2.5
Low N (<19% N) 6.1 2.0 60.4 11.2 5.1 15.2 6.8 3.0 2.6 2.1 9.2 2.9 5.9
High N (>=19% N) 16.1 2.5 4.0 3.1 0.6 8.6 4.5 42.2 43.5 39.8 5.4 39.8 12.6Other 0.5 0.3 0.5 2.1 1.1 1.2 0.6 0.1 0.0 0.1 0.0 0.1 0.5Total product ('000 tonnes) 252 1550 63 63 487 128 2544 733 82 448 18 856 3401
all tillage
Table EW3.1 Product type as percentage of all product used by crop group, England & Wales 2015
Source: British Survey of Fertiliser Practice 2015
row %spring cereal
winter cereal
potatoes sugar beet
oilseed rape
other tillage
grass for grazing
grass for hay
grass for silage
grass not specified
all grass
total product('000 tonnes)
Ammonium Nitrate 9.4 66.4 0.6 1.4 19.1 3.1 78.6 81.5 7.8 52.9 1.3 21.4 1368Urea 6.9 63.6 0.0 1.1 26.1 2.4 90.1 85.4 7.1 52.6 0.0 9.9 368Calcium Ammonium Nitrate (CAN) 8.7 74.5 0.0 1.3 6.6 8.9 65.5 94.2 3.8 45.4 0.0 34.5 45Urea Ammonium Nitrate (UAN) 10.5 63.4 0.6 1.4 22.0 2.0 95.7 60.7 12.1 37.3 34.4 4.3 379Other Straight N 7.7 54.0 0.7 2.0 33.2 2.4 88.3 70.6 4.6 36.9 2.8 11.7 66Triple Superphosphate (TSP) 8.9 62.0 0.9 1.0 16.9 10.2 91.2 89.1 0.5 39.5 9.2 8.8 87Other Straight P 0.0 24.1 0.0 55.0 0.0 20.9 65.9 100.0 0.0 41.4 0.0 34.1 3Muriate of Potash (MOP) 9.5 52.9 5.4 2.6 16.1 13.4 93.9 51.2 13.2 54.7 22.9 6.1 99Other Straight K 2.3 17.4 2.7 53.5 3.5 20.6 96.3 100.0 7.6 100.0 0.0 3.7 28PK 8.9 67.8 0.9 3.6 12.0 6.9 93.9 83.2 9.1 44.3 15.7 6.1 260NK 9.4 39.6 14.9 4.9 12.8 18.4 39.0 79.3 4.4 83.4 0.0 61.0 85
Low N (<19% N) 10.4 22.3 29.0 4.5 20.1 13.7 84.8 87.4 13.6 42.2 5.1 15.2 141
High N (>=19% N) 38.6 37.6 8.0 2.4 3.4 9.9 15.9 91.1 12.2 49.8 0.6 84.1 455Other 10.0 38.6 2.4 9.3 28.8 10.9 98.5 100.0 0.0 53.6 0.0 1.5 17All Fertilisers 9.9 60.9 2.5 2.5 19.2 5.0 74.8 85.6 9.6 52.3 2.0 25.2 3401
Table EW3.2 Use of product type by crop group, England & Wales 2015
all tillage
Source: British Survey of Fertiliser Practice 2015
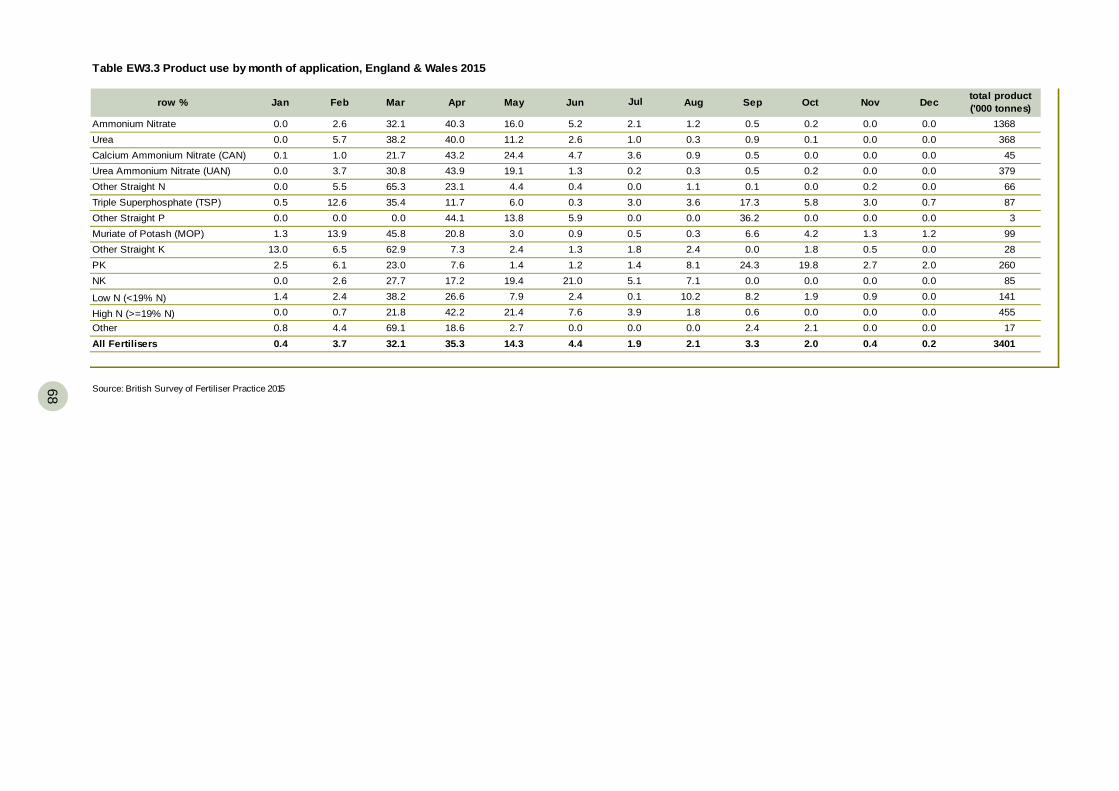
68
68
row % Jan Feb Mar Apr May Jun Aug Sep Oct Nov Dec total product('000 tonnes)
Ammonium Nitrate 0.0 2.6 32.1 40.3 16.0 5.2 2.1 1.2 0.5 0.2 0.0 0.0 1368Urea 0.0 5.7 38.2 40.0 11.2 2.6 1.0 0.3 0.9 0.1 0.0 0.0 368Calcium Ammonium Nitrate (CAN) 0.1 1.0 21.7 43.2 24.4 4.7 3.6 0.9 0.5 0.0 0.0 0.0 45Urea Ammonium Nitrate (UAN) 0.0 3.7 30.8 43.9 19.1 1.3 0.2 0.3 0.5 0.2 0.0 0.0 379Other Straight N 0.0 5.5 65.3 23.1 4.4 0.4 0.0 1.1 0.1 0.0 0.2 0.0 66Triple Superphosphate (TSP) 0.5 12.6 35.4 11.7 6.0 0.3 3.0 3.6 17.3 5.8 3.0 0.7 87Other Straight P 0.0 0.0 0.0 44.1 13.8 5.9 0.0 0.0 36.2 0.0 0.0 0.0 3Muriate of Potash (MOP) 1.3 13.9 45.8 20.8 3.0 0.9 0.5 0.3 6.6 4.2 1.3 1.2 99Other Straight K 13.0 6.5 62.9 7.3 2.4 1.3 1.8 2.4 0.0 1.8 0.5 0.0 28PK 2.5 6.1 23.0 7.6 1.4 1.2 1.4 8.1 24.3 19.8 2.7 2.0 260NK 0.0 2.6 27.7 17.2 19.4 21.0 5.1 7.1 0.0 0.0 0.0 0.0 85
Low N (<19% N) 1.4 2.4 38.2 26.6 7.9 2.4 0.1 10.2 8.2 1.9 0.9 0.0 141
High N (>=19% N) 0.0 0.7 21.8 42.2 21.4 7.6 3.9 1.8 0.6 0.0 0.0 0.0 455Other 0.8 4.4 69.1 18.6 2.7 0.0 0.0 0.0 2.4 2.1 0.0 0.0 17All Fertilisers 0.4 3.7 32.1 35.3 14.3 4.4 1.9 2.1 3.3 2.0 0.4 0.2 3401
Table EW3.3 Product use by month of application, England & Wales 2015
Jul
Source: British Survey of Fertiliser Practice 2015
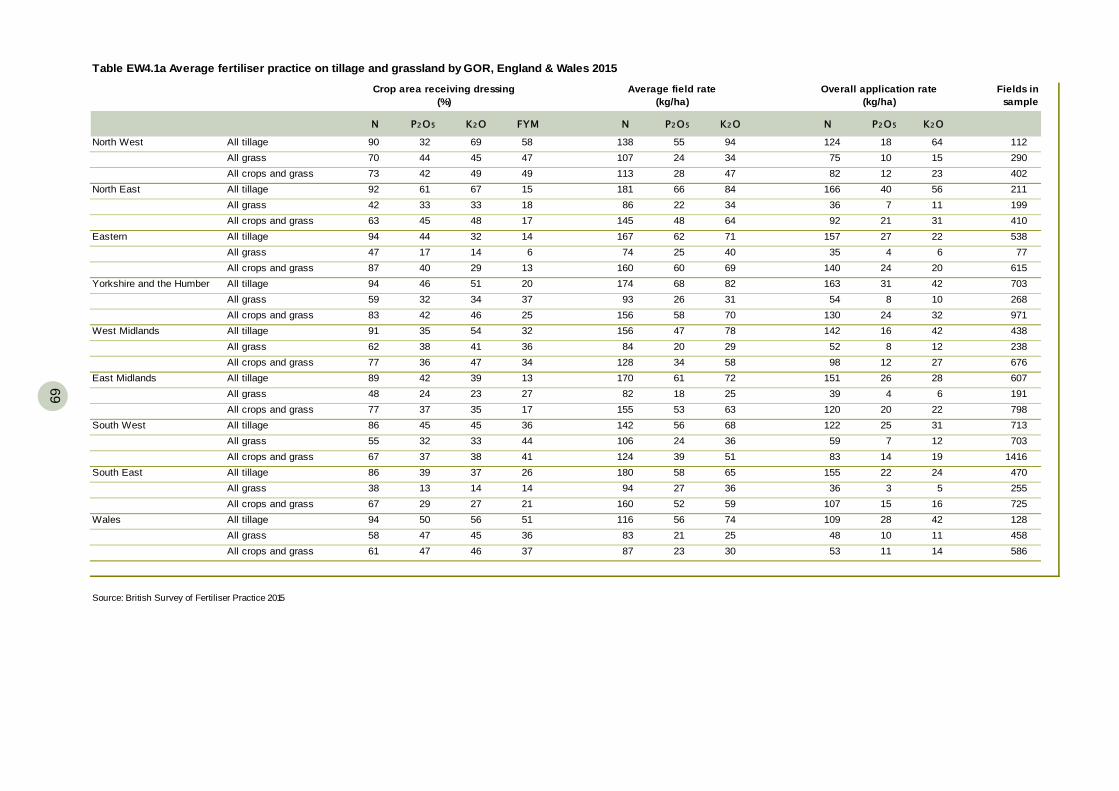
69
Fields in sample
N P2O5 K2O FYM N P2O5 K2O N P2O5 K2O
North West All tillage 90 32 69 58 138 55 94 124 18 64 112 All grass 70 44 45 47 107 24 34 75 10 15 290 All crops and grass 73 42 49 49 113 28 47 82 12 23 402
North East All tillage 92 61 67 15 181 66 84 166 40 56 211 All grass 42 33 33 18 86 22 34 36 7 11 199 All crops and grass 63 45 48 17 145 48 64 92 21 31 410
Eastern All tillage 94 44 32 14 167 62 71 157 27 22 538 All grass 47 17 14 6 74 25 40 35 4 6 77 All crops and grass 87 40 29 13 160 60 69 140 24 20 615
Yorkshire and the Humber All tillage 94 46 51 20 174 68 82 163 31 42 703 All grass 59 32 34 37 93 26 31 54 8 10 268 All crops and grass 83 42 46 25 156 58 70 130 24 32 971
West Midlands All tillage 91 35 54 32 156 47 78 142 16 42 438 All grass 62 38 41 36 84 20 29 52 8 12 238 All crops and grass 77 36 47 34 128 34 58 98 12 27 676
East Midlands All tillage 89 42 39 13 170 61 72 151 26 28 607 All grass 48 24 23 27 82 18 25 39 4 6 191 All crops and grass 77 37 35 17 155 53 63 120 20 22 798
South West All tillage 86 45 45 36 142 56 68 122 25 31 713 All grass 55 32 33 44 106 24 36 59 7 12 703 All crops and grass 67 37 38 41 124 39 51 83 14 19 1416
South East All tillage 86 39 37 26 180 58 65 155 22 24 470 All grass 38 13 14 14 94 27 36 36 3 5 255 All crops and grass 67 29 27 21 160 52 59 107 15 16 725
Wales All tillage 94 50 56 51 116 56 74 109 28 42 128 All grass 58 47 45 36 83 21 25 48 10 11 458 All crops and grass 61 47 46 37 87 23 30 53 11 14 586
Overall application rate(kg/ha)
Source: British Survey of Fertiliser Practice 2015
Table EW4.1a Average fertiliser practice on tillage and grassland by GOR, England & Wales 2015
Crop area receiving dressing(%)
Average field rate(kg/ha)
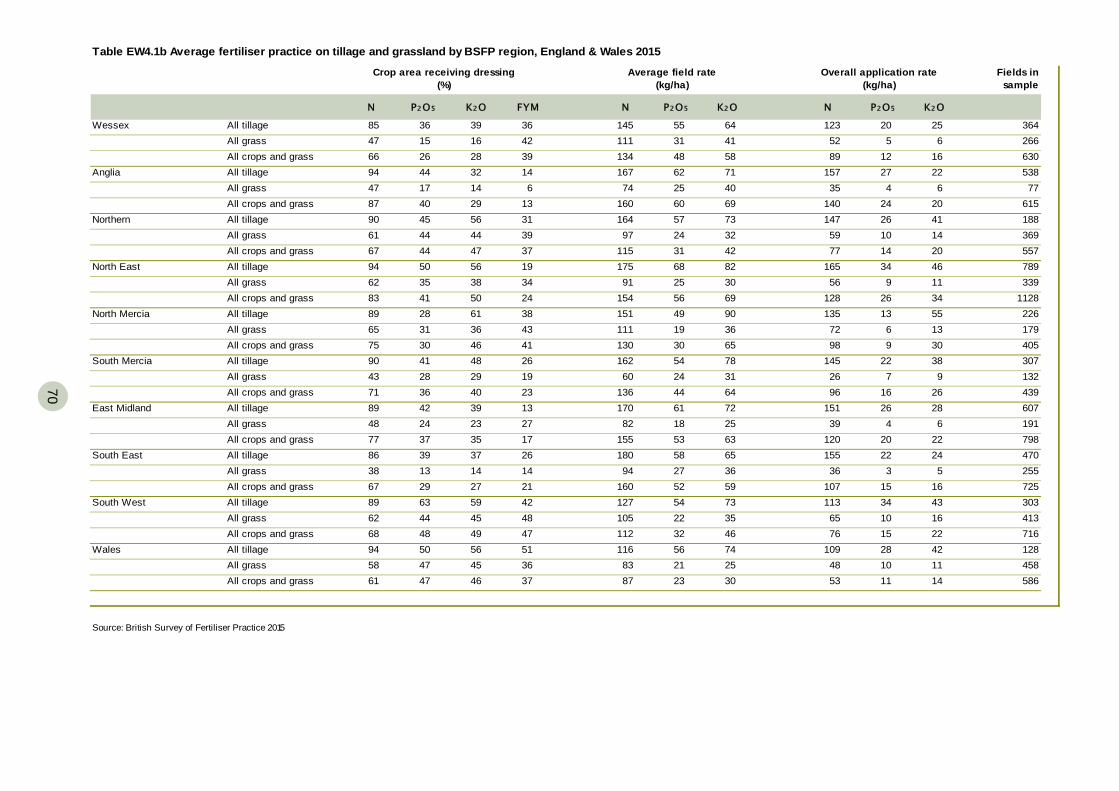
70
70
Fields in sample
N P2O5 K2O FYM N P2O5 K2O N P2O5 K2O
Wessex All tillage 85 36 39 36 145 55 64 123 20 25 364All grass 47 15 16 42 111 31 41 52 5 6 266All crops and grass 66 26 28 39 134 48 58 89 12 16 630
Anglia All tillage 94 44 32 14 167 62 71 157 27 22 538All grass 47 17 14 6 74 25 40 35 4 6 77All crops and grass 87 40 29 13 160 60 69 140 24 20 615
Northern All tillage 90 45 56 31 164 57 73 147 26 41 188All grass 61 44 44 39 97 24 32 59 10 14 369All crops and grass 67 44 47 37 115 31 42 77 14 20 557
North East All tillage 94 50 56 19 175 68 82 165 34 46 789All grass 62 35 38 34 91 25 30 56 9 11 339All crops and grass 83 41 50 24 154 56 69 128 26 34 1128
North Mercia All tillage 89 28 61 38 151 49 90 135 13 55 226All grass 65 31 36 43 111 19 36 72 6 13 179All crops and grass 75 30 46 41 130 30 65 98 9 30 405
South Mercia All tillage 90 41 48 26 162 54 78 145 22 38 307All grass 43 28 29 19 60 24 31 26 7 9 132All crops and grass 71 36 40 23 136 44 64 96 16 26 439
East Midland All tillage 89 42 39 13 170 61 72 151 26 28 607All grass 48 24 23 27 82 18 25 39 4 6 191All crops and grass 77 37 35 17 155 53 63 120 20 22 798
South East All tillage 86 39 37 26 180 58 65 155 22 24 470All grass 38 13 14 14 94 27 36 36 3 5 255All crops and grass 67 29 27 21 160 52 59 107 15 16 725
South West All tillage 89 63 59 42 127 54 73 113 34 43 303All grass 62 44 45 48 105 22 35 65 10 16 413All crops and grass 68 48 49 47 112 32 46 76 15 22 716
Wales All tillage 94 50 56 51 116 56 74 109 28 42 128All grass 58 47 45 36 83 21 25 48 10 11 458All crops and grass 61 47 46 37 87 23 30 53 11 14 586
Table EW4.1b Average fertiliser practice on tillage and grassland by BSFP region, England & Wales 2015
Crop area receiving dressing(%)
Average field rate(kg/ha)
Overall application rate(kg/ha)
Source: British Survey of Fertiliser Practice 2015
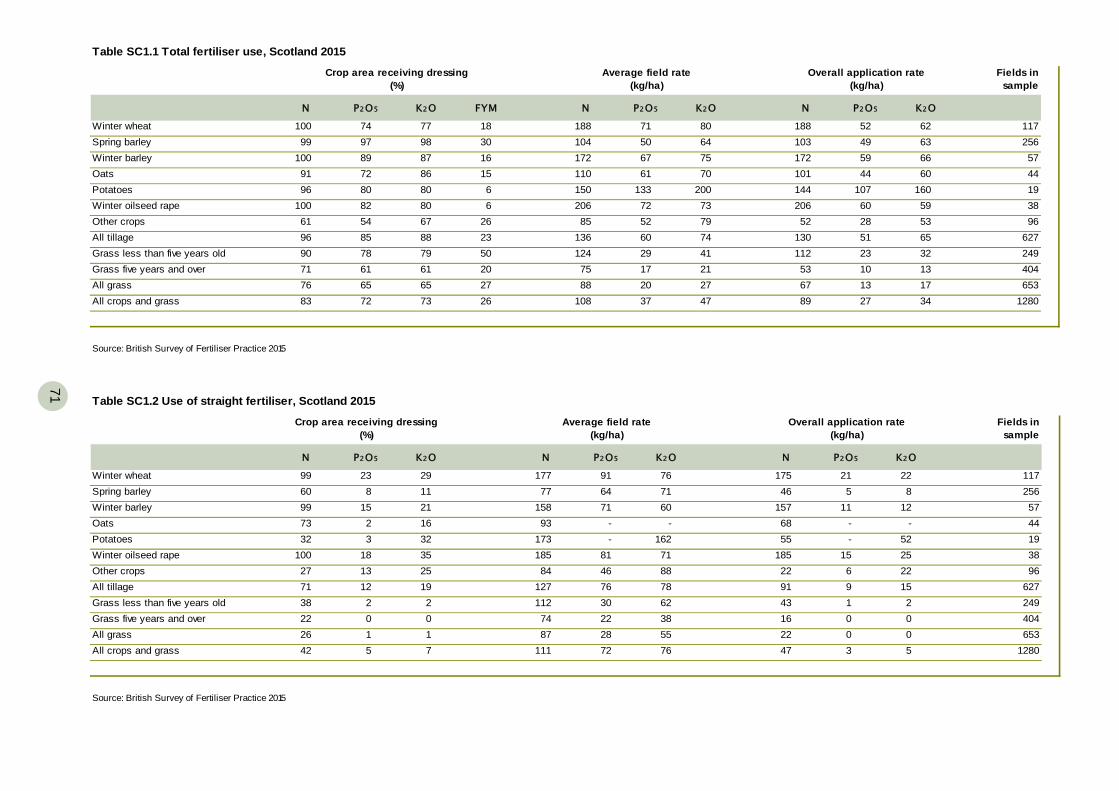
71
Fields in sample
N P2O5 K2O FYM N P2O5 K2O N P2O5 K2O
Winter wheat 100 74 77 18 188 80 188 52 62 117Spring barley 99 97 98 30 104 64 103 49 63 256Winter barley 100 89 87 16 172 75 172 59 66 57Oats 91 72 86 15 110 70 101 44 60 44Potatoes 96 80 80 6 150 200 144 107 160 19Winter oilseed rape 100 82 80 6 206 73 206 60 59 38Other crops 61 54 67 26 85 79 52 28 53 96All tillage 96 85 88 23 136 74 130 51 65 627Grass less than five years old 90 78 79 50 124 41 112 23 32 249Grass five years and over 71 61 61 20 75 21 53 10 13 404All grass 76 65 65 27 88 27 67 13 17 653All crops and grass 83 72 73 26 108 47 89 27 34 1280
Source: British Survey of Fertiliser Practice 2015
13372526029172037
Table SC1.1 Total fertiliser use, Scotland 2015
Crop area receiving dressing(%)
Average field rate(kg/ha)
Overall application rate(kg/ha)
61
715067
Fields in sample
N P2O5 K2O N P2O5 K2O N P2O5 K2O
Winter wheat 99 23 29 177 76 175 21 22 117Spring barley 60 8 11 77 71 46 5 8 256Winter barley 99 15 21 158 60 157 11 12 57Oats 73 2 16 93 - 68 - - 44Potatoes 32 3 32 173 162 55 - 52 19Winter oilseed rape 100 18 35 185 71 185 15 25 38Other crops 27 13 25 84 88 22 6 22 96All tillage 71 12 19 127 78 91 9 15 627Grass less than five years old 38 2 2 112 62 43 1 2 249Grass five years and over 22 0 0 74 38 16 0 0 404All grass 26 1 1 87 55 22 0 0 653All crops and grass 42 5 7 111 76 47 3 5 1280
Source: British Survey of Fertiliser Practice 2015
-81467630222872
Table SC1.2 Use of straight fertiliser, Scotland 2015
Crop area receiving dressing(%)
Average field rate(kg/ha)
Overall application rate(kg/ha)
-
916471
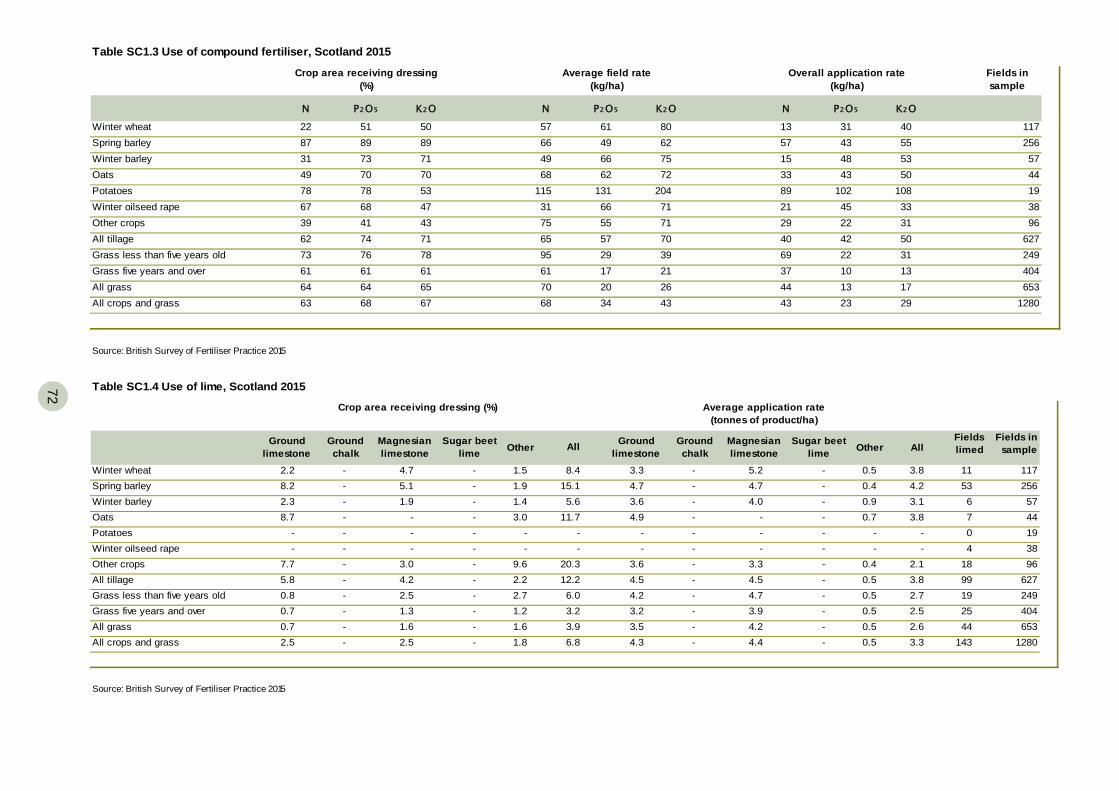
72
72
Fields in sample
N P2O5 K2O N P2O5 K2O N P2O5 K2O
Winter wheat 22 51 50 57 61 13 31 40 117 Spring barley 87 89 89 66 49 57 43 55 256 Winter barley 31 73 71 49 66 15 48 53 57 Oats 49 70 70 68 62 33 43 50 44 Potatoes 78 78 53 115 131 89 102 108 19 Winter oilseed rape 67 68 47 31 66 21 45 33 38 Other crops 39 41 43 75 55 29 22 31 96 All tillage 62 74 71 65 57 40 42 50 627 Grass less than five years old 73 76 78 95 29 69 22 31 249 Grass five years and over 61 61 61 61 17 37 10 13 404 All grass 64 64 65 70 20 44 13 17 653 All crops and grass 63 68 67 68 34 43 23 29 1280
Source: British Survey of Fertiliser Practice 2015
20471717039212643
Table SC1.3 Use of compound fertiliser, Scotland 2015
Crop area receiving dressing(%)
Average field rate(kg/ha)
Overall application rate(kg/ha)
72
806275
Ground limestone
Ground chalk
Magnesian limestone
Sugar beet lime Other Ground
limestoneGround chalk
Magnesian limestone
Sugar beet lime Other All
Fields limed
Fields in sample
Winter wheat 2.2 - 4.7 - 1.5 3.3 - 5.2 - 0.5 3.8 11 117Spring barley 8.2 - 5.1 - 1.9 4.7 - 4.7 - 0.4 4.2 53 256Winter barley 2.3 - 1.9 - 1.4 3.6 - 4.0 - 0.9 3.1 6 57Oats 8.7 - - - 3.0 4.9 - - - 0.7 3.8 7 44Potatoes - - - - - - - - - - - 0 19Winter oilseed rape - - - - - - - - - - - 4 38Other crops 7.7 - 3.0 - 9.6 3.6 - 3.3 - 0.4 2.1 18 96All tillage 5.8 - 4.2 - 2.2 4.5 - 4.5 - 0.5 3.8 99 627Grass less than five years old 0.8 - 2.5 - 2.7 4.2 - 4.7 - 0.5 2.7 19 249Grass five years and over 0.7 - 1.3 - 1.2 3.2 - 3.9 - 0.5 2.5 25 404All grass 0.7 - 1.6 - 1.6 3.5 - 4.2 - 0.5 2.6 44 653All crops and grass 2.5 - 2.5 - 1.8 4.3 - 4.4 - 0.5 3.3 143 1280
Source: British Survey of Fertiliser Practice 2015
6.03.23.96.8
-20.312.2
8.415.15.6
11.7
Table SC1.4 Use of lime, Scotland 2015
Crop area receiving dressing (%) Average application rate (tonnes of product/ha)
All
-
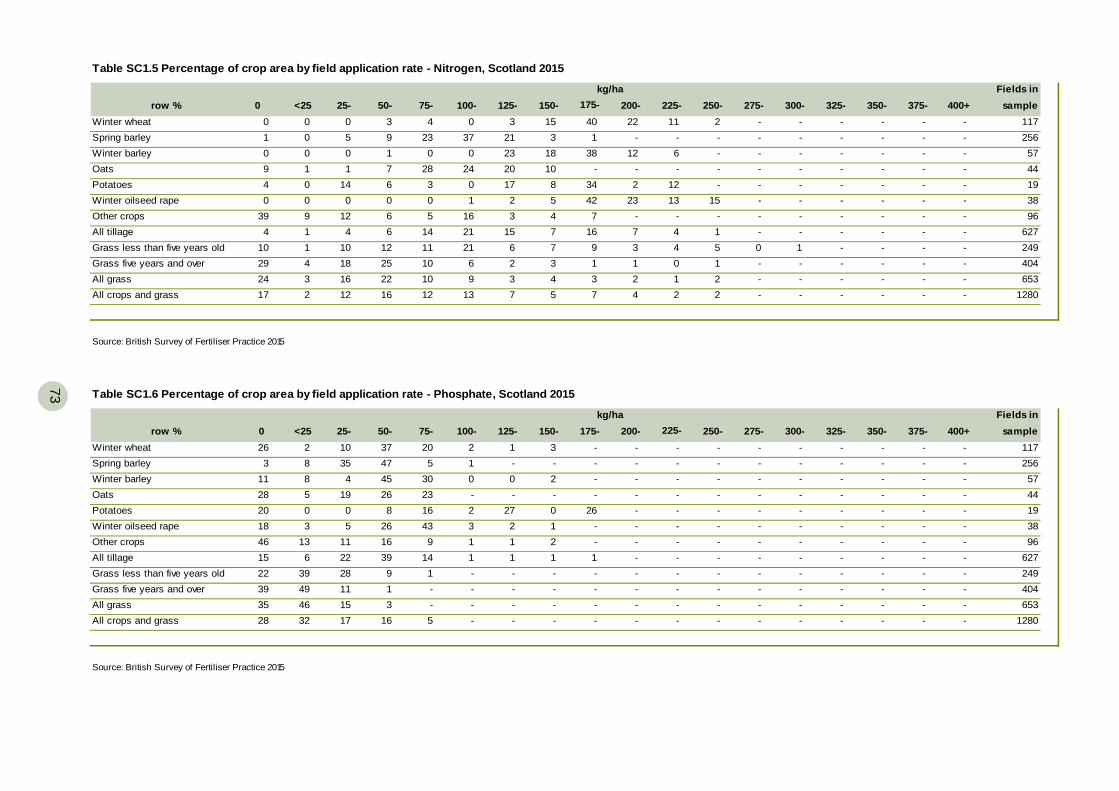
73
Table SC1.5 Percentage of crop area by field application rate - Nitrogen, Scotland 2015
Fields inrow % 0 <25 25- 50- 75- 100- 125- 150- 200- 225- 250- 275- 300- 325- 350- 375- 400+ sample
Winter wheat 0 0 0 3 4 0 3 15 22 11 2 - - - - - - 117Spring barley 1 0 5 9 23 37 21 3 - - - - - - - - - 256Winter barley 0 0 0 1 0 0 23 18 12 6 - - - - - - - 57Oats 9 1 1 7 28 24 20 10 - - - - - - - - - 44Potatoes 4 0 14 6 3 0 17 8 2 12 - - - - - - - 19Winter oilseed rape 0 0 0 0 0 1 2 5 23 13 15 - - - - - - 38Other crops 39 9 12 6 5 16 3 4 - - - - - - - - - 96All tillage 4 1 4 6 14 21 15 7 7 4 1 - - - - - - 627Grass less than five years old 10 1 10 12 11 21 6 7 3 4 5 0 1 - - - - 249Grass five years and over 29 4 18 25 10 6 2 3 1 0 1 - - - - - - 404All grass 24 3 16 22 10 9 3 4 2 1 2 - - - - - - 653All crops and grass 17 2 12 16 12 13 7 5 4 2 2 - - - - - - 1280
Source: British Survey of Fertiliser Practice 2015
137
169
38-
3442
kg/ha175-
401
7
Fields inrow % 0 <25 25- 50- 75- 100- 125- 150- 175- 200- 250- 275- 300- 325- 350- 375- 400+ sample
Winter wheat 26 2 10 37 20 2 1 3 - - - - - - - - - 117 Spring barley 3 8 35 47 5 1 - - - - - - - - - - - 256 Winter barley 11 8 4 45 30 0 0 2 - - - - - - - - - 57 Oats 28 5 19 26 23 - - - - - - - - - - - - 44 Potatoes 20 0 0 8 16 2 27 0 26 - - - - - - - - 19 Winter oilseed rape 18 3 5 26 43 3 2 1 - - - - - - - - - 38 Other crops 46 13 11 16 9 1 1 2 - - - - - - - - - 96 All tillage 15 6 22 39 14 1 1 1 1 - - - - - - - - 627 Grass less than five years old 22 39 28 9 1 - - - - - - - - - - - - 249 Grass five years and over 39 49 11 1 - - - - - - - - - - - - - 404 All grass 35 46 15 3 - - - - - - - - - - - - - 653 All crops and grass 28 32 17 16 5 - - - - - - - - - - - - 1280
Source: British Survey of Fertiliser Practice 2015
---
---
----
Table SC1.6 Percentage of crop area by field application rate - Phosphate, Scotland 2015
kg/ha225-
-
-
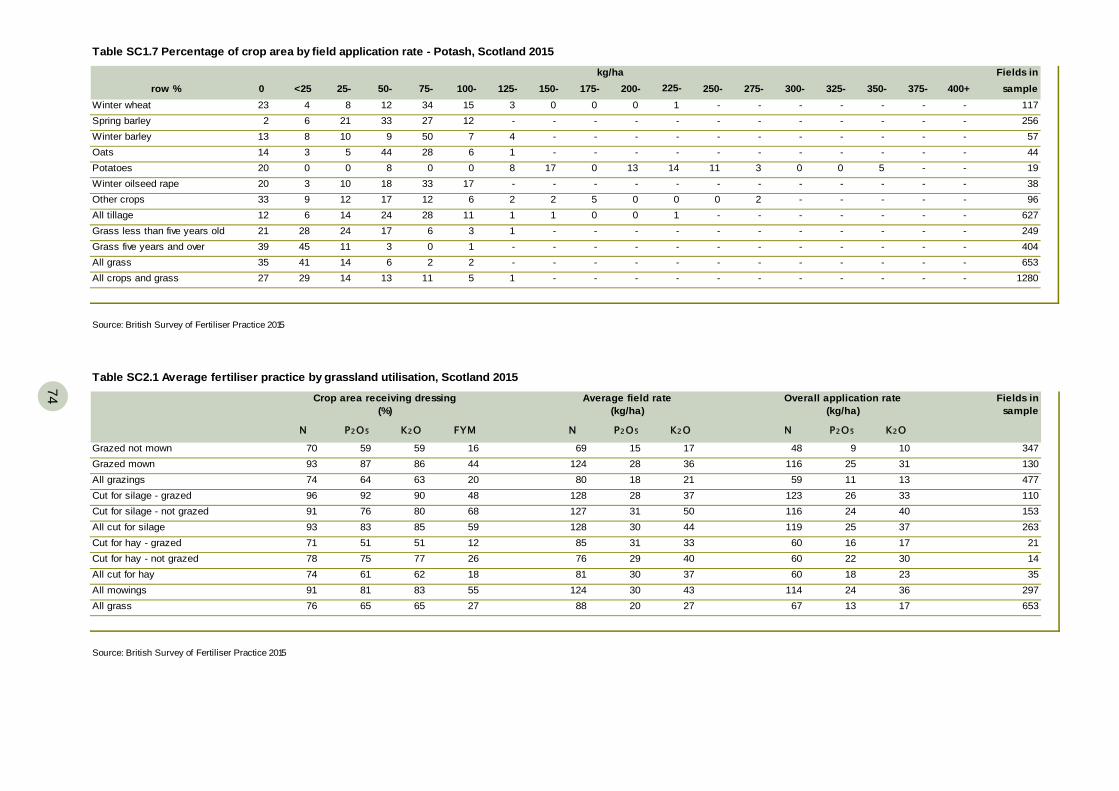
74
74
Fields inrow % 0 <25 25- 50- 75- 100- 125- 150- 175- 200- 250- 275- 300- 325- 350- 375- 400+ sample
Winter wheat 23 4 8 12 34 15 3 0 0 0 - - - - - - - 117 Spring barley 2 6 21 33 27 12 - - - - - - - - - - - 256 Winter barley 13 8 10 9 50 7 4 - - - - - - - - - - 57 Oats 14 3 5 44 28 6 1 - - - - - - - - - - 44 Potatoes 20 0 0 8 0 0 8 17 0 13 11 3 0 0 5 - - 19 Winter oilseed rape 20 3 10 18 33 17 - - - - - - - - - - - 38 Other crops 33 9 12 17 12 6 2 2 5 0 0 2 - - - - - 96 All tillage 12 6 14 24 28 11 1 1 0 0 - - - - - - - 627 Grass less than five years old 21 28 24 17 6 3 1 - - - - - - - - - - 249 Grass five years and over 39 45 11 3 0 1 - - - - - - - - - - - 404 All grass 35 41 14 6 2 2 - - - - - - - - - - - 653 All crops and grass 27 29 14 13 11 5 1 - - - - - - - - - - 1280
Source: British Survey of Fertiliser Practice 2015
---
01-
---
14
Table SC1.7 Percentage of crop area by field application rate - Potash, Scotland 2015
kg/ha225-
1
-
Fields in sample
N P2O5 K2O FYM N P2O5 K2O N P2O5 K2O
Grazed not mown 70 59 59 16 69 17 48 9 10 347Grazed mown 93 87 86 44 124 36 116 25 31 130All grazings 74 64 63 20 80 21 59 11 13 477Cut for silage - grazed 96 92 90 48 128 37 123 26 33 110Cut for silage - not grazed 91 76 80 68 127 50 116 24 40 153All cut for silage 93 83 85 59 128 44 119 25 37 263Cut for hay - grazed 71 51 51 12 85 33 60 16 17 21Cut for hay - not grazed 78 75 77 26 76 40 60 22 30 14All cut for hay 74 61 62 18 81 37 60 18 23 35All mowings 91 81 83 55 124 43 114 24 36 297All grass 76 65 65 27 88 27 67 13 17 653
Source: British Survey of Fertiliser Practice 2015
29303020
313031
152818
Table SC2.1 Average fertiliser practice by grassland utilisation, Scotland 2015
Crop area receiving dressing(%)
Average field rate(kg/ha)
Overall application rate(kg/ha)
28
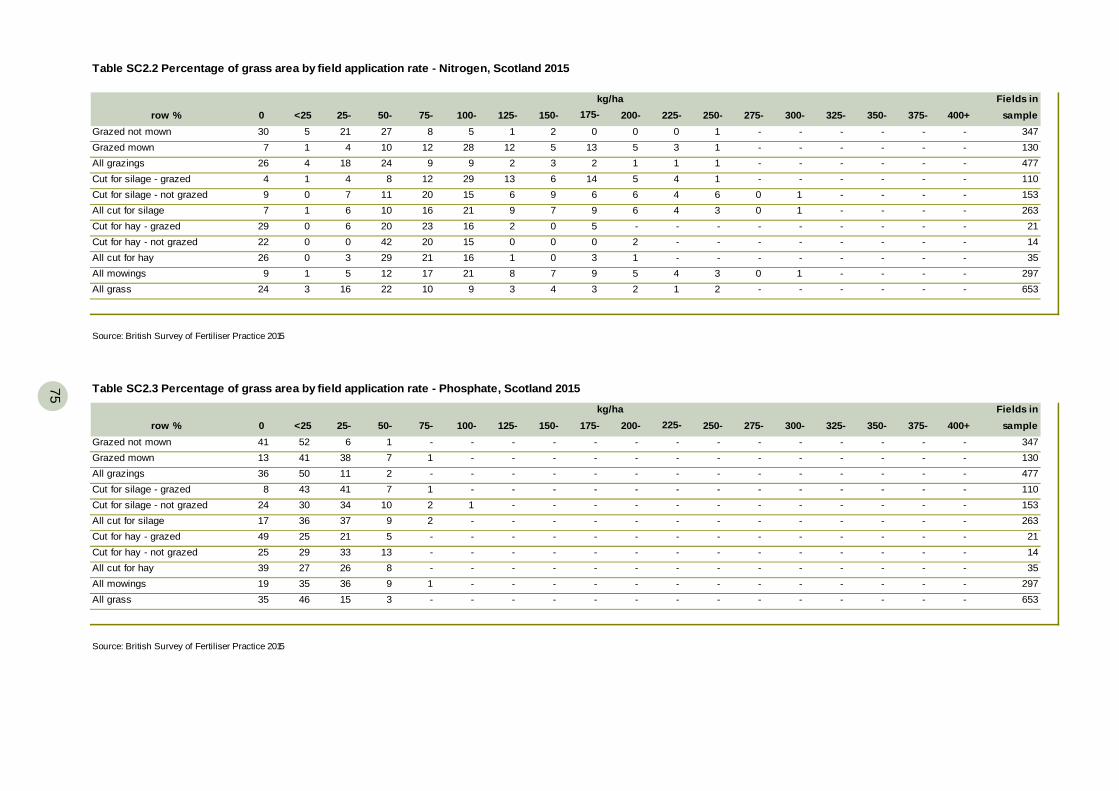
75
Fields inrow % 0 <25 25- 50- 75- 100- 125- 150- 200- 225- 250- 275- 300- 325- 350- 375- 400+ sample
Grazed not mown 30 5 21 27 8 5 1 2 0 0 1 - - - - - - 347Grazed mown 7 1 4 10 12 28 12 5 5 3 1 - - - - - - 130All grazings 26 4 18 24 9 9 2 3 1 1 1 - - - - - - 477Cut for silage - grazed 4 1 4 8 12 29 13 6 5 4 1 - - - - - - 110Cut for silage - not grazed 9 0 7 11 20 15 6 9 6 4 6 0 1 - - - - 153All cut for silage 7 1 6 10 16 21 9 7 6 4 3 0 1 - - - - 263Cut for hay - grazed 29 0 6 20 23 16 2 0 - - - - - - - - - 21Cut for hay - not grazed 22 0 0 42 20 15 0 0 2 - - - - - - - - 14All cut for hay 26 0 3 29 21 16 1 0 1 - - - - - - - - 35All mowings 9 1 5 12 17 21 8 7 5 4 3 0 1 - - - - 297All grass 24 3 16 22 10 9 3 4 2 1 2 - - - - - - 653
Source: British Survey of Fertiliser Practice 2015
93
503
132
146
kg/ha175-
0
Table SC2.2 Percentage of grass area by field application rate - Nitrogen, Scotland 2015
9
Fields inrow % 0 <25 25- 50- 75- 100- 125- 150- 175- 200- 250- 275- 300- 325- 350- 375- 400+ sample
Grazed not mown 41 52 6 1 - - - - - - - - - - - - - 347Grazed mown 13 41 38 7 1 - - - - - - - - - - - - 130All grazings 36 50 11 2 - - - - - - - - - - - - - 477Cut for silage - grazed 8 43 41 7 1 - - - - - - - - - - - - 110Cut for silage - not grazed 24 30 34 10 2 1 - - - - - - - - - - - 153All cut for silage 17 36 37 9 2 - - - - - - - - - - - - 263Cut for hay - grazed 49 25 21 5 - - - - - - - - - - - - - 21Cut for hay - not grazed 25 29 33 13 - - - - - - - - - - - - - 14All cut for hay 39 27 26 8 - - - - - - - - - - - - - 35All mowings 19 35 36 9 1 - - - - - - - - - - - - 297All grass 35 46 15 3 - - - - - - - - - - - - - 653
Source: British Survey of Fertiliser Practice 2015
--
---
----
Table SC2.3 Percentage of grass area by field application rate - Phosphate, Scotland 2015
kg/ha225-
-
-
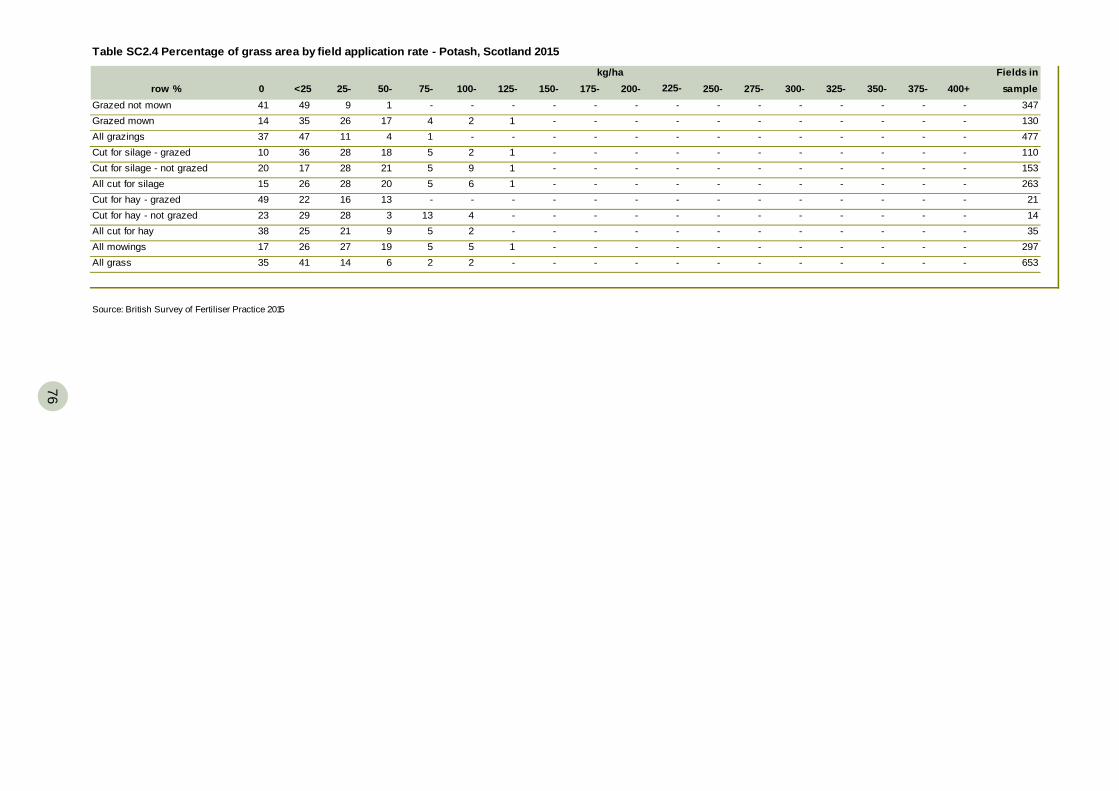
76
76
Fields inrow % 0 <25 25- 50- 75- 100- 125- 150- 175- 200- 250- 275- 300- 325- 350- 375- 400+ sample
Grazed not mown 41 49 9 1 - - - - - - - - - - - - - 347Grazed mown 14 35 26 17 4 2 1 - - - - - - - - - - 130All grazings 37 47 11 4 1 - - - - - - - - - - - - 477Cut for silage - grazed 10 36 28 18 5 2 1 - - - - - - - - - - 110Cut for silage - not grazed 20 17 28 21 5 9 1 - - - - - - - - - - 153All cut for silage 15 26 28 20 5 6 1 - - - - - - - - - - 263Cut for hay - grazed 49 22 16 13 - - - - - - - - - - - - - 21Cut for hay - not grazed 23 29 28 3 13 4 - - - - - - - - - - - 14All cut for hay 38 25 21 9 5 2 - - - - - - - - - - - 35All mowings 17 26 27 19 5 5 1 - - - - - - - - - - 297All grass 35 41 14 6 2 2 - - - - - - - - - - - 653
Source: British Survey of Fertiliser Practice 2015
--
---
----
Table SC2.4 Percentage of grass area by field application rate - Potash, Scotland 2015
kg/ha225-
-
-
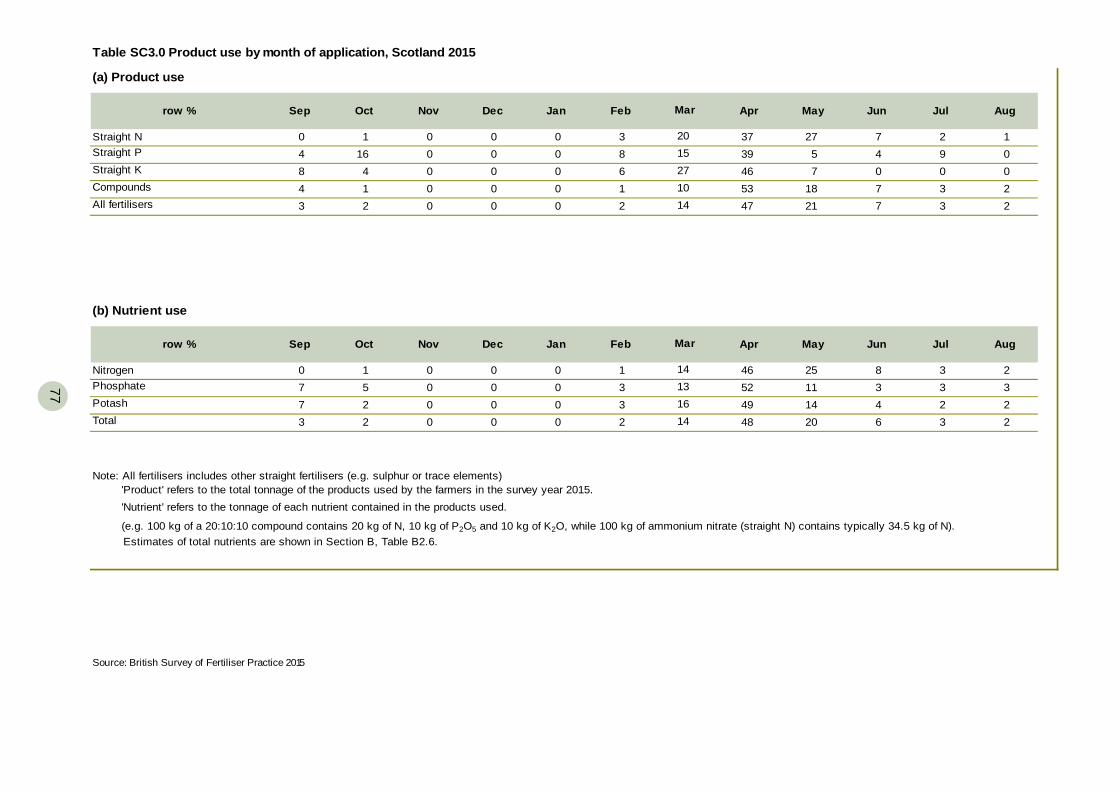
77
(a) Product use
row % Sep Oct Nov Dec Jan Feb Apr May Jun Jul Aug
Straight N 0 1 0 0 0 3 37 27 7 2 1Straight P 4 16 0 0 0 8 39 5 4 9 0Straight K 8 4 0 0 0 6 46 7 0 0 0Compounds 4 1 0 0 0 1 53 18 7 3 2All fertilisers 3 2 0 0 0 2 47 21 7 3 2
(b) Nutrient use
row % Sep Oct Nov Dec Jan Feb Apr May Jun Jul Aug
Nitrogen 0 1 0 0 0 1 46 25 8 3 2Phosphate 7 5 0 0 0 3 52 11 3 3 3Potash 7 2 0 0 0 3 49 14 4 2 2Total 3 2 0 0 0 2 48 20 6 3 2
Source: British Survey of Fertiliser Practice 2015
Note: All fertilisers includes other straight fertilisers (e.g. sulphur or trace elements) 'Product' refers to the total tonnage of the products used by the farmers in the survey year 2015. 'Nutrient' refers to the tonnage of each nutrient contained in the products used.
14
Mar
141316
(e.g. 100 kg of a 20:10:10 compound contains 20 kg of N, 10 kg of P2O5 and 10 kg of K2O, while 100 kg of ammonium nitrate (straight N) contains typically 34.5 kg of N). Estimates of total nutrients are shown in Section B, Table B2.6.
Table SC3.0 Product use by month of application, Scotland 2015
Mar
2015271014
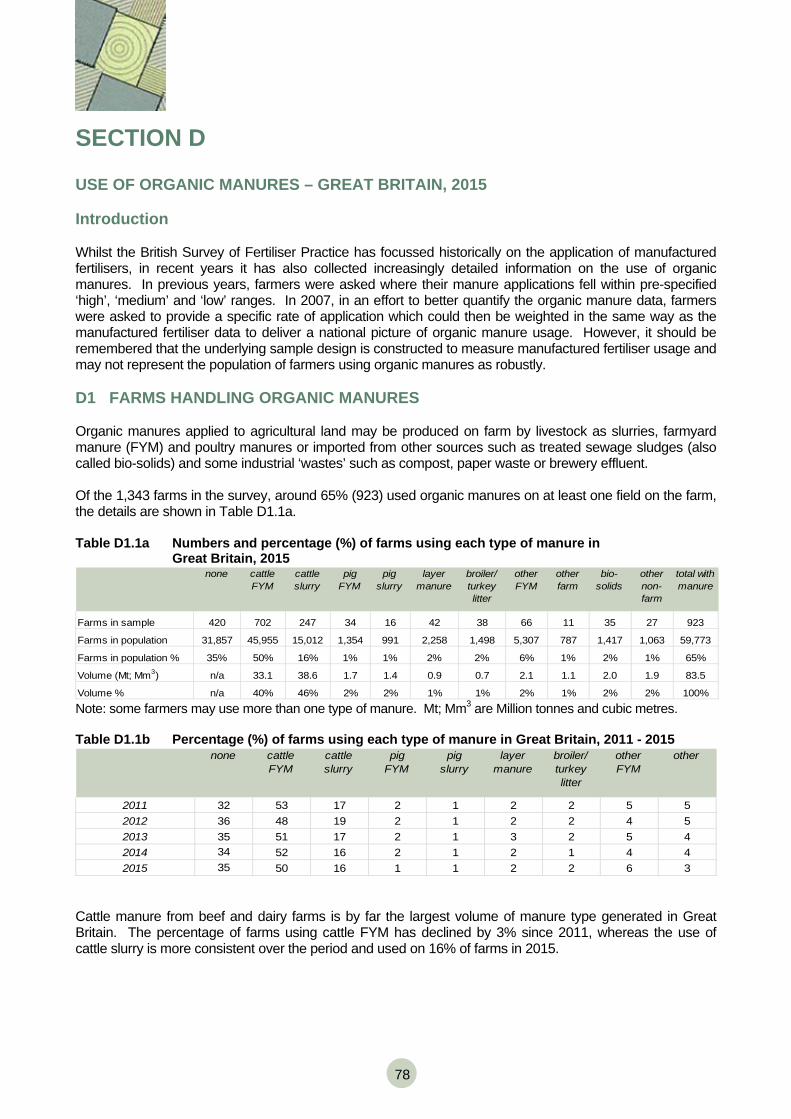
78
SECTION D
USE OF ORGANIC MANURES – GREAT BRITAIN, 2015
Introduction Whilst the British Survey of Fertiliser Practice has focussed historically on the application of manufactured fertilisers, in recent years it has also collected increasingly detailed information on the use of organic manures. In previous years, farmers were asked where their manure applications fell within pre-specified ‘high’, ‘medium’ and ‘low’ ranges. In 2007, in an effort to better quantify the organic manure data, farmers were asked to provide a specific rate of application which could then be weighted in the same way as the manufactured fertiliser data to deliver a national picture of organic manure usage. However, it should be remembered that the underlying sample design is constructed to measure manufactured fertiliser usage and may not represent the population of farmers using organic manures as robustly. D1 FARMS HANDLING ORGANIC MANURES Organic manures applied to agricultural land may be produced on farm by livestock as slurries, farmyard manure (FYM) and poultry manures or imported from other sources such as treated sewage sludges (also called bio-solids) and some industrial ‘wastes’ such as compost, paper waste or brewery effluent. Of the 1,343 farms in the survey, around 65% (923) used organic manures on at least one field on the farm, the details are shown in Table D1.1a. Table D1.1a Numbers and percentage (%) of farms using each type of manure in
Great Britain, 2015 none cattle
FYMcattle slurry
pig FYM
pig slurry
layer manure
broiler/ turkey litter
other FYM
other farm
bio-solids
other non-farm
total with manure
Farms in sample 420 702 247 34 16 42 38 66 11 35 27 923
Farms in population 31,857 45,955 15,012 1,354 991 2,258 1,498 5,307 787 1,417 1,063 59,773
Farms in population % 35% 50% 16% 1% 1% 2% 2% 6% 1% 2% 1% 65%
Volume (Mt; Mm3) n/a 33.1 38.6 1.7 1.4 0.9 0.7 2.1 1.1 2.0 1.9 83.5
Volume % n/a 40% 46% 2% 2% 1% 1% 2% 1% 2% 2% 100% Note: some farmers may use more than one type of manure. Mt; Mm3 are Million tonnes and cubic metres. Table D1.1b Percentage (%) of farms using each type of manure in Great Britain, 2011 - 2015
none cattle FYM
cattle slurry
pig FYM
pig slurry
layer manure
broiler/ turkey litter
other FYM
other
2011 32 53 17 2 1 2 2 5 52012 36 48 19 2 1 2 2 4 52013 35 51 17 2 1 3 2 5 42014 34 52 16 2 1 2 1 4 42015 35 50 16 1 1 2 2 6 3
Cattle manure from beef and dairy farms is by far the largest volume of manure type generated in Great Britain. The percentage of farms using cattle FYM has declined by 3% since 2011, whereas the use of cattle slurry is more consistent over the period and used on 16% of farms in 2015.
79
Table D1.1c Dressing cover of organic manure in Great Britain, 2011 - 2015
all tillage grass 5 years and over grass under 5 years old
2011 22 32 472012 23 32 472013 23 35 472014 22 29 492015 23 29 53
Dressing covers of organic manure on grass under five years old have increased over the 5 year period. In 2015 23% of the tillage area received a dressing, with higher percentages on both categories of grass. Not all the manure generated by a farm is necessarily retained for use by that farm and excess manure/slurry can be exported for use elsewhere. The number and percentage of farms using each type of slurry application method in Great Britain are shown in Table D1.2. These data serve as a guide only and are calculated as an expression of the number of farms adopting a proportion of each application method, where slurry was applied. The data do not account for the proportion of each farm’s total cultivatable area receiving slurry, or any variation in the rate at which slurry may have been applied using different application methods. Notwithstanding these considerations, it is clear that broadcast application is by far the most widespread method adopted for both types of slurry. Table D1.2 Number and percentage (%) of farms using each type of application method by slurry
type, Great Britain 2015
farms in sample
farms in population broadcast band
spreadshallow injection
deep injection rain gun rotating
boomnon-
broadcast
Cattle slurry 247 15,012 81 10 9 2 0 0 20Pig slurry 16 991 50 45 7 0 0 0 50Grand Total 255 15,668 80 12 9 2 0 0 21
percentage of farms
Note: some farms may apply both types of slurry Whilst some of these application methods (e.g. shallow injection or deep injection) apply slurry below the surface of the field, the majority require secondary cultivation to incorporate the manure/slurry into the soil. Assessment of how often organic manures are incorporated into the soil is complicated by the fact that some farmers make more than one application or apply more than one type of manure and may incorporate each of these differently. As manure on grass fields is seldom incorporated (unless they are destined for re-seeding), grass fields have been excluded from the incorporation analysis.
80
Table D1.3 gives estimates of the volume and area of manure/slurry incorporation on tillage fields by manure type and immediacy of incorporation. Farmyard manure is the most extensively incorporated at 95% of the volume with 83% of it incorporated within a week of spreading on tillage fields. Cattle and pig slurries are less likely to be incorporated with 14% and 55% of the volume respectively not incorporated. The high proportion of the pig slurry which is not incorporated is thought to be due in part to its application as a spring top-dressing to winter sown crops (see Table D2.4). Table D1.3 Percentage (%) of organic manure incorporated (volume and area) on tillage fields by
incorporation time and manure/slurry type, Great Britain 2015
applied area
volume applied
%area %vol %area %vol %area %vol %area %vol %area %vol '000 ha 'Mt; Mm 3
FYM 5 6 13 13 30 28 41 42 10 10 759 17.9Cattle slurry 19 14 19 27 16 16 28 23 18 19 146 5.1Pig slurry 52 55 19 19 17 14 6 6 5 5 19 0.6Poultry FYM 15 15 18 19 57 57 9 9 1 1 180 1.4Other 14 14 16 10 32 35 32 32 6 10 155 3.6Total 10 9 15 16 32 28 33 35 9 11 1,260 28.5
total
more than 1 week
not incorporated
within 6 hours
between 6 and 24 hours
between 1 and 7 days
incorporation time after spreading
Farmers were asked to indicate what proportion of their livestock manures had been spread by a contractor (Table D1.4a). The percentage of farmers using a contractor to spread at least some of their FYM was 36% in 2015. Where contractors were used they were applying between 86% and 96% of the manure on average. Table D1.4a Use of contractors to spread manure/slurry in current season, Great Britain 2015
% of farms using a contractor % volume applied by contractor average % of contractor-applied manure, where contractor is used
FYM 36 32 86Cattle slurry 30 29 91Other 51 53 96Total 34 33 89 Use of contractors to spread manures is fairly consistent over the 5 year period 2011-2015, on 28-36% of farms (Table 1.4b), as was the average amount spread, at 84-89%. Table D1.4b Use of contractors to spread manure/slurry, Great Britain 2011 - 2015
% of farms using a contractor % volume applied by contractor average % of contractor-applied manure, where contractor is used
2011 28 29 862012 32 32 842013 30 30 882014 36 39 872015 34 33 89
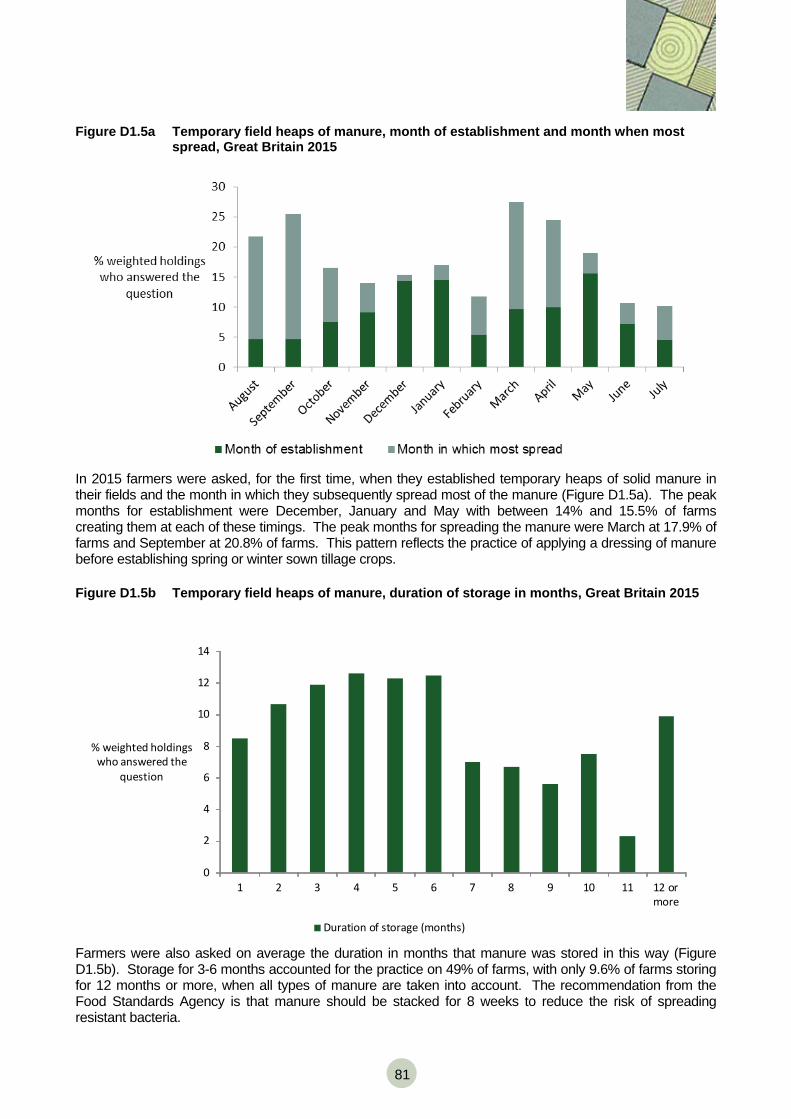
81
Figure D1.5a Temporary field heaps of manure, month of establishment and month when most spread, Great Britain 2015
In 2015 farmers were asked, for the first time, when they established temporary heaps of solid manure in their fields and the month in which they subsequently spread most of the manure (Figure D1.5a). The peak months for establishment were December, January and May with between 14% and 15.5% of farms creating them at each of these timings. The peak months for spreading the manure were March at 17.9% of farms and September at 20.8% of farms. This pattern reflects the practice of applying a dressing of manure before establishing spring or winter sown tillage crops. Figure D1.5b Temporary field heaps of manure, duration of storage in months, Great Britain 2015
0
2
4
6
8
10
12
14
1 2 3 4 5 6 7 8 9 10 11 12 ormore
% weighted holdings who answered the
question
Duration of storage (months)
Farmers were also asked on average the duration in months that manure was stored in this way (Figure D1.5b). Storage for 3-6 months accounted for the practice on 49% of farms, with only 9.6% of farms storing for 12 months or more, when all types of manure are taken into account. The recommendation from the Food Standards Agency is that manure should be stacked for 8 weeks to reduce the risk of spreading resistant bacteria.
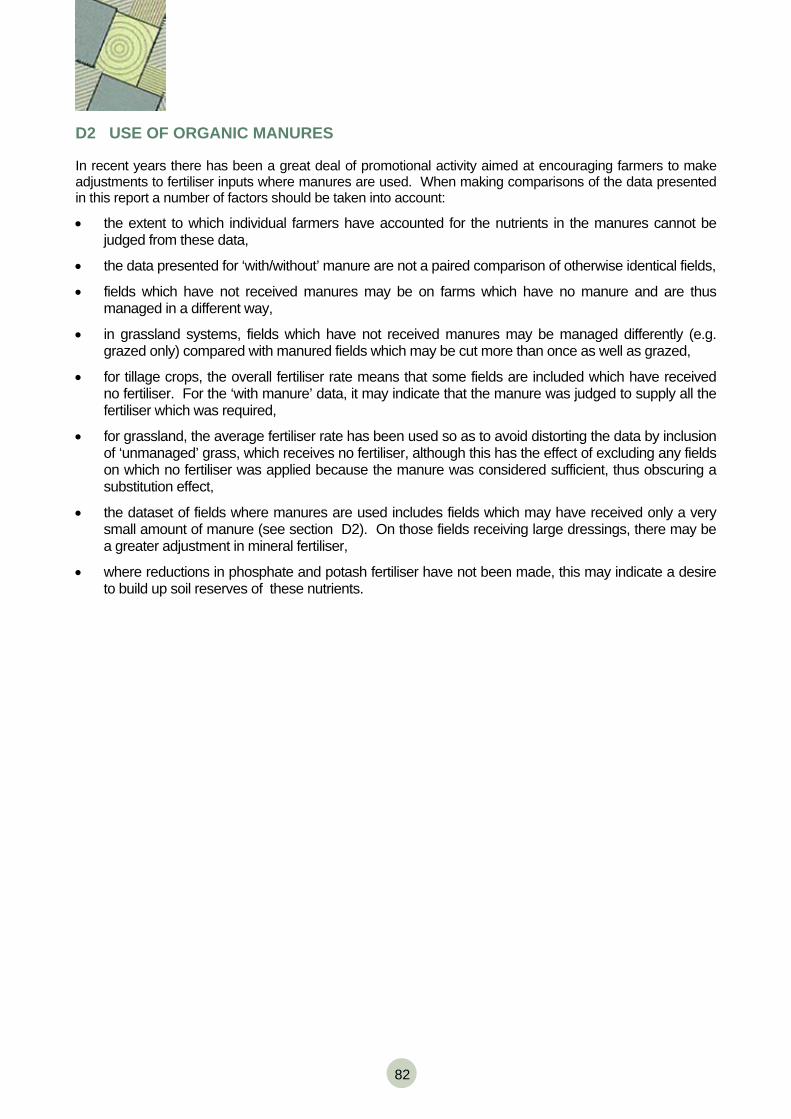
82
D2 USE OF ORGANIC MANURES In recent years there has been a great deal of promotional activity aimed at encouraging farmers to make adjustments to fertiliser inputs where manures are used. When making comparisons of the data presented in this report a number of factors should be taken into account:
• the extent to which individual farmers have accounted for the nutrients in the manures cannot be judged from these data,
• the data presented for ‘with/without’ manure are not a paired comparison of otherwise identical fields,
• fields which have not received manures may be on farms which have no manure and are thus managed in a different way,
• in grassland systems, fields which have not received manures may be managed differently (e.g. grazed only) compared with manured fields which may be cut more than once as well as grazed,
• for tillage crops, the overall fertiliser rate means that some fields are included which have received no fertiliser. For the ‘with manure’ data, it may indicate that the manure was judged to supply all the fertiliser which was required,
• for grassland, the average fertiliser rate has been used so as to avoid distorting the data by inclusion of ‘unmanaged’ grass, which receives no fertiliser, although this has the effect of excluding any fields on which no fertiliser was applied because the manure was considered sufficient, thus obscuring a substitution effect,
• the dataset of fields where manures are used includes fields which may have received only a very small amount of manure (see section D2). On those fields receiving large dressings, there may be a greater adjustment in mineral fertiliser,
• where reductions in phosphate and potash fertiliser have not been made, this may indicate a desire to build up soil reserves of these nutrients.
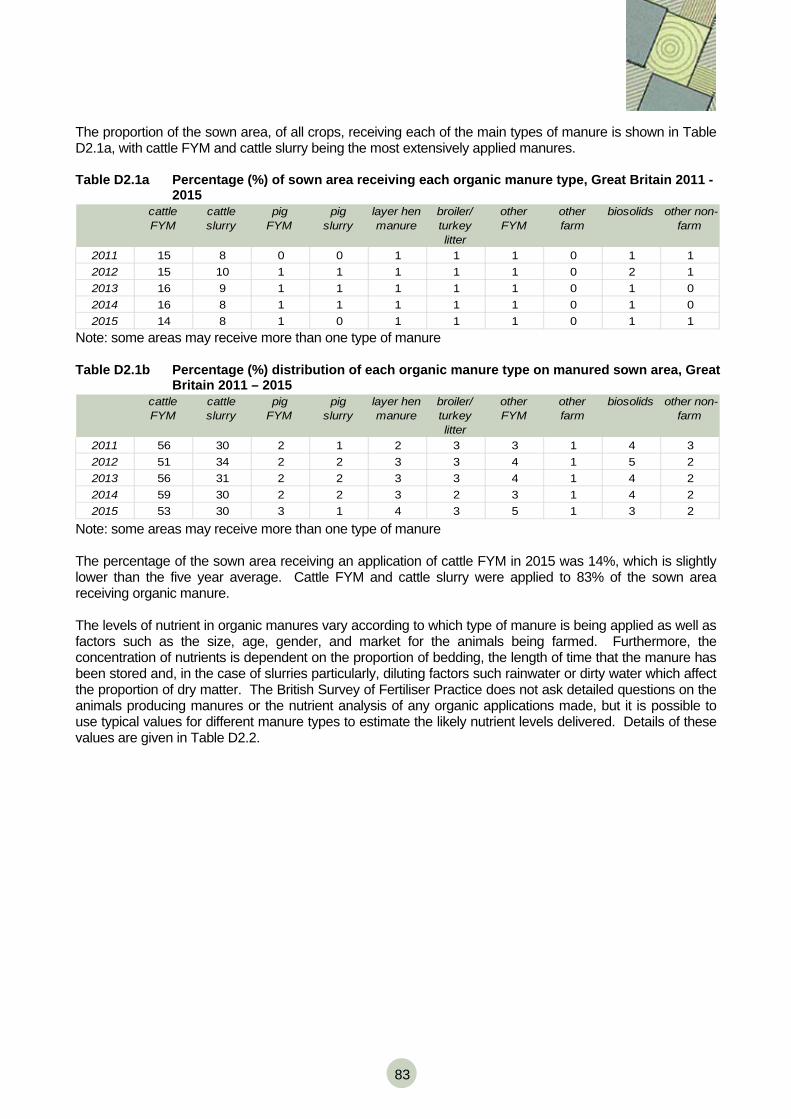
83
The proportion of the sown area, of all crops, receiving each of the main types of manure is shown in Table D2.1a, with cattle FYM and cattle slurry being the most extensively applied manures. Table D2.1a Percentage (%) of sown area receiving each organic manure type, Great Britain 2011 -
2015 cattleFYM
cattleslurry
pigFYM
pigslurry
layer henmanure
broiler/turkeylitter
otherFYM
other farm
biosolids other non-farm
2011 15 8 0 0 1 1 1 0 1 12012 15 10 1 1 1 1 1 0 2 12013 16 9 1 1 1 1 1 0 1 02014 16 8 1 1 1 1 1 0 1 02015 14 8 1 0 1 1 1 0 1 1
Note: some areas may receive more than one type of manure Table D2.1b Percentage (%) distribution of each organic manure type on manured sown area, Great
Britain 2011 – 2015 cattleFYM
cattleslurry
pigFYM
pigslurry
layer henmanure
broiler/turkeylitter
otherFYM
other farm
biosolids other non-farm
2011 56 30 2 1 2 3 3 1 4 32012 51 34 2 2 3 3 4 1 5 22013 56 31 2 2 3 3 4 1 4 22014 59 30 2 2 3 2 3 1 4 22015 53 30 3 1 4 3 5 1 3 2
Note: some areas may receive more than one type of manure The percentage of the sown area receiving an application of cattle FYM in 2015 was 14%, which is slightly lower than the five year average. Cattle FYM and cattle slurry were applied to 83% of the sown area receiving organic manure. The levels of nutrient in organic manures vary according to which type of manure is being applied as well as factors such as the size, age, gender, and market for the animals being farmed. Furthermore, the concentration of nutrients is dependent on the proportion of bedding, the length of time that the manure has been stored and, in the case of slurries particularly, diluting factors such rainwater or dirty water which affect the proportion of dry matter. The British Survey of Fertiliser Practice does not ask detailed questions on the animals producing manures or the nutrient analysis of any organic applications made, but it is possible to use typical values for different manure types to estimate the likely nutrient levels delivered. Details of these values are given in Table D2.2.
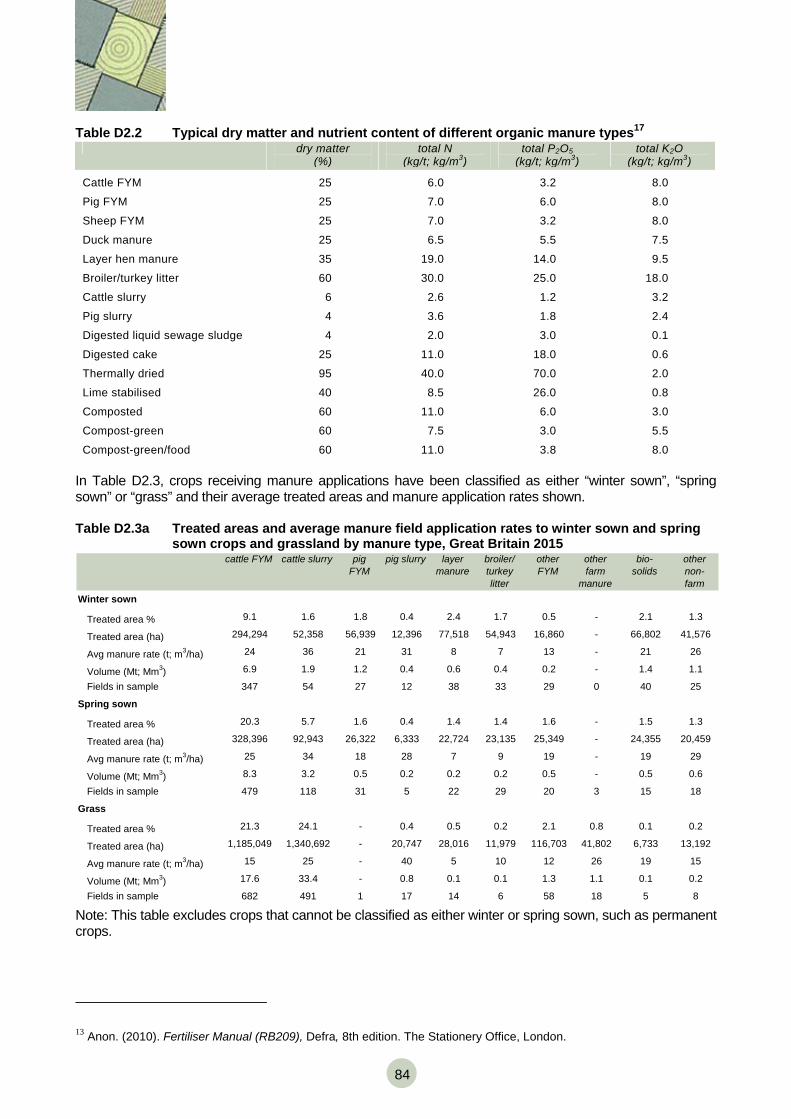
84
Table D2.2 Typical dry matter and nutrient content of different organic manure types17 dry matter
(%) total N
(kg/t; kg/m3) total P2O5
(kg/t; kg/m3) total K2O
(kg/t; kg/m3)
Cattle FYM 25 6.0 3.2 8.0
Pig FYM 25 7.0 6.0 8.0
Sheep FYM 25 7.0 3.2 8.0
Duck manure 25 6.5 5.5 7.5
Layer hen manure 35 19.0 14.0 9.5
Broiler/turkey litter 60 30.0 25.0 18.0
Cattle slurry 6 2.6 1.2 3.2
Pig slurry 4 3.6 1.8 2.4
Digested liquid sewage sludge 4 2.0 3.0 0.1
Digested cake 25 11.0 18.0 0.6
Thermally dried 95 40.0 70.0 2.0
Lime stabilised 40 8.5 26.0 0.8
Composted 60 11.0 6.0 3.0
Compost-green 60 7.5 3.0 5.5
Compost-green/food 60 11.0 3.8 8.0 In Table D2.3, crops receiving manure applications have been classified as either “winter sown”, “spring sown” or “grass” and their average treated areas and manure application rates shown. Table D2.3a Treated areas and average manure field application rates to winter sown and spring
sown crops and grassland by manure type, Great Britain 2015 cattle FYM cattle slurry pig
FYMpig slurry layer
manurebroiler/ turkey litter
otherFYM
otherfarm
manure
bio-solids
othernon-farm
Winter sown
Treated area % 9.1 1.6 1.8 0.4 2.4 1.7 0.5 - 2.1 1.3
Treated area (ha) 294,294 52,358 56,939 12,396 77,518 54,943 16,860 - 66,802 41,576
Avg manure rate (t; m3/ha) 24 36 21 31 8 7 13 - 21 26
Volume (Mt; Mm3) 6.9 1.9 1.2 0.4 0.6 0.4 0.2 - 1.4 1.1
Fields in sample 347 54 27 12 38 33 29 0 40 25
Spring sown
Treated area % 20.3 5.7 1.6 0.4 1.4 1.4 1.6 - 1.5 1.3
Treated area (ha) 328,396 92,943 26,322 6,333 22,724 23,135 25,349 - 24,355 20,459
Avg manure rate (t; m3/ha) 25 34 18 28 7 9 19 - 19 29
Volume (Mt; Mm3) 8.3 3.2 0.5 0.2 0.2 0.2 0.5 - 0.5 0.6
Fields in sample 479 118 31 5 22 29 20 3 15 18
Grass
Treated area % 21.3 24.1 - 0.4 0.5 0.2 2.1 0.8 0.1 0.2
Treated area (ha) 1,185,049 1,340,692 - 20,747 28,016 11,979 116,703 41,802 6,733 13,192
Avg manure rate (t; m3/ha) 15 25 - 40 5 10 12 26 19 15
Volume (Mt; Mm3) 17.6 33.4 - 0.8 0.1 0.1 1.3 1.1 0.1 0.2
Fields in sample 682 491 1 17 14 6 58 18 5 8 Note: This table excludes crops that cannot be classified as either winter or spring sown, such as permanent crops.
13 Anon. (2010). Fertiliser Manual (RB209), Defra, 8th edition. The Stationery Office, London.
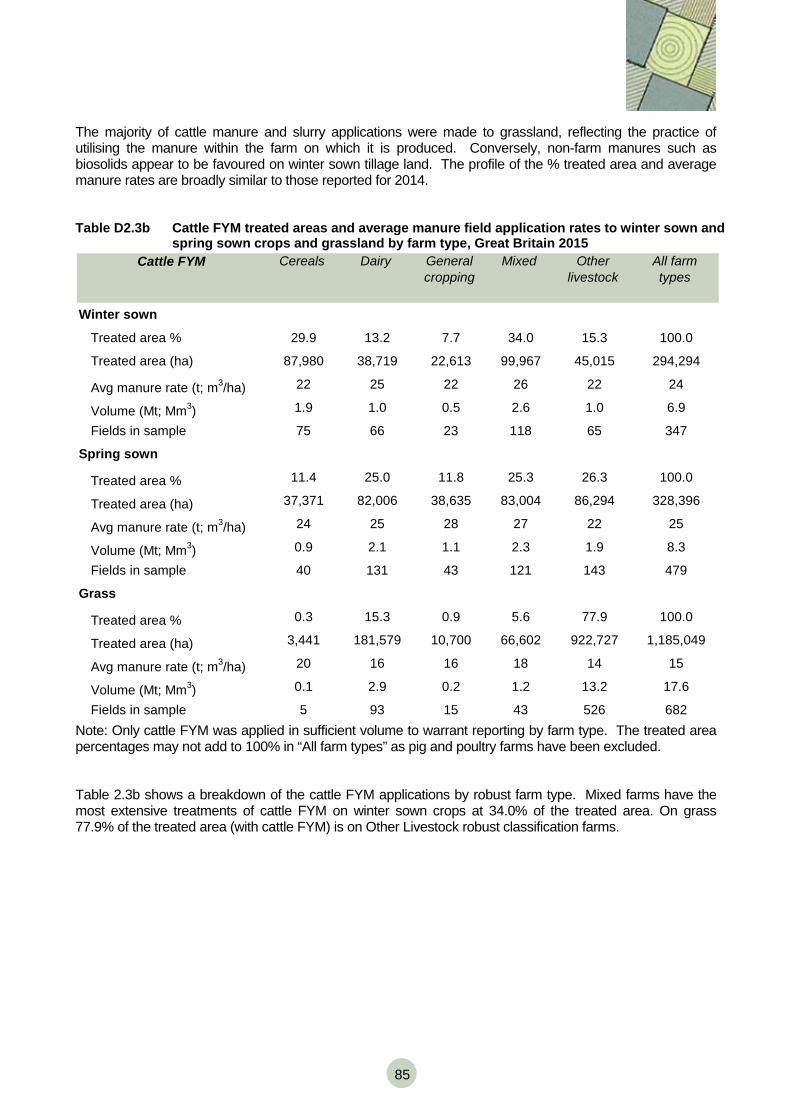
85
The majority of cattle manure and slurry applications were made to grassland, reflecting the practice of utilising the manure within the farm on which it is produced. Conversely, non-farm manures such as biosolids appear to be favoured on winter sown tillage land. The profile of the % treated area and average manure rates are broadly similar to those reported for 2014. Table D2.3b Cattle FYM treated areas and average manure field application rates to winter sown and
spring sown crops and grassland by farm type, Great Britain 2015 Cattle FYM Cereals Dairy General
croppingMixed Other
livestockAll farm types
Winter sown
Treated area % 29.9 13.2 7.7 34.0 15.3 100.0
Treated area (ha) 87,980 38,719 22,613 99,967 45,015 294,294
Avg manure rate (t; m3/ha) 22 25 22 26 22 24
Volume (Mt; Mm3) 1.9 1.0 0.5 2.6 1.0 6.9
Fields in sample 75 66 23 118 65 347
Spring sown
Treated area % 11.4 25.0 11.8 25.3 26.3 100.0
Treated area (ha) 37,371 82,006 38,635 83,004 86,294 328,396
Avg manure rate (t; m3/ha) 24 25 28 27 22 25
Volume (Mt; Mm3) 0.9 2.1 1.1 2.3 1.9 8.3
Fields in sample 40 131 43 121 143 479
Grass
Treated area % 0.3 15.3 0.9 5.6 77.9 100.0
Treated area (ha) 3,441 181,579 10,700 66,602 922,727 1,185,049
Avg manure rate (t; m3/ha) 20 16 16 18 14 15
Volume (Mt; Mm3) 0.1 2.9 0.2 1.2 13.2 17.6
Fields in sample 5 93 15 43 526 682Note: Only cattle FYM was applied in sufficient volume to warrant reporting by farm type. The treated area percentages may not add to 100% in “All farm types” as pig and poultry farms have been excluded. Table 2.3b shows a breakdown of the cattle FYM applications by robust farm type. Mixed farms have the most extensive treatments of cattle FYM on winter sown crops at 34.0% of the treated area. On grass 77.9% of the treated area (with cattle FYM) is on Other Livestock robust classification farms.
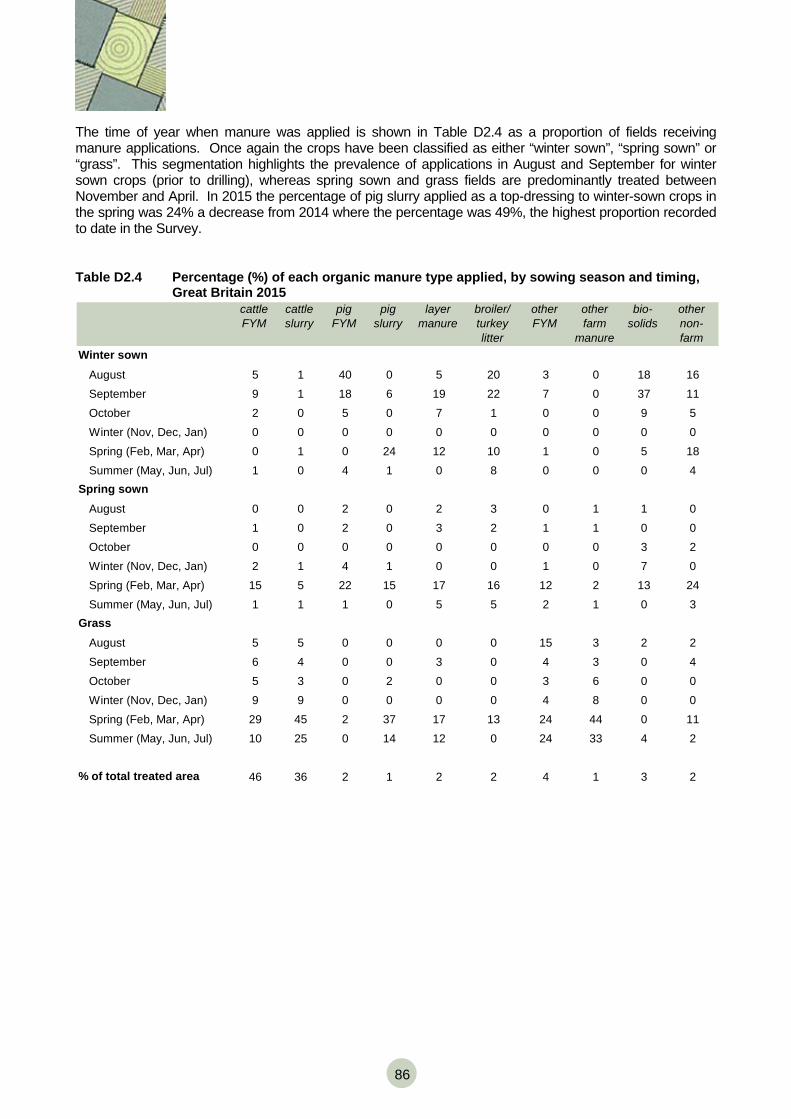
86
The time of year when manure was applied is shown in Table D2.4 as a proportion of fields receiving manure applications. Once again the crops have been classified as either “winter sown”, “spring sown” or “grass”. This segmentation highlights the prevalence of applications in August and September for winter sown crops (prior to drilling), whereas spring sown and grass fields are predominantly treated between November and April. In 2015 the percentage of pig slurry applied as a top-dressing to winter-sown crops in the spring was 24% a decrease from 2014 where the percentage was 49%, the highest proportion recorded to date in the Survey. Table D2.4 Percentage (%) of each organic manure type applied, by sowing season and timing,
Great Britain 2015 cattle FYM
cattle slurry
pig FYM
pig slurry
layermanure
broiler/ turkey litter
otherFYM
otherfarm
manure
bio-solids
othernon-farm
August 5 1 40 0 5 20 3 0 18 16September 9 1 18 6 19 22 7 0 37 11October 2 0 5 0 7 1 0 0 9 5Winter (Nov, Dec, Jan) 0 0 0 0 0 0 0 0 0 0Spring (Feb, Mar, Apr) 0 1 0 24 12 10 1 0 5 18Summer (May, Jun, Jul) 1 0 4 1 0 8 0 0 0 4
August 0 0 2 0 2 3 0 1 1 0September 1 0 2 0 3 2 1 1 0 0October 0 0 0 0 0 0 0 0 3 2Winter (Nov, Dec, Jan) 2 1 4 1 0 0 1 0 7 0Spring (Feb, Mar, Apr) 15 5 22 15 17 16 12 2 13 24Summer (May, Jun, Jul) 1 1 1 0 5 5 2 1 0 3
August 5 5 0 0 0 0 15 3 2 2September 6 4 0 0 3 0 4 3 0 4October 5 3 0 2 0 0 3 6 0 0Winter (Nov, Dec, Jan) 9 9 0 0 0 0 4 8 0 0Spring (Feb, Mar, Apr) 29 45 2 37 17 13 24 44 0 11Summer (May, Jun, Jul) 10 25 0 14 12 0 24 33 4 2
46 36 2 1 2 2 4 1 3 2
Winter sown
Spring sown
Grass
% of total treated area
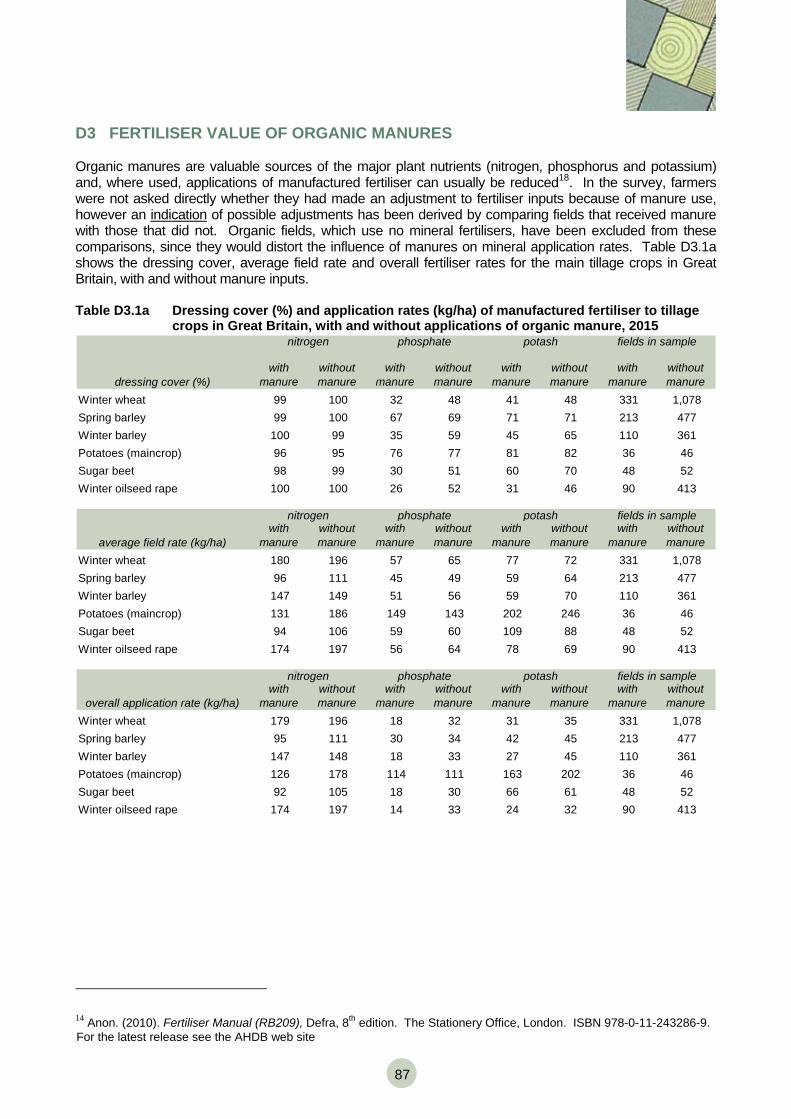
87
D3 FERTILISER VALUE OF ORGANIC MANURES Organic manures are valuable sources of the major plant nutrients (nitrogen, phosphorus and potassium) and, where used, applications of manufactured fertiliser can usually be reduced18. In the survey, farmers were not asked directly whether they had made an adjustment to fertiliser inputs because of manure use, however an indication of possible adjustments has been derived by comparing fields that received manure with those that did not. Organic fields, which use no mineral fertilisers, have been excluded from these comparisons, since they would distort the influence of manures on mineral application rates. Table D3.1a shows the dressing cover, average field rate and overall fertiliser rates for the main tillage crops in Great Britain, with and without manure inputs. Table D3.1a Dressing cover (%) and application rates (kg/ha) of manufactured fertiliser to tillage
crops in Great Britain, with and without applications of organic manure, 2015 nitrogen phosphate potash fields in sample
dressing cover (%)with
manurewithout manure
with manure
without manure
with manure
without manure
with manure
without manure
Winter wheat 99 100 32 48 41 48 331 1,078Spring barley 99 100 67 69 71 71 213 477Winter barley 100 99 35 59 45 65 110 361Potatoes (maincrop) 96 95 76 77 81 82 36 46Sugar beet 98 99 30 51 60 70 48 52Winter oilseed rape 100 100 26 52 31 46 90 413
nitrogen phosphate potash fields in sample
average field rate (kg/ha)with
manurewithout manure
with manure
without manure
with manure
without manure
with manure
without manure
Winter wheat 180 196 57 65 77 72 331 1,078Spring barley 96 111 45 49 59 64 213 477Winter barley 147 149 51 56 59 70 110 361Potatoes (maincrop) 131 186 149 143 202 246 36 46Sugar beet 94 106 59 60 109 88 48 52Winter oilseed rape 174 197 56 64 78 69 90 413
nitrogen phosphate potash fields in sample
overall application rate (kg/ha)with
manurewithout manure
with manure
without manure
with manure
without manure
with manure
without manure
Winter wheat 179 196 18 32 31 35 331 1,078Spring barley 95 111 30 34 42 45 213 477Winter barley 147 148 18 33 27 45 110 361Potatoes (maincrop) 126 178 114 111 163 202 36 46Sugar beet 92 105 18 30 66 61 48 52Winter oilseed rape 174 197 14 33 24 32 90 413
14 Anon. (2010). Fertiliser Manual (RB209), Defra, 8th edition. The Stationery Office, London. ISBN 978-0-11-243286-9. For the latest release see the AHDB web site
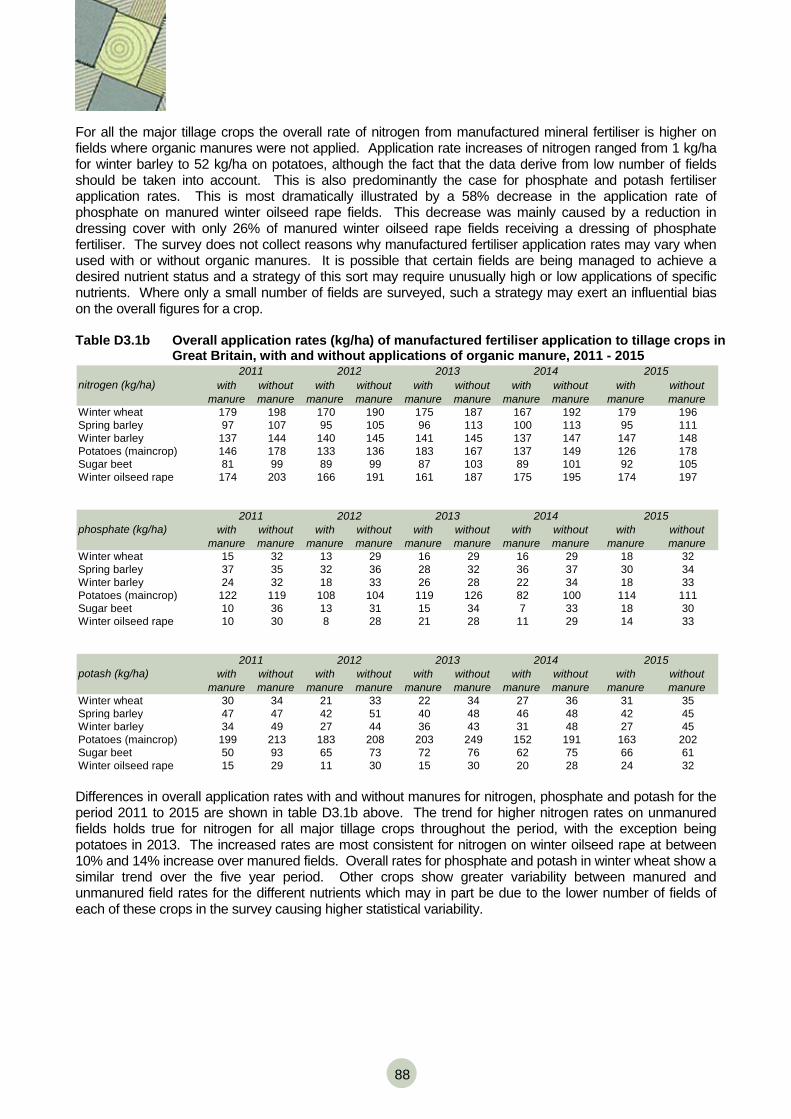
88
For all the major tillage crops the overall rate of nitrogen from manufactured mineral fertiliser is higher on fields where organic manures were not applied. Application rate increases of nitrogen ranged from 1 kg/ha for winter barley to 52 kg/ha on potatoes, although the fact that the data derive from low number of fields should be taken into account. This is also predominantly the case for phosphate and potash fertiliser application rates. This is most dramatically illustrated by a 58% decrease in the application rate of phosphate on manured winter oilseed rape fields. This decrease was mainly caused by a reduction in dressing cover with only 26% of manured winter oilseed rape fields receiving a dressing of phosphate fertiliser. The survey does not collect reasons why manufactured fertiliser application rates may vary when used with or without organic manures. It is possible that certain fields are being managed to achieve a desired nutrient status and a strategy of this sort may require unusually high or low applications of specific nutrients. Where only a small number of fields are surveyed, such a strategy may exert an influential bias on the overall figures for a crop. Table D3.1b Overall application rates (kg/ha) of manufactured fertiliser application to tillage crops in
Great Britain, with and without applications of organic manure, 2011 - 2015
with manure
without manure
with manure
without manure
with manure
without manure
with manure
without manure
with manure
without manure
Winter wheat 179 198 170 190 175 187 167 192 179 196Spring barley 97 107 95 105 96 113 100 113 95 111Winter barley 137 144 140 145 141 145 137 147 147 148Potatoes (maincrop) 146 178 133 136 183 167 137 149 126 178Sugar beet 81 99 89 99 87 103 89 101 92 105Winter oilseed rape 174 203 166 191 161 187 175 195 174 197
with manure
without manure
with manure
without manure
with manure
without manure
with manure
without manure
with manure
without manure
Winter wheat 15 32 13 29 16 29 16 29 18 32Spring barley 37 35 32 36 28 32 36 37 30 34Winter barley 24 32 18 33 26 28 22 34 18 33Potatoes (maincrop) 122 119 108 104 119 126 82 100 114 111Sugar beet 10 36 13 31 15 34 7 33 18 30Winter oilseed rape 10 30 8 28 21 28 11 29 14 33
with manure
without manure
with manure
without manure
with manure
without manure
with manure
without manure
with manure
without manure
Winter wheat 30 34 21 33 22 34 27 36 31 35Spring barley 47 47 42 51 40 48 46 48 42 45Winter barley 34 49 27 44 36 43 31 48 27 45Potatoes (maincrop) 199 213 183 208 203 249 152 191 163 202Sugar beet 50 93 65 73 72 76 62 75 66 61Winter oilseed rape 15 29 11 30 15 30 20 28 24 32
2015
2015
2015
phosphate (kg/ha)
nitrogen (kg/ha)
2014
2011 2012 2013 2014
2011 2012 2013
2011 2012 2013 2014potash (kg/ha)
Differences in overall application rates with and without manures for nitrogen, phosphate and potash for the period 2011 to 2015 are shown in table D3.1b above. The trend for higher nitrogen rates on unmanured fields holds true for nitrogen for all major tillage crops throughout the period, with the exception being potatoes in 2013. The increased rates are most consistent for nitrogen on winter oilseed rape at between 10% and 14% increase over manured fields. Overall rates for phosphate and potash in winter wheat show a similar trend over the five year period. Other crops show greater variability between manured and unmanured field rates for the different nutrients which may in part be due to the lower number of fields of each of these crops in the survey causing higher statistical variability.
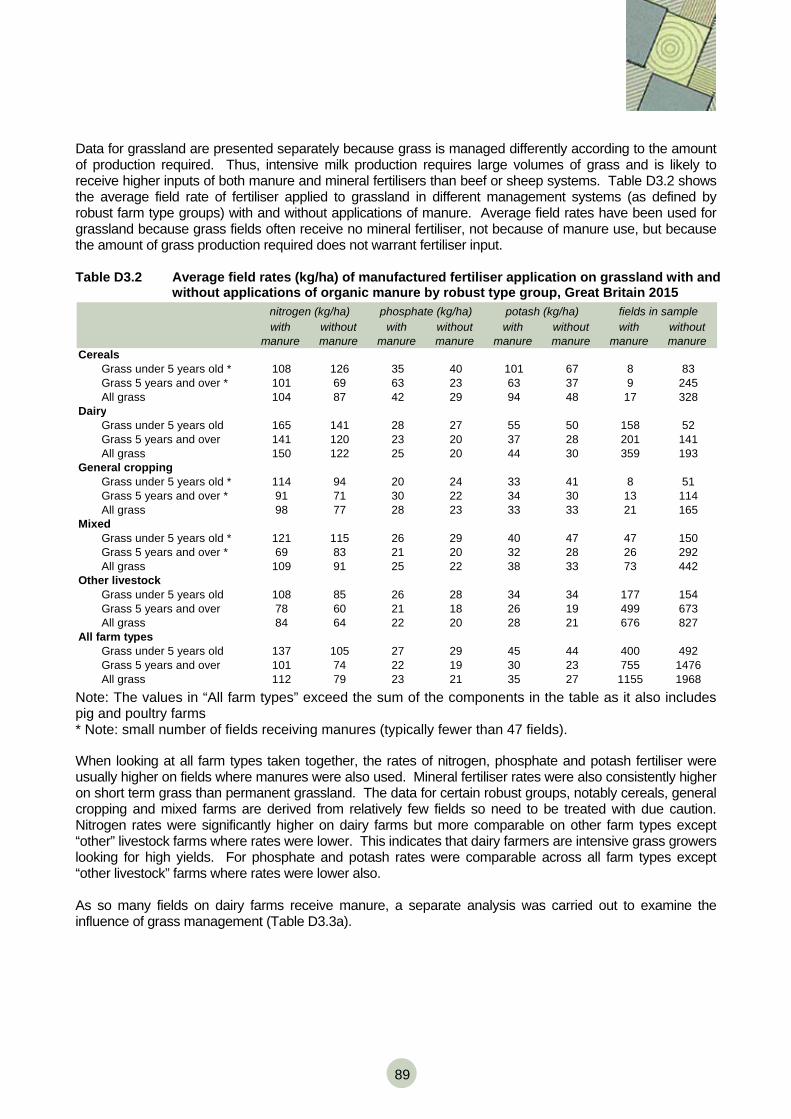
89
Data for grassland are presented separately because grass is managed differently according to the amount of production required. Thus, intensive milk production requires large volumes of grass and is likely to receive higher inputs of both manure and mineral fertilisers than beef or sheep systems. Table D3.2 shows the average field rate of fertiliser applied to grassland in different management systems (as defined by robust farm type groups) with and without applications of manure. Average field rates have been used for grassland because grass fields often receive no mineral fertiliser, not because of manure use, but because the amount of grass production required does not warrant fertiliser input. Table D3.2 Average field rates (kg/ha) of manufactured fertiliser application on grassland with and
without applications of organic manure by robust type group, Great Britain 2015 nitrogen (kg/ha) phosphate (kg/ha) potash (kg/ha) fields in samplewith
manurewithout manure
with manure
without manure
with manure
without manure
with manure
without manure
CerealsGrass under 5 years old * 108 126 35 40 101 67 8 83Grass 5 years and over * 101 69 63 23 63 37 9 245All grass 104 87 42 29 94 48 17 328
DairyGrass under 5 years old 165 141 28 27 55 50 158 52Grass 5 years and over 141 120 23 20 37 28 201 141All grass 150 122 25 20 44 30 359 193
General croppingGrass under 5 years old * 114 94 20 24 33 41 8 51Grass 5 years and over * 91 71 30 22 34 30 13 114All grass 98 77 28 23 33 33 21 165
MixedGrass under 5 years old * 121 115 26 29 40 47 47 150Grass 5 years and over * 69 83 21 20 32 28 26 292All grass 109 91 25 22 38 33 73 442
Other livestockGrass under 5 years old 108 85 26 28 34 34 177 154Grass 5 years and over 78 60 21 18 26 19 499 673All grass 84 64 22 20 28 21 676 827
All farm typesGrass under 5 years old 137 105 27 29 45 44 400 492Grass 5 years and over 101 74 22 19 30 23 755 1476All grass 112 79 23 21 35 27 1155 1968
Note: The values in “All farm types” exceed the sum of the components in the table as it also includes pig and poultry farms * Note: small number of fields receiving manures (typically fewer than 47 fields). When looking at all farm types taken together, the rates of nitrogen, phosphate and potash fertiliser were usually higher on fields where manures were also used. Mineral fertiliser rates were also consistently higher on short term grass than permanent grassland. The data for certain robust groups, notably cereals, general cropping and mixed farms are derived from relatively few fields so need to be treated with due caution. Nitrogen rates were significantly higher on dairy farms but more comparable on other farm types except “other” livestock farms where rates were lower. This indicates that dairy farmers are intensive grass growers looking for high yields. For phosphate and potash rates were comparable across all farm types except “other livestock” farms where rates were lower also. As so many fields on dairy farms receive manure, a separate analysis was carried out to examine the influence of grass management (Table D3.3a).
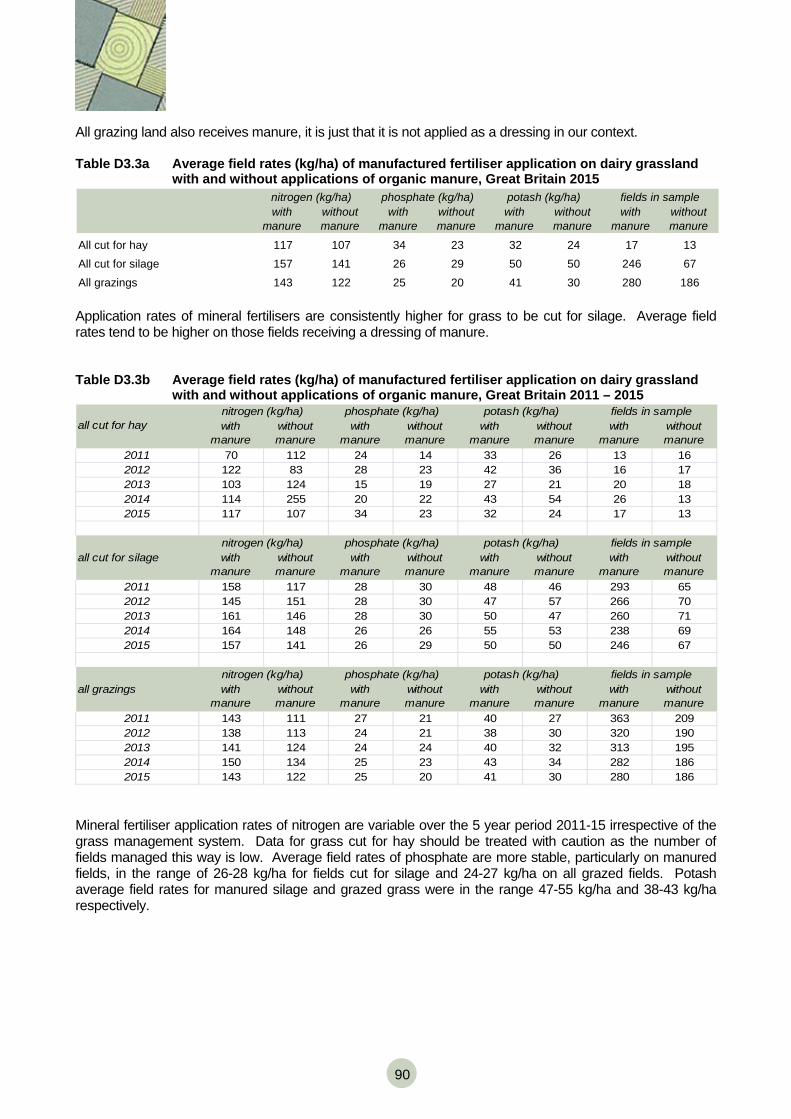
90
All grazing land also receives manure, it is just that it is not applied as a dressing in our context. Table D3.3a Average field rates (kg/ha) of manufactured fertiliser application on dairy grassland
with and without applications of organic manure, Great Britain 2015 nitrogen (kg/ha) phosphate (kg/ha) potash (kg/ha) fields in samplewith
manurewithout manure
with manure
without manure
with manure
without manure
with manure
without manure
All cut for hay 117 107 34 23 32 24 17 13All cut for silage 157 141 26 29 50 50 246 67All grazings 143 122 25 20 41 30 280 186 Application rates of mineral fertilisers are consistently higher for grass to be cut for silage. Average field rates tend to be higher on those fields receiving a dressing of manure. Table D3.3b Average field rates (kg/ha) of manufactured fertiliser application on dairy grassland
with and without applications of organic manure, Great Britain 2011 – 2015
with manure
without manure
with manure
without manure
with manure
without manure
with manure
without manure
2011 70 112 24 14 33 26 13 162012 122 83 28 23 42 36 16 172013 103 124 15 19 27 21 20 182014 114 255 20 22 43 54 26 132015 117 107 34 23 32 24 17 13
with manure
without manure
with manure
without manure
with manure
without manure
with manure
without manure
2011 158 117 28 30 48 46 293 652012 145 151 28 30 47 57 266 702013 161 146 28 30 50 47 260 712014 164 148 26 26 55 53 238 692015 157 141 26 29 50 50 246 67
with manure
without manure
with manure
without manure
with manure
without manure
with manure
without manure
2011 143 111 27 21 40 27 363 2092012 138 113 24 21 38 30 320 1902013 141 124 24 24 40 32 313 1952014 150 134 25 23 43 34 282 1862015 143 122 25 20 41 30 280 186
all cut for silagenitrogen (kg/ha) phosphate (kg/ha) potash (kg/ha) fields in sample
all grazingsnitrogen (kg/ha) phosphate (kg/ha) potash (kg/ha) fields in sample
all cut for haynitrogen (kg/ha) phosphate (kg/ha) potash (kg/ha) fields in sample
Mineral fertiliser application rates of nitrogen are variable over the 5 year period 2011-15 irrespective of the grass management system. Data for grass cut for hay should be treated with caution as the number of fields managed this way is low. Average field rates of phosphate are more stable, particularly on manured fields, in the range of 26-28 kg/ha for fields cut for silage and 24-27 kg/ha on all grazed fields. Potash average field rates for manured silage and grazed grass were in the range 47-55 kg/ha and 38-43 kg/ha respectively.
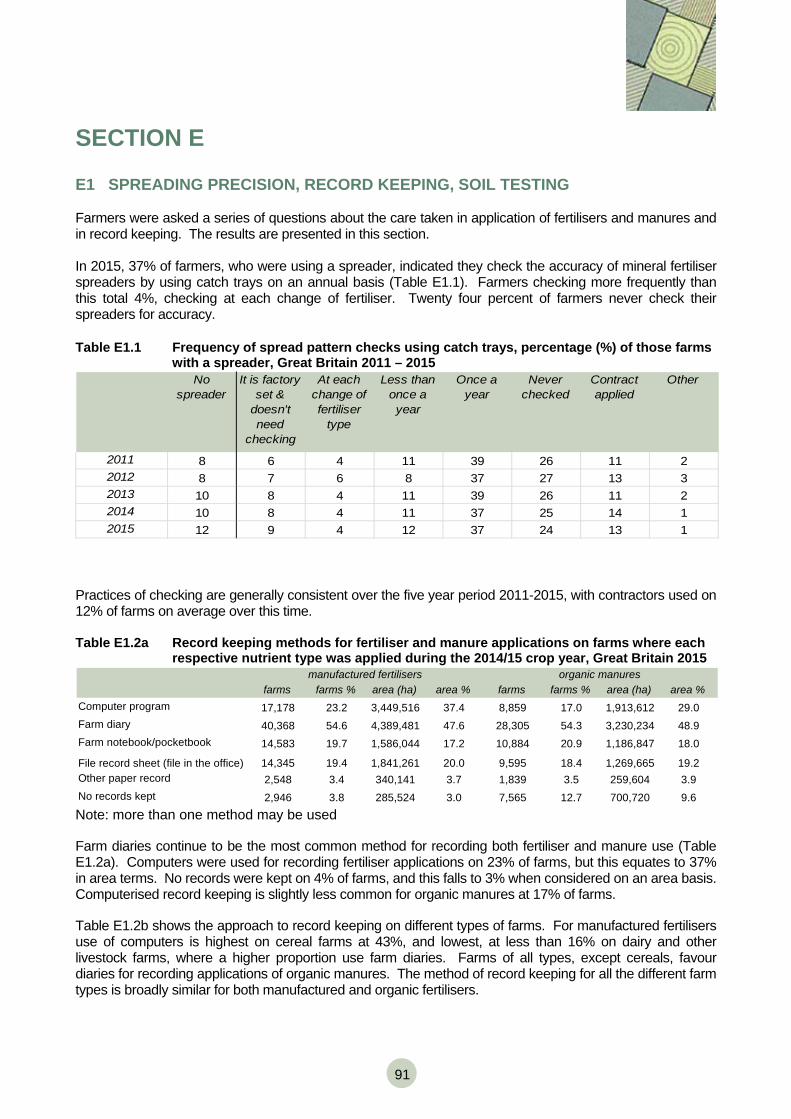
91
SECTION E
E1 SPREADING PRECISION, RECORD KEEPING, SOIL TESTING Farmers were asked a series of questions about the care taken in application of fertilisers and manures and in record keeping. The results are presented in this section. In 2015, 37% of farmers, who were using a spreader, indicated they check the accuracy of mineral fertiliser spreaders by using catch trays on an annual basis (Table E1.1). Farmers checking more frequently than this total 4%, checking at each change of fertiliser. Twenty four percent of farmers never check their spreaders for accuracy.
Table E1.1 Frequency of spread pattern checks using catch trays, percentage (%) of those farms with a spreader, Great Britain 2011 – 2015
No spreader
It is factory set &
doesn't need
checking
At each change of fertiliser
type
Less than once a year
Once a year
Never checked
Contract applied
Other
2011 8 6 4 11 39 26 11 22012 8 7 6 8 37 27 13 32013 10 8 4 11 39 26 11 22014 10 8 4 11 37 25 14 12015 12 9 4 12 37 24 13 1
Practices of checking are generally consistent over the five year period 2011-2015, with contractors used on 12% of farms on average over this time. Table E1.2a Record keeping methods for fertiliser and manure applications on farms where each
respective nutrient type was applied during the 2014/15 crop year, Great Britain 2015 manufactured fertilisers organic manures
farms farms % area (ha) area % farms farms % area (ha) area %Computer program 17,178 23.2 3,449,516 37.4 8,859 17.0 1,913,612 29.0Farm diary 40,368 54.6 4,389,481 47.6 28,305 54.3 3,230,234 48.9Farm notebook/pocketbook 14,583 19.7 1,586,044 17.2 10,884 20.9 1,186,847 18.0
File record sheet (file in the office) 14,345 19.4 1,841,261 20.0 9,595 18.4 1,269,665 19.2Other paper record 2,548 3.4 340,141 3.7 1,839 3.5 259,604 3.9No records kept 2,946 3.8 285,524 3.0 7,565 12.7 700,720 9.6
Note: more than one method may be used Farm diaries continue to be the most common method for recording both fertiliser and manure use (Table E1.2a). Computers were used for recording fertiliser applications on 23% of farms, but this equates to 37% in area terms. No records were kept on 4% of farms, and this falls to 3% when considered on an area basis. Computerised record keeping is slightly less common for organic manures at 17% of farms. Table E1.2b shows the approach to record keeping on different types of farms. For manufactured fertilisers use of computers is highest on cereal farms at 43%, and lowest, at less than 16% on dairy and other livestock farms, where a higher proportion use farm diaries. Farms of all types, except cereals, favour diaries for recording applications of organic manures. The method of record keeping for all the different farm types is broadly similar for both manufactured and organic fertilisers.
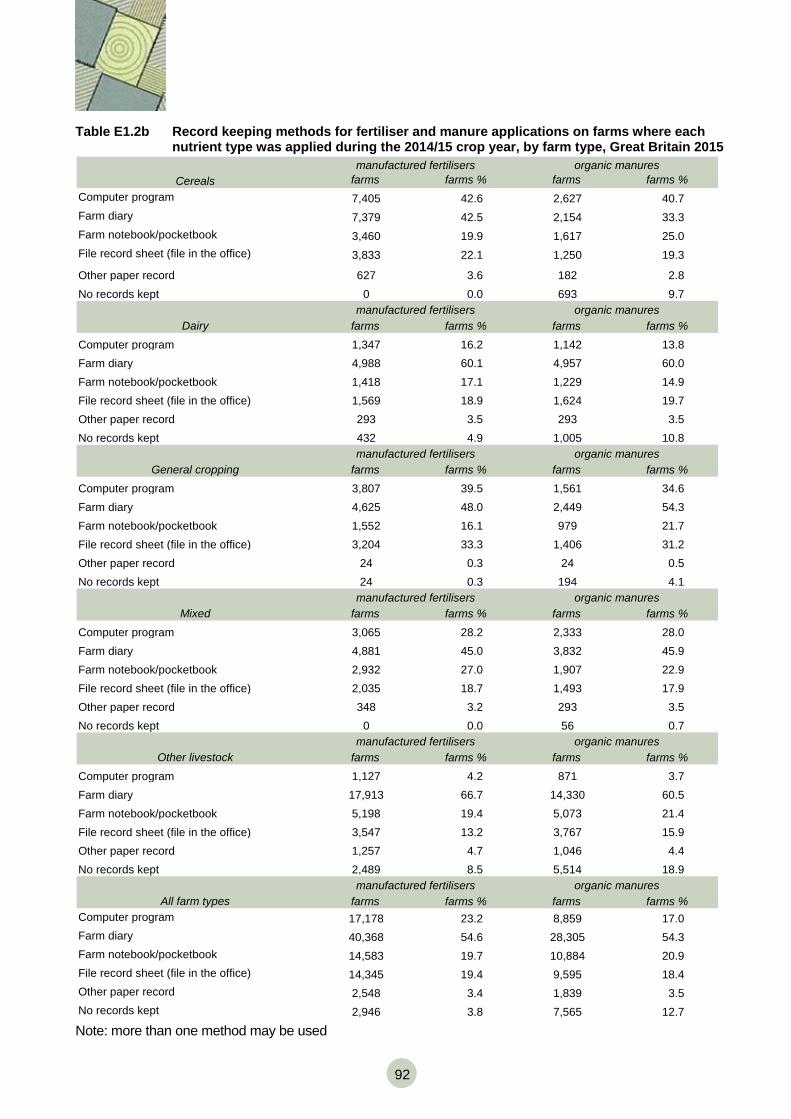
92
Table E1.2b Record keeping methods for fertiliser and manure applications on farms where each nutrient type was applied during the 2014/15 crop year, by farm type, Great Britain 2015
manufactured fertilisers organic manuresfarms farms % farms farms %
Computer program 7,405 42.6 2,627 40.7Farm diary 7,379 42.5 2,154 33.3Farm notebook/pocketbook 3,460 19.9 1,617 25.0File record sheet (file in the office) 3,833 22.1 1,250 19.3
Other paper record 627 3.6 182 2.8No records kept 0 0.0 693 9.7
manufactured fertilisers organic manuresfarms farms % farms farms %
Computer program 1,347 16.2 1,142 13.8Farm diary 4,988 60.1 4,957 60.0Farm notebook/pocketbook 1,418 17.1 1,229 14.9File record sheet (file in the office) 1,569 18.9 1,624 19.7Other paper record 293 3.5 293 3.5No records kept 432 4.9 1,005 10.8
manufactured fertilisers organic manuresfarms farms % farms farms %
Computer program 3,807 39.5 1,561 34.6Farm diary 4,625 48.0 2,449 54.3Farm notebook/pocketbook 1,552 16.1 979 21.7File record sheet (file in the office) 3,204 33.3 1,406 31.2Other paper record 24 0.3 24 0.5No records kept 24 0.3 194 4.1
manufactured fertilisers organic manuresfarms farms % farms farms %
Computer program 3,065 28.2 2,333 28.0Farm diary 4,881 45.0 3,832 45.9Farm notebook/pocketbook 2,932 27.0 1,907 22.9File record sheet (file in the office) 2,035 18.7 1,493 17.9Other paper record 348 3.2 293 3.5No records kept 0 0.0 56 0.7
manufactured fertilisers organic manuresfarms farms % farms farms %
Computer program 1,127 4.2 871 3.7Farm diary 17,913 66.7 14,330 60.5Farm notebook/pocketbook 5,198 19.4 5,073 21.4File record sheet (file in the office) 3,547 13.2 3,767 15.9Other paper record 1,257 4.7 1,046 4.4No records kept 2,489 8.5 5,514 18.9
manufactured fertilisers organic manuresfarms farms % farms farms %
Computer program 17,178 23.2 8,859 17.0Farm diary 40,368 54.6 28,305 54.3Farm notebook/pocketbook 14,583 19.7 10,884 20.9File record sheet (file in the office) 14,345 19.4 9,595 18.4Other paper record 2,548 3.4 1,839 3.5No records kept 2,946 3.8 7,565 12.7
Cereals
Dairy
General cropping
Mixed
Other livestock
All farm types
Note: more than one method may be used
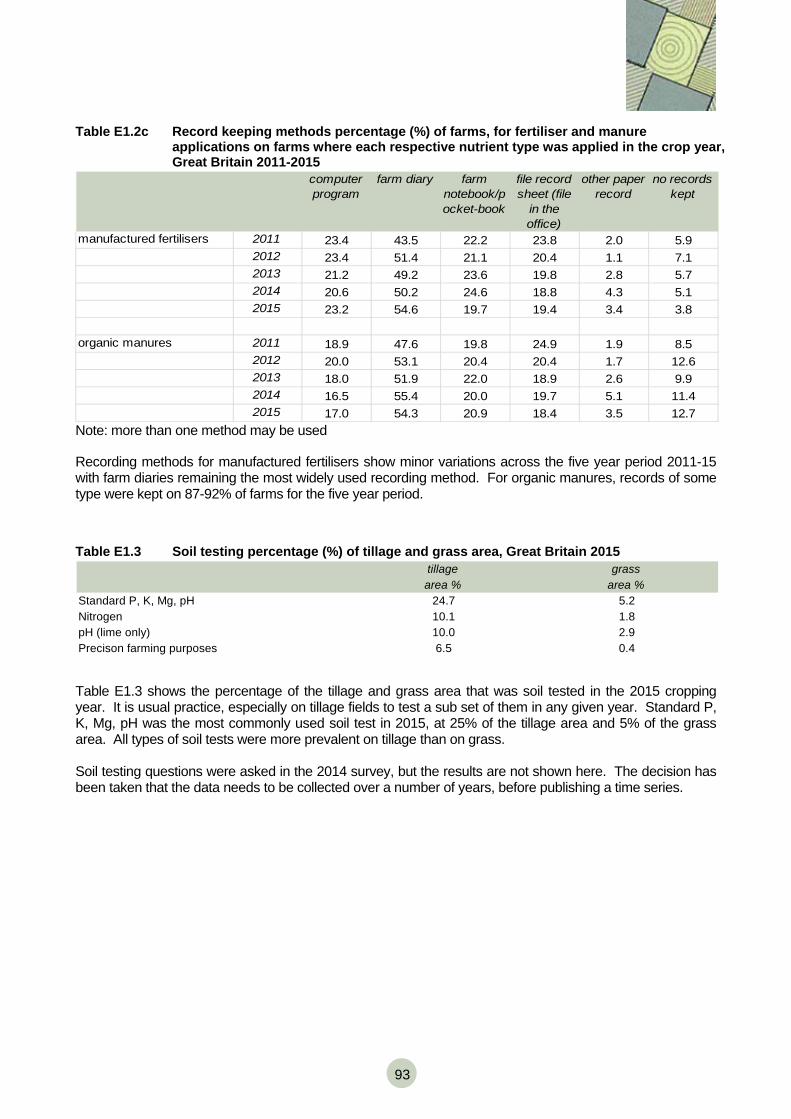
93
Table E1.2c Record keeping methods percentage (%) of farms, for fertiliser and manure applications on farms where each respective nutrient type was applied in the crop year, Great Britain 2011-2015
computer program
farm diary farm notebook/pocket-book
file record sheet (file
in the office)
other paper record
no records kept
manufactured fertilisers 2011 23.4 43.5 22.2 23.8 2.0 5.92012 23.4 51.4 21.1 20.4 1.1 7.12013 21.2 49.2 23.6 19.8 2.8 5.72014 20.6 50.2 24.6 18.8 4.3 5.12015 23.2 54.6 19.7 19.4 3.4 3.8
organic manures 2011 18.9 47.6 19.8 24.9 1.9 8.52012 20.0 53.1 20.4 20.4 1.7 12.62013 18.0 51.9 22.0 18.9 2.6 9.92014 16.5 55.4 20.0 19.7 5.1 11.42015 17.0 54.3 20.9 18.4 3.5 12.7
Note: more than one method may be used Recording methods for manufactured fertilisers show minor variations across the five year period 2011-15 with farm diaries remaining the most widely used recording method. For organic manures, records of some type were kept on 87-92% of farms for the five year period.
Table E1.3 Soil testing percentage (%) of tillage and grass area, Great Britain 2015
tillage grassarea % area %
Standard P, K, Mg, pH 24.7 5.2Nitrogen 10.1 1.8pH (lime only) 10.0 2.9Precison farming purposes 6.5 0.4
Table E1.3 shows the percentage of the tillage and grass area that was soil tested in the 2015 cropping year. It is usual practice, especially on tillage fields to test a sub set of them in any given year. Standard P, K, Mg, pH was the most commonly used soil test in 2015, at 25% of the tillage area and 5% of the grass area. All types of soil tests were more prevalent on tillage than on grass. Soil testing questions were asked in the 2014 survey, but the results are not shown here. The decision has been taken that the data needs to be collected over a number of years, before publishing a time series.
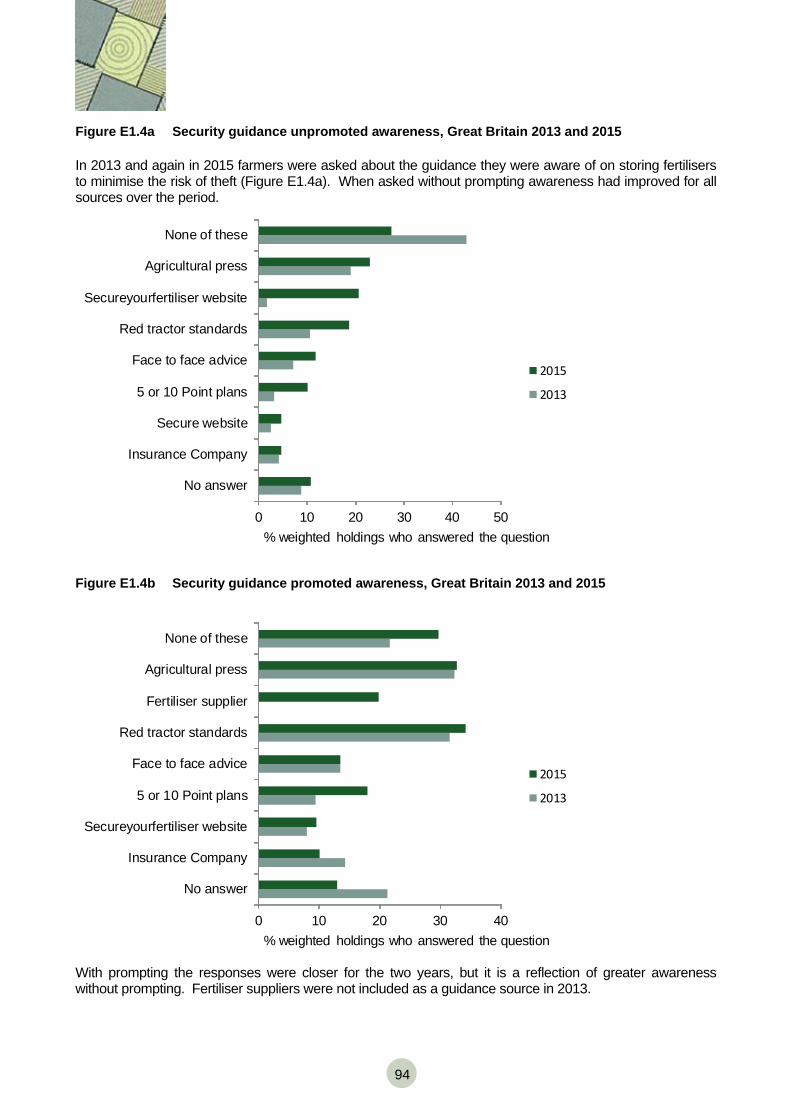
94
Figure E1.4a Security guidance unpromoted awareness, Great Britain 2013 and 2015 In 2013 and again in 2015 farmers were asked about the guidance they were aware of on storing fertilisers to minimise the risk of theft (Figure E1.4a). When asked without prompting awareness had improved for all sources over the period.
0 10 20 30 40 50
No answer
Insurance Company
Secure website
5 or 10 Point plans
Face to face advice
Red tractor standards
Secureyourfertiliser website
Agricultural press
None of these
% weighted holdings who answered the question
2015
2013
Figure E1.4b Security guidance promoted awareness, Great Britain 2013 and 2015
0 10 20 30 40
No answer
Insurance Company
Secureyourfertiliser website
5 or 10 Point plans
Face to face advice
Red tractor standards
Fertiliser supplier
Agricultural press
None of these
% weighted holdings who answered the question
2015
2013
With prompting the responses were closer for the two years, but it is a reflection of greater awareness without prompting. Fertiliser suppliers were not included as a guidance source in 2013.
95
APPENDIX 1 - SURVEY STATISTICS
APP 1.1 SAMPLING VARIATION Table App 1.1 Standard errors of application rates for the major crops in 2015
fields insample
total strt comp total total total total strt comp total total totalN N N P 2 O 5 K 2 O SO 3 N N N P 2 O 5 K 2 O SO 3
winter wheat 2.2 2.5 1.1 1.4 1.6 1.3 2.0 2.1 5.2 1.6 1.7 1.5 1429oilseed rape 2.6 2.6 0.9 1.8 2.1 2.5 2.6 2.5 2.9 2.0 2.5 2.3 506winter barley 2.3 2.7 1.4 1.8 2.4 1.8 2.1 2.2 5.1 1.9 2.5 2.1 474spring barley 1.8 2.4 1.7 1.3 1.6 1.2 1.7 2.0 2.0 1.3 1.6 1.8 708m/c potatoes 8.8 9.3 10.0 9.7 14.6 10.7 7.3 11.9 9.6 8.5 12.2 37.3 84sugar beet 4.0 4.0 2.3 4.7 6.0 7.2 3.6 3.1 7.8 8.0 6.5 13.3 100all tillage crops 2.0 2.3 1.0 0.9 1.2 1.0 1.9 1.9 1.8 1.2 1.5 1.7 4547all grass 1.8 1.5 1.1 0.4 0.6 0.3 1.9 2.4 1.7 0.8 1.2 1.9 3332
fields insample
total strt comp total total total total strt comp total total totalN N N P 2 O 5 K 2 O SO 3 N N N P 2 O 5 K 2 O SO 3
winter wheat 2.4 2.6 1.1 1.4 1.6 1.4 2.1 2.3 5.6 1.7 1.8 1.5 1312oilseed rape 2.7 2.8 1.0 1.8 2.1 2.6 2.7 2.6 3.6 2.2 2.7 2.4 468winter barley 2.4 2.9 1.5 1.8 2.5 1.8 2.3 2.3 5.9 2.1 2.9 2.1 417spring barley 2.3 2.8 1.8 1.4 1.9 1.5 2.1 2.2 2.7 1.7 2.2 2.1 452m/c potatoes 9.6 9.8 10.8 10.6 15.7 6.7 8.2 11.9 10.7 9.6 13.6 20.5 74sugar beet 4.0 4.0 2.3 4.8 6.0 6.5 3.7 3.1 7.8 8.2 6.6 12.0 99all tillage crops 2.2 2.5 1.0 1.0 1.3 1.0 2.1 2.0 2.4 1.5 1.9 1.4 3920all grass 2.0 1.7 1.1 0.4 0.7 0.4 2.2 2.7 2.1 1.0 1.6 2.1 2679
fields insample
total strt comp total total total total strt comp total total totalN N N P 2 O 5 K 2 O SO 3 N N N P 2 O 5 K 2 O SO 3
winter wheat 5.0 7.1 5.3 4.8 5.5 5.7 5.0 5.9 13.2 4.1 4.8 6.4 117oilseed rape 5.6 4.7 3.3 6.7 7.1 10.1 5.6 4.7 2.8 4.9 5.8 8.0 38winter barley 6.1 7.7 4.4 5.1 5.7 6.4 6.1 7.1 9.2 4.6 4.8 7.2 57spring barley 3.0 3.7 3.1 1.9 2.4 2.1 2.7 3.3 2.9 1.7 2.2 3.7 256all potatoes 19.1 20.1 19.4 16.7 28.2 37.7 15.5 34.3 18.2 12.5 23.1 110.1 19all tillage crops 3.8 4.8 2.9 2.0 2.4 2.7 3.7 5.0 2.8 1.9 2.3 8.0 627all grass 3.8 3.1 2.9 0.8 1.2 0.8 3.6 5.3 3.1 1.0 1.7 4.0 653
England & Wales standard errors for overallapplication rates (kg/ha)
standard error for averagefield rates (kg/ha)
Great Britain standard errors for overallapplication rates (kg/ha)
standard error for averagefield rates (kg/ha)
Scotland standard errors for overallapplication rates (kg/ha)
standard error for averagefield rates (kg/ha)
The standard errors quoted in Table App 1.1 are a measure of the standard deviation of the mean, and are used to judge the accuracy of the results for each cell in the table. This is a standard statistical process where the standard deviation of each cell is calculated first and then divided by the square root of the number of data points within that cell. Approximate 95% confidence limits will be the quoted value +/- 2 standard errors.
96
APP 1.2 RESPONSE RATE Tables App 1.2 and App 1.3 summarise information regarding the response received to the main and reserve samples. Table App 1.2 Response to main and reserve samples in 2015 2015 % total Target sample 1500 100
2014 panellists agreeing to re-contact in 2015 1284 86
Achieved ‘Main’ sample from 2014 panel 923 62
Achieved additional ‘Main’ sample 166 11
Achieved ‘1st reserve’ sample 137 9
Achieved ‘2nd reserve’ sample 74 5
Achieved ‘3rd reserve’ sample 43 3
Total achieved 1343 90
Total number of refusals/non-contact 1211
Total number of farms approached 2554 Table App 1.3 Response to main and reserve samples for 2011 - 2015
a includes late submission, contributed enough and incorrect telephone number Farms in the >200ha size band are oversampled by 25%, which has the effect of increasing response rates.
Net response rate 2011 2012 2013 2014 2015 % % % % %
Overall achieved rate 95 94 91 91 90
Achieved % of total contact attempts 59 53 51 52 53
Main sample 81 82 78 76 81
Reserve sample(s) 19 18 12 14 19
Main reason for refusal 2011 2012 2013 2014 2015 % % % % %Too busy 20 22 25 22 17
Not interested 13 13 16 17 14
Do not do surveys 4 4 5 5 4
Want payment 0 0 1 0 0
Too much paperwork 1 0 1 1 1
Non contact 40 41 32 41 45
Other a 22 20 20 13 20
97
APP 1.3 INFORMATION ON HOLDINGS BELOW 20 HECTARES
Holdings of less than 20 hectares in size are excluded from the BSFP sample. These smaller farms account for a significant proportion of the number of holdings but a much smaller proportion of the area of crops and grass. At Great Britain level, the total number of holdings in the population for 2014 was 190,422. Holdings below 20 hectares accounted for 4% of the total crop area and 10% of the total grass area; this was unchanged from the previous year. Further detailed information for Great Britain is provided in the table below on the equivalent crop or grassland areas and number of holdings for those holdings where the total size of the farm is below 20 hectares.
Note: Includes bare fallow and uncropped land.
2014 Total area (ha)
Total no. holdings area>0
Area (ha) <20ha
No. of holdings
with <20ha
Proportion of area <20ha
Proportion of
holdings <20ha
No. of holdings with zero
area
Total no. holdings
Total croppable area 6,081,277
89,063
243,212
39,100 4% 44%
101,359
190,422
of which crops 4,831,583
65,604
183,005
27,595 4% 42%
124,818 190,422
of which temporary grass< 5 years old
1,249,694
56,507
259,387
37,809 21% 67%
133,915 190,422
Total grass 6,432,148
160,700
615,355
86,069 10% 54%
29,722 190,422
grass < 5 years old 1,249,694
56,507
259,387
37,809 21% 67%
133,915 190,422
grass ≥ 5 years old 5,182,454
152,827
619,437
87,873 12% 57%
37,595 190,422
98
APPENDIX 2
APP 2.1 ENGLISH COUNTIES WITHIN BSFP AND DEFRA REGIONS
List of English counties indicating the BSFP and Government Office Regions within which they fall.
County BSFP REGION GOR 1 Bedfordshire Anglia Eastern 2 Berkshire South-East South East 3 Buckinghamshire South-East South East 4 Cleveland North-East North East 5 Cambridgeshire Anglia Eastern 6 Cheshire North Mercia North West 7 Cornwall South-West South West 8 Cumbria Northern North West 9 Derbyshire East Midlands East Midlands 10 Devon South-West South West 11 Dorset Wessex South West 12 Durham North-East North East 13 Essex Anglia Eastern 14 Gloucestershire South Mercia South West 15 Hampshire South-East South East 16 Isle of Wight South-East South East 17 Hereford & Worcester South Mercia West Midlands 18 Hertfordshire Anglia Eastern 20 Kent South-East South East 21 Lancashire Northern North West 22 Leicestershire East Midlands East Midlands 24 Lincolnshire Eastern East Midlands 25 Merseyside North Mercia North West 26/27 Greater London(E) South-East London 28 Norfolk Anglia Eastern 29 Northamptonshire East Midlands East Midlands 30 Tyne and Wear Northern North East 31 Northumberland Northern North East 32 Nottinghamshire East Midlands East Midlands 33 Oxfordshire South-East South East 34 N Somerset and S Gloucestershire Wessex South West 35 Shropshire North Mercia West Midlands 36 Somerset Wessex South West 37 Staffordshire North Mercia West Midlands 38 Suffolk Anglia Eastern 39 Isles of Scilly 40 Surrey South-East South East 41 East Sussex South-East South East 42 West Sussex South-East South East 43 Warwickshire South Mercia West Midlands 44 Greater Manchester North Mercia North West 45 Wiltshire Wessex South West 46 West Midlands South Mercia West Midlands 47 South Yorkshire North-East Yorkshire and the Humber 48 North Yorkshire (Northallerton) North-East Yorkshire and the Humber 49 West Yorkshire North-East Yorkshire and the Humber 50 North Yorkshire (Beverley) North-East Yorkshire and the Humber 51 East Riding of Yorks and North Lincs North-East Yorkshire and the Humber
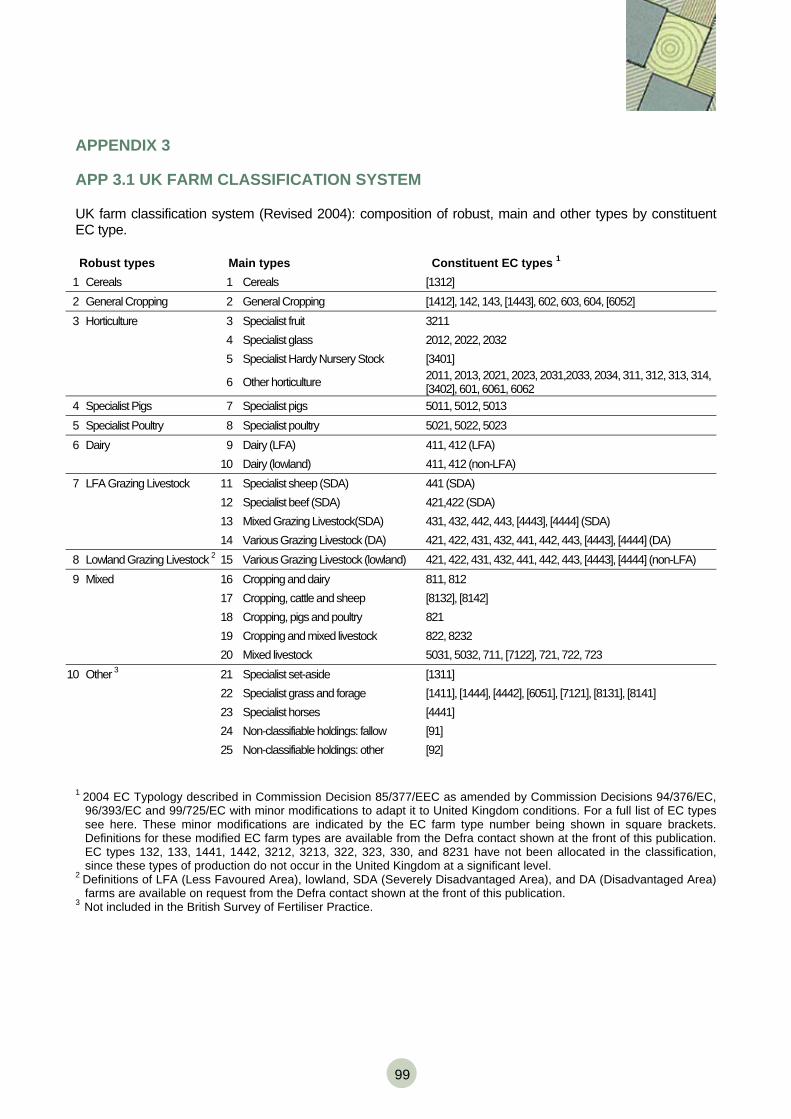
99
APPENDIX 3
APP 3.1 UK FARM CLASSIFICATION SYSTEM UK farm classification system (Revised 2004): composition of robust, main and other types by constituent EC type. Robust types Main types Constituent EC types 1
1 Cereals 1 Cereals [1312] 2 General Cropping 2 General Cropping [1412], 142, 143, [1443], 602, 603, 604, [6052] 3 Horticulture 3 Specialist fruit 3211
4 Specialist glass 2012, 2022, 2032 5 Specialist Hardy Nursery Stock [3401]
6 Other horticulture 2011, 2013, 2021, 2023, 2031,2033, 2034, 311, 312, 313, 314, [3402], 601, 6061, 6062
4 Specialist Pigs 7 Specialist pigs 5011, 5012, 5013 5 Specialist Poultry 8 Specialist poultry 5021, 5022, 5023 6 Dairy 9 Dairy (LFA) 411, 412 (LFA)
10 Dairy (lowland) 411, 412 (non-LFA) 7 LFA Grazing Livestock 11 Specialist sheep (SDA) 441 (SDA)
12 Specialist beef (SDA) 421,422 (SDA) 13 Mixed Grazing Livestock(SDA) 431, 432, 442, 443, [4443], [4444] (SDA) 14 Various Grazing Livestock (DA) 421, 422, 431, 432, 441, 442, 443, [4443], [4444] (DA) 8 Lowland Grazing Livestock 2 15 Various Grazing Livestock (lowland) 421, 422, 431, 432, 441, 442, 443, [4443], [4444] (non-LFA) 9 Mixed 16 Cropping and dairy 811, 812
17 Cropping, cattle and sheep [8132], [8142] 18 Cropping, pigs and poultry 821 19 Cropping and mixed livestock 822, 8232 20 Mixed livestock 5031, 5032, 711, [7122], 721, 722, 723 10 Other 3 21 Specialist set-aside [1311] 22 Specialist grass and forage [1411], [1444], [4442], [6051], [7121], [8131], [8141] 23 Specialist horses [4441] 24 Non-classifiable holdings: fallow [91] 25 Non-classifiable holdings: other [92]
1 2004 EC Typology described in Commission Decision 85/377/EEC as amended by Commission Decisions 94/376/EC,
96/393/EC and 99/725/EC with minor modifications to adapt it to United Kingdom conditions. For a full list of EC types see here. These minor modifications are indicated by the EC farm type number being shown in square brackets. Definitions for these modified EC farm types are available from the Defra contact shown at the front of this publication. EC types 132, 133, 1441, 1442, 3212, 3213, 322, 323, 330, and 8231 have not been allocated in the classification, since these types of production do not occur in the United Kingdom at a significant level.
2 Definitions of LFA (Less Favoured Area), lowland, SDA (Severely Disadvantaged Area), and DA (Disadvantaged Area) farms are available on request from the Defra contact shown at the front of this publication.
3 Not included in the British Survey of Fertiliser Practice.