Embed Size (px)
Citation preview
BBBBritish Columbia Osteoarthritis Survey
A joint initiative of:
British Columbia Ministry of Health The Arthritis Society, BC & Yukon Division
Arthritis Research Centre of Canada Prepared by:
Linda Li
Assistant Professor, Department of Physical Therapy, University of British Columbia Harold Robinson/Arthritis Society Chair in Arthritic Diseases Research Scientist, Arthritis Research Centre of Canada
Financial support provided by Healthy Heart Society, and The Arthritis
Society, BC & Yukon Division
BC Osteoarthritis Survey; January 2008
i
CCCContents
RRRResearch Team .............................................................................................................................. iii
LLLList of Acronyms ........................................................................................................................... iv
EEEExecutive Summary ........................................................................................................................ v
Chapter 1: IIIIntroduction ............................................................................................................ 1
Objectives ................................................................................................................................................ 1
Chapter 2: PPPPilot Study ............................................................................................................... 2
Survey Administration and Process Evaluation .................................................................................. 2
Summary of Results ................................................................................................................................ 2
Chapter 3: BBBBritish Columbia Osteoarthritis Survey – Methods .............................................. 3
Sample Selection ..................................................................................................................................... 3
Questionnaire .......................................................................................................................................... 3
Survey Administration ........................................................................................................................... 4
Analysis .................................................................................................................................................... 4
Chapter 4: RRRResults ..................................................................................................................... 8
Participant Characteristics .................................................................................................................... 8
Work and Osteoarthritis ...................................................................................................................... 16
Use of Health Services and Treatments .............................................................................................. 17 Health professional visits .................................................................................................................. 17
Medications, supplements, and non-pharmacological treatments .................................................. 21
Participation in exercises and physical activities ............................................................................. 24
Community Services for Self-Management ...................................................................................... 26
Joint replacement surgeries .............................................................................................................. 27
Did People with Osteoarthritis Receive the Treatment They Needed? ........................................... 29
Chapter 5: CCCConclusion ............................................................................................................ 30
Recommendations ................................................................................................................................. 31
RRRReferences ..................................................................................................................................... 33
AAAAppendix A: BC Osteoarthritis Survey Questionnaire ......................................................... 37
BC Osteoarthritis Survey; January 2008
ii
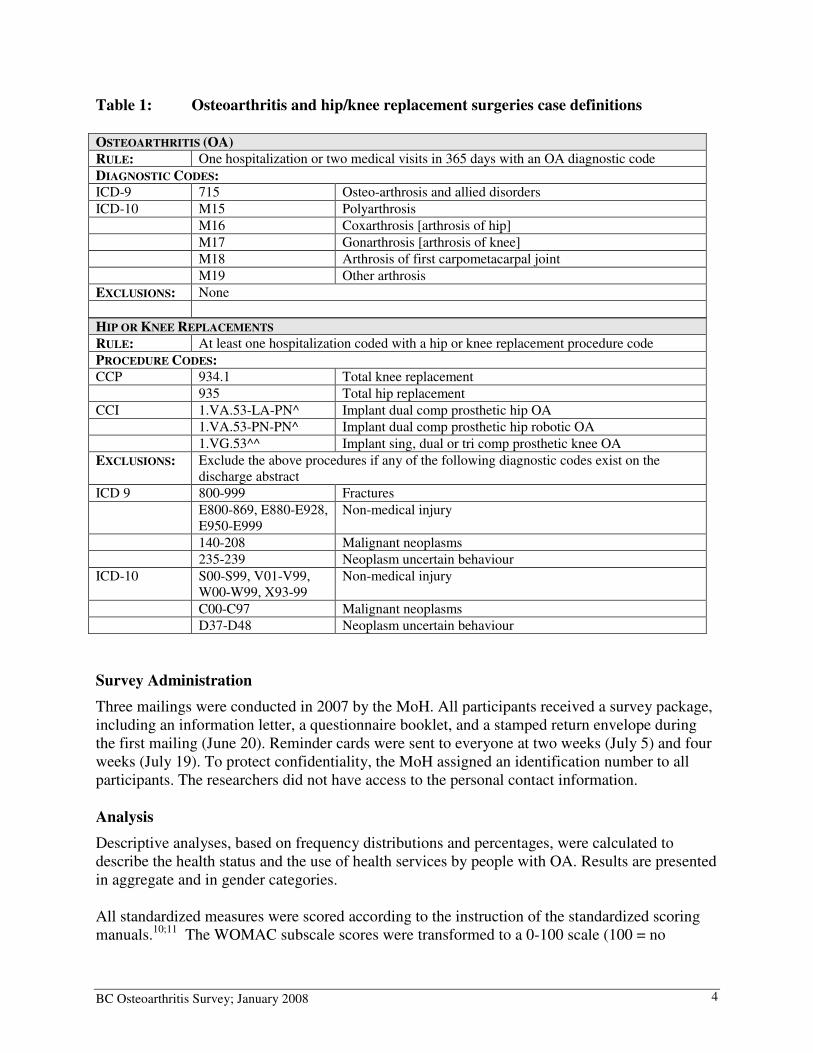
List of Tables Table 1: Osteoarthritis and hip/knee replacement surgeries case definitions ........................... 4
Table 2: Criteria for meeting a quality indicator for osteoarthritis and the corresponding items
on the questionnaire ........................................................................................................................ 6
Table 3: Survey response by health authority ........................................................................... 8
Table 4: Participant characteristics (N = 1713)......................................................................... 9
Table 5: Health profile of participants with osteoarthritis (N = 1713) ................................... 10
Table 6: Pain in hip or knee during activities in the past 4 weeks (N = 1349) ....................... 11
Table 7: Joint stiffness in hip or knee in the past four weeks (N = 1349) .............................. 12
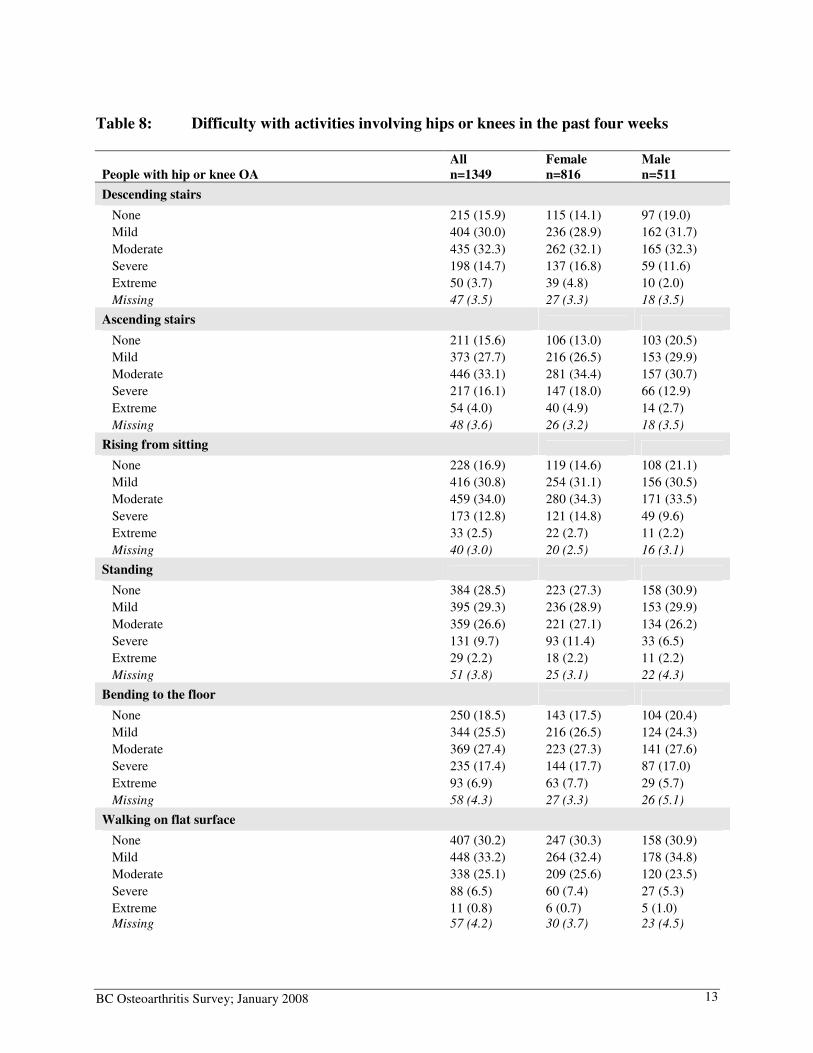
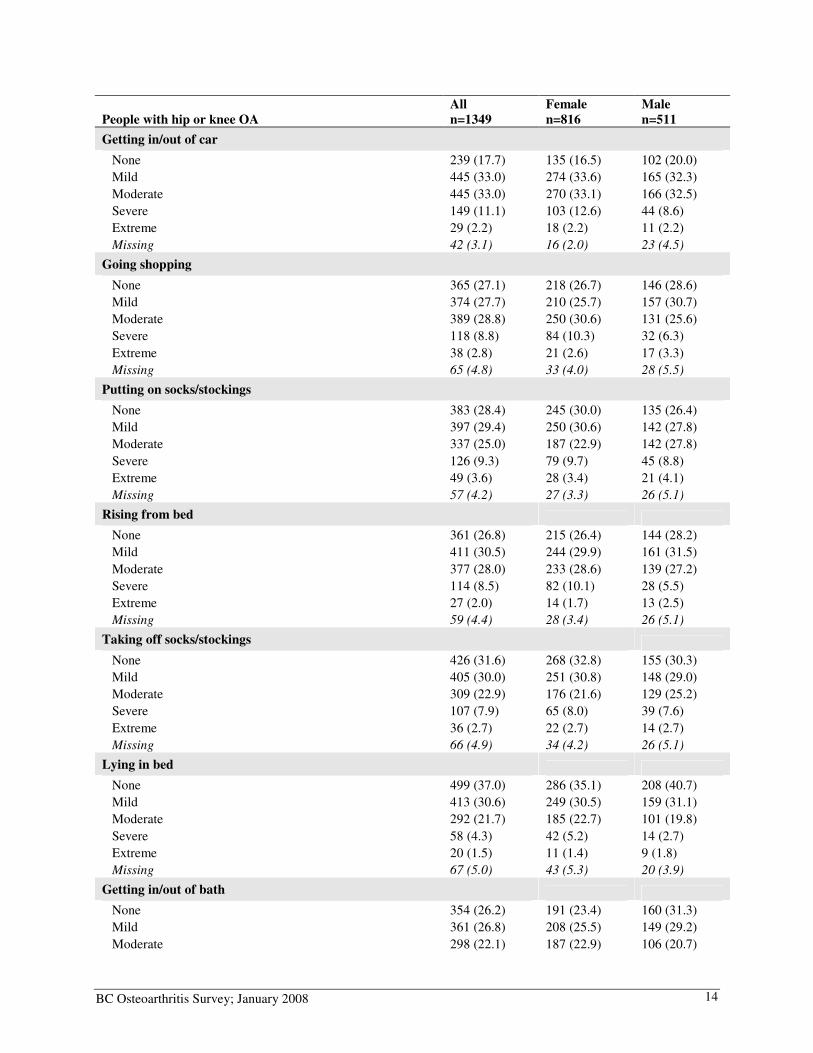
Table 8: Difficulty with activities involving hips or knees in the past four weeks ................. 13
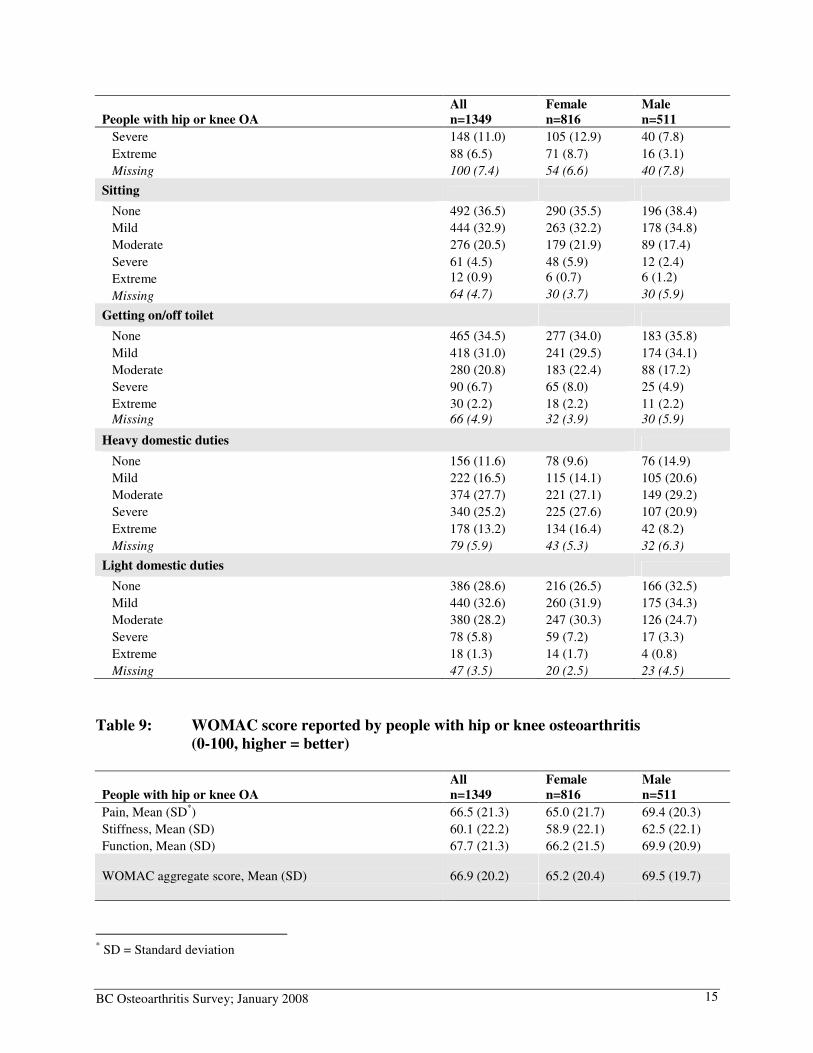
Table 9: WOMAC score reported by people with hip or knee osteoarthritis ......................... 15
Table 10: Work and arthritis ..................................................................................................... 16
Table 11: Health professional visits .......................................................................................... 17
Table 12: Satisfaction with health professionals in managing osteoarthritis ............................ 18
Table 13: Problems experienced with health services .............................................................. 19
Table 14: Use of drugs and non-pharmacological treatments for OA in the past year ............. 22
Table 15: Use of complementary and alternative therapies for OA in the past 6 months ........ 23
Table 16: Time spent on exercise and physical activities in the past week .............................. 25
Table 17: Community programs used by people with osteoarthritis ........................................ 26
Table 18: Self-reported confidence in managing osteoarthritis ................................................ 27
Table 19: Access to Joint Replacement Surgery ....................................................................... 28
Table 20: Quality of Osteoarthritis Care ................................................................................... 29
BC Osteoarthritis Survey; January 2008
iii
RRRResearch Team
Linda Li, PT, PhD Assistant Professor, Harold Robinson/Arthritis Society Chair in Arthritic Diseases, Department of Physical Therapy, Faculty of Medicine, University of British Columbia Research Scientist, Arthritis Research Centre of Canada Jacek Kopec, MD, PhD Research Scientist, Arthritis Research Centre of Canada Associate Professor, Health Care & Epidemiology, University of British Columbia Jolanda Cibere, MD, MPH, FRCPC, PhD Research Scientist, Arthritis Research Centre of Canada Assistant Professor, Division of Rheumatology, Faculty of Medicine, University of British Columbia John Esdaile, MD, MPH, FRCPC Scientific Director, Arthritis Research Centre of Canada
Professor of Medicine, Division of Rheumatology, Faculty of Medicine, University of British Columbia
Research Trainees and Staff
Anamaria Jones, PT, PhD Candidate São Paulo Federal University, Brazil Visiting Student, Arthritis Research Centre of Canada Eric Sayre, PhD Candidate Statistical Analyst, Arthritis Research Centre of Canada
Christopher Drozda, MA Project Coordinator, Arthritis Research Centre of Canada Katie Rogers Research Assistant, Arthritis Research Centre of Canada
BC Osteoarthritis Survey; January 2008
iv
LLLList of Acronyms
ACR American College of Rheumatology
ARC Arthritis Research Centre of Canada
ASMP Arthritis Self Management Program
BMI Body Mass Index
EQ-5D EuroQol Instrument
HSDA Health Service Delivery Area
MoH Ministry of Health
MCS SF-36 Mental Component Summary
MSM Methylsulfonylmethane
NSAID Non-steroidal anti-inflammatory drugs
OA Osteoarthritis
OT Occupational Therapist
PCS SF-36 Physical Component Summary
PT Physical Therapist
RA Rheumatoid Arthritis
SD Standard Deviation
TAS The Arthritis Society, BC & Yukon Division
UBC University of British Columbia
WOMAC The Western Ontario and McMaster Universities OA Index
BC Osteoarthritis Survey; January 2008
v
EEEExecutive Summary
Osteoarthritis (OA) affects about 433,000 British Columbians, is one of the major reasons for family physician visits, and accounts for almost half of all non-steroidal anti-inflammatory drugs (NSAIDs) prescriptions. Severe OA is one of the main reasons for hip and knee replacement surgery. Despite the impact of the disease, there has been little information about the use of health services by people with OA, making it difficult for policy makers and health care administrators to allocate resources.
The BC OA survey aimed to address this information gap. This project was conducted through the collaboration of the Arthritis Research Centre of Canada, the Primary Health Care Branch of BC Ministry of Health (MoH), and The Arthritis Society (TAS). The objectives were to: (1.) assess the health status and functional disability of people living with OA; (2.) describe the use of services and treatments; and (3.) describe the access barriers to services and treatments.
Six thousand BC residents with OA were randomly selected to receive a mailed questionnaire in June 2007. The main eligibility criteria include: (1) meeting the case definitions for OA or hip/knee replacement surgeries between 1992 and 2006; (2) having at least two medical visits for OA or one hospitalization within a 365-day period; and (3) age 19 or older.
Of the 6000 questionnaires, 2134 (response rate=36%) were returned with usable data, and 1713 reported that they had been told by a health professional that they had arthritis. The average age of participants was 67.3 years. Almost 70% rated their general health as good, very good or excellent. More than 30% continued to work and most of them had not changed their workload. Among those who stopped working, arthritis was not the most common reason for retirement.
The participants used a variety of health services and treatments. The most frequently reported barrier to access a health professional was the long waiting time. Almost 48% of those seeing an orthopaedic surgeon waited longer than three months. Cost was another frequently reported access barrier to health professionals.
Exercise, weight management, and medications are the first-line treatment for OA. This survey found 57% of participants used acetaminophen, 36% used ibuprofen, 17% used aspirin, and 25% used other NSAIDs. However, the use of non-pharmacological treatment was very low, with only 26% of people reported that they exercised in the past year, and only 24% of those who were overweight or obese received weight-loss counselling. The use of community services was also low, with only 24% of the participants using one or more programs offered by TAS.
Results of this survey present a positive picture of the general health of this population. On the other hand, gaps are found in the management of OA, especially the low use of inexpensive interventions that can effectively reduce long term disability and the need for joint replacement surgery. Since interventions that address physical inactivity and obesity often require people to make major life-style changes, consultations for exercise and healthy eating, and information about community resources are essential components of OA care.
BC Osteoarthritis Survey; January 2008
1
Chapter 1: IIIIntroduction
Osteoarthritis (OA) is the most common form of joint disease, affecting about 433,000 British Columbians (1 in 10 people).1 The prevalence is higher for women of all age groups. About one-third of men and 40% of women had OA in the age 70 to 74 category.1 People with severe OA may require joint replacement surgeries. In 2004-05, there were 8,734 joint replacement surgeries and the number increased to more than 10,000 in 2006-07. By 2020, this figure is estimated to rise to 20,000 with an annual cost of $230 million.2 As the population ages, the economic impact of OA is expected to increase proportionately. In most cases, the onset of OA is insidious and the damage progresses slowly over years. Cartilage acts to cushion the joints and in OA the cartilage is lost prematurely. This causes the bones rub together, resulting in damage and pain. Low grade inflammation of the synovial membrane can also occur.3 The knees, hips, hands and spine are the most commonly affected joints. People with OA often experience pain, joint stiffness, swelling, and muscle weakness. Arthritis of the knee and hip in particular can compromise activities such as walking, climbing stairs, and self-care.4 Treatments for OA consist of education, exercise, weight management, medication, and surgery.5-7 While most OA cases are treated by primary care physicians, individuals may also seek help from specialists, allied health professionals, and complementary and alternative therapy practitioners. They may also access community resources such as education and exercise programs, and fitness facilities. However, there has been little information about the use of health services by people with OA, making it challenging for policy makers and health care administrators to make decisions about resources allocation. In May 2007, a research team, led by Drs. Linda Li and Jacek Kopec, received funding from the Healthy Heart Society – IMPACT BC and The Arthritis Society BC & Yukon Division (TAS) to conduct a survey of British Columbians with OA to assess their health status, quality of life, and their use of health services. Adults with OA were identified using the BC medical services plan claims data and were asked to complete a questionnaire. This project was conducted in partnership with the Primary Health Care Branch of BC Ministry of Health (MoH) and TAS. Prior to this survey, the MoH and TAS provided funding for a pilot study to test the survey methodology and to estimate a response rate for the current survey. Objectives
This report presents the results of the BC OA survey. Specific objectives of this project were to:
1. Assess the health status and functional disability of people with OA.
2. Describe the use of services and treatments (pharmacological / non-pharmacological treatments, surgical interventions, complementary and alternative therapies, and community services) by people with OA.
3. Describe the access barriers to services and treatments.
BC Osteoarthritis Survey; January 2008
2
Chapter 2: PPPPilot Study
In 2004, a pilot study was conducted to test the feasibility of a full scale province-wide survey. The questionnaire was sent to 200 people identified as having OA using physician billing data (100 each from the Richmond Health Service Delivery Area (HSDA) and the Northern Health Authority). In addition, 50 people identified as having a hip or knee replacement surgery due to OA were randomly selected. The study protocol was approved by the University of British Columbia (UBC) Behavioural Research Ethics Board (Application number: B04-0289). Survey Administration and Process Evaluation
An invitation letter, a questionnaire booklet and a pre-paid addressed envelope were mailed to the 250 potential participants on July 21, 2004. Two and six weeks after the first mailing (August 4 and September 10), reminder postcards were sent to non-responders. A reminder letter along with another copy of the survey was also sent to the non-responders at four weeks (August 18). The cut-off date for data entry was September 10, 2004. If participants had any questions or concerns regarding the study, they could contact staff at ARC, TAS or MoH. To evaluate the feasibility of a full scale survey, we tracked the return rate of the questionnaires and the completion rate for each question. Summary of Results
Of the 250 questionnaires, we received 123 (49.2%) with usable data by the cut-off date. Eighteen surveys were returned incomplete. Reasons for non-participation included invalid addresses, refusal to participate, or deceased. Of the 123 questionnaires, 46 (37.4%) were from the Richmond HSDA, 46 (37.4%) from the Northern Health Authority, and 31 (25.2%) from the hip or knee replacement data. The average age of the respondents was 69 + 12.7 years (range= 31 to 93 years); the majority were females (n=75; 61%), had OA of the knee (n=80; 65%), and had completed high school or lower (n=69; 56.1%). Of the 62 questions in the survey booklet, 15 had more than 10% missing data. These questions were reviewed by the research team and the wording was modified when necessary. Results of the pilot study suggested that a full province-wide survey was feasible and that a reasonable response rate could be achieved.
BC Osteoarthritis Survey; January 2008 3
Chapter 3: BBBBritish Columbia Osteoarthritis Survey – Methods
The BC OA Survey protocol was approved by the UBC Behavioural Research Ethics Board on April 27, 2007 (application number: H04-80289). Sample Selection
A random sample of 6,000 people with OA, or hip/knee replacement surgeries due to OA, was selected after stratifying by health authorities (Vancouver Coastal, Vancouver Island, Fraser, Interior, and Northern). This ensured equal numbers of people were included from each region. Random selection was conducted by the MoH using administrative billing data for outpatient physician visits (Medical Services Plan Fee-For-Service Database) and hospitalization (Discharge Abstract Database). Individuals were included if they: (1) met the case definitions for OA or hip/knee replacement surgeries between April 1, 1992 and March 31, 2006 (Table 1); (2) had at least two medical visits for OA or one hospitalization within a 365-day period; (3) were age 19 or older on March 31, 2006; (4) were living in BC, and (5) were alive (i.e., no date of death recorded on the MoH OA administrative database at the time of sampling). The 365-day period was a moving window. The case date was defined as the first date by which the case definition was met. Questionnaire
The questionnaire covered five areas related to the use of health services and the health of people with OA, including: (1) the general health and comorbid conditions; (2) visits to health professionals and complementary therapy practitioners; (3) use of medications, traditional non-pharmacological treatments, surgical interventions, complementary and alternative therapies, and community services; (4) physical function; and (5) participation in the work force (Appendix A). We used existing validated outcome measures where possible. These include:
• The Western Ontario and McMaster Universities OA Index (WOMAC)8 to measure
pain, stiffness and physical function in people with hip and/or knee OA. The aggregate score ranges from 0 to 100, with a higher score meaning better outcome.
• SF-8 Health Survey to measure the general health status. Developed from the SF-36 Health Survey,9 SF-8 uses a single item to measure each of the eight health domains in the original SF-36 instrument (limitations in physical activities, limitations in social functioning as a result of physical and/or emotional problems, limitations in the usual role functioning, bodily pain, general mental health, vitality, and general health perception). The SF-8 was scored using norm-based scoring methods. The mean scores, variances and regression weights used to score the SF-8 and the summary measures were derived from studies in the general U.S. population in 2000.10
Information on health resource use was collected using a series of questions that were pilot tested in 2004. We also included open-ended questions to examine the services that people found the most helpful in managing OA, problems experienced when accessing services, and reasons for not getting the required care.
BC Osteoarthritis Survey; January 2008 4
Table 1: Osteoarthritis and hip/knee replacement surgeries case definitions
HIP OR KNEE REPLACEMENTS
RULE: At least one hospitalization coded with a hip or knee replacement procedure code
PROCEDURE CODES: CCP 934.1 Total knee replacement
935 Total hip replacement
CCI 1.VA.53-LA-PN^ Implant dual comp prosthetic hip OA
1.VA.53-PN-PN^ Implant dual comp prosthetic hip robotic OA
1.VG.53^^ Implant sing, dual or tri comp prosthetic knee OA
EXCLUSIONS: Exclude the above procedures if any of the following diagnostic codes exist on the discharge abstract
ICD 9 800-999 Fractures
E800-869, E880-E928, E950-E999
Non-medical injury
140-208 Malignant neoplasms
235-239 Neoplasm uncertain behaviour
ICD-10 S00-S99, V01-V99, W00-W99, X93-99
Non-medical injury
C00-C97 Malignant neoplasms
D37-D48 Neoplasm uncertain behaviour
Survey Administration
Three mailings were conducted in 2007 by the MoH. All participants received a survey package, including an information letter, a questionnaire booklet, and a stamped return envelope during the first mailing (June 20). Reminder cards were sent to everyone at two weeks (July 5) and four weeks (July 19). To protect confidentiality, the MoH assigned an identification number to all participants. The researchers did not have access to the personal contact information. Analysis
Descriptive analyses, based on frequency distributions and percentages, were calculated to describe the health status and the use of health services by people with OA. Results are presented in aggregate and in gender categories. All standardized measures were scored according to the instruction of the standardized scoring manuals.10;11 The WOMAC subscale scores were transformed to a 0-100 scale (100 = no
OSTEOARTHRITIS (OA)
RULE: One hospitalization or two medical visits in 365 days with an OA diagnostic code
DIAGNOSTIC CODES: ICD-9 715 Osteo-arthrosis and allied disorders
ICD-10 M15 Polyarthrosis
M16 Coxarthrosis [arthrosis of hip]
M17 Gonarthrosis [arthrosis of knee]
M18 Arthrosis of first carpometacarpal joint
M19 Other arthrosis
EXCLUSIONS: None
BC Osteoarthritis Survey; January 2008 5
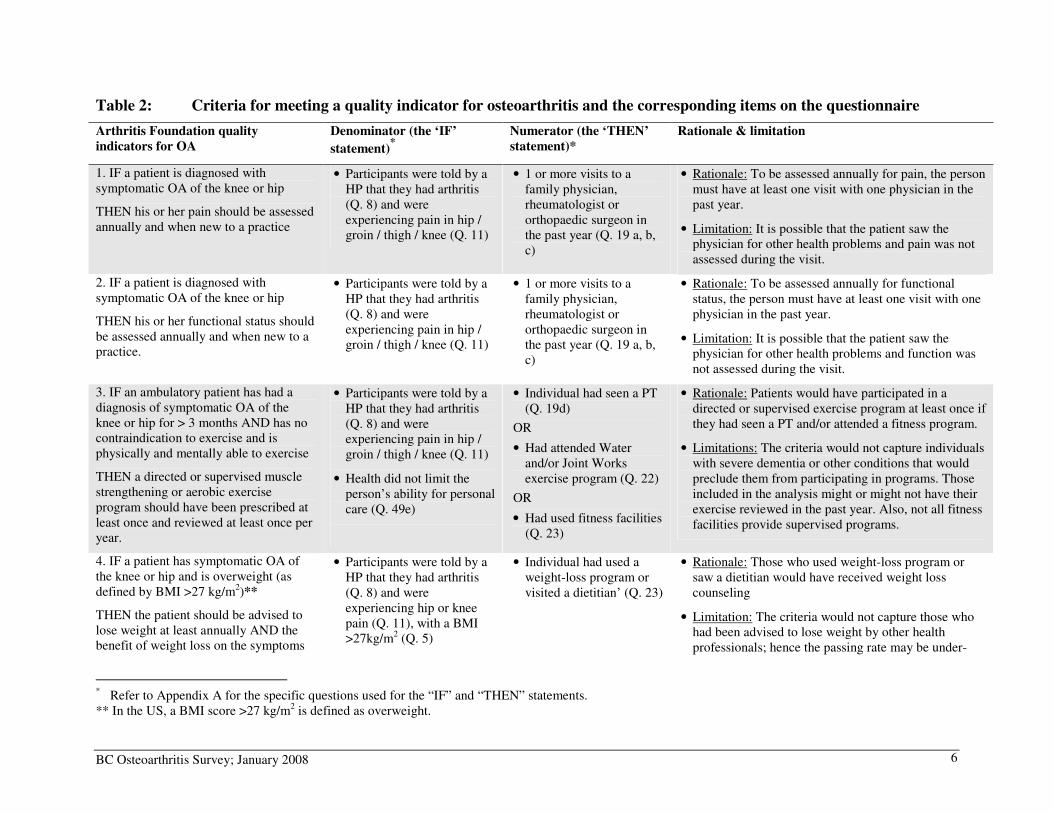
difficulty, 75 = mild difficulty, 50 = moderate difficulty, 25 = severe difficulty, 0 = extreme difficulty). Differences in WOMAC functional scores of more than 10 points on the transformed scale are generally noticeable by patients.12 For the SF-8 measure, the raw scores were transformed into a ‘50/10’ scoring, because the means for the U.S. population is 50 with standard deviations of 10. Hence, all scores above and below 50 are above and below the average, respectively, compared to the general US population.10 The SF-8 physical component summary (PCS) and mental component summary (MCS) scores were calculated using the algorithm in the SF-8 user manual.10 To assess the treatment gaps, we applied six of the Arthritis Foundation Quality Indicators for OA, two on assessment (pain and function) and four on non-pharmacological interventions (exercise, weight management, mobility aids, and other assistive devices) (Table 2). Developed by the RAND group, these indicators were based on a comprehensive review of literature and existing quality measures for OA, and were reviewed by a multidisciplinary expert panel.13 These indicators cover a broad spectrum of care, including assessment, treatment and follow-up. A typical quality indicator includes two components:
• The ‘IF’ statement determines the eligibility for the care process in question
• The ‘THEN’ statement specifies what care process should be performed The passing rate was calculated by dividing the number of people received the care (i.e., those who passed the ‘THEN’ statement) with the number of those eligible for the care (i.e., those who passed the ‘IF’ statement).
BC Osteoarthritis Survey; January 2008 6
Table 2: Criteria for meeting a quality indicator for osteoarthritis and the corresponding items on the questionnaire
Arthritis Foundation quality
indicators for OA
Denominator (the ‘IF’
statement)*
Numerator (the ‘THEN’
statement)*
Rationale & limitation
1. IF a patient is diagnosed with symptomatic OA of the knee or hip
THEN his or her pain should be assessed annually and when new to a practice
• Participants were told by a HP that they had arthritis (Q. 8) and were experiencing pain in hip / groin / thigh / knee (Q. 11)
• 1 or more visits to a family physician, rheumatologist or orthopaedic surgeon in the past year (Q. 19 a, b, c)
• Rationale: To be assessed annually for pain, the person must have at least one visit with one physician in the past year.
• Limitation: It is possible that the patient saw the physician for other health problems and pain was not assessed during the visit.
2. IF a patient is diagnosed with symptomatic OA of the knee or hip
THEN his or her functional status should be assessed annually and when new to a practice.
• Participants were told by a HP that they had arthritis (Q. 8) and were experiencing pain in hip / groin / thigh / knee (Q. 11)
• 1 or more visits to a family physician, rheumatologist or orthopaedic surgeon in the past year (Q. 19 a, b, c)
• Rationale: To be assessed annually for functional status, the person must have at least one visit with one physician in the past year.
• Limitation: It is possible that the patient saw the physician for other health problems and function was not assessed during the visit.
3. IF an ambulatory patient has had a diagnosis of symptomatic OA of the knee or hip for > 3 months AND has no contraindication to exercise and is physically and mentally able to exercise
THEN a directed or supervised muscle strengthening or aerobic exercise program should have been prescribed at least once and reviewed at least once per year.
• Participants were told by a HP that they had arthritis (Q. 8) and were experiencing pain in hip / groin / thigh / knee (Q. 11)
• Health did not limit the person’s ability for personal care (Q. 49e)
• Individual had seen a PT (Q. 19d)
OR
• Had attended Water and/or Joint Works exercise program (Q. 22)
OR
• Had used fitness facilities (Q. 23)
• Rationale: Patients would have participated in a directed or supervised exercise program at least once if they had seen a PT and/or attended a fitness program.
• Limitations: The criteria would not capture individuals with severe dementia or other conditions that would preclude them from participating in programs. Those included in the analysis might or might not have their exercise reviewed in the past year. Also, not all fitness facilities provide supervised programs.
4. IF a patient has symptomatic OA of the knee or hip and is overweight (as defined by BMI >27 kg/m2)**
THEN the patient should be advised to lose weight at least annually AND the benefit of weight loss on the symptoms
• Participants were told by a HP that they had arthritis (Q. 8) and were experiencing hip or knee pain (Q. 11), with a BMI >27kg/m2 (Q. 5)
• Individual had used a weight-loss program or visited a dietitian’ (Q. 23)
• Rationale: Those who used weight-loss program or saw a dietitian would have received weight loss counseling
• Limitation: The criteria would not capture those who had been advised to lose weight by other health professionals; hence the passing rate may be under-
* Refer to Appendix A for the specific questions used for the “IF” and “THEN” statements. ** In the US, a BMI score >27 kg/m2 is defined as overweight.
BC Osteoarthritis Survey; January 2008 7
Arthritis Foundation quality
indicators for OA
Denominator (the ‘IF’
statement)*
Numerator (the ‘THEN’
statement)*
Rationale & limitation
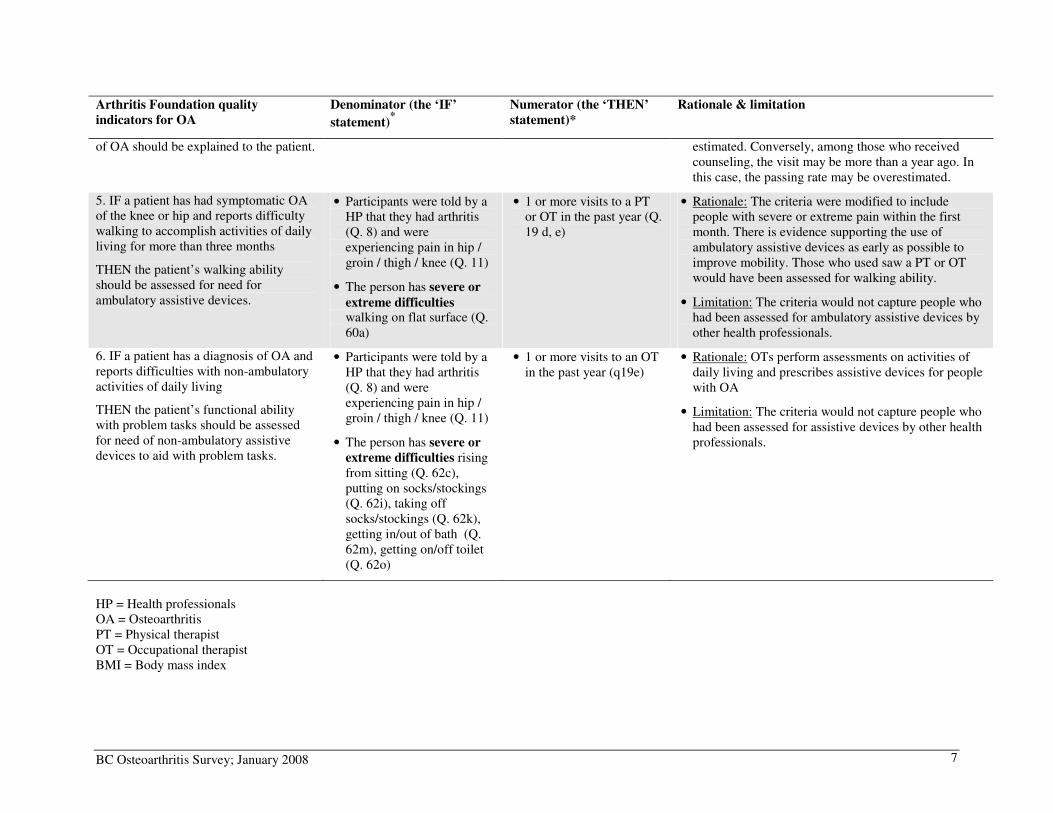
of OA should be explained to the patient. estimated. Conversely, among those who received counseling, the visit may be more than a year ago. In this case, the passing rate may be overestimated.
5. IF a patient has had symptomatic OA of the knee or hip and reports difficulty walking to accomplish activities of daily living for more than three months
THEN the patient’s walking ability should be assessed for need for ambulatory assistive devices.
• Participants were told by a HP that they had arthritis (Q. 8) and were experiencing pain in hip / groin / thigh / knee (Q. 11)
• The person has severe or
extreme difficulties walking on flat surface (Q. 60a)
• 1 or more visits to a PT or OT in the past year (Q. 19 d, e)
• Rationale: The criteria were modified to include people with severe or extreme pain within the first month. There is evidence supporting the use of ambulatory assistive devices as early as possible to improve mobility. Those who used saw a PT or OT would have been assessed for walking ability.
• Limitation: The criteria would not capture people who had been assessed for ambulatory assistive devices by other health professionals.
6. IF a patient has a diagnosis of OA and reports difficulties with non-ambulatory activities of daily living
THEN the patient’s functional ability with problem tasks should be assessed for need of non-ambulatory assistive devices to aid with problem tasks.
• Participants were told by a HP that they had arthritis (Q. 8) and were experiencing pain in hip / groin / thigh / knee (Q. 11)
• The person has severe or
extreme difficulties rising from sitting (Q. 62c), putting on socks/stockings (Q. 62i), taking off socks/stockings (Q. 62k), getting in/out of bath (Q. 62m), getting on/off toilet (Q. 62o)
• 1 or more visits to an OT in the past year (q19e)
• Rationale: OTs perform assessments on activities of daily living and prescribes assistive devices for people with OA
• Limitation: The criteria would not capture people who had been assessed for assistive devices by other health professionals.
HP = Health professionals OA = Osteoarthritis PT = Physical therapist OT = Occupational therapist BMI = Body mass index
BC Osteoarthritis Survey; January 2008 8
Chapter 4: RRRResults
Participant Characteristics
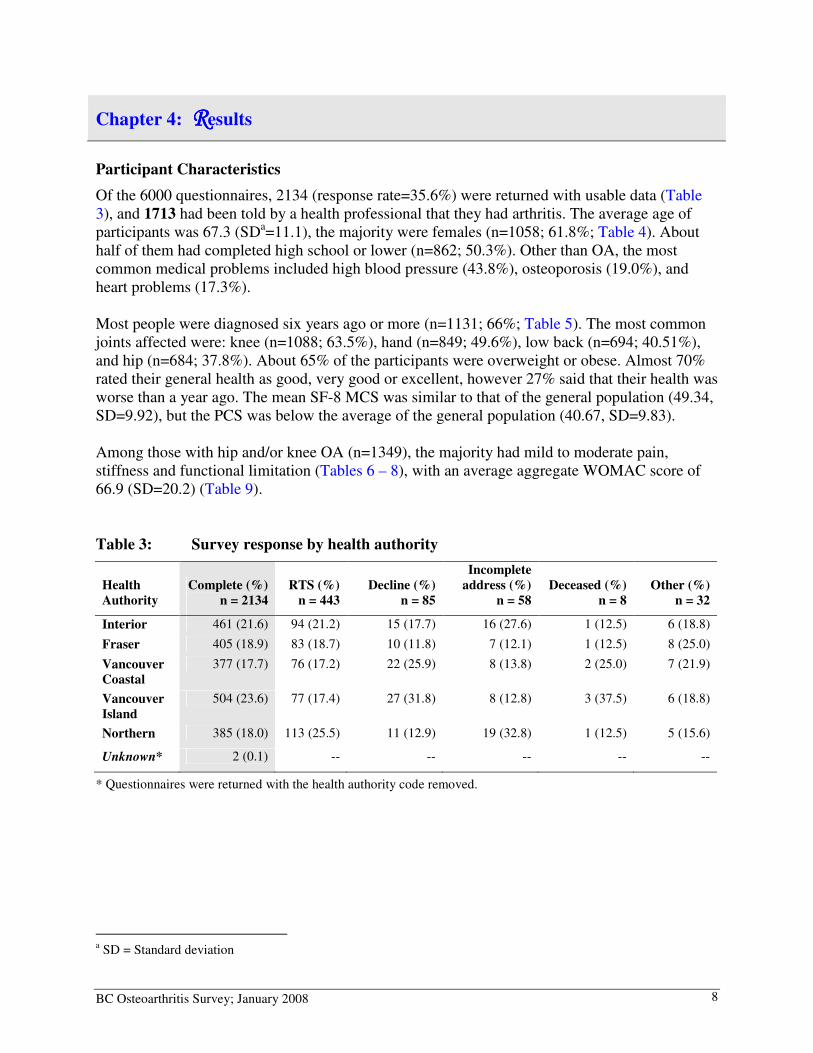
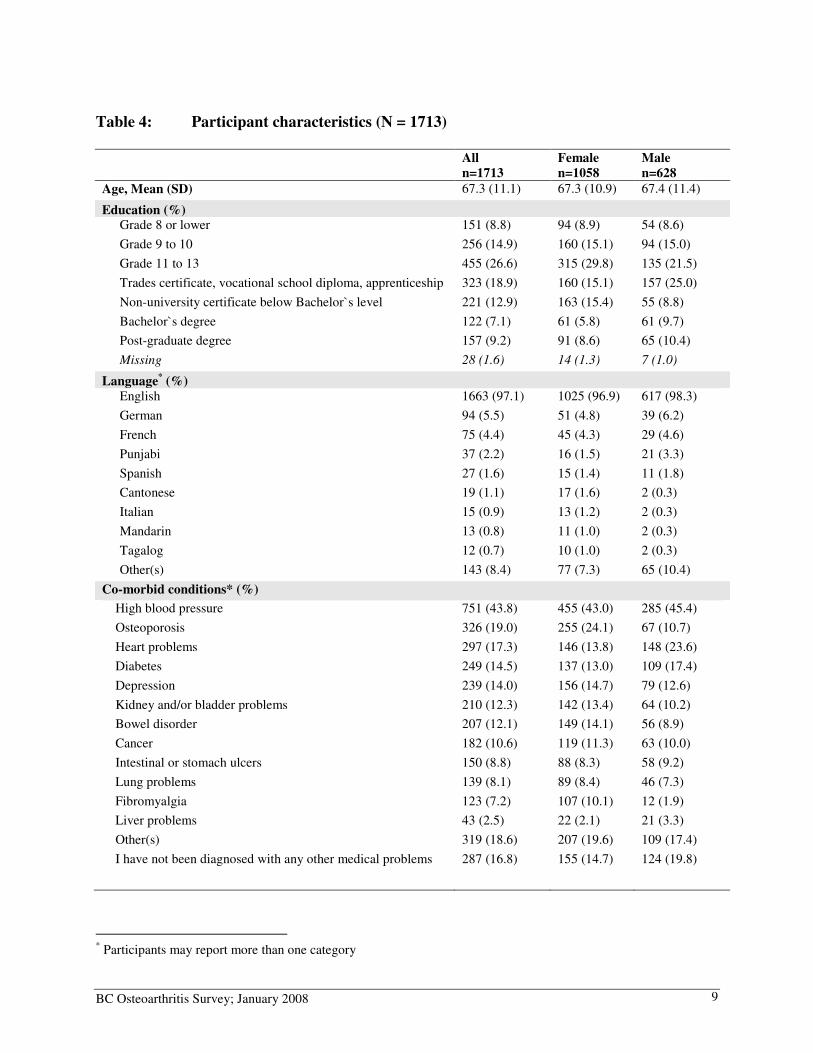
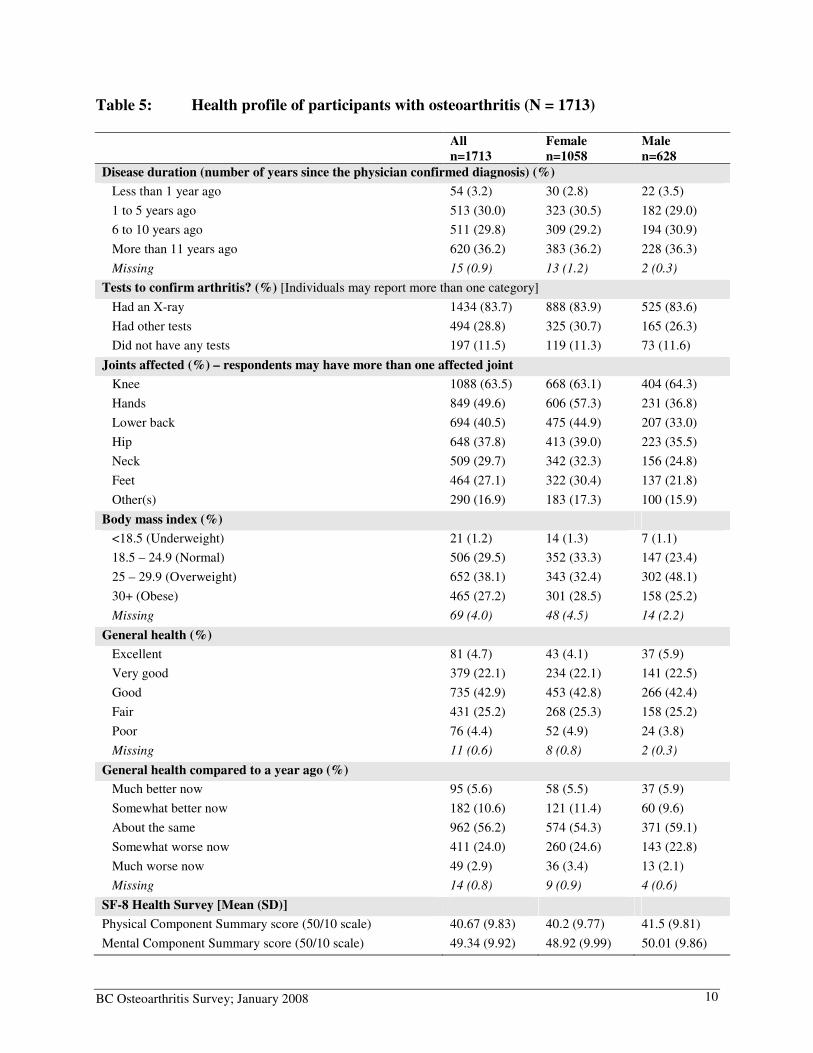
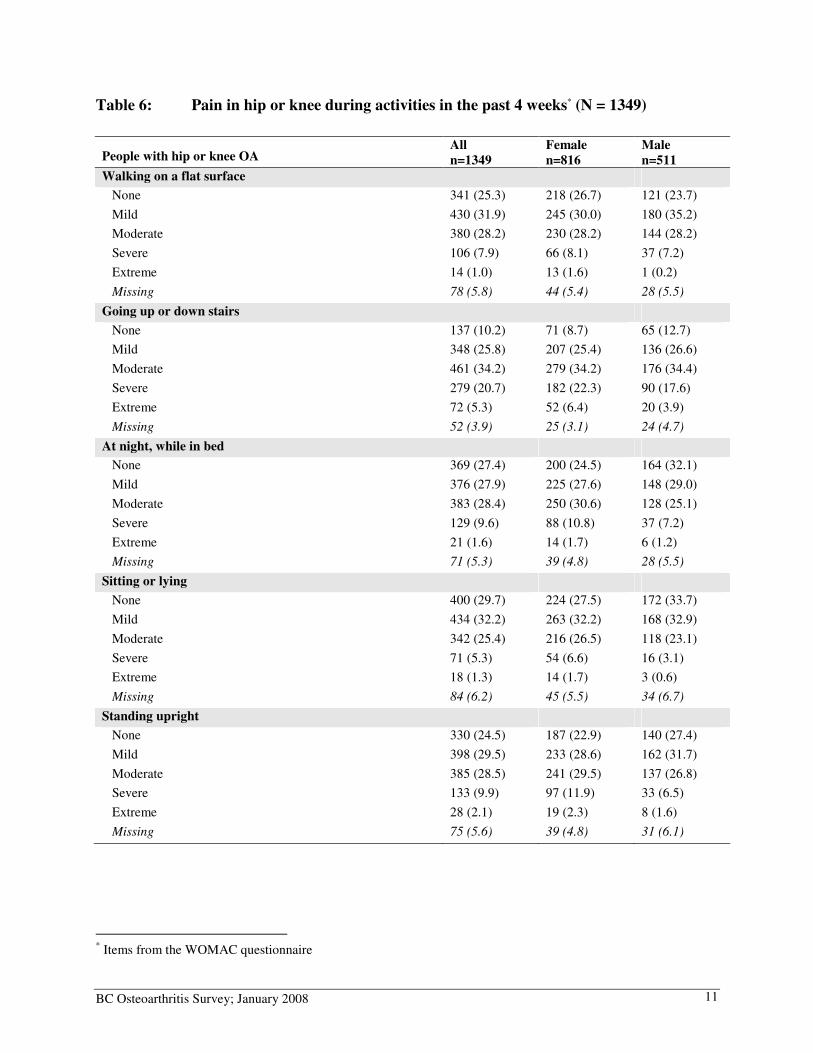
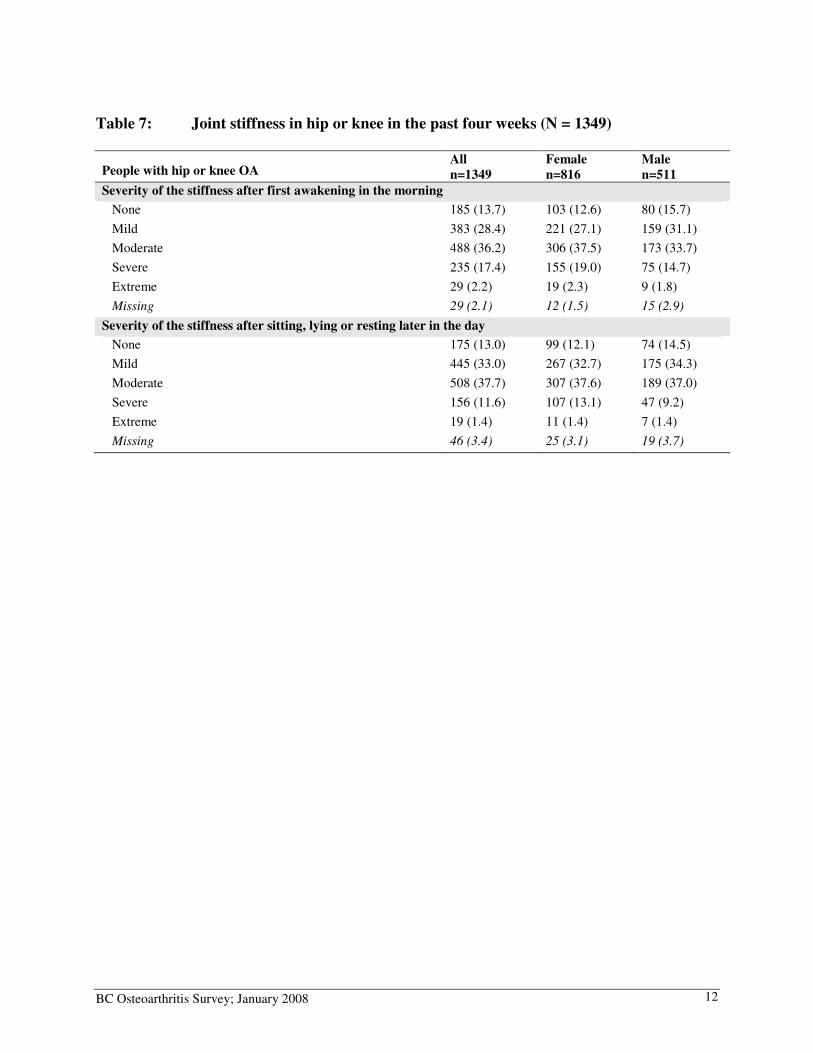
Of the 6000 questionnaires, 2134 (response rate=35.6%) were returned with usable data (Table 3), and 1713 had been told by a health professional that they had arthritis. The average age of participants was 67.3 (SDa=11.1), the majority were females (n=1058; 61.8%; Table 4). About half of them had completed high school or lower (n=862; 50.3%). Other than OA, the most common medical problems included high blood pressure (43.8%), osteoporosis (19.0%), and heart problems (17.3%). Most people were diagnosed six years ago or more (n=1131; 66%; Table 5). The most common joints affected were: knee (n=1088; 63.5%), hand (n=849; 49.6%), low back (n=694; 40.51%), and hip (n=684; 37.8%). About 65% of the participants were overweight or obese. Almost 70% rated their general health as good, very good or excellent, however 27% said that their health was worse than a year ago. The mean SF-8 MCS was similar to that of the general population (49.34, SD=9.92), but the PCS was below the average of the general population (40.67, SD=9.83). Among those with hip and/or knee OA (n=1349), the majority had mild to moderate pain, stiffness and functional limitation (Tables 6 – 8), with an average aggregate WOMAC score of 66.9 (SD=20.2) (Table 9). Table 3: Survey response by health authority
Health
Authority
Complete (%)
n = 2134
RTS (%)
n = 443
Decline (%)
n = 85
Incomplete
address (%)
n = 58
Deceased (%)
n = 8
Other (%)
n = 32
Interior 461 (21.6) 94 (21.2) 15 (17.7) 16 (27.6) 1 (12.5) 6 (18.8)
Fraser 405 (18.9) 83 (18.7) 10 (11.8) 7 (12.1) 1 (12.5) 8 (25.0)
Vancouver
Coastal
377 (17.7) 76 (17.2) 22 (25.9) 8 (13.8) 2 (25.0) 7 (21.9)
Vancouver
Island
504 (23.6) 77 (17.4) 27 (31.8) 8 (12.8) 3 (37.5) 6 (18.8)
Northern 385 (18.0) 113 (25.5) 11 (12.9) 19 (32.8) 1 (12.5) 5 (15.6)
Unknown* 2 (0.1) -- -- -- -- --
* Questionnaires were returned with the health authority code removed.
a SD = Standard deviation
BC Osteoarthritis Survey; January 2008 9
Table 4: Participant characteristics (N = 1713)
All
n=1713
Female
n=1058
Male
n=628
Age, Mean (SD) 67.3 (11.1) 67.3 (10.9) 67.4 (11.4)
Education (%) Grade 8 or lower 151 (8.8) 94 (8.9) 54 (8.6)
Grade 9 to 10 256 (14.9) 160 (15.1) 94 (15.0)
Grade 11 to 13 455 (26.6) 315 (29.8) 135 (21.5)
Trades certificate, vocational school diploma, apprenticeship 323 (18.9) 160 (15.1) 157 (25.0)
Non-university certificate below Bachelor`s level 221 (12.9) 163 (15.4) 55 (8.8)
Bachelor`s degree 122 (7.1) 61 (5.8) 61 (9.7)
Post-graduate degree 157 (9.2) 91 (8.6) 65 (10.4)
Missing 28 (1.6) 14 (1.3) 7 (1.0)
Language* (%)
English 1663 (97.1) 1025 (96.9) 617 (98.3)
German 94 (5.5) 51 (4.8) 39 (6.2)
French 75 (4.4) 45 (4.3) 29 (4.6)
Punjabi 37 (2.2) 16 (1.5) 21 (3.3)
Spanish 27 (1.6) 15 (1.4) 11 (1.8)
Cantonese 19 (1.1) 17 (1.6) 2 (0.3)
Italian 15 (0.9) 13 (1.2) 2 (0.3)
Mandarin 13 (0.8) 11 (1.0) 2 (0.3)
Tagalog 12 (0.7) 10 (1.0) 2 (0.3)
Other(s) 143 (8.4) 77 (7.3) 65 (10.4)
Co-morbid conditions* (%)
High blood pressure 751 (43.8) 455 (43.0) 285 (45.4)
Osteoporosis 326 (19.0) 255 (24.1) 67 (10.7)
Heart problems 297 (17.3) 146 (13.8) 148 (23.6)
Diabetes 249 (14.5) 137 (13.0) 109 (17.4)
Depression 239 (14.0) 156 (14.7) 79 (12.6)
Kidney and/or bladder problems 210 (12.3) 142 (13.4) 64 (10.2)
Bowel disorder 207 (12.1) 149 (14.1) 56 (8.9)
Cancer 182 (10.6) 119 (11.3) 63 (10.0)
Intestinal or stomach ulcers 150 (8.8) 88 (8.3) 58 (9.2)
Lung problems 139 (8.1) 89 (8.4) 46 (7.3)
Fibromyalgia 123 (7.2) 107 (10.1) 12 (1.9)
Liver problems 43 (2.5) 22 (2.1) 21 (3.3)
Other(s) 319 (18.6) 207 (19.6) 109 (17.4)
I have not been diagnosed with any other medical problems 287 (16.8) 155 (14.7) 124 (19.8)
* Participants may report more than one category
BC Osteoarthritis Survey; January 2008 10
Table 5: Health profile of participants with osteoarthritis (N = 1713)
All
n=1713
Female
n=1058
Male
n=628
Disease duration (number of years since the physician confirmed diagnosis) (%)
Less than 1 year ago 54 (3.2) 30 (2.8) 22 (3.5)
1 to 5 years ago 513 (30.0) 323 (30.5) 182 (29.0)
6 to 10 years ago 511 (29.8) 309 (29.2) 194 (30.9)
More than 11 years ago 620 (36.2) 383 (36.2) 228 (36.3)
Missing 15 (0.9) 13 (1.2) 2 (0.3)
Tests to confirm arthritis? (%) [Individuals may report more than one category]
Had an X-ray 1434 (83.7) 888 (83.9) 525 (83.6)
Had other tests 494 (28.8) 325 (30.7) 165 (26.3)
Did not have any tests 197 (11.5) 119 (11.3) 73 (11.6)
Joints affected (%) – respondents may have more than one affected joint
Knee 1088 (63.5) 668 (63.1) 404 (64.3)
Hands 849 (49.6) 606 (57.3) 231 (36.8)
Lower back 694 (40.5) 475 (44.9) 207 (33.0)
Hip 648 (37.8) 413 (39.0) 223 (35.5)
Neck 509 (29.7) 342 (32.3) 156 (24.8)
Feet 464 (27.1) 322 (30.4) 137 (21.8)
Other(s) 290 (16.9) 183 (17.3) 100 (15.9)
Body mass index (%)
<18.5 (Underweight) 21 (1.2) 14 (1.3) 7 (1.1)
18.5 – 24.9 (Normal) 506 (29.5) 352 (33.3) 147 (23.4)
25 – 29.9 (Overweight) 652 (38.1) 343 (32.4) 302 (48.1)
30+ (Obese) 465 (27.2) 301 (28.5) 158 (25.2)
Missing 69 (4.0) 48 (4.5) 14 (2.2)
General health (%)
Excellent 81 (4.7) 43 (4.1) 37 (5.9)
Very good 379 (22.1) 234 (22.1) 141 (22.5)
Good 735 (42.9) 453 (42.8) 266 (42.4)
Fair 431 (25.2) 268 (25.3) 158 (25.2)
Poor 76 (4.4) 52 (4.9) 24 (3.8)
Missing 11 (0.6) 8 (0.8) 2 (0.3)
General health compared to a year ago (%)
Much better now 95 (5.6) 58 (5.5) 37 (5.9)
Somewhat better now 182 (10.6) 121 (11.4) 60 (9.6)
About the same 962 (56.2) 574 (54.3) 371 (59.1)
Somewhat worse now 411 (24.0) 260 (24.6) 143 (22.8)
Much worse now 49 (2.9) 36 (3.4) 13 (2.1)
Missing 14 (0.8) 9 (0.9) 4 (0.6)
SF-8 Health Survey [Mean (SD)]
Physical Component Summary score (50/10 scale) 40.67 (9.83) 40.2 (9.77) 41.5 (9.81)
Mental Component Summary score (50/10 scale) 49.34 (9.92) 48.92 (9.99) 50.01 (9.86)
BC Osteoarthritis Survey; January 2008 11
Table 6: Pain in hip or knee during activities in the past 4 weeks* (N = 1349)
People with hip or knee OA All
n=1349
Female
n=816
Male
n=511
Walking on a flat surface
None 341 (25.3) 218 (26.7) 121 (23.7)
Mild 430 (31.9) 245 (30.0) 180 (35.2)
Moderate 380 (28.2) 230 (28.2) 144 (28.2)
Severe 106 (7.9) 66 (8.1) 37 (7.2)
Extreme 14 (1.0) 13 (1.6) 1 (0.2)
Missing 78 (5.8) 44 (5.4) 28 (5.5)
Going up or down stairs
None 137 (10.2) 71 (8.7) 65 (12.7)
Mild 348 (25.8) 207 (25.4) 136 (26.6)
Moderate 461 (34.2) 279 (34.2) 176 (34.4)
Severe 279 (20.7) 182 (22.3) 90 (17.6)
Extreme 72 (5.3) 52 (6.4) 20 (3.9)
Missing 52 (3.9) 25 (3.1) 24 (4.7)
At night, while in bed
None 369 (27.4) 200 (24.5) 164 (32.1)
Mild 376 (27.9) 225 (27.6) 148 (29.0)
Moderate 383 (28.4) 250 (30.6) 128 (25.1)
Severe 129 (9.6) 88 (10.8) 37 (7.2)
Extreme 21 (1.6) 14 (1.7) 6 (1.2)
Missing 71 (5.3) 39 (4.8) 28 (5.5)
Sitting or lying
None 400 (29.7) 224 (27.5) 172 (33.7)
Mild 434 (32.2) 263 (32.2) 168 (32.9)
Moderate 342 (25.4) 216 (26.5) 118 (23.1)
Severe 71 (5.3) 54 (6.6) 16 (3.1)
Extreme 18 (1.3) 14 (1.7) 3 (0.6)
Missing 84 (6.2) 45 (5.5) 34 (6.7)
Standing upright
None 330 (24.5) 187 (22.9) 140 (27.4)
Mild 398 (29.5) 233 (28.6) 162 (31.7)
Moderate 385 (28.5) 241 (29.5) 137 (26.8)
Severe 133 (9.9) 97 (11.9) 33 (6.5)
Extreme 28 (2.1) 19 (2.3) 8 (1.6)
Missing 75 (5.6) 39 (4.8) 31 (6.1)
* Items from the WOMAC questionnaire
BC Osteoarthritis Survey; January 2008 12
Table 7: Joint stiffness in hip or knee in the past four weeks (N = 1349)
People with hip or knee OA All
n=1349
Female
n=816
Male
n=511
Severity of the stiffness after first awakening in the morning
None 185 (13.7) 103 (12.6) 80 (15.7)
Mild 383 (28.4) 221 (27.1) 159 (31.1)
Moderate 488 (36.2) 306 (37.5) 173 (33.7)
Severe 235 (17.4) 155 (19.0) 75 (14.7)
Extreme 29 (2.2) 19 (2.3) 9 (1.8)
Missing 29 (2.1) 12 (1.5) 15 (2.9)
Severity of the stiffness after sitting, lying or resting later in the day
None 175 (13.0) 99 (12.1) 74 (14.5)
Mild 445 (33.0) 267 (32.7) 175 (34.3)
Moderate 508 (37.7) 307 (37.6) 189 (37.0)
Severe 156 (11.6) 107 (13.1) 47 (9.2)
Extreme 19 (1.4) 11 (1.4) 7 (1.4)
Missing 46 (3.4) 25 (3.1) 19 (3.7)
BC Osteoarthritis Survey; January 2008 13
Table 8: Difficulty with activities involving hips or knees in the past four weeks
People with hip or knee OA
All
n=1349
Female
n=816
Male
n=511
Descending stairs
None 215 (15.9) 115 (14.1) 97 (19.0)
Mild 404 (30.0) 236 (28.9) 162 (31.7)
Moderate 435 (32.3) 262 (32.1) 165 (32.3)
Severe 198 (14.7) 137 (16.8) 59 (11.6)
Extreme 50 (3.7) 39 (4.8) 10 (2.0)
Missing 47 (3.5) 27 (3.3) 18 (3.5)
Ascending stairs
None 211 (15.6) 106 (13.0) 103 (20.5)
Mild 373 (27.7) 216 (26.5) 153 (29.9)
Moderate 446 (33.1) 281 (34.4) 157 (30.7)
Severe 217 (16.1) 147 (18.0) 66 (12.9)
Extreme 54 (4.0) 40 (4.9) 14 (2.7)
Missing 48 (3.6) 26 (3.2) 18 (3.5)
Rising from sitting
None 228 (16.9) 119 (14.6) 108 (21.1)
Mild 416 (30.8) 254 (31.1) 156 (30.5)
Moderate 459 (34.0) 280 (34.3) 171 (33.5)
Severe 173 (12.8) 121 (14.8) 49 (9.6)
Extreme 33 (2.5) 22 (2.7) 11 (2.2)
Missing 40 (3.0) 20 (2.5) 16 (3.1)
Standing
None 384 (28.5) 223 (27.3) 158 (30.9)
Mild 395 (29.3) 236 (28.9) 153 (29.9)
Moderate 359 (26.6) 221 (27.1) 134 (26.2)
Severe 131 (9.7) 93 (11.4) 33 (6.5)
Extreme 29 (2.2) 18 (2.2) 11 (2.2)
Missing 51 (3.8) 25 (3.1) 22 (4.3)
Bending to the floor
None 250 (18.5) 143 (17.5) 104 (20.4)
Mild 344 (25.5) 216 (26.5) 124 (24.3)
Moderate 369 (27.4) 223 (27.3) 141 (27.6)
Severe 235 (17.4) 144 (17.7) 87 (17.0)
Extreme 93 (6.9) 63 (7.7) 29 (5.7)
Missing 58 (4.3) 27 (3.3) 26 (5.1)
Walking on flat surface
None 407 (30.2) 247 (30.3) 158 (30.9)
Mild 448 (33.2) 264 (32.4) 178 (34.8)
Moderate 338 (25.1) 209 (25.6) 120 (23.5)
Severe 88 (6.5) 60 (7.4) 27 (5.3)
Extreme 11 (0.8) 6 (0.7) 5 (1.0) Missing
57 (4.2)
30 (3.7)
23 (4.5)
BC Osteoarthritis Survey; January 2008 14
People with hip or knee OA
All
n=1349
Female
n=816
Male
n=511
Getting in/out of car
None 239 (17.7) 135 (16.5) 102 (20.0)
Mild 445 (33.0) 274 (33.6) 165 (32.3)
Moderate 445 (33.0) 270 (33.1) 166 (32.5)
Severe 149 (11.1) 103 (12.6) 44 (8.6)
Extreme 29 (2.2) 18 (2.2) 11 (2.2)
Missing 42 (3.1) 16 (2.0) 23 (4.5)
Going shopping
None 365 (27.1) 218 (26.7) 146 (28.6)
Mild 374 (27.7) 210 (25.7) 157 (30.7)
Moderate 389 (28.8) 250 (30.6) 131 (25.6)
Severe 118 (8.8) 84 (10.3) 32 (6.3)
Extreme 38 (2.8) 21 (2.6) 17 (3.3)
Missing 65 (4.8) 33 (4.0) 28 (5.5)
Putting on socks/stockings
None 383 (28.4) 245 (30.0) 135 (26.4)
Mild 397 (29.4) 250 (30.6) 142 (27.8)
Moderate 337 (25.0) 187 (22.9) 142 (27.8)
Severe 126 (9.3) 79 (9.7) 45 (8.8)
Extreme 49 (3.6) 28 (3.4) 21 (4.1)
Missing 57 (4.2) 27 (3.3) 26 (5.1)
Rising from bed
None 361 (26.8) 215 (26.4) 144 (28.2)
Mild 411 (30.5) 244 (29.9) 161 (31.5)
Moderate 377 (28.0) 233 (28.6) 139 (27.2)
Severe 114 (8.5) 82 (10.1) 28 (5.5)
Extreme 27 (2.0) 14 (1.7) 13 (2.5)
Missing 59 (4.4) 28 (3.4) 26 (5.1)
Taking off socks/stockings
None 426 (31.6) 268 (32.8) 155 (30.3)
Mild 405 (30.0) 251 (30.8) 148 (29.0)
Moderate 309 (22.9) 176 (21.6) 129 (25.2)
Severe 107 (7.9) 65 (8.0) 39 (7.6)
Extreme 36 (2.7) 22 (2.7) 14 (2.7)
Missing 66 (4.9) 34 (4.2) 26 (5.1)
Lying in bed
None 499 (37.0) 286 (35.1) 208 (40.7)
Mild 413 (30.6) 249 (30.5) 159 (31.1)
Moderate 292 (21.7) 185 (22.7) 101 (19.8)
Severe 58 (4.3) 42 (5.2) 14 (2.7)
Extreme 20 (1.5) 11 (1.4) 9 (1.8)
Missing 67 (5.0) 43 (5.3) 20 (3.9)
Getting in/out of bath
None 354 (26.2) 191 (23.4) 160 (31.3)
Mild 361 (26.8) 208 (25.5) 149 (29.2)
Moderate 298 (22.1) 187 (22.9) 106 (20.7)
BC Osteoarthritis Survey; January 2008 15
People with hip or knee OA
All
n=1349
Female
n=816
Male
n=511
Severe 148 (11.0) 105 (12.9) 40 (7.8)
Extreme 88 (6.5) 71 (8.7) 16 (3.1)
Missing 100 (7.4) 54 (6.6) 40 (7.8)
Sitting
None 492 (36.5) 290 (35.5) 196 (38.4)
Mild 444 (32.9) 263 (32.2) 178 (34.8)
Moderate 276 (20.5) 179 (21.9) 89 (17.4)
Severe 61 (4.5) 48 (5.9) 12 (2.4)
Extreme 12 (0.9) 6 (0.7) 6 (1.2)
Missing 64 (4.7) 30 (3.7) 30 (5.9)
Getting on/off toilet
None 465 (34.5) 277 (34.0) 183 (35.8)
Mild 418 (31.0) 241 (29.5) 174 (34.1)
Moderate 280 (20.8) 183 (22.4) 88 (17.2)
Severe 90 (6.7) 65 (8.0) 25 (4.9)
Extreme 30 (2.2) 18 (2.2) 11 (2.2) Missing 66 (4.9) 32 (3.9) 30 (5.9)
Heavy domestic duties
None 156 (11.6) 78 (9.6) 76 (14.9)
Mild 222 (16.5) 115 (14.1) 105 (20.6)
Moderate 374 (27.7) 221 (27.1) 149 (29.2)
Severe 340 (25.2) 225 (27.6) 107 (20.9)
Extreme 178 (13.2) 134 (16.4) 42 (8.2)
Missing 79 (5.9) 43 (5.3) 32 (6.3)
Light domestic duties
None 386 (28.6) 216 (26.5) 166 (32.5)
Mild 440 (32.6) 260 (31.9) 175 (34.3)
Moderate 380 (28.2) 247 (30.3) 126 (24.7)
Severe 78 (5.8) 59 (7.2) 17 (3.3)
Extreme 18 (1.3) 14 (1.7) 4 (0.8)
Missing 47 (3.5) 20 (2.5) 23 (4.5)
Table 9: WOMAC score reported by people with hip or knee osteoarthritis
(0-100, higher = better)
People with hip or knee OA
All
n=1349
Female
n=816
Male
n=511
Pain, Mean (SD*) 66.5 (21.3) 65.0 (21.7) 69.4 (20.3)
Stiffness, Mean (SD) 60.1 (22.2) 58.9 (22.1) 62.5 (22.1)
Function, Mean (SD) 67.7 (21.3) 66.2 (21.5) 69.9 (20.9)
WOMAC aggregate score, Mean (SD) 66.9 (20.2) 65.2 (20.4) 69.5 (19.7)
* SD = Standard deviation
BC Osteoarthritis Survey; January 2008 16
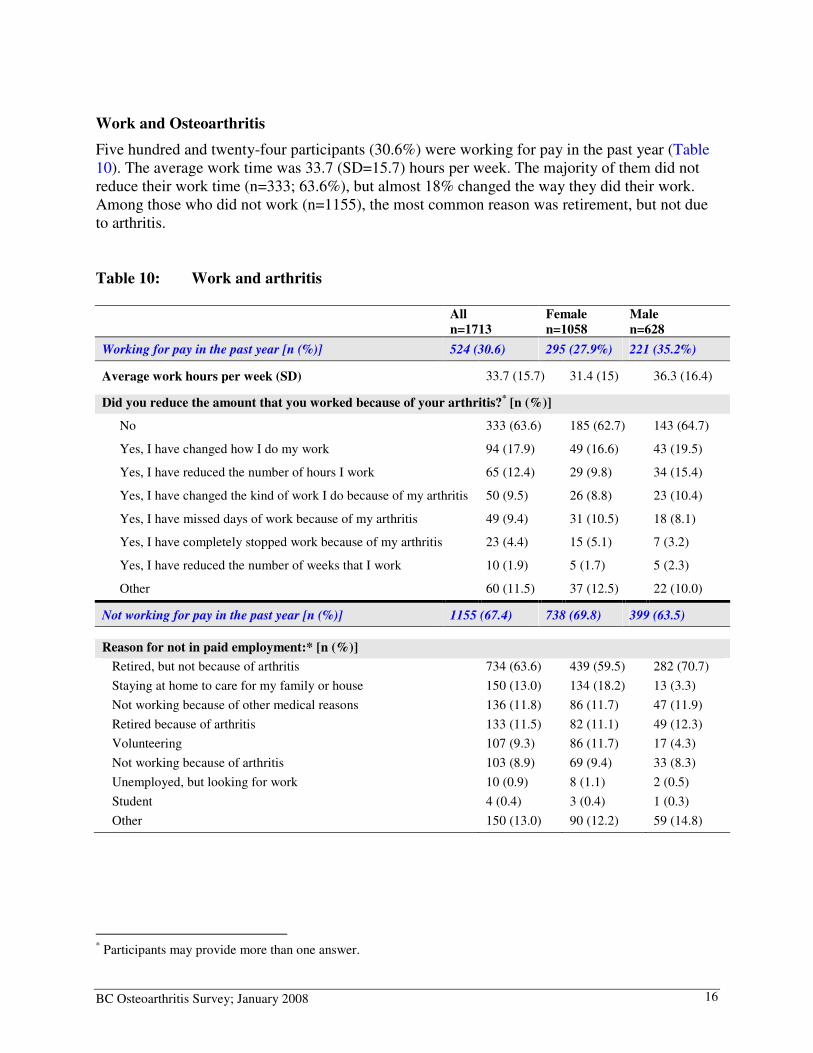
Work and Osteoarthritis
Five hundred and twenty-four participants (30.6%) were working for pay in the past year (Table 10). The average work time was 33.7 (SD=15.7) hours per week. The majority of them did not reduce their work time (n=333; 63.6%), but almost 18% changed the way they did their work. Among those who did not work (n=1155), the most common reason was retirement, but not due to arthritis. Table 10: Work and arthritis
All
n=1713
Female
n=1058
Male
n=628
Working for pay in the past year [n (%)] 524 (30.6) 295 (27.9%) 221 (35.2%)
Average work hours per week (SD) 33.7 (15.7) 31.4 (15) 36.3 (16.4)
Did you reduce the amount that you worked because of your arthritis?* [n (%)]
No 333 (63.6) 185 (62.7) 143 (64.7)
Yes, I have changed how I do my work 94 (17.9) 49 (16.6) 43 (19.5)
Yes, I have reduced the number of hours I work 65 (12.4) 29 (9.8) 34 (15.4)
Yes, I have changed the kind of work I do because of my arthritis 50 (9.5) 26 (8.8) 23 (10.4)
Yes, I have missed days of work because of my arthritis 49 (9.4) 31 (10.5) 18 (8.1)
Yes, I have completely stopped work because of my arthritis 23 (4.4) 15 (5.1) 7 (3.2)
Yes, I have reduced the number of weeks that I work 10 (1.9) 5 (1.7) 5 (2.3)
Other 60 (11.5) 37 (12.5) 22 (10.0)
Not working for pay in the past year [n (%)] 1155 (67.4) 738 (69.8) 399 (63.5)
Reason for not in paid employment:* [n (%)]
Retired, but not because of arthritis 734 (63.6) 439 (59.5) 282 (70.7)
Staying at home to care for my family or house 150 (13.0) 134 (18.2) 13 (3.3)
Not working because of other medical reasons 136 (11.8) 86 (11.7) 47 (11.9)
Retired because of arthritis 133 (11.5) 82 (11.1) 49 (12.3)
Volunteering 107 (9.3) 86 (11.7) 17 (4.3)
Not working because of arthritis 103 (8.9) 69 (9.4) 33 (8.3)
Unemployed, but looking for work 10 (0.9) 8 (1.1) 2 (0.5)
Student 4 (0.4) 3 (0.4) 1 (0.3)
Other 150 (13.0) 90 (12.2) 59 (14.8)
* Participants may provide more than one answer.
BC Osteoarthritis Survey; January 2008 17
Use of Health Services and Treatments
Health professional visits
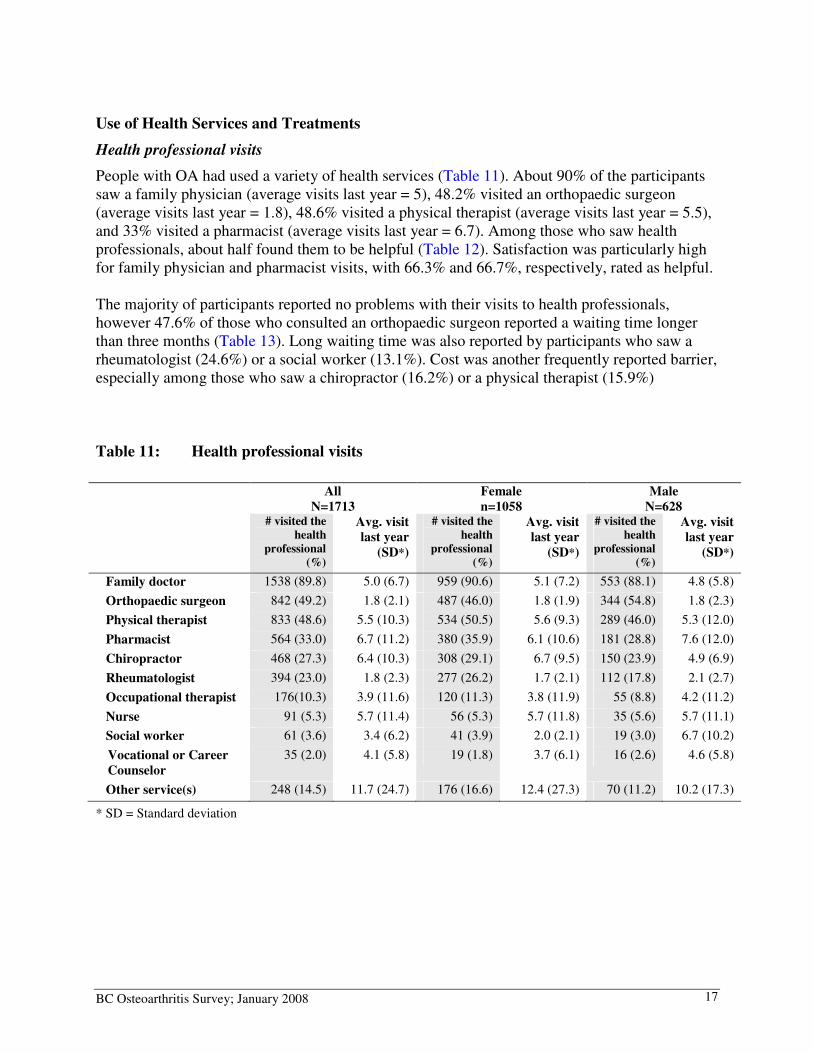
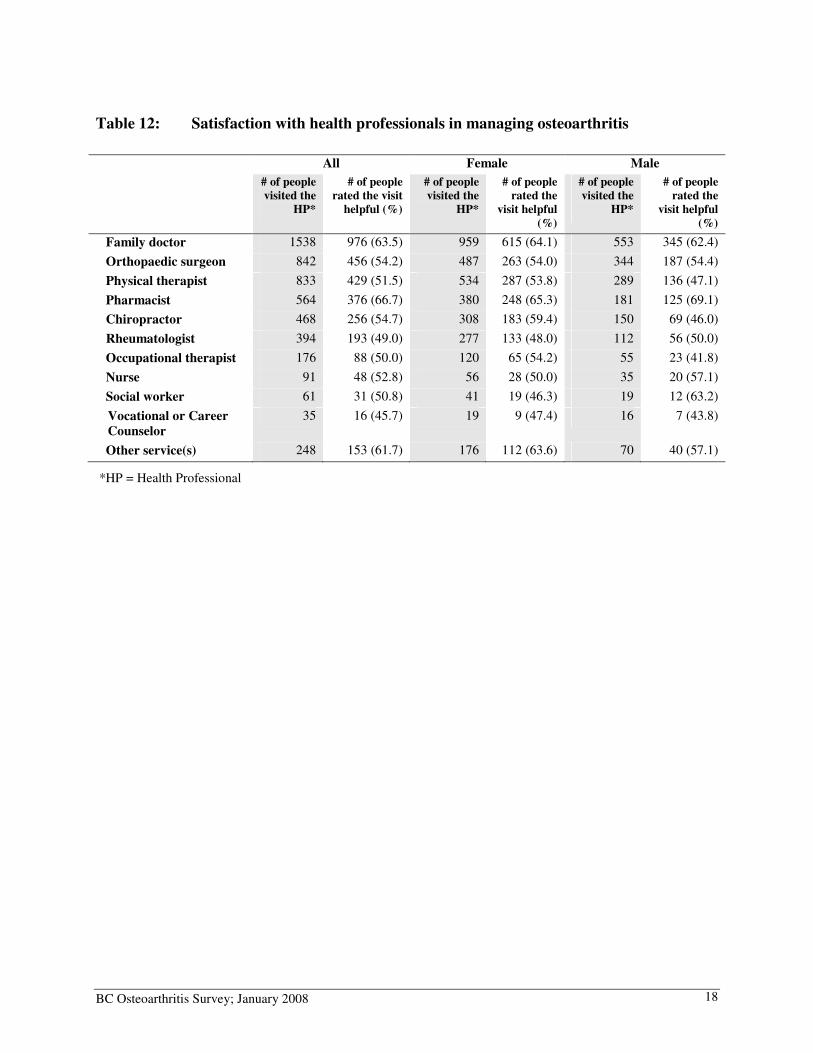
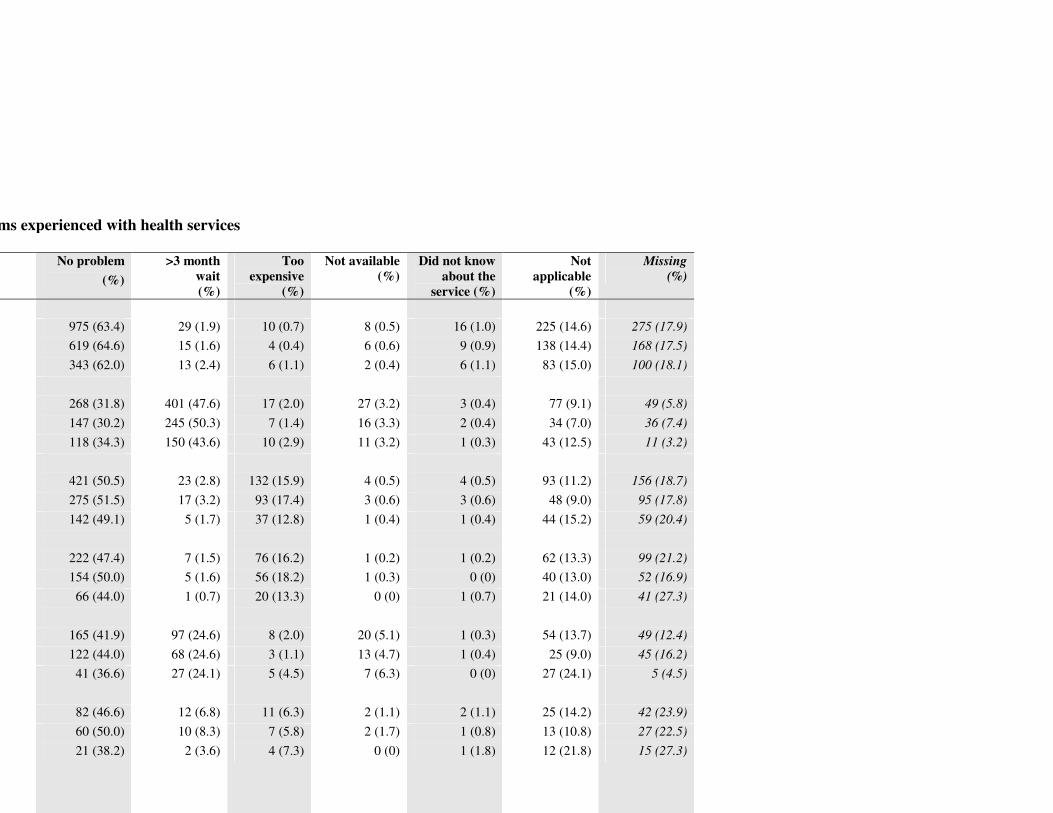
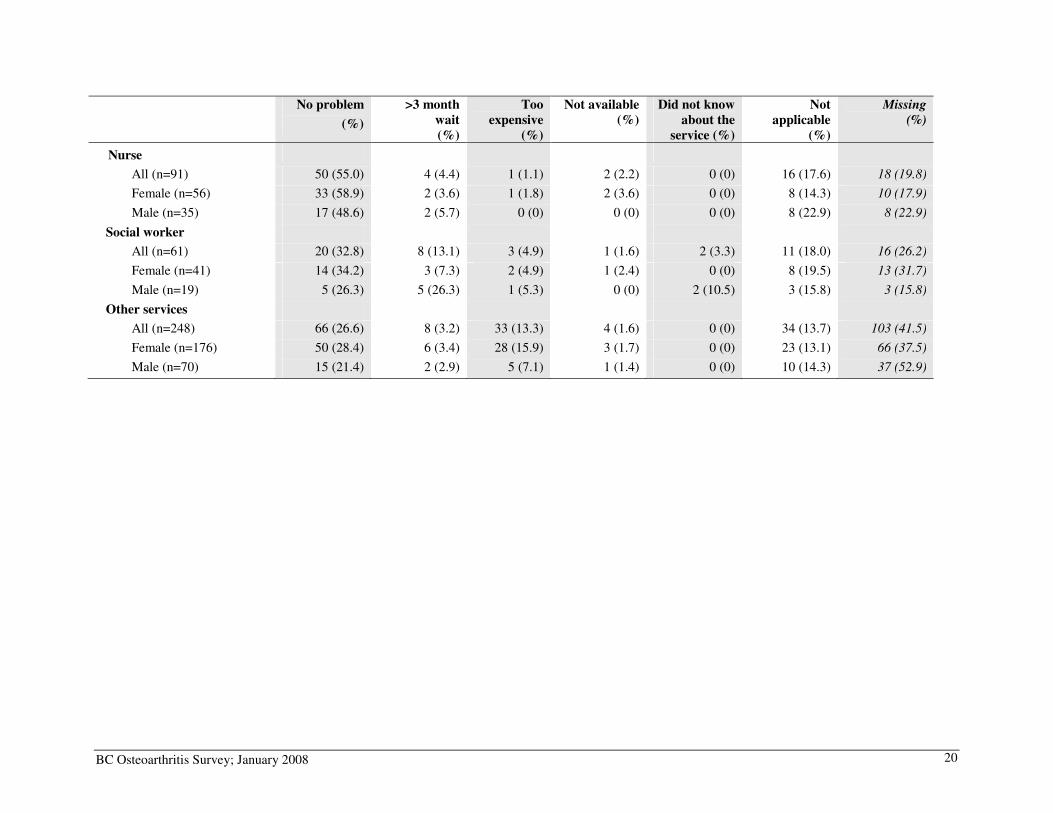
People with OA had used a variety of health services (Table 11). About 90% of the participants saw a family physician (average visits last year = 5), 48.2% visited an orthopaedic surgeon (average visits last year = 1.8), 48.6% visited a physical therapist (average visits last year = 5.5), and 33% visited a pharmacist (average visits last year = 6.7). Among those who saw health professionals, about half found them to be helpful (Table 12). Satisfaction was particularly high for family physician and pharmacist visits, with 66.3% and 66.7%, respectively, rated as helpful. The majority of participants reported no problems with their visits to health professionals, however 47.6% of those who consulted an orthopaedic surgeon reported a waiting time longer than three months (Table 13). Long waiting time was also reported by participants who saw a rheumatologist (24.6%) or a social worker (13.1%). Cost was another frequently reported barrier, especially among those who saw a chiropractor (16.2%) or a physical therapist (15.9%) Table 11: Health professional visits
All
N=1713
Female
n=1058
Male
N=628 # visited the
health
professional
(%)
Avg. visit
last year
(SD*)
# visited the
health
professional
(%)
Avg. visit
last year
(SD*)
# visited the
health
professional
(%)
Avg. visit
last year
(SD*)
Family doctor 1538 (89.8) 5.0 (6.7) 959 (90.6) 5.1 (7.2) 553 (88.1) 4.8 (5.8)
Orthopaedic surgeon 842 (49.2) 1.8 (2.1) 487 (46.0) 1.8 (1.9) 344 (54.8) 1.8 (2.3)
Physical therapist 833 (48.6) 5.5 (10.3) 534 (50.5) 5.6 (9.3) 289 (46.0) 5.3 (12.0)
Pharmacist 564 (33.0) 6.7 (11.2) 380 (35.9) 6.1 (10.6) 181 (28.8) 7.6 (12.0)
Chiropractor 468 (27.3) 6.4 (10.3) 308 (29.1) 6.7 (9.5) 150 (23.9) 4.9 (6.9)
Rheumatologist 394 (23.0) 1.8 (2.3) 277 (26.2) 1.7 (2.1) 112 (17.8) 2.1 (2.7)
Occupational therapist 176(10.3) 3.9 (11.6) 120 (11.3) 3.8 (11.9) 55 (8.8) 4.2 (11.2)
Nurse 91 (5.3) 5.7 (11.4) 56 (5.3) 5.7 (11.8) 35 (5.6) 5.7 (11.1)
Social worker 61 (3.6) 3.4 (6.2) 41 (3.9) 2.0 (2.1) 19 (3.0) 6.7 (10.2)
Vocational or Career
Counselor
35 (2.0) 4.1 (5.8) 19 (1.8) 3.7 (6.1) 16 (2.6) 4.6 (5.8)
Other service(s) 248 (14.5) 11.7 (24.7) 176 (16.6) 12.4 (27.3) 70 (11.2) 10.2 (17.3)
* SD = Standard deviation
BC Osteoarthritis Survey; January 2008 18
Table 12: Satisfaction with health professionals in managing osteoarthritis
All Female Male
# of people
visited the
HP*
# of people
rated the visit
helpful (%)
# of people
visited the
HP*
# of people
rated the
visit helpful
(%)
# of people
visited the
HP*
# of people
rated the
visit helpful
(%)
Family doctor 1538 976 (63.5) 959 615 (64.1) 553 345 (62.4)
Orthopaedic surgeon 842 456 (54.2) 487 263 (54.0) 344 187 (54.4)
Physical therapist 833 429 (51.5) 534 287 (53.8) 289 136 (47.1)
Pharmacist 564 376 (66.7) 380 248 (65.3) 181 125 (69.1)
Chiropractor 468 256 (54.7) 308 183 (59.4) 150 69 (46.0)
Rheumatologist 394 193 (49.0) 277 133 (48.0) 112 56 (50.0)
Occupational therapist 176 88 (50.0) 120 65 (54.2) 55 23 (41.8)
Nurse 91 48 (52.8) 56 28 (50.0) 35 20 (57.1)
Social worker 61 31 (50.8) 41 19 (46.3) 19 12 (63.2)
Vocational or Career
Counselor
35 16 (45.7) 19 9 (47.4) 16 7 (43.8)
Other service(s) 248 153 (61.7) 176 112 (63.6) 70 40 (57.1)
*HP = Health Professional
Problems experienced with health services
No problem
(%)
>3 month
wait
(%)
Too
expensive
(%)
Not available
(%)
Did not know
about the
service (%)
Not
applicable
(%)
Missing
(%)
975 (63.4) 29 (1.9) 10 (0.7) 8 (0.5) 16 (1.0) 225 (14.6) 275 (17.9)
619 (64.6) 15 (1.6) 4 (0.4) 6 (0.6) 9 (0.9) 138 (14.4) 168 (17.5)
343 (62.0) 13 (2.4) 6 (1.1) 2 (0.4) 6 (1.1) 83 (15.0) 100 (18.1)
268 (31.8) 401 (47.6) 17 (2.0) 27 (3.2) 3 (0.4) 77 (9.1) 49 (5.8)
147 (30.2) 245 (50.3) 7 (1.4) 16 (3.3) 2 (0.4) 34 (7.0) 36 (7.4)
118 (34.3) 150 (43.6) 10 (2.9) 11 (3.2) 1 (0.3) 43 (12.5) 11 (3.2)
421 (50.5) 23 (2.8) 132 (15.9) 4 (0.5) 4 (0.5) 93 (11.2) 156 (18.7)
275 (51.5) 17 (3.2) 93 (17.4) 3 (0.6) 3 (0.6) 48 (9.0) 95 (17.8)
142 (49.1) 5 (1.7) 37 (12.8) 1 (0.4) 1 (0.4) 44 (15.2) 59 (20.4)
222 (47.4) 7 (1.5) 76 (16.2) 1 (0.2) 1 (0.2) 62 (13.3) 99 (21.2)
154 (50.0) 5 (1.6) 56 (18.2) 1 (0.3) 0 (0) 40 (13.0) 52 (16.9)
66 (44.0) 1 (0.7) 20 (13.3) 0 (0) 1 (0.7) 21 (14.0) 41 (27.3)
165 (41.9) 97 (24.6) 8 (2.0) 20 (5.1) 1 (0.3) 54 (13.7) 49 (12.4)
122 (44.0) 68 (24.6) 3 (1.1) 13 (4.7) 1 (0.4) 25 (9.0) 45 (16.2)
41 (36.6) 27 (24.1) 5 (4.5) 7 (6.3) 0 (0) 27 (24.1) 5 (4.5)
82 (46.6) 12 (6.8) 11 (6.3) 2 (1.1) 2 (1.1) 25 (14.2) 42 (23.9)
60 (50.0) 10 (8.3) 7 (5.8) 2 (1.7) 1 (0.8) 13 (10.8) 27 (22.5)
21 (38.2) 2 (3.6) 4 (7.3) 0 (0) 1 (1.8) 12 (21.8) 15 (27.3)
BC Osteoarthritis Survey; January 2008 20
No problem
(%)
>3 month
wait
(%)
Too
expensive
(%)
Not available
(%)
Did not know
about the
service (%)
Not
applicable
(%)
Missing
(%)
Nurse
All (n=91) 50 (55.0) 4 (4.4) 1 (1.1) 2 (2.2) 0 (0) 16 (17.6) 18 (19.8)
Female (n=56) 33 (58.9) 2 (3.6) 1 (1.8) 2 (3.6) 0 (0) 8 (14.3) 10 (17.9)
Male (n=35) 17 (48.6) 2 (5.7) 0 (0) 0 (0) 0 (0) 8 (22.9) 8 (22.9)
Social worker
All (n=61) 20 (32.8) 8 (13.1) 3 (4.9) 1 (1.6) 2 (3.3) 11 (18.0) 16 (26.2)
Female (n=41) 14 (34.2) 3 (7.3) 2 (4.9) 1 (2.4) 0 (0) 8 (19.5) 13 (31.7)
Male (n=19) 5 (26.3) 5 (26.3) 1 (5.3) 0 (0) 2 (10.5) 3 (15.8) 3 (15.8)
Other services
All (n=248) 66 (26.6) 8 (3.2) 33 (13.3) 4 (1.6) 0 (0) 34 (13.7) 103 (41.5)
Female (n=176) 50 (28.4) 6 (3.4) 28 (15.9) 3 (1.7) 0 (0) 23 (13.1) 66 (37.5)
Male (n=70) 15 (21.4) 2 (2.9) 5 (7.1) 1 (1.4) 0 (0) 10 (14.3) 37 (52.9)
BC Osteoarthritis Survey; January 2008 21
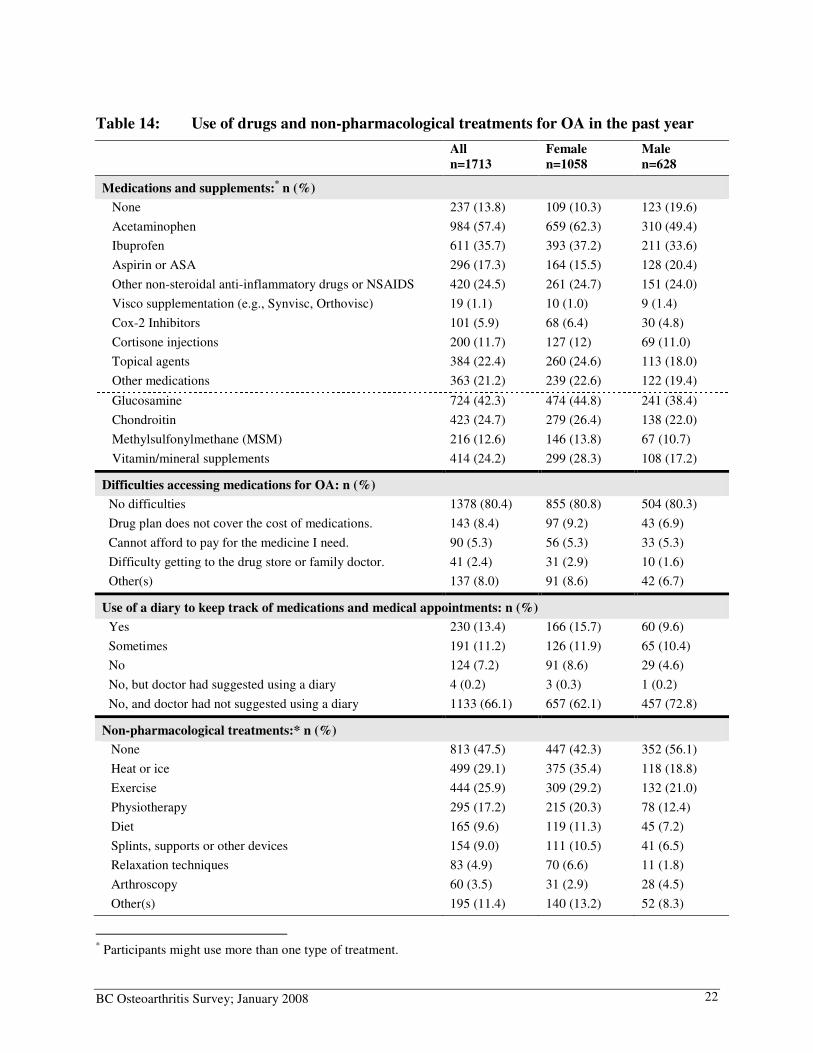
Medications, supplements, and non-pharmacological treatments
Among those who used prescription and non-prescription medications in the past year, 57.4% used acetaminophen (Table 14). The use of non-steroidal anti-inflammatory drugs (NSAIDs) was also common (35.7% ibuprofen, 17.3% aspirin, and 24.5% other NSAIDs), with a small percentage of people using Cox-2 selective inhibitors (5.9%). Many people also tried dietary supplements, with 42.3% using glucosamine, 24.7% chondroitin, 12.6% methylsulfonylmethane (MSM), and 24% using vitamin/mineral supplements. About 14% of respondents did not use any prescription and non-prescription medication or supplement in the past year (Table 14). The majority of people reported no access problem to medications for OA (80.4%). About 25% used a diary to record their medications and medical appointments at least some of the times. Among those who did not use diaries, most said that their doctors had not suggested using them (Table 14). Almost 53% of the participants used some form of non-pharmacological treatments in the past year, with 29% using thermotherapy (heat or ice) and 26% using exercise in the past year (Table 14).
BC Osteoarthritis Survey; January 2008 22
Table 14: Use of drugs and non-pharmacological treatments for OA in the past year
All
n=1713
Female
n=1058
Male
n=628
Medications and supplements:* n (%)
None 237 (13.8) 109 (10.3) 123 (19.6)
Acetaminophen 984 (57.4) 659 (62.3) 310 (49.4)
Ibuprofen 611 (35.7) 393 (37.2) 211 (33.6)
Aspirin or ASA 296 (17.3) 164 (15.5) 128 (20.4)
Other non-steroidal anti-inflammatory drugs or NSAIDS 420 (24.5) 261 (24.7) 151 (24.0)
Visco supplementation (e.g., Synvisc, Orthovisc) 19 (1.1) 10 (1.0) 9 (1.4)
Cox-2 Inhibitors 101 (5.9) 68 (6.4) 30 (4.8)
Cortisone injections 200 (11.7) 127 (12) 69 (11.0)
Topical agents 384 (22.4) 260 (24.6) 113 (18.0)
Other medications 363 (21.2) 239 (22.6) 122 (19.4)
Glucosamine 724 (42.3) 474 (44.8) 241 (38.4)
Chondroitin 423 (24.7) 279 (26.4) 138 (22.0)
Methylsulfonylmethane (MSM) 216 (12.6) 146 (13.8) 67 (10.7)
Vitamin/mineral supplements 414 (24.2) 299 (28.3) 108 (17.2)
Difficulties accessing medications for OA: n (%)
No difficulties 1378 (80.4) 855 (80.8) 504 (80.3)
Drug plan does not cover the cost of medications. 143 (8.4) 97 (9.2) 43 (6.9)
Cannot afford to pay for the medicine I need. 90 (5.3) 56 (5.3) 33 (5.3)
Difficulty getting to the drug store or family doctor. 41 (2.4) 31 (2.9) 10 (1.6)
Other(s) 137 (8.0) 91 (8.6) 42 (6.7)
Use of a diary to keep track of medications and medical appointments: n (%)
Yes 230 (13.4) 166 (15.7) 60 (9.6)
Sometimes 191 (11.2) 126 (11.9) 65 (10.4)
No 124 (7.2) 91 (8.6) 29 (4.6)
No, but doctor had suggested using a diary 4 (0.2) 3 (0.3) 1 (0.2)
No, and doctor had not suggested using a diary 1133 (66.1) 657 (62.1) 457 (72.8)
Non-pharmacological treatments:* n (%)
None 813 (47.5) 447 (42.3) 352 (56.1)
Heat or ice 499 (29.1) 375 (35.4) 118 (18.8)
Exercise 444 (25.9) 309 (29.2) 132 (21.0)
Physiotherapy 295 (17.2) 215 (20.3) 78 (12.4)
Diet 165 (9.6) 119 (11.3) 45 (7.2)
Splints, supports or other devices 154 (9.0) 111 (10.5) 41 (6.5)
Relaxation techniques 83 (4.9) 70 (6.6) 11 (1.8)
Arthroscopy 60 (3.5) 31 (2.9) 28 (4.5)
Other(s) 195 (11.4) 140 (13.2) 52 (8.3)
* Participants might use more than one type of treatment.
BC Osteoarthritis Survey; January 2008 23
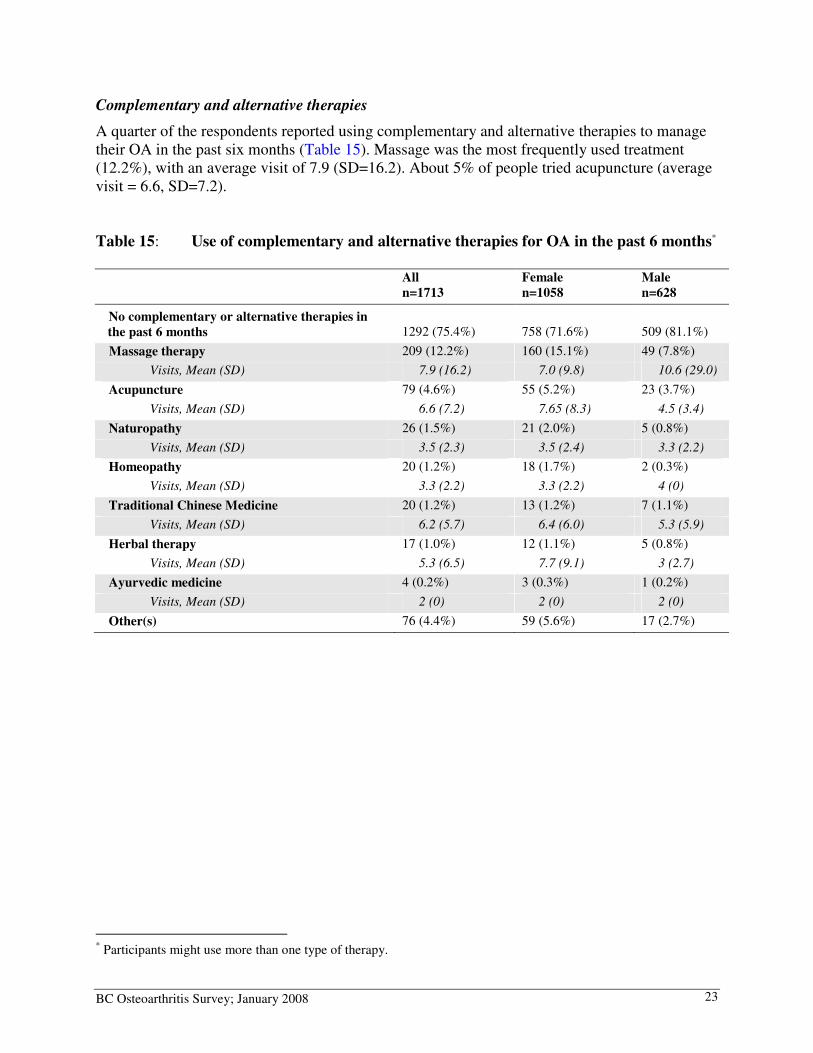
Complementary and alternative therapies
A quarter of the respondents reported using complementary and alternative therapies to manage their OA in the past six months (Table 15). Massage was the most frequently used treatment (12.2%), with an average visit of 7.9 (SD=16.2). About 5% of people tried acupuncture (average visit = 6.6, SD=7.2). Table 15: Use of complementary and alternative therapies for OA in the past 6 months*
All
n=1713
Female
n=1058
Male
n=628
No complementary or alternative therapies in
the past 6 months 1292 (75.4%) 758 (71.6%) 509 (81.1%)
Massage therapy 209 (12.2%) 160 (15.1%) 49 (7.8%)
Visits, Mean (SD) 7.9 (16.2) 7.0 (9.8) 10.6 (29.0)
Acupuncture 79 (4.6%) 55 (5.2%) 23 (3.7%)
Visits, Mean (SD) 6.6 (7.2) 7.65 (8.3) 4.5 (3.4)
Naturopathy 26 (1.5%) 21 (2.0%) 5 (0.8%)
Visits, Mean (SD) 3.5 (2.3) 3.5 (2.4) 3.3 (2.2)
Homeopathy 20 (1.2%) 18 (1.7%) 2 (0.3%)
Visits, Mean (SD) 3.3 (2.2) 3.3 (2.2) 4 (0)
Traditional Chinese Medicine 20 (1.2%) 13 (1.2%) 7 (1.1%)
Visits, Mean (SD) 6.2 (5.7) 6.4 (6.0) 5.3 (5.9)
Herbal therapy 17 (1.0%) 12 (1.1%) 5 (0.8%)
Visits, Mean (SD) 5.3 (6.5) 7.7 (9.1) 3 (2.7)
Ayurvedic medicine 4 (0.2%) 3 (0.3%) 1 (0.2%)
Visits, Mean (SD) 2 (0) 2 (0) 2 (0)
Other(s) 76 (4.4%) 59 (5.6%) 17 (2.7%)
* Participants might use more than one type of therapy.
BC Osteoarthritis Survey; January 2008 24
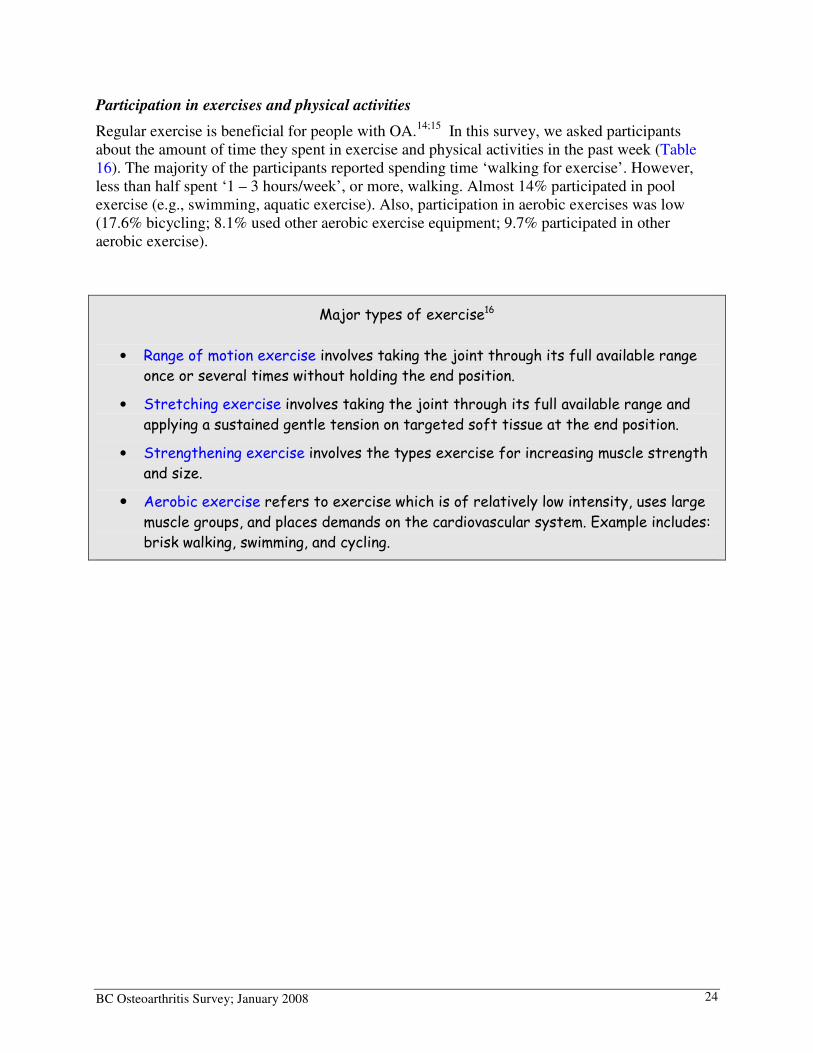
Participation in exercises and physical activities
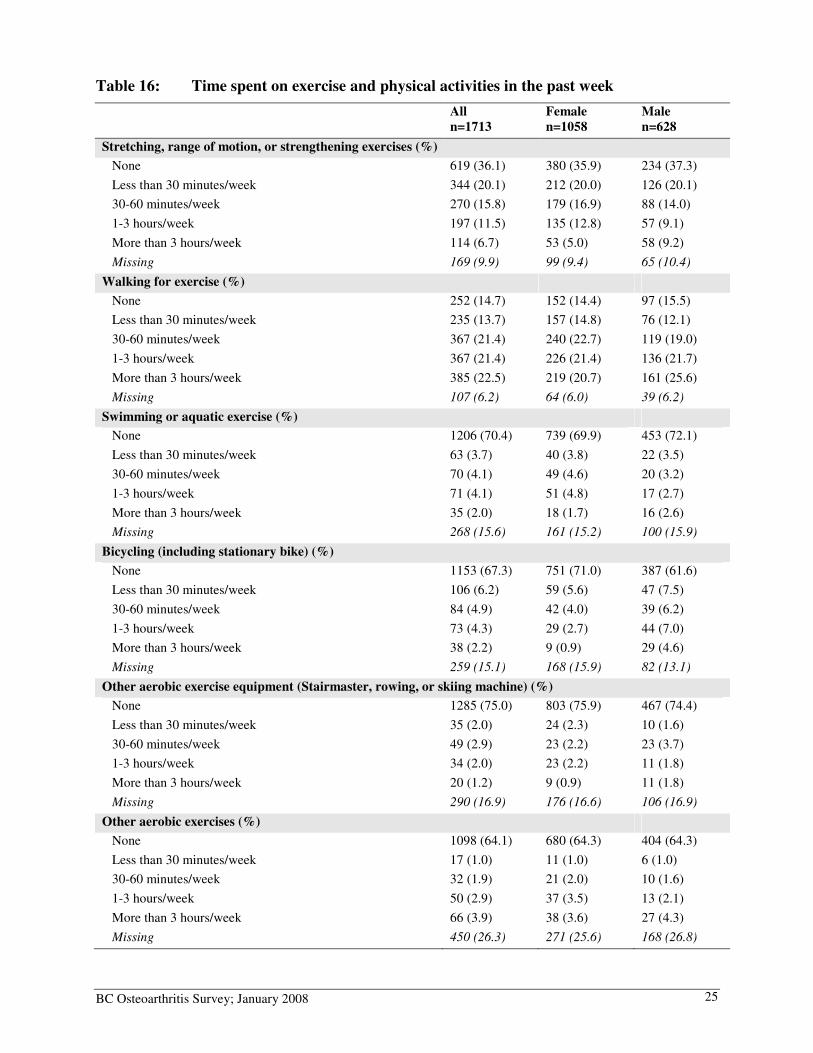
Regular exercise is beneficial for people with OA.14;15 In this survey, we asked participants about the amount of time they spent in exercise and physical activities in the past week (Table 16). The majority of the participants reported spending time ‘walking for exercise’. However, less than half spent ‘1 – 3 hours/week’, or more, walking. Almost 14% participated in pool exercise (e.g., swimming, aquatic exercise). Also, participation in aerobic exercises was low (17.6% bicycling; 8.1% used other aerobic exercise equipment; 9.7% participated in other aerobic exercise).
Major types of exercise16
• Range of motion exercise involves taking the joint through its full available range
once or several times without holding the end position.
• Stretching exercise involves taking the joint through its full available range and
applying a sustained gentle tension on targeted soft tissue at the end position.
• Strengthening exercise involves the types exercise for increasing muscle strength
and size.
• Aerobic exercise refers to exercise which is of relatively low intensity, uses large
muscle groups, and places demands on the cardiovascular system. Example includes:
brisk walking, swimming, and cycling.
BC Osteoarthritis Survey; January 2008 25
Table 16: Time spent on exercise and physical activities in the past week
All
n=1713
Female
n=1058
Male
n=628
Stretching, range of motion, or strengthening exercises (%)
None 619 (36.1) 380 (35.9) 234 (37.3)
Less than 30 minutes/week 344 (20.1) 212 (20.0) 126 (20.1)
30-60 minutes/week 270 (15.8) 179 (16.9) 88 (14.0)
1-3 hours/week 197 (11.5) 135 (12.8) 57 (9.1)
More than 3 hours/week 114 (6.7) 53 (5.0) 58 (9.2)
Missing 169 (9.9) 99 (9.4) 65 (10.4)
Walking for exercise (%)
None 252 (14.7) 152 (14.4) 97 (15.5)
Less than 30 minutes/week 235 (13.7) 157 (14.8) 76 (12.1)
30-60 minutes/week 367 (21.4) 240 (22.7) 119 (19.0)
1-3 hours/week 367 (21.4) 226 (21.4) 136 (21.7)
More than 3 hours/week 385 (22.5) 219 (20.7) 161 (25.6)
Missing 107 (6.2) 64 (6.0) 39 (6.2)
Swimming or aquatic exercise (%)
None 1206 (70.4) 739 (69.9) 453 (72.1)
Less than 30 minutes/week 63 (3.7) 40 (3.8) 22 (3.5)
30-60 minutes/week 70 (4.1) 49 (4.6) 20 (3.2)
1-3 hours/week 71 (4.1) 51 (4.8) 17 (2.7)
More than 3 hours/week 35 (2.0) 18 (1.7) 16 (2.6)
Missing 268 (15.6) 161 (15.2) 100 (15.9)
Bicycling (including stationary bike) (%)
None 1153 (67.3) 751 (71.0) 387 (61.6)
Less than 30 minutes/week 106 (6.2) 59 (5.6) 47 (7.5)
30-60 minutes/week 84 (4.9) 42 (4.0) 39 (6.2)
1-3 hours/week 73 (4.3) 29 (2.7) 44 (7.0)
More than 3 hours/week 38 (2.2) 9 (0.9) 29 (4.6)
Missing 259 (15.1) 168 (15.9) 82 (13.1)
Other aerobic exercise equipment (Stairmaster, rowing, or skiing machine) (%)
None 1285 (75.0) 803 (75.9) 467 (74.4)
Less than 30 minutes/week 35 (2.0) 24 (2.3) 10 (1.6)
30-60 minutes/week 49 (2.9) 23 (2.2) 23 (3.7)
1-3 hours/week 34 (2.0) 23 (2.2) 11 (1.8)
More than 3 hours/week 20 (1.2) 9 (0.9) 11 (1.8)
Missing 290 (16.9) 176 (16.6) 106 (16.9)
Other aerobic exercises (%)
None 1098 (64.1) 680 (64.3) 404 (64.3)
Less than 30 minutes/week 17 (1.0) 11 (1.0) 6 (1.0)
30-60 minutes/week 32 (1.9) 21 (2.0) 10 (1.6)
1-3 hours/week 50 (2.9) 37 (3.5) 13 (2.1)
More than 3 hours/week 66 (3.9) 38 (3.6) 27 (4.3)
Missing 450 (26.3) 271 (25.6) 168 (26.8)
BC Osteoarthritis Survey; January 2008 26
Community Services for Self-Management
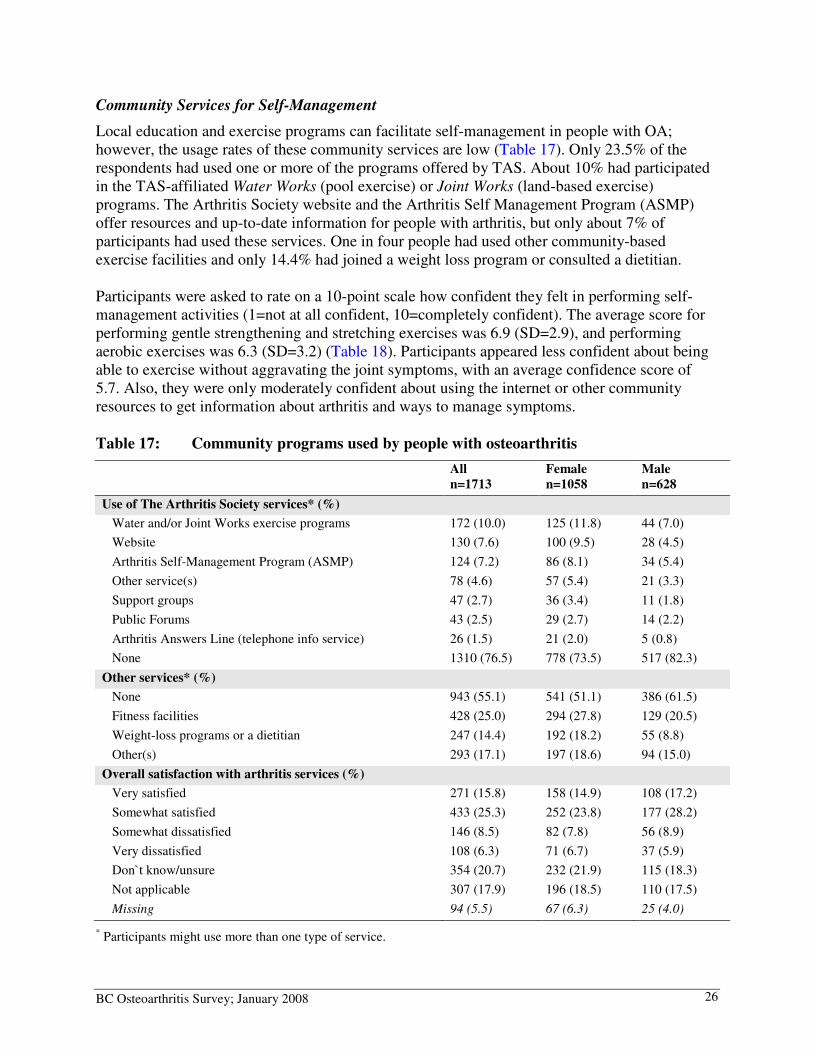
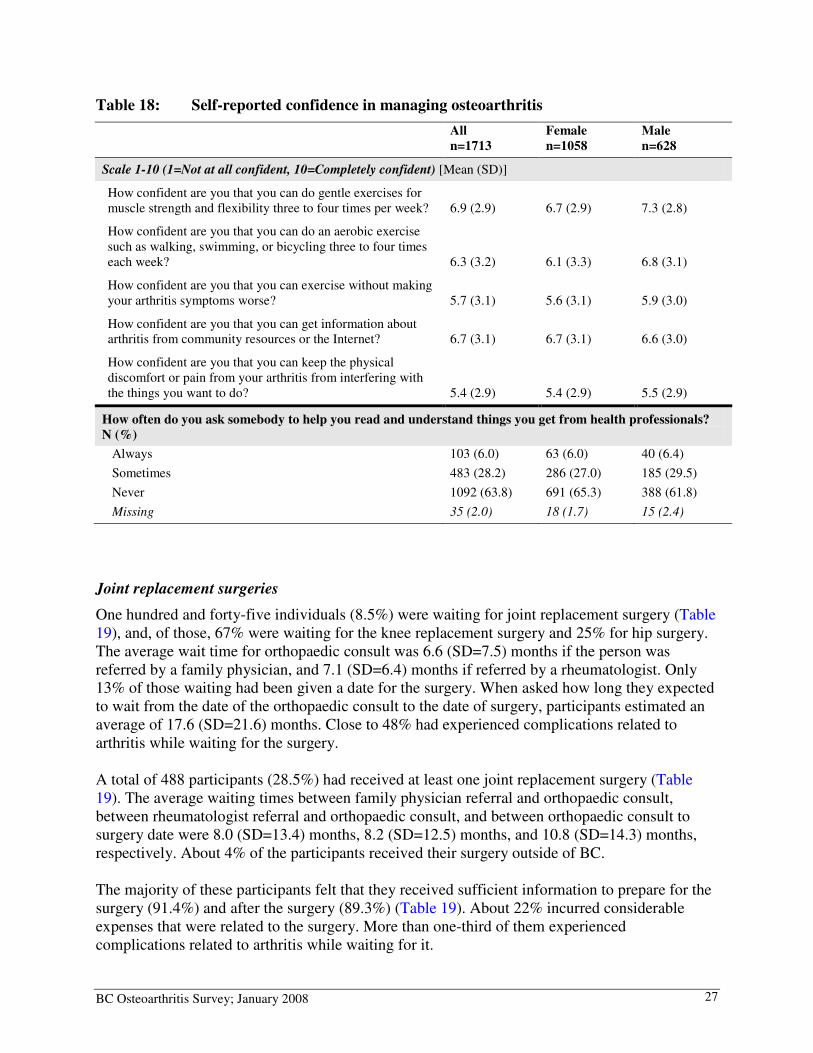
Local education and exercise programs can facilitate self-management in people with OA; however, the usage rates of these community services are low (Table 17). Only 23.5% of the respondents had used one or more of the programs offered by TAS. About 10% had participated in the TAS-affiliated Water Works (pool exercise) or Joint Works (land-based exercise) programs. The Arthritis Society website and the Arthritis Self Management Program (ASMP) offer resources and up-to-date information for people with arthritis, but only about 7% of participants had used these services. One in four people had used other community-based exercise facilities and only 14.4% had joined a weight loss program or consulted a dietitian. Participants were asked to rate on a 10-point scale how confident they felt in performing self-management activities (1=not at all confident, 10=completely confident). The average score for performing gentle strengthening and stretching exercises was 6.9 (SD=2.9), and performing aerobic exercises was 6.3 (SD=3.2) (Table 18). Participants appeared less confident about being able to exercise without aggravating the joint symptoms, with an average confidence score of 5.7. Also, they were only moderately confident about using the internet or other community resources to get information about arthritis and ways to manage symptoms. Table 17: Community programs used by people with osteoarthritis
All
n=1713
Female
n=1058
Male
n=628
Use of The Arthritis Society services* (%)
Water and/or Joint Works exercise programs 172 (10.0) 125 (11.8) 44 (7.0)
Website 130 (7.6) 100 (9.5) 28 (4.5)
Arthritis Self-Management Program (ASMP) 124 (7.2) 86 (8.1) 34 (5.4)
Other service(s) 78 (4.6) 57 (5.4) 21 (3.3)
Support groups 47 (2.7) 36 (3.4) 11 (1.8)
Public Forums 43 (2.5) 29 (2.7) 14 (2.2)
Arthritis Answers Line (telephone info service) 26 (1.5) 21 (2.0) 5 (0.8)
None 1310 (76.5) 778 (73.5) 517 (82.3)
Other services* (%)
None 943 (55.1) 541 (51.1) 386 (61.5)
Fitness facilities 428 (25.0) 294 (27.8) 129 (20.5)
Weight-loss programs or a dietitian 247 (14.4) 192 (18.2) 55 (8.8)
Other(s) 293 (17.1) 197 (18.6) 94 (15.0)
Overall satisfaction with arthritis services (%)
Very satisfied 271 (15.8) 158 (14.9) 108 (17.2)
Somewhat satisfied 433 (25.3) 252 (23.8) 177 (28.2)
Somewhat dissatisfied 146 (8.5) 82 (7.8) 56 (8.9)
Very dissatisfied 108 (6.3) 71 (6.7) 37 (5.9)
Don`t know/unsure 354 (20.7) 232 (21.9) 115 (18.3)
Not applicable 307 (17.9) 196 (18.5) 110 (17.5)
Missing 94 (5.5) 67 (6.3) 25 (4.0)
* Participants might use more than one type of service.
BC Osteoarthritis Survey; January 2008 27
Table 18: Self-reported confidence in managing osteoarthritis
All
n=1713
Female
n=1058
Male
n=628
Scale 1-10 (1=Not at all confident, 10=Completely confident) [Mean (SD)]
How confident are you that you can do gentle exercises for muscle strength and flexibility three to four times per week? 6.9 (2.9) 6.7 (2.9) 7.3 (2.8)
How confident are you that you can do an aerobic exercise such as walking, swimming, or bicycling three to four times each week? 6.3 (3.2) 6.1 (3.3) 6.8 (3.1)
How confident are you that you can exercise without making your arthritis symptoms worse? 5.7 (3.1) 5.6 (3.1) 5.9 (3.0)
How confident are you that you can get information about arthritis from community resources or the Internet? 6.7 (3.1) 6.7 (3.1) 6.6 (3.0)
How confident are you that you can keep the physical discomfort or pain from your arthritis from interfering with the things you want to do? 5.4 (2.9) 5.4 (2.9) 5.5 (2.9)
How often do you ask somebody to help you read and understand things you get from health professionals?
N (%)
Always 103 (6.0) 63 (6.0) 40 (6.4)
Sometimes 483 (28.2) 286 (27.0) 185 (29.5)
Never 1092 (63.8) 691 (65.3) 388 (61.8)
Missing 35 (2.0) 18 (1.7) 15 (2.4)
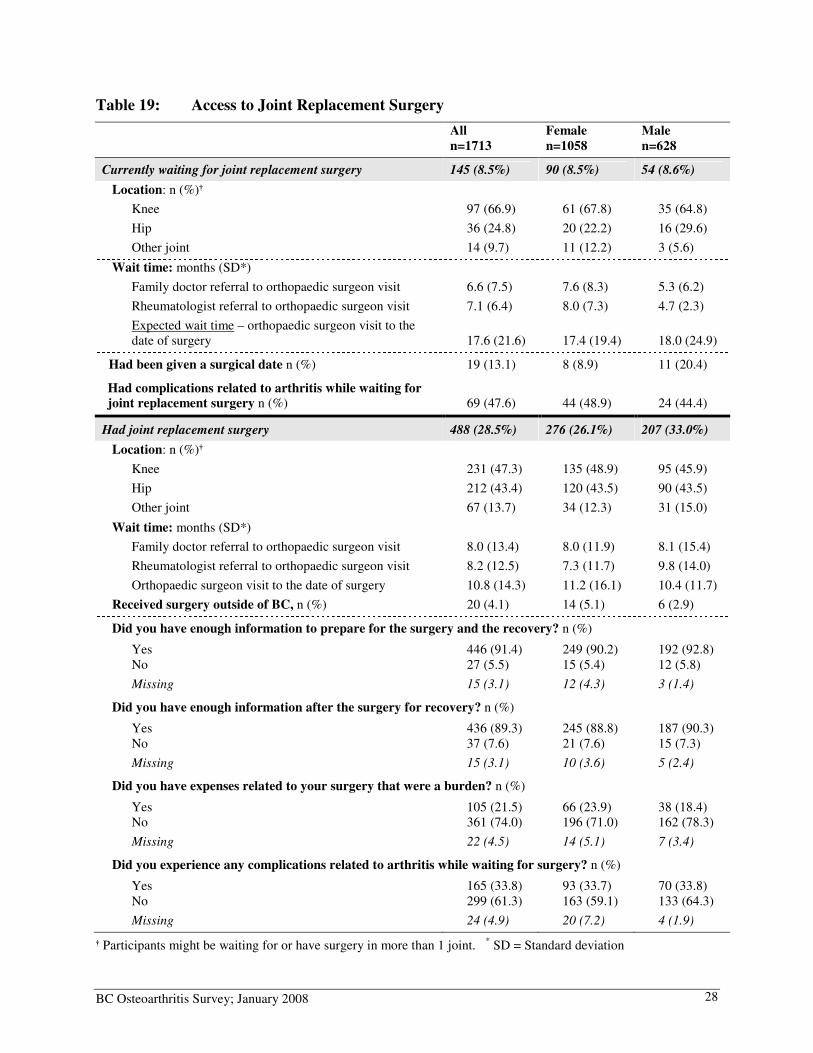
Joint replacement surgeries
One hundred and forty-five individuals (8.5%) were waiting for joint replacement surgery (Table 19), and, of those, 67% were waiting for the knee replacement surgery and 25% for hip surgery. The average wait time for orthopaedic consult was 6.6 (SD=7.5) months if the person was referred by a family physician, and 7.1 (SD=6.4) months if referred by a rheumatologist. Only 13% of those waiting had been given a date for the surgery. When asked how long they expected to wait from the date of the orthopaedic consult to the date of surgery, participants estimated an average of 17.6 (SD=21.6) months. Close to 48% had experienced complications related to arthritis while waiting for the surgery. A total of 488 participants (28.5%) had received at least one joint replacement surgery (Table 19). The average waiting times between family physician referral and orthopaedic consult, between rheumatologist referral and orthopaedic consult, and between orthopaedic consult to surgery date were 8.0 (SD=13.4) months, 8.2 (SD=12.5) months, and 10.8 (SD=14.3) months, respectively. About 4% of the participants received their surgery outside of BC. The majority of these participants felt that they received sufficient information to prepare for the surgery (91.4%) and after the surgery (89.3%) (Table 19). About 22% incurred considerable expenses that were related to the surgery. More than one-third of them experienced complications related to arthritis while waiting for it.
BC Osteoarthritis Survey; January 2008 28
Table 19: Access to Joint Replacement Surgery
All
n=1713
Female
n=1058
Male
n=628
Currently waiting for joint replacement surgery 145 (8.5%) 90 (8.5%) 54 (8.6%)
Location: n (%)†
Knee 97 (66.9) 61 (67.8) 35 (64.8)
Hip 36 (24.8) 20 (22.2) 16 (29.6)
Other joint 14 (9.7) 11 (12.2) 3 (5.6)
Wait time: months (SD*)
Family doctor referral to orthopaedic surgeon visit 6.6 (7.5) 7.6 (8.3) 5.3 (6.2)
Rheumatologist referral to orthopaedic surgeon visit 7.1 (6.4) 8.0 (7.3) 4.7 (2.3)
Expected wait time – orthopaedic surgeon visit to the date of surgery 17.6 (21.6) 17.4 (19.4) 18.0 (24.9)
Had been given a surgical date n (%) 19 (13.1) 8 (8.9) 11 (20.4)
Had complications related to arthritis while waiting for joint replacement surgery n (%) 69 (47.6) 44 (48.9) 24 (44.4)
Had joint replacement surgery 488 (28.5%) 276 (26.1%) 207 (33.0%)
Location: n (%)†
Knee 231 (47.3) 135 (48.9) 95 (45.9)
Hip 212 (43.4) 120 (43.5) 90 (43.5)
Other joint 67 (13.7) 34 (12.3) 31 (15.0)
Wait time: months (SD*)
Family doctor referral to orthopaedic surgeon visit 8.0 (13.4) 8.0 (11.9) 8.1 (15.4)
Rheumatologist referral to orthopaedic surgeon visit 8.2 (12.5) 7.3 (11.7) 9.8 (14.0)
Orthopaedic surgeon visit to the date of surgery 10.8 (14.3) 11.2 (16.1) 10.4 (11.7)
Received surgery outside of BC, n (%) 20 (4.1) 14 (5.1) 6 (2.9)
Did you have enough information to prepare for the surgery and the recovery? n (%)
Yes 446 (91.4) 249 (90.2) 192 (92.8) No 27 (5.5) 15 (5.4) 12 (5.8)
Missing 15 (3.1) 12 (4.3) 3 (1.4)
Did you have enough information after the surgery for recovery? n (%)
Yes 436 (89.3) 245 (88.8) 187 (90.3) No 37 (7.6) 21 (7.6) 15 (7.3)
Missing 15 (3.1) 10 (3.6) 5 (2.4)
Did you have expenses related to your surgery that were a burden? n (%)
Yes 105 (21.5) 66 (23.9) 38 (18.4) No 361 (74.0) 196 (71.0) 162 (78.3)
Missing 22 (4.5) 14 (5.1) 7 (3.4)
Did you experience any complications related to arthritis while waiting for surgery? n (%)
Yes 165 (33.8) 93 (33.7) 70 (33.8) No 299 (61.3) 163 (59.1) 133 (64.3)
Missing 24 (4.9) 20 (7.2) 4 (1.9)
† Participants might be waiting for or have surgery in more than 1 joint. * SD = Standard deviation
BC Osteoarthritis Survey; January 2008 29
Did People with Osteoarthritis Receive the Treatment They Needed?
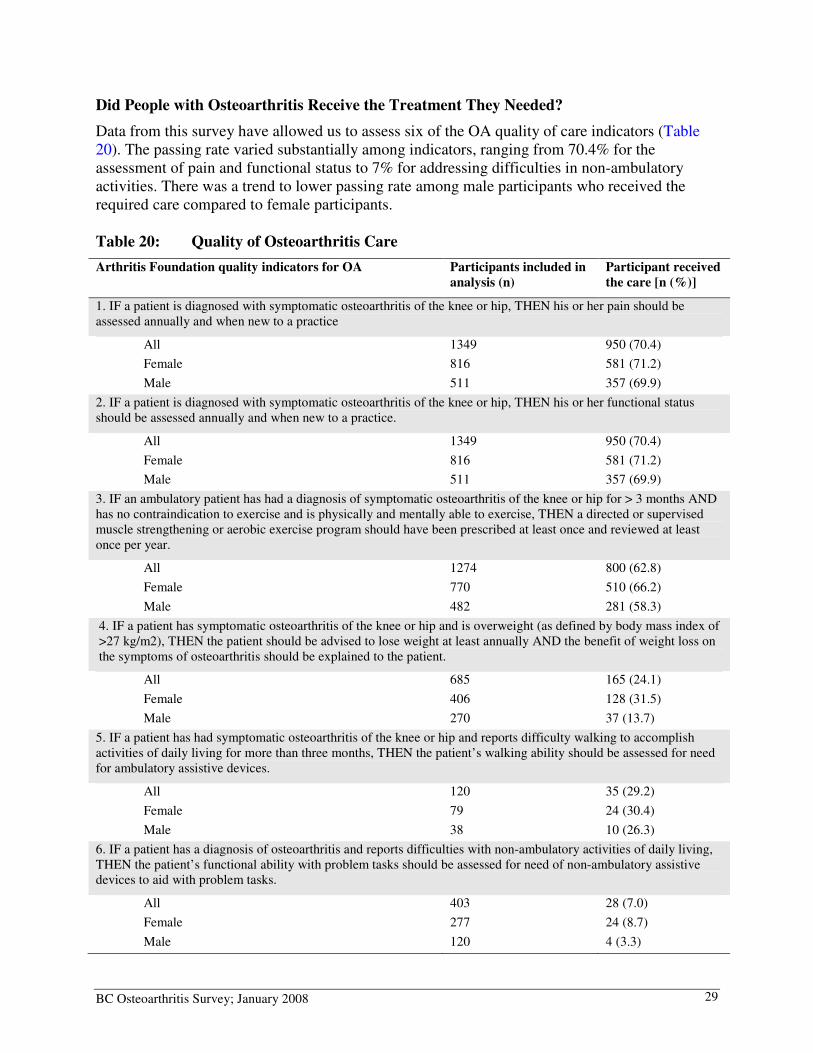
Data from this survey have allowed us to assess six of the OA quality of care indicators (Table 20). The passing rate varied substantially among indicators, ranging from 70.4% for the assessment of pain and functional status to 7% for addressing difficulties in non-ambulatory activities. There was a trend to lower passing rate among male participants who received the required care compared to female participants. Table 20: Quality of Osteoarthritis Care
Arthritis Foundation quality indicators for OA Participants included in
analysis (n)
Participant received
the care [n (%)]
1. IF a patient is diagnosed with symptomatic osteoarthritis of the knee or hip, THEN his or her pain should be assessed annually and when new to a practice
All 1349 950 (70.4)
Female 816 581 (71.2)
Male 511 357 (69.9)
2. IF a patient is diagnosed with symptomatic osteoarthritis of the knee or hip, THEN his or her functional status should be assessed annually and when new to a practice.
All 1349 950 (70.4)
Female 816 581 (71.2)
Male 511 357 (69.9)
3. IF an ambulatory patient has had a diagnosis of symptomatic osteoarthritis of the knee or hip for > 3 months AND has no contraindication to exercise and is physically and mentally able to exercise, THEN a directed or supervised muscle strengthening or aerobic exercise program should have been prescribed at least once and reviewed at least once per year.
All 1274 800 (62.8)
Female 770 510 (66.2)
Male 482 281 (58.3)
4. IF a patient has symptomatic osteoarthritis of the knee or hip and is overweight (as defined by body mass index of >27 kg/m2), THEN the patient should be advised to lose weight at least annually AND the benefit of weight loss on the symptoms of osteoarthritis should be explained to the patient.
All 685 165 (24.1)
Female 406 128 (31.5)
Male 270 37 (13.7)
5. IF a patient has had symptomatic osteoarthritis of the knee or hip and reports difficulty walking to accomplish activities of daily living for more than three months, THEN the patient’s walking ability should be assessed for need for ambulatory assistive devices.
All 120 35 (29.2)
Female 79 24 (30.4)
Male 38 10 (26.3)
6. IF a patient has a diagnosis of osteoarthritis and reports difficulties with non-ambulatory activities of daily living, THEN the patient’s functional ability with problem tasks should be assessed for need of non-ambulatory assistive devices to aid with problem tasks.
All 403 28 (7.0)
Female 277 24 (8.7)
Male 120 4 (3.3)
BC Osteoarthritis Survey; January 2008 30
Chapter 5: CCCConclusion
This survey is the first to provide a comprehensive description on the use of health services by people with OA in British Columbia. Our findings present a positive picture of the general health of this population. Despite having OA, most of the participants viewed themselves as having good health and that their health status was relatively stable compared to a year ago. On the other hand, the results confirm the gaps in the management of OA that have been reported in the literature, especially the poor uptake of inexpensive interventions that can effectively reduce long term disability and the need for joint replacement surgery.17-19 This survey also documented the challenges experienced by people when seeking access to health professionals and treatments, such as the waiting time for orthopaedic consults and surgeries, and the cost of using rehabilitation treatments. The following major gaps in OA care are identified in this survey:
• Use of exercise and physical activity was below international recommendations
for the management of OA
The American College of Rheumatology’s (ACR) recommends that, at minimum, people with arthritis should accumulate 30 minutes of moderate-intensity physical activity (e.g., brisk walking) 3 days a week or the equivalent 90 minutes per week.20 In this survey, although the majority of participants reported that they walked for exercise, less than half met the ACR recommendation on physical activity. Exercise is considered a subcategory of physical activity and is specially designed to maintain or improve joint movement, muscle strength, and physical fitness. Only 26% of the survey participants reported that they exercised in the past year.
• The majority of people with hip/knee OA had not received weight-loss
counseling even if they were overweight
Obesity is one of the most important risk factors for the development of severe OA of the knee.21 This survey found that less than one in four people with knee or hip OA and a BMI >27 (i.e., defined as overweight according to the US Arthritis Foundation OA quality indicators) had seen a dietitian or attended a weight-loss program.
• Long waiting time for joint replacement surgery
One of the most frequently reported access barriers to health professionals is the waiting time, especially for orthopaedic surgeons. Among those who were waiting for joint surgery, the average delay for their initial orthopaedic consult was six to seven months. In addition, these individuals estimated a delay of another 18 months from the surgeon visit to the date of surgery, which exceeded the recommended waiting time of six months or less in this country.22-24 Among those who already had joint replacement surgery, more than one in three reported arthritis-related complications while waiting.
BC Osteoarthritis Survey; January 2008 31
• Community education and exercise programs fail to reach people with OA
The use of community services is very low among people with OA. For example, The Arthritis Society BC & Yukon Division provides education, exercise program and information support to people with arthritis across the province, but almost 77% of our participants had never used these resources. Furthermore, only one in four people had visited a community fitness centre. Since most of these services can help to facilitate successful self-care, major efforts will be required to increase the awareness of these programs among patients and among health professionals.
• People with severe disability were not assessed for the necessary assistive
devices
Only 7% of participants who reported severe difficulties with non-ambulatory activities (e.g., putting on socks; getting in/out of bath) had been assessed by occupational therapists, who are experts in prescribing aids and devices to address functional limitations related to OA.
Recommendations
• Improve support for people with OA to engage in exercise and physical
activities
In this survey, participants were only moderately confident in their ability to exercise three to four times a week, or to exercise without aggravating their symptoms. The latter can become an additional barrier to exercise. Although exercise improves OA pain,25 people in pain may avoid exercise, and therefore, may not adhere to the exercise regime.26 To address this, health professionals can provide guidance and modify exercises according to the individuals’ symptoms and abilities. Also, integrating physical activities and exercise into one’s personal lifestyle helps adherence.15 Health professionals can help a person develop an achievable exercise plan and encourage the use of a diary to monitor the progress. This strategy has been shown to be successful in improving exercise adherence in people after coronary rehabilitation.27 Information about community exercise programs and facilities should also be provided to people with OA.
• Focus on weight-loss in people with OA who are overweight
Improving weight management in this population is critical. High body mass index (BMI) is associated with deterioration in the functional status in the first three years of follow-up after the diagnosis.28 Among people with OA who are overweight, even a moderate weight loss of 5% can significantly improve physical disability.29 Resources such as Dial-a-Dietitian (www.dialadietitian.org/index.asp), funded by the MoH, can be recommended to those who require information about nutrition and weight management
• Educate the public about myths and facts of OA
One of the challenges of managing OA is the prevailing perception that it is a part of aging and that little can be done to slow down the progress of joint damage.30-32 These misconceptions also likely contribute to the low use of effective treatments in the OA
BC Osteoarthritis Survey; January 2008 32
population. Our findings suggest that future research should be directed to the evaluation of interventions that improve the awareness about the myths and facts of OA, improve the quality of OA care in the community, and facilitate the use of inexpensive and effective approaches, such as improving physical fitness and reducing to a healthy weight, as the first-line management.
• Identify, test and implement alternative models to provide care for people
requiring joint replacement surgery
A number of health service delivery models involving nurses and rehabilitation professionals in advanced practice roles have been developed to improve the waiting time and care for people who need joint replacement surgery.33 Examples include the use of advanced practice physical therapist to triage patients referred for orthopedic consults,34;35 or the use of advanced orthopedic trained therapists to provide post-surgical rehabilitation.35;36 These models may be considered, taking into account the shortage of arthritis health professionals in this province.
BC Osteoarthritis Survey; January 2008 33
RRRReferences
(1) Kopec JA, Rahman MM, Berthelot JM, Le PC, Aghajanian J, Sayre EC et al. Descriptive epidemiology of osteoarthritis in British Columbia, Canada. Journal of Rheumatology 2007; 34(2):386-393.
(2) Fines P, Flanagan W, Kopec JA, Rahman MM, Sayre EC, Cibere J et al. Projecting number of osteoarthritis patients from 2001 to 2021 in Canada using microsimulation. International Society for Quality of Life - Quality of Life Research (Suppl) , A-49, Abstract #1598. 2007.
(3) Ling SM, Rudolph K. Osteoarthritis. In: Bartlett SJ, Bingham CO, Maricic MJ, Iversen MD, Ruffing V, editors. Clinical Care in the Rheumatic Diseases. 3rd Edition ed. Atlanda, GA: Association of Rheumatology Health Professionals; 2006. 127-134.
(4) Corti MC, Rigon C. Epidemiology of osteoarthritis: prevalence, risk factors and functional impact. Aging-Clinical & Experimental Research 2003; 15(5):359-363.
(5) Hochberg MC, Altman RD, Brandt KD, Clark BM, Dieppe PA, Griffin MR et al. Guidelines for the medical management of osteoarthritis. Part I. Osteoarthritis of the hip.American College of Rheumatology. Arthritis Rheum 1995; 38(11):1535-1540.
(6) Hochberg MC, Altman RD, Brandt KD, Clark BM, Dieppe PA, Griffin MR et al. Guidelines for the medical management of osteoarthritis. Part II. Osteoarthritis of the knee.American College of Rheumatology. Arthritis Rheum 1995; 38(11):1541-1546.
(7) Ottawa panel evidence-based clinical practice guidelines for therapeutic exercises and manual therapy in the management of osteoarthritis. Physical Therapy 2005; 85(9):907-971.
(8) Bellamy N, Buchanan WW, Goldsmith CH, Campbell J, Stitt LW. Validation study of WOMAC: A health status instrument for measuring clinically important patient relevant outcomes to antirheumatic drug therapy in patients with osteoarthritis of the hip or knee. J Rheumatol 1988; 15:1833-1840.
(9) Stewart AL, Hays RD, Ware JE, Jr. The MOS short-form general health survey. Reliability and validity in a patient population. Medical Care 1988; 26(7):724-735.
(10) Ware JE, Jr., Kosinski M, Dewey ME, Gandek B. How to Score and Interpret Single-Item Health Status Measures. A Manual for User of the SF-8 Health Survey. Lincoln, RI.: QualityMetric, Inc.; 2008.
(11) Bellamy N. WOMAC Osteoarthritis Index User Guide. Queensland, Australia: University of Queensland; 2000.
BC Osteoarthritis Survey; January 2008 34
(12) Ehrich EW, Davies GM, Watson DJ, Bolognese JA, Seidenberg BC, Bellamy N. Minimal perceptible clinical improvement with the Western Ontario and McMaster Universities osteoarthritis index questionnaire and global assessments in patients with osteoarthritis. J Rheumatol 2000; 27:2635-2641.
(13) Pencharz JN, MacLean CH. Measuring quality in arthritis care: the Arthritis Foundation's Quality Indicator set for osteoarthritis. Arthritis Rheum 2004; 51(4):538-548.
(14) Ottawa panel evidence-based clinical practice guidelines for therapeutic exercises and manual therapy in the management of osteoarthritis. Physical Therapy 2005; 85(9):907-971.
(15) Westby MD, Li L. Physical therapy an exercise for arthritis: Do they work? Geriatrics & Aging 2006; 9(9):624-630.
(16) Westby MD, Minor MA. Exercise and physical activity. In: Bartlett SJ, Bingham CO, Maricic MJ, Iversen MD, Ruffing V, editors. Clinical Care in the Rheumatic Diseases. 3rd Edition ed. Atlanta, Georgia: Association of Rheumatology Health Professionals; 2006. 211-220.
(17) Wenger NS, Solomon DH, Roth CP, MacLean CH, Saliba D, Kamberg CJ et al. The quality of medical care provided to vulnerable community-dwelling older patients. Ann Intern Med 2003; 139:740-747.
(18) Ganz DA, Chang JT, Roth CP, Guan M, Kamberg CJ, Niu F et al. Quality of osteoarthritis care for community-dwelling older adults. Arthritis Rheum 2006; 55(2):241-247.
(19) Glazier RH, Dalby DM, Badley EM, Hawker GA, Bell MJ, Buchbinder R et al. Management of common musculoskeletal problems: survey of Ontario primary care physicians. Canadian Medical Association Journal 1998; 158(8):1037-1040.
(20) Minor M, Stenstrom CH, Klepper SE, Hurley M, Ettinger WH. Work group recommendations: 2002 exercise and physical activity conference, St. Louis, Missouri. Arthritis Rheum 2003; 49(3):453-454.
(21) Bliddal H, Christensen R. The management of osteoarthritis in the obese patient: practical considerations and guidelines for therapy. Obes Rev 2006; 7(4):323-331.
(22) Wait Time Alliance for Timely Access to Health Care. It's about time! Achieving benchmarks and best practices in wait time management. Ottawa, ON: Canadian Medical Association; 2005.
(23) Gross AE. Report of the total hip and knee joint replacement expert panel. Ottawa, ON: Total Hip and Knee Joint Replacement Expert Panel; 2005.
(24) Arthritis isn't a big deal until you get it. Ask 4 million Canadians. Report from the Summit on Standards for Arthritis Prevention and Care, November 1-2, 2005, Ottawa,
BC Osteoarthritis Survey; January 2008 35
Ontario, Canada. Alliance for the Canadian Arthritis Program; 2006.
(25) Ottawa panel evidence-based clinical practice guidelines for therapeutic exercises and manual therapy in the management of osteoarthritis. Physical Therapy 2005; 85(9):907-971.
(26) van Gool CH, Penninx BJ, Kempen GI, Rejeski WJ, Miller GD, van Eijk JT et al. Effects of exercise adherence on physical function among overweight older adults with knee osteoarthritis. Arthritis Rheum 2005; 53(1):24-32.
(27) Sniehotta FF, Scholz U, Schwarzer R, Fuhrmann B, Kiwus U, Voller H. Long-term effects of two psychological interventions on physical exercise and self-regulation following coronary rehabilitation. International Journal of Behavioral Medicine 2005; 12(4):244-255.
(28) van Dijk GM, Dekker J, Veenhof C, Van den Ende CH, Carpa Study Group. Course of functional status and pain in osteoarthritis of the hip or knee: a systematic review of the literature. Arthritis Rheum 2006; 55(5):779-785.
(29) Christensen R, Bartels EM, Astrup A, Bliddal H. Effect of weight reduction in obese patients diagnosed with knee osteoarthritis: a systematic review and meta-analysis. Ann Rheum Dis 2007; 66(4):433-439.
(30) Hudak PL, Clark JP, Hawker GA, Coyte PC, Mahomed NN, Kreder HJ et al. "You're Perfect for the Procedure! Why Don't You Want It?" Elderly Arthritis Patients' Unwillingness to Consider Total Joint Arthroplasty Surgery: A Qualitative Study. Med Decis Making 2002; 22(3):272-278.
(31) Gignac MA, Davis AM, Hawker G, Wright JG, Mahomed N, Fortin PR et al. "What do you expect? You're just getting older": A comparison of perceived osteoarthritis-related and aging-related health experiences in middle- and older-age adults. Arthritis Rheum 2006; 55(6):905-912.
(32) Appelt CJ, Burant CJ, Siminoff LA, Kwoh CK, Ibrahim SA. Arthritis-specific health beliefs related to aging among older male patients with knee and/or hip osteoarthritis. J Gerontol A Biol Sci Med Sci 2007; 62(2):184-190.
(33) Li LC, Badley EM, MacKay C, Mosher D, Jamal S, Jones A et al. An evidence-informed, integrated framework for rheumatoid arthritis care (Accepted for publication). Arthritis Rheum 2008.
(34) O'Cathain A, Froggett M, Taylor MP. General practice based physiotherapy: its use and effect on referrals to hospital orthopaedics and rheumatology outpatient departments. British Journal of General Practice 1995; 45(396):352-354.
(35) An innovative model for service delivery in arthroplasty: The development of the advanced practice physiotherapist (Abstract #3118). 2007.
BC Osteoarthritis Survey; January 2008 36
(36) Robarts S, Kennedy D, MacLeod AM, Findlay H, Gollish J. A framework for the development and implementation of advanced practice roles for physiotherapists that improves access and quality of care for patients. Healthcare Quarterly 2008; 11(2):67-75.
BC Osteoarthritis Survey; January 2008 37
AAAAppendix A: BC Osteoarthritis Survey Questionnaire