Embed Size (px)
Citation preview

Economic Modelling 42 (2014) 177–185
Contents lists available at ScienceDirect
Economic Modelling
j ourna l homepage: www.e lsev ie r .com/ locate /ecmod
The behavior of Turkish exchange rates: A panel data perspective
Ugur Adiguzel a,1, Ahmet Sahbaz b,⁎, Ceyhun Can Ozcan c,2, Saban Nazlioglu d,3
a Department of International Trade and Logistics, Cumhuriyet University, Sivas, Turkeyb Department of Economics, Gaziantep University, Gaziantep, Turkeyc Department of Tourism Management, Necmettin Erbakan University, Konya, Turkeyd Department of Econometrics, Pamukkale University, Denizli, Turkey
⁎ Corresponding author. Tel.: +90 342 317 2062; fax: +E-mail addresses: [email protected] (U. Ad
(A. Sahbaz), [email protected] (C.C. Ozcan), snazliogl1 Tel.: +90 346 219 1010/2384; fax: +90 346 219 1202 Tel.: +90 332 236 2148; fax: +90 332 236 2150.3 Tel.: +90 258 296 2694; fax: +90 258 296 2626.
http://dx.doi.org/10.1016/j.econmod.2014.06.0140264-9993/© 2014 Elsevier B.V. All rights reserved.
a b s t r a c t
a r t i c l e i n f oArticle history:Accepted 23 June 2014Available online xxxx
JEL classification:C23F31
Keywords:Purchasing power parityTurkeyPanel unit root
This paper investigates the behavior of Turkish exchange rates within the context of purchasing power parity(PPP) hypothesis by means of recent developments in the panel unit root testing procedures for ten Turkishreal exchange rates during January 2002–May 2012. The unit root test which accounts for nonlinearity, smoothstructural shifts, and cross-section dependency supports that PPP hypothesis holds for Eurozone and Europeancountries (Denmark, Norway, Sweden, Switzerland, and United Kingdom), while it does not hold for non-European trading partners (Canada, Japan, Saudi Arabia, and USA). From the empirical results, we can concludethat PPP hypothesis holds in the countries which have the free trade agreement, while it is violated in the coun-tries inwhich there are trade barriers and greater distance. The findings therefore provide policy implications forTurkey in determining equilibrium exchange rates with her major trading partners.
90 342 360 1402.iguzel), [email protected]@pau.edu.tr (S. Nazlioglu).2.
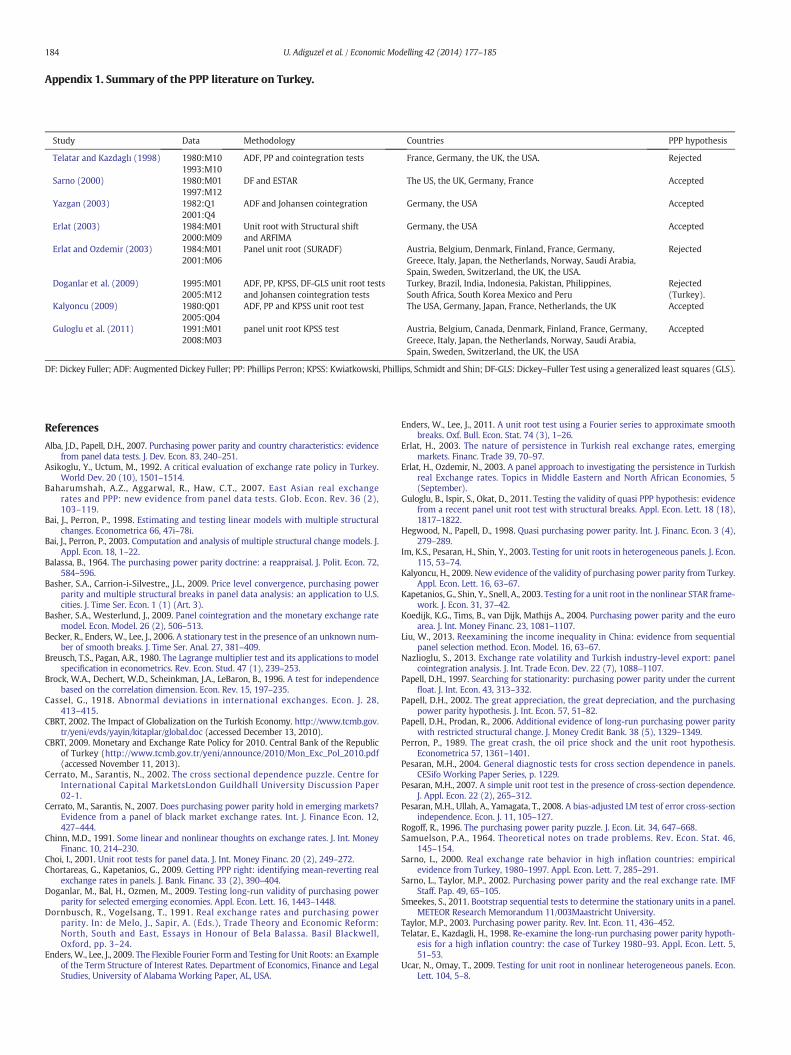
4 The literature onappendix.
© 2014 Elsevier B.V. All rights reserved.
1. Introduction
Turkey as an emerging country and one of the fastest growing econ-omies during the last decade has been implementing the trade-orientedgrowth model since 1980. The exchange rate policy in that respect is atthe center of trade andmonetary policies. After the eruption of the 2001crisis, Turkey shifted from pegged to flexible exchange rate system andhence the behavior of Turkish lira has attracted a great deal of attentionin recent years. Thereby determining the behavior of exchange rateswould provide important information for better understanding of thedynamics of Turkish lira and is also crucial for designing sound mone-tary policy for macroeconomic stability.
With respect to the behavior of exchange rates, the prominent theo-ry is purchasing power parity (PPP) hypothesis. The hypothesis impliesthat exchange rates adjust to their equilibrium values until purchasingpower discrepancy across countries disappears. The PPP hypothesis isbased on the “law of one price” which means that in the absence oftransportation and transaction costs, the price of an identical good intwo countries will be same when the prices are expressed in the samecurrency. PPP hypothesis means that exchange rates between twocountries change according to relative prices so they show a mean
reverting (stationary) process. Given the importance of PPP hypothesisin open economy macroeconomics and for constructing fundamentalequilibrium exchange rates, long-run PPP relationship is of great impor-tance for academicians and policy makers (Cerrato and Sarantis, 2007).The common approach in examining PPP hypothesis is to carry out unitroot analysis on real exchange series to determine whether or not realexchange rates are mean reverting. The stationary real exchange ratesprovide evidence in favor of PPP hypothesis (see Rogoff, 1996; Sarnoand Taylor, 2002; Taylor, 2003).
The literature on the behavior of Turkish real exchange rates showsthat there is no consensus whether PPP hypothesis holds.4 On the onehand, some studies find evidence on the validity of PPP hypothesis(Erlat, 2003; Guloglu et al., 2011; Kalyoncu, 2009; Sarno, 2000;Yazgan, 2003). On the other hand, some studies find out the lack ofPPP hypothesis (Doganlar et al., 2009; Erlat and Ozdemir, 2003;Telatar and Kazdagli, 1998). The controversy in the literature can be at-tributed to two reasons. First, the results from the empirical studies dif-fer based on time period and data frequency. For instance, Telatar andKazdagli (1998) reject PPP hypothesis for the period 1980–1993 withmonthly data; Kalyoncu (2009) supports the hypothesis employingquarterly data for 1980–2005. Second, the difference in empirical evi-dence is based on empirical methods which have different assumptionsregarding data generating process of the exchange rates. In the paneldata studies, Erlat and Ozdemir (2003) rely on the panel unit root testthat takes into account dependency across series. In a recent study,
Turkey with respect to data, method, and findings is summarized in
178 U. Adiguzel et al. / Economic Modelling 42 (2014) 177–185
Guloglu et al. (2011) utilize panel unit root approach controlling forstructural shifts. The lack of consensus on the validity of PPP hypothesisprovides a room to analyze thebehavior of Turkish exchange rateswith-in the context of recent developments in unit root tests which assumedifferent generating process. By employing a different unit root testingapproach, this paper tries to extend the recent discussion on whethershocks to Turkish exchange rates are permanent or transitory. Thisstudy contributes to the literature by providing new information re-garding the nature of the dynamics in Turkish exchange rates.
This paper examines the behavior of Turkish exchange rates withinthe context of PPP hypothesis for ten Turkish real exchange rates duringthe period January 2002–March 2012. In the empirical analysis, we fol-low a systematic modeling approach within the panel data framework.First, we conduct a preliminary analysis which includes testing cross-section dependency, nonlinearity, and structural shifts. Second, wefocus on employing an appropriate panel unit root test which is ableto take information into account provided by the preliminary analysis.Accordingly, we employ the sequential panel selection method(SPSM) along with Panel KSS unit root tests with a Fourier function.The results support the validity of PPP hypothesis in Eurozone and fiveEuropean countries (United Kingdom, Switzerland, Norway, Denmark,Sweden), although PPP hypothesis in not valid for four countries(Saudi Arabia, Canada, Japan, and USA).
In ourmodeling approach, nonlinearity in exchange rates is capturedby the nonlinear panel unit root test proposed by Ucar and Omay(2009); structural shifts aremodeled as gradual adjustment; and finallycross-section dependency is taken into account by means of bootstrapdistribution. Furthermore, the unit root strategy employed here clas-sifies the whole panel into a group of stationary series and a group ofnon-stationary series.
The rest of the paper is organized as follows: The developments inTurkish exchange rates policy are summarized in Section 2. InSection 3, we concentrate on modeling issues in PPP hypothesis whichprovides the background of this paper. The empirical framework isoutlined in Section 4 and the findings are discussed in Section 5. Finally,brief summary and policy discussion are provided in Section 6.
2. Turkish exchange rate policy: a brief overview
With the implementation of the trade-oriented growth strategysince 1980, Turkey has assigned a crucial role to the exchange rate pol-icy. From 1980 to early 2000s, Turkey adopted fixed exchange rate re-gime and shifted from pegged exchange rate regime to flexibleexchange rate system after the eruption of the 2001 economic crisis.The trade dynamics and exchange rate policy developments in Turkisheconomy during recent years show a positive relation between floatingexchange rates and an increase in exports (Nazlioglu, 2013).
It seems that the changes in Turkey's exchange rate policy are in linewith the developments in the macro-economy. A fixed exchange rateregime was adopted before 1980 by adjusting the value of Turkish liraaccording to changes in economic condition. After implementation ofthe outward-oriented growth strategy in 1980, adjustable peg policywas followed in order to maintain the trade-oriented growth model.During 1980 1988, Turkish lira was daily adjusted and consequently itdevaluated more than 8% in real terms. In 1989, the government decid-ed to put into effect the partial official exchange rate system and allowthe free capital movements along with higher interest rates and con-vertible Turkish lira. These structural shifts led to the appreciation ofthe Turkish lira.5
The 1994 crisis – one of the major economic crises in Turkey – ledthe government to put into effect the stabilization and economic rescueprograms in cooperation with the International Monetary Fund (IMF).
5 An interested reader is referred to Asikoglu and Uctum (1992) for a broad overviewofTurkish exchange rate policies during the 1980–1990 and to CBRT (2002) for an overviewof the liberalization process.
In this respect, Turkish lira was considerably devaluated by 39%. The1999 stabilization program guided by the IMF to decrease inflationand real interest rates and to provide a stable macroeconomic environ-ment was essentially designed based on exchange rate policy. Itdepended on announcing value of exchange rate basket for first oneand a half year period (Central Bank of the Republic of Turkey (CBRT),2002).
In February 2001, Turkey experienced themost destructive econom-ic crisis since 1945 and in the aftermath of the crisis, the CBRT decided toimplement floating exchange rate regime and the value of Turkish lirawas essentially left to market forces. However, it is worthwhile empha-sizing that the Turkish central bank intervenes in exchange ratemarketswhen Turkish lira is dramatically depreciated against the dollar andeuro. The global financial crisis in 2008 led to a considerable deprecia-tion of the Turkish lira and thereby the CBRT launched themonetary ex-pansion process inNovember 2008. After the globalfinancial crisis, eventhough the CBRT continues to implementfloating exchange rate regime,changes in the real effective exchange rate indices are closelymonitoredand policy measures are taken in order to maintain financial stability.6
3. Background
The definition of PPP hypothesis by Cassel (1918) postulates thatreal exchange rates are mean reverting around a constant term. Eventhough this definition requires only a constant term in an estimatedmodel, a deterministic trend termcan also be introduced to take into ac-count high levels of productivity growth shown by the countries. Theso-called “trend PPP” concept described by Balassa (1964) andSamuelson (1964) therefore entails a stationary real exchange rate se-ries that has a linear time trend in addition to the constant term. Struc-tural breaks in constant and time trend are usually considered asevidence of why PPP hypothesis does not hold. If structural breaks areignored in testing for PPP, a stationary real exchange rate could not nec-essarily imply evidence of PPP hypothesis (Erlat, 2003). The presence ofone structural break in level of the real exchange rate is first consideredin Dornbusch and Vogelsang (1991). While examining PPP hypothesisaround structural breaks in constant term has been called “qualifiedPPP” by Dornbusch and Vogelsang (1991), it has been defined as“quasi PPP” by Hegwood and Papell (1998), Papell (2002), and Papelland Prodan (2006). The case of which real exchange rate is stationaryaround a linear time trend with structural shifts can be denoted as“trend qualified PPP” or “trend quasi PPP” (Basher and Carrion-i-Silvestre, 2009).
The literature on PPP hypothesis shows that some important issuesare still remaining. First, univariate time series unit root tests have lowpower and therefore more recent studies have paid attention to panelunit root tests because panel data methods increase power of tests(for example, Papell, 1997; Cerrato and Sarantis, 2002; Choi, 2001;Erlat and Ozdemir, 2003; Wu et al., 2004; Baharumshah et al., 2007).Second, there is a growing consensus on that real exchange rate seriesexhibit nonlinearity (asymmetry) and therefore unit root tests whichare not able to control for this feature may have low power. As exten-sively discussed in Chinn (1991), nonlinear behavior of exchange ratescan be attributed to regime changes, greater trade barriers, tighter cur-rency bands, and shocks causing high volatility in exchange rates. Third,it is important to consider impact of possible structural breaks in real ex-change rate series since changes in economic structure and conditionsresult in structural policy shifts. Omission of structural breaks in datacan result in bias towards non-stationarity conclusion (Perron, 1989).As shown in Papell (2002), structural breaks in real exchange seriescan play an important role in appropriately analyzing whether or notPPP hypothesis holds. Fourth, dependency across exchange rates hastriggered great interest in empirical analysis. The dependency can
6 See CBRT (2009) for the general framework of themonetary and exchange rate policy.
Table 1
179U. Adiguzel et al. / Economic Modelling 42 (2014) 177–185
arise from the fact that a shock in one countrymay be easily transmittedto other countries through international trade and financial integration.In recent studies Basher and Carrion-i-Silvestre (2009) and Basher andWesterlund (2009) provide that in addition to structural breaks, ac-counting for cross-sectional dependence is crucial for the investigationof PPP hypothesis.
4. Data and empirical framework
Based on aforementioned discussion, we first attempt to determinewhether or not Turkish exchange rate series exhibit dependency andnon-linearity. In that respect, following data description, we carry outpreliminary analysis to employ a suitable unit root test that accommo-dates the features of Turkish exchange rates.
4.1. Data
We use monthly real exchange rates between Turkey and tentrading partners7 (Canada, Denmark, Eurozone, Japan Norway, SaudiArabia, Sweden, Switzerland, United Kingdom, and USA) during theperiod January 2002–March 2012. According to discussion in Koedijket al. (2004), as Eurozone countries gradually converge to each other,Euro area can increasingly be regarded as a single economic entity. Con-sistent with this view, the importance of the euro in Turkish trade con-tracts has increased considerably. The euro accounted for about 48% ofTurkey's exports by currency and 30% of Turkish imports by currencyas of 2012. The data starts from January, 2002 since the euro banknotesand coins were put into circulation for cash payments on 1 January2002.8
The nominal exchange rates and consumer price indexes (2005 =100) are obtained from the International Financial Statistics on-line da-tabase of International Monetary Fund. Then the real exchange rate isdescribed as yit = eit + pit⁎ − pt where y denotes the real exchangerate, e is the log of nominal exchange rates, p⁎ is the log of foreign CPI,and p is the log of domestic (Turkey's) CPI. Thereby, an increase (a de-crease) in the real exchange rates represents real depreciation (appreci-ation) of Turkish lira.
4.2. Preliminary analysis
4.2.1. Cross-section dependency testsThe panel data regression model for testing cross-sectional depen-
dence in the exchange rates is describe as
Δyi;t ¼ di þ δiyi;t−1 þ∑pij¼1λi; jΔyi;t− j þ ui;t i ¼ 1;…;N; t
¼ 1;…; T ð1Þ
where deterministic component di is considered for constant or con-stant and trend, and p is lag length (s). To test for the null hypothesisof no cross-sectional dependency (H0 : Cov(uit, ujt) = 0 , for all t andi ≠ j) against the alternative hypothesis of cross-sectional dependence(H1 : Cov(uit, ujt) ≠ 0 , for at least one pair of i ≠ j), Breusch andPagan (1980) developed the following Lagrange multiplier statistic:
LM ¼ TXN−1
i¼1
XNj¼iþ1
ρ̂2ij ð2Þ
7 In fact, we concentrated on twenty major trading partners in Turkey's trade (exportand import), howeverwe cannot collected balanced data for Turkish exchange rates seriesfor Iraq, Iran, the UAE, China, Azerbaijan, Romania, Israel, Libya, India, South Korea, andUkraine. This difficulty is also available in other studies for Turkey (see, Appendix 1). Nev-ertheless, the countries in our data explain about 97 and 96% of Turkish exports and im-ports by currency, respectively, that basically dominated by euro and US dollar.
8 The statistics were taken from Turkish Statistical Institute on-line database that areavailable at http://www.tuik.gov.tr/PreTablo.do?alt_id=1046 and upon request.
where ρ̂ij is the pair-wise correlation between residuals from the ordi-nary least squares (OLS) estimation of Eq. (1) for each i. Under thenull hypothesis, the LM statistic is asymptotically distributed aschi-square with N(N − 1)/2 degrees of freedom. The LM test is validfor N relatively small and T sufficiently large, and this drawback isattempted to be solved by Pesaran (2004) by the following scaled ver-sion of the LM test:
CDlm ¼ 1N N−1ð Þ
� �1=2XN−1
i¼1
XNj¼iþ1
Tρ̂2ij−1
� �: ð3Þ
Under the null hypothesis with T→ ∞ first and then N→ ∞, this teststatistic has a standard normal distribution. Although CDlm is applicableeven if N and T are large, it is likely to exhibit substantial size distortionsif N is large and T is small. The shortcomings of the LM and CDlm testsclearly show the need for a cross-sectional dependence test applicableto a large N and a small T. In that respect, Pesaran (2004) proposedthe following test statistic:
CD ¼ffiffiffiffiffiffiffiffiffiffiffiffiffiffiffiffiffiffiffiffiffiffiffiffiffi
2TN N−1ð Þ
� �s XN−1
i¼1
XNj¼iþ1
ρ̂ij
0@
1A: ð4Þ
Under the null hypothesis with T → ∞ and N → ∞ in any order, theCD test has an asymptotic normal standard distribution.
Pesaran (2004) indicates that the CD test has a mean of exactly zerofor fixed T and N and is robust for heterogeneous dynamic models, in-cluding multiple breaks in slope coefficients and/or error variances, aslong as the unconditional means of yit and xit are time-invariant andtheir innovations have symmetric distributions. However, the CD willlack power in certain situations in which the population average pair-wise correlations are zero, although the underlying individual popula-tion pair-wise correlations are non-zero (Pesaran et al. 2008, p.106).Pesaran et al. (2008) propose a bias-adjusted test that is amodified ver-sion of the LM by using the exact mean and variance of the LM statistic.The bias-adjusted LM test is constructed as follows:
LMadj ¼ffiffiffiffiffiffiffiffiffiffiffiffiffiffiffiffiffiffiffiffiffiffiffiffiffi
2N N−1ð Þ
� �s XN−1
i¼1
XNj¼iþ1
ρ̂ij
T−kð Þρ⌢2ij−μTijffiffiffiffiffiffiffi
ν2Tij
q ð5Þ
where μTij and νTij2 are, respectively, the exact mean and variance of
T−kð Þρ ⌢2ij provided in Pesaran et al. (2008, p.108). Under the null hy-
pothesiswith first T→∞ and thenN→∞, the LMadj test is asymptotical-ly distributed as standard normal.
The results from cross-section dependency tests reported in Table 1indicate that the null hypothesis of no cross-sectional dependence isrejected at one percent level of significance, implying that Turkish realexchange rates are dependent on each other. This finding implies thata shock in one exchange rate is transmitted to other exchange rate se-ries. Since open economies are highly integrated with each other, ashock in a country easily spills over to other countries because of thehigh degree of international trade and financial liberalization. The exis-tence of cross-sectional dependency entails that one needs to conduct a
Results for cross-section dependency tests.
Constant Constant and trend
Test Statistic p-Value Statistic p-Value
LM 848.439⁎⁎⁎ 0.0000 858.602⁎⁎⁎ 0.0000CDLM 84.690⁎⁎⁎ 0.0000 85.761⁎⁎⁎ 0.0000CD −7.395⁎⁎⁎ 0.0000 −7.442⁎⁎⁎ 0.0000LMadj 148.590⁎⁎⁎ 0.0000 147.091⁎⁎⁎ 0.0000
⁎⁎⁎ Denotes statistical significance at 1%.
180 U. Adiguzel et al. / Economic Modelling 42 (2014) 177–185
unit root analysis which accounts for dependency in modeling the be-havior of Turkish exchange rates.
4.2.2. Nonlinearity testIf time series data has nonlinearity, inferences drawn from a linear
approach would be misleading. The BDS test proposed by Brock et al.(1996) is carried out to test for nonlinearity in the exchange rates. TheBDS test provides a nonparametric statistic for testing the null hypoth-esis of identically and independently distributed (i.i.d.) distributionagainst the alternative hypothesis of not i.i.d. distribution. In particular,when the test is applied to the residual from a fitted linear model, theBDS test can be used to detect remaining dependence and thus the pres-ence of nonlinear structure. The alternative hypothesis thereby impliesa nonlinear time series structure. If the null hypothesis is not rejected,then the original linear model cannot be rejected; if the null hypothesisis rejected, the fitted linear model is misspecified, and in this sense, itcan also be treated as a test for nonlinearity (Zivot and Wang, 2006).
The test is based on concept of correlation integral and estimator ofspatial probabilities across time. Given Xt is them-dimensional time se-ries ofwhich (Xt, Xt+ 1, ⋯, Xt+m− 1), the correlation integral is definedas:
Cm T; eð Þ ¼XTm−1
t¼1
XTm
s¼tþ1ΙðXm
t ;Xms ; eÞ �
2Tm Tm−1ð Þ ð6Þ
where Tm is sample size and Tm = T− (m− 1), Ι(Xtm, Xsm, e) denotes anindicator function which is equal to 1 if ‖Xt
m − Xsm‖ b e and equal to 0
otherwise. ‖Xtm, Xs
m‖ is the measure of Euclidian distance between Xtm
and Xsm. Since the correlation integral measures the fraction of data
pairs of (Xtm, Xsm) which are within a maximum-norm distance of e, theBDS test statistic can be obtained by:
Wm T; eð Þ ¼ffiffiffiT
pCm T; eð Þ−C1 T; eð Þm� �
σm eð Þ →N 0;1ð Þ ð7Þ
where σm(e) is standard deviation of sample given m dimensions. Therejection of the null of the i.i.d. assumption supports evidence of nonlin-earity. The BDS statistic is the two-tailed test that large negative/positive values imply the rejection of null hypothesis.
The results for the BDS test illustrated in Table 2 show that the nullhypothesis of the i.i.d. assumption is rejected for all the exchangerates, supporting evidence on non-linearity. Thereby, itwould be appro-priate to take into account nonlinearitywhen investigating the behaviorof Turkish exchange rates.
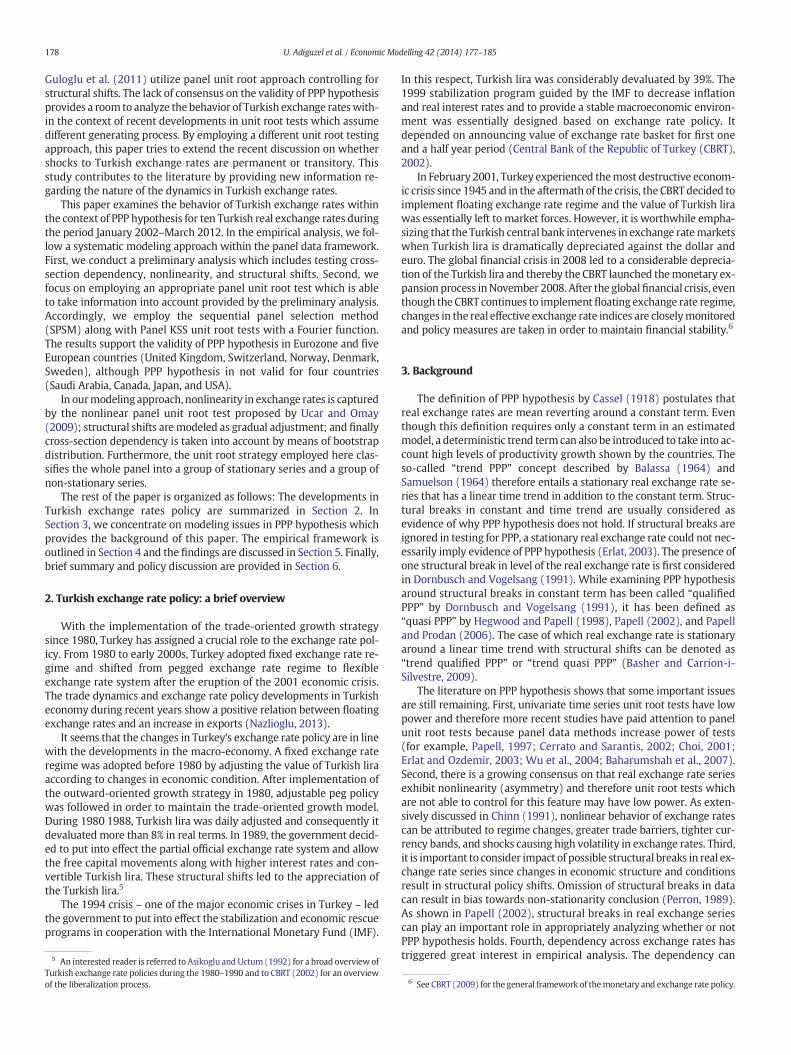
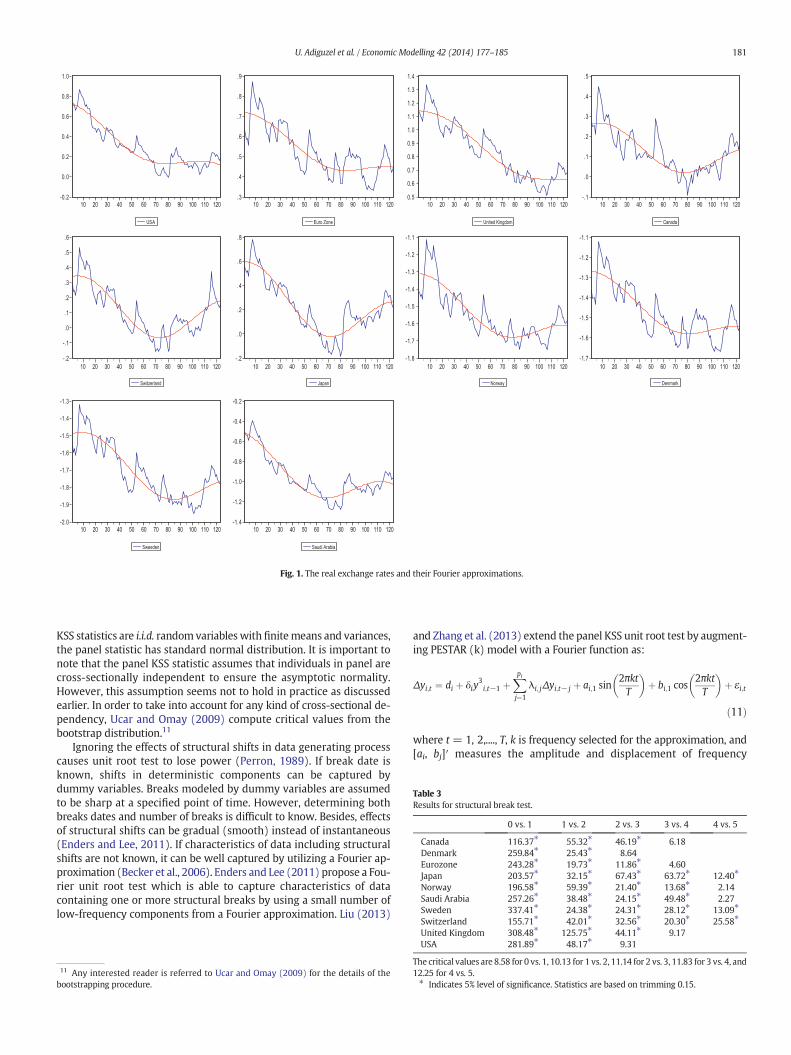
The nonlinearity suggested by the BDS test can also be drawn fromthe dynamics of exchange rates illustrated in Fig. 1. It seems that the
Table 2Results for nonlinearity test.
Country Statistic p-Value
Canada 34.625⁎⁎⁎ 0.000Denmark 36.457⁎⁎⁎ 0.000Eurozone 37.046⁎⁎⁎ 0.000Japan 37.750⁎⁎⁎ 0.000Norway 29.206⁎⁎⁎ 0.000Saudi Arabia 24.286⁎⁎⁎ 0.000Sweden 52.364⁎⁎⁎ 0.000Switzerland 42.136⁎⁎⁎ 0.000United Kingdom 84.566⁎⁎⁎ 0.000USA 31.621⁎⁎⁎ 0.000
m (embedding dimension) is set to 2 and σm(e) is set to 0.5.To investigate whether the results are sensitive to embedding dimension and to standarddeviation, we set embedding dimensions and standard deviation to different values andobtained evidence on nonlinearity. To save space, the results for robustness analysis arenot reported, but available upon request.⁎⁎⁎ Denotes statistical significance at 1%.
movements in exchange rates from 2002 to 2008 are slightly differentthan those from 2008 to 2012. With the implementation of floating ex-change rate regime in 2002, Turkish lira appears to be appreciated untilthe 2008 global financial crisis. Aftermath of the crisis, it depreciatesagainst the major currencies and exhibits more volatile structure.Thereby, it can be drawn that the exchange rates have different regimes,resulting in nonlinear behavior or structural shifts.
4.2.3. Structural break testThe preliminary tests so far suggest that Turkish real exchange rates
are characterized by cross-sectional dependency and nonlinearity. Itseems that the structure of the exchange rates could, in fact, be nonlin-ear with no structural shifts or linear with structural changes or both:nonlinearwith structural breaks.9 In order to test whether or not the se-ries show structural changes,we use the structural break test developedby Bai and Perron (1998 and 2003). We are interested in structuralchanges in the mean of the series. To determine the number of breaks,we allowup to 5 breaks and apply the sequential l + 1 breaks vs l breaksprocedure. The results from the structural break tests in Table 3 indicateevidence on the presence of structural shifts in themean of Turkish realexchange rates.
To sum up, the preliminary analysis implies that Turkish real ex-change rates are characterized by cross-section dependency, nonlinear-ity, and structural shifts. Thereby, the proper modeling of determiningtrend behavior of Turkish exchange rates entails accounting for thesefeatures in the unit root methodology. In what follows, we outline thepanel unit root testing method that is able to control for nonlinearity,structural change and cross-section dependency.
4.3. Panel unit root test
In order to incorporate nonlinearity, we utilize the nonlinear panelunit root test by Ucar and Omay (2009) which combines the nonlinearframework in Kapetanios et al. (2003) (KSS hereafter) with the panelunit root testing procedure of Im et al. (2003). Ucar and Omay (2009)describe a panel exponential smooth transition autoregressive process(PESTAR). The PESTAR (1) model is given by:
Δyit ¼ di þ γiyit−1 1− exp −θiy2it−1
� �n oþ εit ð8Þ
where deterministic component di is considered for constant (αi) orconstant and trend (αi + βit), and θi N 0 implies the speed of mean re-version for all i. By applying the first-order Taylor series approximationto PESTAR (1) model around θi = 0 for all i, the auxiliary regression isobtained as
Δyit ¼ di þ δiy3it−1 þ εit ð9Þ
where δi= θiγi. Extending PESTAR (1) to PESTAR (k)model is very sim-ple. A PESTAR (k) model can be written as:
Δyit ¼ di þ δiy3it−1 þ
Xpij¼1
λijΔyit− jþεit ð10Þ
where p denotes lag length.10 The null hypothesis of linear non-stationarity (H0 : δi=0 for all i) is established against the alternative hy-pothesis of nonlinear stationary (H1 : δi b 0, for some i). Ucar and Omay(2009) propose the panel KSS unit root test which is the average of in-dividual KSS statistics developed by Kapetanios et al. (2003). The KSSstatistic is the t-ratio (ti,NL) associated with δi in Eq. (9). The panel KSSstatistic thereby is written as tNL ¼ 1=N∑N
i¼1ti;NL. Since the individual
9 We are grateful to anonymous referee for pointing out this comment.10 Determining optimal lag(s) through information criterions in unit root analysis is thecommon way we use Schwarz information criterion.
-0.2
0.0
0.2
0.4
0.6
0.8
1.0
10 20 30 40 50 60 70 80 90 100 110 120
USA
.3
.4
.5
.6
.7
.8
.9
10 20 30 40 50 60 70 80 90 100 110 120
Euro Zone
0.5
0.6
0.7
0.8
0.9
1.0
1.1
1.2
1.3
1.4
10 20 30 40 50 60 70 80 90 100 110 120
United Kingdom
-.1
.0
.1
.2
.3
.4
.5
10 20 30 40 50 60 70 80 90 100 110 120
Canada
-.2
-.1
.0
.1
.2
.3
.4
.5
.6
10 20 30 40 50 60 70 80 90 100 110 120
Switzerland
-.2
.0
.2
.4
.6
.8
10 20 30 40 50 60 70 80 90 100 110 120
Japan
-1.8
-1.7
-1.6
-1.5
-1.4
-1.3
-1.2
-1.1
10 20 30 40 50 60 70 80 90 100 110 120
Norway
-1.7
-1.6
-1.5
-1.4
-1.3
-1.2
-1.1
10 20 30 40 50 60 70 80 90 100 110 120
Denmark
-2.0
-1.9
-1.8
-1.7
-1.6
-1.5
-1.4
-1.3
10 20 30 40 50 60 70 80 90 100 110 120
Sweeden
-1.4
-1.2
-1.0
-0.8
-0.6
-0.4
-0.2
10 20 30 40 50 60 70 80 90 100 110 120
Saudi Arabia
Fig. 1. The real exchange rates and their Fourier approximations.
Table 3Results for structural break test.
0 vs. 1 1 vs. 2 2 vs. 3 3 vs. 4 4 vs. 5
Canada 116.37⁎ 55.32⁎ 46.19⁎ 6.18Denmark 259.84⁎ 25.43⁎ 8.64Eurozone 243.28⁎ 19.73⁎ 11.86⁎ 4.60Japan 203.57⁎ 32.15⁎ 67.43⁎ 63.72⁎ 12.40⁎
Norway 196.58⁎ 59.39⁎ 21.40⁎ 13.68⁎ 2.14Saudi Arabia 257.26⁎ 38.48⁎ 24.15⁎ 49.48⁎ 2.27Sweden 337.41⁎ 24.38⁎ 24.31⁎ 28.12⁎ 13.09⁎
⁎ ⁎ ⁎ ⁎ ⁎
181U. Adiguzel et al. / Economic Modelling 42 (2014) 177–185
KSS statistics are i.i.d. random variables with finitemeans and variances,the panel statistic has standard normal distribution. It is important tonote that the panel KSS statistic assumes that individuals in panel arecross-sectionally independent to ensure the asymptotic normality.However, this assumption seems not to hold in practice as discussedearlier. In order to take into account for any kind of cross-sectional de-pendency, Ucar and Omay (2009) compute critical values from thebootstrap distribution.11
Ignoring the effects of structural shifts in data generating processcauses unit root test to lose power (Perron, 1989). If break date isknown, shifts in deterministic components can be captured bydummy variables. Breaks modeled by dummy variables are assumedto be sharp at a specified point of time. However, determining bothbreaks dates and number of breaks is difficult to know. Besides, effectsof structural shifts can be gradual (smooth) instead of instantaneous(Enders and Lee, 2011). If characteristics of data including structuralshifts are not known, it can be well captured by utilizing a Fourier ap-proximation (Becker et al., 2006). Enders and Lee (2011) propose a Fou-rier unit root test which is able to capture characteristics of datacontaining one or more structural breaks by using a small number oflow-frequency components from a Fourier approximation. Liu (2013)
11 Any interested reader is referred to Ucar and Omay (2009) for the details of thebootstrapping procedure.
and Zhang et al. (2013) extend the panel KSS unit root test by augment-ing PESTAR (k) model with a Fourier function as:
Δyi;t ¼ di þ δiy3i;t−1 þ
Xpij¼1
λi; jΔyi;t− j þ ai;1 sin2πktT
� �þ bi;1 cos
2πktT
� �þ εi;t
ð11Þ
where t = 1, 2,...., T, k is frequency selected for the approximation, and[ai, bj]′ measures the amplitude and displacement of frequency
Switzerland 155.71 42.01 32.56 20.30 25.58United Kingdom 308.48⁎ 125.75⁎ 44.11⁎ 9.17USA 281.89⁎ 48.17⁎ 9.31
The critical values are 8.58 for 0 vs. 1, 10.13 for 1 vs. 2, 11.14 for 2 vs. 3, 11.83 for 3 vs. 4, and12.25 for 4 vs. 5.⁎ Indicates 5% level of significance. Statistics are based on trimming 0.15.
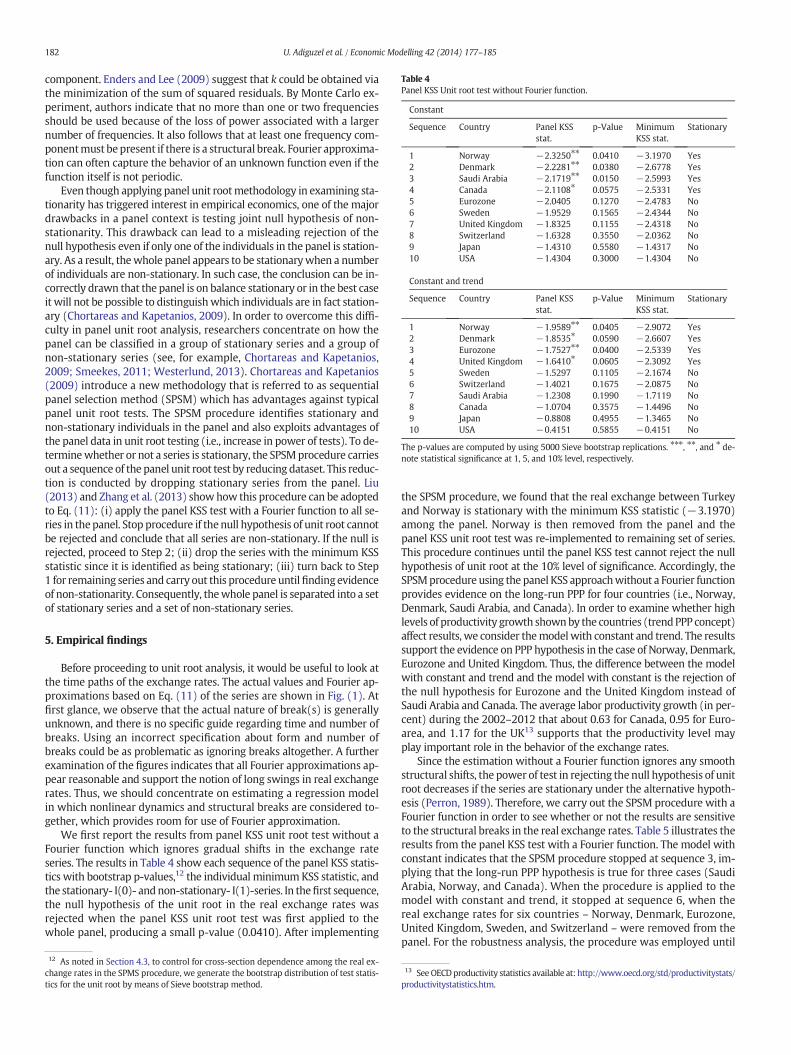
Table 4Panel KSS Unit root test without Fourier function.
Constant
Sequence Country Panel KSSstat.
p-Value MinimumKSS stat.
Stationary
1 Norway −2.3250⁎⁎ 0.0410 −3.1970 Yes2 Denmark −2.2281⁎⁎ 0.0380 −2.6778 Yes3 Saudi Arabia −2.1719⁎⁎ 0.0150 −2.5993 Yes4 Canada −2.1108⁎ 0.0575 −2.5331 Yes5 Eurozone −2.0405 0.1270 −2.4783 No6 Sweden −1.9529 0.1565 −2.4344 No7 United Kingdom −1.8325 0.1155 −2.4318 No8 Switzerland −1.6328 0.3550 −2.0362 No9 Japan −1.4310 0.5580 −1.4317 No10 USA −1.4304 0.3000 −1.4304 No
Constant and trend
Sequence Country Panel KSSstat.
p-Value MinimumKSS stat.
Stationary
1 Norway −1.9589⁎⁎ 0.0405 −2.9072 Yes2 Denmark −1.8535⁎ 0.0590 −2.6607 Yes3 Eurozone −1.7527⁎⁎ 0.0400 −2.5339 Yes4 United Kingdom −1.6410⁎ 0.0605 −2.3092 Yes5 Sweden −1.5297 0.1105 −2.1674 No6 Switzerland −1.4021 0.1675 −2.0875 No7 Saudi Arabia −1.2308 0.1990 −1.7119 No8 Canada −1.0704 0.3575 −1.4496 No9 Japan −0.8808 0.4955 −1.3465 No10 USA −0.4151 0.5855 −0.4151 No
The p-values are computed by using 5000 Sieve bootstrap replications. ⁎⁎⁎, ⁎⁎, and ⁎ de-note statistical significance at 1, 5, and 10% level, respectively.
182 U. Adiguzel et al. / Economic Modelling 42 (2014) 177–185
component. Enders and Lee (2009) suggest that k could be obtained viathe minimization of the sum of squared residuals. By Monte Carlo ex-periment, authors indicate that no more than one or two frequenciesshould be used because of the loss of power associated with a largernumber of frequencies. It also follows that at least one frequency com-ponentmust be present if there is a structural break. Fourier approxima-tion can often capture the behavior of an unknown function even if thefunction itself is not periodic.
Even though applying panel unit rootmethodology in examining sta-tionarity has triggered interest in empirical economics, one of the majordrawbacks in a panel context is testing joint null hypothesis of non-stationarity. This drawback can lead to a misleading rejection of thenull hypothesis even if only one of the individuals in the panel is station-ary. As a result, thewhole panel appears to be stationarywhen a numberof individuals are non-stationary. In such case, the conclusion can be in-correctly drawn that the panel is on balance stationary or in the best caseit will not be possible to distinguishwhich individuals are in fact station-ary (Chortareas and Kapetanios, 2009). In order to overcome this diffi-culty in panel unit root analysis, researchers concentrate on how thepanel can be classified in a group of stationary series and a group ofnon-stationary series (see, for example, Chortareas and Kapetanios,2009; Smeekes, 2011; Westerlund, 2013). Chortareas and Kapetanios(2009) introduce a new methodology that is referred to as sequentialpanel selection method (SPSM) which has advantages against typicalpanel unit root tests. The SPSM procedure identifies stationary andnon-stationary individuals in the panel and also exploits advantages ofthe panel data in unit root testing (i.e., increase in power of tests). To de-terminewhether or not a series is stationary, the SPSMprocedure carriesout a sequence of the panel unit root test by reducing dataset. This reduc-tion is conducted by dropping stationary series from the panel. Liu(2013) and Zhang et al. (2013) showhow this procedure can be adoptedto Eq. (11): (i) apply the panel KSS test with a Fourier function to all se-ries in thepanel. Stop procedure if thenull hypothesis of unit root cannotbe rejected and conclude that all series are non-stationary. If the null isrejected, proceed to Step 2; (ii) drop the series with the minimum KSSstatistic since it is identified as being stationary; (iii) turn back to Step1 for remaining series and carry out this procedure untilfindingevidenceof non-stationarity. Consequently, thewhole panel is separated into a setof stationary series and a set of non-stationary series.
5. Empirical findings
Before proceeding to unit root analysis, it would be useful to look atthe time paths of the exchange rates. The actual values and Fourier ap-proximations based on Eq. (11) of the series are shown in Fig. (1). Atfirst glance, we observe that the actual nature of break(s) is generallyunknown, and there is no specific guide regarding time and number ofbreaks. Using an incorrect specification about form and number ofbreaks could be as problematic as ignoring breaks altogether. A furtherexamination of the figures indicates that all Fourier approximations ap-pear reasonable and support the notion of long swings in real exchangerates. Thus, we should concentrate on estimating a regression modelin which nonlinear dynamics and structural breaks are considered to-gether, which provides room for use of Fourier approximation.
We first report the results from panel KSS unit root test without aFourier function which ignores gradual shifts in the exchange rateseries. The results in Table 4 show each sequence of the panel KSS statis-tics with bootstrap p-values,12 the individual minimumKSS statistic, andthe stationary- I(0)- andnon-stationary- I(1)-series. In thefirst sequence,the null hypothesis of the unit root in the real exchange rates wasrejected when the panel KSS unit root test was first applied to thewhole panel, producing a small p-value (0.0410). After implementing
12 As noted in Section 4.3, to control for cross-section dependence among the real ex-change rates in the SPMS procedure, we generate the bootstrap distribution of test statis-tics for the unit root by means of Sieve bootstrap method.
the SPSM procedure, we found that the real exchange between Turkeyand Norway is stationary with the minimum KSS statistic (−3.1970)among the panel. Norway is then removed from the panel and thepanel KSS unit root test was re-implemented to remaining set of series.This procedure continues until the panel KSS test cannot reject the nullhypothesis of unit root at the 10% level of significance. Accordingly, theSPSMprocedure using the panel KSS approachwithout a Fourier functionprovides evidence on the long-run PPP for four countries (i.e., Norway,Denmark, Saudi Arabia, and Canada). In order to examine whether highlevels of productivity growth shownby the countries (trendPPP concept)affect results, we consider themodelwith constant and trend. The resultssupport the evidence on PPP hypothesis in the case of Norway, Denmark,Eurozone and United Kingdom. Thus, the difference between the modelwith constant and trend and the model with constant is the rejection ofthe null hypothesis for Eurozone and the United Kingdom instead ofSaudi Arabia and Canada. The average labor productivity growth (in per-cent) during the 2002–2012 that about 0.63 for Canada, 0.95 for Euro-area, and 1.17 for the UK13 supports that the productivity level mayplay important role in the behavior of the exchange rates.
Since the estimation without a Fourier function ignores any smoothstructural shifts, the power of test in rejecting the null hypothesis of unitroot decreases if the series are stationary under the alternative hypoth-esis (Perron, 1989). Therefore, we carry out the SPSM procedure with aFourier function in order to see whether or not the results are sensitiveto the structural breaks in the real exchange rates. Table 5 illustrates theresults from the panel KSS test with a Fourier function. The model withconstant indicates that the SPSM procedure stopped at sequence 3, im-plying that the long-run PPP hypothesis is true for three cases (SaudiArabia, Norway, and Canada). When the procedure is applied to themodel with constant and trend, it stopped at sequence 6, when thereal exchange rates for six countries – Norway, Denmark, Eurozone,United Kingdom, Sweden, and Switzerland – were removed from thepanel. For the robustness analysis, the procedure was employed until
13 SeeOECDproductivity statistics available at: http://www.oecd.org/std/productivitystats/productivitystatistics.htm.
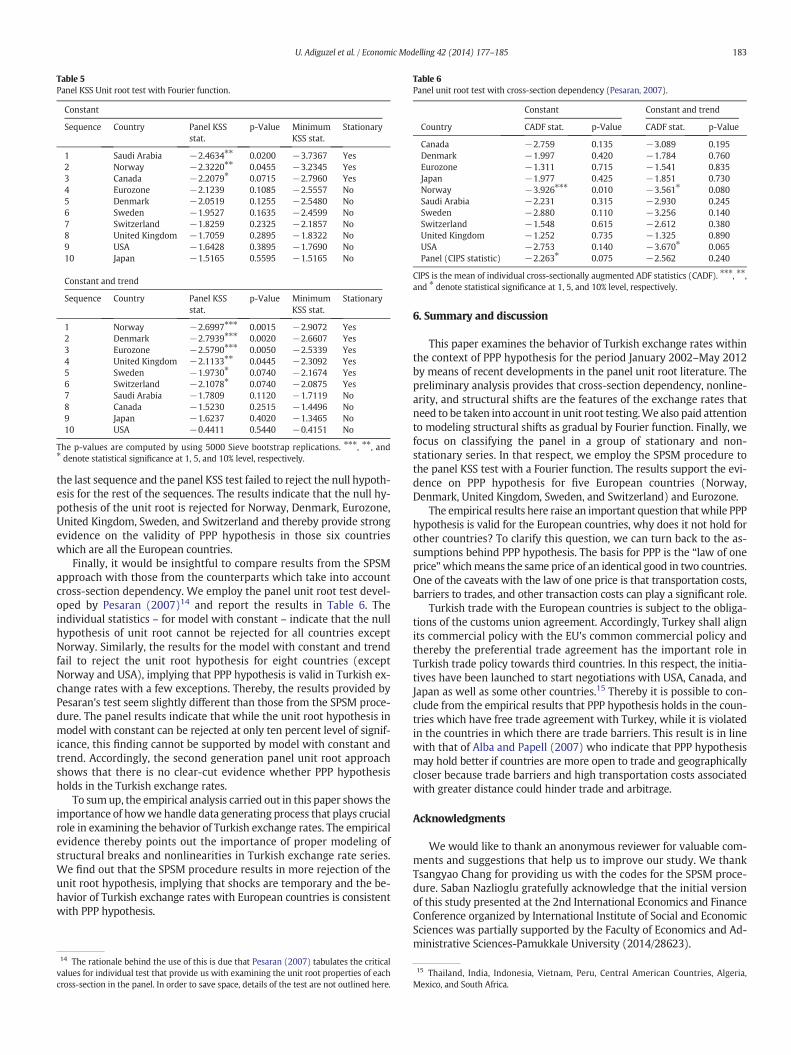
Table 6Panel unit root test with cross-section dependency (Pesaran, 2007).
Constant Constant and trend
Country CADF stat. p-Value CADF stat. p-Value
Canada −2.759 0.135 −3.089 0.195Denmark −1.997 0.420 −1.784 0.760Eurozone −1.311 0.715 −1.541 0.835Japan −1.977 0.425 −1.851 0.730Norway −3.926⁎⁎⁎ 0.010 −3.561⁎ 0.080Saudi Arabia −2.231 0.315 −2.930 0.245Sweden −2.880 0.110 −3.256 0.140Switzerland −1.548 0.615 −2.612 0.380United Kingdom −1.252 0.735 −1.325 0.890USA −2.753 0.140 −3.670⁎ 0.065Panel (CIPS statistic) −2.263⁎ 0.075 −2.562 0.240
CIPS is the mean of individual cross-sectionally augmented ADF statistics (CADF). ⁎⁎⁎, ⁎⁎,and ⁎ denote statistical significance at 1, 5, and 10% level, respectively.
Table 5Panel KSS Unit root test with Fourier function.
Constant
Sequence Country Panel KSSstat.
p-Value MinimumKSS stat.
Stationary
1 Saudi Arabia −2.4634⁎⁎ 0.0200 −3.7367 Yes2 Norway −2.3220⁎⁎ 0.0455 −3.2345 Yes3 Canada −2.2079⁎ 0.0715 −2.7960 Yes4 Eurozone −2.1239 0.1085 −2.5557 No5 Denmark −2.0519 0.1255 −2.5480 No6 Sweden −1.9527 0.1635 −2.4599 No7 Switzerland −1.8259 0.2325 −2.1857 No8 United Kingdom −1.7059 0.2895 −1.8322 No9 USA −1.6428 0.3895 −1.7690 No10 Japan −1.5165 0.5595 −1.5165 No
Constant and trend
Sequence Country Panel KSSstat.
p-Value MinimumKSS stat.
Stationary
1 Norway −2.6997⁎⁎⁎ 0.0015 −2.9072 Yes2 Denmark −2.7939⁎⁎⁎ 0.0020 −2.6607 Yes3 Eurozone −2.5790⁎⁎⁎ 0.0050 −2.5339 Yes4 United Kingdom −2.1133⁎⁎ 0.0445 −2.3092 Yes5 Sweden −1.9730⁎ 0.0740 −2.1674 Yes6 Switzerland −2.1078⁎ 0.0740 −2.0875 Yes7 Saudi Arabia −1.7809 0.1120 −1.7119 No8 Canada −1.5230 0.2515 −1.4496 No9 Japan −1.6237 0.4020 −1.3465 No10 USA −0.4411 0.5440 −0.4151 No
The p-values are computed by using 5000 Sieve bootstrap replications. ⁎⁎⁎, ⁎⁎, and⁎ denote statistical significance at 1, 5, and 10% level, respectively.
183U. Adiguzel et al. / Economic Modelling 42 (2014) 177–185
the last sequence and the panel KSS test failed to reject the null hypoth-esis for the rest of the sequences. The results indicate that the null hy-pothesis of the unit root is rejected for Norway, Denmark, Eurozone,United Kingdom, Sweden, and Switzerland and thereby provide strongevidence on the validity of PPP hypothesis in those six countrieswhich are all the European countries.
Finally, it would be insightful to compare results from the SPSMapproach with those from the counterparts which take into accountcross-section dependency. We employ the panel unit root test devel-oped by Pesaran (2007)14 and report the results in Table 6. Theindividual statistics – for model with constant – indicate that the nullhypothesis of unit root cannot be rejected for all countries exceptNorway. Similarly, the results for the model with constant and trendfail to reject the unit root hypothesis for eight countries (exceptNorway and USA), implying that PPP hypothesis is valid in Turkish ex-change rates with a few exceptions. Thereby, the results provided byPesaran's test seem slightly different than those from the SPSM proce-dure. The panel results indicate that while the unit root hypothesis inmodel with constant can be rejected at only ten percent level of signif-icance, this finding cannot be supported by model with constant andtrend. Accordingly, the second generation panel unit root approachshows that there is no clear-cut evidence whether PPP hypothesisholds in the Turkish exchange rates.
To sumup, the empirical analysis carried out in this paper shows theimportance of howwe handle data generating process that plays crucialrole in examining the behavior of Turkish exchange rates. The empiricalevidence thereby points out the importance of proper modeling ofstructural breaks and nonlinearities in Turkish exchange rate series.We find out that the SPSM procedure results in more rejection of theunit root hypothesis, implying that shocks are temporary and the be-havior of Turkish exchange rates with European countries is consistentwith PPP hypothesis.
14 The rationale behind the use of this is due that Pesaran (2007) tabulates the criticalvalues for individual test that provide us with examining the unit root properties of eachcross-section in the panel. In order to save space, details of the test are not outlined here.
6. Summary and discussion
This paper examines the behavior of Turkish exchange rates withinthe context of PPP hypothesis for the period January 2002–May 2012by means of recent developments in the panel unit root literature. Thepreliminary analysis provides that cross-section dependency, nonline-arity, and structural shifts are the features of the exchange rates thatneed to be taken into account in unit root testing.We also paid attentionto modeling structural shifts as gradual by Fourier function. Finally, wefocus on classifying the panel in a group of stationary and non-stationary series. In that respect, we employ the SPSM procedure tothe panel KSS test with a Fourier function. The results support the evi-dence on PPP hypothesis for five European countries (Norway,Denmark, United Kingdom, Sweden, and Switzerland) and Eurozone.
The empirical results here raise an important question thatwhile PPPhypothesis is valid for the European countries, why does it not hold forother countries? To clarify this question, we can turn back to the as-sumptions behind PPP hypothesis. The basis for PPP is the “law of oneprice”whichmeans the same price of an identical good in two countries.One of the caveats with the law of one price is that transportation costs,barriers to trades, and other transaction costs can play a significant role.
Turkish trade with the European countries is subject to the obliga-tions of the customs union agreement. Accordingly, Turkey shall alignits commercial policy with the EU's common commercial policy andthereby the preferential trade agreement has the important role inTurkish trade policy towards third countries. In this respect, the initia-tives have been launched to start negotiations with USA, Canada, andJapan as well as some other countries.15 Thereby it is possible to con-clude from the empirical results that PPP hypothesis holds in the coun-tries which have free trade agreement with Turkey, while it is violatedin the countries in which there are trade barriers. This result is in linewith that of Alba and Papell (2007) who indicate that PPP hypothesismay hold better if countries are more open to trade and geographicallycloser because trade barriers and high transportation costs associatedwith greater distance could hinder trade and arbitrage.
Acknowledgments
We would like to thank an anonymous reviewer for valuable com-ments and suggestions that help us to improve our study. We thankTsangyao Chang for providing us with the codes for the SPSM proce-dure. Saban Nazlioglu gratefully acknowledge that the initial versionof this study presented at the 2nd International Economics and FinanceConference organized by International Institute of Social and EconomicSciences was partially supported by the Faculty of Economics and Ad-ministrative Sciences-Pamukkale University (2014/28623).
15 Thailand, India, Indonesia, Vietnam, Peru, Central American Countries, Algeria,Mexico, and South Africa.
184 U. Adiguzel et al. / Economic Modelling 42 (2014) 177–185
Appendix 1. Summary of the PPP literature on Turkey.
Study Data Methodology Countries PPP hypothesis
Telatar and Kazdaglı (1998) 1980:M101993:M10
ADF, PP and cointegration tests France, Germany, the UK, the USA. Rejected
Sarno (2000) 1980:M011997:M12
DF and ESTAR The US, the UK, Germany, France Accepted
Yazgan (2003) 1982:Q12001:Q4
ADF and Johansen cointegration Germany, the USA Accepted
Erlat (2003) 1984:M012000:M09
Unit root with Structural shiftand ARFIMA
Germany, the USA Accepted
Erlat and Ozdemir (2003) 1984:M012001:M06
Panel unit root (SURADF) Austria, Belgium, Denmark, Finland, France, Germany,Greece, Italy, Japan, the Netherlands, Norway, Saudi Arabia,Spain, Sweden, Switzerland, the UK, the USA.
Rejected
Doganlar et al. (2009) 1995:M012005:M12
ADF, PP, KPSS, DF-GLS unit root testsand Johansen cointegration tests
Turkey, Brazil, India, Indonesia, Pakistan, Philippines,South Africa, South Korea Mexico and Peru
Rejected(Turkey).
Kalyoncu (2009) 1980:Q012005:Q04
ADF, PP and KPSS unit root test The USA, Germany, Japan, France, Netherlands, the UK Accepted
Guloglu et al. (2011) 1991:M012008:M03
panel unit root KPSS test Austria, Belgium, Canada, Denmark, Finland, France, Germany,Greece, Italy, Japan, the Netherlands, Norway, Saudi Arabia,Spain, Sweden, Switzerland, the UK, the USA
Accepted
DF: Dickey Fuller; ADF: Augmented Dickey Fuller; PP: Phillips Perron; KPSS: Kwiatkowski, Phillips, Schmidt and Shin; DF-GLS: Dickey–Fuller Test using a generalized least squares (GLS).
References
Alba, J.D., Papell, D.H., 2007. Purchasing power parity and country characteristics: evidencefrom panel data tests. J. Dev. Econ. 83, 240–251.
Asikoglu, Y., Uctum, M., 1992. A critical evaluation of exchange rate policy in Turkey.World Dev. 20 (10), 1501–1514.
Baharumshah, A.Z., Aggarwal, R., Haw, C.T., 2007. East Asian real exchangerates and PPP: new evidence from panel data tests. Glob. Econ. Rev. 36 (2),103–119.
Bai, J., Perron, P., 1998. Estimating and testing linear models with multiple structuralchanges. Econometrica 66, 47i–78i.
Bai, J., Perron, P., 2003. Computation and analysis of multiple structural change models. J.Appl. Econ. 18, 1–22.
Balassa, B., 1964. The purchasing power parity doctrine: a reappraisal. J. Polit. Econ. 72,584–596.
Basher, S.A., Carrion-i-Silvestre,, J.L., 2009. Price level convergence, purchasing powerparity and multiple structural breaks in panel data analysis: an application to U.S.cities. J. Time Ser. Econ. 1 (1) (Art. 3).
Basher, S.A., Westerlund, J., 2009. Panel cointegration and the monetary exchange ratemodel. Econ. Model. 26 (2), 506–513.
Becker, R., Enders, W., Lee, J., 2006. A stationary test in the presence of an unknown num-ber of smooth breaks. J. Time Ser. Anal. 27, 381–409.
Breusch, T.S., Pagan, A.R., 1980. The Lagrange multiplier test and its applications to modelspecification in econometrics. Rev. Econ. Stud. 47 (1), 239–253.
Brock, W.A., Dechert, W.D., Scheinkman, J.A., LeBaron, B., 1996. A test for independencebased on the correlation dimension. Econ. Rev. 15, 197–235.
Cassel, G., 1918. Abnormal deviations in international exchanges. Econ. J. 28,413–415.
CBRT, 2002. The Impact of Globalization on the Turkish Economy. http://www.tcmb.gov.tr/yeni/evds/yayin/kitaplar/global.doc (accessed December 13, 2010).
CBRT, 2009. Monetary and Exchange Rate Policy for 2010. Central Bank of the Republicof Turkey (http://www.tcmb.gov.tr/yeni/announce/2010/Mon_Exc_Pol_2010.pdf(accessed November 11, 2013).
Cerrato, M., Sarantis, N., 2002. The cross sectional dependence puzzle. Centre forInternational Capital MarketsLondon Guildhall University Discussion Paper02-1.
Cerrato, M., Sarantis, N., 2007. Does purchasing power parity hold in emerging markets?Evidence from a panel of black market exchange rates. Int. J. Finance Econ. 12,427–444.
Chinn, M.D., 1991. Some linear and nonlinear thoughts on exchange rates. J. Int. MoneyFinanc. 10, 214–230.
Choi, I., 2001. Unit root tests for panel data. J. Int. Money Financ. 20 (2), 249–272.Chortareas, G., Kapetanios, G., 2009. Getting PPP right: identifying mean-reverting real
exchange rates in panels. J. Bank. Financ. 33 (2), 390–404.Doganlar, M., Bal, H., Ozmen, M., 2009. Testing long-run validity of purchasing power
parity for selected emerging economies. Appl. Econ. Lett. 16, 1443–1448.Dornbusch, R., Vogelsang, T., 1991. Real exchange rates and purchasing power
parity. In: de Melo, J., Sapir, A. (Eds.), Trade Theory and Economic Reform:North, South and East, Essays in Honour of Bela Balassa. Basil Blackwell,Oxford, pp. 3–24.
Enders, W., Lee, J., 2009. The Flexible Fourier Form and Testing for Unit Roots: an Exampleof the Term Structure of Interest Rates. Department of Economics, Finance and LegalStudies, University of Alabama Working Paper, AL, USA.
Enders, W., Lee, J., 2011. A unit root test using a Fourier series to approximate smoothbreaks. Oxf. Bull. Econ. Stat. 74 (3), 1–26.
Erlat, H., 2003. The nature of persistence in Turkish real exchange rates, emergingmarkets. Financ. Trade 39, 70–97.
Erlat, H., Ozdemir, N., 2003. A panel approach to investigating the persistence in Turkishreal Exchange rates. Topics in Middle Eastern and North African Economies, 5(September).
Guloglu, B., Ispir, S., Okat, D., 2011. Testing the validity of quasi PPP hypothesis: evidencefrom a recent panel unit root test with structural breaks. Appl. Econ. Lett. 18 (18),1817–1822.
Hegwood, N., Papell, D., 1998. Quasi purchasing power parity. Int. J. Financ. Econ. 3 (4),279–289.
Im, K.S., Pesaran, H., Shin, Y., 2003. Testing for unit roots in heterogeneous panels. J. Econ.115, 53–74.
Kalyoncu, H., 2009. New evidence of the validity of purchasing power parity from Turkey.Appl. Econ. Lett. 16, 63–67.
Kapetanios, G., Shin, Y., Snell, A., 2003. Testing for a unit root in the nonlinear STAR frame-work. J. Econ. 31, 37–42.
Koedijk, K.G., Tims, B., van Dijk, Mathijs A., 2004. Purchasing power parity and the euroarea. J. Int. Money Financ. 23, 1081–1107.
Liu, W., 2013. Reexamining the income inequality in China: evidence from sequentialpanel selection method. Econ. Model. 16, 63–67.
Nazlioglu, S., 2013. Exchange rate volatility and Turkish industry-level export: panelcointegration analysis. J. Int. Trade Econ. Dev. 22 (7), 1088–1107.
Papell, D.H., 1997. Searching for stationarity: purchasing power parity under the currentfloat. J. Int. Econ. 43, 313–332.
Papell, D.H., 2002. The great appreciation, the great depreciation, and the purchasingpower parity hypothesis. J. Int. Econ. 57, 51–82.
Papell, D.H., Prodan, R., 2006. Additional evidence of long-run purchasing power paritywith restricted structural change. J. Money Credit Bank. 38 (5), 1329–1349.
Perron, P., 1989. The great crash, the oil price shock and the unit root hypothesis.Econometrica 57, 1361–1401.
Pesaran, M.H., 2004. General diagnostic tests for cross section dependence in panels.CESifo Working Paper Series, p. 1229.
Pesaran, M.H., 2007. A simple unit root test in the presence of cross-section dependence.J. Appl. Econ. 22 (2), 265–312.
Pesaran, M.H., Ullah, A., Yamagata, T., 2008. A bias-adjusted LM test of error cross-sectionindependence. Econ. J. 11, 105–127.
Rogoff, R., 1996. The purchasing power parity puzzle. J. Econ. Lit. 34, 647–668.Samuelson, P.A., 1964. Theoretical notes on trade problems. Rev. Econ. Stat. 46,
145–154.Sarno, L., 2000. Real exchange rate behavior in high inflation countries: empirical
evidence from Turkey, 1980–1997. Appl. Econ. Lett. 7, 285–291.Sarno, L., Taylor, M.P., 2002. Purchasing power parity and the real exchange rate. IMF
Staff. Pap. 49, 65–105.Smeekes, S., 2011. Bootstrap sequential tests to determine the stationary units in a panel.
METEOR Research Memorandum 11/003Maastricht University.Taylor, M.P., 2003. Purchasing power parity. Rev. Int. Econ. 11, 436–452.Telatar, E., Kazdagli, H., 1998. Re-examine the long-run purchasing power parity hypoth-
esis for a high inflation country: the case of Turkey 1980–93. Appl. Econ. Lett. 5,51–53.
Ucar, N., Omay, T., 2009. Testing for unit root in nonlinear heterogeneous panels. Econ.Lett. 104, 5–8.

185U. Adiguzel et al. / Economic Modelling 42 (2014) 177–185
Westerlund, J., 2013. A sequential test for pair-wise convergence in Chinese provincial in-come. J. Asian Econ. 27, 1–6.
Wu, J.-L., Tsai, L.-J., Chen, S.-L., 2004. Are real exchange rates non-stationary? The pacificbasin perspective. J. Asian Econ. 15, 425–438.
Yazgan,M.E., 2003. The purchasing power parity hypothesis for a high inflation country: are-examination of the case of Turkey. Appl. Econ. Lett. 10, 143–147.
Zhang, D., Chang, T., Lee, C.H., Hung, K., 2013. Revisiting purchasing power parity forEast Asian countries: sequential panel selection method. Appl. Econ. Lett. 20 (1),62–66.
Zivot, E.,Wang, J., 2006. Modeling Financial Time Series with S-PLUS, 2nd edition. Springer,New York.