Embed Size (px)
Citation preview

Turkish FMCG Sector Inquiry: Lessons From A Developing Country
Perspective
Meltem Bağış Akkaya Turkish Competition Authority
31.May.2013 University of Oxford

2
FMCG Sector Inquiry of the Turkish Competition Authority
q Turkish Competition Authority (TCA) carried out a comprehensive sector inquiry into the fast moving consumer goods (FMCG),
q Because of: (1) the growing trend of retail chains; rapid consolidation of existing domestic
stores (mostly in the form of creeping mergers) (2) increases in food prices. (3)increasing number of complaints from suppliers on retailers’
practices such as non compliance of payments and deadlines, countless demand of fees, retroactive payments, discounts, etc
q In the meanwhile, amendments to the Commercial Law were made in, which
introduced a limitation of sixty days for payment periods in commercial relationships. q This regulation is compliant with the new directive of the EU, adopted at the end of
2010 to fight late payments.
3
Methodology
q Preliminary Report • Collecting retailers’ data • Face-to-face meetings with chosen suppliers • Analysis of various country examples (U.K., Australia, Italy, France, Portugal,
Nordic countries …) • Preliminary findings and proposing policy suggestions
q Final Report • Opening of the preliminary report to public (stakeholders) opinion • 2 closed workshops with retailers and suppliers • Outsourcing supplier online survey (each supplier was given a password to
maintain confidentiality: “climate of fear!”) • Retailer survey • Analysing buyer power and policy suggestions

4
Problem
q None of the retailers are in dominant position q No joint-dominance q No abuse of dominance q No provision in the Competition Act in the form of a “abuse of superior bargaining
power” q No reference to economic dependency q But there were complaints especially from suppliers on various points …

5
Concentration Ratios
Market Shares in Total FMCG (%) Market Shares in Organized FMCG (%)
2008 2009 2010 2011 2008 2009 2010 2011
BİM ["] ["] ["] ["] BİM ["] ["] ["] ["]
Migros ["] ["] ["] ["] Migros ["] ["] ["] ["]
Tesco ["] ["] ["] ["] Tesco ["] ["] ["] ["]
Carrefour ["] ["] ["] ["] Carrefour ["] ["] ["] ["]
A-101 ["] ["] ["] ["] A-101 ["] ["] ["] ["]
Makromarket ["] ["] ["] ["] Makromarket ["] ["] ["] ["]
Kiler ["] ["] ["] ["] Kiler ["] ["] ["] ["]
Real ["] ["] ["] ["] Real ["] ["] ["] ["]
CR3 9.12 10.48 11.47 11.88 CR3 21.56 23.03 23.38 23.36
CR4 10.05 11.47 12.64 13.74 CR4 23.75 25.20 25.76 27.01
CR5 10.63 12.11 13.23 14.45 CR5 25.13 26.61 26.96 28.41
CR8 11.53 13.22 14.62 16.01 CR8 27.25 29.04 29.79 31.47

6
Concentration Ratios-regional
q Concentration ratios vary according to different geographic regions and cities: q CR4 of the retailers in Marmara region amounts to 45% q In Istanbul (the biggest city of the country) CR4 is 60 % q The most striking concentration ratios are seen the Aegean region:CR4 is 50%. In
this region, Izmir, the 3rd biggest town of the country has the highest concentration ratios: 77%.

7
Format Developments
q Spectacular growth in the discounter format. q Second fastest growing format is the hypermarkets thanks to opening of new
shopping malls (75% of the hypermarkets are located in malls) q Regional/Local chains are gaining importance q They do compete with national/multinational chains q Activities on supermarket format; discount format starting to grow
2009-2012 (%) Discounters 182.19 Hypermarkets 129.99 Supermarkets 71.20 Total market 94.90

8
Analysing Buyer Power
q Our starting point was retailers could not have been able to impose unfair trade practices without a spectacular buyer power. Is it so?
q It is essential to find out buyer power before adopting a regulation in the retail sector. q Indications of buyer power could stem from (but not limited to):
• Retailers’ ability to obtain more favourable terms (extract discounts and obtain low prices)
• Contractual obligations that are placed on suppliers (various fees, etc) • High (and increasing) market share of private labels. Given the fact that the
biggest retailer is a discounter which has more than 65% private labels, it is worth looking at the situation.
• High and increasing market shares of retailers • Even under low market shares, it is possible to speak of a (abuse of)
bargaining power. q So we carried out two surveys: one for the suppliers side, the other for the retailer
side.
9
Supplier Survey
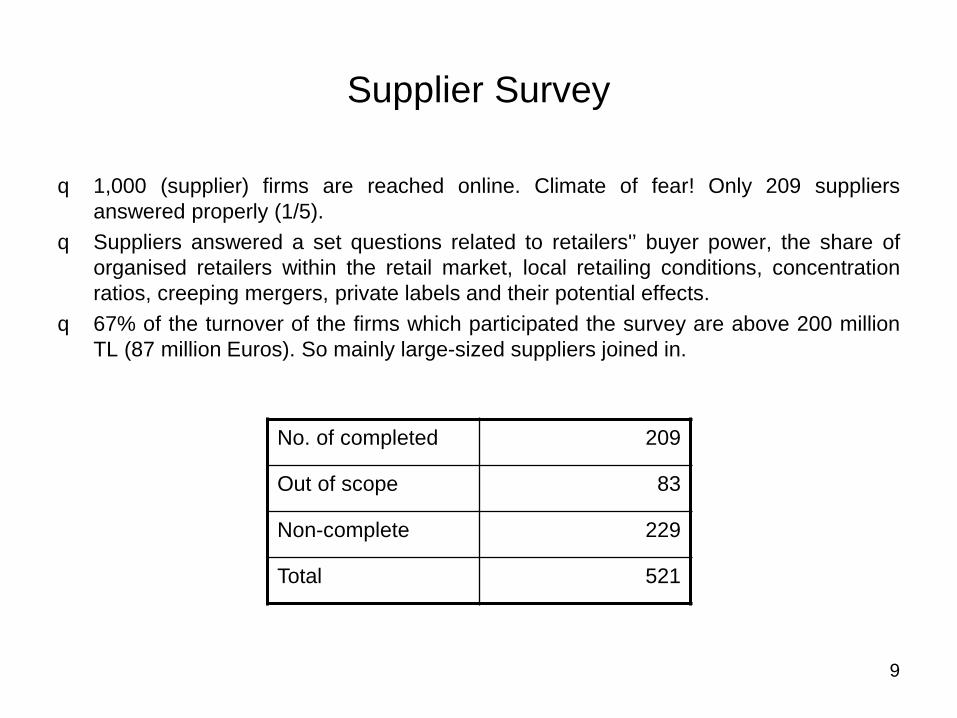
q 1,000 (supplier) firms are reached online. Climate of fear! Only 209 suppliers answered properly (1/5).
q Suppliers answered a set questions related to retailers'’ buyer power, the share of organised retailers within the retail market, local retailing conditions, concentration ratios, creeping mergers, private labels and their potential effects.
q 67% of the turnover of the firms which participated the survey are above 200 million TL (87 million Euros). So mainly large-sized suppliers joined in.
No. of completed 209
Out of scope 83
Non-complete 229
Total 521
10
Supplier-Retailer Agreements
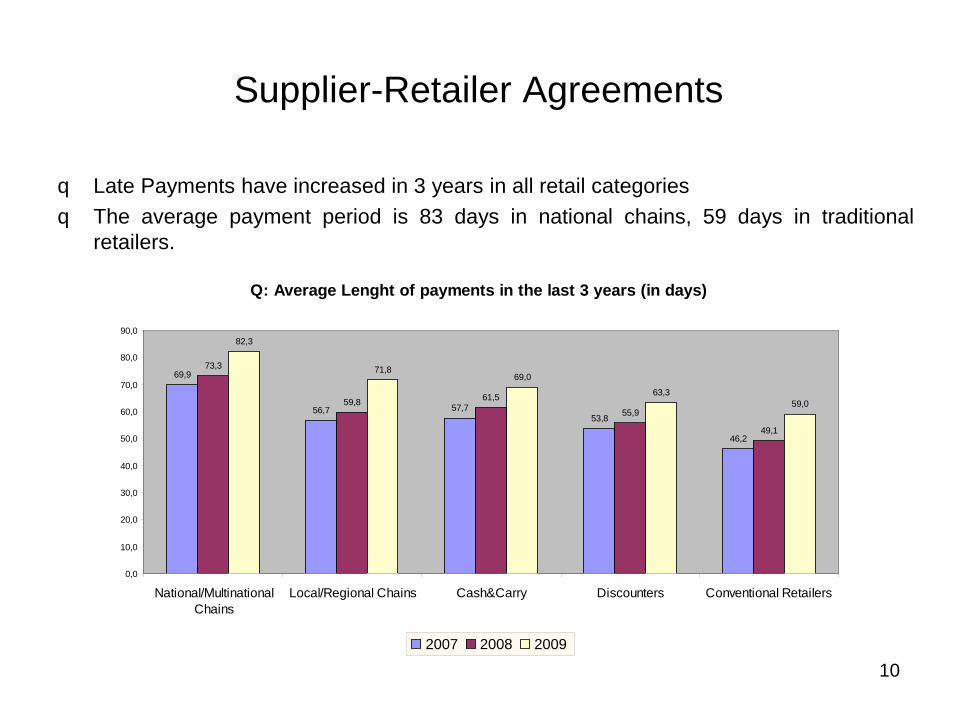
q Late Payments have increased in 3 years in all retail categories q The average payment period is 83 days in national chains, 59 days in traditional
retailers.
Q: Average Lenght of payments in the last 3 years (in days)
69,9
56,7 57,753,8
46,2
73,3
59,8 61,5
55,9
49,1
82,3
71,869,0
63,359,0
0,0
10,0
20,0
30,0
40,0
50,0
60,0
70,0
80,0
90,0
National/MultinationalChains
Local/Regional Chains Cash&Carry Discounters Conventional Retailers
2007 2008 2009

11
Supplier-Retailer Agreements
q When a conflicts occurs between a retailer and its supplier, it is very rare to take the case to the legal system (since it takes long time to settle a case in courts).
q Plus no one wants to be labelled as the “naughty” kid of the market; it is also unreasonable and financially “suicide” to go to court in the middle of an agreement period.
q Suppliers go to court only when agreements are terminated. q Even though suppliers refrain from going to courts, they are not satisfied with the
settlement they arrive by way of negotiation. q Discounts and fees are the most controversial areas of the trade flow. q 67% of the suppliers express that problems are the same in all retail formats.

12
Supplier-Retailer Agreements
q Findings have been obtained showing that in some cases retailers leverage their buyer power against suppliers in a disproportionate way: Suppliers are asked to make payments under a variety of names such as listing fee, shelf fee, display area fee, insert fee, electricity fee, promotional contribution fee, employee request, store opening fee, anniversary fee, end of year discount, crisis contribution fee, wedding gift fee !!!!, and many more creative fees almost every week.
q The fact that the retailers in some cases charge these fees as invoiced outside the scope of the contract and retroactively, can leave the supplier faced with an unforeseen cost and commercial risk.
q It has been established that, within the turnovers of the nation-wide retail chains, these fees that the suppliers are charged followed an increasing trend over the years and reached an average of as high as 14% by 2010.
q Large risk-sharing loans for retailers’ investment needs (such as promotions & opening of new stores).

13
Supplier-Retailer Agreements
Types of payments made to retailers
34,70%
59,90%
22,80%
15,60%
22,20%
25,70%
77,80%
80,80%
9,00%
29,90%
79,00%
43,70%
62,30%
29,90%
Company listing fee
Product listing fee
Positioning fee
Pay to stay fee
Shelf space fee
Paying for personnel
Activity fee
Insert fee
Electricity fee
Barcode fee
Store opening fee
Store renovation fee
Anniversary fee
Store merger/acqusition fee
14
Supplier-Retailer Agreements
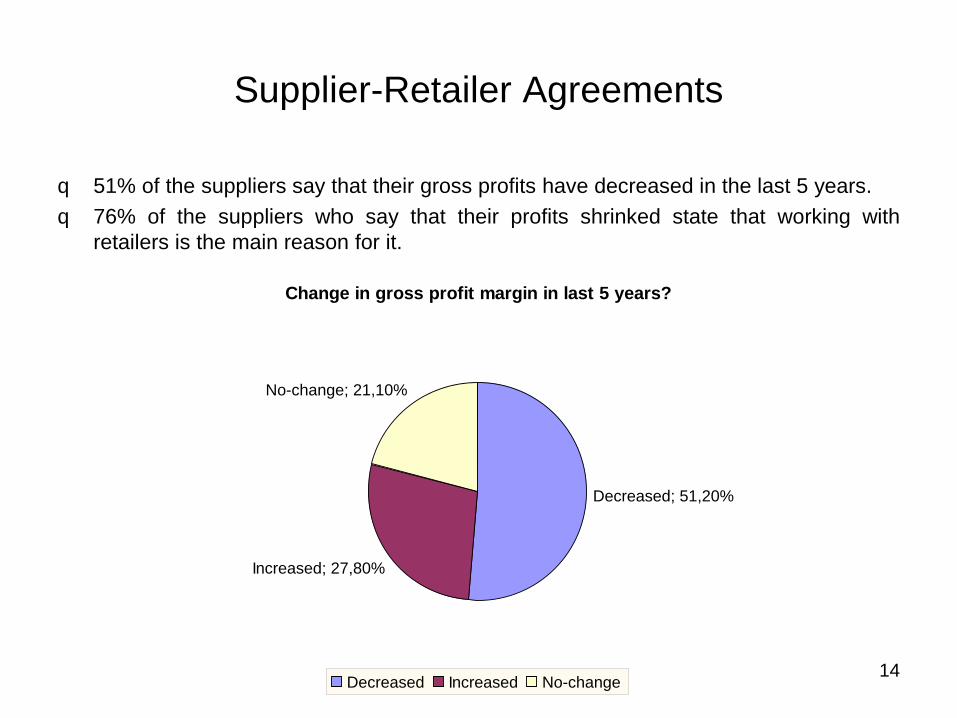
q 51% of the suppliers say that their gross profits have decreased in the last 5 years. q 76% of the suppliers who say that their profits shrinked state that working with
retailers is the main reason for it.
Change in gross profit margin in last 5 years?
Increased; 27,80%
No-change; 21,10%
Decreased; 51,20%
Decreased Increased No-change
15
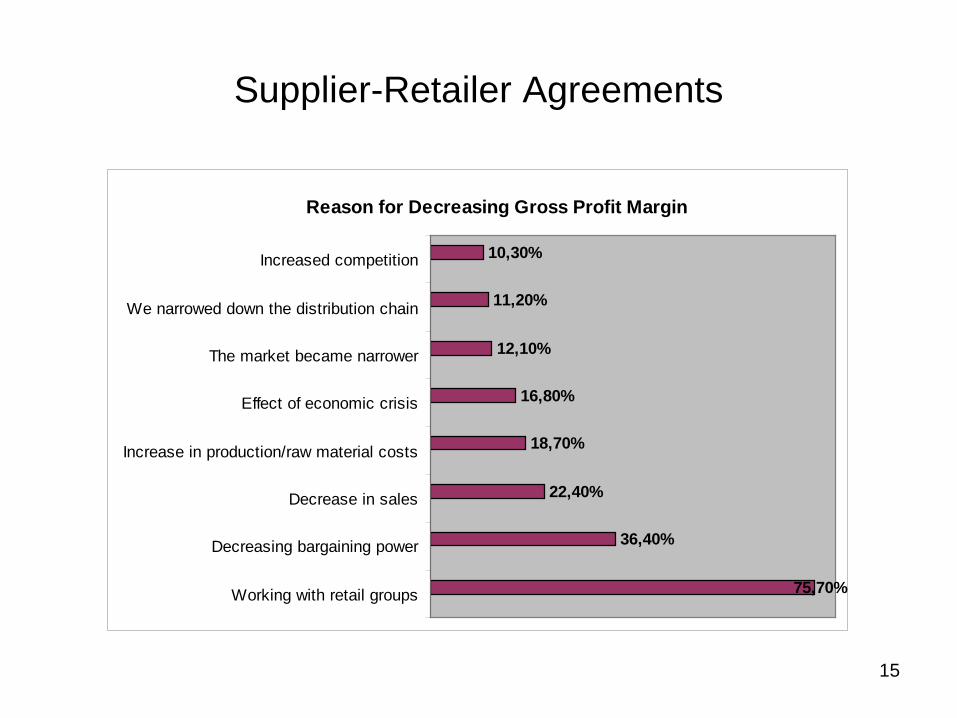
Supplier-Retailer Agreements
Reason for Decreasing Gross Profit Margin
75,70%
36,40%
22,40%
18,70%
16,80%
12,10%
11,20%
10,30%
Working with retail groups
Decreasing bargaining power
Decrease in sales
Increase in production/raw material costs
Effect of economic crisis
The market became narrower
We narrowed down the distribution chain
Increased competition

16
Private Labels
q Private labels enable the retailers to stand in the market not only as a provider of shelf and a customer but also as a competitor. In Turkey, 55% of the suppliers produce private labels.
q Private label products began to emerge by the 2001 crisis, and to accelerate further by the 2008 crisis. PLs are attractive in terms of price. Quality, consumer choice and packaging is lower than in brands.
q Private label products are mostly sold by discounters and the average is 34%. BİM’s (the biggest retailer and discounter) ratio is 65%.
Year PL Ratio (%) 2008 4 2009 6 2010 8 2011 11 2012 13

17
Private Labels
Q: Will private label replace your brand?
33,50%
20,80% 20,30%
44,20%
66,50%
79,20% 79,70%
55,80%
0,00%
10,00%
20,00%
30,00%
40,00%
50,00%
60,00%
70,00%
80,00%
90,00%
National/MultinationalChains
Local/Regional Chains Cash&Carry Discounters
Yes No
18
Private Labels
q The increase in the sale of private label products relates both to the fact that purchasing power of the consumer has been undercut due to the crisis and that private label products are continuing their development even though their developmental phase in Turkey corresponds to phase 1.
q The development of private label products are evaluated in 4 phases. q In phase 1, the share of private label products and the brand power of the retailer
associated with these products are relatively low. q In phase 2, the retailer adopts a strategy to spread its private label to categories in
parallel with increasing brand awareness. q In phase 3, the retailer focuses on product diversification with respect to its private
label. q In phase 4, the retailer along with its private label becomes a brand in the market vis-
à-vis the products of producer brands.

19
Private Labels
q Private label products started to emerge in product categories important as of consumer expenses; and where brand loyalty is low: food products, cleaning products and personal care products.
q In terms of the development of private label products, Turkey lags quite behind in comparison with other countries. The level of pressure exerted by private label products on branded products has not reached an important level yet. However, the pressure to be exerted on branded products is expected to increase in the forthcoming period due to the ever increasing number of discount markets.
q Private labels as of today, are not seen as barrier to market entry, but they are an opportunity to enhance suppliers’ financial structure & revenues. Because suppliers do not treat retailers as their rivals yet.
20
Private Labels & Brands
q Private labels are developed and designed in line with customer choices. Since retailers are the closest contact point to the customers, they know what the customer wants and that they pass this customer choice to the suppliers. Thus, private labels are the results of a joint-product-development process.
q The production of private labels gives the opportunity (in particular to small and mid sized companies) to use their idle capacity. By producing private labels, they were having the chance to use the idle capacity to contribute and support their branded production. In the end, it helps them to increase their profitability.
q Negative effect: Through private labels, retailers get info about cost patterns, hence suppliers lose their control on the pricing.

21
Private Labels, Brands & Info Sharing
q From suppliers’ point of view: joint R&D and innovation is used in the strengthening of suppliers’ brands. The case is even more clear for the suppliers working with discounters.
q In long-term agreements, the cooperation becomes satisfactory for both sides. q Some of the suppliers produce both for the local chains and for the other stores of
the retailers abroad - export their own-brands through the formula they learned from producing PLs.
22
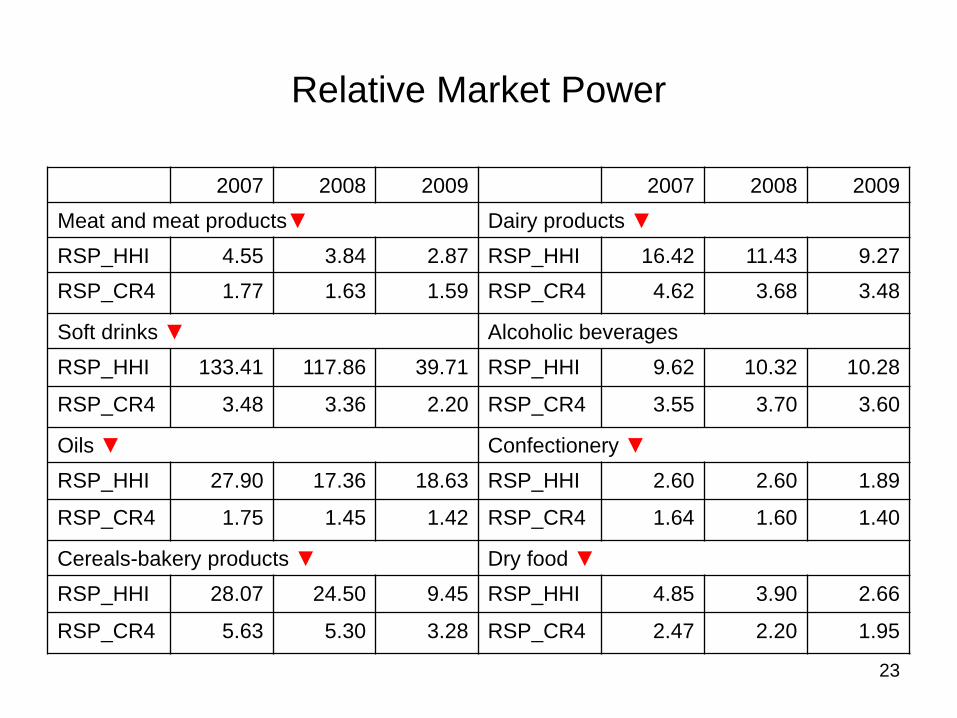
Relative-Seller Power Analysis
q Relative Seller Power (RSP) is an index that compares the suppliers’ market power with the retailers’ buyer power. (It is worth repeating that the retailers operate in the supply market as a buyer and in the retail market as a seller. Plus, they also sell private labels which makes them a competitor of their suppliers.) Retailers’ buyer power depends on both branded goods and private labels purchases. Suppliers’ market power solely depend on its brands.
q The formula here is: Relative Seller Power = HHI (suppliers’ sales of brands) / HHI (retailers’ purchases
(private labels + brands)) q By definition, Relative Buyer Power (RBP) is the reverse of RSP. q According to RSP calculations of the TCA, in certain markets it is possible to speak of
a relative bargaining power of retailers. q The analysis show that except for alcoholic beverages category, the relative buyer
power of retailers is increasing over the years. (The figures show that there is a decreasing trend which indicate an increasing trend in RBP)
23
Relative Market Power
2007 2008 2009 2007 2008 2009
Meat and meat products▼ Dairy products ▼ RSP_HHI 4.55 3.84 2.87 RSP_HHI 16.42 11.43 9.27
RSP_CR4 1.77 1.63 1.59 RSP_CR4 4.62 3.68 3.48
Soft drinks ▼ Alcoholic beverages
RSP_HHI 133.41 117.86 39.71 RSP_HHI 9.62 10.32 10.28
RSP_CR4 3.48 3.36 2.20 RSP_CR4 3.55 3.70 3.60
Oils ▼ Confectionery ▼ RSP_HHI 27.90 17.36 18.63 RSP_HHI 2.60 2.60 1.89
RSP_CR4 1.75 1.45 1.42 RSP_CR4 1.64 1.60 1.40
Cereals-bakery products ▼ Dry food ▼ RSP_HHI 28.07 24.50 9.45 RSP_HHI 4.85 3.90 2.66
RSP_CR4 5.63 5.30 3.28 RSP_CR4 2.47 2.20 1.95

24
Comparison of market shares of first 4 retailers and suppliers according to product categories
First 4 suppliers First 4 retailers 2007 2008 2009 2010 2007 2008 2009 2010
Alcoholic beverages 89 83 83 87 20 22 25 30
Ice-cream 73 81 72 72 7 9 9 11 Frozen food 41 41 35 41 47 46 51 56
Red-white meat 8 10 11 11 9 10 11 12 Other food 7 8 8 8 11 14 16 16 Ready-canned food 49 48 43 47 32 37 41 44 Paper products 54 56 53 54 19 19 23 24 Baby food 11 11 12 13 12 13 16 15 Personal care 61 62 59 57 15 17 18 19 Cosmetics 63 63 64 61 5 7 7 9 Confectionery 59 62 61 62 16 18 21 23 Hot drinks 58 60 60 64 15 17 19 20 Soft drinks 47 43 40 40 8 8 10 11 Dairy products 21 22 20 20 15 18 20 21 Cleaning products 66 68 68 72 16 18 20 20 Oils 37 41 40 38 16 20 21 21 Eggs 5 5 7 9 7 8 10 11 Tobacco 93 94 94 94 2 1 1 1 Source: AMPD-Ipsos KMG
25
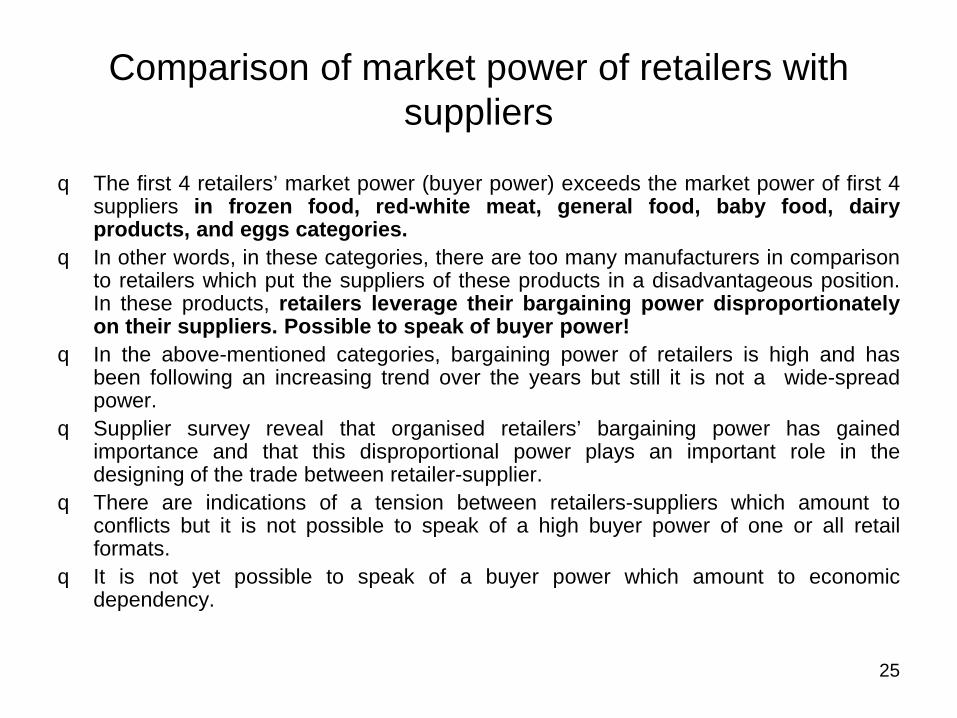
Comparison of market power of retailers with suppliers
q The first 4 retailers’ market power (buyer power) exceeds the market power of first 4 suppliers in frozen food, red-white meat, general food, baby food, dairy products, and eggs categories.
q In other words, in these categories, there are too many manufacturers in comparison to retailers which put the suppliers of these products in a disadvantageous position. In these products, retailers leverage their bargaining power disproportionately on their suppliers. Possible to speak of buyer power!
q In the above-mentioned categories, bargaining power of retailers is high and has been following an increasing trend over the years but still it is not a wide-spread power.
q Supplier survey reveal that organised retailers’ bargaining power has gained importance and that this disproportional power plays an important role in the designing of the trade between retailer-supplier.
q There are indications of a tension between retailers-suppliers which amount to conflicts but it is not possible to speak of a high buyer power of one or all retail formats.
q It is not yet possible to speak of a buyer power which amount to economic dependency.

26
Competition Policy Suggestions
q Suggestions of the Preliminary Report: q The proposed measures of the preliminary report (code of conduct, ombudsman,
forwarding of retailer-supplier agreements to the competition agency on an annual basis and the decreasing of notification thresholds for retail mergers) are not necessarily to be implemented at this stage. LOWER MARKE SHARES, LOWER PL RATIO
q No urgent need to adopt a hard law instrument; soft law amendments would be sufficient at this level.

27
Policy Suggestions
q Implement a more effective concentration control regime: • Concentrations in the retail market are increasing by way of small-sized
acquisitions. • Even below dominance market share-levels, buyer-power induced competition-
limiting effects can be seen. • The dominance test of the Competition Act makes it difficult to intervene under
these conditions. In order to follow the acquis communataire and to overcome the defects explained, it is essential to use the “substantial lessening of competition test.”
q Geographical markets should be assessed and defined carefully to allow for an effective merger control. Additional analysis should be made by including customer catchment areas, loyalty cards etc.
q Even if the concentration ratios are not very high on a country-level, assessments should be made to allow for local market conditions. Plus, new definitions of relevant markets according to different formats are needed.

28
Policy Suggestions
q Current Legislation Needs to be Broadened with a Buyer-power focus • Retailer market power element needs to be added to exemption regime
(vertical restraints). • The market share threshold of 30% which was before sought only for the
supplier-side of the vertical agreement is now also sought for the buyer (retailer) in the EU (Commission Regulation 330/210 and Guidelines on Vertical Restraints).
• “Upfront access payment” and “category management” concepts which stem from retailers’ activities are also added to the Vertical Restraints Notice.
• According to the Notice, these concepts are to be assessed by rule-of-reason, • The TCA is working on a similar reform.
29
Policy Suggestions
q Monitoring buyer power and the developments in the market • With the projection that the concentration and buyer power in the FMCG
retailing sector would increase in the upcoming years, a data-bank needs to be established to follow the trends.
• Annual monitoring of private labels, retail and supplier side concentration ratios (calculating buyer power indexes).
• A voluntary based code of conduct could be on the agenda if market shares keep on rising.