Embed Size (px)
Citation preview

The BC Economy to 2010 and Beyond
November 19, 2008West Vancouver Chamber of CommerceWest Vancouver, BC
Virginia GreenePRESIDENT and CHIEF EXECUTIVE OFFICER
Business Council of British Columbia

2
Business Council of British Columbia
• Cross-sectoral business association representing large and mid-sized firms drawn from 15+ industries with a presence in BC
• Membership of 230 organizations, mainly companies but also including several affiliated sector associations, which together = 25% of all paid jobs in BC
• Core mandate: 1) advocate for a growing and competitive economy; 2) encourage business investment and economic development
• Most work is done at the provincial level, with some attention to federal/local government issues

3
2008 – One for the Record Books!
• Global financial crisis and credit crunch
• US housing implosion
• Violent swings in oil prices – from US$70/bbl in January to $147 in July and $55 in mid November
• Start of a “world recession” likely in Q4
• Rapid fire restructuring of financial industries
• Shift from widespread fears of surging inflation in Q1 to initial worries about deflation by Q4
• Canada – commodity prices boost value of exports and now are a drag on exports
3

4
A newsflash…

5
World Real GDP Growth, PPP weighted
0
1
2
3
4
5
6
7
70 72 74 76 78 80 82 84 86 88 90 92 94 96 98 00 02 04 06
Post 2002 Period Saw Robust Global Economic Expansion
Source: IMF, PPP=purchasing power parity.
per cent

6
Current World Situation
• Global economy is clearly losing steam
• US, Japan, Euro area and UK in recession » advanced economies as a group projected to shrink
0.3% next year (IMF)
• China, India, OPEC, and other emerging markets continue to grow but are slowing too
• Financial crisis clouds the outlook for 2009 (and 2010?)
• “Decoupling” a myth – global connections stronger than ever
6
7
Share of World Growth
Source: TD Economics.* Including Newly Industrialized Asian countries.
40
42
44
46
48
50
52
54
56
58
60
80 82 84 86 88 90 92 94 96 98 00 02 04 06
per cent of total
Emerging Markets*
Industrialized Countries
8
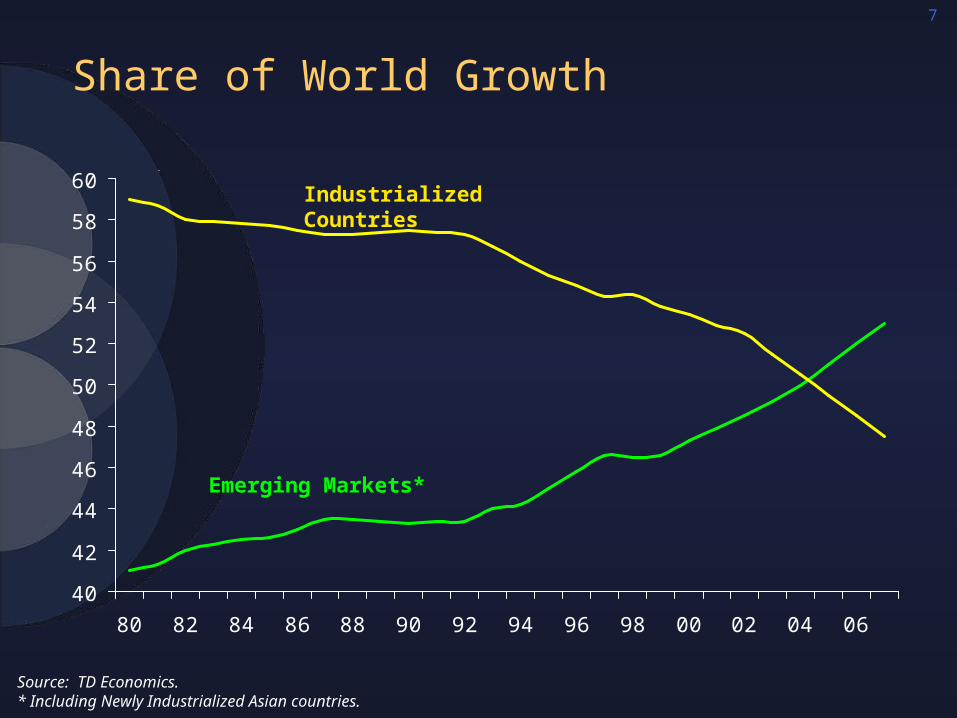
Source: PWC.
The World in 2050: Projected Size of National Economies (US = 100)
0
20
40
60
80
100
120
140
US
Japan
Chin
a
Germ
any
UK
France
Italy
Canada
Bra
zil
Russ
ia
India
Mexi
co
Indonesi
a
2007 2050
GDP at Market Exchange Rates in US Dollars

9
US Overview • US economy in recession
» contracted 0.3% in Q3» real personal consumption fell 3.1% » ISM Mfg. Index 38.9 in October» weak recovery in 2009 ?
• Employment falling » 9 consecutive months of job losses, employment down
year-over-year and unemployment up
• Consumer is the key to the outlook» fiscal stimulus package waning, housing bust continues to
unfold» energy and food prices hammered household budgets» financial crisis broadening
• US dollar devaluation is trimming trade deficit (boosted exports, lowering imports)
10
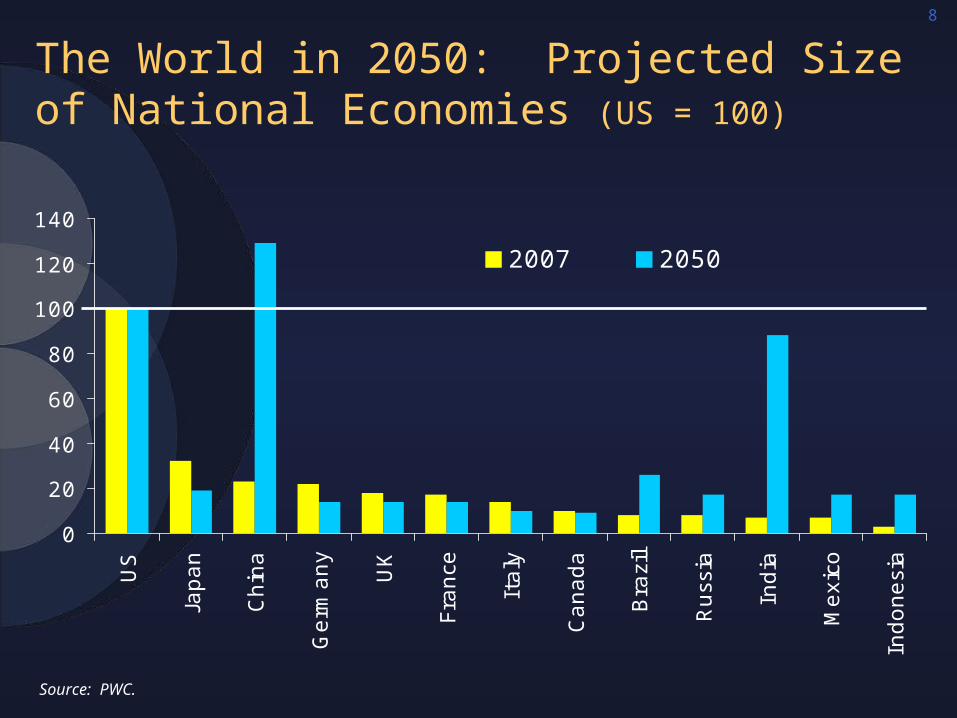
US Housing – A Bleak Picture
• Prices falling in all major cities – Case/Shiller 20-city index down 16% y/y in Q2 2008» all 20 metro areas showing annual declines» biggest drop in 20 year history of index
• Approx. 11 months of unsold inventory for new homes and existing homes
• Large scale foreclosures
• No meaningful recovery until 2010

11
US Housing Startsmonthly, S.A. annual rates
800
1000
1200
1400
1600
1800
2000
2200
2400
90 91 92 93 94 95 96 97 98 99 00 01 02 03 04 05 06 07 08
New Home Construction Tumbles
Source: US Census Bureau.
thousands
Latest September 2008

12
Global Credit Market Turmoil
• Began in Q2 2007 and is still ongoing
• Underlying causes include:
» rapid growth of securitization of debt (“originate and distribute model” at banks and investment firms)
» poor risk management
» financial innovation and complexity of products
» malfeasance by credit rating agencies
» skewed incentives for financial actors
• But perhaps the most important factor was the benign economic environment – the ‘perfect calm’: several years of strong global growth, low interest rates, subdued inflation

13
Financial Crisis – Some Consequences
• Liquidity impairment amidst mounting risk aversion, plus ongoing de-leveraging, leading to…» weaker global economy in 2009-2010» rapid-fire restructuring of financial industries
• Massive government intervention, followed by tightened regulation
• Some of the costs of the financial and the preceding sub-prime mortgage crises:» IMF: financial institutions’ losses = $1.5 trillion» US household net worth down perhaps $3 trillion (housing
plus equities)» Government bailouts/backstops in US, Japan, EU, UK –
unknown cost
• Undermines consumer confidence

14
Homeowners Net Equity as % of Household Real Estate
Source: Global Insight.
45
50
55
60
65
70
75
80
62 71 80 89 98 07
United States
Canada
%
1515
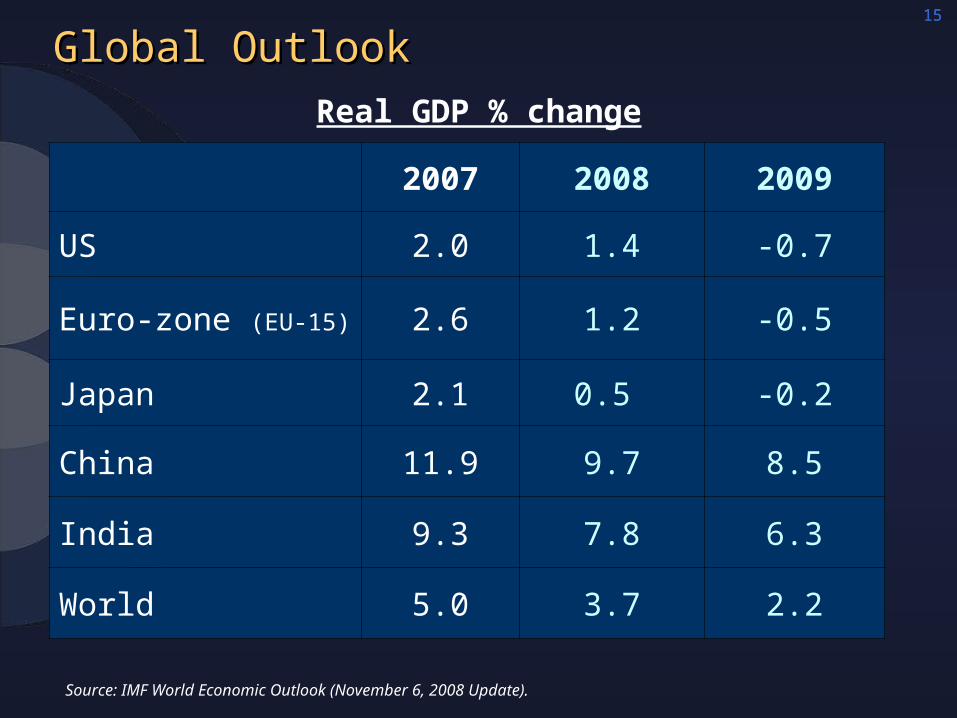
Global Outlook Global Outlook
Source: IMF World Economic Outlook (November 6, 2008 Update).
2007 2008 2009
US 2.0 1.4 -0.7
Euro-zone (EU-15) 2.6 1.2 -0.5
Japan 2.1 0.5 -0.2
China 11.9 9.7 8.5
India 9.3 7.8 6.3
World 5.0 3.7 2.2
Real GDP % change

16
Canadian Backdrop
• Economic growth is slowing and will continue to moderate in the coming quarters» recession likely» job market still relatively strong
• Manufacturing as a whole in recession for more than a year
• Dwindling trade surplus a major drag on growth
• Western provinces (BC, Alta, Sask) still doing better than the rest
• Interest rates – Bank of Canada coordinated cut Oct. 8 then trimmed another 25 bps
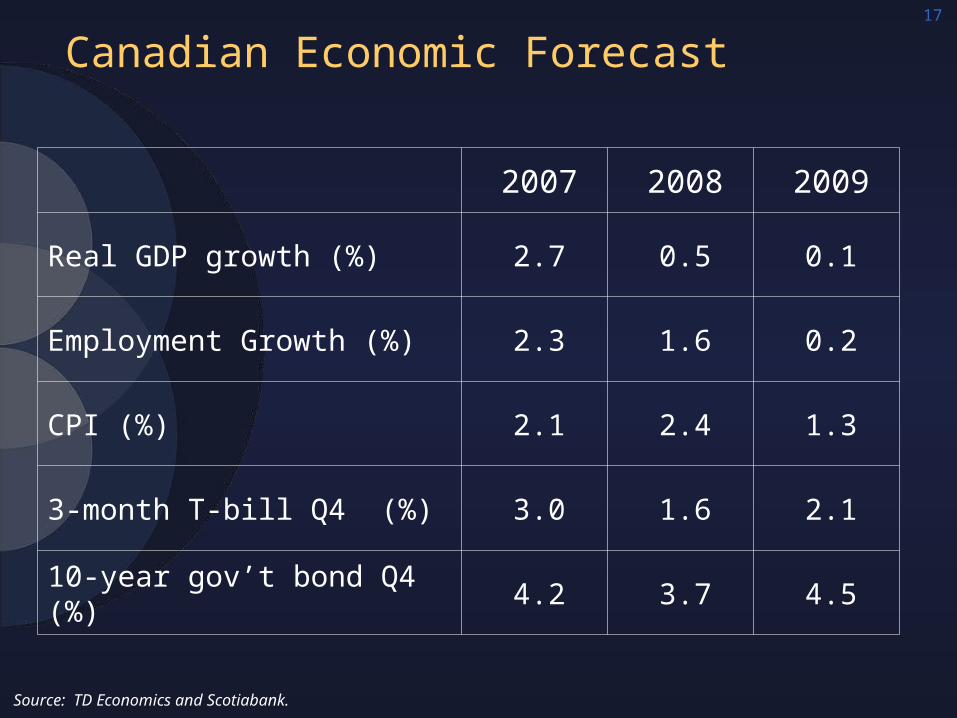
17
Canadian Economic Forecast
2007 2008 2009
Real GDP growth (%) 2.7 0.5 0.1
Employment Growth (%) 2.3 1.6 0.2
CPI (%) 2.1 2.4 1.3
3-month T-bill Q4 (%) 3.0 1.6 2.1
10-year gov’t bond Q4 (%) 4.2 3.7 4.5
Source: TD Economics and Scotiabank.

18
Real GDP Growth, Western Canada (aggregate)
0
1
2
3
4
5
6
7
98 99 00 01 02 03 04 05 06 07
per cent
Western Canada
Rest of Canada
Stronger Economies in the WestStronger Economies in the West
Source: Statistics Canada.
19
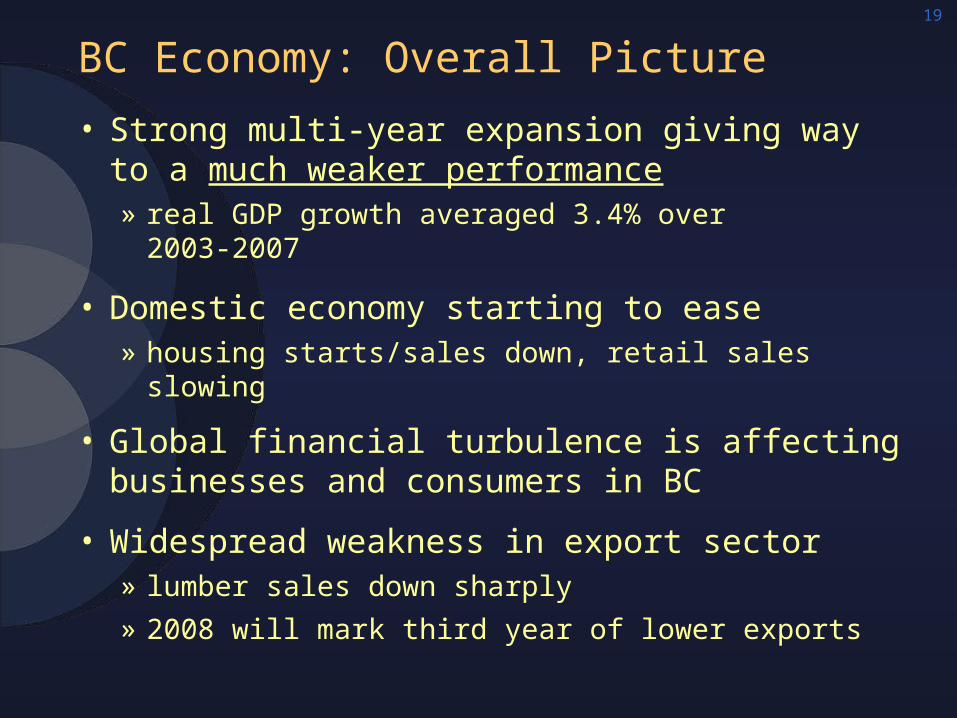
BC Economy: Overall Picture
• Strong multi-year expansion giving way to a much weaker performance » real GDP growth averaged 3.4% over
2003-2007
• Domestic economy starting to ease » housing starts/sales down, retail sales slowing
• Global financial turbulence is affecting businesses and consumers in BC
• Widespread weakness in export sector» lumber sales down sharply
» 2008 will mark third year of lower exports
20
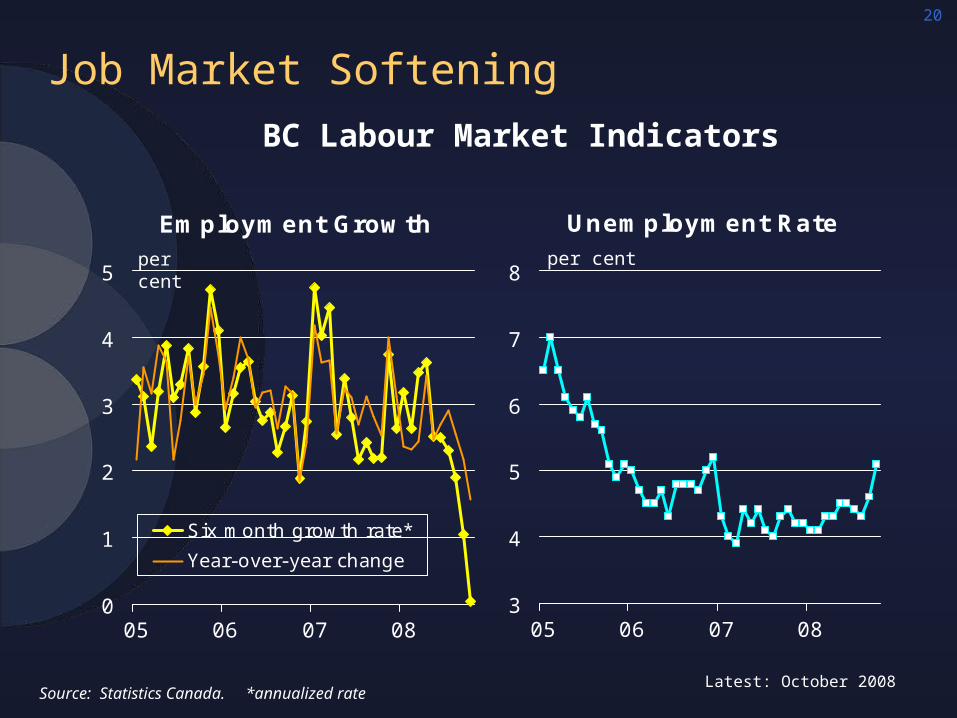
Unemployment Rate
3
4
5
6
7
8
05 06 07 08
Job Market Softening
Employment Growth
0
1
2
3
4
5
05 06 07 08
Six month growth rate*
Year-over-year change
BC Labour Market Indicators
per cent per cent
Source: Statistics Canada. *annualized rateLatest: October 2008
21
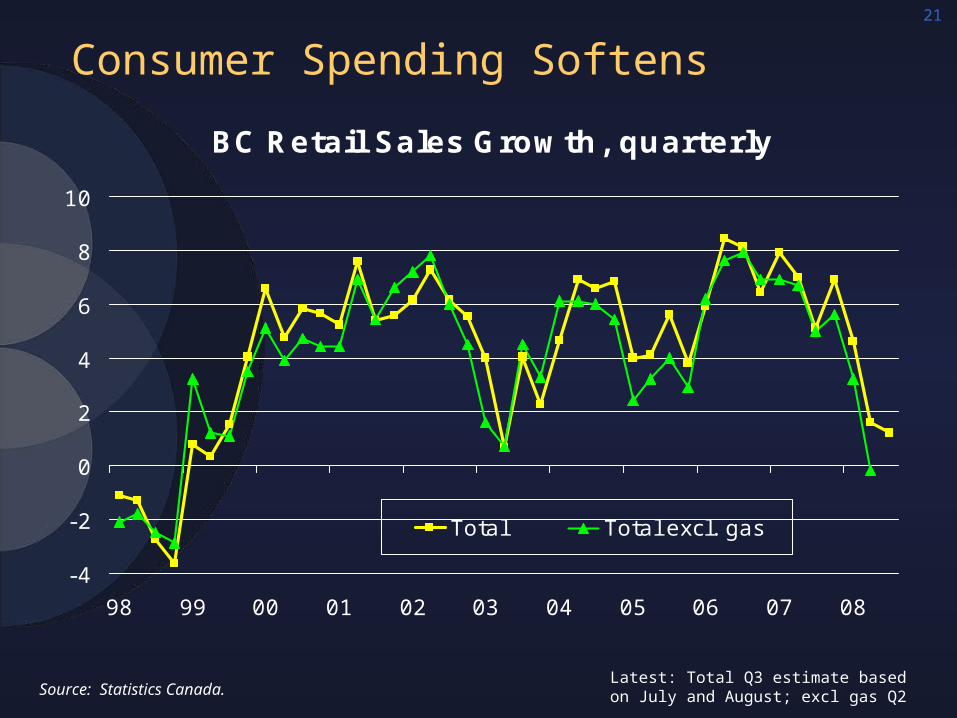
Consumer Spending Softens
BC Retail Sales Growth, quarterly
-4
-2
0
2
4
6
8
10
98 99 00 01 02 03 04 05 06 07 08
Total Total excl. gas
y/y per cent change
Latest: Total Q3 estimate based on July and August; excl gas Q2Source: Statistics Canada.

22
Softer Housing Market Dampening Retail Activity
Source: Statistics Canada.
BC Retail Sales Growth by Sector
-5
0
5
10
15
Homecentres
Furn. &home
furnishings
Appliances& electron.
Buildingmaterials& garden
stores
Autos (new &used)
Clothingstores
Total Gasstations
Avg. 2004-07
J an-J une 2008
y/y per cent change

23
Annual Change in Price of Homes Sold*
-10
-5
0
5
10
15
20
25
30
02 03 04 05 06 07 08
Housing Market Slowing
Sales & New Listings, monthly SA
1500
2500
3500
4500
5500
02 03 04 05 06 07 08
Sales Listings
Greater Vancouver Housing Indicators
units per cent
Source: CREA; * average price of all homes sold through MLS®.Latest: September 2008

24
Investment Turns Lower
BC Non-Residential I nvestment, quarterly
400
600
800
1000
1200
1400
1600
98 99 00 01 02 03 04 05 06 07 08
Current $
2002 $
millions $
Latest: Q2 2008Source: Statistics Canada.

25
BC Economic Forecast(annual % change unless noted; as of Oct 1/08)
Source: Statistics Canada and Business Council of British Columbia.
actual actual forecast
2006 2007 2008 2009 2010
Real GDP 3.3 3.1 1.6 1.0 2.8
Employment 3.1 3.2 2.3 1.2 1.9
Retail sales 6.5 7.0 3.5 3.0 7.5
Foreign exports -2.0 -5.6 -2.0 -5.0 3.0
Housing starts(units)
36,500 39,200 33,000 26,000 28,000

26
Some Progress in Closing BC’s “Prosperity Gap” with Canada
Source: Statistics Canada, Provincial Economic Accounts.
15,000
20,000
25,000
30,000
35,000
40,000
45,000
50,000
2001 2007 2001 2007
Canada BC
Real GDP per Capita Real Disposable Income per Capita
$4,040 gap
$2,656 gap
$552 gap
$237 gap
$ 2002

27
Premier’s 10 Point Plan
• Provides some support to consumer confidence» cumulative stimulus of $485 million over the next three years,
plus accelerated infrastructure spending
• A number of items relevant to BC business» school property tax rebate for light and heavy industry ($115 m
over three years), building upon reductions in Budget 2008» tax relief for small business – tax rate cut to 2.5%, from 3.5%
starting December 1st ($146 million over three years)» double commission paid to business for PST & hotel room tax
• Individuals will see a cut in income tax - $144 million in total, retroactive benefit on 2008 tax return
• Pension “opportunity” – private sector pension plan available to employers, employees and self-employed (no details)
• Speed up infrastructure spending

28
Key BC Key BC Medium-TermMedium-Term Economic Economic Challenges Challenges
• Labour scarcity, skill shortages
• Weak export base, growing trade deficit
• Managing fallout from the pine beetle disaster
• Economic diversification (especially as forest sector declines)
• Improving BC’s poor productivity record
• Strengthening performance on innovation and research

29
Lacklustre Productivity Growth
Source: Centre for the Study of Living Standards.
Productivity Growth by Province 1987-2006
0 10 20 30 40 50
British Columbia
New Brunswick
Manitoba
Nova Scotia
Prince Edward I sland
Quebec
Ontario
Alberta
Saskatchewan
Nfld & Labrador
per cent

30
Trade More Important to BC’s Economy
BC Exports and Imports as a Share of GDP
20
40
60
80
100
1983 1988 1993 1998 2006
Exports Imports Exports + Imports
Source: Statistics Canada.
per cent
Up 26 percentage
points since 1983
31
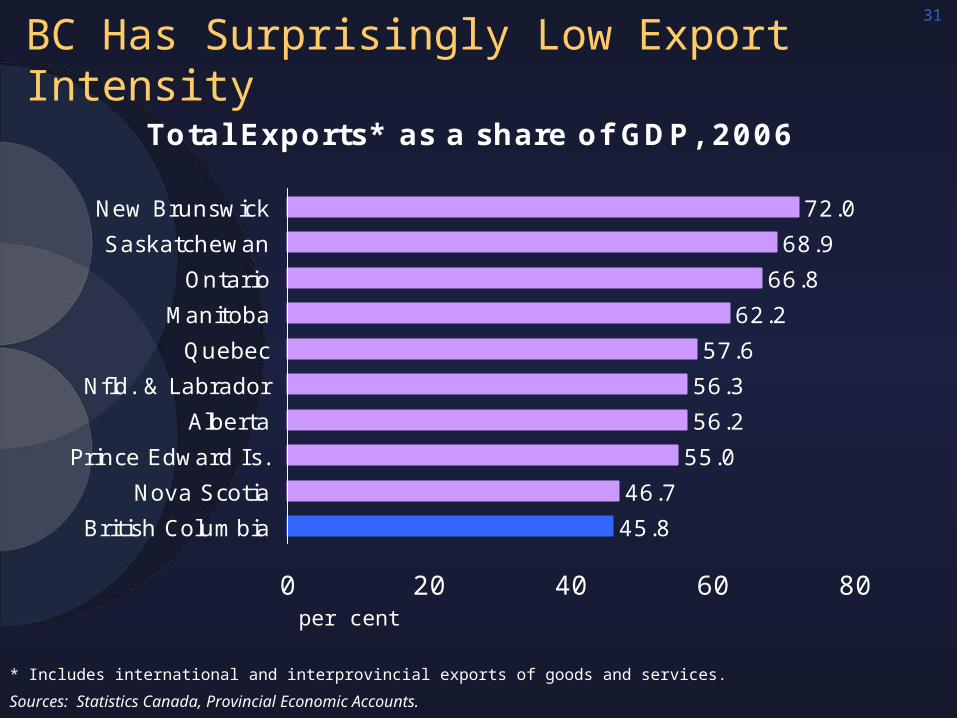
BC Has Surprisingly Low Export Intensity
Sources: Statistics Canada, Provincial Economic Accounts.
* Includes international and interprovincial exports of goods and services.
Total Exports* as a share of GDP, 2006
45.8
46.7
55.0
56.2
56.3
57.6
62.2
66.8
72.0
68.9
0 20 40 60 80
British Columbia
Nova Scotia
Prince Edward I s.
Alberta
Nfld. & Labrador
Quebec
Manitoba
Ontario
Saskatchewan
New Brunswick
per cent
32
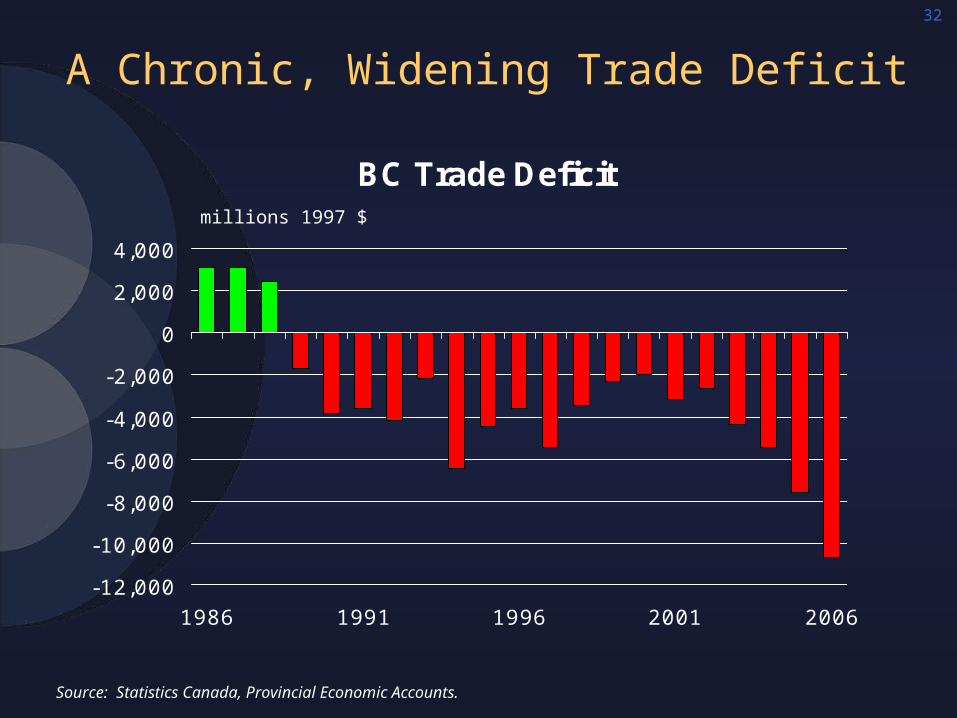
A Chronic, Widening Trade Deficit
Source: Statistics Canada, Provincial Economic Accounts.
BC Trade Deficit
-12,000
-10,000
-8,000
-6,000
-4,000
-2,000
0
2,000
4,000
1986 1991 1996 2001 2006
millions 1997 $

33
Goods (75% of total BC exports) Resource industries Resource processing Secondary manufacturing High tech manufacturing
Services (25% of total BC exports) Business/commercial/financial services Tourism Communications Culture/entertainment services (film/t.v./new media) Other high tech services Professional services (engineering, law, accounting, architecture)
Transportation (mostly linked to trade in goods)
Maritime-related services Royalties/license fees Education
The Structure of BC’s Export Base

3434
Need for Diversification
• Forestry = 40-45% of BC’s international merchandise exports and a similar share of manufacturing output
• Forestry destined to shrink, due topine beetle and ongoing decline in the size and economic contribution of pulp/paper industry
• Mining and energy are much better positioned to grow.
• Tourism struggling, based on the past few years’ performance.
• Bottom line: BC needs new engines of wealth creation, capable of exporting or otherwise generating inflows of income to the province
35
Opportunity BC 2020 Project Overview Opportunity BC 2020 Project Overview
• Focus on BC’s economic prospects to 2020
• Initial think piece, followed by 25 individual topic papers
• Drafts of the papers will be developed in 2008/09 and reviewed by relevant business stakeholders before finalized in spring 2009
• Public communication strategy and rollout of selected topic papers (partnership with Canwest Global)
• Major June 2009 conference on BC’s economic future
• Synthesis report
• All topic papers and final report available at no charge via website

36
Opportunity BC 2020 Project – Opportunity BC 2020 Project – Core Questions Core Questions
1. What are the key trends that will define the economic and demographic environment for BC to 2020?
2. How can BC, as a small, open economy, continue to prosper in a more competitive and increasingly knowledge-based world?
3. What steps can be taken to improve upon current policies, institutions, attitudes, and practices to strengthen the foundations for prosperity in the province?

37
Conclusions
• Global recession, unprecedented credit market crisis (not yet resolved) adds significant downside risk
• Canadian economy stalling
• Much slower growth ahead for BC economy, weakening evident then global financial turmoil» no significant growth engines
» export sector remains soft, prompting more regional variation
» BC may continue to out-perform Canada, but gap will narrow
• Labour market conditions will ease, but over the medium term the job market will continue to reflect the shift toward an environment of relative labour scarcity
• BC also confronted by a number of medium-term challenges (the export base, weak productivity, pine beetle, aging population, carbon constraints)

38
For a copy of this presentation, For a copy of this presentation, please contactplease contact
Barbara McNicholls Barbara McNicholls atat
[email protected]@bcbc.comoror
604-684-3384604-684-3384