Embed Size (px)
Citation preview
1
The Assessment/Instruction The Assessment/Instruction Connection: What Every Principal Connection: What Every Principal
and Coach Should Knowand Coach Should KnowDr. Joseph K. TorgesenDr. Joseph K. Torgesen
Florida State University and the Florida State University and the Florida Center for Reading ResearchFlorida Center for Reading Research
PrincipalPrincipal’’s Leadership Conference, July, 2006s Leadership Conference, July, 2006
With this presentation, I have included notes for most of the slides that explain and elaborate the information in the slide. It is provided only in a format that cannot be manipulated in order to preserve school and student level confidentiality in some of the slides taken from the PMRN.
2
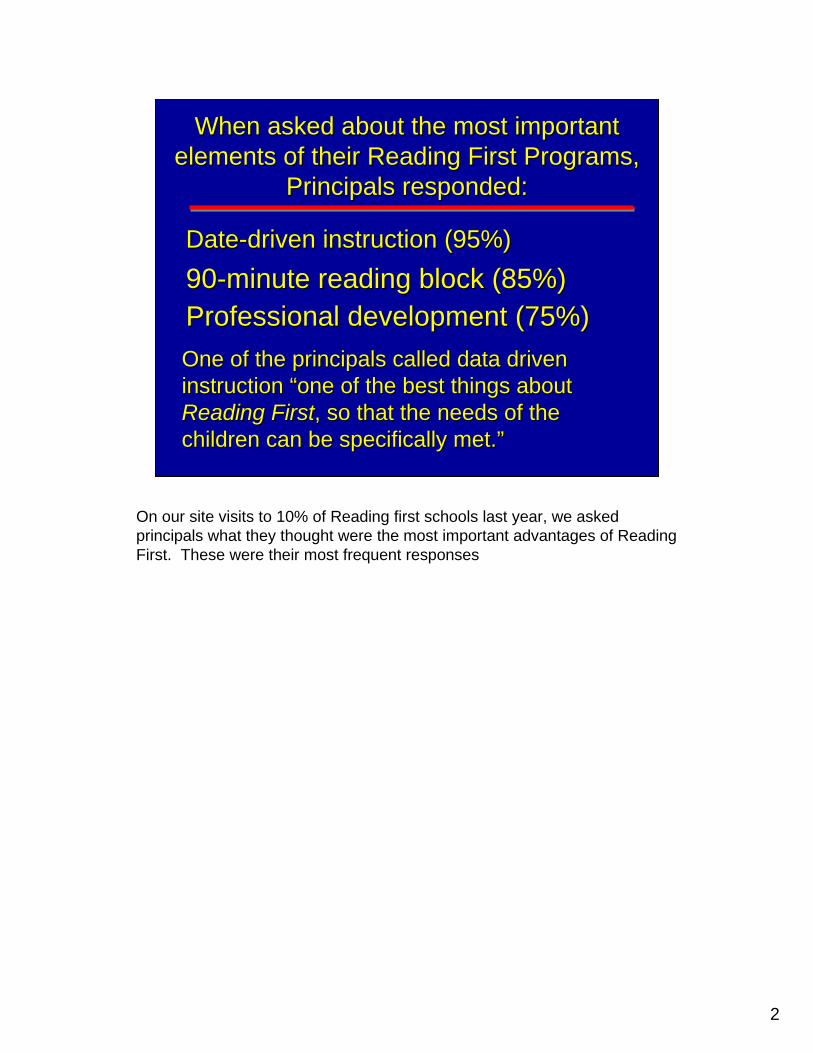
When asked about the most important When asked about the most important elements of their Reading First Programs, elements of their Reading First Programs,
Principals responded:Principals responded:
DateDate--driven instruction (95%)driven instruction (95%)9090--minute reading block (85%)minute reading block (85%)Professional development (75%)Professional development (75%)One of the principals called data driven One of the principals called data driven instruction instruction ““one of the best things about one of the best things about Reading FirstReading First, so that the needs of the , so that the needs of the children can be specifically met.children can be specifically met.””
On our site visits to 10% of Reading first schools last year, we asked principals what they thought were the most important advantages of Reading First. These were their most frequent responses
3
Successful schools use data effectively!Successful schools use data effectively!
This video simply underlines the fact that, in almost all large scale reform efforts, successful schools are the ones that learn to use data effectively to help them guide instruction.
4
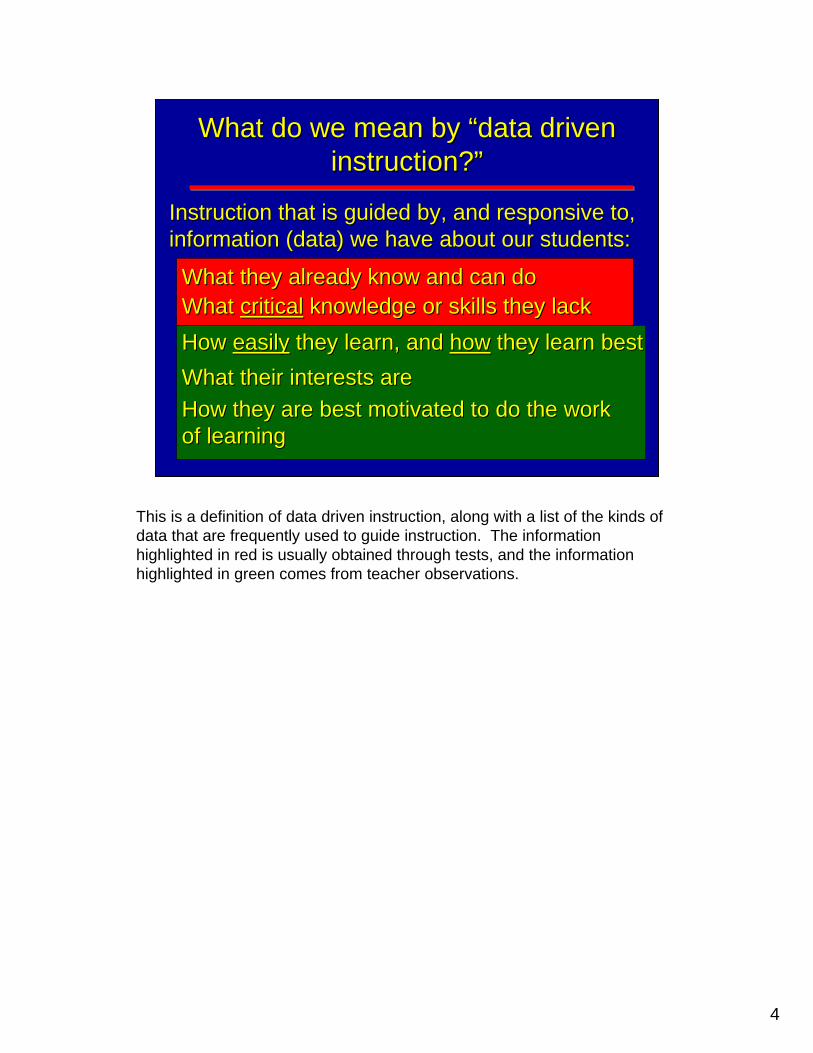
What do we mean by What do we mean by ““data driven data driven instruction?instruction?””
Instruction that is guided by, and responsive to, Instruction that is guided by, and responsive to, information (data) we have about our students:information (data) we have about our students:
What they already know and can doWhat they already know and can doWhat What criticalcritical knowledge or skills they lackknowledge or skills they lack
What their interests areWhat their interests areHow they are best motivated to do the work How they are best motivated to do the work of learningof learning
How How easilyeasily they learn, and they learn, and howhow they learn bestthey learn best
This is a definition of data driven instruction, along with a list of the kinds of data that are frequently used to guide instruction. The information highlighted in red is usually obtained through tests, and the information highlighted in green comes from teacher observations.
5
What are the major ways we can use What are the major ways we can use student data to improve teaching and student data to improve teaching and
learning?learning?Individual student dataIndividual student data can help us group can help us group children for instructionchildren for instruction
Probably the most widespread way that we use data to guide instruction is to help us in the formation of instructional groups.
6
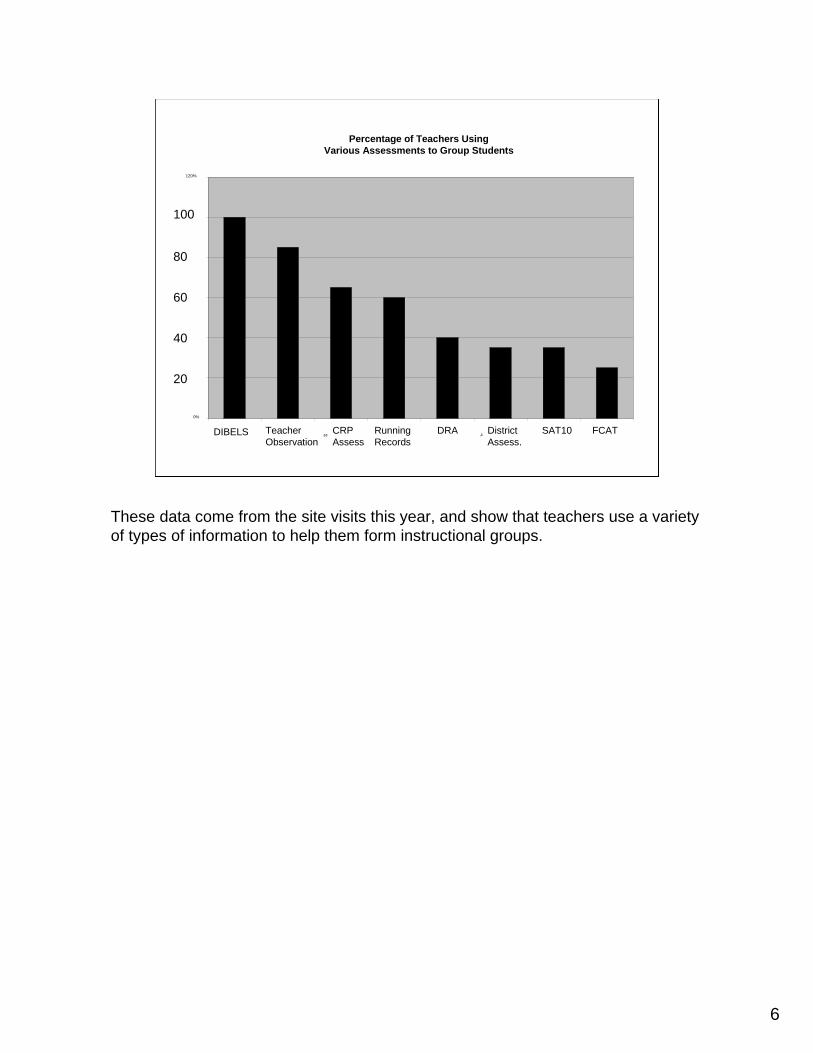
Percentage of Teachers UsingVarious Assessments to Group Students
0%
20%
40%
60%
80%
100%
120%
DIBELS Teacher
Observation
CRP
Assessments
Running
Records
DRA District
Assessments
SAT-10 FCAT
100
80
60
40
20
DIBELS Teacher Observation
CRP Assess
Running Records
DRA District Assess.
SAT10 FCAT
These data come from the site visits this year, and show that teachers use a variety of types of information to help them form instructional groups.

7
For instruction in basic components, For instruction in basic components, grouping students by ability is important grouping students by ability is important
This video simply explains that, for some types of instruction, particularly that which is focused on basic skills like phonemic awareness, phonics, and fluency, instructional efficiency is increased when students are taught in groups that are homogeneous with regard to their level of skill and knowledge in the area being taught.
8
What are the major ways we can use What are the major ways we can use student data to improve teaching and student data to improve teaching and
learning?learning?Individual student dataIndividual student data can help us group children for can help us group children for instructioninstruction
Instructional groups should be differentiated by:Instructional groups should be differentiated by:
Classroom and school level dataClassroom and school level data can help us identify can help us identify areas of instruction that need strengtheningareas of instruction that need strengthening
Focus of instructionFocus of instructionType of lesson structure: guided reading or skills Type of lesson structure: guided reading or skills
focusedfocusedFrequency and duration of small group instructionFrequency and duration of small group instructionSize of instructional groupSize of instructional group
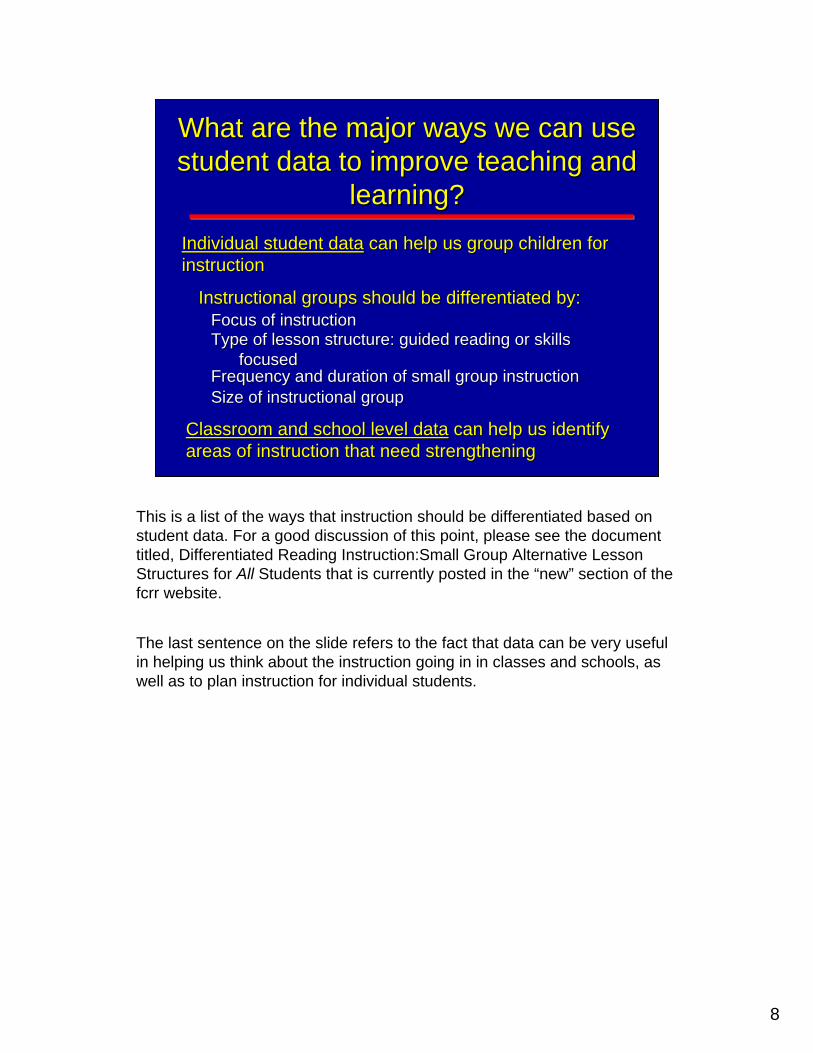
This is a list of the ways that instruction should be differentiated based on student data. For a good discussion of this point, please see the document titled, Differentiated Reading Instruction:Small Group Alternative Lesson Structures for All Students that is currently posted in the “new” section of the fcrr website.
The last sentence on the slide refers to the fact that data can be very useful in helping us think about the instruction going in in classes and schools, as well as to plan instruction for individual students.
9
A Comprehensive Assessment Plan for A Comprehensive Assessment Plan for Reading involves four types of Reading involves four types of
assessments:assessments:
ScreeningScreening
Progress MonitoringProgress Monitoring
DiagnosticDiagnostic
OutcomesOutcomesThese assessments provide These assessments provide somesome of what we of what we need to know, but do not provide all information need to know, but do not provide all information necessary to guide instructionnecessary to guide instruction
We use four broad types of assessments to help inform instruction at both the student and school level
10
Decision making at the Decision making at the level of the individual level of the individual
student using screening student using screening and progress monitoring and progress monitoring
datadata
.
11
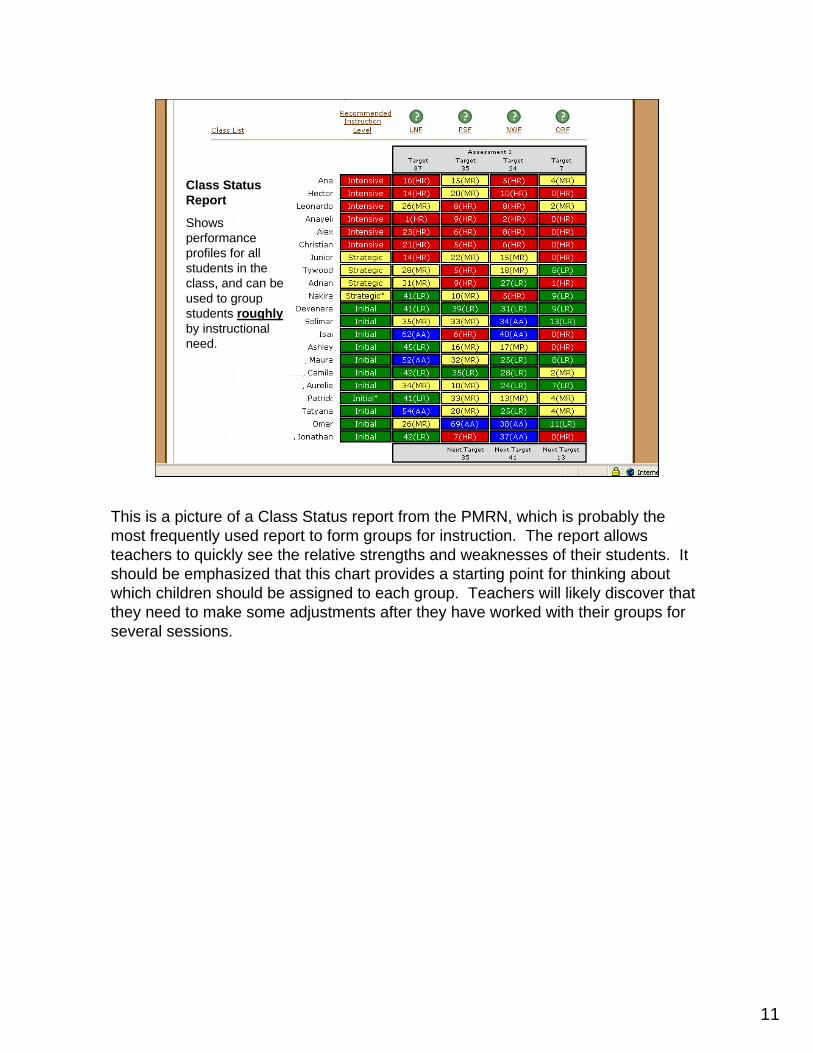
Class Status Report
Shows performance profiles for all students in the class, and can be used to group students roughlyby instructional need.
This is a picture of a Class Status report from the PMRN, which is probably the most frequently used report to form groups for instruction. The report allows teachers to quickly see the relative strengths and weaknesses of their students. It should be emphasized that this chart provides a starting point for thinking about which children should be assigned to each group. Teachers will likely discover that they need to make some adjustments after they have worked with their groups for several sessions.
12
Sept Dec Feb May
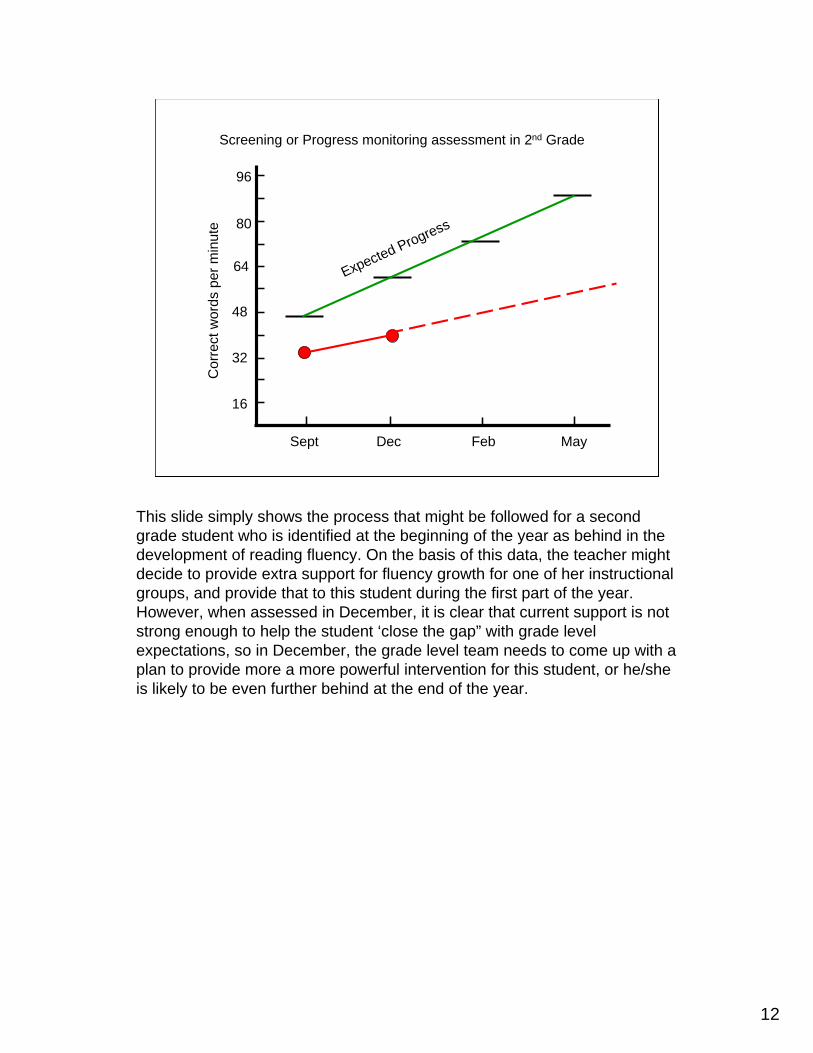
Screening or Progress monitoring assessment in 2nd Grade
16
32
64
48
80
96
Cor
rect
wor
ds p
er m
inut
e
Expected Progress
This slide simply shows the process that might be followed for a second grade student who is identified at the beginning of the year as behind in the development of reading fluency. On the basis of this data, the teacher might decide to provide extra support for fluency growth for one of her instructional groups, and provide that to this student during the first part of the year. However, when assessed in December, it is clear that current support is not strong enough to help the student ‘close the gap” with grade level expectations, so in December, the grade level team needs to come up with a plan to provide more a more powerful intervention for this student, or he/she is likely to be even further behind at the end of the year.
13
Sept Dec Feb May
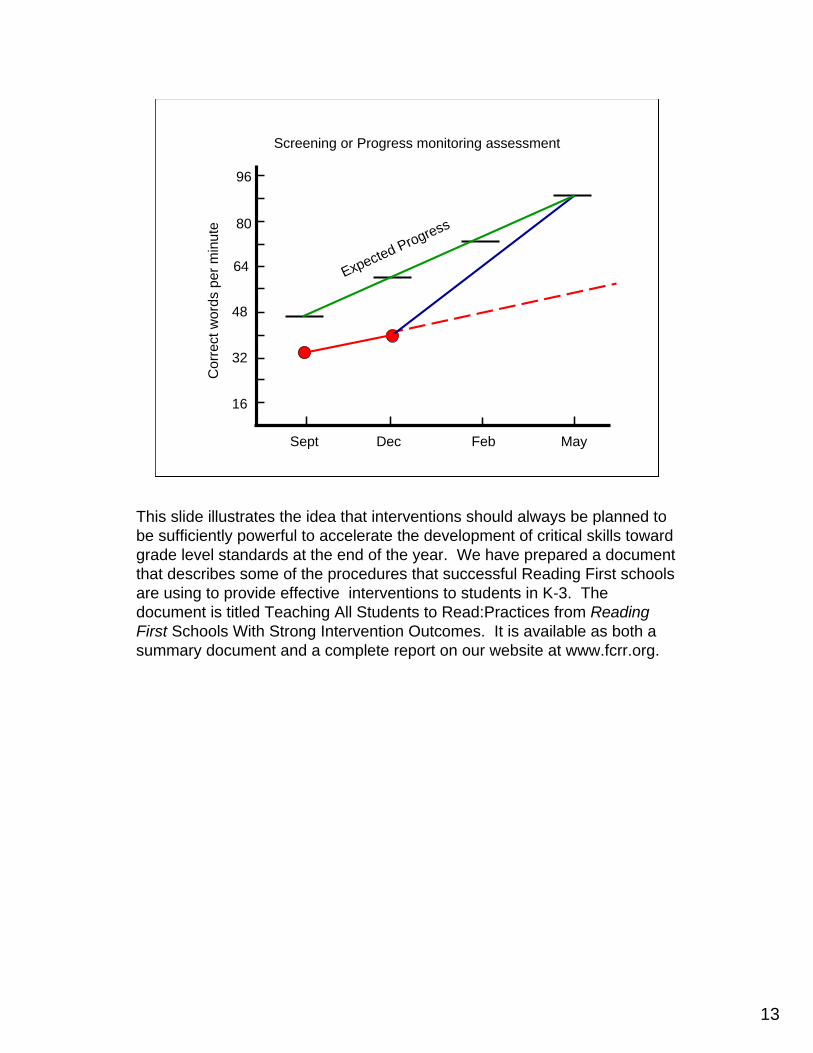
Screening or Progress monitoring assessment
16
32
64
48
80
96
Cor
rect
wor
ds p
er m
inut
e
Expected Progress
This slide illustrates the idea that interventions should always be planned to be sufficiently powerful to accelerate the development of critical skills toward grade level standards at the end of the year. We have prepared a document that describes some of the procedures that successful Reading First schools are using to provide effective interventions to students in K-3. The document is titled Teaching All Students to Read:Practices from Reading First Schools With Strong Intervention Outcomes. It is available as both a summary document and a complete report on our website at www.fcrr.org.
14
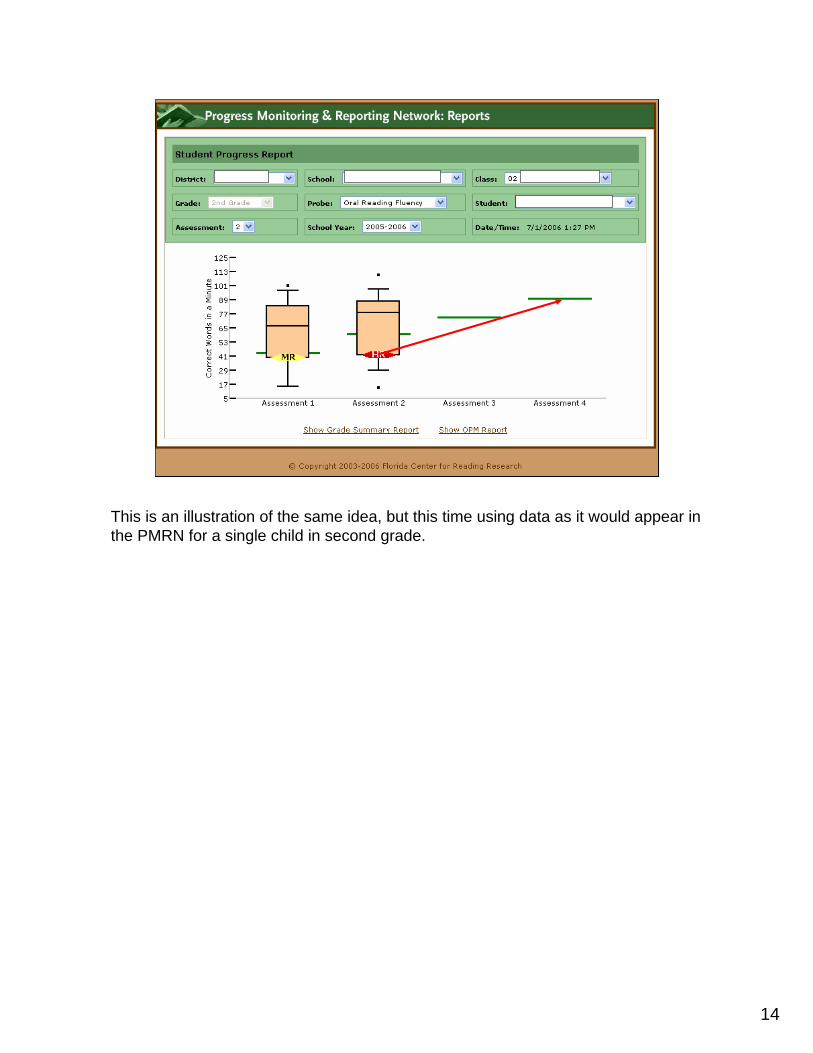
This is an illustration of the same idea, but this time using data as it would appear in the PMRN for a single child in second grade.
15
To use student reading data effectively To use student reading data effectively for any purposefor any purpose principals, coaches, principals, coaches, and teachers must understand the and teachers must understand the
relationships among reading relationships among reading components and the components and the URGENCYURGENCY of of development for foundational skillsdevelopment for foundational skills
Using data to help us evaluate the Using data to help us evaluate the effectiveness of classroom and school effectiveness of classroom and school
level programs and instructionlevel programs and instruction
I have provided a simple illustration of a couple common ways that data is used in planning more effective instruction for individual students. We will now turn out attention to the use of data to help us understand some areas we need to improve on in many of our Reading First schools.
Before we do that, though, I want to outline some important ideas about the development, and interdependence of critical skills as children learn to read.
16
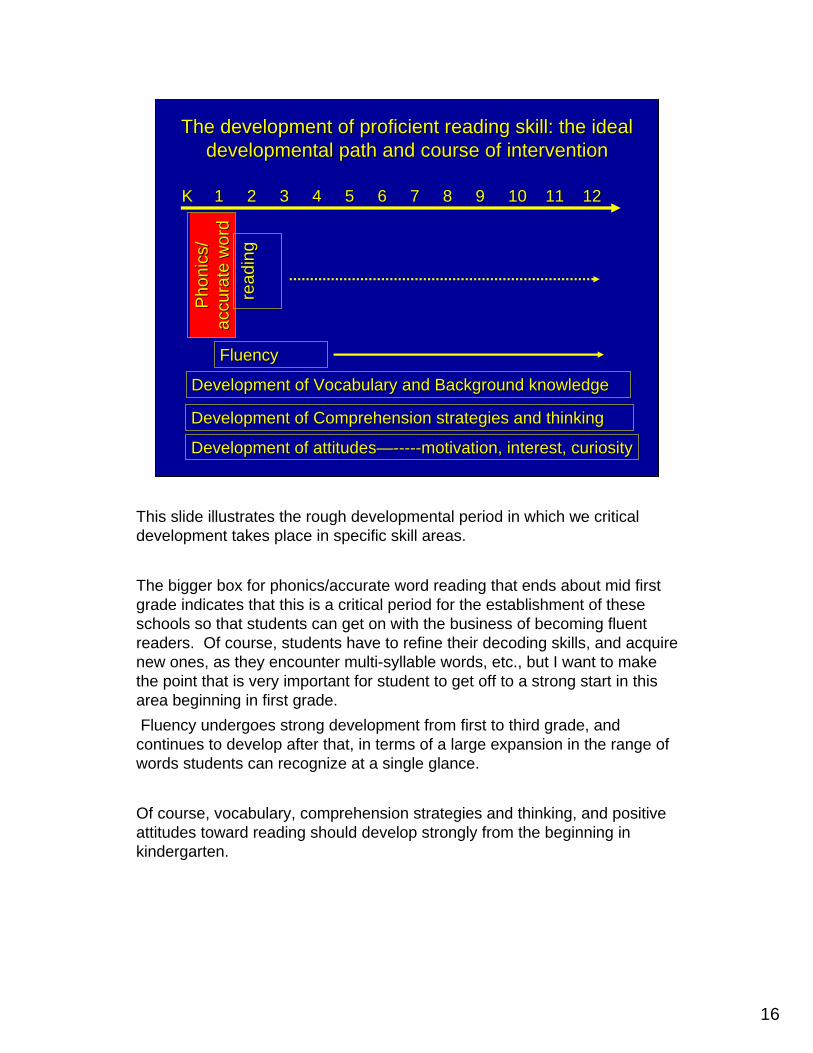
The development of proficient reading skill: the ideal The development of proficient reading skill: the ideal developmental path and course of interventiondevelopmental path and course of intervention
KK 11 22 33 44 55 66 77 88 99 1010 1111 1212
Development of Vocabulary and Background knowledgeDevelopment of Vocabulary and Background knowledge
Development of attitudesDevelopment of attitudes——----------motivation, interest, curiositymotivation, interest, curiosity
FluencyFluency
Pho
nics
/ P
honi
cs/
accu
rate
wor
d ac
cura
te w
ord
read
ing
read
ing
Development of Comprehension strategies and thinkingDevelopment of Comprehension strategies and thinking
This slide illustrates the rough developmental period in which we critical development takes place in specific skill areas.
The bigger box for phonics/accurate word reading that ends about mid first grade indicates that this is a critical period for the establishment of these schools so that students can get on with the business of becoming fluent readers. Of course, students have to refine their decoding skills, and acquire new ones, as they encounter multi-syllable words, etc., but I want to make the point that is very important for student to get off to a strong start in this area beginning in first grade.Fluency undergoes strong development from first to third grade, and
continues to develop after that, in terms of a large expansion in the range of words students can recognize at a single glance.
Of course, vocabulary, comprehension strategies and thinking, and positive attitudes toward reading should develop strongly from the beginning in kindergarten.
17
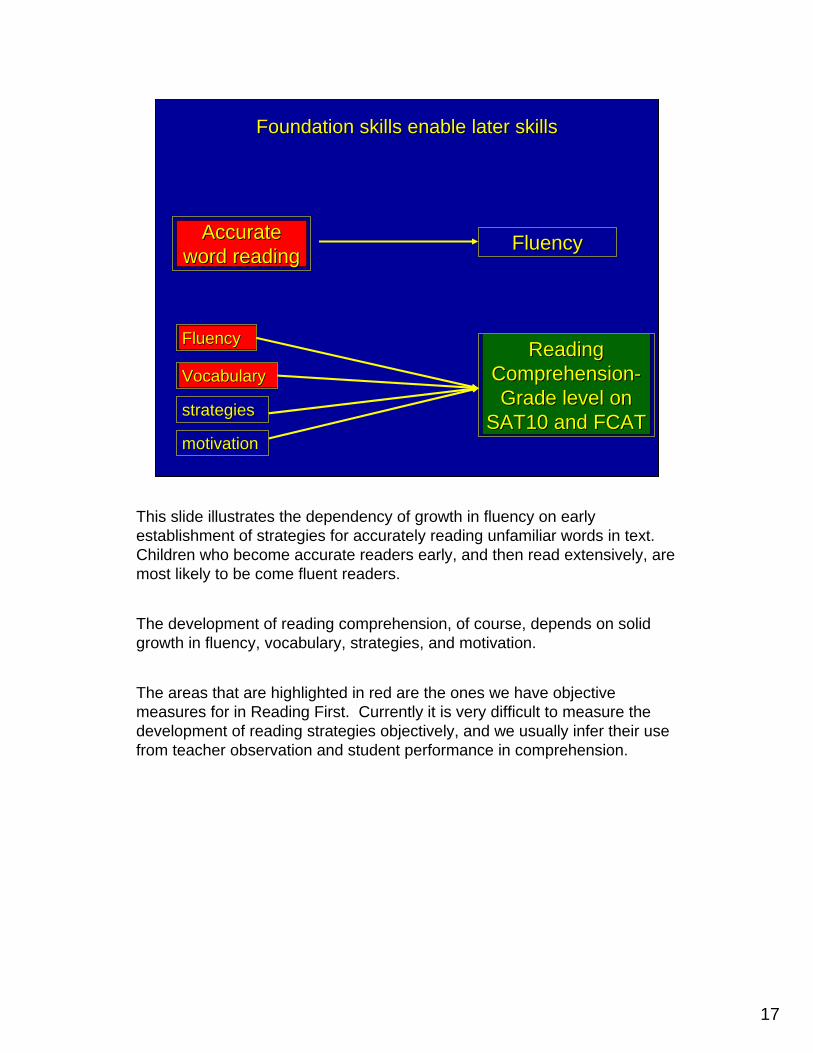
Foundation skills enable later skillsFoundation skills enable later skills
Accurate Accurate word readingword reading
FluencyFluency
VocabularyVocabulary
motivationmotivation
FluencyFluency
strategiesstrategies
Reading Reading ComprehensionComprehension--Grade level on Grade level on
SAT10 and FCATSAT10 and FCAT
This slide illustrates the dependency of growth in fluency on early establishment of strategies for accurately reading unfamiliar words in text. Children who become accurate readers early, and then read extensively, are most likely to be come fluent readers.
The development of reading comprehension, of course, depends on solid growth in fluency, vocabulary, strategies, and motivation.
The areas that are highlighted in red are the ones we have objective measures for in Reading First. Currently it is very difficult to measure the development of reading strategies objectively, and we usually infer their use from teacher observation and student performance in comprehension.
18
0
10
20
30
40
50
60
70
80
1 2 3
2006
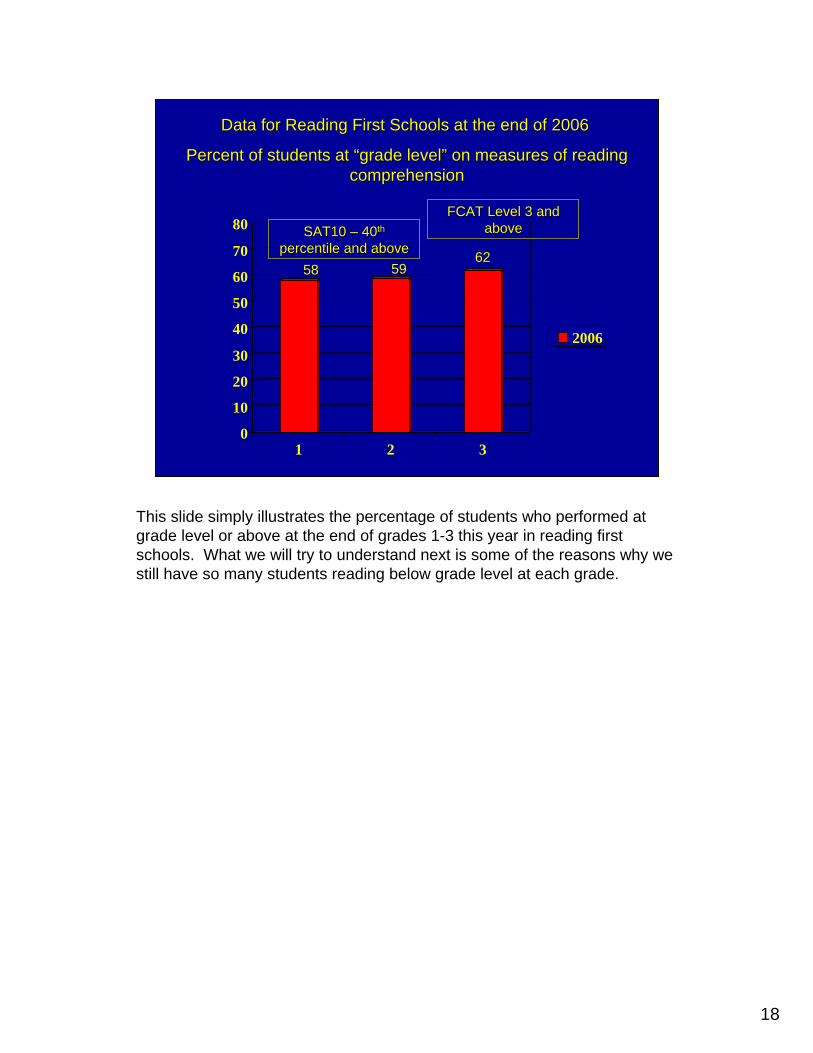
Data for Reading First Schools at the end of 2006Data for Reading First Schools at the end of 2006
5858 5959
Percent of students at Percent of students at ““grade levelgrade level”” on measures of reading on measures of reading comprehensioncomprehension
6262
SAT10 SAT10 –– 4040thth
percentile and abovepercentile and above
FCAT Level 3 and FCAT Level 3 and aboveabove
This slide simply illustrates the percentage of students who performed at grade level or above at the end of grades 1-3 this year in reading first schools. What we will try to understand next is some of the reasons why we still have so many students reading below grade level at each grade.
19
0
10
20
30
40
50
60
70
80
K 1 2 3
year 23535
39394444 4747
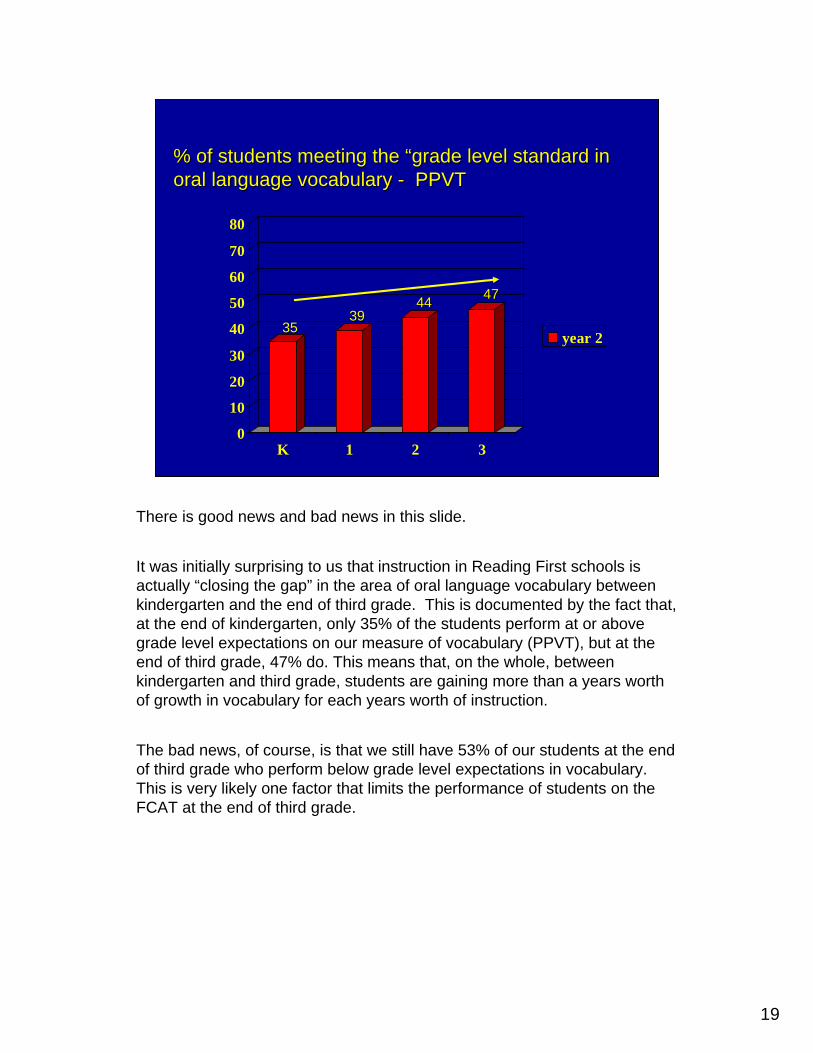
% of students meeting the % of students meeting the ““grade level standard in grade level standard in oral language vocabulary oral language vocabulary -- PPVTPPVT
There is good news and bad news in this slide.
It was initially surprising to us that instruction in Reading First schools is actually “closing the gap” in the area of oral language vocabulary between kindergarten and the end of third grade. This is documented by the fact that, at the end of kindergarten, only 35% of the students perform at or above grade level expectations on our measure of vocabulary (PPVT), but at the end of third grade, 47% do. This means that, on the whole, between kindergarten and third grade, students are gaining more than a years worth of growth in vocabulary for each years worth of instruction.
The bad news, of course, is that we still have 53% of our students at the end of third grade who perform below grade level expectations in vocabulary. This is very likely one factor that limits the performance of students on the FCAT at the end of third grade.
20
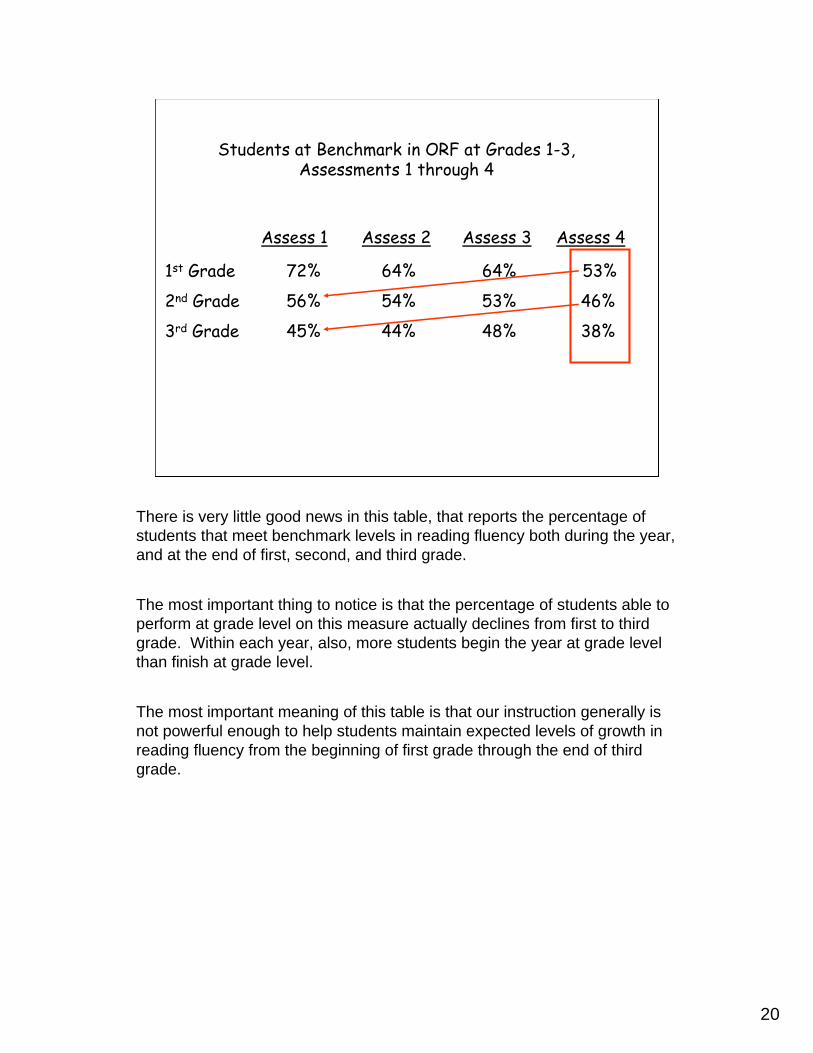
Students at Benchmark in ORF at Grades 1-3, Assessments 1 through 4
Assess 1 Assess 2 Assess 3 Assess 4
1st Grade
2nd Grade
3rd Grade
72% 64% 64% 53%
56% 54% 53% 46%
45% 44% 48% 38%
There is very little good news in this table, that reports the percentage of students that meet benchmark levels in reading fluency both during the year, and at the end of first, second, and third grade.
The most important thing to notice is that the percentage of students able to perform at grade level on this measure actually declines from first to third grade. Within each year, also, more students begin the year at grade level than finish at grade level.
The most important meaning of this table is that our instruction generally is not powerful enough to help students maintain expected levels of growth in reading fluency from the beginning of first grade through the end of third grade.

21
Representative sample Reading First of all students students
.30
.40
.50
.60
Cor
rela
tion
with
FC
AT
SS
S s
core
Cor
rela
tion
with
FC
AT
SS
S s
core
.70
.74
.68
.803rd Grade
.71
.57
Flue
ncy
Flue
ncy
Voc
abul
ary
Voc
abul
ary
This slide shows the correlations between FCAT scores and scores on measures of vocabulary and fluency in two different samples.
The values on the left come from a study of a representative sample of Florida Students described in a study by Schatschneider, et al., (2004) that is a technical report on the FCRR website.
The second sample is from current reading first students (about 60,000) in the spring of 2006.
The correlations are higher for the representative sample because there was a larger overall range of reading ability in that sample than in the reading first sample.
Notice that the correlation between fluency and FCAT scores is consistently higher than the correlation between FCAT scores and vocabulary in third grade.
22
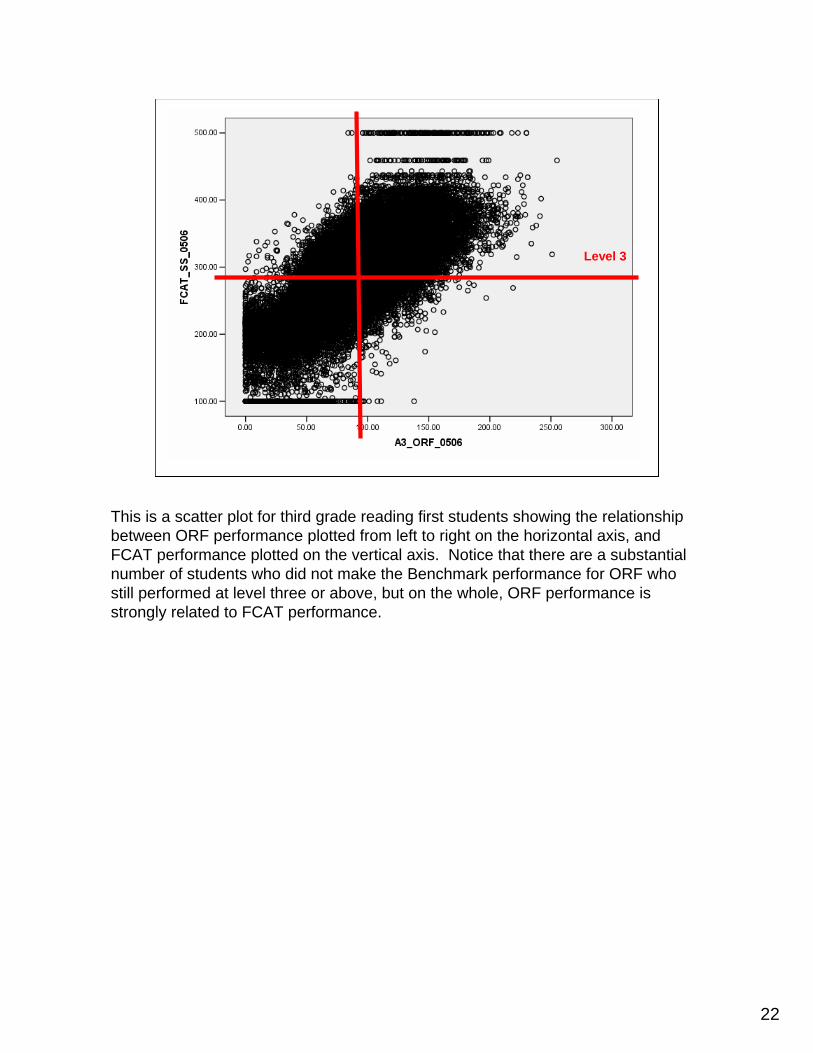
Level 3
This is a scatter plot for third grade reading first students showing the relationship between ORF performance plotted from left to right on the horizontal axis, and FCAT performance plotted on the vertical axis. Notice that there are a substantial number of students who did not make the Benchmark performance for ORF who still performed at level three or above, but on the whole, ORF performance is strongly related to FCAT performance.
23
10
20
30
40
Hi riskModerate Risk
Per
cent
of a
ll st
uden
tsP
erce
nt o
f all
stud
ents
50
60
Low Risk
70
80
90
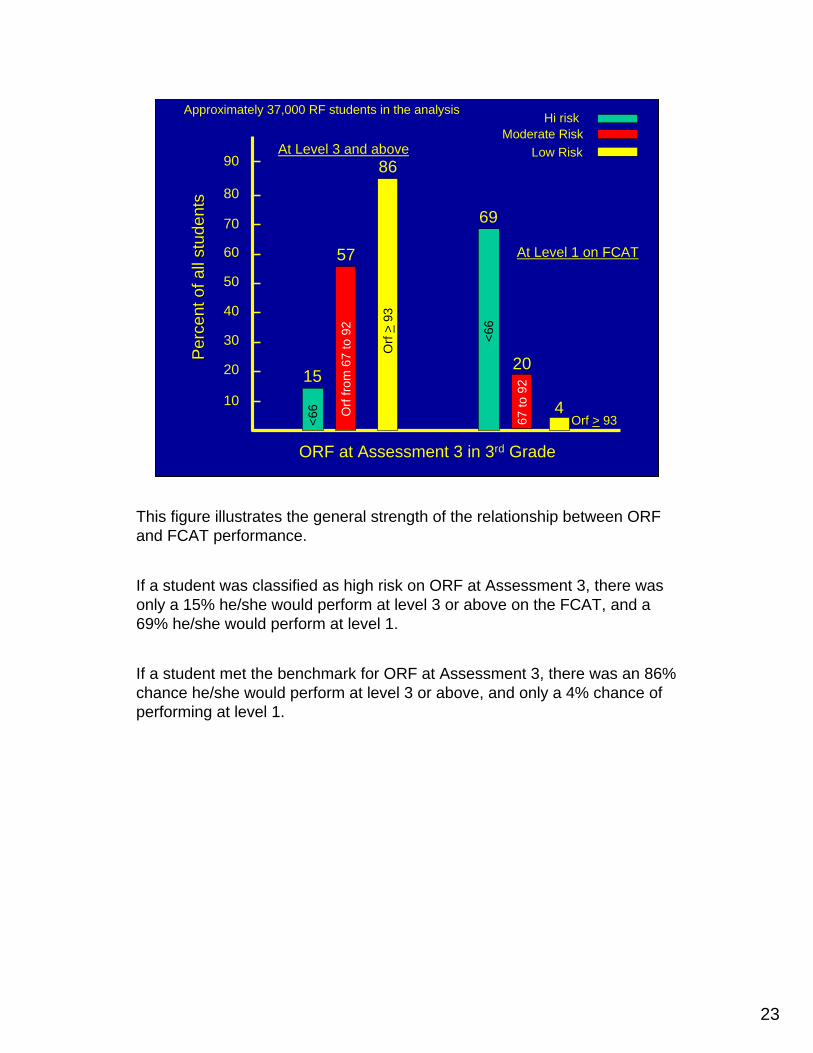
ORF at Assessment 3 in 3rd Grade
Approximately 37,000 RF students in the analysis
15
57
86
Orf
>93
Orf
from
67
to 9
2
<66
At Level 3 and above
69
20
4Orf > 9367
to 9
2
<66
At Level 1 on FCAT
This figure illustrates the general strength of the relationship between ORF and FCAT performance.
If a student was classified as high risk on ORF at Assessment 3, there was only a 15% he/she would perform at level 3 or above on the FCAT, and a 69% he/she would perform at level 1.
If a student met the benchmark for ORF at Assessment 3, there was an 86% chance he/she would perform at level 3 or above, and only a 4% chance of performing at level 1.
24
We are having difficulties meeting We are having difficulties meeting grade level expectations for growth grade level expectations for growth
in reading fluency, and it is likely in reading fluency, and it is likely having an impact on students having an impact on students
ability to meet grade level ability to meet grade level standards on the FCAT in third standards on the FCAT in third
gradegrade
This is an important conclusion from the state wide data we have seen so far.
25
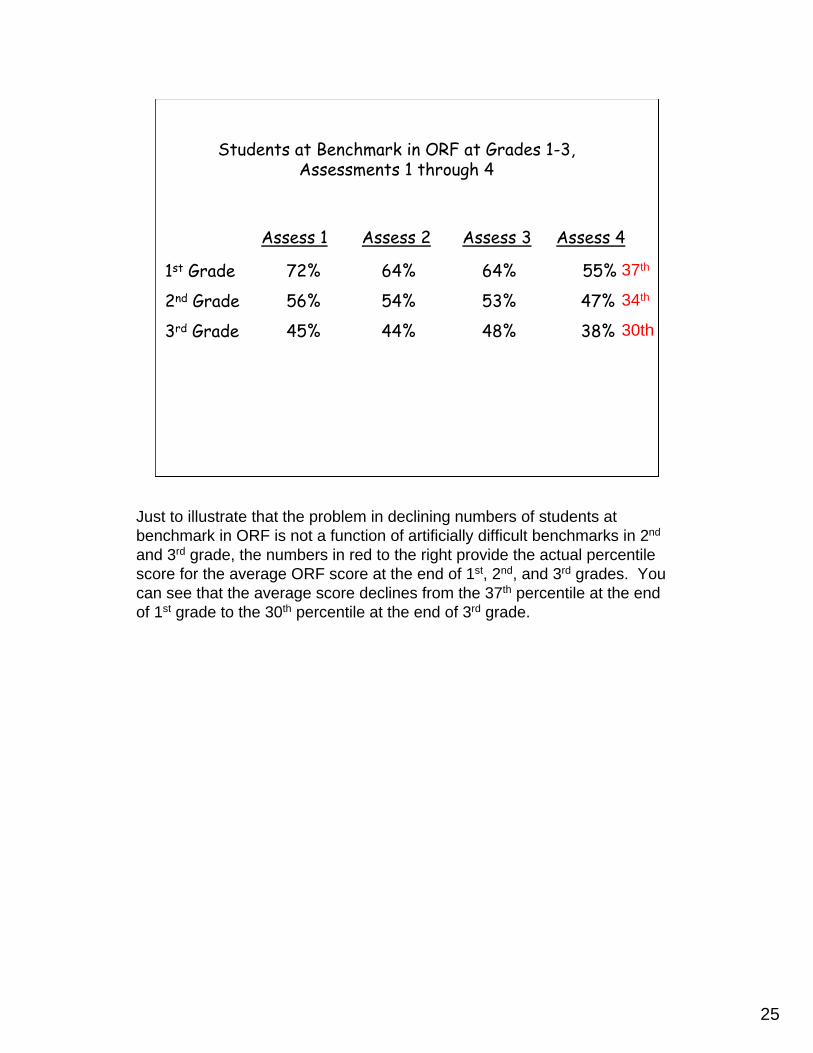
Students at Benchmark in ORF at Grades 1-3, Assessments 1 through 4
Assess 1 Assess 2 Assess 3 Assess 4
1st Grade
2nd Grade
3rd Grade
72% 64% 64% 55%
56% 54% 53% 47%
45% 44% 48% 38%
37th
34th
30th
Just to illustrate that the problem in declining numbers of students at benchmark in ORF is not a function of artificially difficult benchmarks in 2nd
and 3rd grade, the numbers in red to the right provide the actual percentile score for the average ORF score at the end of 1st, 2nd, and 3rd grades. You can see that the average score declines from the 37th percentile at the end of 1st grade to the 30th percentile at the end of 3rd grade.
26
:
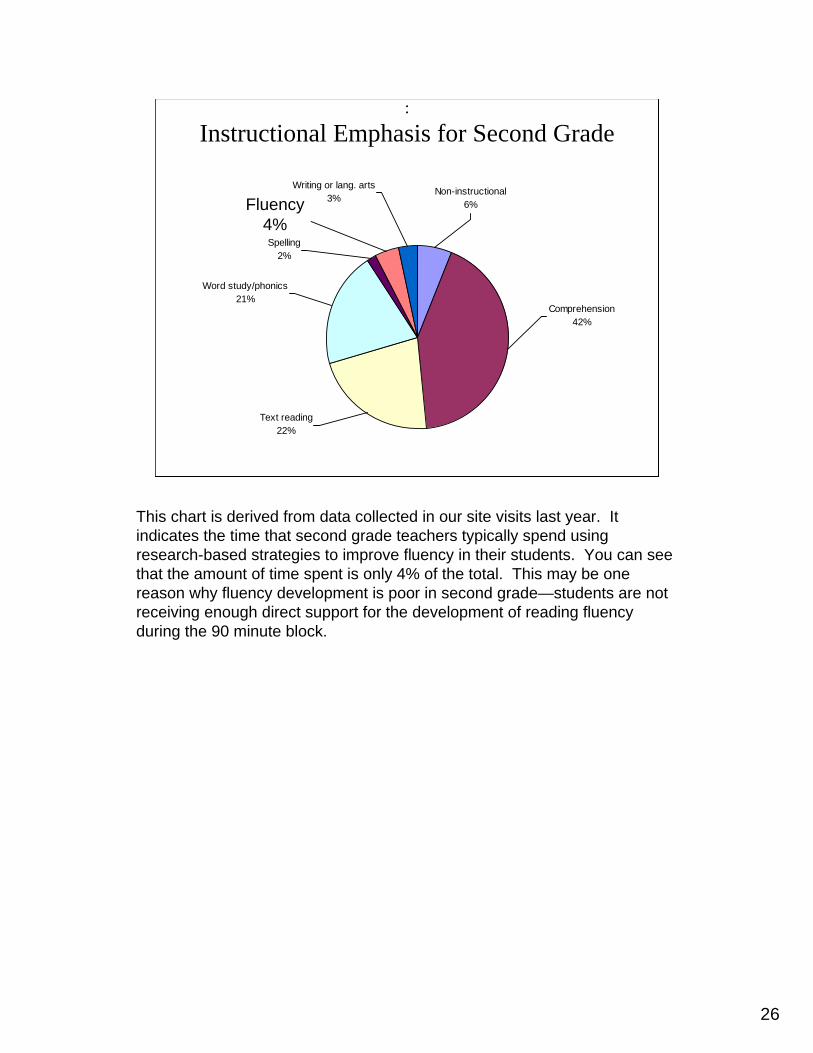
Instructional Emphasis for Second Grade
Comprehension42%
Non-instructional6%
Writing or lang. arts 3%
Fluency4%
Spelling2%
Word study/phonics21%
Text reading22%
Fluency4%
This chart is derived from data collected in our site visits last year. It indicates the time that second grade teachers typically spend using research-based strategies to improve fluency in their students. You can see that the amount of time spent is only 4% of the total. This may be one reason why fluency development is poor in second grade—students are not receiving enough direct support for the development of reading fluency during the 90 minute block.
27
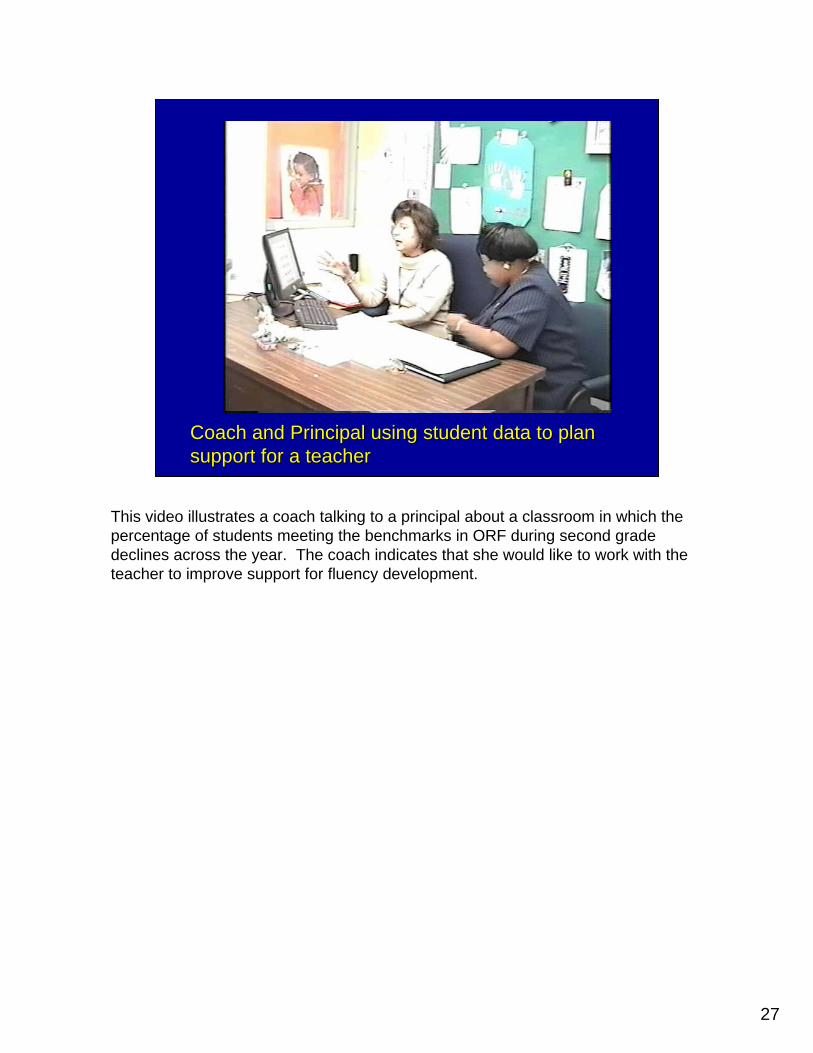
Coach and Principal using student data to plan Coach and Principal using student data to plan support for a teachersupport for a teacher
This video illustrates a coach talking to a principal about a classroom in which the percentage of students meeting the benchmarks in ORF during second grade declines across the year. The coach indicates that she would like to work with the teacher to improve support for fluency development.
28
What else might be going on to What else might be going on to contribute to fluency growth contribute to fluency growth problems in second grade?problems in second grade?
Too many students are coming Too many students are coming from first grade who have not from first grade who have not
mastered accurate word reading mastered accurate word reading strategiesstrategies--phonicsphonics
Another problem that very likely interferes with the development of fluency in second grade is the high percentage of students who enter second grade still not able to accurately identify unfamiliar words in text.
29
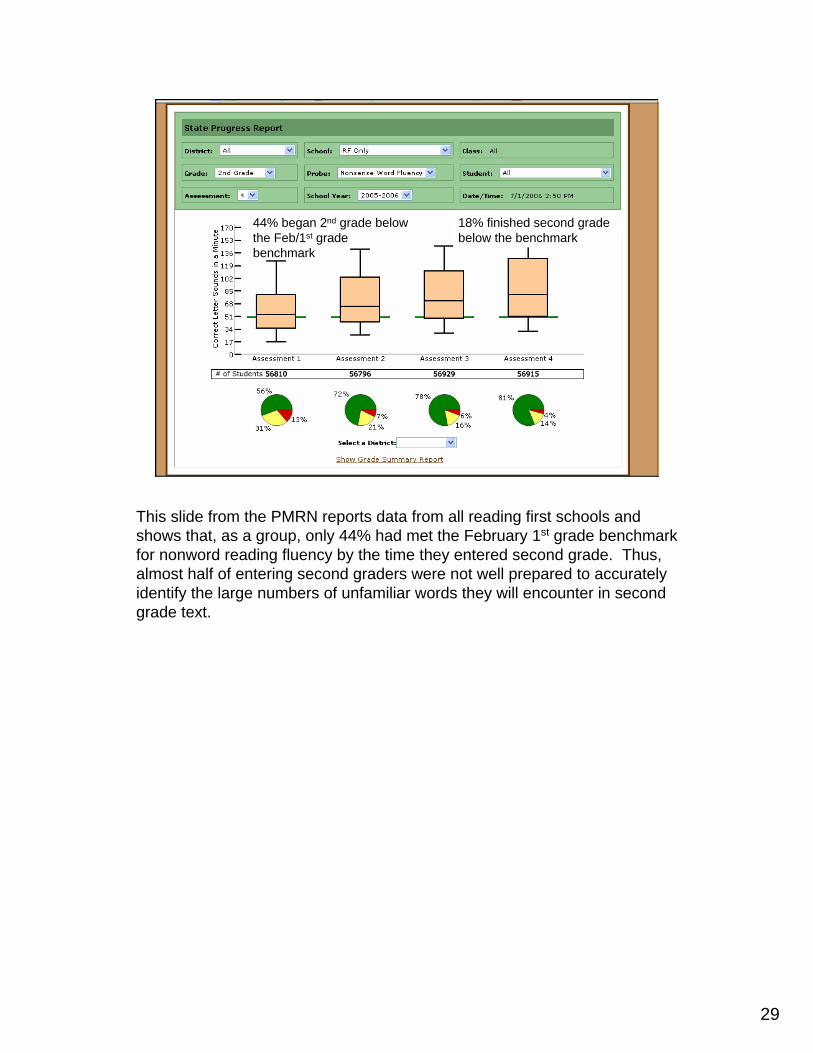
44% began 2nd grade below the Feb/1st grade benchmark
18% finished second grade below the benchmark
This slide from the PMRN reports data from all reading first schools and shows that, as a group, only 44% had met the February 1st grade benchmark for nonword reading fluency by the time they entered second grade. Thus, almost half of entering second graders were not well prepared to accurately identify the large numbers of unfamiliar words they will encounter in second grade text.

30
One problem that arises from so many students One problem that arises from so many students coming into 2coming into 2ndnd grade still weak in effective, accurate grade still weak in effective, accurate word reading strategiesword reading strategies
Growth in fluency requires Growth in fluency requires accurateaccurate practicepractice
A A majormajor factor underlying growth in fluency for factor underlying growth in fluency for struggling readers is how fast the number of words struggling readers is how fast the number of words they can recognize they can recognize ““by sightby sight”” increasesincreases
Children must read unfamiliar words with Children must read unfamiliar words with perfect perfect accuracy on multiple occasions before they can accuracy on multiple occasions before they can become sight wordsbecome sight words
Sight vocabulary must grow Sight vocabulary must grow very rapidlyvery rapidly in second in second grade to keep pace with normative developmentgrade to keep pace with normative development
We know from scientific analysis that one of the major factors that underlies the development of reading fluency is growth in the range and number of words that can be identified “at a single glance”
We typically refer to words that can be read easily and automatically as “sight words” For a word to become a sight word, the student must read it with perfect accuracy a number of different times.
If students do not have efficient strategies available for identifying unfamiliar words when they first encounter them, then they will miss many opportunities for the growth of their sight word vocabulary, and overall growth in reading fluency will be limited.
Phonemic decoding strategies are the single most important clue to the identity of unknown words in text. At this point, in our Reading First schools, we are sending too many students on to second grade who are still not proficient in the use of phonemic decoding strategies to identify unfamiliar words in text.
31
10
20
30
40
Hi riskModerate Risk
Per
cent
of s
tude
nts
who
mad
e be
nchm
ark
Per
cent
of s
tude
nts
who
mad
e be
nchm
ark
in O
RF
at e
nd o
f Sec
ond
Gra
dein
OR
F at
end
of S
econ
d G
rade
50
60
Low Risk
70
80
90
NWF at Assessment 1 in 2nd Grade
Approximately 37,000 RF students in the analysis
21
64
NW
F >
50
Below Benchmark
At Benchmark or above
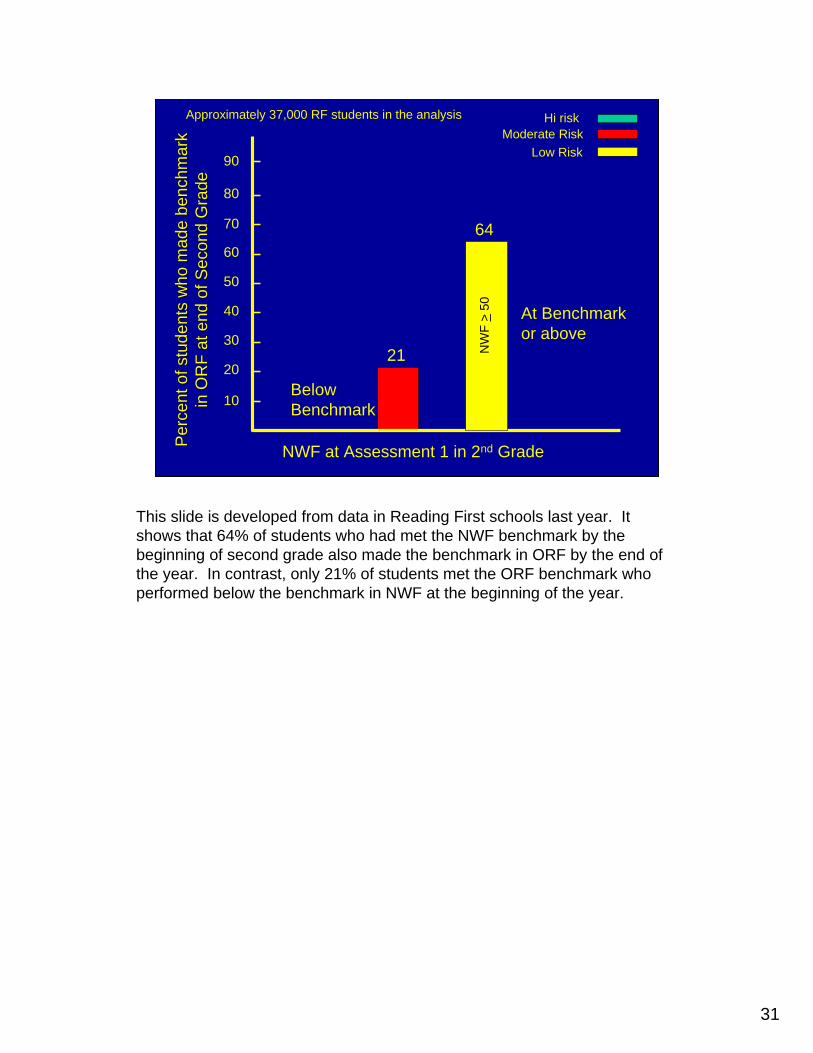
This slide is developed from data in Reading First schools last year. It shows that 64% of students who had met the NWF benchmark by the beginning of second grade also made the benchmark in ORF by the end of the year. In contrast, only 21% of students met the ORF benchmark who performed below the benchmark in NWF at the beginning of the year.
32
1st Grade
% at Benchmark Assessment 1 = 69%
% at Benchmark Assessment 2 = 64%
% at Benchmark Assessment 3 = 55%
% at Benchmark Assessment 4 = 67%
Is our instruction in use of phonemic decoding strategies strong enough in 1st
grade?
65
60
51
63
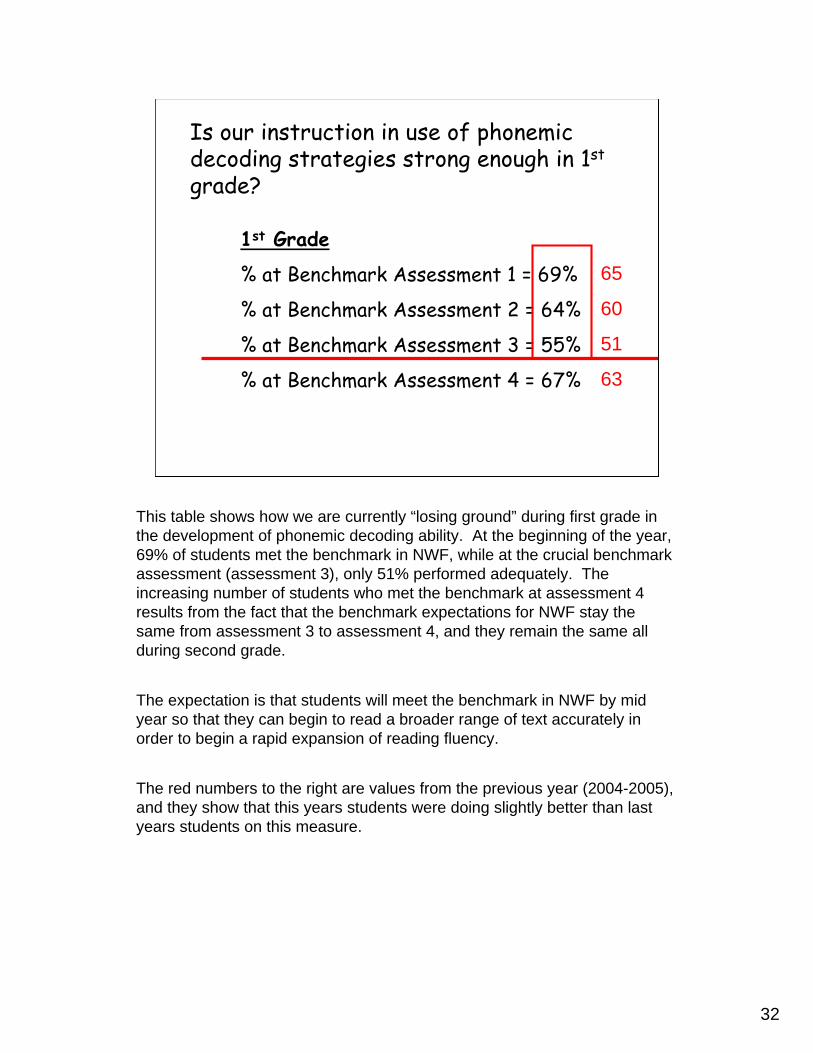
This table shows how we are currently “losing ground” during first grade in the development of phonemic decoding ability. At the beginning of the year, 69% of students met the benchmark in NWF, while at the crucial benchmark assessment (assessment 3), only 51% performed adequately. The increasing number of students who met the benchmark at assessment 4 results from the fact that the benchmark expectations for NWF stay the same from assessment 3 to assessment 4, and they remain the same all during second grade.
The expectation is that students will meet the benchmark in NWF by mid year so that they can begin to read a broader range of text accurately in order to begin a rapid expansion of reading fluency.
The red numbers to the right are values from the previous year (2004-2005), and they show that this years students were doing slightly better than last years students on this measure.
33
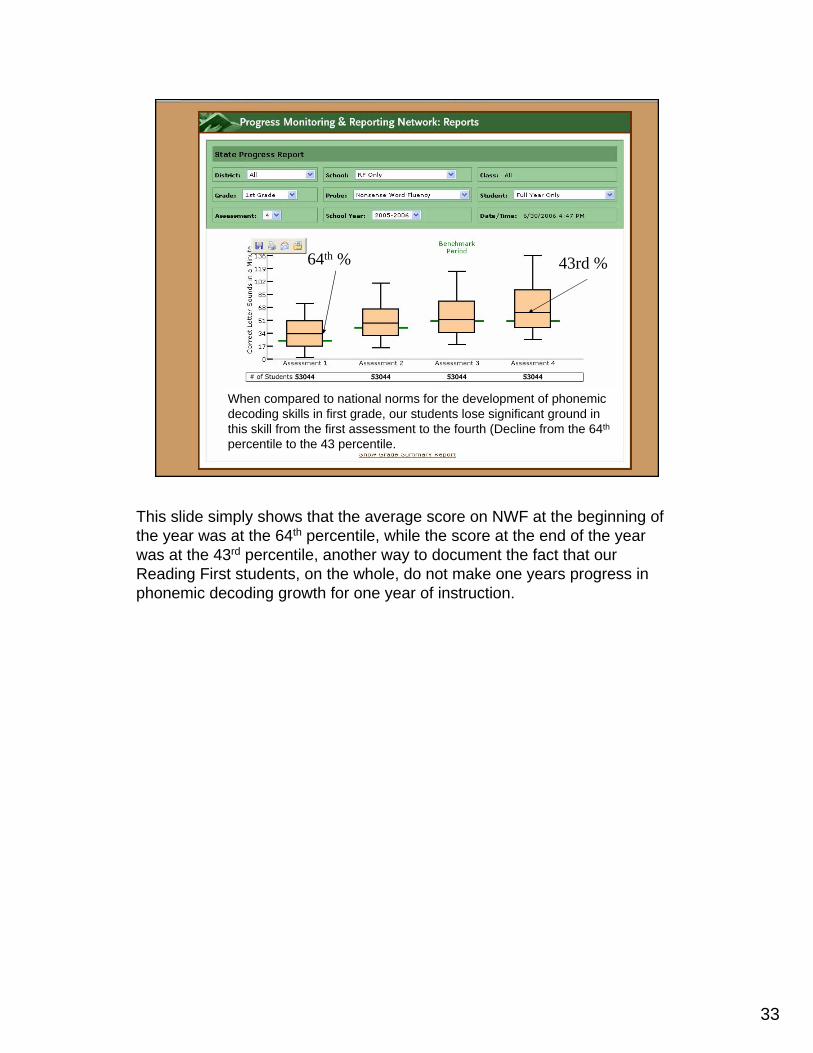
64th % 43rd %
When compared to national norms for the development of phonemic decoding skills in first grade, our students lose significant ground in this skill from the first assessment to the fourth (Decline from the 64th
percentile to the 43 percentile.
This slide simply shows that the average score on NWF at the beginning of the year was at the 64th percentile, while the score at the end of the year was at the 43rd percentile, another way to document the fact that our Reading First students, on the whole, do not make one years progress in phonemic decoding growth for one year of instruction.
34
““Good to GreatGood to Great”” Strategy:Strategy:
Look the problems in the faceLook the problems in the face
Ruthlessly confront weaknessesRuthlessly confront weaknesses
Carefully identify problem areasCarefully identify problem areas
This is simply a reminder that, if we are to improve, we must carefully face the weaknesses in our current instruction.
35
Schools were selected based on their Schools were selected based on their index of Effectiveness of Core index of Effectiveness of Core
Instruction (ECI) Instruction (ECI)
LetLet’’s look at growth in phonemic s look at growth in phonemic decoding in 20 RF schools that began decoding in 20 RF schools that began 11stst grade at approximately the same grade at approximately the same
level of proficiencylevel of proficiency
10 high performing schools10 high performing schools10 low performing schools10 low performing schools
We picked 10 reading first schools that had high ECI’s last year, and ten that had low ECI’s because we wanted to see if their were differences between these groups of schools in the power of their instruction in phonemic decoding.
Remember, the ECI indicates what proportion of students who began the year reading at grade level also finished the year reading at grade level. It is based primarily on growth of oral reading fluency.
36
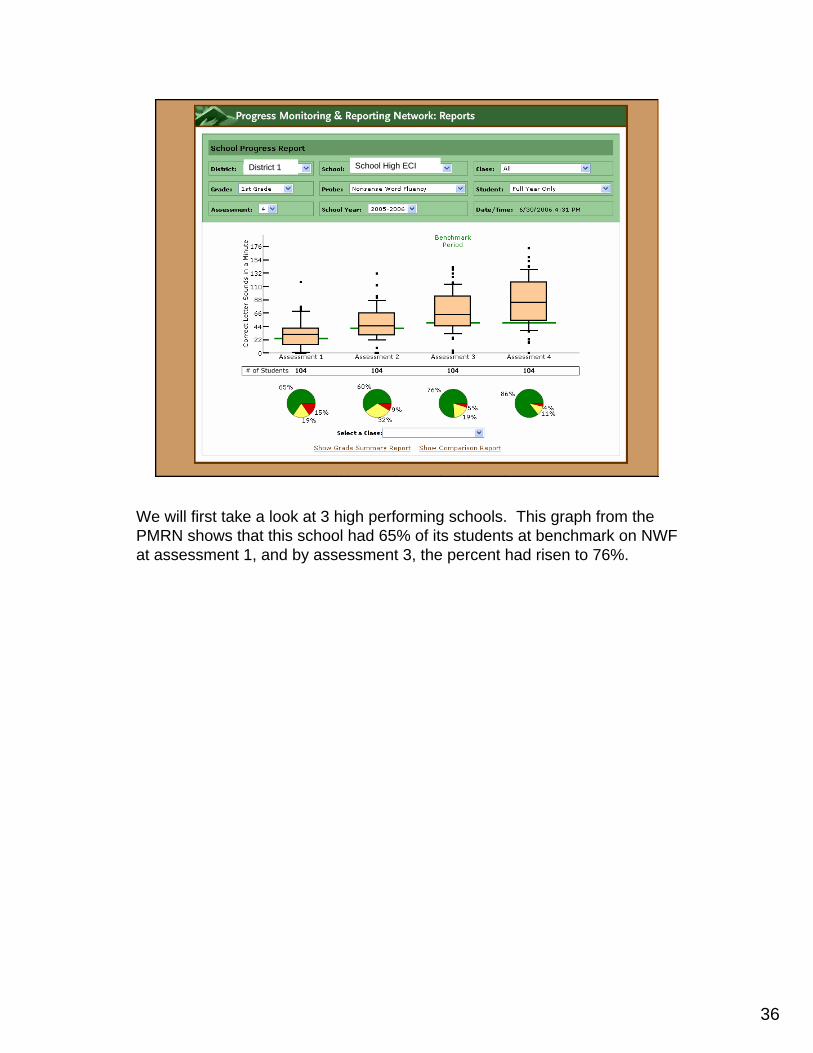
District 1 School High ECI
We will first take a look at 3 high performing schools. This graph from the PMRN shows that this school had 65% of its students at benchmark on NWF at assessment 1, and by assessment 3, the percent had risen to 76%.
37
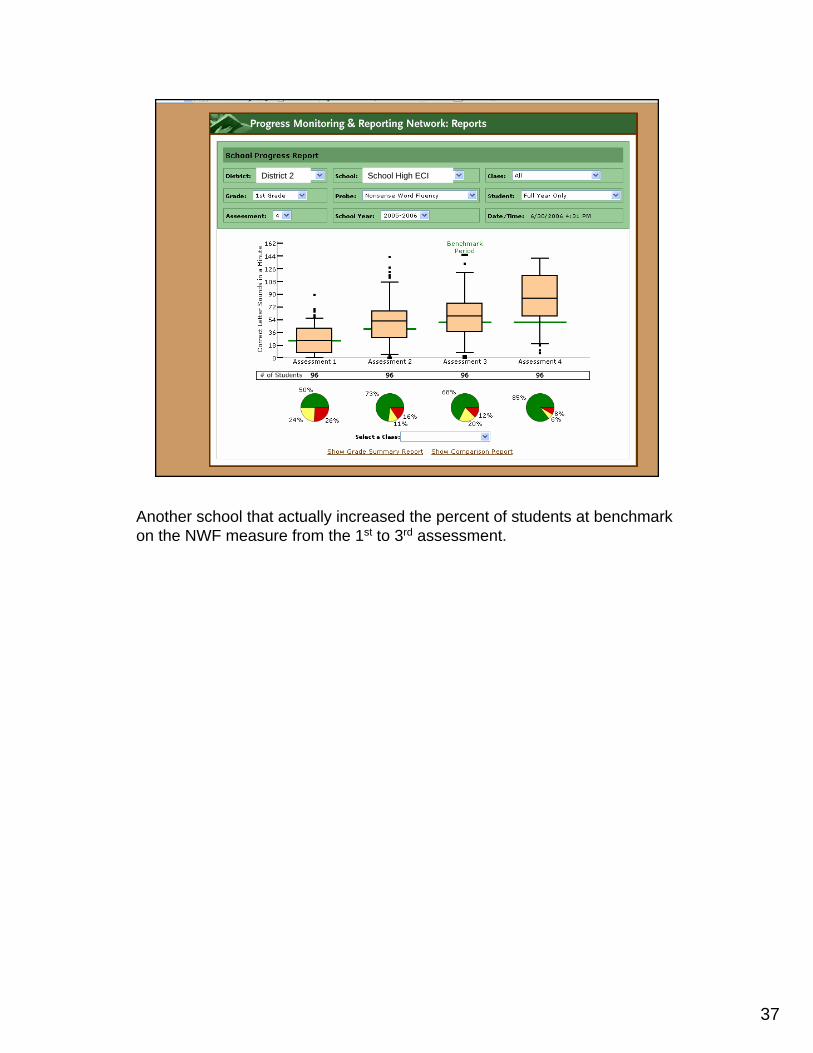
District 2 School High ECI
Another school that actually increased the percent of students at benchmark on the NWF measure from the 1st to 3rd assessment.
38
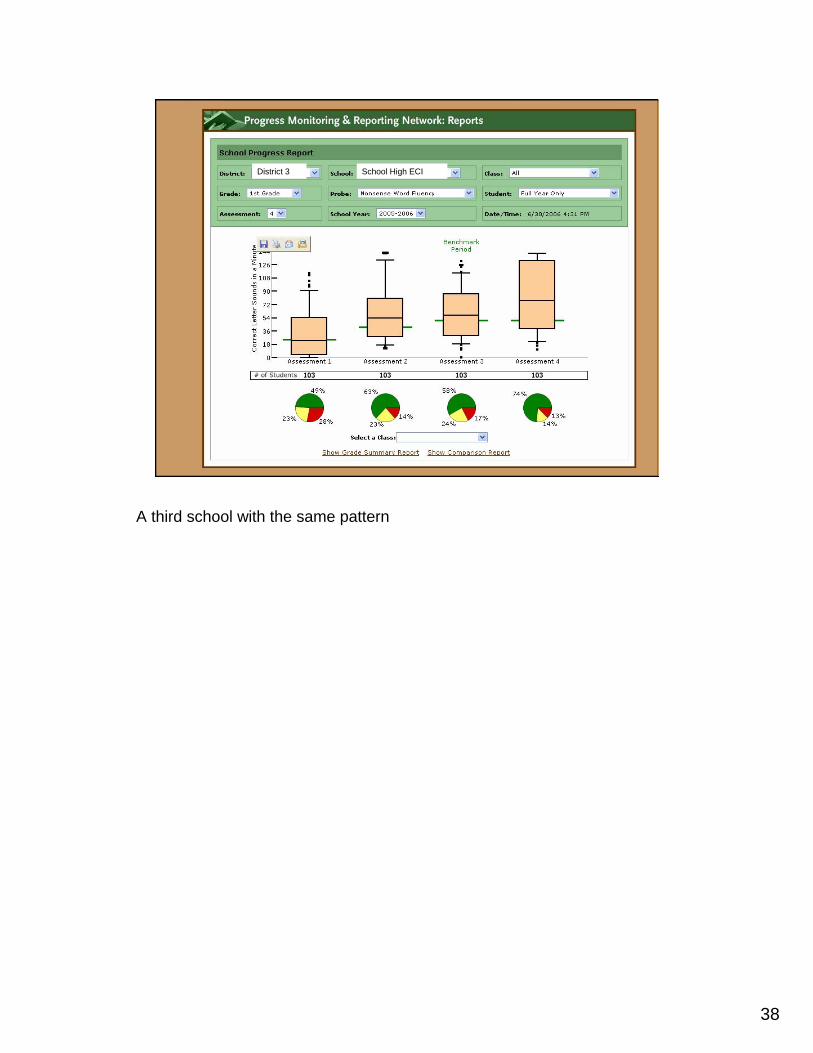
District 3 School High ECI
A third school with the same pattern

39
District 1 School Low ECI
This is one of the schools with a relatively low ECI last year. They started with 82% of their students meeting grade level expectations on the NWF measure, but by assessment 3, that percent was down to 42. Many, many of their students made poor progress in the growth of NWF during the first 4 months of first grade.

40
District 2 School Low ECI
Another school with a serious decline in percent of students performing at grade level on the NWF measure
41
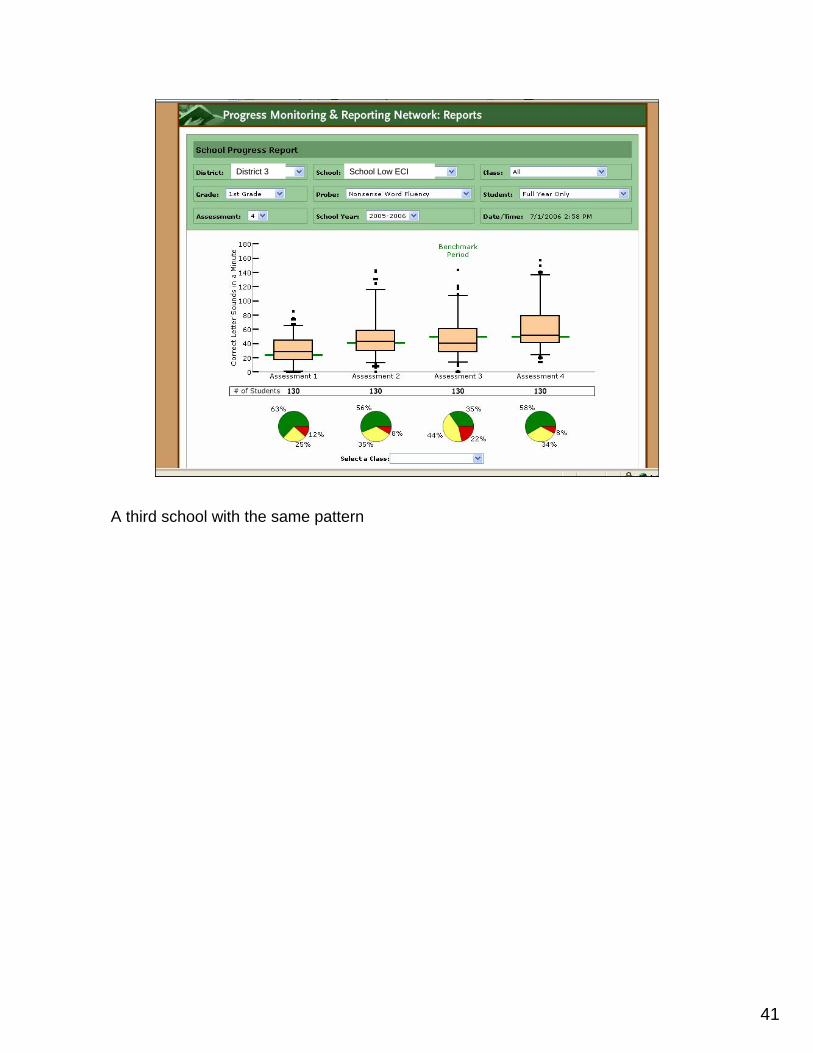
District 3 School Low ECI
A third school with the same pattern
42
65 65 68
56
67
40
79
52
0
10
20
30
40
50
60
70
80
1 2 3 4
High ECILow ECI
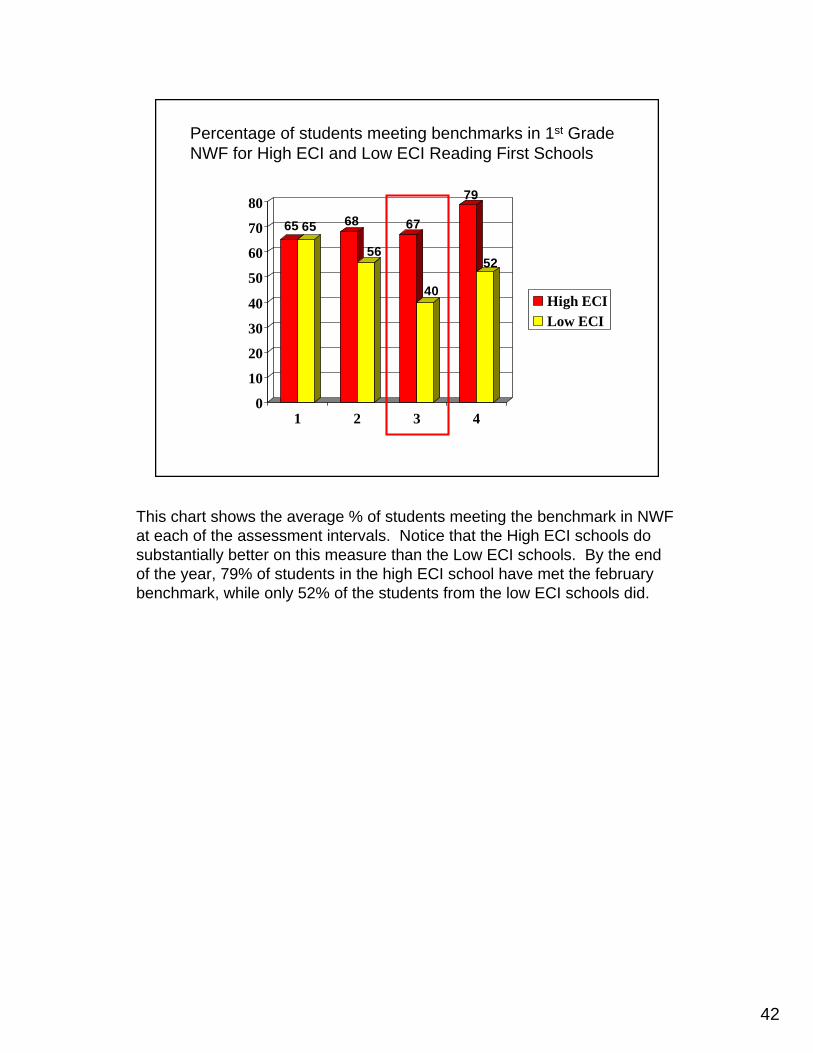
Percentage of students meeting benchmarks in 1st Grade NWF for High ECI and Low ECI Reading First Schools
This chart shows the average % of students meeting the benchmark in NWF at each of the assessment intervals. Notice that the High ECI schools do substantially better on this measure than the Low ECI schools. By the end of the year, 79% of students in the high ECI school have met the februarybenchmark, while only 52% of the students from the low ECI schools did.
43
10
20
30
40
Hi riskModerate Risk
Per
cent
of w
ho m
ade
benc
hmar
k in
P
erce
nt o
f who
mad
e be
nchm
ark
in
OR
F at
end
of F
irst G
rade
OR
F at
end
of F
irst G
rade
50
60
Low Risk
70
80
90
NWF at Assessment 3 in 1st Grade
Approximately 37,000 RF students in the analysis
9
30
78
NW
F >
50
30 to
50
<29
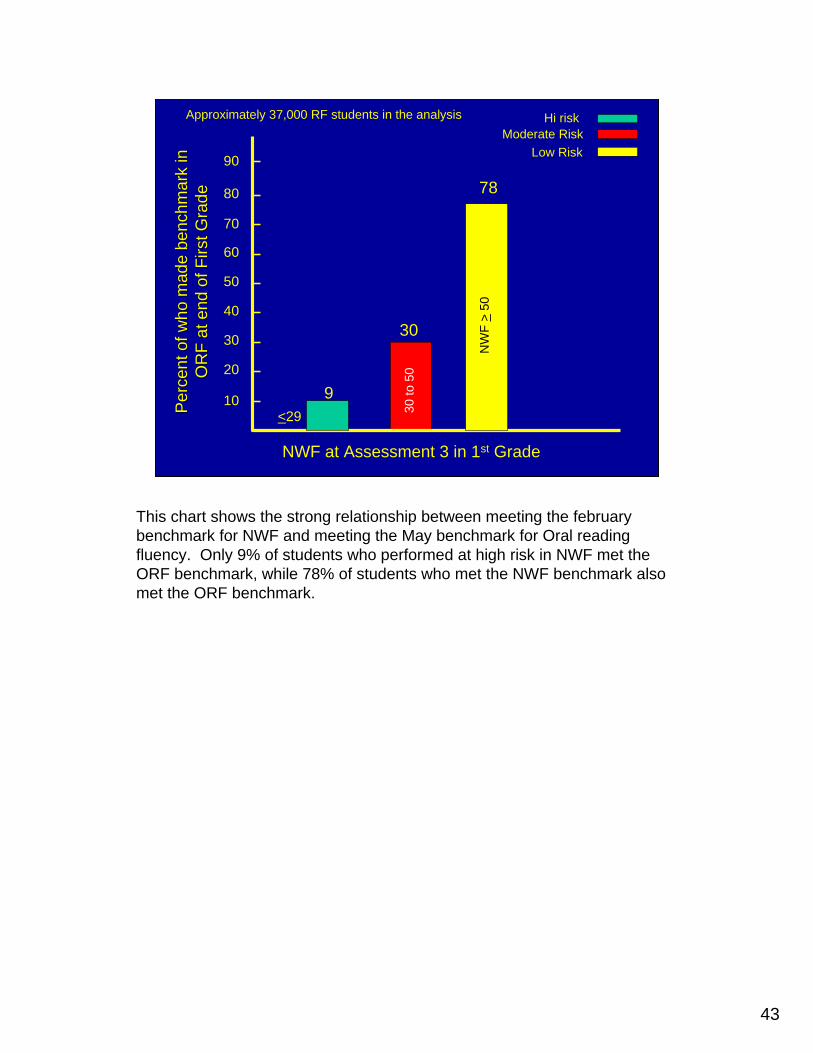
This chart shows the strong relationship between meeting the februarybenchmark for NWF and meeting the May benchmark for Oral readingfluency. Only 9% of students who performed at high risk in NWF met the ORF benchmark, while 78% of students who met the NWF benchmark also met the ORF benchmark.
44
Questions that Principals and Coaches should be Questions that Principals and Coaches should be asking from Classroom and School level dataasking from Classroom and School level data
In our school,In our school, is growth of phonemic decoding strategies is growth of phonemic decoding strategies keeping pace with benchmark expectations?keeping pace with benchmark expectations?In our schoolIn our school, is growth of reading fluency from first to , is growth of reading fluency from first to third grade, and within each grade, keeping pace with third grade, and within each grade, keeping pace with benchmark expectations?benchmark expectations?
Do we have any classes that seem to be doing Do we have any classes that seem to be doing particularly well in these areas?particularly well in these areas?Do we have any classes/teachers that seem to be Do we have any classes/teachers that seem to be having particular difficulties in these areas?having particular difficulties in these areas?
In our schoolIn our school, is growth of vocabulary keeping pace with , is growth of vocabulary keeping pace with developmental expectations?developmental expectations?
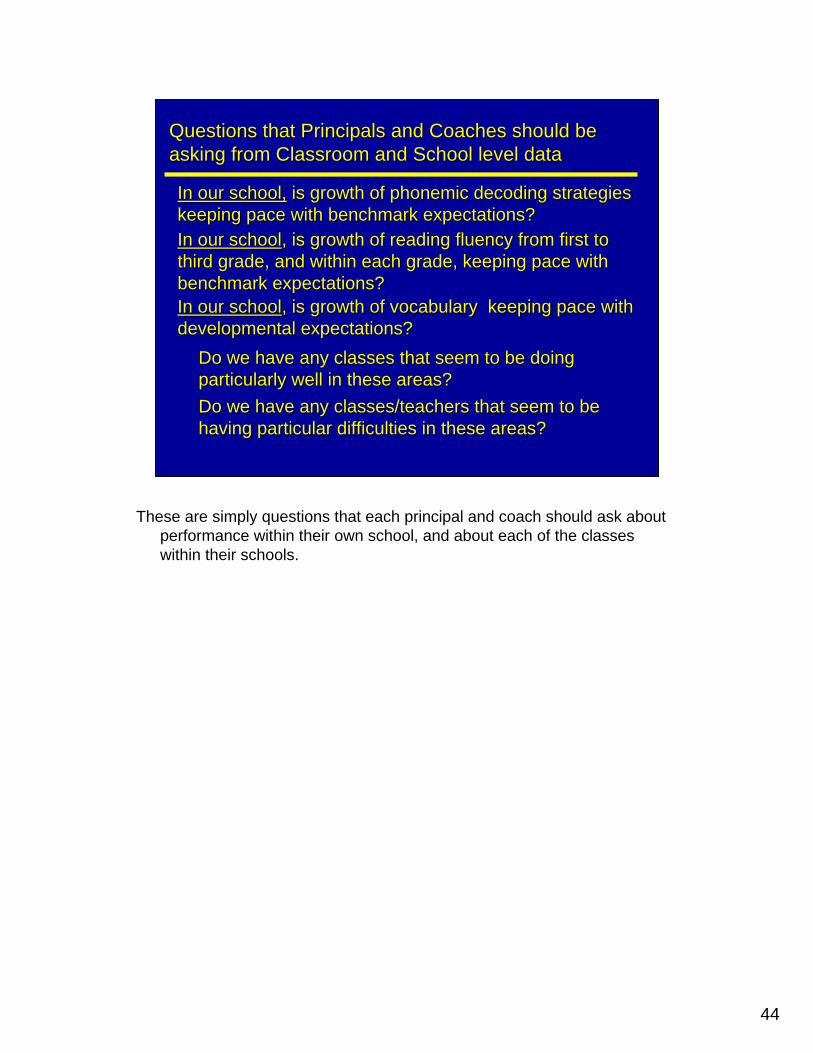
These are simply questions that each principal and coach should ask about performance within their own school, and about each of the classes within their schools.
45
Instructional recommendations at the State LevelInstructional recommendations at the State Level
We must strengthen instruction and support for growth of We must strengthen instruction and support for growth of phonemic decoding ability in first gradephonemic decoding ability in first grade
We must strengthen productive practice to build reading We must strengthen productive practice to build reading fluency in 1fluency in 1stst, 2, 2ndnd, and 3, and 3rdrd gradegrade
We must continue to increase the strength of our support We must continue to increase the strength of our support for vocabulary growth from Kfor vocabulary growth from K--33
We probably need to do a better job teaching advanced We probably need to do a better job teaching advanced word analysis skills in 2word analysis skills in 2ndnd grade, but cangrade, but can’’t tell directly t tell directly from the datafrom the data
We must continue to improve in our support and We must continue to improve in our support and instruction to help students think more effectively about instruction to help students think more effectively about their reading their reading –– readingreading comprehension strategiescomprehension strategies
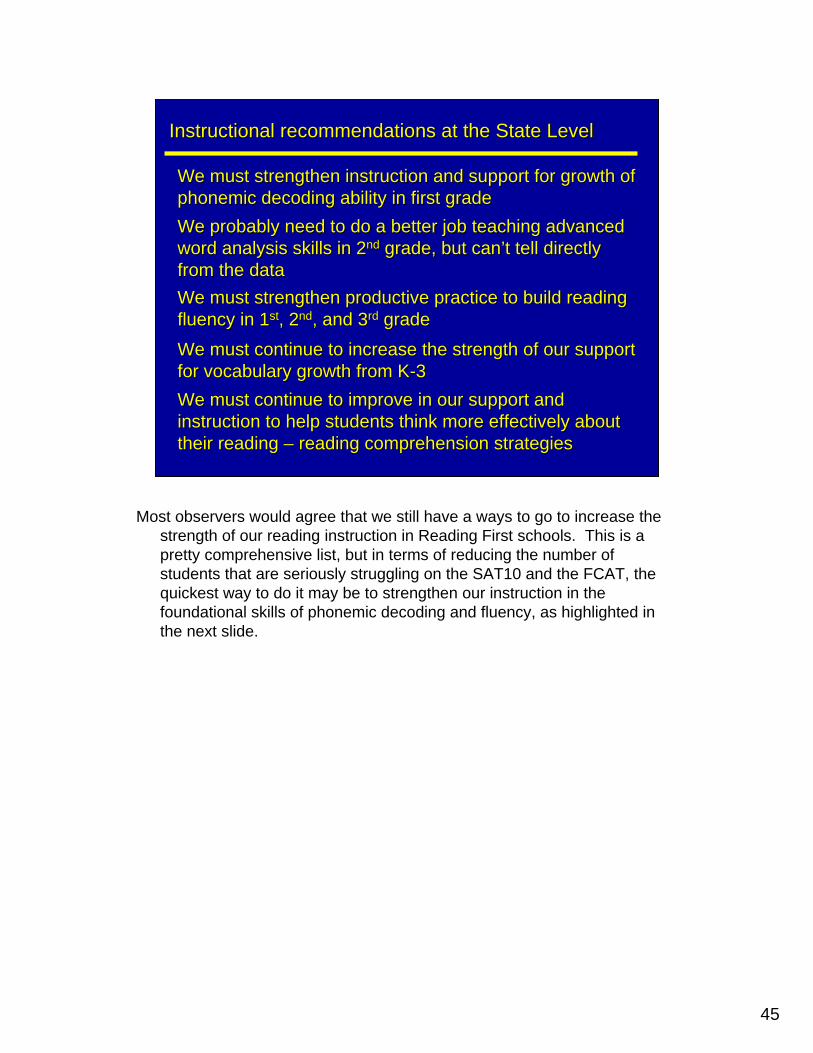
Most observers would agree that we still have a ways to go to increase the strength of our reading instruction in Reading First schools. This is a pretty comprehensive list, but in terms of reducing the number of students that are seriously struggling on the SAT10 and the FCAT, the quickest way to do it may be to strengthen our instruction in the foundational skills of phonemic decoding and fluency, as highlighted in the next slide.
46
Instructional recommendations at the State LevelInstructional recommendations at the State Level
We must strengthen instruction and support for growth of We must strengthen instruction and support for growth of phonemic decoding ability in first gradephonemic decoding ability in first grade
We must strengthen productive practice to build reading We must strengthen productive practice to build reading fluency in 1fluency in 1stst, 2, 2ndnd, and 3, and 3rdrd gradegrade
We must continue to increase the strength of our support We must continue to increase the strength of our support for vocabulary growth from Kfor vocabulary growth from K--33
We probably need to do a better job teaching advanced We probably need to do a better job teaching advanced word analysis skills in 2word analysis skills in 2ndnd grade, but cangrade, but can’’t tell directly t tell directly from the datafrom the data
We must continue to improve in our support and We must continue to improve in our support and instruction to help students think more effectively about instruction to help students think more effectively about their reading their reading –– readingreading comprehension strategiescomprehension strategies
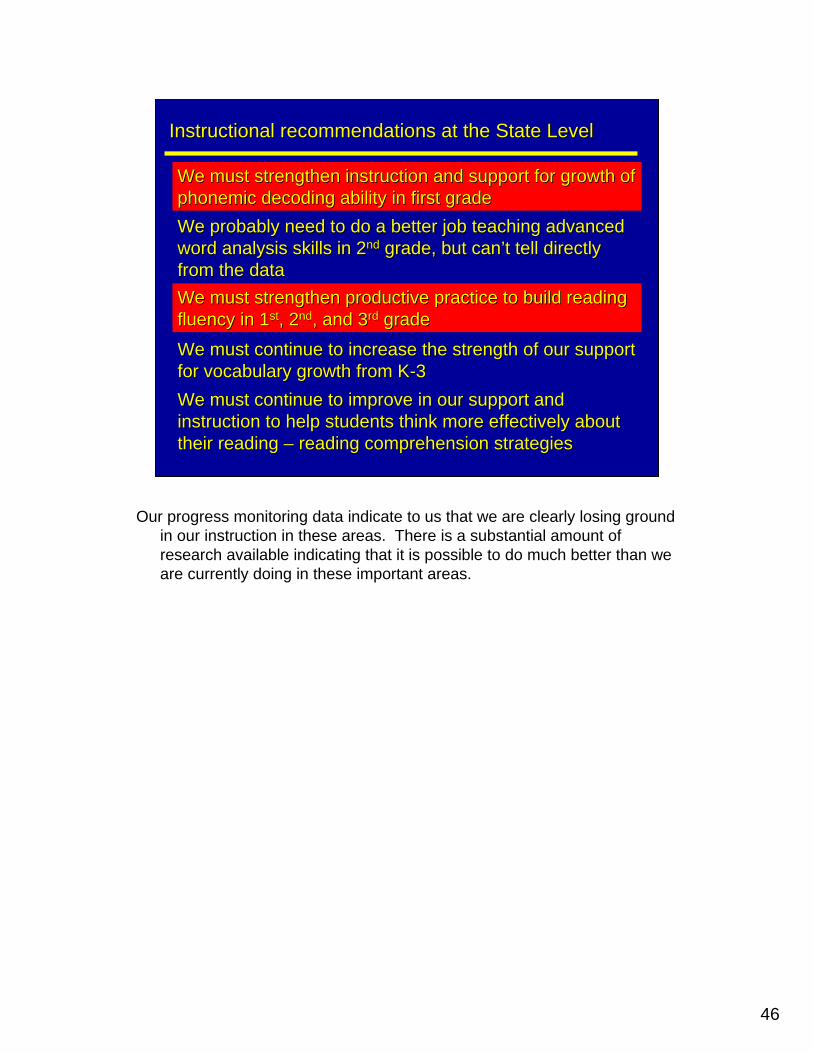
Our progress monitoring data indicate to us that we are clearly losing ground in our instruction in these areas. There is a substantial amount of research available indicating that it is possible to do much better than we are currently doing in these important areas.
47
The most important Reading First goals:The most important Reading First goals:
1. I1. Increasencrease the percentage of students reading the percentage of students reading ““at at grade levelgrade level”” each year at each grade level from each year at each grade level from kindergarten through third gradekindergarten through third grade
2. 2. DecreaseDecrease the percentage of students with serious the percentage of students with serious reading difficulties each year at each grade levelreading difficulties each year at each grade level
These goals are to be met while considering all These goals are to be met while considering all children taking the year end test, not just those children taking the year end test, not just those who have received the full treatmentwho have received the full treatment
This is a reminder that all of our instruction should be pointed toward increasing students reading comprehension ability – these are the two most important goals of Reading First.
48
The most important Reading First goals:The most important Reading First goals:
Overall student performance should increase each Overall student performance should increase each year do to two factors:year do to two factors:
In each successive year, many of the students In each successive year, many of the students will have had the advantage of previous RF will have had the advantage of previous RF instructioninstructionBy year 3, many 3By year 3, many 3rdrd grade students grade students –– 3 years 3 years By year 3, many 2By year 3, many 2ndnd grade students grade students –– 3 years 3 years By year 3, many 1By year 3, many 1stst grade students grade students –– 2 years 2 years
Each year, instruction at each grade level, and Each year, instruction at each grade level, and schoolschool--level systems as a whole, should be level systems as a whole, should be strongerstronger
This slide simply outlines what we must do to achieve success in meeting these goals, even though we have a high degree of studeent mobility in Reading First schools.
49
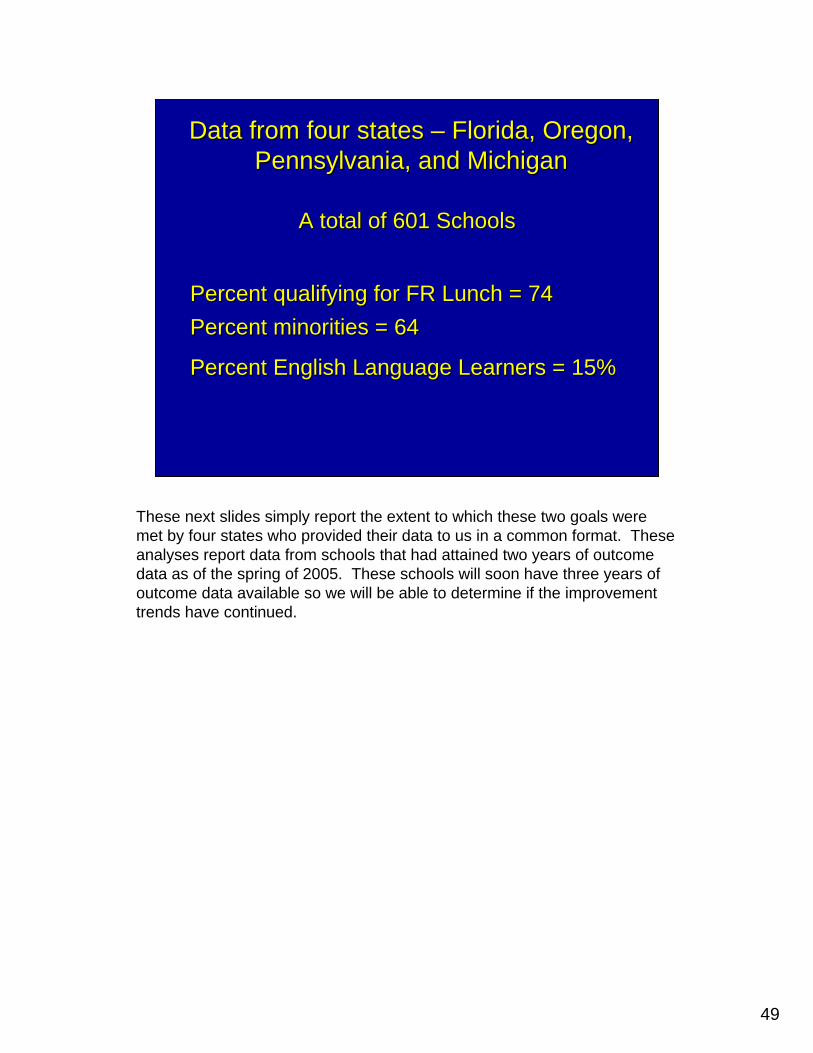
Data from four states Data from four states –– Florida, Oregon, Florida, Oregon, Pennsylvania, and MichiganPennsylvania, and Michigan
A total of 601 SchoolsA total of 601 Schools
Percent qualifying for FR Lunch = 74Percent qualifying for FR Lunch = 74Percent minorities = 64Percent minorities = 64
Percent English Language Learners = 15%Percent English Language Learners = 15%
These next slides simply report the extent to which these two goals were met by four states who provided their data to us in a common format. These analyses report data from schools that had attained two years of outcome data as of the spring of 2005. These schools will soon have three years of outcome data available so we will be able to determine if the improvement trends have continued.
50
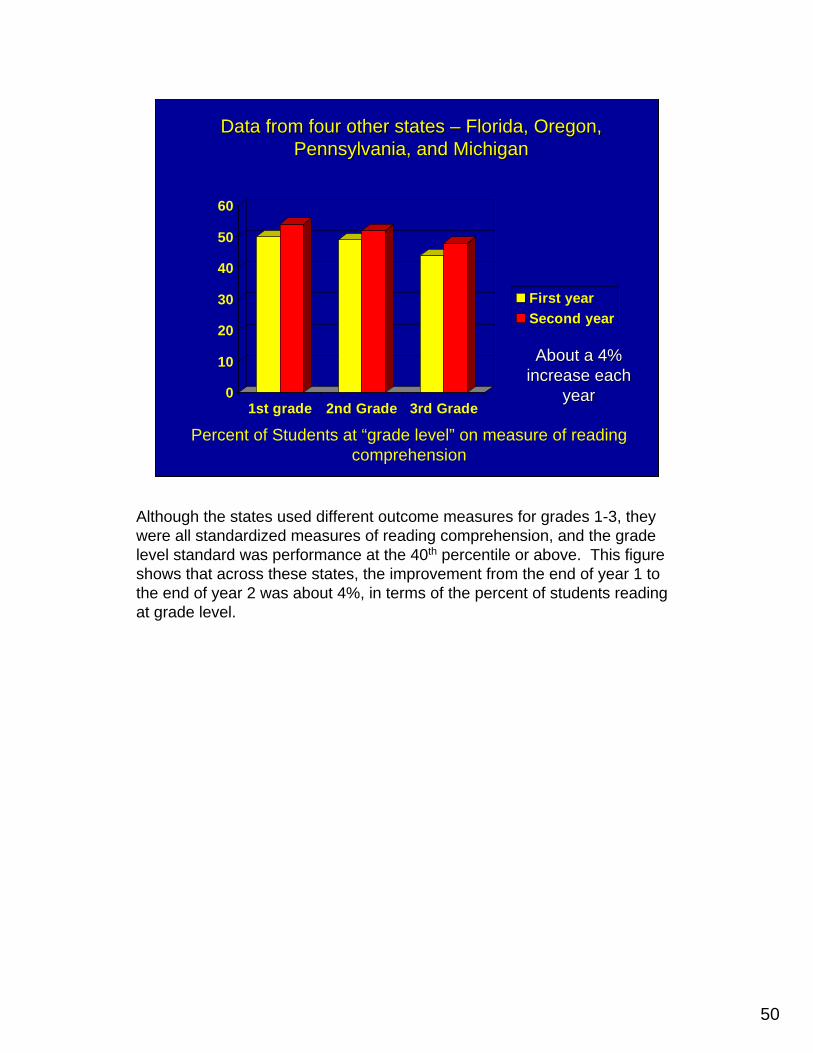
Data from four other states Data from four other states –– Florida, Oregon, Florida, Oregon, Pennsylvania, and MichiganPennsylvania, and Michigan
0
10
20
30
40
50
60
1st grade 2nd Grade 3rd Grade
First yearSecond year
Percent of Students at “grade level” on measure of reading comprehension
About a 4% About a 4% increase each increase each
yearyear
Although the states used different outcome measures for grades 1-3, they were all standardized measures of reading comprehension, and the grade level standard was performance at the 40th percentile or above. This figure shows that across these states, the improvement from the end of year 1 to the end of year 2 was about 4%, in terms of the percent of students reading at grade level.
51
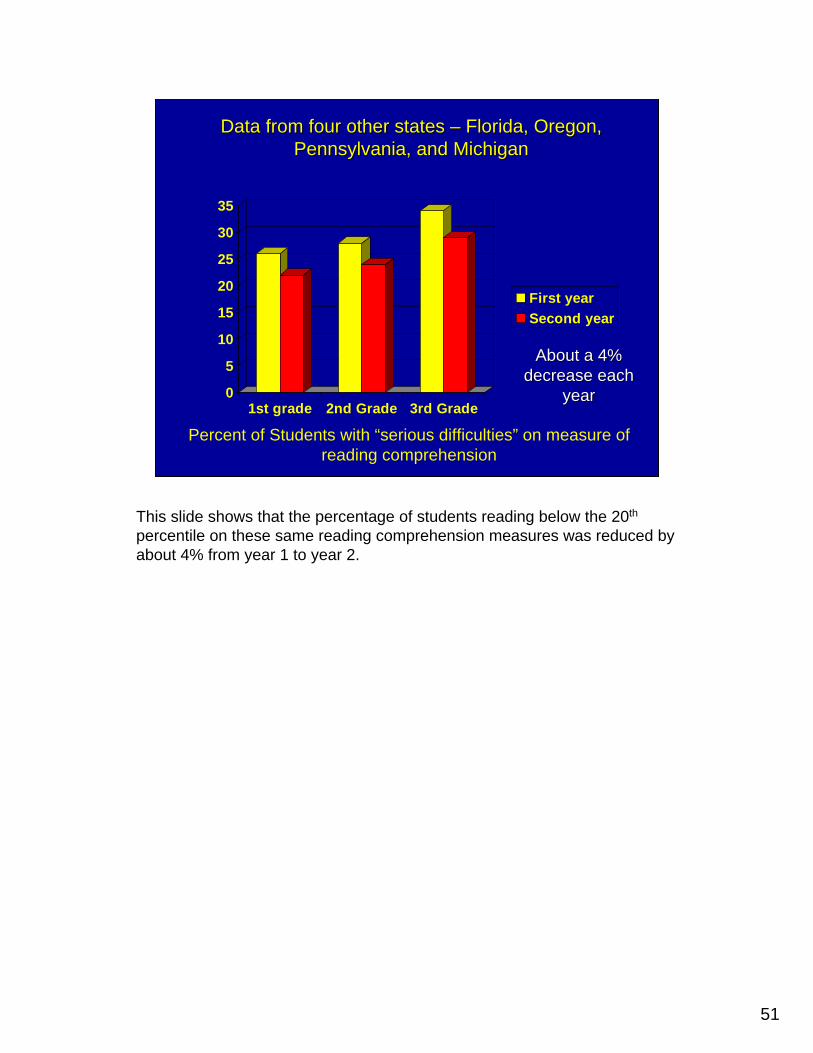
Data from four other states Data from four other states –– Florida, Oregon, Florida, Oregon, Pennsylvania, and MichiganPennsylvania, and Michigan
0
5
10
15
20
25
30
35
1st grade 2nd Grade 3rd Grade
First yearSecond year
Percent of Students with “serious difficulties” on measure of reading comprehension
About a 4% About a 4% decrease each decrease each
yearyear
This slide shows that the percentage of students reading below the 20th
percentile on these same reading comprehension measures was reduced by about 4% from year 1 to year 2.
52
The most important question:The most important question:
Are we improving from year to year in the power of our Are we improving from year to year in the power of our instruction to accomplish two important aims:instruction to accomplish two important aims:
Increase the percentage of students who can meet Increase the percentage of students who can meet grade level standards or higher in reading grade level standards or higher in reading comprehension at the end of 1comprehension at the end of 1stst, 2, 2ndnd, and 3, and 3rdrd gradesgrades
Reduce the percentage of students who have serious Reduce the percentage of students who have serious difficulties in reading comprehension at the end of 1difficulties in reading comprehension at the end of 1stst, , 22ndnd, and 3, and 3rdrd grade.grade.
Ultimately, these are the most important two questions that Reading First schools should be asking of themselves. If improvement is not as strong as you would like, then we need to consider the strength of our classroom instructions, and our interventions in the fundamental areas of reading growth discussed in this presentation.
53
A concluding thoughtA concluding thought……..
There is no question but that when we are asked There is no question but that when we are asked to to ““leave no child behindleave no child behind””, we are being asked to , we are being asked to do something that is very, very difficultdo something that is very, very difficult……It will require finding necessary resources at the It will require finding necessary resources at the state and local level, strong school leadership, state and local level, strong school leadership, supporting teachers with focused professional supporting teachers with focused professional development, providing good instructional development, providing good instructional materials and lots of books, and keeping our eyes materials and lots of books, and keeping our eyes on the goalon the goal……
We are working toward a very difficult goal, and it will only be achieved as we continue to stay focused on doing the things we know will produce higher levels of student achievement. We must get better at these things each year that we work in the Reading First program.
If you are concerned about any aspect of your schools instructional program, please contact your Reading First Professional Development Coordinator, or your district Reading First coordinator for additional guidance and support.
54
Thank Thank YouYou