Embed Size (px)
Citation preview

Available online at www.ijo.ir
Iranian Journal of Optimization 1(2009) 243-265
Iranian Journal of
Optimization
The Application of Data Envelopment Analysis
Methodology to Improve the Benchmarking
Process in the EFQM Business Model
(Case Study: Automotive Industry of Iran)
K. Shahroudi*1
Department of Industrial management, Islamic Azad University, Rasht branch
Abstract
This paper reports a survey and case study research outcomes on the application of Data Envelopment Analysis (DEA) to the ranking method of European Foundation for Quality Management (EFQM) Business Excellence Model in Iran’s Automotive Industry and improving benchmarking process after assessment. Following the global trend, the Iranian industry leaders have introduced the EFQM practice to their supply chain in order to improve the supply base competitiveness during the last four years. A question which is raises is whether the EFQM model can be combined with a mathematical model such as DEA in order to generate a new ranking method and develop or facilitate the benchmarking process. The developed model of this paper is simple. However, it provides some new and interesting insights. The paper assesses the usefulness and capability of the DEA technique to recognize a new scoring system in order to compare the classical ranking method and the EFQM business model. We used this method to identify meaningful exemplar companies for each criterion of the EFQM model then we designed a road map based on realistic targets in the criterion which have currently been
* E-mail: [email protected]
Archive of SID
www.SID.ir

K.Shahroudi / Iranian Journal of optimization 1(2009) 243-265 244
achieved by exemplar companies. The research indicates that the DEA approach is a reliable tool to analyze the latent knowledge of scores generated by conducting self- assessments. The Wilcoxon Rank Sum Test is used to compare two scores and the Test of Hypothesis reveals the meaningful relation between the EFQM and DEA new ranking methods. Finally, we drew a road map based on the benchmarking concept using the research results.
Keywords: Data Envelopment Analysis; EFQM Excellence Model; Wilcoxon Rank Sum
Test; Benchmarking; Road Map.
Archive of SID
www.SID.ir
K.Shahroudi / Iranian Journal of optimization 1(2009) 243-265 245
1. Introduction
Regarding the recent dispute, the current enablers and results criteria of the European
Foundation for Quality Management (EFQM) Business Excellence Model assess
organizational quality performance effectively. However, there are different opinions
about the actual values related to individual element weightings. It is more significant
when companies from different economic sectors are examining and comparing. Earlier,
Donnelly [1] indicated the application of Data Envelopment Analysis (DEA) to re-rank
the organizations based on the EFQM approach. However, the latent knowledge behind
the scores was not analyzed to draw a road map showing the companies how to plan the
improvement activities and set actual targets for each enabler. By using DEA application
validity as a new method of ranking, usage of the method in other sectors and different
organizations is an interesting issue. Increasing of competitions intensity has motivated
many top managers in manufacturing organizations evaluate their competitive strategies
and management practices to improve the organizational performance. With a diminish
workforce and needing to sustain performance, organizations are striving to define,
implement and sustain Excellence Roadmap Practice.
It is argued that new management assessment tools, integrate strategy, and
management practice; In addition, organizations yield a quality organization which
improves and sustains better performance, continuously. Quality Management Award
(QMA) has been used as a nationwide and global criterion during the last decade to
compare improvement. QMA is one of three major Awards in Europe in the form of the
EFQM Business Excellence Model originated from the Total Quality Management
(TQM).
Following this global trend, Iranian industry leaders have introduced the EFQM
practice to their supply chain in order to improve its supply base competitiveness during
the last four years. The raised question is whether the EFQM model can be combined
with mathematical model such as DEA in order to generate a new ranking method and
develop or facilitate the benchmarking process. To answer this question, we, firstly refer
to the EFQM basic model and DEA method and then make a mathematical model based
on the combination of the EFQM conceptual model and DEA mathematical model.
Finally, by using the collected data from EFQM assessment in Iranian automotive
Archive of SID
www.SID.ir

K.Shahroudi / Iranian Journal of optimization 1(2009) 243-265 246
industry, we run the model and draw a Road Map to help executive managers identify
benchmark companies.
2. Literature Review
The literature review is divided into two sections. We explain a summary of the EFQM
Excellence Model in the first section and then concentrate on DEA method and its
application in formulation and modeling problems.
2.1. The EFQM Excellence Model
The main purpose of the EQA was recognizing the organizational excellence in European
companies since 1991. Westlund [2] argued that the EFQM Excellence Model is a
framework behind this award and it has clearly become the most commonly applied
model in Europe for TQM. The EFQM Excellence Model comprises nine criterions
grouped under five “enablers” criteria that include: leadership, policy and strategy,
people, partnerships, and resources and process and also, four “results” criteria that
includes: customer results, people results, society results, and key performance results.
The enablers stand for how the organization operates, and the results focus on the
achievements towards organizational stakeholders, those who have an interest in the
organization, and how they can be measured and targeted (Fig. 1). Each criterion is
divided into several sub-criteria and each sub-criteria is exemplified with various
“guidance points” that explain what the organization must do to develop the criteria.
Figure 1. The EFQM Excellence Model, Source: EFQM (1999).
PEOPLE
MANAGEMEN
POLICY AND
STRATEGY
PARTNERSHIP
AND
PEOPLE
RESULTS (9%)
CUSTOMER
RESULTS
SOCIETY
RESULTS (6%)
ENABLERS RESULTS
LEARNING AND
Archive of SID
www.SID.ir

K.Shahroudi / Iranian Journal of optimization 1(2009) 243-265 247
The EFQM Excellence Model, like other quality award models such as the Malcolm
Baldrige National Quality Award in USA or Deming Prize in Japan, is based on self-
assessment. Hillman et al., [3] mention that self-assessment means a comprehensive and
regular review of an organization’s activities and results alongside the criteria of the
model. Porter and Tanner [4] argued that undertaking a self-assessment process against
the EFQM Excellence Model provides an objective, complete measure of strengths of an
organization and improvement areas, and gives rise to the establishment and
implementation of action plans, integrated in business planning. Van der Wiele et al., [5]
mention that the self-assessment process also allows a methodology to be adopted that
will assess progress towards excellence on a regular basis by providing a comparison of
scores from assessment to path the real achieved improvement.
Since the EFQM Excellence Model is a non-prescriptive framework, self assessment
can be conducted by using a variety of tools such as: questionnaires, workshops, award
simulation and achievement matrix. But the EFQM Excellence Model has other benefits
apart from those derived from self-assessment. Ghobadian and Woo [6] argued that the
EFQM Excellence Model can be considered as a guide to introduce the TQM activities
because the model combines the principles or fundamental concepts of TQM in clear and
available language.
2.1.1. The EFQM Practice in IRAN
The Excellence Model was introduced to Iranian companies in 2000 and the first
countrywide assessment of the EFQM, as a selected framework of Iranian authorities, was
conducted in 2002. The most profound impact of the Quality Management and
Excellence Practice on organizational performance has been in the Iranian Steel making
and Automotive Industry. Mentioned industries have clearly proved the possibility of old
manufacturing businesses revitalization and it will continue showing the improvements in
quality and productivity. Recently, Iranian automotive companies have started action
plans on assessing their affiliated companies in order to improve productivity and launch
TQM, using EFQM tools.
Archive of SID
www.SID.ir

K.Shahroudi / Iranian Journal of optimization 1(2009) 243-265 248
2.2. Data Envelopment Analysis
Zhu [7] mention that Data Envelopment Analysis (DEA) is relatively a new “data
oriented” approach for evaluating the performance of a set of similar entities called
Decision Making Units (DMUs) which converts multiple inputs into multiple outputs.
The definition of a DMU is generic and flexible. Since DEA in its present form was
firstly introduced in 1978, various researchers have rapidly recognized that it is an
excellent and easily used methodology for modeling operational processes for
performance evaluations. For example, Zhu provides a number of DEA spreadsheet
models that can be used in performance evaluation and benchmarking. The empirical
orientation of DEA and the absence of a need for the numerous previous assumptions that
accompany other approaches such as standard forms of statistical regression analysis have
results in its use in a number of studies. DEA is used in the efficient frontier estimations
in the governmental and nonprofit sector, the regulated sector, and the private sector.
Charnes, Cooper, and Rhodes [8] described DEA as a ‘mathematical programming
model applied to observational data [that] provides a new way of obtaining empirical
estimations of relations -such as the production functions and/or efficient production
possibility surfaces- that are cornerstones of modern economics’. Earlier, Farrell [9]
motivated the need of developing better methods to evaluate the productivity. He argued
that attempting to solve the problem usually produces careful measurements which are
also very restrictive because they failed to combine the measurement of multiple inputs
into any satisfactory overall measure of efficiency. The initial DEA model, as originally
presented in Charnes, Cooper, and Rhodes (CCR), was built on the earlier work of Farrel.
Allowing the applications to a wide variety of activities, they used the term Decision
Making Units (DMU) to refer to any entity that is to be evaluated in terms of its abilities
to convert inputs into outputs. They assume that there are n DMUs to be evaluated which
each one consumes varying amounts of m different inputs to produce s different outputs.
Specifically, DMUj consumes amount ijx of input i and produces amount rjy of output r.
Firstly, they introduce the “ratio-form” of DEA in which the ratio of outputs to inputs is
used to measure the relative efficiency of the 0DMUDMU j = to be evaluated relative
to the ratios of all of the nj ,...,2,1= jDMU . In mathematical programming parlance,
Archive of SID
www.SID.ir

K.Shahroudi / Iranian Journal of optimization 1(2009) 243-265 249
this ratio, which is to be maximized, forms the objective function for the particular
DMU being evaluated, so that symbolically:
( ) 000 /,max ii irr r xvyuvuh ∑∑=
A set of normalizing constraints (one for each DMU) reflects the condition that the virtual
output to virtual input ratio of every DMU, including 0DMUDMU j = , must be less
than or equal to unity. The mathematical programming problem may thus be stated as:
( ) 000 /,max ii irr r xvyuvuh ∑∑=
Subject to nforjxvyu iji irjr r ,...,2,11/ =≤∑∑
0, ≥ir vu for all i and r
A fully rigorous development would replace 0, ≥ir vu with
,
10∑
=
m
iii
r
xv
u0
10
>≥∑
=
εm
iii
r
xv
u where ε is a non-Archimedean element smaller than any
positive real number. See Arnold et al., [10]. This condition guarantees that solutions will
be positive in these variables. The above ratio form yields an infinite number of solutions;
if ( )∗∗ vu , is optimal, then ( )∗∗ vu αα , is also optimal for 0>α . However, the
transformation developed by Charnes and Cooper (1962) for linear fractional
programming selects a representative solution [i.e., the solution (u,v) for which
101=∑ = i
m
i i xv ] and yields the equivalent linear programming problem in which the
change of variables from (u,v) to (µ ,v) is a result of the Charnes-Cooper transformation
:
(LP 0 )
∑=
=s
rrr yz
10max µ
Archive of SID
www.SID.ir
K.Shahroudi / Iranian Journal of optimization 1(2009) 243-265 250
Subject to
0,
1
0
10
1
≥
=
≤−
∑
∑∑
=
=
ir
m
iii
m
iijirjr
v
xv
xvy
µ
µ
For which the LP dual problem is :
(DLP 0 )
θθ min=∗
Subject to
.,...,2,1,0
;,...,2,1,
;,...,2,1,
01
01
nj
sryy
mixx
j
rj
n
jrj
ij
n
jij
=≥
=≥
=≤
∑
∑
=
=
λ
λ
θλ
The last model, is sometimes referred to as the “Farrell model” because it is the one used
in Farrell (1957).
3. DEA and the EFQM Model of Business Excellence
The form of the EFQM Model of Business Excellence permits a relatively simple
analysis of the performance of a DMU in terms of the relationship between its inputs
(leadership, policy and strategy, human resource, resources, and participations and
process) and its results (customer results, human results, society results and key
performance results assessed by awarding a percentage score to each Enablers and
Results category, the overall performance of a DMU is measured by the EFQM model in
a simple, but pre-determined, weighted aggregation of each of the scores across all the
Archive of SID
www.SID.ir
K.Shahroudi / Iranian Journal of optimization 1(2009) 243-265 251
nine elements. An alternative perspective is to regard the Enablers as inputs and
allocate an “opportunity cost” of 100 minus the EFQM percentage score reflecting the
improvement that might still be achieved in each of the five elements making up the
Enablers set. The percentage scores which the DMU attracts in its Results elements, in
this perspective, might be regarded directly as the outputs of the DMU. The aim then
would be to minimize the weighted aggregate of the input “costs” to achieve a maximum
weighted aggregate output score.
4. Problem Setting and Methodology
Each year, Iranian companies in automotive industry assess their affiliated companies
by using the EFQM Excellence Model called “Iranian Excellence Award” (IEA). The
main purposes of this Award are:
- Development of excellence culture among the Group Companies.
- To share the knowledge and experiences and to institutionalize the
benchmarking culture among the companies.
- To emphasize on self-assessment in order to identify strengths and areas for
improvements.
- To align between the goals and strategies.
- Using of a standard model to assess companies.
- To define improvement projects and trace the progress
After assessing up to 46 companies and defining improvement projects based on
assessment results and scores, it is important that companies must benchmark the best
practices across the Group companies. It is essential that Holding Company must monitor
the use of an appropriate performance measurement system on a regular basis that
follows: what activities are going well?, Which have stagnated?, What needs to be
improved?, and what is missing?
Schmidt and Zink [11] argued that the majority of the academic literature on self-
assessment has concentrated on the main Quality/Excellence award models and
comparison of their criteria, and the relationship between award winners and business
results. Another work that has done by Ritchie and Dale [12] has concentrated on the self-
Archive of SID
www.SID.ir

K.Shahroudi / Iranian Journal of optimization 1(2009) 243-265 252
assessment process with respect to issues such as deciding the assessment approach,
the management of the process, the resource required, and selecting performance
measurements. Since the launch of the EFQM Model in 1991, thousands of European
organizations have used the model as a framework for assessing their performance. But to
date, little use has been made of the criteria underpinning the model together with the data
collected to build and develop decision models and associated analysis tools for
supporting the self-assessment process. In this paper, we have used DEA approach in
order to build a decision model that helps the Saipa Group strategic managers to goal
setting for each criteria of EFQM business model. One of the main problems after
conducting each assessment is how the companies can benchmark the best practices in
nine criteria and which companies should be selected as benchmark. In the following we
explain the modeling process. The Data shown in Table1 are the percentage scores for
each of the nine elements, five Enablers criteria -as Inputs and four Results criteria -as
Outputs. Data of the Business Excellence Model for 46 companies are assessed by the
Holding company Assessment Teams.
Table 1. Percentage Score for each criteria in Automotive’s
Archive of SID
www.SID.ir

K.Shahroudi / Iranian Journal of optimization 1(2009) 243-265 253
Company No.
Leadership
Strategy
Human Resour
ces
Resources
Processes
Customer Re.
Human Re.
Society Re.
Key Per. Re.
1 40.2 38.1 49.4 48.2 41 30.3 47.11 25.2 40
2 23 13.8 28.0 29.0 15 21.25 12.5 11.3 32.5
3 24 18.8 24.0 30.0 30 10 16.3 10.0 22.5
4 18 18.8 30.0 24.0 50 25 32.5 11.8 22.5
5 26.3 22.4 32.9 32.8 34.0 21.6 27.1 14.5 29.4
6 20.6 23.8 16.5 24.6 22 17 7.25 5.9 12.3
7 23 23.8 14.0 15.0 24 15 6.2 5.0 25
8 30 36.3 31.0 33.0 32 15 16 8.8 30
9 23 17.5 22.0 21.0 29 10 15 10.0 15
10 19 16.5 16.5 21.0 24 20 15 8.3 24
11 30 23.0 29.8 33.5 38 29.4 32 14.7 34.7
12 25 20.0 25.0 28.0 29 21.25 16 17.5 30
13 16 22.5 17.0 18.9 19 13.5 10 10.0 10.8
14 16 8.8 14.0 18.0 20 10 29 7.5 10
15 11 10.0 16.0 19.0 18 15 15 15.0 15
16 21 17.5 27.0 28.0 32 11.25 26 13.8 27.5
17 20 18.8 15.0 17.0 21 15 11 7.5 27.5
18 21 21.3 30.0 23.3 30 28.5 30 20.0 30
19 22 23.8 27.0 30.0 25 23.5 27 5.0 25
20 14 11.3 14.0 16.0 23 15 25 10.0 17.5
21 27 26.3 29.0 28.0 31 16.25 21 17.5 37.5
22 15 15.0 20.0 15.0 20 20 15 5.0 15
23 18.8 20.6 27.5 29.3 30 22.8 14 14.7 26.9
24 21 16.8 19.6 21.2 22 13 13 8.8 20
25 15 12.5 17.1 20.0 17 5.7 5 8.7 10
26 13 10.0 17.8 13.3 19 10 10 15.0 10
27 25 20.0 25.6 20.0 30 5 6 5.0 10
Archive of SID
www.SID.ir

K.Shahroudi / Iranian Journal of optimization 1(2009) 243-265 254
4.1. The Mathematical Modeling (DEA Model)
We designed a one-year EFQM assessment program for about forty six companies.
The companies taken part in our analysis are from different business sectors but almost in
automotive supply chain. The selected assessment teams for the process consist of fifteen
teams of four people with different expertise. The formats and the criteria have been
reviewed by teams. To calibrate the results, all teams have analyzed a case study and all
assessments have been compared with the base report. In order to make a mathematical
model based on the relationship between Enablers and Results criteria in the EFQM
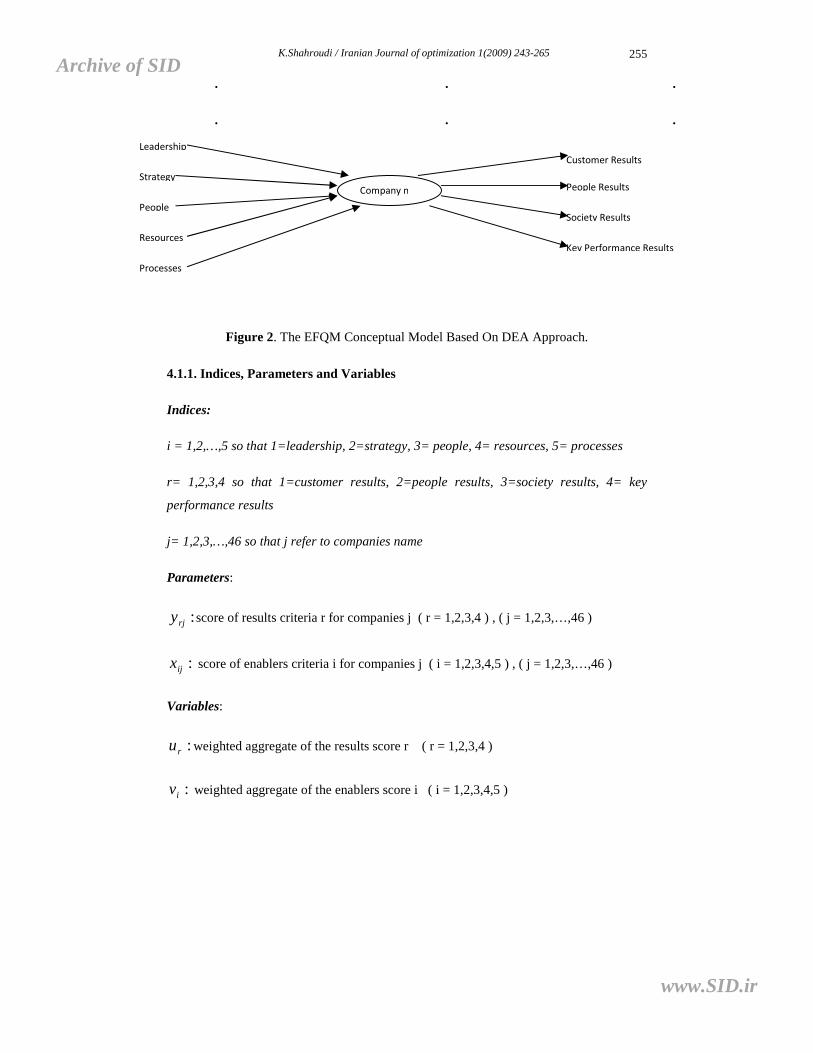
business model, we used DEA approach as shown in Fig. 2.
. .
. . .
INPUTs OPERATIONS OUTPUTs
Leadership
Strategy
People
Resources
Processes
Company 1
Customer Results
People Results
Society Results
Key Performance Results
Leadership
Strategy
People
Resources
Processes
Company 2
Customer Results
People Results
Society Results
Key Performance Results
Archive of SID
www.SID.ir
K.Shahroudi / Iranian Journal of optimization 1(2009) 243-265 255
. . .
. . .
Figure 2. The EFQM Conceptual Model Based On DEA Approach.
4.1.1. Indices, Parameters and Variables
Indices:
i = 1,2,…,5 so that 1=leadership, 2=strategy, 3= people, 4= resources, 5= processes
r= 1,2,3,4 so that 1=customer results, 2=people results, 3=society results, 4= key
performance results
j= 1,2,3,…,46 so that j refer to companies name
Parameters:
:rjy score of results criteria r for companies j ( r = 1,2,3,4 ) , ( j = 1,2,3,…,46 )
:ijx score of enablers criteria i for companies j ( i = 1,2,3,4,5 ) , ( j = 1,2,3,…,46 )
Variables:
:ru weighted aggregate of the results score r ( r = 1,2,3,4 )
:iv weighted aggregate of the enablers score i ( i = 1,2,3,4,5 )
Leadership
Strategy
People
Resources
Processes
Company n
Customer Results
People Results
Society Results
Key Performance Results
Archive of SID
www.SID.ir

K.Shahroudi / Iranian Journal of optimization 1(2009) 243-265 256
∑=
=4
100
rrr uyMaxh
s.t. 15
10 =∑
=iii vx
05
1
4
1
≤−∑∑== i
iijr
rrj vxuy ( j = 1,2,3,…,43 )
rjivu ir ,,,, ∀≥ ε
The dual problem of (LP0 ) is expressed with a real variable θ and a non-negative vector
Tn ),...,( 1 λλλ = of variables as follows (Envelopment form):
(DLP0 ) λθ ,
Min θ
s.t :
46,...,1,0
4,3,2,1,
5,4,3,2,1,00
46
1
=≥
=≥
=≤−
∑
∑=
j
ryy
ixx
j
rjjrj
ij
jij
λ
λ
θλ
Archive of SID
www.SID.ir
K.Shahroudi / Iranian Journal of optimization 1(2009) 243-265 257
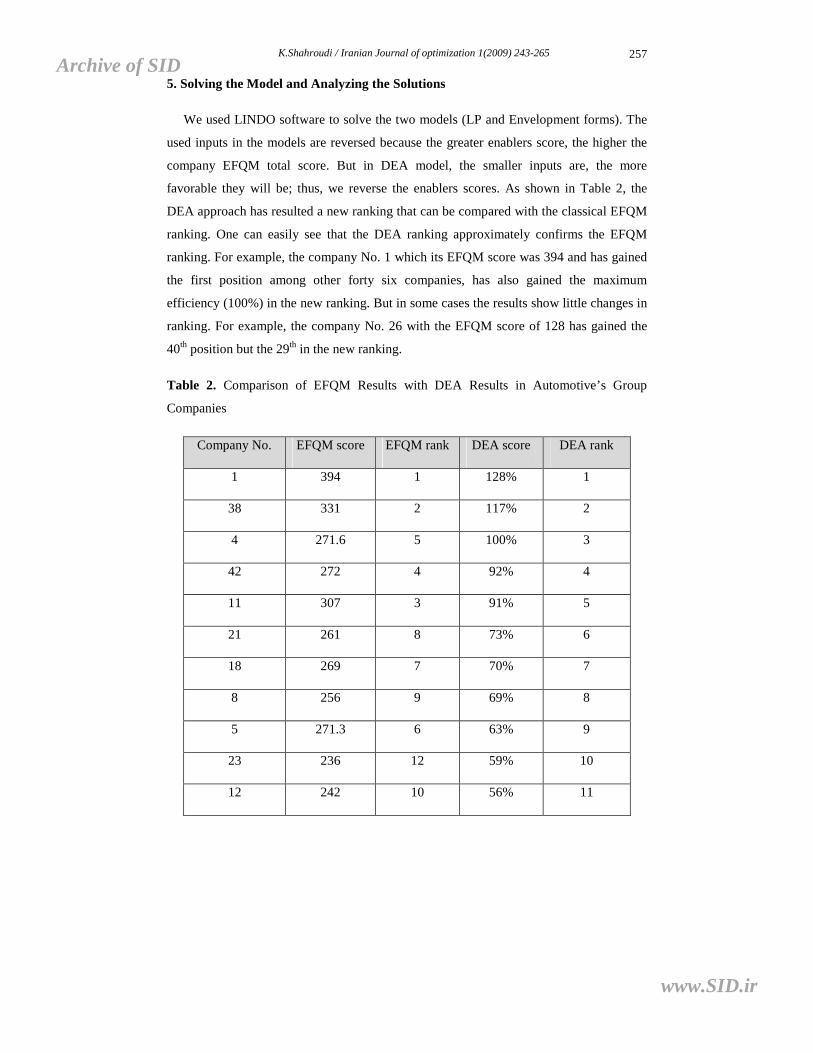
5. Solving the Model and Analyzing the Solutions
We used LINDO software to solve the two models (LP and Envelopment forms). The
used inputs in the models are reversed because the greater enablers score, the higher the
company EFQM total score. But in DEA model, the smaller inputs are, the more
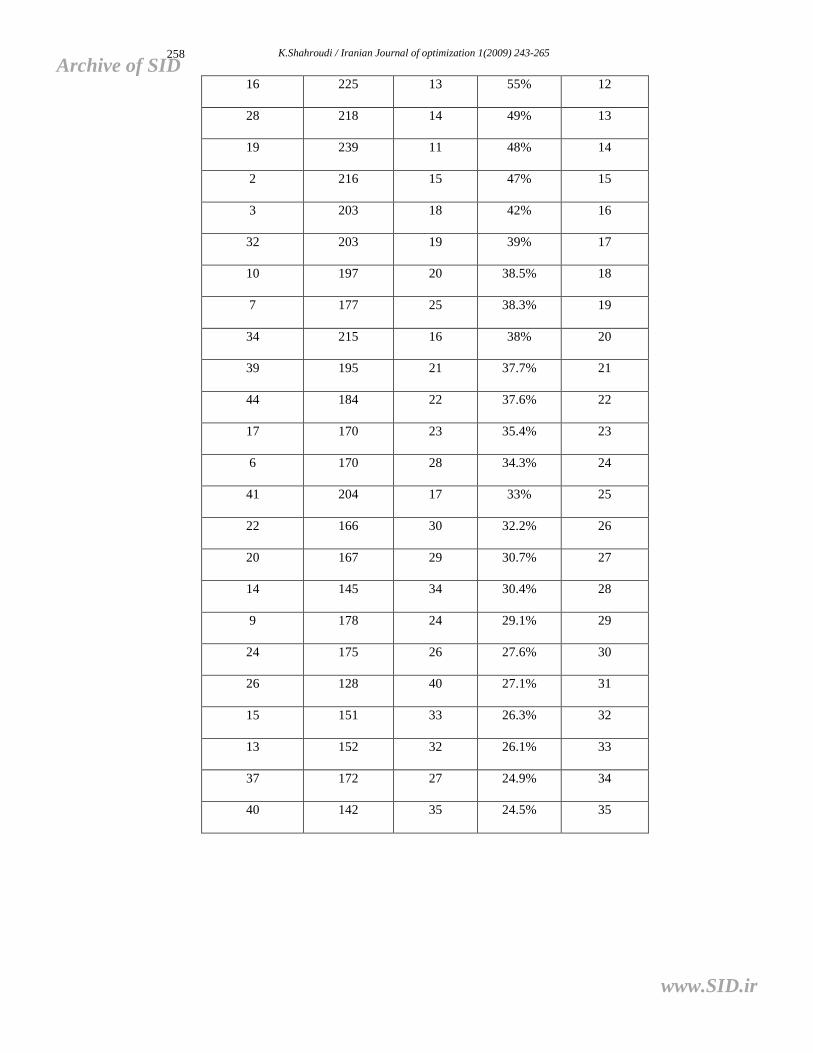
favorable they will be; thus, we reverse the enablers scores. As shown in Table 2, the
DEA approach has resulted a new ranking that can be compared with the classical EFQM
ranking. One can easily see that the DEA ranking approximately confirms the EFQM
ranking. For example, the company No. 1 which its EFQM score was 394 and has gained
the first position among other forty six companies, has also gained the maximum
efficiency (100%) in the new ranking. But in some cases the results show little changes in
ranking. For example, the company No. 26 with the EFQM score of 128 has gained the
40th position but the 29th in the new ranking.
Table 2. Comparison of EFQM Results with DEA Results in Automotive’s Group
Companies
Company No. EFQM score EFQM rank DEA score DEA rank
1 394 1 128% 1
38 331 2 117% 2
4 271.6 5 100% 3
42 272 4 92% 4
11 307 3 91% 5
21 261 8 73% 6
18 269 7 70% 7
8 256 9 69% 8
5 271.3 6 63% 9
23 236 12 59% 10
12 242 10 56% 11
Archive of SID
www.SID.ir
K.Shahroudi / Iranian Journal of optimization 1(2009) 243-265 258
16 225 13 55% 12
28 218 14 49% 13
19 239 11 48% 14
2 216 15 47% 15
3 203 18 42% 16
32 203 19 39% 17
10 197 20 38.5% 18
7 177 25 38.3% 19
34 215 16 38% 20
39 195 21 37.7% 21
44 184 22 37.6% 22
17 170 23 35.4% 23
6 170 28 34.3% 24
41 204 17 33% 25
22 166 30 32.2% 26
20 167 29 30.7% 27
14 145 34 30.4% 28
9 178 24 29.1% 29
24 175 26 27.6% 30
26 128 40 27.1% 31
15 151 33 26.3% 32
13 152 32 26.1% 33
37 172 27 24.9% 34
40 142 35 24.5% 35
Archive of SID
www.SID.ir

K.Shahroudi / Iranian Journal of optimization 1(2009) 243-265 259
29 137 38 21.3% 36
33 107 43 19.8% 37
27 157 31 18.9% 38
35 140 37 18.8% 39
31 133 39 18.4% 40
43 141 36 17.4% 41
25 119 41 14.7% 42
36 118 42 14.6% 43
45 89 45 13.1% 44
30 106 44 10% 45
46 60 46 5% 46
The Wilcoxon Signed Ranks Test
The Wilcoxon Signed Ranks Test is a nonparametric alternative to the two sample t-
test which is solely based on the order in which the observations from the two samples
fall. We will use this technique to compare two populations. Suppose that we have
samples of observations from each of two populations A (EFQM) and B (DEA) scores
containing An and Bn observations, respectively. We wish to test the hypothesis that the
distribution of X-measurement in the population A (EFQM score) is the same as in the
population B which we will symbolically write as H 0 : A=B (a). The departures from H 0
that Wilcoxon test tries to detect are location shifts. If we expect to detect that the
distribution of A is shifted to the right of distribution B as in Figure 3, we will write this
as H 1 : A > B (b). The other two possibilities are H 1 : A < B, A is shifted to the left of B,
and the two sided-alternative, which we will write as H 1 : A ≠ B, for situations in which
we have no strong prior reason for expecting a shift in a particular direction.
Archive of SID
www.SID.ir

K.Shahroudi / Iranian Journal of optimization 1(2009) 243-265 260
Figure 3-Illustrate of H 0 : A=B versus H 1 : A > B
Thus we select to test the following hypothesis :
H 0 : A=B
H 1 :A ≠ B
Wilcoxon Signed Ranks Test
Ranks
N Mean Rank Sum of Ranks
dea - efqm Negative
Ranks 2(a) 1.50 3.00
Positive Ranks 44(b) 24.50 1078.00
Ties 0(c)
Total 46
a dea < efqm
Archive of SID
www.SID.ir
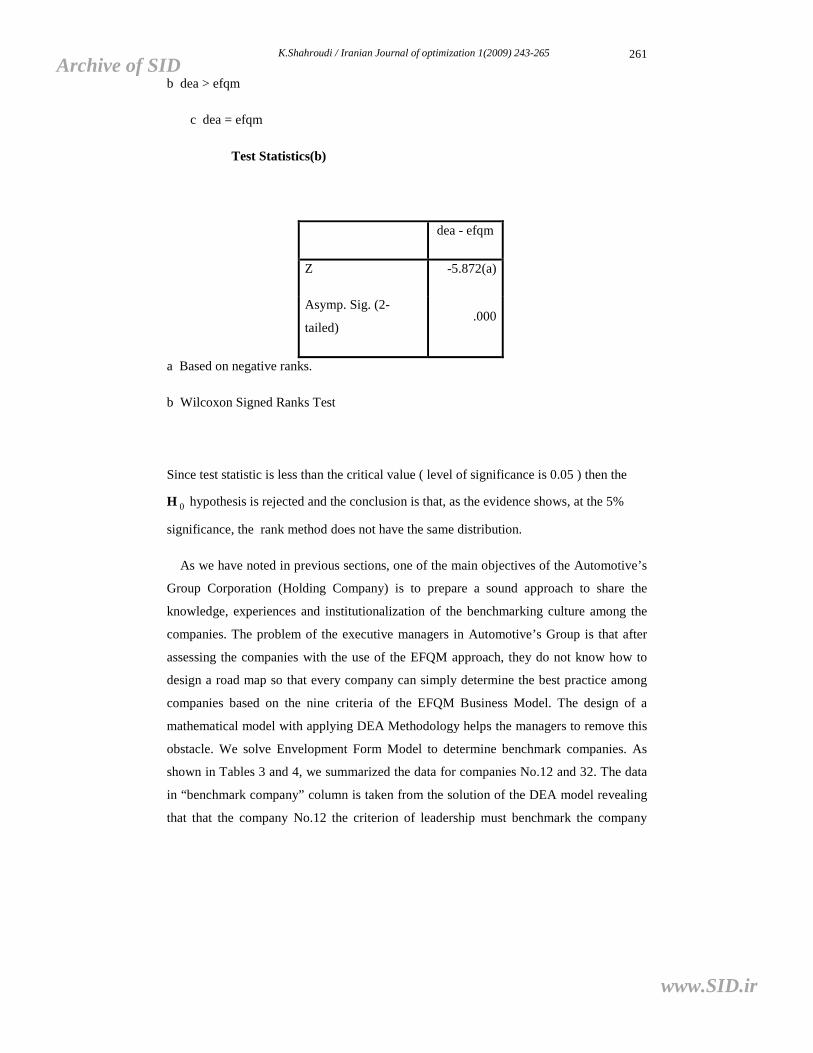
K.Shahroudi / Iranian Journal of optimization 1(2009) 243-265 261
b dea > efqm
c dea = efqm
Test Statistics(b)
dea - efqm
Z -5.872(a)
Asymp. Sig. (2-
tailed) .000
a Based on negative ranks.
b Wilcoxon Signed Ranks Test
Since test statistic is less than the critical value ( level of significance is 0.05 ) then the
H 0 hypothesis is rejected and the conclusion is that, as the evidence shows, at the 5%
significance, the rank method does not have the same distribution.
As we have noted in previous sections, one of the main objectives of the Automotive’s
Group Corporation (Holding Company) is to prepare a sound approach to share the
knowledge, experiences and institutionalization of the benchmarking culture among the
companies. The problem of the executive managers in Automotive’s Group is that after
assessing the companies with the use of the EFQM approach, they do not know how to
design a road map so that every company can simply determine the best practice among
companies based on the nine criteria of the EFQM Business Model. The design of a
mathematical model with applying DEA Methodology helps the managers to remove this
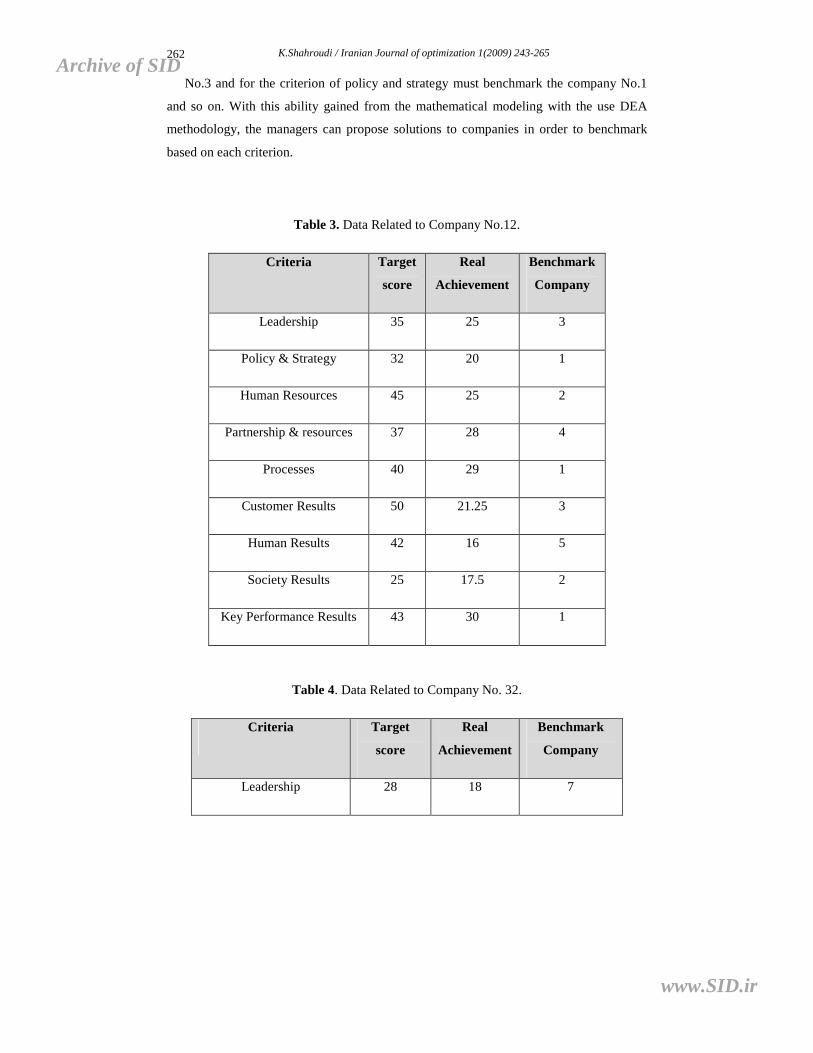
obstacle. We solve Envelopment Form Model to determine benchmark companies. As
shown in Tables 3 and 4, we summarized the data for companies No.12 and 32. The data
in “benchmark company” column is taken from the solution of the DEA model revealing
that that the company No.12 the criterion of leadership must benchmark the company
Archive of SID
www.SID.ir
K.Shahroudi / Iranian Journal of optimization 1(2009) 243-265 262
No.3 and for the criterion of policy and strategy must benchmark the company No.1
and so on. With this ability gained from the mathematical modeling with the use DEA
methodology, the managers can propose solutions to companies in order to benchmark
based on each criterion.
Table 3. Data Related to Company No.12.
Criteria Target
score
Real
Achievement
Benchmark
Company
Leadership 35 25 3
Policy & Strategy 32 20 1
Human Resources 45 25 2
Partnership & resources 37 28 4
Processes 40 29 1
Customer Results 50 21.25 3
Human Results 42 16 5
Society Results 25 17.5 2
Key Performance Results 43 30 1
Table 4. Data Related to Company No. 32.
Criteria Target
score
Real
Achievement
Benchmark
Company
Leadership 28 18 7
Archive of SID
www.SID.ir

K.Shahroudi / Iranian Journal of optimization 1(2009) 243-265 263
Policy & Strategy 30 16.3 9
Human Resources 35 24 12
Partnership & resources 32 20 6
Processes 38 24 16
Customer Results 40 20 4
Human Results 32 24 1
Society Results 18 12.5 3
Key Performance Results 36 20 9
In Fig. 3, we draw a Road Map to show how the outputs of the DEA model can help the
companies to select the Benchmark Companies for each EFQM model criterion.
Figure 3. The Road Map for Leadership Criteria Target Score (Company No.32).
ye
20 20 20 20 20
Target
4
8
6
2
1
Bench.Com
Bench.Com
Bench.Com
Bench.Com
Bench.Com
Archive of SID
www.SID.ir

K.Shahroudi / Iranian Journal of optimization 1(2009) 243-265 264
For example, the company No.32 must be the benchmark of the company No.7 for
leadership criteria based on the data of 2007 and set target score for 2008. We, therefore,
can draw this Road Map for other criteria of EFQM model for each company (e.g., the
Benchmark Company 2009 will be determined by making a DEA model based on data
collected in 2008, and so on).
6. Conclusions and Future Developments
In this conceptual-mathematical model, I have shown that the DEA mathematical
model can be combined with conceptual EFQM Business Excellence Model to produce
an optimal ranking as a new ranking based on the EFQM score and help the
benchmarking process. This paper reports finding of a survey and case study research on
the application of the DEA to the ranking method of EFQM Business Excellence Model
in Iran’s Automotive Industry. This paper assesses the usefulness and power of the DEA
technique to recognize a new scoring system in order to compare the classical ranking
method with the EFQM business model. We used this method to identify meaningful
exemplar companies for every criterion of the EFQM model and then design a road map
based on the realistic targets in each criterion which is currently being achieved by
exemplar companies. The research indicates that the DEA approach is a powerful tool to
analyze the latent knowledge of the scores generated from the conducting self-
assessments. Finally, we used the research results in order to draw a road map based on
the benchmarking concept. In this survey, we assumed that each criterion in the EFQM
Business Excellence Model has an equal importance for each company. In some
situations, this assumption is unrealistic. Since the degrees of importance of the nine
criteria are different for one company in comparison with another one, we need to design
a mathematical model that recognizes the different weights.
References
[1] Donnelly M., A radical scoring system for the European Foundation for Quality
Management Business Excellence Model, Managerial Auditing Journal,15, 1-12, 2000.
[2] Westlund A. H., Measuring environmental impact on society in the EFQM system,
Total Quality Management, 12(1), 125-35, 2001.
Archive of SID
www.SID.ir

K.Shahroudi / Iranian Journal of optimization 1(2009) 243-265 265
[3] Hillman G.P., Making self-assessment successful, The TQM Magazine, 6, 29-31,
1994.
[4] Porter L., and Tanner S., Assessing Business Excellence , Buttrworth- Heinemann,
Oxford, 1996.
[5] Van der Wiele T., Dale B. And Williams R., Business improvement through quality
management system, Management Decision, 38(1), 19-23, 2000.
[6] Ghobadian A., and Woo H. S., Characteristics, benefits and shortcomings of four
major quality award, International Journal of Quality&Reliability Management, 13(2),
10-44, 1996.
[7] Zhu J., Quantitative Model for Performance Evaluation and Benchmarking: Data
Envelopment Analysis with Spreadsheets and DEA Excel Solver, Kluwer Academic
Publishers, Boston, 2002.
[8] Charnes A., Cooper, W.W. and Rhodes, E., Measuring the efficiency of decision
making units , European Journal of Operation Research, 2, 429-44, 1978.
[9] Farrel M.J., The measurement of productive efficiency, Journal of Royal Statistical
Society A, 120, 253-281, 1957.
[10] Arnold V., Bardhan I., Cooper W. W., and Gallegos A., Primal and Dual Optimality
in Computer Codes Using Two-Stage Solution Procedures in DEA, Operations Research
Methods, Models and Applications (Westpost, conn: Quorum Books ), 1998.
[11] Schmidt A., and Zink K. J., Practice and implementatin of self-assessment,
International Journal of Quality Science, 3, 5-17, 1998.
[12] Ritchie L., and Dale B.G., An analysis of the self-assessment practice using the
business excellence model, Proceeding of the Institution of Mechanical Engineers,
204(B4), 593-602, 2000.
Archive of SID
www.SID.ir