Embed Size (px)
Citation preview
(iipyright 0 1986 by the Genetics Society of America
THE ALLELIC CORRELATION STRUCTURE OF GAINJ- AND KALAM-SPEAKING PEOPLE. I. THE ESTIMATION
AND INTERPRETATION OF WRIGHT’S 8’-STATISTICS
JEFFREY C. LONG’
Department of Human Genetics, University of Michigan, Ann Arbor, Michigan 48109
Manuscript received July 3 1 , 1985 Revised copy accepted November 14, 1985
ABSTRACT
T h e internal patterning of allelic correlations in the Gainj and Kalam swidden horticulturalists of highland Papua New Guinea is examined within the context of SEWALL WRIGHT’S F-statistic model. A multiallelic extension of the model is given first, and multivariate variance-component estimators for the parameters are suggested. Then , it is shown that the expectation of the F-statistic set de- pends on the age structure of the population and that knowledge of the popu- lation and sample age structure is critical for meaningful analysis. T h e array of F-statistics estimated jointly over five polymorphic enzyme loci reveals the fol- lowing features of Gainj and Kalam population structure: (1) significant depar- tures from panmictic expectations and (2) characteristics of a continuously dis- tributed breeding population, rather than those expected for populations sub- divided into demes with discrete boundaries. Finally, the F-statistics estimated for the Gainj and Kalam are briefly compared to estimates obtained from other tribal populations. I t is seen that the level of differentiation observed in the Gainj and Kalam is only about one-third that observed in South American swid- den horticulturalists. Consequently, some conventional wisdom regarding the interrelationship of socioecological settings and genetic structures may require reevaluation.
HE first step in the analysis of human population genetic structure often T involves quantifying the departure of genotype frequencies from their panmictic expectations. WRIGHT’S (1 95 1 , 1965) F-statistic model has been a universally popular analytical approach for this purpose because it is well suited for populations that are subdivided into smaller units, such as demes, clans or villages (e.g. CAVALLI-SFORZA, BARRAI and EDWARDS 1964; WORKMAN and NISWANDER 1970; WORKMAN et al. 1973; NEEL and WARD 1972; WIESENFELD and GAJDUSEK 1976; JORDE 1980). The model’s parameters relate the depar- ture from panmictic expectations in the total population to the Wahlund effect between subdivisions and the average departure from panmixia within subdi- visions. The application presented here is designed to use observed deviations from expected genotypic proportions to identify the patterning and magnitude
I Present address: Hunian Genetics Program, Department of Biostatistics, Graduate School of Public Health, University of Pittsburgh, Pittsburgh, Pennsylvania 15261.
Genetics 112: 629-647 March, 1986.
630 J. C. LONG
of barriers to random mating within the Gainj- and Kalam-speaking swidden horticulturalists of highland Papua New Guinea.
Application of the F-statistic model is often problematic despite its popular- ity. It was originally derived for codominant diallelic loci, and there has been no consensus on how it can be extended to include multiallelic loci (LI 1969; NEI 1977). In addition, the proper estimation procedures for the model’s Parameters have been uncertain (WEIR and COCKERHAM 1984). Difficulties arise from (1) unequal sample sizes in the subdivisions; (2) how information from multiallelic loci should be used, given that they are inadequately covered by the theory and that multivariate statistical estimation is generally more complicated; and (3) how information from different loci can be combined to increase the precision of F-statistic estimates and the power of hypothesis tests.
A review of the F-statistic model is presented before it is applied to the Gainj and Kalam. It is shown that COCKERHAM’S (1969, 1973) analysis of variance (ANOVA) parameterization of the model for diallelic loci can be extended to cover multiallelic loci. The ANOVA approach to WRIGHT’S theory is especially useful because it provides a clear demonstration of WRIGHT’S correlational definitions of the parameters, even with multiallelic loci, and because it readily deals with problems of estimation. A method for combining F-statistic estimates from different loci is then given.
With these theoretical and methodological issues resolved, the distribution of genetic characteristics in the Gainj and Kalam is investigated. It is shown that the array of estimated F-statistics is characteristic of certain patterns of nonrandom mating and is different from either panmixia or other patterns of nonrandom mating. As a consequence, insight into the details of the population breeding structure is gained from the analysis. It is also shown that, when there is migration between the population subunits, the expectation of the F- statistic set is age structured and is quite different from the values expected with complete isolation of subunits.
THE MODEL
The F-statistic model is a hierarchical model with genes stratified at three levels: individuals ( I ) , within subdivisions ( S ) and within the total population ( T ) . It has three main parameters; FIT is the correlation of uniting gametes relative to those of the total population, FIs is the average over all subdivisions of the correlation of uniting gametes relative to the gametes of the subdivision and F,5r is the correlation of random gametes within subdivisions relative to t h e total population. These definitions are relative to a current population (cJ WRIGHT 1965, p. 401), and such correlations may arise as the consequence of a variety of evolutionary processes. The three F-statistics are interrelated as
( 1 - FIT) = (1 - F.ST)( 1 - &S). ( 1 ) A variety of derivations of this basic relationship are available (WRIGHT 195 1, 1965; COCKERHAM 1969).
Suppose a locus has 2 alleles, designated A I , A Q , . -., Az, with population frequencies P I , py, . - , pz . The variability at this locus is examined in the context of a set of random vectors, x, each with 2 - 1 elements. The first

ALLELIC CORRELATION STRUCTURE
TABLE 1
Scoring for a three-allele locus
63 1
Genotypes Vectors
vector element is assigned a one if the allele is type A I , and a zero otherwise. At the second position, a one is assigned if the allele is type A*, and a zero otherwise. And so forth until the position Z - 1 is reached. Thus, the vector corresponding to the allele Az is a vector with 2 - 1 zeros. This approach will yield identical values for the F-statistics no matter which alleles are designated A , , A y , , A z . Since each person carries two alleles, two vectors are scored for each individual sampled. Although the methodology and procedures adopted in the following will remain the same for loci with any number of alleles, the subsequent derivations and explanations will be presented in terms of a three-allele locus for the purposes of brevity and concreteness. An example of the scoring procedure is given in Table 1.
The expectation of the vector x is p = [ p , , p 2 ] and the associated variance- covariance matrix is
z = [Pdl - - P J -P1P2] -p1p2 pZ(1 - p 2 ) .
This variance-covariance matrix can be subdivided into components corre- sponding to the various population subdivisions by considering the linear model
Xklj = p + ah 4- ht + Wkzj , (2) where Xky indexes the j t h allele, j = 1, 2, in the ith individual, z = 1 , , ah,
in the kth group, k = 1, - . . , K . The effects are a for groups, b for individuals and w within individuals. All effects are assumed random and uncorrelated and have the associated variance-covariance matrices Ea, E b and xw. The ex- pectation of quadratics over vectors are
E(Xkl lX$t , l ’ ) = ppT + 2 if K = k’, i = i’, j = j ’
= ppT + X a b if K = K’, i = i’, j # j ’ = p p T + Z a if k = K ’ , i # i
= ppT + Zg if k # k’.
(3)
632 J. C. LONG
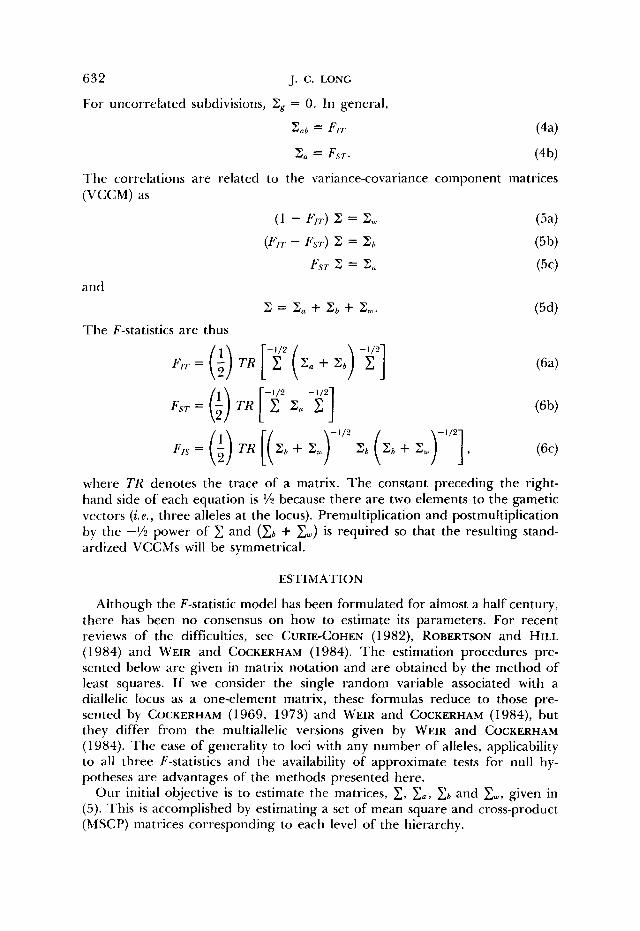
For uncorrelated subdivisions, Zg = 0. In general,
z a b = FIT ( 4 4
2, = FST. (4b)
The correlations are related to the variance-covariance component matrices (VCCM) as
The F-statistics are thus
where TR denotes the trace of a matrix. The constant preceding the right- hand side of each equation is ‘/2 because there are two elements to the gametic vectors ( i . e . , three alleles at the locus). Premultiplication and postmultiplication by the -Yz power of and ( c b + E,) is required so that the resulting stand- ardized VCCMs will be symmetrical.
ESTIMATION
Although the F-statistic model has been formulated for almost a half century, there has been no consensus on how to estimate its parameters. For recent reviews of the difficulties, see CURIE-COHEN (1 982), ROBERTSON and HILL (1 984) and WEIR and COCKERHAM (1 984). The estimation procedures pre- sented below are given in matrix notation and are obtained by the method of least squares. If we consider the single random variable associated with a diallelic locus as a one-element matrix, these formulas reduce to those pre- sented by COCKERHAM (1969, 1973) and WEIR and COCKERHAM (1984), but they differ from the multiallelic versions given by WEIR and COCKERHAM (1 984). The ease of generality to loci with any number of alleles, applicability to all three F-statistics and the availability of approximate tests for null hy- potheses are advantages of the methods presented here.
Our initial objective is to estimate the matrices, 2, e,, e b and cw, given in (5) . This is accomplished by estimating a set of mean square and cross-product (MSCP) matrices corresponding to each level of the hierarchy.
ALLELIC CORRELATION STRUCTURE
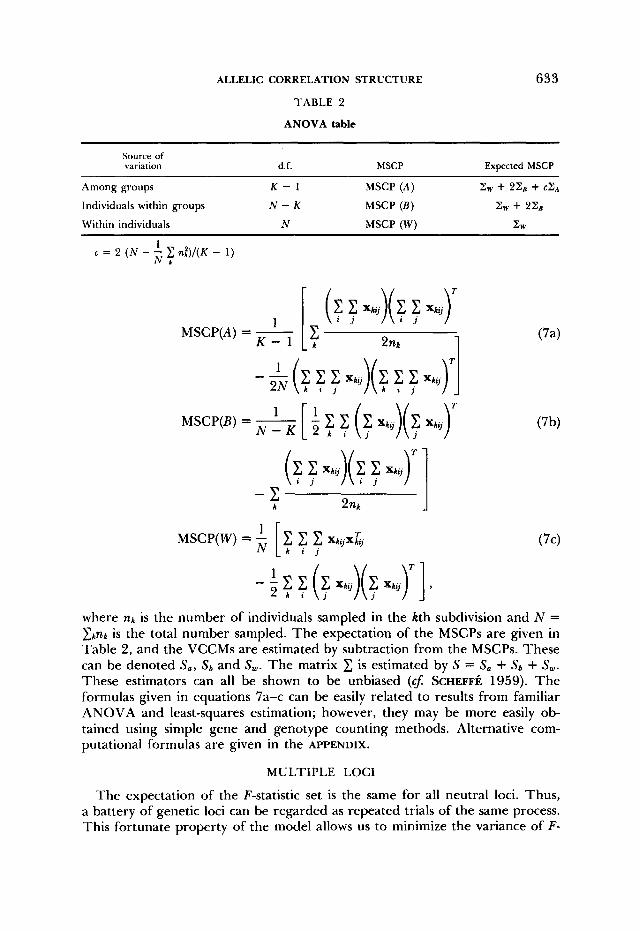
TABLE 2
ANOVA table
633
Source of variation d.f. MSCP Expected MSCP
Among groups K - 1 MSCP (A) z w + 22, + CZA
Individuals within groups N - K MSCP ( E ) 2 w + 22,
Within individuals N MSCP ( W ) ZW
1 MSCP(A) = -
K -
L k 1
where nh is the number of individuals sampled in the kth subdivision and N = &nk is the total number sampled. The expectation of the MSCPs are given in Table 2 , and the VCCMs are estimated by subtraction from the MSCPs. These can be denoted Sa, s b and S,. The matrix is estimated by S = Sa + S b + S,. These estimators can all be shown to be unbiased (cf: SCHEFF~ 1959). The formulas given in equations 7a-c can be easily related to results from familiar ANOVA and least-squares estimation; however, they may be more easily ob- tained using simple gene and genotype counting methods. Alternative com- putational formulas are given in the APPENDIX.
MULTIPLE LOCI
The expectation of the F-statistic set is the same for all neutral loci. Thus, a battery of genetic loci can be regarded as repeated trials of the same process. This fortunate property of the model allows us to minimize the variance of F-
634 J. C. LONG
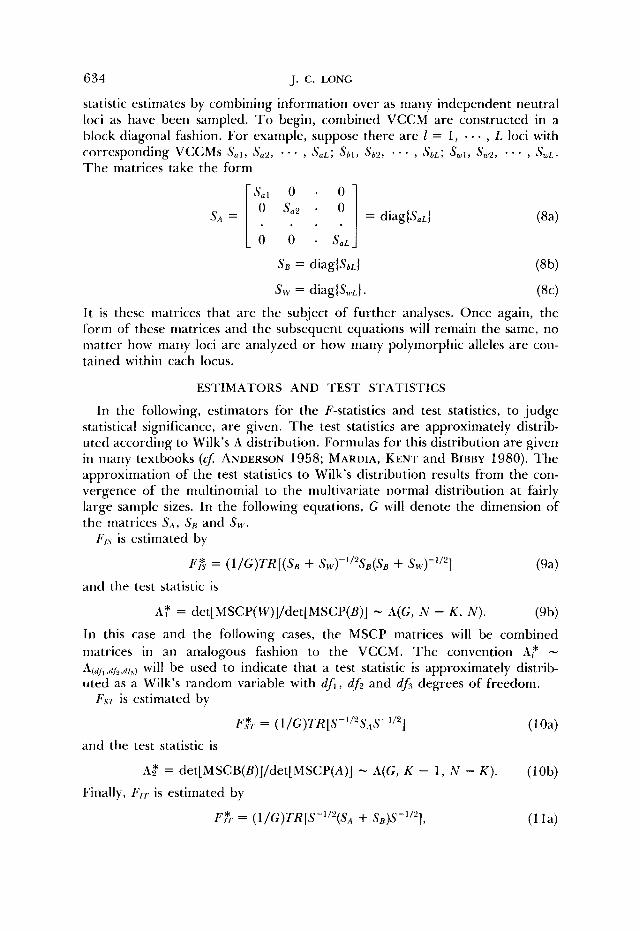
statistic estimates by combining information over as many independent neutral loci as have been sampled. T o begin, combined VCCM are constructed in a block diagonal fashion. For example, suppose there are E = 1, , L loci with corresponding VCCMs S a l , Sa2, , SaL; Sbl, S b 2 , , SQL; Swl, Sw2, , SwL. The matrices take the form
Sa] 0 . 0 0 $ 2 * 0
( 8 4
S B = diag(SbL1 (ab)
S w = diag(SwL). (8c) I t is these matrices that are the subject of further analyses. Once again, the form of these matrices and the subsequent equations will remain the same, no matter how many loci are analyzed or how many polymorphic alleles are con- tained within each locus.
ESTIMATORS AND TEST STATISTICS
In the following, estimators for the F-statistics and test statistics, to judge statistical significance, are given. The test statistics are approximately distrib- uted according to Wilk's A distribution. Formulas for this distribution are given in many textbooks ( c j ANDERSON 1958; MARDIA, KENT and BIBBY 1980). The approximation of the test statistics to Wilk's distribution results from the con- vergence of the multinomial to the multivariate normal distribution at fairly large sample sizes. In the following equations, G will denote the dimension of the matrices S A , Se and S,.
Fl.5 is estimated by
F& = (l/G)TR[(SB + Sw)-'/2SB(SB + Sw)-1/2J
A; = det[MSCP(W)]/det[MSCP(B)] - A(G, N - K , N ) .
( 9 4
(9b)
and the test statistic is
In this case and the following cases, the MSCP matrices will be combined matrices in an analogous fashion to the VCCM. The convention A,* - A(dh ,df2,df3) will be used to indicate that a test statistic is approximately distrib- uted as a Wilk's random variable with d f l , df2 and dfs degrees of freedom.
F.Yr is estimated by
F& = (l/G)TR[S-'/2SAS-'/2] (loa) and the test statistic is
A$ = det[MSCB(B)J/det[MSCP(A)] - A(G, K - 1, N - K ) . (lob) Finally, FIT is estimated by
FI"T = (l/G)TR[S-"2(SA + SB)S-1/2], (1 la)
ALLELIC CORRELATION STRUCTURE 635
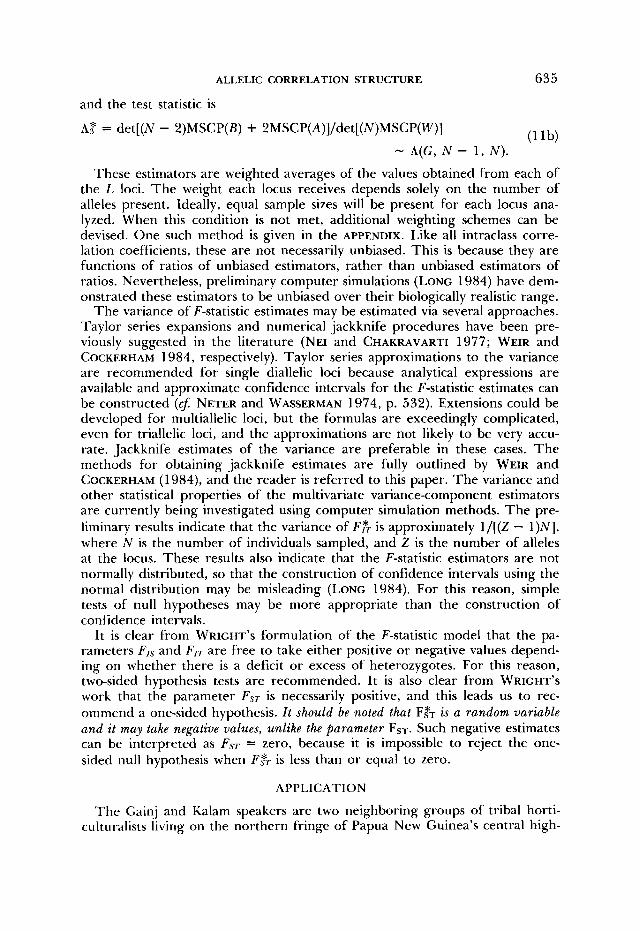
and the test statistic is
(1 1b) A? = det[(N - S)MSCP(B) + 2MSCP(A)]/det[(N)MSCP(W)]
- A(G, N - 1, N) .
These estimators are weighted averages of the values obtained from each of the L loci. The weight each locus receives depends solely on the number of alleles present. Ideally, equal sample sizes will be present for each locus ana- lyzed. When this condition is not met, additional weighting schemes can be devised. One such method is given in the APPENDIX. Like all intraclass corre- lation coefficients, these are not necessarily unbiased. This is because they are functions of ratios of unbiased estimators, rather than unbiased estimators of ratios. Nevertheless, preliminary computer simulations (LONG 1984) have dem- onstrated these estimators to be unbiased over their biologically realistic range.
The variance of F-statistic estimates may be estimated via several approaches. Taylor series expansions and numerical jackknife procedures have been pre- viously suggested in the literature (NEI and CHAKRAVARTI 1977; WEIR and COCKERHAM 1984, respectively). Taylor series approximations to the variance are recommended for single diallelic loci because analytical expressions are available and approximate confidence intervals for the F-statistic estimates can be constructed (4 NETER and WASSERMAN 1974, p. 532). Extensions could be developed for multiallelic loci, but the formulas are exceedingly complicated, even for triallelic loci, and the approximations are not likely to be very accu- rate. Jackknife estimates of the variance are preferable in these cases. The methods for obtaining jackknife estimates are fully outlined by WEIR and COCKERHAM (1984), and the reader is referred to this paper. The variance and other statistical properties of the multivariate variance-component estimators are currently being investigated using computer simulation methods. The pre- liminary results indicate that the variance of FFT is approximately 1/[(Z - 1)N], where N is the number of individuals sampled, and Z is the number of alleles at the locus. These results also indicate that the F-statistic estimators are not normally distributed, so that the construction of confidence intervals using the normal distribution may be misleading (LONG 1984). For this reason, simple tests of null hypotheses may be more appropriate than the construction of confidence intervals.
I t is clear from WRIGHT’S formulation of the F-statistic model that the pa- rameters FlS and F I T are free to take either positive or negative values depend- ing on whether there is a deficit or excess of heterozygotes. For this reason, two-sided hypothesis tests are recommended. It is also clear from WRIGHT’S work that the parameter FST is necessarily positive, and this leads us to rec- ommend a one-sided hypothesis. I t should be noted that F& is a random variable and it may take negative values, unlike the parameter FsT. Such negative estimates can be interpreted as Fsr = zero, because it is impossible to reject the one- sided null hypothesis when FfT is less than or equal to zero.
APPLICATION
The Gainj and Kalam speakers are two neighboring groups of tribal horti- culturalists living on the northern fringe of Papua New Guinea’s central high-
636 J. C. LONG
lands (WOOD, SMOUSE and LONG 1985; LONG 1984; J. C. LONG et al., 1986). These two contiguous populations are linguistically distinct but ecologically and culturally very similar. They are both subdivided into a series of local groups ranging in size from about 20 to 200 individuals. Within each local group, members share access to the territory’s garden land and forest resources. In keeping with long-standing anthropological usage in New Guinea, these groups will be referred to as parishes (HOGBIN and WEDGWOOD 1952).
Gainj and Kalam parishes constitute the most easily identified units of resi- dential structure. The F-statistic analysis presented here is therefore structured relative to the parish level of subdivision. Nevertheless, it is uncertain to what extent parish membership represents a barrier to random genetic exchange. There is a very high rate of marital exchange between parishes, and all of the parishes included in this analysis are in very close geographic proximity (WOOD, SMOUSE and LONG 1985). The major questions to be answered are (1) whether or not there is significant genetic differentiation between parishes, and should there be differentiation; and (2) what are the barriers to random genetic ex- change, both within and among parishes? Thus, for the purposes of this study, Fls is the correlation of alleles within individuals, relative to the allelic array of the parish; FST is the correlation of random alleles within parishes, relative to the entire population; and FIT is the correlation of alleles within individuals, relative to the allelic array of the entire population.
Five loci, red cell acid phosphatase (ACP), glutamic-pyruvate transaminase (GPT) , adenosine deaminase (ADA), haptoglobin ( H p ) and Group Specific Com- ponent (Gc) were analyzed. The first four of these loci each have two alleles, whereas Gc is triallelic. Of the 52 genetic systems for which these people have been characterized (LONG et al., 1986), these five loci were the only ones that met the following criteria for selection. First, they are codominant systems. Second, there are typings in all 21 parishes for which blood samples have been collected. Third, in the total population, the average frequency of the most common allele is <0.90. The first condition ensures that all single-locus gen- otypes are observable, and the second provides an adequate number of degrees of freedom for hypothesis testing. The third condition is important for a variety of more subtle reasons reviewed below.
Computer simulation studies have shown the variance of the F-statistic esti- mates to be high and unstable with respect to allele frequency when the most common allele is above the 0.90 frequency level. By contrast, when the most frequent allele is below this level, the variance of the F-statistic estimates are related to sample sizes, but nearly independent of allele frequencies (LONG 1984). I t is also the case that F-statistic estimates can be substantially biased when the level of polymorphism is low and small samples have been drawn, Finally, F-statistic estimates from loci with low levels of polymorphism are not strictly comparable with estimates from loci with high polymorphism for purely mechanical reasons. FIS is defined only in the interval [-q/( 1 - 4); 1 .O], where q is the frequency of the least frequent allele (CURIE-COHEN 1982). Thus, if q is the frequency of a rare variant, the negative portion of Fls’s range will be far more restricted than if q is the frequency of a common morph. Both

ALLELIC CORRELATION STRUCTURE 637
TABLE 3
Estimated Pstatistics ~
Locus ~~ ~
ACP 0.0 177 0.0144* 0.0318 570 ADA 0.0836** 0.0310* 0.1120** 570 GPT 0.0439 0.0426** 0.0847 569 HP -0.0313 0.0227** -0.0079 470 Gc 0.0474 0.0109** 0.0544 522
Total 0.0364** 0.0224** 0.0568**
* P < 0.05; ** P < 0.01.
theoretical (COCKERHAM 1973) and empirical studies (SMOUSE, NEEL and LIU 1983) have indicated that FIs values as low as -0.10 are reasonable for human populations. Consequently, it will not be instructive to examine loci for which Fly values are excluded from the region because of low polymorphism.
RESULTS
F-statistics estimated individually for the five loci, and combined for the set, are presented in Table 3. Sample sizes and significance levels (P values) are also given. The significance levels should be interpreted cautiously, because the distributional requirements are achieved only at large sample sizes. Never- theless, it is comforting that applications of various approximate x2 tests for the individual loci (SNEDECOR and IRWIN 1933; LI and HORVITZ 1953; COCK- ERHAM 1969) yield nearly identical results. The significance levels for the multiple locus estimates must be accepted even more tentatively, because there is a considerable amount of missing data at the haptoglobin locus. The primary reason for this is that ahaptoglobinemia reaches a fairly high frequency in this population (approximately 20%). As a conservative precaution, the haptoglobin sample size was used to determine the number of degrees of freedom for hypothesis tests. Despite these inadequacies of the testing procedure, there are few cases of ambiguous significance, so the interpretation of the results is not impaired.
The single locus FIS coefficients range from -0.0313 (Hp) to 0.0836 (ADA). The single locus FST coefficients are far more homogeneous, ranging from 0.0109 (Cc) to 0.0426 (GPT). There is nothing revealed by the interlocus patterns of either FIs or FST that would suggest that selective forces are oper- ating on these loci. However, five loci is far too few a number to expect such patterns to emerge.
The single-locus estimates of FIT span -0.0079 ( H p ) to 0.1 120 (ADA). The negative FIT value observed at the H p locus is not statistically significant, and only the extremely high observation at ADA reaches unequivocal significance. Finally, the H p locus illustrates an important point. The positive and significant value of FST is countered by a negative value of FIS. Thus, the genotypes in the entire population are nearly in panmictic proportions, despite the fact that nonrandom associations of alleles exist within and among parishes.
638 J. C. LONG
The multiple-locus estimates of all three F-statistics are seen to be positive and significantly different from zero. We see that FIT is elevated by both within and among subdivision deviations from panmixia, and roughly to the same extent. The implication of the values for the Gainj and Kalam is complicated by the fact that there are many evolutionary pressures affecting genotype proportions simultaneously (cJ: WORKMAN 1969). Nevertheless, a careful ex- amination of the pattern of allelic correlations does shed light on the Gainj and Kalam breeding structure.
INTERPRETATION OF F.FT
Despite the close geographical proximity and high marital exchange rate between parishes, the overall estimate of FST (0.0224; P < 0.01) indicates that significant subpopulation structure exists within the study group. This value is in excess of the value ( F S T = 0.001) inferred from a heterogeneity x2 analysis of blood-group phenotypes observed in 15 clans of New Guinea highlanders at Bundi (MALCOLM, BOOTH and CAVALLI-SFORZA 1971), and it is reasonably close to the level (FsT = 0.0201) observed in 19 “villages” of the North and South Fore linguistic groups in the eastern highland (WIESENFELD and GAJ- DUSEK 1976). The low level of clan differentiation is consistent with theoretical expectations (MORTON, IMAIZUMI and HARRIS 1971), and the higher level of differentiation of “villages” within different linguistic groups is not unexpected, given that linguistic barriers are usually barriers to mate exchange as well.
Beyond these very generalized statements, it is difficult to interpret FST
values. GAJDUSEK and his colleagues (GAJDUSEK and ALPERS 1972; SIMMONS et al. 1972; WIESENFELD and GAJDUSEK 1976) have pointed out that we do not know the precise relationship between the existing social units and the popu- lation breeding structure. They note that before European contact, true tribal organization or formalized tribal leadership did not exist anywhere in the New Guinea highlands. Traditionally, the people resided in small hamlets ranging in size from a few to several families. The people were so geographically restricted that few people even knew the extent of their own language group. Larger political units arose from loose affiliations of hamlets resulting Erom marriage ties, property rights, adoption of children and frequent exchange of members. These affiliations were both temporally and spatially plastic, and they even extended across linguistic boundaries. GAJDUSEK and ALPERS (1972, p. 7) conclude, “if there is anything resembling tribal organization today, it follows from government determination of linguistic boundaries, appointment of village leaders, (as luluai and tultul), conduct of census, and European construct of a named tribe.”
Both the precontact population pattern and the European overlay are ap- parent in the Gainj and Kalam today. The parishes that we identify correspond closely to administrative units within the Gainj census division. The Gainj census division is, itself, a conglomeration of people; most are Gainj speakers, but many Kalam and some Maring speakers are included as well. The larger parishes we have sampled are actually collections of named, but smaller, places. These smaller places correspond closely to the hamlets described by GAJDUSEK
ALLELIC CORRELATION STRUCTURE 639
and ALPERS (1 972). Our demographic information reveals that these smaller places may realign with different parishes episodically. The question thus arises, does our value of FST reflect variation accrued by discrete breeding units, or rather, does it reflect heterogeneity within a continuous breeding population (6 WRIGHT 1943) that has been arbitrarily subdivided for administrative pur- poses? Because FST is a simple summary measure that can arise in either of these situations, it cannot answer this question (WRIGHT 1965). Nevertheless, the other F-statistics offer much to resolve this issue.
INTERPRETATION OF F,s
The value of Fls (0.0364; P < 0.01) estimated here is enigmatic at first glance. Virtually all empirical studies and theoretical considerations lead us to expect negative Fls values in tribal populations (NEEL and WARD 1972; COCK- ERHAM 1973; WORKMAN et al. 1973; JORDE 1980; SMOUSE, NEEL and LIU 1983). The factors that affect allelic correlations include finite size, subdivision, differential fertility and sex differences in gamete frequencies, assortative mat- ing, migration and mixtures of subdivisions. It will be shown, however, that the value of Fls observed in the Gainj and Kalam is not unreasonable, given our sampling framework and the juxtaposition of those forces that would arise from the precontact breeding structure.
Consider a population with discrete generations that is subdivided into com- pletely isolated units. Allowing for separate sexes and random mating within subdivisions, it is well known (COCKERHAM 1973) that, after one generation, FIS is constant across generations (although FST and FIT can continuously in- crease) and Fls is negative. NEI (1973) has extended this model to allow for differential fertility of males and females (including concomitant sex differences in allele frequencies). He finds the expectation of Fls to be E(Fls ) = -[ 1/(8nm) -t 1/(8nf)], where n, and nj are, respectively, the effective numbers of males and females. When n~ and n, are equal, E(Fls ) is -1/(2ne), but when they differ, Fls becomes more negative. This formulation still assumes random mat- ing with respect to consanguinity, which includes brother-sister and other types of relative matings. Any avoidance of consanguinity serves to make FIS even more negative.
Turning to the Gainj and Kalam, the average effective population size of the parishes is estimated to be roughly 31 individuals. This figure is simply one-third of the average parish size. In addition to this small number, male and female contributions to the breeding population are uneven, due to polygyny, and marriages between close relatives are consciously avoided (JOHN- SON 1982). Given these considerations, we would expect FIs to be on the order of -0.02 if the above population structure model were realistic.
The most obvious departures of the Gainj and Kalam from this simple model are age structuring and migration between subdivisions. The effects of these factors are modeled by dividing the population into parental (postmigratory) and offspring (premigratory) age categories and finding the expectation of F ~ s within each group. We shall assume that, within each parish, the frequency of some arbitrary allele f(A1), is fl, in male parents and flf in female parents and
640 J. C. LONG
that genotypes in both sexes are close to their respective panmictic proportions. The parental group genotypes (combined males and females) will not be in panmictic proportions but rather,
where p is the average allele frequency, and U%(,, / ) is the between-sex variance in allele frequency. This variance in allele frequency can be manipulated to the form ci(,,f) = (%)om - pf)' (4 LI 1976, p. 64). Thus, the parents have a Wahlund sort of effect reducing the number of heterozygotes, and this effect can easily be expressed in terms of the sex difference in allele frequency. The expectation of FIs in parents is then Ep(FIS) = ~ ; ( ~ , ~ ) / p ( 1 - p ) .
The offspring distribution of genotypes is well known (ROBERTSON 1965);
where p , = p - ('h)(pf - p , ) and pf = p + (Yz)(pf - pm). The expectation of F1.y in the offspring portion of the population is then E,(F,~,) = - u % ( ~ , / ) / p(l - p ) , exactly the same magnitude as, but opposite in sign to, the parental value.
When the population subdivisions are not completely isolated, the expecta- tion of FIA is age structured. The expectation of Fls is then
W
where o is the oldest attainable age, F ( x ) and F, are the respective continuous and discrete age-specific F,S functions and C ( X ) and c, are, respectively, the continuous and discrete probability density functions giving the relative pro- portion of the population in each age category (CAVALLI-SFORZA and BODMER 1971, p. 298). It is apparent that estimation of FIS requires knowledge of the population age structure and that the sampling framework must reflect this knowledge in order to avoid seriously biased results. These are important considerations in the study population because there is a high interparish mi- gration rate (m = 0.45) and, by and large, postmarital residence is patrilocal, so migrant individuals are most often female. This system almost guarantees there will be a sex difference in allele frequencies within the adult members of a parish.
To help resolve the unusually high value of FIS observed in the Gainj and Kalam, the sample has been divided into two categories. For convenience, these are designated postmigratory and premigratory, although membership is de- termined solely on the basis of age. The premigratory category includes indi-
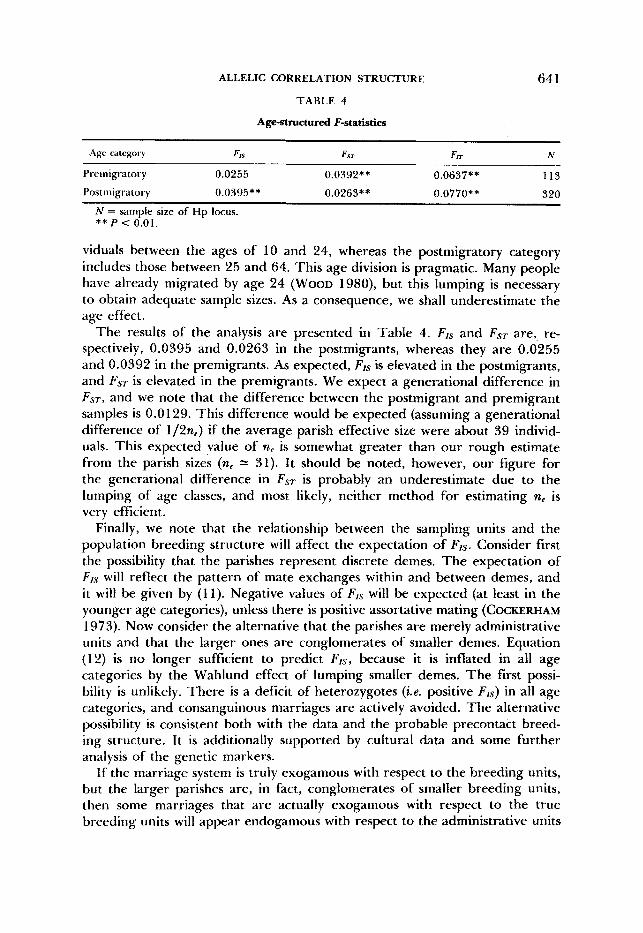
ALLELIC CORRELATION STRUCTURE 64 1 TABLE 4
Agestructured F-statistics
Age category FIS Fsr FIT N ~~
Preriiigratory 0.0255 0.0392** 0.0637** I13
Postmigratory 0.0395** 0.0263** 0.0770** 320
N = sample size of Hp locus. ** P c 0.01.
viduals between the ages of 10 and 24, whereas the postmigratory category includes those between 25 and 64. This age division is pragmatic. Many people have already migrated by age 24 (WOOD 1980), but this lumping is necessary to obtain adequate sample sizes. As a consequence, we shall underestimate the age effect.
The results of the analysis are presented in Table 4. FIs and FsT are, re- spectively, 0.0395 and 0.0263 in the postmigrants, whereas they are 0.0255 and 0.0392 in the premigrants. As expected, F,s is elevated in the postmigrants, and FST is elevated in the premigrants. We expect a generational difference in F A T , and we note that the difference between the postmigrant and premigrant samples is 0.0 129. This difference would be expected (assuming a generational difference of 1/2ne) if the average parish effective size were about 39 individ- uals. This expected value of ne is somewhat greater than our rough estimate from the parish sizes (n, 31). It should be noted, however, our figure for the generational difference in Fs, is probably an underestimate due to the lumping of age classes, and most likely, neither method for estimating ne is very efficient.
Finally, we note that the relationship between the sampling units and the population breeding structure will affect the expectation of F ~ s . Consider first the possibility that the parishes represent discrete demes. The expectation of Fl.\ will reflect the pattern of mate exchanges within and between demes, and it will be given by (1 1) . Negative values of Fls will be expected (at least in the younger age categories), unless there is positive assortative mating (COCKERHAM 1973). Now consider the alternative that the parishes are merely administrative units and that the larger ones are conglomerates of smaller demes. Equation (12) is no longer sufficient to predict FIS, because it is inflated in all age categories by the Wahlund effect of lumping smaller demes. The first possi- bility is unlikely. There is a deficit of heterozygotes (i.e. positive FIS) in a11 age categories, and consanguinous marriages are activeIy avoided. The alternative possibility is consistent both with the data and the probable precontact breed- ing structure. It is additionally supported by cultural data and some further analysis of the genetic markers.
If the marriage system is truly exogamous with respect to the breeding units, but the larger parishes are, in fact, conglomerates of smaller breeding units, then some marriages that are actually exogamous with respect to the true breeding units will appear endogamous with respect to the administrative units

642 J. C. LONG
(parishes). This proportion will be expected to increase with parish size, an observation already reported by JOHNSON (1 982).
We would also expect FIs to be lower (possibly negative) in smaller parishes and greater (positive) in larger parishes. To test this theory, the 21 parishes were divided into two groups. The first group contained 11 parishes with census sizes of less than 99 individuals, and the second group was composed of the 10 parishes with census sizes of more than 99 people. FIS was then calculated separately for each set of parishes. The respective values were -0.0148 and 0.0458, once again agreeing with the predictions.
The positive value of FIs is therefore consistent with the precontact breeding structure sampled within the framework of the postcontact administrative units. It is not consistent with the notion that the parishes are discrete breeding units.
INTERPRETATION OF Fir
We can conclude from the observed value of F I T (0.0568; P < 0.01) that there is a moderately high correlation between alleles within individuals rela- tive to the allelic array of the total population. This correlation is specific to the age categories appropriate to our sample and does not represent the level of correlation existing in the population as a whole. This is because F I T and F~$.,., like F,T, have age-structured expectations.
The effect of age structure on FST has already been worked out in detail for the migration matrix model of population structure (ROGERS and HARPENDING 1983). The general implications of age structure for FST are heuristically re- iterated below. Consider a subdivided population with migration between the subunits. A cohort of individuals is born within each subdivision; they grow to maturity, and migration between the subdivisions takes place. Mating follows migration, and the cycle is complete with the production of a new cohort within each subdivision. An ontogeny of genetic variation parallels this process. There is a certain level of differentiation among subdivisions at the beginning of the cycle. This level of differentiation is diminished after migration. A new increment is then accrued with the formation of the next generation. The magnitude of this sampling effect is approximately l/(2fie). Thus, genetic dif- ferentiation between the subdivisions oscillates with respect to the life cycle. When the homogenizing effects of migration and the diversifying effects of sampling are of equal magnitude, the level of differentiation remains constant across generations with respect to the phase of the life cycle. This leads to two conclusions: (1) a generational difference in FST will be expected, regardless of whether or not a between-generation equilibrium has been attained; and (2) in age-structured populations, the population value of FsT will be an average over age-specific expectations of FsT and the population age distribution. Fi- nally, given the effect of age structure on both FIS and FsT, the age structuring of FIT is obvious.
DISCUSSION
Despite the popularity of WRIGHT’S (1 95 1, 1965) F-statistic model, numerous alternative models and a plethora of estimation procedures have been sug-
ALLELIC CORRELATION STRUCTURE 643
gested in recent years (6 SPIELMAN, NEEL and LI 1977). This is because the model parameters, as defined by WRIGHT, are difficult to estimate and because there has not been an obvious extension of the model to multiallelic loci. The extension presented here is appealing because of its straightforward connection with the theory for diallelic loci and because of its simple preservation of WRIGHT’S correlational definitions of the parameters. As with COCKERHAM’S original (1969, 1973) use of the ANOVA format, approximate hypothesis testing procedures are available with this multiallelic extension. In addition, the treatment of information from a sample of different genetic loci follows without difficulty.
Application to genotypic data collected on Gainj- and Kalam-speaking people of Papua New Guinea has elucidated the relationship between their current social units and their population breeding structure. The pattern of the F- statistics indicates that the basic postcontact social units do not display the genetic characteristics of discrete demes, but rather, the larger parishes appear to be conglomerates of smaller breeding units. The current genetic structure thus reflects the traditional social organization in highland New Guinea de- scribed by GAJDUSEK and ALPERS (1972). That is a population fragmented into numerous small hamlets with extremely ephemeral social cohesion.
It is well known that estimates of FST are sensitive to the way the subdivisions are defined (NEEL and WARD 1972; JORDE 1980), and it is apparent that estimates of FJs are as sensitive. The consequence of lumping smaller breeding units is then the inflation of Fls and the deflation of FST. It is interesting that careful analysis of the FJs component has yielded the most insight into the Gainj and Kalam population structure. In retrospect, this should not be too surprising, as COCKERHAM (1973) has noted, FIs attains equilibrium rapidly and is more reflective of the immediate population breeding structure than the other parameters of the model.
The observation of positive FIS in the Gainj and Kalam distinguishes them from all other anthropological populations yet studied. For example, in the Yanomama and Makiritare Indians of South America and the Papago and Zuni tribes of North America, negative values of F,s are observed (NEEL and WARD 1972; WORKMAN et al. 1973, 1974). Negative values of FJS are characteristic of populations subdivided into discrete breeding units, and consequently, these groups are characterized by different breeding structures. FST has been esti- mated for many more populations than FlS (see JORDE 1980), and it has been claimed that high values of this statistic ( F S T > 0.04) are found primarily among tropical agriculturalists of restricted mobility, with substantially lower values characterizing hunter-gatherers of greater mobility (HARPENDING 1974). Al- though the Gainj and Kalam estimate of FsT, 0.0224, is higher than that fqr the !Kung hunter-gatherers, 0.007, studied by HARPENDING and JENKINS ( 1 973, 1974), it is only about one-third that observed for the horticultural Yanomama Amerindians, 0.063 (SPIELMAN, NEEL and LI 1977). This is so, despite the fact that the Gainj and Kalam are far more sedentary than the Yanomama. It is reasonable to hypothesize that this lower value of FST derives from the contin-
644 J. C. LONG
uous breeding structure of the Gainj and Kalam, rather than from the discrete Yanomama subdivisions.
Consequently, we find a more intricate relationship between socioecological settings and population breeding structures than has heretofore been realized. This conclusion prevents us from making sweeping generalizations about hu- man evolution and variation from the study of a few “typical” populations, but it presents the opportunity to pose more detailed questions about the covar- iation of human biological and social variation. From an optimistic viewpoint, we can expect to find new insight into the evolutionary significance of the forces of the population breeding structure by examining and comparing dif- ferent groups.
I should like to thank GEORGE ESTRARROOK, C . C. LI, FRANK LIVINGSTONE, JAMES V. NEEL, PAULA NEMETH and PETER SMOUSE for their comments on earlier drafts of this paper. Useful suggestions were also provided by two anonymous reviewers. The fieldwork depended on many Gainj and Kalam people, the Papua New Guinea Institute of Medical Research and PETER SMOUSE, PATRICIA JOHNSON, and JAMES WOOD. Financial support of this research was provided by National Institutes of Health grants NIH R01 GM30135 and NIH T32 GM07544 and a Dissertation grant frotn the Horace H. Rackhani School of Graduate Studies, University of Michigan.
LITERATURE CITED
ANDERSON, T. W., 1958 A n Zntroduction to Multivariate Statistics. John Wiley XC Sons, New York.
CAVAI.I.I-SFORZA, L. L., I . BARRAI and A. W. F. EDWARDS, 1964 Analysis of human evolution
The Genetics of Human Populations. W. H.
under random genetic drift. Cold Spring Harbor Symp. Quant. Biol. 29 29.
CAVALLI-SFORZA, I,. L. and W. F. BODMER, 1971 Freeman, San Francisco.
COCKERHAM, C. C., 1969
COCKERHAM, C. C. 1973
CURIE-COHEN, M., 1982
<;AJDUSEK, 11. C. and M. ALPERS, 1972
Variance of gene frequencies. Evolution 23: 72-84.
Analyses of gene frequencies. Genetics 74: 679-700.
Estimates of inbreeding in a natural population. Genetics 100 339-38.
Genetic studies in relation to kuru. Am. J. Hum. Genet. 24 (Suppl): slLs38.
243. HARPENDING, H. C., 1974 Genetic structure of sniall populations Annu. Rev. Anthropol. 3: 229-
HARPENDING, H. C. and T. JENKINS, 1973 Genetic distances among Southern African popula- tions. In: Methods and Theories of Anthropological Genetics, Edited by M. H . CRAWFORD and P. L. WORKMAN. University of New Mexico Press, Albuquerque.
by J. F. CROW and C. F. DENNISTON. Plenum Press, New York. HARPENI)IN(;, H. C. and T. JENKINS, 1974 !Kung population structure. In: Genetic Distance, Edited
HOGBIN, I . and C. Wr;.txwooD, 1952
JOHNSON, P. l . . , 1982
Local grouping in Melanesia. Oceania 23: 241-276
Gainj kinship and social organi7ation. Ph.D. Dissertation, University of
The genetic structure of subdivided human populations: review. In : Current Developments in Anthropological Genetics, Vol. 1. Theory and Methods, Edited by H. Mielke and M. H. Crawford. Plenum Publishing Corp., New York.
I , I . C . C., 1969 Population subdivision with respect to multiple alleles. Ann. Hum. Genet. 33: 23-29.
Michigan, Ann Arbor.
JORIE, I.. B., 1980
ALLELIC CORRELATION STRUCTURE 645
1.1, C. C., 1976 Population Genetics, Boxwood Press, Pacific Grove, California.
1.1, C. C. and D. G. HORVITZ, 1953 Some methods of estimating the inbreeding coefficient. Am. J. Hum. Genet. 5: 107-117.
T h e estimation of genetic variation and divergence: application to Gainj and Kalam speakers of highland New Guinea. Ph.D. Dissertation, University of Michigan, Ann Arbor.
LONG, J. C., J. M. NAIDU, H. W. MOHRENWEISER, H. GERSHOWITZ, P. JOHNSON, J. W. WOOD and P. E. SMOUSE, 1985 Genetic characterization of Gainj and Kalam speaking people of Papua, New Guinea. Am. J. Phys. Anthrop. In press.
Intermarriage patterns and blood group gene frequencies of the Bundi people of the New Guinea highlands. Hum. Biol. 43: 187-199.
Multivariate Analysis. Academic Press, New
Clans as genetic barriers. Am. Anthropol.
T h e genetic structure of a tribal population, the Yanomama Indians. VI. Analysis by F-statistics (including a comparison with the Makiritare and Xavante). Genetics 72: 639-666.
NEI, M., 1973 Analysis of gene diversity in subdivided populations. Proc. Natl. Acad. Sci. USA
NEI, M., 1977 F-statistics and the analysis of gene diversity in subdivided populations. Ann. Hum.
Drift variances of FST and GsT statistics obtained from a
h N G , J. C., 1984
MALCOLM, L. A., P. B. BOOTH and L. L. CAVALLI-SFORZA, 1971
MARDIA, K. V., J. T. KENT and J. M. BIBBY, 1980
MORTON, N . E., Y. IMAIZUMI and D. E. HARRIS, 1971
York.
73: 1005- 10 10.
, J. V. and R. H. WARD, 1972
7 0 3321-3323.
Genet. 41: 22-233.
NEI, M. and A. CHAKRAVARTI, 1977 finite number of isolated populations. Theor. Pop. Biol. 3: 460-465.
Honiewood, Illinois. NETER, J. and W. WASSERMAN, 1977 Applied Linear Statistical Models. Richard D. Irwin, Inc.,
T h e interpretation of genotypic ratios in domestic animal populations.
Deviations from Hardy-Weinberg proportions: sampling
ROGERS, A. R. and H. C. HARPENDING, 1983 Population structure and quantitative characters.
ROBERTSON, A., 1965 Anim. Prod. 7: 319-324.
ROBERTSON, A. and W. G. HILL, 1984 variances and use in estimation of inbreeding coefficients. Genetics 107: 703-71 8.
Genetics 105: 985-1002.
SCHEFFE, H., 1959
SIMMONS, R. T . , J. J. GRAYDON, D. C. GAJDUSEK, M. P. ALPERS and R. W. HORNABROOK, 1972 Genetic studies in relation to kuru. 11. Blood-group genetic patterns in Kuru patients and populations of the eastern highlands of New Guinea. Am. J. Hum. Genet. 24 (Suppl): "7 1 .
SMOUSE, P. E., J. V. NEEL and W. LIU, 1983 Multiple-locus departures from panmictic equilib- rium within and between village gene pools of Amerindian tribes at different stages of ag- glomeration. Genetics 104 133-153.
On the chi-square test for homogeneity. Iowa State J. Sci.
Inbreeding estimation from population data:
Estimating F-statistics for the analysis of population
The Analysis of Variance. John Wiley & Sons, Canada.
SNEDECOR, G. and M. R. IRWIN, 1933
SPIELMAN, R. S., J. V. NEEL and F. H. F. LI, 1977
WEIR, B. S . and C. C. COCKERHAM, 1984
8: 7-81.
models, procedures and implications. Genetics 8: 3-37 1.
structure. Evolution 38: 1358-1 370.
646 J. C. LONG
U’EISENFELD, S. I, . and D. C;. GAJDUSEK, 1976 Genetic structure and heterozygosity in the kuru
hlechanisnis of demographic equilibrium in a small human population, the
region, eastern highlands of New Guinea. Am. J. Phys. Anthropol. 4: 177-190.
WOOD, J. W., 1980 Gainj of Papu;i New Guinea. Ph.D. Dissertation, University of Michigan, Ann Arbor.
WOOD, J. W., P. E. S M ~ U ~ E and J. C. LONG, 1985 Sex-specific dispersal patterns in two human populations of highland New Guinea. Am. Nat. 125: 747-768.
WORKMAN, P. l.., 1969 T h e analysis of simple genetic polymorphisms. Hum. Bioi. 41: 97-114.
WORKMAN, P. I . . , H. HARPENDING, J. M. LALOUEL, C. LYNCH, J. D. NISWANDER and R. SINGLETON, 1973 Population studies on southwestern Indian tribes. VI. Papago population structure: a comparison of genetic and migration analyses. In: Genetic Structure of Populations, Edited by N. MoR~oN. University of Hawaii Press, Honolulu.
WORKMAN, P. I,. and J. D. NISWANDER, 1970 Population studies on southwestern lndian tribes. Am. J. Hum. Genet. 22: 24-49.
WORKMAN, E’. L., J. D. NISWANDER, K . S. BROWN and W. C. LEYSHON, 1974 Population studies on Southwestern Indian tribes. IV. The Zuni. Am. J. Phys. Anthropol. 41: 119-132.
WRIGHT, S., 1943
WRIGHT, S., 1951
WRIGHT, S. , 1965
Isolation by distance. Genetics 28: 114-138.
The genetical structure of populations. Ann. Eugen (Lond.) 1: 323-34.
T h e interpretation of population structure by F-statistics with special regard to systenis of mating. Evolution 19: 39-420.
Communicating editor: B. S. WEIR
APPENDIX: COMPUTATIONAL METHODS
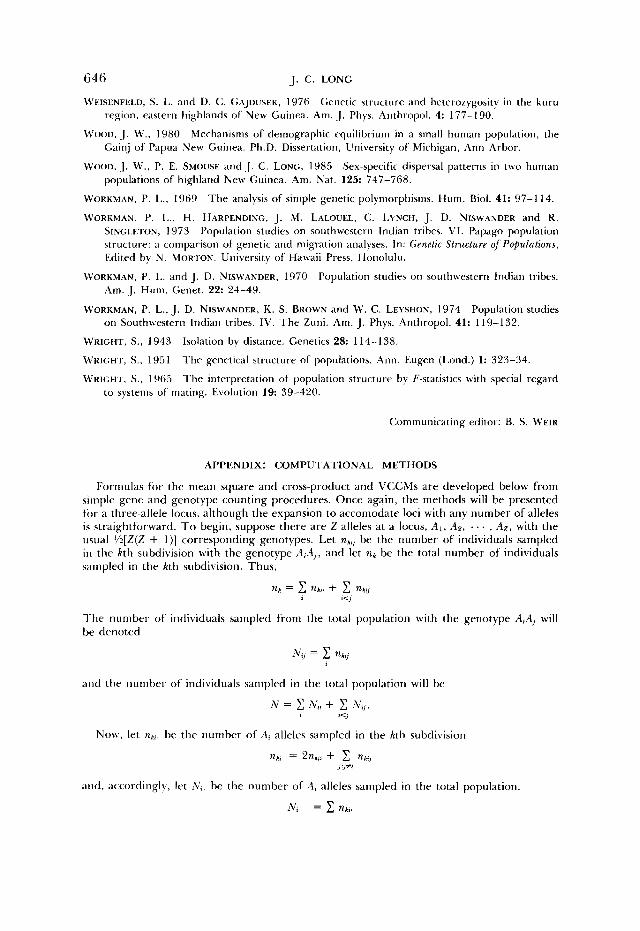
Formulas for the mean square and cross-product and VCCMs are developed below from simple gene and genotype counting procedures. Once again, the methods will be presented for a three-allele locus, although the expansion to accomodate loci with any number of alleles is straightforward. To begin, suppose there a re Z alleles at a locus, A, , A*, . . . , . 4 ~ , with the usiial i/?[Z(Z + l)] corresponding genotypes. Let nh,] be the number of individuals sampled in the kth subdivision with the genotype &Al, and let nk be the total number of individuals sunpled in the kth subdivision. Thus,
T h e number of individuals sampled from the total population with the genotype A,Al will be denoted
and the number of individuals sampled in the total population will be
Now, let nkl be the number of A, alleles sampled in the kth subdivision
nk, = %,, + C nk,, J Jfl
a d , ,iccordingly, let ATt be the number of A, alleles sampled in the total population.
N, = nh,.
ALLELIC CORRELATION STRUCTURE
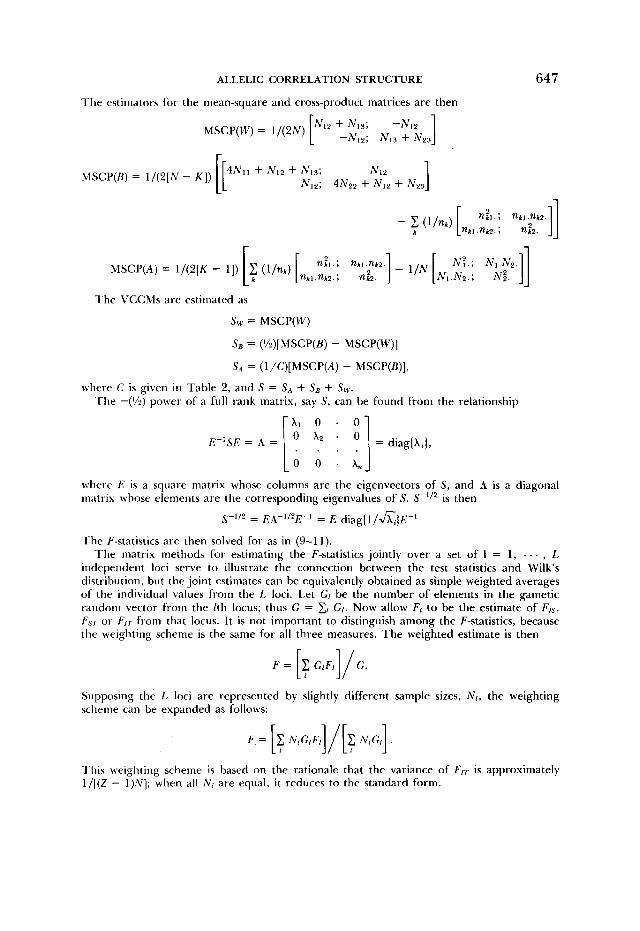
T h e estimators for the mean-square and cross-product matrices a re then
647
k
r
NT.; N l . N 2 . ] ] N , . N z . ; NB.
T h e VCCMs are estimated as
Sw = MSCP(W)
Se = (%)[MSCP(B) - MSCP(W)]
S A = (l/C)[MSCP(A) - MSCP(B)],
where C is given in Table 2, and S = SA + SB + Sw. T h e -(%) power of a full rank matrix, say S, can be found from the relationship
E-’SE = A = ;z 1 :] = diag(X,),
where E is a square matrix whose columns are the eigenvectors of S, and A is a diagonal matrix whose elements are the corresponding eigenvalues of S. S--L’2 is then
S--L’2 = EA-”2E-l = E diag(l/&)E-’
O O . X ,
T h e F-statistics a re then solved for as in (9-1 1 ) . T h e matrix methods for estimating the F-statistics jointly over a set of I = 1, . . . , L
independent loci serve to illustrate the connection between the test statistics and Wilk’s distribution, but the joint estimates can be equivalently obtained as simple weighted averages of the individual values from the L loci. Let Gi be the number of elements in the gametic random vector from the Ith locus; thus G = X I G I . Now allow FL to be the estimate of Frs, F,I. or FrT from that locus. I t is not important to distinguish among the F-statistics, because the weighting scheme is the same for all three measures. T h e weighted estimate is then
Supposing the L loci a re represented by slightly different sample sizes, N , , the weighting scheme can be expanded as follows:
l‘his weighting scheme is based on the rationale that the variance of FIT is approximately 1/[(Z - 1)NJ; when all N I are equal, it reduces to the standard form.