Embed Size (px)
Citation preview

RESEARCH ARTICLE Open Access
Natural allelic variations of Saccharomycescerevisiae impact stuck fermentation due tothe combined effect of ethanol andtemperature; a QTL-mapping studyPhilippe Marullo1,2* , Pascal Durrens3,4, Emilien Peltier1,2, Margaux Bernard1,2, Chantal Mansour2
and Denis Dubourdieu1ˆ
Abstract
Background: Fermentation completion is a major prerequisite in many industrial processes involving the bakeryyeast Saccharomyces cerevisiae. Stuck fermentations can be due to the combination of many environmental stresses.Among them, high temperature and ethanol content are particularly deleterious especially in bioethanol and redwine production. Although the genetic causes of temperature and/or ethanol tolerance were widely investigated inlaboratory conditions, few studies investigated natural genetic variations related to stuck fermentations in highgravity matrixes.
Results: In this study, three QTLs linked to stuck fermentation in winemaking conditions were identified by using aselective genotyping strategy carried out on a backcrossed population. The precision of mapping allows theidentification of two causative genes VHS1 and OYE2 characterized by stop-codon insertion. The phenotypic effectof these allelic variations was validated by Reciprocal Hemyzygous Assay in high gravity fermentations (> 240 g/L ofsugar) carried out at high temperatures (> 28 °C). Phenotypes impacted were mostly related to the late stage ofalcoholic fermentation during the stationary growth phase of yeast.
Conclusions: Our findings illustrate the complex genetic determinism of stuck fermentation and open newavenues for better understanding yeast resistance mechanisms involved in high gravity fermentations.
Keywords: QTL, OYE2, VHS1, Subtelomeric region, Wine yeast, Temperature, Ethanol
BackgroundThe yeast Saccharomyces cerevisiae presents huge gen-etic and phenotypic variability that has been recentlycaptured at a large scale level [1]. Beside its worldwidepresence in natural habitat, this species is characterizedby domesticated strains used in several industrial pro-cesses as biofuel, wine, sake, brewery, and bakery [2].Such strains are specifically adapted to transform sugarsin ethanol thought the alcoholic fermentation. One com-mon feature of all industrial strains is the ability to
ensure a complete sugar to ethanol conversion sincestuck fermentations cause economical prejudice in in-dustry. Most of the environmental factors affecting stuckfermentation have been widely reviewed and partiallydepend on the industrial application [3, 4]. Stuck fer-mentations may result from the combination of manydifferent stresses including high ethanol content [5, 6],low pH [6, 7], presence of toxins [8, 9], oxygen or nitro-gen depletion [10], bacterial contaminations [11, 12],and high temperature [5, 6, 13]. Among others, the com-bination of high ethanol content and high temperaturehas been reported to be particularly deleterious for yeastphysiology [5, 6, 14]. This is the case for many industrialprocesses where elevated temperature and high ethanolcontent are met. Therefore, understanding tolerance
© The Author(s). 2019 Open Access This article is distributed under the terms of the Creative Commons Attribution 4.0International License (http://creativecommons.org/licenses/by/4.0/), which permits unrestricted use, distribution, andreproduction in any medium, provided you give appropriate credit to the original author(s) and the source, provide a link tothe Creative Commons license, and indicate if changes were made. The Creative Commons Public Domain Dedication waiver(http://creativecommons.org/publicdomain/zero/1.0/) applies to the data made available in this article, unless otherwise stated.
* Correspondence: [email protected]ˆDeceased1University of Bordeaux, ISVV, Unité de recherche OEnologie EA 4577, USC1366 INRA, 33140 Bordeaux INP, Villenave d’Ornon, France2Biolaffort, 33100 Bordeaux, FranceFull list of author information is available at the end of the article
Marullo et al. BMC Genomics (2019) 20:680 https://doi.org/10.1186/s12864-019-5959-8

mechanisms of fermenting yeast in high temperatureand high gravity matrixes is of particular interest. First,in bioethanol industry where Simultaneous Saccharifi-cation and Fermentation (SSF) at high temperature(35–41 °C) are frequently used [15]. Second, in moretraditional food related fermentations; and in particu-lar in red winemaking where the floating cap reachestemperatures significantly higher than those of thebulk liquid, 32–37 °C [16, 17].In order to improve yeast temperature tolerance dur-
ing alcoholic fermentation, several genetic strategieshave been developed such as mutagenesis [18, 19], adap-tive evolution [20, 21] and breeding strategies [5, 6]demonstrating that the fermentation completion of highgravity media at elevated temperatures is a complexquantitative trait. Beside these applied researches, theability to growth at high temperature was investigated inlaboratory conditions. Particularly tolerant strains werefound in clinical samples [22], tropical fruits [23] orcachaça brews [24]. These strains, able to growth in la-boratory media at up to 42 °C, were used for implement-ing quantitative genetic approaches carried out instandard laboratory media [25]. The genetic basis ofHigh Temperature Growth (HTG) revealed to be par-ticularly complex highlighting the existence of epistaticnetworks involving multiple genes and their allelic varia-tions [26–29]. However, these studies were mostly car-ried out in physiological conditions that are far from theindustrial reality. Indeed, many stresses (including thetemperature) impact the yeast physiology during the sta-tionary growth phase at high ethanol concentration level.In such conditions, the identification of natural geneticvariations preventing stuck fermentation were scarcelyidentified.In a previous work, we constructed by successive back-
crosses a Nearly Isogenic Lineage (NIL) improved for itsfermentation performance at 28 °C [5]. In this lineage,nearly 93% of the genome is identical to one parentalstrain showing stuck fermentation at elevatedtemperature. The remaining 7% of the genome containsheterozygous genetic regions that prevent stuck fermen-tation. In the present work, this genetic material wasused for carrying out a QTL mapping using a selectivegenotyping strategy. Three main QTL were identifiedand two of them were dissected at the gene level leadingto the identification of two causative genes encoding theproteins Oye2p and Vhs1p. The third locus mapped wasthe subtelomeric region of the chromosome XV thatcould play a role in this complex trait.
ResultsGenetic material and experimental designAmong many others, the temperature is an impactingfactor that influences the fermentation completion [30].
In a previous study, we demonstrated that this par-ameter induced stuck fermentations for many wineindustrial starters when they are steadily fermented at28 °C. In contrast, in the same media, most of themachieved the fermentation when the temperature wasmaintained at 24 °C. For another group of strains, thetemperature change did not affect the fermentationcompletion. These observations suggested a differen-tial susceptibility to temperature in high gravitymedium that was previously defined as thermo-sensi-tive/tolerant trait [5]. More generally, the phenotypicdiscrepancy results in an overall resistance to harshfermentative conditions which constitutes a complextrait depending many genetics and environmentalconditions. Among various wine yeast strains, thisphenotypic discrepancy is particularly high for themeiotic segregants B-1A and G-4A, which are derivedfrom commercial starters Actiflore BO213 and Zyma-flore F10, respectively (Laffort, FRANCE) (Table 1). In abreeding program, the hybrid H4 was obtained by succes-sive backcrosses using the tolerant strain, B-1A as thedonor and the sensitive strain, G-4A as the recipient strain(see Fig. 1a). These backcrosses were driven by selectingrecursively the meiotic segregants showing the best fer-mentation completion in high gravity synthetic mediumfermented at 28 °C [5]. The resulting hybrid H4 had astrong genetic similarity (~ 93%) with the recipient back-ground G-4A but also inherited some genetic regionsfrom B-1A conferring a more efficient fermentation(Fig. 1a).The aim of the present study is to identify the genetic
determinisms explaining the phenotypic variance ob-served in this nearly isogenic population by applyingQTL mapping approach. The overall strategy is pre-sented in the Fig. 1(b and c). Initially, the phenotypicsegregation of fermentation traits was investigated in77-segregants of H4. Then, seven extreme individualsleaving the lowest concentration of residual sugarswere individually genotyped by Affymetrix® Tiling micro-array. This selective genotyping step allowed thelocalization of genomic regions inherited from B-1A thathave been introgressed in the G-4A genome during thebackcross. Finally, numerous segregants (~ 160) belongingto two backcrossed hybrids (H4 and H5) were genotypedusing Kompetitive Allele Specific PCR markers (KASP™).A linkage analysis identified three QTLs, two them weremolecularly dissected by Reciprocal Hemizygous Assay.
Phenotypic characterization of H4 progenyThe parental strains (B-1A, G-4A), the hybrid H4,and 77 H4-meiotic segregants were fermented in asynthetic grape must containing 260 g/L of sugar at28 °C (see methods). Most of the strains showed stuckfermentation due to the harsh conditions applied. The
Marullo et al. BMC Genomics (2019) 20:680 Page 2 of 17

overall phenotypic characterization was carried out bymeasuring eight quantitative traits (Table 2). According tothe phenotype, the heritability h2 in the H4 progenyranged from 2.5 to 86.9%. Kinetic traits in relation withthe early part of alcoholic fermentation (LP, T35, T50)were poorly heritable and are not statistically differentwithin the parental strains. None of these traits were fur-ther investigated due to their low heritability. The lack ofsegregation within the offspring suggests that all the segre-gants share similar phenotypes in the first part of the fer-mentation which correspond to the growth phase. Thisobservation has been previously reported for one particu-larly tolerant segregants of H4 showing growth parametersvery similar to the parental strain G-4A [5]. In contrast,traits linked to the late part of the fermentation (T70, rate50–70, ethanol produced, CO2max, Residual Sugars (RS))had a high variability. This is the case of the ResidualSugars at the end of the alcoholic fermentation (Fig. 2a).For this trait, the parental strains values are 0.1 and30.3 g/L for B-1A and G-4A, respectively. A completeoverview of the trait segregation is given for all thetrait investigated (Additional files 1 and 2). The con-trasted segregation between early and late fermenta-tion traits indicates that the underlining geneticdeterminisms would be linked to modification of thephysiological state of fermenting strain occurring inthe stationary growth phase. Since they are stronglycorrelated each together (Additional file 3), only twofermentation traits (Residual Sugar and T70) showingthe highest heritability were investigated by QTL mapping.
Narrowing introgressed loci by selective genotyping withAffymetrix® tiling microarrayIn order to identify QTLs, a selective genotyping ap-proach was implemented. First, the genomic DNA of theparental strains G-4A and B-1A were hybridized on
Yeast Tiling Microarray (YTM). Using the algorithmSNP Scanner described by Gresham et al. [32]; 18601and 12848 SNP were detected with respect to the refer-ence genome (Saccharomyces cerevisiae S288C strain,R49.1.1, 2005) for the strains B-1A and G-4A, respect-ively. Among these SNP, 3397 non-common positionswere found defining putative markers between the par-ental strains (Additional file 4). The correct assignationof these predicted SNP was verified by checking theirposition with the complete sequence of the parentalstrains obtained by whole genome sequencing taking asreference the (Saccharomyces cerevisiae S288C strain,(version Apr2011/sacCer3) (Additional file 4). As the al-gorithm was not able to predict exactly the position ofthe SNP, a search window was defined with various in-tervals ranging from 5 to 20 bp. More than 80% of thedetected SNP were located at least than 10 bases of theposition predicted by YTM. However, only 1204 pre-dicted SNP were correctly assigned meaning that in ourexperiment the False Discovery Rate of YTM was closeto 65%. Nevertheless, the 1204 validated SNP constitutesreliable bi-allelic markers covering the most part of thegenome. According to the inheritance of parental strains(B-1A and G-4A), these markers were thereafter named“B” and “G”, respectively. The inheritance of this set ofmarkers was investigated in the H4 segregants. In orderto reduce the genotyping cost, only seven H4 segregantswere individually genotyped by YTM. These segregantswere selected on the basis of their ability to achievedthe most part of the alcoholic fermentation accordingto their RS values (Fig. 2a). They represent the bestdecile of the H4-progeny which is sufficient to narrowthe main genetic regions containing QTLs [33]. Dueto recurrent backcrosses operated, only 192 markers(green ticks) inherited from B-1A were detected inthe genome of the seven progenies genotyped. The
Table 1 Yeast strains used
Strain Background/description Relevant genotype a Reference
G-4A Meiotic segregant of Zymaflore F10 Mat a/Mat alpha; HO/HO; OYE2G/OYE2G; VHS1G/VHS1G [5]
B-1A Meiotic segregant of Actiflore BO213 Mat a/Mat alpha; HO/HO; OYE2B/OYE2B; VHS1B/VHS1B [5]
H4 4th-backcross hybrid G-4A X B-1A Mat a/Mat alpha; HO/HO; OYE2G/OYE2B; VHS1G/VHS1B [5]
H4-2C H4 Meiotic segregants Mat a/Mat alpha;HO/HO; OYE2B/OYE2B; VHS1B/VHS1B This study
H4-19B H4 Meiotic segregants Mat a/Mat alpha; HO/HO; OYE2B/OYE2B; VHS1B/VHS1B This study
H5 Hybrid H4-2C x H4-19B Mat a/Mat alpha; HO/HO; OYE2B/OYE2B; VHS1B/VHS1B This study
H4-OYE2-G H4 Mat a/Mat alpha; HO/HO; OYE2G/OYE2B::kanMX4; VHS1G/VHS1B This study
H4-OYE2-B H4 Mat a/Mat alpha; HO/HO; OYE2G::kanMX4/OYE2B; VHS1G/VHS1B This study
H4-VHS1-G H4 Mat a/Mat alpha; HO/HO; OYE2G/OYE2B; VHS1G/VHS1B::kanMX4 This study
H4-VHS1-B H4 Mat a/Mat alpha; HO/HO; OYE2G/OYE2B; VHS1G::kanMX4/VHS1B This study
Y02873 BY4741 Mat a; his3Δ1; leu2Δ0; met15Δ0; ura3Δ0; YHR179w::kanMX4
Y03606 BY4741 Mat a; his3Δ1; leu2Δ0; met15Δ0; ura3Δ0; YDR247w::kanMX4aFor OYE2 and VHS1 the exponents G and B indicate the allelic variations for the strains G-4A and B-1A, respectively
Marullo et al. BMC Genomics (2019) 20:680 Page 3 of 17

Fig. 1 Genetic material and experimental design. a summarizes the construction of the genetic material used in this study. The H4 hybrid wasobtained by a backcross program using the parental strains G-4A (G) and B-1A (B). The F1-hybrid was sporulated and the resulting segregantswere phenotyped for their fermentation performance at 28 °C. The segregant leaving the smallest quantity of residual sugars was cross with thestrain G-4A. This procedure was recurrently done four time in order to get the hybrid H4 that constitutes the starting point of this present study[5]. Phenotypic comparison of the hybrid H4 and G illustrates that fermentation efficiency of H4 was specifically improved at 28 °C as reported byMarullo et al. [5]. b describes the strategy used for mapping the chromosomal portion of the strain B-1A present in the hybrid H4. In order tonarrow the most relevant regions, a selective genotyping approach was applied. Seventy-seven H4-segregants were fermented and the sevenbest ones were genotyped by combining Tiling Microarray (Affymetrix®) and whole genome sequencing. c describes the QTL mapping strategyapplied that was carried out by developing qPCR-based markers (KASP™ technology) in order to achieve a linkage analysis using up to 160segregants. Candidates genes identified were then validated by reciprocal hemizygosity assay (RHA)
Marullo et al. BMC Genomics (2019) 20:680 Page 4 of 17

remaining 1012-markers were inherited from the parentalstrain G-4A (red ticks). The B-specific markers weremainly clustered in 12 genomic regions localized in 11chromosomes (Fig. 2b). Half of them (89 green dots) werefound in more than 4 of the 7 progenies genotyped. Sincethey are more frequently found in the best progenies,those regions are supposed to encompass the B-specificmarkers allowing a more complete fermentation. Accord-ing to the segregant, the proportion of B-markers was verysimilar, ranging between 14.3 and 16.9%. This ratio is a bithigher than expected for a 4 times backcrossed hybrid butclearly confirms that the genetic imprinting of parent B-
1A has been reduced by the backcross procedure as previ-ously demonstrated by a microsatellite analysis [5]. Fromthe 192 B-markers identified, we selected a subset of posi-tions in order to genotype a larger population. On thebasis of parental genome sequence, 43 KASP™ markers lo-calized in the 12 genomic regions were designed (Fig. 2b);their genomic positions are given in (Additional file 5).
Sequential QTL mapping in two NIL populations identifiesthree loci linked to stuck fermentationThe 77 segregants of the backcross hybrid H4 were ge-notyped by using the KASP™ markers (LGC genomic
Table 2 Phenotypes of parental strains and for the H4 progeny
Trait G-4A B-1A H4 Parental differences H4-progeny (n = 77)a
mean SE (n = 4) mean SE (n = 4) mean SE (n = 4) (Wilcox test p value) range h2
CO2max (g.L−1) 95.9 1.6 118.2 0.8 108.3 1.2 9.5E-06 93.8–117.45 69.6
LP (h) 4.0 1.0 4.0 0.0 3.9 0.5 ns 3.0–6.5 < 5
T35 (h) 43.6 2.1 55.5 8.5 47.1 2.1 ns 54.0–92.0 < 5
T50 (h) 70.8 3.7 75.5 4.5 73.0 3.2 ns 34.0–47.6 < 5
T70 (h) 147.2 3.8 106.5 2.5 126.0 2.8 2.0E-4 92.3–173.5 86.9
rate 50–70 (g.L−1.h−1) 0.23 0.02 0.49 0.03 0.22 0.02 1.0E-4 0.20–0.53 51.1
RS (g.L−1) (Residual Sugars) 30.3 3.18 0.1 0.03 17.29 0.9 6.0E-4 3.5–51.5 79.4
Ethanol (%Vol) 12.1 0.17 14.3 0.12 13.98 0.15 6.0E-4 11.8–14.7 77.5aFermentations were done in duplicateSE stands for standard error computed for four replicates, ns stands for no significative, h2 stands for heritability and was calculated according to Marullo etal. [31]
Fig. 2 QTL regions narrowed by selective genotyping. a. Distribution of the residual sugars found at the end of the alcoholic fermentation for the77 H4-segregants and for the parental strains. The average values of parental strains and H4-hybrid were indicated by green (B-1A), red (G-4A)and black squares (H4-hybrid). The segregants values are the means of experimental duplicates, the seven best progenies (black dots) wereselected for narrowing the QTL regions. b, Physical map of all the B-1A and G-4A specific markers inherited in the seven H4 progenies. Each thickis one of the 1204 bi-allelic markers selected. The B and G alleles are shown in green and red, respectively. The green dots are the SNP that werefound in more than four segregants defining 12 chromosomal regions
Marullo et al. BMC Genomics (2019) 20:680 Page 5 of 17
company, UK). This technique allows the detection ofSNP inheritance by using a qPCR method with la-beled primers [34]. The correct Mendelian segregationof these 43 SNP in this population was confirmed(chi2 test, α = 0.05) as well as the homozygous statusof each segregant (> 99% of the SNPs). A linkage ana-lysis was carried out by using a non-parametric test(Wilcoxon test, α = 0.05) with a significant thresholdfixed by 1000 permutations as previously described[35]. The use of non-parametric test was justified bythe heterogeneity of variance of the phenotype inves-tigated. Two main QTLs localized on the chromo-some IV and VIII were mapped for phenotypes RSand T70 (Fig. 3a and b). The maximum linkage valueswere found for the markers IV_953 and VIII_464. Forboth loci, the B-1A inheritance conferred an im-proved phenotype, which is in accordance with paren-tal strains phenotypes (Fig. 3c and d). The part ofvariance explained by those QTLs ranged between15.6 and 25.8% according to the trait and the locus(Table 3). The analysis of variance of the linear modeldescribed an additive effect without interaction.This first genetic mapping captures only 40% of the
total variance observed within H4 progeny suggestingthat other QTLs playing a minor role were not yet de-tected. More complex mapping methods integrating the
QTL position as cofactors failed to detect any other loci(data not shown), likely due to the relatively small num-ber of segregants analyzed and the low density of themap. According to the strategy proposed by Sinha et al.[27], the effect of the two major QTLs was removed byperforming an additional cross. We selected two H4 seg-regants (H4-19B and H4-2C) showing a B-alleles inherit-ance for the QTLs IV_953 and VIII_464. These cloneswere selected in order to maximize their phenotypic dis-tance for RS (close to 30 g/L). The resulting hybrid H5was heterozygous for only 23 loci localized in 8 chromo-somal regions (Additional file 5).A population of 84 segregants of the H5 hybrid was
then isolated, phenotyped and genotyped in the sameway than for H4 segregants. The phenotypic segregationof this population is given in the Table 4. Although thetrait heritability was lower than for H4 progeny, sometraits of interest such RS and T70 are clearly inheritableand showed a wide segregation. This lower heritability islikely due to the fact that traits were measured withoutreplicates in order to maximize the number of segre-gants tested. This choice can be justify by the fact themost important factor affecting QTL-mapping efficiencyis the number of individuals rather than the phenotypemeasurement accuracy [33]. A new linkage analysisallowed the detection of one additional QTL localized in
Fig. 3 Linkage analysis in the H4 progeny. a and b show the linkage score expressed in – log of pvalue (Wilcox-Mann-Withney test) for the 43qPCR markers used for QTL mapping of Residual sugars and T70, respectively. The dot colors represent markers on different chromosomes. The p-value thresholds of False discovery Rate (FDR 10 and 5%) were estimated by permutation tests (n = 1000) and are shown by tight and widedotted lines, respectively. c and d. Trait distribution among the H4 progeny according to the inheritance at the loci VII-464 and IV-953 forResidual Sugars (g/L) and T70 (h), respectively. The parental values are indicated at the left part of the dot plot. The seven progenies selectedwere indicated by diamonds symbols. The letters G and B stands for G-4A and B-1A inheritance, respectively
Marullo et al. BMC Genomics (2019) 20:680 Page 6 of 17

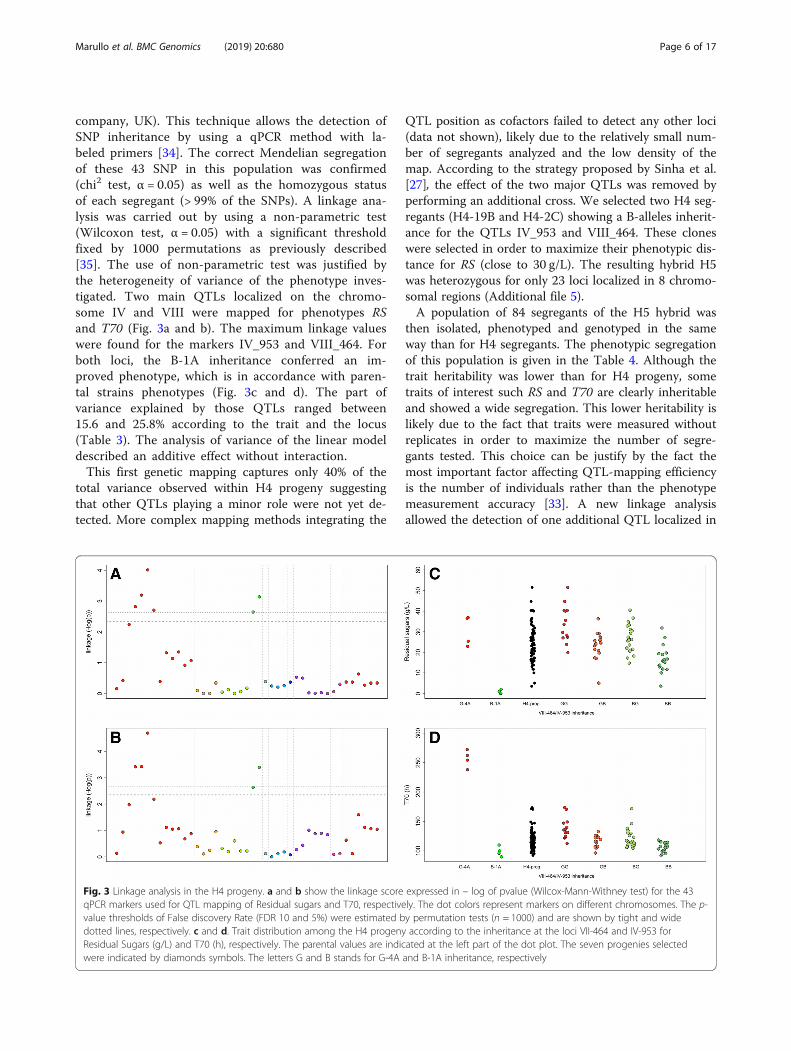
the subtelomeric region of chromosome XV (Fig. 4a).The maximum peak linkage was found for the markerXV_1051. Surprisingly, for this locus the G-4A allele waslinked to a more efficient fermentation for both RS andT70 traits. One-way analysis of variance indicates thatonly 7.5% of the total variance was explained by thisQTL in the H5 progeny (Table 3).
Impact of the NADPH oxidoreductase Oye2p on stuckfermentation in high sugars and temperatures conditionsWe first investigated the QTL VIII_464 by analyzingthe genomic sequence of both parental strains neigh-boring 15 kb from the best marker found. This region(456000 to 472000 bp) encompassed 7 genes; four ofthem (STB5, OYE2, YHR180W, YHR182W) showednon-synonymous SNP between the parental strains(Additional file 6). At less than 2 kb of the QTL peak,a deletion at the position genomic position 462732(c.229_230delTC) produced a frame-shift mutation inthe OYE2 gene of the parental strain G-4A (p.Ser77f-sTer95). The resulting ORF produces a truncated pro-tein of only 95 amino acids instead of the 400expected in the full-length protein. This two-bases de-letion was thereafter named OYE2G allele. In contrast,the strain B-1A has the same sequence than the refer-ence genome (S288c) encoding for a full-length pro-tein form (thereafter named OYE2B). By screeninggenome databases, we did not detect this specific de-letion in other 100 strains (data not shown). However,two other strains carry missense polymorphisms that
generate truncated Oye2p proteins OS104 (p.Gly73fs)and S294 (p.Gln176*) (Fig. 5a).In order to test the impact of this candidate gene,
Reciprocal Hemizygous Assay (RHA) [25] was imple-mented. This method allows the comparison of eachparental allele in the H4-hybrid background. The strainsH4-OYE2-G and H4-OYE2-B were obtained by using adeletion cassette. These hemizygous hybrids had geno-types ΔOYE2B::KanMx4/OYE2G and OYE2B/ΔOYE2G::KanMx4, respectively (Table 1). Their fermentation per-formances were compared at different fermentation tem-peratures (24, 28 and 32 °C). In addition to the CO2
fermentation kinetics, biomass samples were taken inorder to estimate the maximal population reached aswell as the cell viability at 70% of the fermentation(Table 5). An analysis of variance (type II) reveals thatboth temperature and OYE2-allele nature impactedmany phenotypes. The temperature effect accounts forthe major part of the phenotypic variance confirming itsdeleterious effect on the fermentation completion inhigh gravity conditions. Beside this notorious environ-mental effect, our results demonstrated that the natureof the OYE2 allele significantly affected the fermentationkinetics (T70 and rate), residual sugar content (RS) andthe total amount of CO2 produced (Fig. 5b and c). Incontrast, neither growth, biomass content, nor cellularviability were different between the hemizygous hybrids(Additional file 7). Therefore, the physiological impact ofOye2p concerns more fermentation activity than the cellgrowth or viability. In standard laboratory conditions,
Table 3 QTL effects and part of variance explained
Locus NIL T70 RS
Part of variance explained (%) P value Part of variance explained (%) P value
VIII_464 H4 a 19.8 1.30e-05 15.6 6.03e-05
IV_953 H4 a 17.7 3.25e-05 25.8 6.05e-07
VIII_464:IV_953 H4 a 1.4 0.209 0.6 0.404
XV_1051 H5 b 7.4 0.0152 7.7 0.008aANOVA II performed with a classical linear model with interaction, the variables declared are the loci VIII_464, IV_953 with two possible levels B and G accordingto the genotypebOne way ANOVA, the variable declared is the locus XV_1051 with two possible levels B and G according to the genotype
Table 4 Effect of temperature and OYE2 alleles on the main fermentation parameters
Traits H4 (Δ/G) H4 (B/Δ) Allele effect 24 28 32 Temperature effect
RS 50.6 33.1 9.4 *** 6.3 47.5 71.6 88.7 ***
CO2 98.9 104.8 5.1 * 118.5 98.5 88.5 92.6 ***
T70 116.5 84.5 27.8 * 91.5 85.6 124.4 ns ns
rate 0.55 0.72 36.6 * 0.69 0.68 0.52 ns ns
K 5.65 107 5.68 107 ns ns 5.95 107 6.04 107 5.00 107 97.2 ***
Viability 52.9 63.0 ns ns 73.2 69.0 32.1 87.6 ***
The hemizygous hybrids carrying the functional alleles OYE2B and OYE2G were respectively encoded H4(Δ /G) and H4(Δ /B). A complete two way ANOVA (type II)model was used for assessing allele, temperature effects and their interactions. Since no significant interactions were detected, only the part of variance explainedfor allele and temperature treatment were shown. The p-value associated is coded as follow, ns = p > 0.05, * = p < 0.05, *** = p < 0.005
Marullo et al. BMC Genomics (2019) 20:680 Page 7 of 17
the OYE2 hemizygous showed exactly the same fitness(data not shown). For the RS measured at 28 °C, thephenotypic difference between H4-OYE2-G and H4-OYE2-B hybrids was close to 16 g/L. By splitting the H4-progenies in two groups according to their inheritancefor OYE2 marker, the average phenotypic discrepancywithin the two groups is only 9.2 g/L. Epistatic relation-ships within other genes might explain why the OYE2 ef-fect in H4-offspring is lower than that observed in thehemizygous hybrids. This finding suggests that othergenes close to OYE2 might control this phenotype.Nevertheless, our data suggest that the gene OYE2strongly contributes to the QTL’s effect.As the mutation (p.Ser77fsTer95) is the unique Oye2p
peptidic variation found between the parental strains,the OYE2G allele (p.Ser77fsTer95) should be responsibleof the deleterious effect observed. In the hybrid H4, phe-notypes observed are quite similar to those observed inthe hemizygous hybrid H4-OYE2-B suggesting the reces-sive nature of this mutation (Fig. 5b and c). In other toevaluate more generally the implication of the OYE2gene in wine fermentations, we assayed in laboratorystrain background (BY4741) the physiological impact of
its full deletion using the strain Δoye2 (Y02873). The fer-mentation conditions were adapted by reducing the ini-tial sugar content (180 g/ instead of 260 g/L) since thelaboratory strain is much less adapted than industrialbackgrounds (Additional file 8). The OYE2 deletion im-pacted both kinetics and RS content whatever thetemperature of fermentation. These additional resultssuggest that the OYE2 gene might play a role in fermen-tation resistance not only at high temperature but alsoin more permissive conditions.
Impact of the protein kinase Vhs1p on stuck fermentationin high sugars and temperatures conditionsThe second QTL localized in the right arm of chromo-some IV was also investigated. During the backcrossprocedure, three distinct introgressed regions wereinherited form B-1A, encompassing a very large portionof chromosome IV (Fig. 2b). Only the central zone wasstatistically linked to the phenotype with a maximumpeak detected for the marker IV_953. In this genomicregion (945500 to 957800), nine non-synonymous varia-tions were found within the parental strains affecting 7genes (Additional file 6). The most striking mutation
Table 5 H5 Phenotypes
Trait H4-2C H4-19B Parental difference H5-progenies (n = 84)a
Mean SE (n = 5) Mean SE (n = 5) (Wilcoxon test p value) Mean Variance Range H
CO2max (g.L−1) 101.7 5.2 115.0 2.6 ns 108.8 34.6 94.6–119.0 < 5
LP (h) 5.0 1.0 5.7 0.25 ns 4.0 0.4 3–6 < 5
T35 (h) 34.0 1.0 36.25 2.25 ns 34.0 1.88 31–37 < 5
T50 (h) 53.5 0.5 57.0 3.0 ns 53.3 3.1 49–57 < 5
T70 (h) 105.0 3.0 96.5 2.5 0.08 97.1 43.7 86–117 65.1
rate 50–70 (g.L−1.h−1) 0.39 0.02 0.50 0.01 0.09 0.46 0.003 0.30–0.59 28
RS (g.L−1) (Residual Sugars) 34.19 8.9 5.49 1.95 0.06 21.00 112.13 3.34–47.60 29aFermentations were done without replicateSE stands for standard error, ns stands for no significative, h2 stands for heritability and was calculated according to Marullo et al. [31]
Fig. 4 Mapping of the minor QTL XV in the H5 progeny. a shows the linkage score expressed in – log of p-value (Wilcox-Mann-Withney test) forthe 19 qPCR markers used for QTL mapping of Residual sugars in the H5 progeny. The dot colors represent markers on different chromosomes.The p-value threshold of False discovery Rate (FDR 10 and 5%) was estimated by permutation tests (n = 1000) and are shown out by tight andwide dotted lines, respectively. b. Residual Sugars (g/L) distribution among the H5 progeny according to the inheritance at the loci XV_1051. Theparental values (H4-2C) and H4-19B) are indicated at the left part of the dot plot. The letters G and B stands for G-4A and B-1Ainheritance, respectively
Marullo et al. BMC Genomics (2019) 20:680 Page 8 of 17

was a nucleotide substitution C to A at the positiong.957128 producing a stop-codon (p.Tyr372*) in thegene VHS1. This gene encodes for a cytoplasmicserine/threonine protein kinase. Interestingly the stop-codon came from the parental strain B-1A conferringa more efficient fermentation. The resulting protein istruncated for 93 C-terminal amino acids but con-serves its catalytic domain. This allelic variation wasnot detected in any other strains (n = 100). Thereafterthis mutation is named VHS1B in opposition to thewild type allele VHS1G carried by the parental strainG-4A and the reference strain S288c. The effect ofthis gene was partially validated by RHA by con-structing the hemizygous hybrids H4-VHS1-G and
H4-VHS1-B (Table 1). In the experimental conditionsused for QTL mapping (260 g/L of sugar, 28 °C), wedid not observe a significant effect of this gene duethe very high variability observed within repetitions.However, by reducing the sugar concentration to 240g/L and increasing the fermentation temperature upto 32 °C a significant effect of the VHS1B allele wasobserved (Fig. 6a and b). As for OYE2, no differencesare found neither for growth, biomass production,nor viability whatever the culture medium used(synthetic grape juice or laboratory medium). Theweak effect observed is likely due to the fact thatother genes in this genetic region also impact thisphenotype. The hybrid H4 has the same phenotypic
Fig. 5 Physiological effect of the OYE2 alleles. a. Sequence alignments of Saccharomyces cerevisiae Oye2p proteins. The strains F10 (parental strainof G-4A), OS104 and S294 show stop-codon insertion at different positions. b. The bar plots represent the average values of residual sugars afterisothermal fermentations carried out at 24, 30 and 32 °C in both hemyzygous hybrids and the native H4 hybrid. The genotypes ΔOYE2B::KanMx4/OYE2G, OYE2B/ΔOYE2G::KanMx4, and OYE2B/OYE2G are shown in red, green and black, respectively. Bars represent standard error of five repetitions,the statistical differences between the hemizygous was tested by a Wilcoxon-Mann-Whitney Test (the p value is coded as follow, ‘ns’ = p > 0.05,‘.’ = p < 0.1, ‘**’ = p < 0.01. c. Fermentation kinetics (CO2 produced time course) for the same strains and with the same color key
Marullo et al. BMC Genomics (2019) 20:680 Page 9 of 17

level than the hemizygous hybrid H4-VHS1-G suggestingthat the beneficial allele VHS1B is mostly recessive. Alikefor OYE2, we verified the VHS1 effect in another geneticbackground (BY4741) applying milder fermentation con-ditions (180 g/L of sugar). The deletion mutant Δvhs1(Y03606) showed a significative reduction of fermentation
efficiency respect to the control by leaving more residualsugars (Fig. 6c) and having a slower fermentation kinetics(Fig. 6d). In contrast to the results observed in the H4background, the deletion effect of VHS1 was not observedat 28 °C but only at 24 °C. Again, a very high phenotypicvariability within repetition was observed and the
Fig. 6 Physiological effect of VHS1 alleles. a. The bar plots represent the average values of residual sugars after isothermal fermentations carriedout at 24, 30 and 32 °C in both hemyzygous hybrids and the native H4 hybrid . The genotypes ΔVHS1B::KanMx4/VHS1G, VHS1B/ΔVHS1G::KanMx4,and VHS1B/VHS1G are shown in red, green and black, respectively. Bars represent standard error of five repetitions, the statistical differencesbetween the hemizygous was tested by a Wilcoxon-Mann-Whitney Test (the p value is coded as follow, ‘ns’ = p > 0.05, ‘.’ = p < 0.1, ‘**’ = p < 0.01.b. Fermentation kinetics (CO2 produced time course) for the same strains and with the same color key. c The bar plots represent the averagevalues of residual sugars after isothermal fermentations carried out at 24, and 32 °C in the laboratory strain background (BY4741). The genotypesΔvhs1 and VHS1(wt) were shown in blue and grey, respectively. Bars represent standard error of five repetitions, the statistical differences betweenthe strains was tested by a Wilcoxon-Mann-Whitney Test (the p value is coded as follow, ‘ns’ = p > 0.05, ‘**’ = p < 0.01). d. Fermentation kinetics(CO2 produced time course at 24 °C) for the same strains and with the same color key
Marullo et al. BMC Genomics (2019) 20:680 Page 10 of 17

laboratory strain showed a very sluggish fermentation kin-etics consuming only 40% of the total sugar. This strongvariability illustrates the difficulty to asses precisely pheno-types associated to stuck fermentation that could dependson intra-individual phenotypic variability. These additionalresults also suggest that the complete loss of function ofthis protein is deleterious for fermentation efficiency.Strikingly, the effect of total deletion of VHS1 in BY back-ground contrasted with the partial C-terminal deletion ob-served in H4. Indeed, the VHS1B allele has a positive effecton the fermentation efficiency. Altogether, reciprocalhemizygous and functional genetic analyses of VHS1 inanother background provide new insights of this poorlycharacterized kinase. Interestingly a positive natural allelicvariation associated to fermentation resistance in hightemperature and ethanol conditions has been identified.The weak effect of this mutation suggested that VHS1 isnot the unique gene explaining the effect of this QTL.Therefore, other allelic variations physically linked toVHS1 are likely involved and remain to be identified.
DiscussionA backcross strategy for mapping quantitative trait locirelated to the late fermentation partIn order to reduce the genotyping cost, the QTLmapping was carried out on a Nearly IsogenicLineage (NIL). This lineage is derived from meioticsegregants of the hybrid H4, which has been obtainedby successive backcrosses, using as parental donor thestrain B-1A, and as recipient one the strain G-4A.Main regions inherited from B-1A were identified bygenotyping the seven best segregants of H4 usingYeast Tiling Microarrays (YTM). This selective geno-typing strategy is routinely used in quantitative genet-ics and allows the reduction of genotyping effort byincreasing the detection power of major QTLs [33].Selective genotyping could be achieved by Bulk Segre-gant Analysis which requires pooling large set of ex-treme segregants [36]. In yeast, this strategy has beenparticularly useful for mapping QTLs linked to fitnessdifferences by allowing an easy selection of numerousindividuals with extreme phenotypes [37]. In our ex-perimental conditions, all the progenies showed asimilar growth/viability and are mostly different fortheir fermentation kinetics and their residual sugarsvalues. Therefore, an easy selection based on fitnessor viability was not possible and all of them werephenotyped individually. The selection of only sevensegregants representing the tail of RS distribution (thebest 10%) was sufficient to map 12 genomic regionsby using Tiling microarray. Once the main intro-gressed regions have been localized, we applied anadditional filter using the parental genome sequences.This filter was necessary since the SNPs detected by
Tiling microarray were not all reliable (FDR = 65%). Asubset of 43 bi-allelic markers segregating in a Men-delian way across the H4 population was successfullydefined. Those markers were selected in genomic re-gions mostly inherited from B-1A strain assuming thefact that most of alleles allowing a more efficient fer-mentation would be brought by this parental strain.By genotyping 77 segregants, 2 main QTLs (VIII_464and IV_953) were detected confirming the efficiencyof our strategy. Despite the low-density map used, itis noteworthy that both QTL mapped are very close(less than 4 kb) to the two genes investigated (OYE2and VHS1). However, this first linkage analysis cap-tured only 40% of the total phenotypic variation ob-served. The identification of only two major QTLs isconsistent with quantitative genetics theory. In fact,most of the QTL-studies fail to capture all the gen-etic variability especially due to the strong epistaticrelations within QTLs [38]. In order to find out otherminor QTLs, the effect of those major loci was re-moved by achieving another cross among phenotypic-ally distant progenies having the same inheritance (B)for the markers VII_464 and IV_953. This additionalanalysis leads to map a third locus localized at theend of chromosome XV (peak linkage at the markerXV_1051). Due to the weak effect of this QTL, wedid not investigate the causative genes of this region.However, some details recently reported stroke ourattention. The end of chromosome XV was linkedwith the genomic region C acquired by horizontaltransfer which is present by most of the wine yeast[39]. Recently, it was demonstrated that the genesFOT1–2 of this region derived from Torulasporamicroellipsoides confers evolutionary advantages ingrape must fermentations [40]. However, both paren-tal strains have a full copy of the gene FOT1–2 sug-gesting that the cause of their phenotypic discrepancyis elsewhere. By comparing the read coverage of theparental strains, we found that B-1A has a 12-kb de-letion in the right subtelomeric part of the chromo-some XV (Additional file 9). This deletionencompassed the genes FIT2, FIT3, FRE5, YOR385W,PHR1, and YOR387W and has been previously de-scribed for other yeast strains [41]. Since the allele ofthe strain B-1A confers temperature sensitivity, thelack of one or many genes of this region could bedirectly involved. Similarly, a recent work linked thecold temperature tolerance with various subtelomericregions of chromosome XIII, XV, and XVI havingsuch kind of deletion [42]. Our results suggest thatthe right arm of chromosome XV might play a pos-sible role on fermentation completion in the appliedconditions. However, further genetic analyses are ob-viously necessary for confirming this hypothesis and
Marullo et al. BMC Genomics (2019) 20:680 Page 11 of 17

identifying the causative gene(s) involved. Some segre-gants carrying all the three positive alleles constitutea relevant genetic material for carrying out breedingprograms in order to improve the performance ofother strains by using marker assisted selection strat-egies [43].
New insights in the physiological role of the old yellowreductase Oye2pWe attempted to dissect at the gene level the two majorQTL identified. First the locus VIII_464 accounting formore than 25% of the Residual Sugar variance (Table 5)was investigated. By using a Reciprocal HemizygosityAnalysis, the role of the gene OYE2 (YHL179c) wasestablished. The allele OYE2G reduced the efficiency ofalcoholic fermentation since the parental strain G-1Ahas a two nucleotides deletion (c.229_230delTC) whichgenerates a truncated protein of 94 amino acids (insteadof the 400 expected). In the G-1A background, this alleleconferred the same phenotype than the null mutationoye2::KanMx4 (data not shown). In the industrial back-ground, the OYE2G effect is only observed during the al-coholic fermentation of high quantity of sugars when thetemperature exceeds 32 °C (Fig. 5). Similar phenotypeswere investigated in another unrelated background(S288c) (Additional file 8). However, in this background,the gene deletion affects fermentation performanceswhatever the temperature impairing to establish a gen-eral link between OYE2 and the temperature resistance.Moreover, our results did not perfectly validate thatOYE2 is the unique genetic factor contributing to stuckfermentation at this locus. Indeed, at 28 °C phenotypicdifferences within hemizygous hybrids were closer (andpoorly significative) than those observed within H4 pro-genies having inherited the G and B alleles, respectively.This basic functional characterization of OYE2 dele-
tion supports the idea that its related protein could playa secondary physiological role in drastic fermentationconditions (32 °C, 260 g/L of sugar). The protein Oye2pis a conserved NADPH oxydoreductase [44] belongingto the large family of flavoenzymes that has a growinginterest in biocatalysis [45]. Despite several studies, thephysiological role of Oye2p remains unclear. Large-scalefunctional genomics suggested that Oye2p should have apossible role in cytoskeleton assembly [46] as well as inoxidative stress response [47, 48]. This mitochondrion-associated protein was also characterized for its anti-apoptotic effect by lowering Programed Cell Death(PCD) after various oxidative treatments [48]. Interest-ingly, a connection between oxidative stress conditionsand heat shock has been previously established for thisgene [49]. The effect of oye2 deletion on cell viabilityafter a transient heat shock (50 °C, 20 min) was only ob-served when the cells are sampled during the stationary
phase but not during exponential growth [49]. These re-sults are consistent with the effect detected in H4 back-ground that occurred only at a relatively hightemperature (32 °C). Additional characterization efforts anecessary for better understanding the protective role ofOye2p in such conditions. This might be due to its pro-tective effect against ROS (Reactive Oxygen Species) thatare observed in important amount in late steps of winealcoholic fermentation [50]. Since high temperature [51]and ethanol [52] promote ROS production in S. cerevi-siae, the harsh conditions met in our experiment mayhave emphasized this phenomenon. A possible connec-tion between ROS production and fermentation effi-ciency would be the potential role of OYE2 to preventProgrammed Cell Death as previously proposed [53].However, neither the cell viability nor the biomass pro-duction is impacted in hemizygous H4-hybrids (Add-itional file 7, Table 5).Interestingly, the phenotypic discrepancy observed
within H4 hemyzygous appeared after 67 h of fermenta-tion when more than 70% of sugar has been consumed.At this stage the ethanol concentration is higher than11% Vol and becomes very toxic for fermenting yeast. Inthis context, high temperatures (32 °C and in a less ex-tent 28 °C) act as a strong perturbating factor enhancingthe chance to trig stuck fermentations. Since no differ-ences in yeast fitness (viability or concentration) wereobserved, the OYE2 effect pointed out might be directlyor indirectly related to metabolic and/or transport activ-ity of fermenting yeast. This could be due to various per-turbations in cellular process that are impacted by thedeactivation of this gene, including actin polymerization[54], cellular glutathione content [48], and sterol metab-olism [55].
Evidence of a truncated form of the protein Vhs1pimpacting fermentation efficiencyA second QTL (IV_953) linked to stuck fermentationwas also partially resolved at the gene level. By compar-ing the genomic sequence of parental strains, we de-tected close to the QTL peak (IV_953), a non-sensemutation (c.1116C > A) in the coding sequence of VHS1of the strain B1-A. Reciprocal hemizygous analysis wascarried out in order to demonstrate the effect of geneVHS1. However, conditions applied were not those ofthe QTL mapping analysis since both hemizygous hy-brids failed to ferment at 260 g/L of sugar and showed astrong phenotypic variability within repetitions. By de-creasing the sugar content (and by consequence ethanolamount) a slight effect was eventually measured in theH4 background at 32 °C (Fig. 6). VHS1 encodes a cyto-plasmic serine/threonine protein kinase; strikingly, thefavorable allele suspected, VHS1B, generates a truncatedC-terminal protein of 371 amino acid instead of 461.
Marullo et al. BMC Genomics (2019) 20:680 Page 12 of 17
This 90 amino acids deletion do not encompass the pro-tein kinase domain (PS50011) suggesting that the trun-cated form might conserve its serine-threonine kinaseactivity. More over, the positive effect of the truncatedallele of VHS1B contrasted with the full deletion ofVHS1 done in the BY background (Fig. 6c and d). In-deed, in H4 hemizygous hybrids a significative effect wasfound only at 32 °C while, in the laboratory background,the full deletion of VHS1 significantly impact fermenta-tion only at 24 °C.These contrasted effects could be explained by gene
dosage phenomenon. Indeed, the H4 experiment onlyone of the two copies of VHS1 is still present in hemizy-gous, while no functional copy is present in the BY ex-periment. Interestingly, VHS1 deletion has beenreported to generate haploinsufficiency in an alcoholicfermentation context [56]. More generally, other neigh-bor genes could control this phenotype and would alsocontribute to the strong effect of this second QTL. In-deed, compare to the locus VIII_464, this genomic re-gion is quite large (> 400 kb) (Table 3) and four markersspaced by 25 kb were positively linked to the phenotype.Previous studies in S. cerevisiae [7, 25] already describedthese particularly large QTLs, which could be due to thepresence of several causative genes brought by both par-ental strains. This could be the case here since othergenes having a close phenotypic relation withtemperature (HSP48) or acid pH (RKR4) resistances arelocated in the same region. The molecular function ofthis kinase has been only partially characterized in a re-cent study [57]. This protein is involved in the regulationof the Snf1p, a central regulator of the carbon metabol-ism. By phosphorylating the protein Sip5p, Vhs1p indir-ectly activates the regulator Snf1p. Therefore, Vhs1pmight indirectly promotes the fermentation metabolismby activating the Snf1p pathway.
The complex nature of the genetic determinism of stuckfermentationBy crossing two strains derived from industrial starterswe eventually find out genes and natural allelic varia-tions playing a role in stuck fermentation. This multi-facetted complex phenotype depends on the combin-ation of many biotic and abiotic factors and is quite diffi-cult to define. Here, we more specifically focused on thecombined effect of temperature and ethanol content thatare noteworthy factors affecting yeast viability and meta-bolic activity [4]. Indeed, it is well documented thatmany thermosensitive mutations confer a permissivephenotype at mild temperature but generate a non-func-tional protein in warmer conditions [58]. In the indus-trial background used (H4), the deleterious impact ofhigh sugar and temperature is modulated by the inherit-ance of non-sense mutations in the VHS1 and OYE2
genes. Indeed, the allelic versions of the parental strain Bleads to a more complete fermentation at hightemperature (Fig. 5b and 6a). Strikingly, by testing thedeletion effect of those genes in the BY background, theeffect of high temperature was not confirmed even ifboth genes have a significant impact on the fermentationprocess (Additional file 8 and Fig. 6c and d). A possibleexplanation would be the chaotropic role of temperaturethat may have facilitated stochastic phenomena enhan-cing the heterogeneity of fermenting population. Thisexplains some difficulties for measuring accurately theresidual sugars concentration especially in VHS1 experi-ment. Altogether these results emphases the low pene-trance of genetic factors due to modifier loci thatmodulate the architecture of complex traits by epistatic[59] and GxE [60] interactions, but also by controllingthe probabilistic traits [61] and expression noise [62] inisogenic populations.
ConclusionIn this study we identified by a QTL mapping ap-proach, two natural allelic variations impacting thefermentation performance of industrial yeast in sugarrich media (> 250 g /L of glucose-fructose). A thirdlocus encompassing the deletion of 6 subtelomericgenes has been also detected. The combination of se-lective genotyping and the further selection of fewmarkers did not impact the precision of QTL mappingleading to identify loci explaining a part total phenotypicvariation. A first functional characterization work wasattempted leading to highlight the role of two new pro-teins Oye2p and Vhs1p involved in the fermentation com-pletion in a high temperature and a high sugar context.
MethodsYeast strains and culture conditionsAll the Saccharomyces cerevisiae strains used during thiswork were listed in (Table 1). All strains were propa-gated at 30 °C on YPD medium (1% yeast extract, 1%peptone, 2% glucose) solidified with 2% agar when required.When necessary the antibiotic G418 (Sigma-Aldrich, StLouis, Missouri, USA) was added at a final concentration of100 μg/ml. The construction of the backcross hybrid H4and the description of the initial parental strains G-4A andB-1A have been previously reported [5]. The hybrid H5was obtained by crossing two selected meiotic segregants ofH4 (H4-2C and H4-19B) on the basis of their genotype asdetailed in result section.A collection of 77 and 84 meiotic segregants respect-
ively derived from H4 and H5 was obtained by sporedissection using a Singer manual apparatus. The segre-gants obtained are diploid fully homozygous cells due tothe homothallic character of the hybrids H4 and H5(HO/HO). Due to their nearly isogenic nature, the
Marullo et al. BMC Genomics (2019) 20:680 Page 13 of 17
germination rate of the hybrids H4 and H5 were close to100% and all the segregants showed the same fitness onlaboratory media.
Phenotype measurementAlcoholic fermentationFermentations were run in the KP medium, a syntheticgrape juice which mimics a standard grape juice [63]. Thismedium was sterilized by filtration through a 0.45 μm ni-trate-cellulose membrane (Millipore, Molsheim, France).Phenotypes were measured in a medium containing 260g.L− 1 of sugars (50% fructose-50% glucose) with a dilutedamount of anaerobic growth factors (S + A- conditions) asdescribed previously [5]. For the fermentation with the BYstrains, the amount of sugar was reduced to 160 g/L.moreover in such experiment the strain auxotrophies werecomplemented by adding uracil (20mg/L), methionine(20mg/L), leucine (30mg/L), histidine (30mg/L) in thesynthetic media. A solution stock of [ergosterol (15 μg. L−1), sodium oleate (5 μg/L) and 1mL Tween 80/ethanol (1:1, v/v)] was added in the medium with a 5000 fold dilu-tion. Pre-cultures were run in Erlenmeyer flasks for 24 hat 24 °C under orbital agitation (150 rpm) in the fermenta-tion media filtered and diluted 1:1 with milli-Q water. Theinoculum concentration was 106 viable cells per ml. Fer-mentations were then run in closed 150mL glass-reactors,locked to maintain anaerobiosis, with permanent stirring(300 rpm) at 28 °C. The CO2 released was monitored bymeasurement of glass-reactor weight loss regularly andexpressed in g.L− 1. Raw weight lost data were smoothedby a Loess function allowing the estimation of various kin-etics parameters. The CO2max (g.L− 1) was the maximalamount of CO2 produced during the fermentation, the LP(h) was the lag phase time before the CO2 production ratewas higher than 0.05 g.L− 1.h− 1, the T35, T50, T70 are thetime necessary to reach 35, 50 and 70% of the maximalamount of CO2 expected (125 g.L− 1); the rate 50–70 (g.L−1.h− 1) was the rate of CO2 released between T70 and T50.Due to the important number of progenies analyzed, twodistinct batches of fermentation were carried out. To esti-mate eventual block effects parental strains (G-4A, B-1Afor H4) and (H4-2C, H4-19B for H5) were fermented inboth batches two (or three) times leading to get 4 (or 5)replicates of each parent and their relative hybrids. No sig-nificative block effects were observed for the traits ana-lyzed (data not shown). For the H4 segregants, all thefermentations were done in duplicate, for the H5 segre-gants only one series was carried out.
Fermentation analysesAt the end of the alcoholic fermentation, the syntheticwines were analyzed for basic enological parameters.Glucose and Fructose consumed were estimated by en-zymatic assay using the kit n° 10139106035 according to
manufacturer protocol (R-Biopharm, Germany) and theRS (Residual Sugars) was computed as the sum ofremaining glucose and fructose (expressed in g.L− 1).The linearity of this method was presented in the Add-itional file 10 and was recently published [64]. Ethanol(%Vol) was measured by infrared reflectance using anInfra-Analyzer 450 (Technicon, Plaisir, France).
Whole genome sequencing of parental strainsWhole genome sequences of strains B-1A and G-4A wereobtained by using Illumina pair-end sequencing. Briefly,genomic DNA was extracted from a saturated culture of100ml under anaerobic condition (YPD) using the gen-omic tip-100 kit (Qiagen, Courtaboeuf, FRANCE). Paired-end Illumina sequencing libraries were prepared fromsonicated genomic DNA according to manufacturer pro-tocols (Genomic DNA Sample Preparation) and were real-ized by the Genomic and Transcriptomic Facility ofBordeaux, FRANCE. Sequencing was performed on Illu-mina Genome Analyzer IIx (Illumina, Palo Alto, CA) witha read length of 54 bp. Raw reads data have been depos-ited in the SRA at NCBI with the accession numberPRJNA419624. The genome coverage was respectively45X and 34X for B-1A and G-4A, respectively. After readsquality trimming and filtration step, each strain wasaligned to the reference genome of Saccharomyces cerevi-siae S288c (version Apr2011/sacCer3) using “Bowtie2”with default parameters. Single Nucleotide Polymor-phisms (SNPs) were called using Samtools mpileup withmapping quality ≥ 30, base quality ≥ 20, and varFilterdepth ≥ 10. Single amino-acid polymorphisms were identi-fied using snpEff [65] requiring quality QUAL ≥30 andgenotype GEN[*] GQ ≥ 20. Using this procedure, we de-fined a set of 9829 high-quality SNP (Q > 30, homozygous)named WGS-SNP and given in (Additional file 4).
Selective genotyping using yeast tiling microarrays (YTM)The genomic DNA of the diploid parental strains (G-4A,B-1A) and of seven H4 segregants was isolated as previ-ously described [31] and hybridized onto GeneChip S.cerevisiae Tiling Array 1.0 from Affymetrix (Palo Alto,CA) following the protocol detailed by Gresham et al.[32]. Hybridization and microarray scanning wereperformed by the ProfileXpert platform (Lyon, France).For each parental strain, two independent hybridizationswere carried out. Single Nucleotide Polymorphism(SNP) and short Insertion Deletion (INDEL) weresearched using the SNPscanner program [32] built forscanning SNP on the reference genome release R49–1-1(2005). In order to reduce the heterogeneity of fluores-cence signal between each microarray, the Z score ofhybridization signal was calculated according to [66].The prediction threshold of z scored-transformed datawas higher than 2.5 and only regions extending for at
Marullo et al. BMC Genomics (2019) 20:680 Page 14 of 17

least 10 nucleotides above the signal threshold were con-served. This approach allows recovering 3354 putativemarkers within the strains. Using the same procedure,seven segregants of the hybrid H4 were genotyped. Thecompiled set of YTM markers inherited from B-1A andG-4A found in the seven segregants was listed in the(Additional file 3). The Perl and R scripts used for com-puting these dataset are available on request.
PCR-based KASP™ genotyping of H4 and H5 progeniesGenomic DNA of segregants were extracted using the Gen-ome Wizard (Promega, France) kit using the modified con-ditions described by Zimmer et al. [35]. The inheritance of43 SNP was investigated using the KASP genotyping assaybased on the use of one universal FRET cassette reportersystem. Primers design and genotyping were performed byLGC genomics (Hertz, UK).
Reciprocal hemizygosity assayGene deletion were carried out by homologous recom-bination using deletion cassette constructed by PCRusing as template the genomic DNA of Euroscarf collec-tion strains (Euroscarf, Franckfurt, Germany). The OYE2and VHS1 deletion cassette were obtained using as tem-plate the genomic DNA of the strains Y02873 andY03606, respectively. All the constructs were verified byboth insertion and deletion PCR test. The insertion testconsists to positively amplify by PCR a fragment con-taining the 5′ part of the KanMx4 cassette and ~ 600 bpof the 5′-flanking region of the target gene. Deletion testconsists in the absence of amplification of a central por-tion of the target gene. The hybrid H4 and the parentalstrains B-1A and G-4A were transformed using the lith-ium acetate protocol described by Gietz and Schiestl[49]. The allele identity in hemizygous hybrids wastested by sequencing. All the primers used are listedin Additional file 11. For each hemizygous hybridassay at least two independent clones of each geno-type were tested.
Determination of cell viability and concentrationThe cell concentration (cells/ml) as well the cell via-bility were estimated at 70% of the total CO2 expectedusing a flow cytometer (Quanta SC MPL, BeckmanCoulter, Fullerton, California), equipped with a 488 nmlaser (22mW) and a 670 nm long-pass filter. Samples werediluted in McIlvaine buffer pH = 4.0 (0.1M citric acid,0.2 M sodium phosphate dibasic) added with propi-dium iodide (0.3% v/v) in order to stain dead cells(FL3 channel).
Graphical and statistical analysesAll the statistical and graphical analyses were carried outusing the R program (R version 3.3.3 2017-03-06). The
custom R scripts used are available on request. The glo-bal heritability of each trait (h2) was estimated as de-scribed previously [63]. The correlation among traitswere estimated using a Pearson test corrected by a Bon-ferroni’s test using the R package Coortest. Linkage ana-lysis was carried out according to the non-parametricmethod (Wilcoxon-Mann-Whitney) used by Zimmer etal. [35]; and by calculating for each trait a significantthreshold by 1000 permutation tests (α = 0.05). TheQTLs, genes, and temperature effects were estimated bystandard complete linear models (with interaction) andfurther analyzed by ANOVA (type II). For each variable,the homogeneity of the variance was assessed using aLevene test (car package) and the normality of residualdistribution was controlled using a Shapiro test (α > 0.01).Duncan’s multiple comparison was used to determinewhich means differ significantly (Duncan’s multiple com-parison, α = 0.05) using the agricolae package. When re-quired, pairwise comparisons were carried out using theWilcoxon test with at least four independent repetitions.
Additional files
Additional file 1: Fermentation kinetics of the 77 segregants and thetwo parental strains G-4A (red) and B-1A (green). (TIFF 2437 kb)
Additional file 2: Trait distribution among H4 progeny. The green, redand black full dots represent the parental values of the strains B-1A, G-4Aand H4. (TIFF 21796 kb)
Additional file 3: Correlation analysis within each trait investigated inthe H4 progeny. The test applied was the Pearson test. The size and thecolor of the dots represent the pvalue and the correlation rate,respectively. Only significant correlations corrected p values (BH) lowerthan 0.001 were shown. (TIFF 21796 kb)
Additional file 4: SNP detected by NGS (sheet 1); Tiling (Sheet 2) andfiltered markers with their occurrence in the 7 segregants genotyped(sheet 3) (XLSX 544 kb)
Additional file 5: KASP Markers used for linkage analysis (XLSX 12 kb)
Additional file 6: List on SNP within parental strains and their effect forloci on chromosomes VIII and IV (XLSX 10 kb)
Additional file 7: Biomass viability for the hemyzygous hybridsΔOYE2B::KanMx4/OYE2G (red) and OYE2B/ΔOYE2G::KanMx4 (green) and H4(black). The dots represent mean value for the sampling points and theshaded area the standard deviation estimated with at least fiverepetitions. (TIFF 1720 kb)
Additional file 8: Panel A. The bar plots represent the average values ofresidual sugars after isothermal fermentations carried out at 24, and 32 °Cin the laboratory strain background (BY4741). The genotypes Δoye2 andOYE2(wt) were shown in blue and grey, respectively. Bars representstandard error of five repetitions, the statistical differences between thehemizygous was tested by a Wilcoxon-Mann-Whitney Test (the p value iscoded as follow, ‘*’ = p < 0.05). Panel B. Fermentation kinetics (CO2
produced time course at 24 °C.) for the same strains and with the samecolor key (TIFF 9490 kb)
Additional file 9: This figure illustrates the deletion observed in thestrain B-1A for the genomic region encompassing the genes FIT2, FIT3,FRE5, YOR385W, PHR1, YOR387C. The deletion was found by comparingthe read per kb observed for all the genes of the right arm ofchromosome XV. Green bars (B-1A), red bars (G-4A). (TIFF 1480 kb)
Additional file 10: Reliability of the enzymatic assay of glucose andfructosePanel A. Linearity of the assay. The values shown are the average
Marullo et al. BMC Genomics (2019) 20:680 Page 15 of 17

of two repetitions and the error bar indicates the standard deviation. Theblue line indicates the linear regression line, the adjusted R-Squared isindicated. Panel B. Recovery of the assay. Each point represents theaverage value of three repetitions. The error bars indicate the standarddeviation. The blue line indicates the linear regression line. Recovery isindicated. Linearity of the assay (panel A). The concentration of a samplewas measured at different dilution levels (1/100, 1/200 and 1/400). Linearregression with a R-Squared close to 1 indicates the linearity of theenzyme assay in this range (0.15 g/L - 0.6 g/L). Recovery of the assay(panel B). Different concentrations of glucose or fructose are added to asample (0.4 g/L, 1 g/L, 10 g/L and 15 g/L). The slope of the linear regressionline indicates which part of the added concentration is actually measured(recovery). A slope close to 1 shows a good recovery of the assay between0.4 g/l and 15 g/l. (PDF 75 kb)
Additional file 11: Details of the gene deletion method. (DOCX 65 kb)
AbbreviationsINDEL: Insertion DELetion; NIL: Nearly Isogenic Line; PCD: Programmed CellDeath; QTL: Quantitative Trait Loci; RHA: Reciprocal Hemizygous Assay;ROS: Reactive Oxygen species; SNP: Single Nucleotide Polymorphism
AcknowledgementsNot applicable.
Authors’ contributionsPM and DD conceived the work, PM, EP, PD, MB and CM realizedexperiments, PM wrote the manuscript. All authors read and approved thefinal manuscript.
FundingPM received 2 grants from Conseil Regional d’Aquitaine (SAGESSE forgenome sequencing, and QTL2 for genotyping). The funders had no role instudy design, data collection and analysis, decision to publish, or preparationof the manuscript.
Availability of data and materialsThe datasets supporting the conclusions of this article are included withinthe article (5 tables, 6 figures) and its 11 additional files.
Ethics approval and consent to participateNot applicable.
Consent for publicationNot applicable.
Competing interestsMB, CM, EP and PM are employed by BIOLAFFORT company. This does notalter the authors’ adherence to all the journal policies on sharing data andmaterials.
Author details1University of Bordeaux, ISVV, Unité de recherche OEnologie EA 4577, USC1366 INRA, 33140 Bordeaux INP, Villenave d’Ornon, France. 2Biolaffort, 33100Bordeaux, France. 3CNRS UMR 5800, University of Bordeaux, 33405 Talence,France. 4Inria Bordeaux Sud-Ouest, Joint team Pleiade Inria/INRA/CNRS, 33405Talence, France.
Received: 6 March 2018 Accepted: 4 July 2019
References1. Peter J, De Chiara M, Friedrich A, Yue J-X, Pflieger D, Bergström A, Sigwalt A,
Barre B, Freel K, Llored A, Cruaud C, Labadie K, Aury J-M, Istace B, LebrigandK, Barbry P, Engelen S, Lemainque A, Wincker P, Liti G, Schacherer J.Genome evolution across 1,011 Saccharomyces cerevisiae isolates. Nature.2018;556:339–44.
2. Sicard D, Legras JL. Bread, beer and wine: yeast domestication in theSaccharomyces sensu stricto complex. Comptes Rendus - Biol. 2011;334:229–36.
3. Zhao XQ, Bai FW. Mechanisms of yeast stress tolerance and its manipulationfor efficient fuel ethanol production. J Biotechnol. 2009;144:23–30.
4. Bisson LF. Stuck and sluggish fermentations. Am J Enol Vitic. 1999;50:107–19.5. Marullo P, Mansour C, Dufour M, Albertin W, Sicard D, Bely M, Dubourdieu
D. Genetic improvement of thermo-tolerance in wine Saccharomycescerevisiae strains by a backcross approach. FEMS Yeast Res. 2009;9:1148–60.
6. Mitsumasu K, Liu Z-S, Tang Y-Q, Akamatsu T, Taguchi H, Kida K. Developmentof industrial yeast strain with improved acid- and thermo-tolerance throughevolution under continuous fermentation conditions followed byhaploidization and mating. J Biosci Bioeng. 2014;118:689–95.
7. Martí-Raga M, Peltier E, Mas A, Beltran G, Marullo P. Genetic Causes ofPhenotypic Adaptation to the Second Fermentation of Sparkling Wines inSaccharomyces cerevisiae. G3 Genes Genomes Genet. 2017;7:399–412.
8. Hasunuma T, Sanda T, Yamada R, Yoshimura K, Ishii J, Kondo A. Metabolicpathway engineering based on metabolomics confers acetic and formicacid tolerance to a recombinant xylose-fermenting strain of Saccharomycescerevisiae. Microb Cell Factories. 2011;10:2.
9. Taherzadeh M, Gustafsson L, Niklasson C. Physiological effects of 5-hydroxymethylfurfural on Saccharomyces cerevisiae. Appl Microbiol. 2000;53:701. https://doi.org/10.1007/s002530000328.
10. Blateyron L, Sablayrolles JM. Stuck and slow fermentations in enology:statistical study of causes and effectiveness of combined additions ofoxygen and diammonium phosphate. J Biosci Bioeng. 2001;91:184–9.
11. Rich JO, Leathers TD, Bischoff KM, Anderson AM, Nunnally MS. Biofilmformation and ethanol inhibition by bacterial contaminants of biofuelfermentation. Bioresour Technol. 2015;196:347–54.
12. Jarosz DF, Brown JCS, Walker GA, Datta MS, Ung WL, Lancaster AK, Rotem A,Chang A, Newby GA, Weitz DA, Bisson LF, Lindquist S. Cross-kingdomchemical communication drives a heritable, mutually beneficial prion-basedtransformation of metabolism. Cell. 2014;158:1083–93.
13. Aldiguier AS, Alfenore S, Cameleyre X, Goma G, Uribelarrea JL, Guillouet SE,Molina-Jouve C. Synergistic temperature and ethanol effect onSaccharomyces cerevisiae dynamic behaviour in ethanol bio-fuelproduction. Bioprocess Biosyst Eng. 2004;26:217–22.
14. Choudhary J, Singh S, Nain L. Thermotolerant fermenting yeasts forsimultaneous saccharification fermentation of lignocellulosic biomass.Electron J Biotechnol. 2016;21:82–92.
15. Olofsson K, Bertilsson M, Lidén G, Saidi B, Braun R, Jönsson L, Saez F,Saez R, Wegner T, Zerbe J. A short review on SSF ? An interestingprocess option for ethanol production from lignocellulosic feedstocks.Biotechnol Biofuels. 2008;1:7.
16. Colombié S, Malherbe S, Sablayrolles JM. Modeling of heat transfer in tanksduring wine-making fermentation. Food Control. 2007;18:953–60.
17. Guymon JF, Crowell EA. The nature and cause of cap-liquid temperaturedifferences during wine fermentation. Am J Enol Vitic. 1977;28:74–8.
18. Cha Y-L, An GH, Yang J, Moon Y-H, Yu G-D, Ahn J-W. Bioethanolproduction from Miscanthus using thermotolerant Saccharomycescerevisiae mbc 2 isolated from the respiration-deficient mutants. RenewEnergy. 2015;80:259–65.
19. Shi D, Wang C, Wang K. Genome shuffling to improve thermotolerance,ethanol tolerance and ethanol productivity of Saccharomyces cerevisiae. JInd Microbiol Biotechnol. 2009;36:139–47.
20. Caspeta L, Chen Y, Ghiaci P, Feizi A, Buskov S, Hallström BM, Petranovic D,Nielsen J. Biofuels. Altered sterol composition renders yeast thermotolerant.Science. 2014;346:75–8.
21. Çakar ZP, Seker UOS, Tamerler C, Sonderegger M, Sauer U. Evolutionaryengineering of multiple-stress resistant Saccharomyces cerevisiae. FEMSYeast Res. 2005;5:569–78.
22. McCusker JH, Clemons KV, Stevens DA, Davis RW. Geneticcharacterization of pathogenic Saccharomyces cerevisiae isolates.Genetics. 1994;136:1261–9.
23. Auesukaree C, Koedrith P, Saenpayavai P, Asvarak T, Benjaphokee S,Sugiyama M, Kaneko Y, Harashima S, Boonchird C. Characterization andgene expression profiles of thermotolerant Saccharomyces cerevisiaeisolates from Thai fruits. J Biosci Bioeng. 2012;114:144–9.
24. Vianna CR, Silva CLC, Neves MJ, Rosa CA. Saccharomyces cerevisiae strainsfrom traditional fermentations of Brazilian cacha?A: trehalose metabolism,heat and ethanol resistance. Antonie Van Leeuwenhoek. 2008;93:205–17.
25. Steinmetz LM, Sinha H, Richards DR, Spiegelman JI, Oefner PJ, McCusker JH,Davis RW. Dissecting the architecture of a quantitative trait locus in yeast.Nature. 2002;416:326–30.
26. Sinha H, Nicholson BP, Steinmetz LM, McCusker JH. Complex geneticinteractions in a quantitative trait locus. PLoS Genet. 2006;2:140–7.
Marullo et al. BMC Genomics (2019) 20:680 Page 16 of 17

27. Sinha H, David L, Pascon RC, Clauder-Münster S, Krishnakumar S, Nguyen M, ShiG, Dean J, Davis RW, Oefner PJ, McCusker JH, Steinmetz LM. Sequentialelimination of major-effect contributors identifies additional quantitative trait lociconditioning high-temperature growth in yeast. Genetics. 2008;180:1661–70.
28. Yang Y, Foulquié-Moreno MR, Clement L, Erdei E, Tanghe A, SchaerlaekensK, Dumortier FF, Thevelein JM, Foulquié-Moreno MR, Clement L, Erdei É,Tanghe A, Schaerlaekens K, Dumortier FF, Thevelein JM. QTL Analysis ofHigh Thermotolerance with Superior and Downgraded Parental YeastStrains Reveals New Minor QTLs and Converges on Novel Causative AllelesInvolved in RNA Processing. PLoS Genet. 2013;9:e1003693.
29. Parts L, Cubillos FA, Warringer J, Jain K, Salinas F, Bumpstead SJ, Molin M,Zia A, Simpson JT, Quail MA, Moses A, Louis EJ, Durbin R, Liti G. Revealingthe genetic structure of a trait by sequencing a population under selection.Genome Res. 2011;21:1131–8.
30. Ribéreau-Gayon P, Dubourdieu D, Donèche B, Lonvaud A. Handbook ofEnology, Vol. 1: The Microbiology of wine and vinifications. 2nd ed.Paris: Wiley; 2006. https://doi.org/10.1002/0470010363.
31. Marullo P, Aigle M, Bely M, Masneuf-Pomarède I, Durrens P, Dubourdieu D,Yvert G. Single QTL mapping and nucleotide-level resolution of a physiologictrait in wine Saccharomyces cerevisiae strains. FEMS Yeast Res. 2007;7:941–52.
32. Gresham D, Ruderfer DM, Pratt SC, Schacherer J, Dunham MJ, Botstein D,Kruglyak L. Genome-wide detection of polymorphisms at nucleotideresolution with a single DNA microarray. Science. 2006;311:1932–6.
33. Lander ES, Botstein S. Mapping mendelian factors underlying quantitativetraits using RFLP linkage maps. Genetics. 1989;121:185.
34. Semagn K, Babu R, Hearne S, Olsen M. Single nucleotide polymorphismgenotyping using Kompetitive allele specific PCR (KASP): overview of thetechnology and its application in crop improvement. Mol Breed. 2014;33:1–14.
35. Zimmer A, Durand C, Loira N, Durrens P, Sherman DJ, Marullo P. QTL dissectionof lag phase in wine fermentation reveals a new translocation responsible forSaccharomyces cerevisiae adaptation to sulfite. PLoS One. 2014;9:37–9.
36. Magwene PM, Willis JH, Kelly JK. The statistics of bulk Segregant analysisusing next generation sequencing. PLoS Comput Biol. 2011;7:e1002255.
37. Wilkening S, Lin G, Fritsch ES, Tekkedil MM, Anders S, Kuehn R, Nguyen M,Aiyar RS, Proctor M, Sakhanenko NA, Galas DJ, Gagneur J, Deutschbauer A,Steinmetz LM. An evaluation of high-throughput approaches to QTLmapping in Saccharomyces cerevisiae. Genetics. 2014;196:853–65.
38. Bloom JS, Ehrenreich IM, Loo WT, Lite T-LV, Kruglyak L. Finding the sourcesof missing heritability in a yeast cross. Nature. 2013;494:234–7.
39. Novo M, Bigey F, Beyne E, Galeote V, Gavory F, Mallet S, Cambon B, LegrasJ-L, Wincker P, Casaregola S, Dequin S. Eukaryote-to-eukaryote gene transferevents revealed by the genome sequence of the wine yeast Saccharomycescerevisiae EC1118. Proc Natl Acad Sci. 2009;106:16333–8.
40. Marsit S, Mena A, Bigey F, Sauvage F-X, Couloux A, Guy J, Legras J-L,Barrio E, Dequin S, Galeote V. Evolutionary advantage conferred by aneukaryote-to-eukaryote gene transfer event in wine yeasts. Mol BiolEvol. 2015;32(7):1695–707.
41. Schacherer J, Shapiro JA, Ruderfer DM, Kruglyak L. Comprehensivepolymorphism survey elucidates population structure of Saccharomycescerevisiae. Nature. 2009;458:342–5.
42. García-Ríos E, Morard M, Parts L, Liti G, Guillamón JM. The geneticarchitecture of low-temperature adaptation in the wine yeastSaccharomyces cerevisiae. BMC Genomics. 2017;18:159.
43. Marullo P, Yvert G, Bely M, Aigle M, Dubourdieu D. Efficient use of DNAmolecular markers to construct industrial yeast strains. FEMS Yeast Res.2007;7:1295–306.
44. Stott K, Saito K, Thiele DJ, Massey V. Old Yellow Enzyme. The discoveryof multiple isozymes and a family of related proteins. J Biol Chem.1993;268:6097–106.
45. Bruce NC, Williams RE. ‘New uses for an old enzyme’ – the old yellowenzyme family of flavoenzymes. Microbiology. 2002;148:1607–14.
46. Amberg DC, Basart E, Botstein D. Defining protein interactions with yeastactin in vivo. Nat Struct Biol. 1995;2:28–35.
47. Trotter EW, Collinson EJ, Dawes IW, Grant CM. Old yellow enzymes protectagainst acrolein toxicity in the yeast Saccharomyces cerevisiae. Appl EnvironMicrobiol. 2006;72:4885–92.
48. Odat O, Matta S, Khalil H, Kampranis SC, Pfau R, Tsichlis PN, Makris AM. Oldyellow enzymes, highly homologous FMN oxidoreductases with modulatingroles in oxidative stress and programmed cell death in yeast. J Biol Chem.2007;282:36010–23.
49. Jarolim S, Ayer A, Pillay B, Gee AC, Phrakaysone A, Perrone GG, BreitenbachM, Dawes IW. Saccharomyces cerevisiae genes involved in survival of heatshock. G3 Genes Genomes Genet. 2013;3:2321–33.
50. Landolfo S, Politi H, Angelozzi D, Mannazzu I. ROS accumulation andoxidative damage to cell structures in Saccharomyces cerevisiae winestrains during fermentation of high-sugar-containing medium. BiochimBiophys Acta - Gen Subj. 1780;2008:892–8.
51. Zhang M, Shi J, Jiang L. Modulation of mitochondrial membrane integrityand ROS formation by high temperature in Saccharomyces cerevisiae.Electron J Biotechnol. 2015;18:202–9.
52. Pérez-Gallardo R V, Briones LS, Díaz-Pérez AL, Gutiérrez S, Rodriguez-ZavalaJS, Campos-García J, Chavez I: Reactive oxygen species production inducedby ethanol in Saccharomyces cerevisiae increases because of a dysfunctionalmitochondrial iron–sulfur cluster assembly system. FEMS Yeast Res. 2013;13(8):804–19. https://doi.org/10.1111/1567-1364.12090. Epub 2013 Oct 7.
53. Perrone GG, Tan S-X, Dawes IW. Reactive oxygen species and yeastapoptosis. Biochim Biophys Acta - Mol Cell Res. 2008;1783:1354–68.
54. Farah ME, Amberg DC. Conserved actin cysteine residues are oxidative stresssensors that can regulate cell death in yeast. Mol Biol Cell. 2007;18:1359–65.
55. Higgins VJ, Beckhouse AG, Oliver AD, Rogers PJ, Dawes IW. Yeastgenome-wide expression analysis identifies a strong ergosterol andoxidative stress response during the initial stages of an industrial lagerfermentation. Appl Environ Microbiol. 2003;69:4777–87.
56. Novo M, Mangado A, Quirós M, Morales P, Salvadó Z, Gonzalez R.Genome-wide study of the adaptation of Saccharomyces cerevisiae tothe early stages of wine fermentation. PLoS One. 2013;8:e74086.
57. Simpson-Lavy K, Xu T, Johnston M, Kupiec M. The Std1 Activator of theSnf1/AMPK Kinase Controls Glucose Response in Yeast by a RegulatedProtein Aggregation. Mol Cell. 2017;68:1120–1133.e3.
58. Ben-Aroya S, Pan X, Boeke JD, Hieter P. Making temperature-sensitivemutants. Methods Enzymol. 2010;470:181–204.
59. Bloom JS, Kotenko I, Sadhu MJ, Treusch S, Albert FW, Kruglyak L. Geneticinteractions contribute less than additive effects to quantitative traitvariation in yeast. Nat Commun. 2015;6:8712.
60. Peltier E, Sharma V, Marti Raga M, Roncoroni M, Bernard M, Jiranek V, GibonY, Marullo P. Genetic basis of genetic x environment interaction in anenological context. BMC Genomics. 2018;19(1):772. https://doi.org/10.1186/s12864-018-5145-4.
61. Chuffart F, Richard M, Jost D, Burny C, Duplus-Bottin H, Ohya Y, Yvert G.Exploiting single-cell quantitative data to map genetic variants havingprobabilistic effects. PLoS Genet. 2016;12:e1006213.
62. Ansel J, Bottin H, Rodriguez-Beltran C, Damon C, Nagarajan M, Fehrmann S,Francois J, Yvert G. Cell-to-cell stochastic variation in gene expression is acomplex genetic trait. PLoS Genet. 2008;4:e1000049.
63. Marullo P, Bely M, Masneuf-Pomarède I, Pons M, Aigle M, Dubourdieu D,Masneuf-Pomarede I, Pons M, Aigle M, Dubourdieu D. Breeding strategiesfor combining fermentative qualities and reducing off-flavor production in awine yeast model. FEMS Yeast Res. 2006;6:268–79.
64. Peltier E, Bernard M, Trujillo M, Prodhomme DD, Barbe J-C, Gibon Y, MarulloP. Wine yeast phenomics: a standardized fermentation method for assessingquantitative traits of Saccharomyces cerevisiae strains in enologicalconditions. PLoS One. 2018;13:191353.
65. Cingolani P, Platts A, Wang LL, Coon M, Nguyen T, Wang L, Land SJ, Lu X,Ruden DM. A program for annotating and predicting the effects of singlenucleotide polymorphisms, SnpEff. Fly (Austin). 2012;6:80–92.
66. Cheadle C, Vawter MP, Freed WJ, Becker KG. Analysis of microarray datausing Z score transformation. J Mol Diagnostics. 2003;5:73–81.
Publisher’s NoteSpringer Nature remains neutral with regard to jurisdictional claims inpublished maps and institutional affiliations.
Marullo et al. BMC Genomics (2019) 20:680 Page 17 of 17