Embed Size (px)
Citation preview

The ageing of the EU – implications for pensionsA DISCUSSION PAPER
ACTUARIAL ASSOCIATION OF EUROPEMARCH 2016


Foreword ............................................................................................................................................................................................................................................................................
This discussion paper analyses some of the key features of “The 2015 Ageing Report” and “The 2015 Pension Adequacy Report”, published in 2015 by the European Commission. It comments on the underlying population projections and the scope for differences of view and then considers what the projections tell us about future sustainability and adequacy of pension systems in the EU. This paper should be a ‘must read’ for decision-makers and interested parties concerned with pensions and social security throughout the EU.
Although there is a lot of uncertainty in the projections and the paper draws attention to some of their shortcomings, overall the picture is one of improving fiscal sustainability. The 2015 Ageing Report shows significant reductions in the long-term fiscal public expenditure implications of pensions. In part this results from the changes that have been made to the underlying population projections and other technical assumptions, but it also reflects a wide range of pension reform activity in most member states.
Amongst the most prevalent of reform measures are those relating to increasing retirement age, but there have also been important changes to benefit accrual, to indexation, to qualifying periods for pension and some quite radical restructuring of social security program structures, for example the move in several member states from defined benefit to notional defined contribution arrangements.
However, the paper warns that much has been assumed about the impact of reforms and there is still a long way to go to be sure that they will have the impact projected, for example with raising the effective retirement age.
Actuaries are professionals with expertise in the quantification and management of long-term risks which are susceptible to mathematical modelling. This includes all types of social security, as well as complementary workplace or mandatory pensions, whether funded or not. The member associations of the Actuarial Association of Europe have robust educational and professionalism requirements for those who are qualified actuaries and the AAE is also starting to issue model standards of actuarial practice for the associations to adopt for some specifically EU applications. Actuaries are well-placed to play an active role in analysing the impact of future changes on pension provision and to advise EU and national institutions.
The AAE is ready to work with the European Commission, the European Parliament and other stakeholders to assist in further developing the necessary conditions for an adequate European pension environment.
Philip ShierChairperson of the AAE

Brussels March 2016
This paper is prepared by the Social Security Sub-Committee of the Pensions Committee of the AAE
EDITORS:
CHRIS DAYKIN (LEAD EDITOR)
FALCO VALKENBURG
This paper is a discussion paper of the Actuarial Association of Europe. Any views expressed in this paper are views to stimulate and inform further discussion and should not be read as being representative either of the author’s or contributors’ individual opinions or of their employers or professional organisations or an agreed position of the Actuarial Association of Europe.
Contents .....................................................................................................................................................................................................................................
EXECUTIVE SUMMARY 7
1: INTRODUCTION 9
2: DEMOGRAPHIC PROJECTIONS 10
3: PROJECTED GROWTH OF EXPENDITURE ON PENSIONS 18 AND MEASURES TO MODERATE GROWTH
4: SUSTAINABILITY OF PENSION SYSTEMS 29
5: ADEQUACY OF PENSIONS 33
6: ACTUARIES IN SOCIAL SECURITY AND PENSIONS 37
7: OVERALL CONCLUSIONS 39
REFERENCES 40
ANNEX TABLE A.1 41FERTILITY RATES, 1960-2020
ANNEX TABLE A.2 42PROJECTION OF NET MIGRATION FLOWS, 1980-2060
ANNEX TABLE A.3 43PROJECTION OF OLD-AGE DEPENDENCY RATIOS, 2013-2060
ANNEX FIGURE A.1 44IMPACT OF PENSION REFORMS ON THE AVERAGE EFFECTIVE RETIREMENT AGE FROM THE LABOUR FORCE

THE AGEING OF THE EU – IMPLICATIONS FOR PENSIONS actuarial association of europe I 7
Executive Summary ..............................................................................................................................................................................................................................................
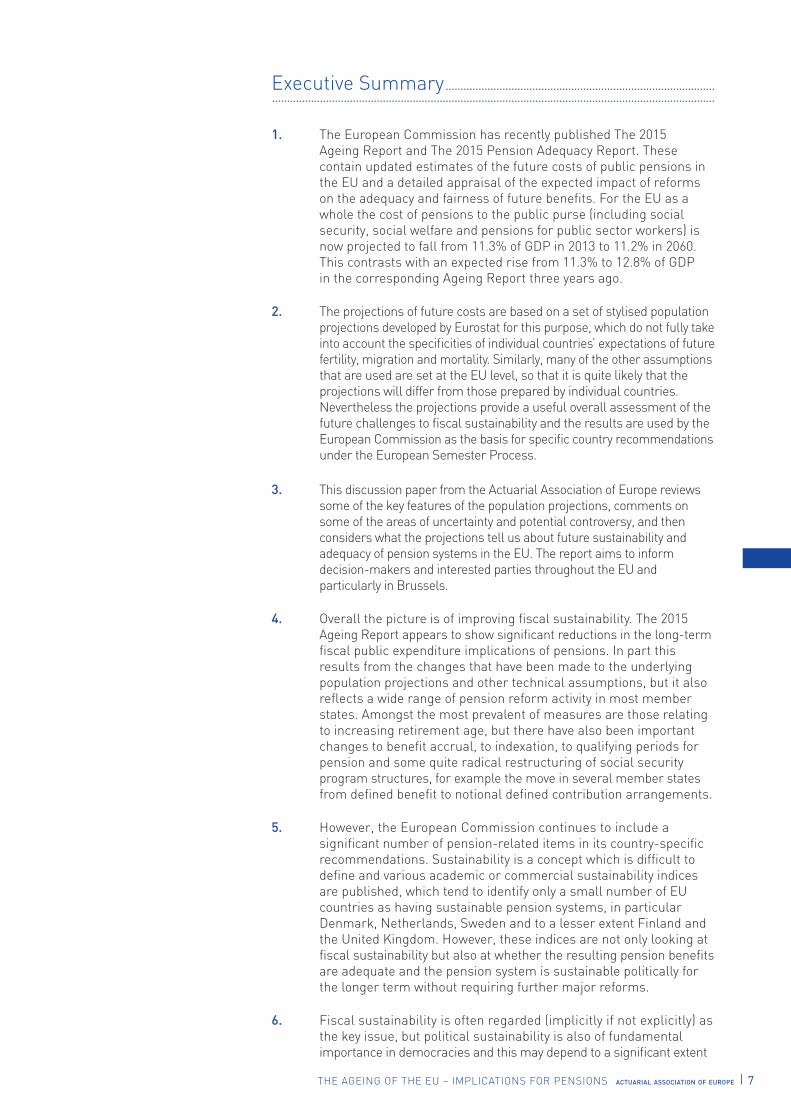
1. The European Commission has recently published The 2015 Ageing Report and The 2015 Pension Adequacy Report. These contain updated estimates of the future costs of public pensions in the EU and a detailed appraisal of the expected impact of reforms on the adequacy and fairness of future benefits. For the EU as a whole the cost of pensions to the public purse (including social security, social welfare and pensions for public sector workers) is now projected to fall from 11.3% of GDP in 2013 to 11.2% in 2060. This contrasts with an expected rise from 11.3% to 12.8% of GDP in the corresponding Ageing Report three years ago.
2. The projections of future costs are based on a set of stylised population projections developed by Eurostat for this purpose, which do not fully take into account the specificities of individual countries’ expectations of future fertility, migration and mortality. Similarly, many of the other assumptions that are used are set at the EU level, so that it is quite likely that the projections will differ from those prepared by individual countries. Nevertheless the projections provide a useful overall assessment of the future challenges to fiscal sustainability and the results are used by the European Commission as the basis for specific country recommendations under the European Semester Process.
3. This discussion paper from the Actuarial Association of Europe reviews some of the key features of the population projections, comments on some of the areas of uncertainty and potential controversy, and then considers what the projections tell us about future sustainability and adequacy of pension systems in the EU. The report aims to inform decision-makers and interested parties throughout the EU and particularly in Brussels.
4. Overall the picture is of improving fiscal sustainability. The 2015 Ageing Report appears to show significant reductions in the long-term fiscal public expenditure implications of pensions. In part this results from the changes that have been made to the underlying population projections and other technical assumptions, but it also reflects a wide range of pension reform activity in most member states. Amongst the most prevalent of measures are those relating to increasing retirement age, but there have also been important changes to benefit accrual, to indexation, to qualifying periods for pension and some quite radical restructuring of social security program structures, for example the move in several member states from defined benefit to notional defined contribution arrangements.
5. However, the European Commission continues to include a significant number of pension-related items in its country-specific recommendations. Sustainability is a concept which is difficult to define and various academic or commercial sustainability indices are published, which tend to identify only a small number of EU countries as having sustainable pension systems, in particular Denmark, Netherlands, Sweden and to a lesser extent Finland and the United Kingdom. However, these indices are not only looking at fiscal sustainability but also at whether the resulting pension benefits are adequate and the pension system is sustainable politically for the longer term without requiring further major reforms.
6. Fiscal sustainability is often regarded (implicitly if not explicitly) as the key issue, but political sustainability is also of fundamental importance in democracies and this may depend to a significant extent
8 I actuarial association of europe THE AGEING OF THE EU – IMPLICATIONS FOR PENSIONS
on whether the resulting benefits are adequate and are seen as manifestly fair and equitable. In our view the long-term projections of future expenditure set out in The Ageing Report are a much more useful indicator of the financial aspect of sustainability than any calculation of implicit pension debt for national balance sheets.
7. Although raising the eligibility age for pension benefits is likely to continue to be favoured as a policy for addressing sustainability, it is important for other factors to be taken into account, such as the responsiveness of the labour market and the extent to which it is reasonable to expect everyone to work for longer.
8. Adequacy is also difficult to define and to measure. Pension systems yield very different outcomes for different groups of people and different individuals within groups, so that statistical measures (and averages in particular) do not tell the whole story. The question of adequacy is intricately connected to the question of fairness, and this can also be considered in a variety of different ways, such as fairness between generations, within generations, between genders, regions and different parts of the labour force.
9. Increasing emphasis on actuarial fairness in pensions, implying a closer relationship between pensions and contributions, entails increasing exposure to risks associated with instability of labour markets. In addition, the general exclusion from labour markets for long periods of those who perform unpaid caring roles is clearly reflected in low pensions and poverty in later life; this represents an existing injustice whose mitigation requires urgent attention. Although most countries provide poverty relief, means-tested social assistance is no substitute for the dignity and security of an unconditional social security or occupational pension. The fundamental challenge is to find the right balance between actuarial fairness and social justice.
10. Changes to pensions resulting from the financial crisis and subsequent austerity measures appear in several countries to have generated a climate of uncertainty and doubts regarding public pension schemes. Public feelings regarding future pensions should be taken seriously into account. The new challenges need to be interpreted in a way which can be communicated effectivelyn to the public at large; wider awareness of the issues people face is of vital importance.
11. The AAE suggests that the range of issues highlighted in chapter 5 regarding the major risks to future pension adequacy and how to mitigate them merit special and increased attention in the next cycle of this analytical work. The AAE also intends to carry out further research into the way in which different mortality tables are being used for projecting pension costs and also for driving policies of increasing retirement age.
12. Actuaries are professionals with expertise in the quantification and management of long-term risks which are susceptible to mathematical modelling. This includes all types of social security, as well as complementary workplace or mandatory pensions, whether funded or not. The member associations of the Actuarial Association of Europe have robust educational and professionalism requirements for those who are qualified actuaries and the AAE is also starting to issue model standards of actuarial practice for the associations to adopt for some specifically EU applications. Actuaries are well-placed to play an active role in analysing the impact of future changes on pension provision and to advise EU and national institutions.

THE AGEING OF THE EU – IMPLICATIONS FOR PENSIONS actuarial association of europe I 9
1: Introduction ................................................................................................................................................................................................................................................................
1.1 In May 2015 the European Commission published The 2015 Ageing Report1. This is an exercise undertaken every three years to review the demographic developments in the EU and the long-term implications for public expenditure on pensions, health care, long-term care, education and unemployment insurance. For the EU as a whole the total expenditure for each of these areas is projected to evolve as follows up to 2060:
% of GDP in 2013 % of GDP in 2060
Pensions 11.3 11.2
Health care 6.9 7.8
Long-term care 1.6 2.7
Education 4.7 4.7
Unemployment 1.1 0.7
Total 25.6 27.1
1.2 Thus pension and unemployment insurance expenditures are expected to decline slightly, whereas health care, and particularly long-term care, costs are projected to increase, whilst education expenditure is expected to stay at about the same level relative to GDP.
1.3 The corresponding publication three years earlier2 showed total expenditure for these areas rising from 26.0% of GDP in 2010 to 29.7% of GDP in 2060 for the then 27 countries of the EU and pension costs increasing from 11.3% to 12.8%. The latest report shows a significant reduction in the long-termcosts relating to pensions. In fact three-quarters of the improvement compared to the report three years ago is accounted for by the lower projected cost of pensions. This reflects a large number of measures taken by differentcountries to address the rising costs of pensions, as well as revised population projections for the countries of the EU.
1.4 The projected expenditure depends on the population projections but also on assumptions about the evolution of the labour market and specific assumptions about changes to legislation in each country.
1.5 Although concerns about long-term fiscal sustainability have been the major driver for pension reforms, the resulting changes to pension systems may result in pensions which are inadequate, as well as having potential for increasing intergenerational inequity and a more general level of perceived unfairness. The 2015 Ageing Report is produced by the Directorate General for Economic and Financial Affairs (DG ECFIN) overseen by the Ageing Working Party established by the Economic Policy Committee. Following on from this work, the Directorate General for Employment, Social Affairs and Inclusion (DG Employment) has now published The 2015 Pensions Adequacy Report3, which seeks to analyse the impact of recent pension reforms in the EU, today and in the future, from the perspective of adequacy of old-age income, social fairness and equity, in contrast to the financial and fiscal sustainability aspects.
1.6 In this report from the Actuarial Association of Europe we analyse and comment on the principles used for the underlying population projections, the realism of the projections of pension costs and the measures for reviewing fairness and equity.
1 The 2015 Ageing Report. Economic and Budgetary Projections for the 28 EU Member States 2013-2060 http://ec.europa.eu/economy_finance/ publications/european_economy/2015/pdf/ee3_en.pdf
2 The 2012 Ageing Report. Economic and Budgetary Projections for the 27 EU Member States 2010-2060 http://ec.europa.eu/economy_finance/publications/european_economy/2012/pdf/ee-2012-2_en.pdf
3 The 2015 Pensions Adequacy Report http://ec.europa.eu/social/main.jsp?langId=en&catId=89&newsId=2339

10 I actuarial association of europe THE AGEING OF THE EU – IMPLICATIONS FOR PENSIONS
IE
FR
UK
SE
BE
DK
FI
EE
CZ
NL
SI
HU
DE
PL
IT
ES
PT
2: Demographic projections ...........................................................................................................................................................................................................................
2.1 The population projections which are used as the basis for The 2015 Ageing Report are the EUROPOP2013 projections prepared by Eurostat and published on 28 March 20144. The work of Eurostat in this area is independent of the political processes associated with the European Council of Ministers and the European Commission. However, the projections reflect some quite strong assumptions about how the population of the EU will develop in future, in particular the following:
• Fertility rates for all member states are assumed to converge to the same (below replacement) level in the very long term (2150) to be consistent with a total fertility rate currently broadly indicated by a group of ‘forerunner’ countries.
• Expectation of life for member states is projected to increase throughout the projection period, with differentials between countries, and between males and females, narrowing and converging in the very long term to the mortality of a ‘leading group’ of 12 countries.
• Migration is assumed to converge in the long-term to a position where there is no net migration between member states. Since no distinction is made between migration from other EU countries and migration from outside the EU this implies that the long-term convergent position is of no net migration for any country.
Fertility2.2 Over the projection period to 2060 Sweden and the UK are assumed to have reached the long-term level and therefore to experience little change to their current fertility levels. France and Ireland have current fertility levels higher than this and are assumed to converge downwards, whilst all other countries are projected to have increasing fertility throughout the period as they trend towards the long-term assumption. Figure 1 illustrates how this works out for 17 of the countries, which together account for about 90% of the total population of the EU at ages 15-64. A full table of the underlying figures for all EU countries is shown at Annex Table A.1.
Figure 1
Total fertility rates 1960-2060 for selection of EU member states
1960 1970 1980 1990 2000 2010 2020 2030 2040 2050 2060
2.3 Although the assumption about convergence of the fertility levels of all member states is a strong one, there would probably be a fair level of consensus that fertility levels will remain below the theoretical replacement level of 2.1 children per woman for the foreseeable future, although there would be different views on whether current differentials between countries will narrow. As a result these assumptions are probably relatively uncontroversial and give a reasonable estimate of future births, although in practice it is likely that fertility will vary quite a lot from year to year, as it has in the past, and differences will remain between countries, reflecting different social,
4 More details of the projections are given in The 2015 Ageing Report: Underlying Assumptions and Projection Methodologies at http://ec. europa.eu/economy_finance/publications/ european_economy/2014/pdf/ee8_en.pdf
IEFRUKSEBEDKFIEECZNLSIHUDEPLITESPT
4,00
3,25
2,50
1,75
1,00
THE AGEING OF THE EU – IMPLICATIONS FOR PENSIONS actuarial association of europe I 11
economic and employment situations and different experience of inwards and outwards migration, which can materially affect fertility levels. This also assumes that member states do not adopt policies to encourage higher levels of fertility, such as higher family benefits.
Migration2.4 The migration assumptions are more difficult. Convergence is assumed from current levels of migration, but insufficient country-specific allowance is made for short-term expectations, possible cyclicality of migration, dependence on economic developments, influence of projected population deficits at working ages, world population trends and wider political and economic factors. As we have seen recently, migration can vary a great deal, and is very sensitive to differences in economic conditions between member states (since there is free movement within the EU) and to external factors (such as the heavy migration into the EU in recent months from Africa and the Middle East as a result of wars and difficult economic conditions in the migrants’ home countries).
2.5 Some changes have been made to the Eurostat methodology for this round of projections to take more account, at least for the short term, of recent trends and current factors. However, the application of the above short-term trend component in the migration projection methodology appears to put more weight on the consistency of the methodology rather than aiming to address the country-specific factors which are likely to affect the net migration level in the short-term. The 2015 Ageing Report specifically reports the reservations of Ireland about the projection of net emigration for so long into the future. Similar reservations might be made about the migration assumptions for a number of member states. High levels of economically driven migration within the EU (and perhaps from outside) will not necessarily just reduce to zero over time but could be reversed as migrants decide to return home.
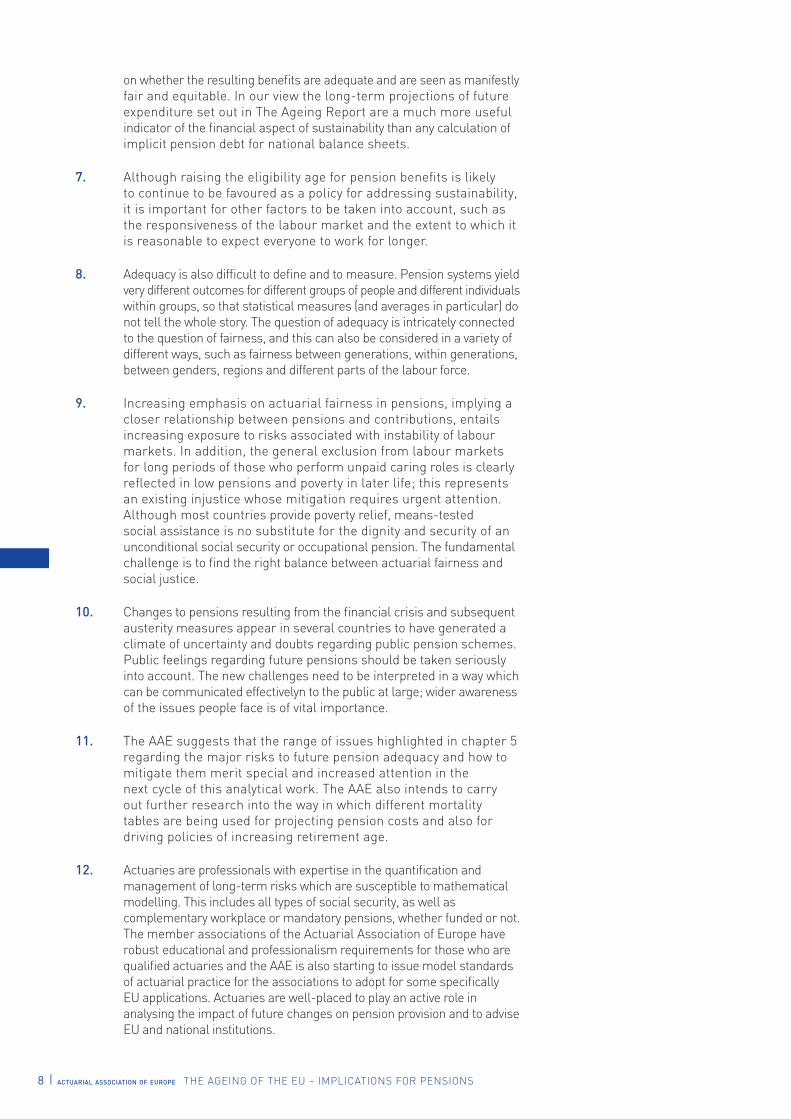
2.6 Apart from the somewhat extreme projection for Luxembourg, which is shown to grow by 86% of its 2013 population by 2060, there are five member states projected to have more than 20% increase in their population as a result of migration alone (not including the additional births which might result) and two member states projected to lose more than 10% of their current population. Table 1 below shows a selection of figures from the migration projections. A more complete table is given in Annex Table A.2.
Table 1
Projection of net migration flows, 2010 and 2020 to 2060Projection of net migration flows (000s)
Cumulative net migration 2013-2060
Cumulative net mign as % of 2013 popn
2010 2020 2040 2060
LU 7.7 11.7 9.1 4.9 429.0 85.8%
BE 135.8 80.2 69.8 42.1 3192.0 28.5%
IT 200.1 348.1 335.9 196.4 15511.0 25.8%
SE 49.7 55.3 49.1 31.2 2273.0 23.7%
AT 27.4 51.3 41.9 24.8 1994.0 23.5%
FI 13.8 22.0 17.7 8.9 812.0 15.0%
UK 266.7 172.1 209.3 171.2 9162.0 14.3%
ES 75.5 -79.0 225.2 275.0 6511.0 14.0%
CZ 14.3 28.0 40.7 21.2 1441.0 13.7%
DK 16.8 18.9 16.3 10.0 755.0 13.5%
12 I actuarial association of europe THE AGEING OF THE EU – IMPLICATIONS FOR PENSIONS
SI -0.5 4.1 5.5 4.5 224.0 10.7%
HU 11.5 24.3 24.2 14.0 943.0 9.5%
DE 130.2 228.7 142.6 97.9 7041.0 8.7%
FR 37.6 90.2 84.0 66.8 3960.0 6.0%
PL -2.1 2.9 25.4 11.6 606.0 1.6%
IE -25.8 -30.3 4.8 15.1 -208.0 -4.5%
LV -35.6 -14.3 0.9 0.0 -237.0 -11.9%
LT -77.9 -37.4 1.0 0.0 -605.0 -20.2%
2.7 Whether or not these are realistic projections only time will tell but they do have a significant influence on the population projections and hence on the projections of expenditure. It is worth pointing out, particularly in this context, but also with regard to other assumptions, that population projections prepared by individual member states may differ materially from these projections prepared for EU purposes.
Mortality2.8 Expectations of life in all member states have increased significantly in recent years, some by rather more than others. However, there are still material differences between member states. For example, male expectation of life at birth in 2012 ranged from 68.4 in Lithuania to 79.9 in Sweden and female expectation of life at birth ranged from 77.9 in Bulgaria to 85.5 in Spain. Expectation of life may also differ considerably between local areas of individual countries and between populations with different characteristics.
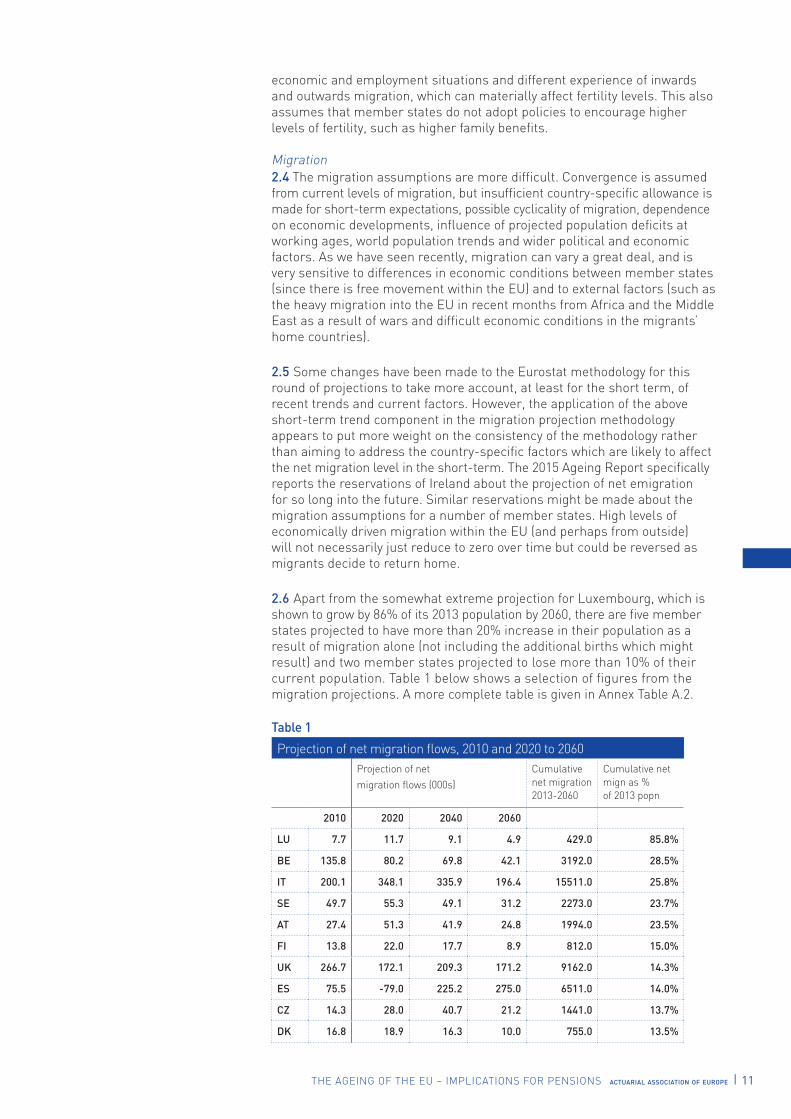
2.9 Expectations of life are projected to continue to improve, with convergence towards the ‘forerunner’ countries, mortality for which is in turn projected to continue improving on the basis of a modified version of the Lee-Carter model. Most projections of mortality improvement in recent years, whether by actuaries or demographers, have proved too conservative and expectations of life have continued to rise much faster than expected. Along with most national projections, the Eurostat projections assume there will be a slowing down of improvement in the future. To the extent that this proves to be a false assumption, the numbers in the older age groups could turn out to be higher, and perhaps significantly so, than the projections indicate. A few countries have recently seen a slight moderation in improvement but it is too early to know whether that will be sustained. It is important for decision-makers to be aware of the considerable uncertainty that there is with all such long-term projections.
Figure 2
Male expectation of life at age 65 to 2060 for selected member states
2010 2020 2030 2040 2050 2060
FR
ES
SE
IT
UK
IE
DE
NL
FI
BE
PT
DK
SI
CZ
PL
EE
HU
24,0
23,0
22,0
21,0
20,0
19,0
18,0
17,0
16,0
15,0
14,0
FRESSEITUKIEDENLFIBEPTDKSICZPLEEHU
THE AGEING OF THE EU – IMPLICATIONS FOR PENSIONS actuarial association of europe I 13
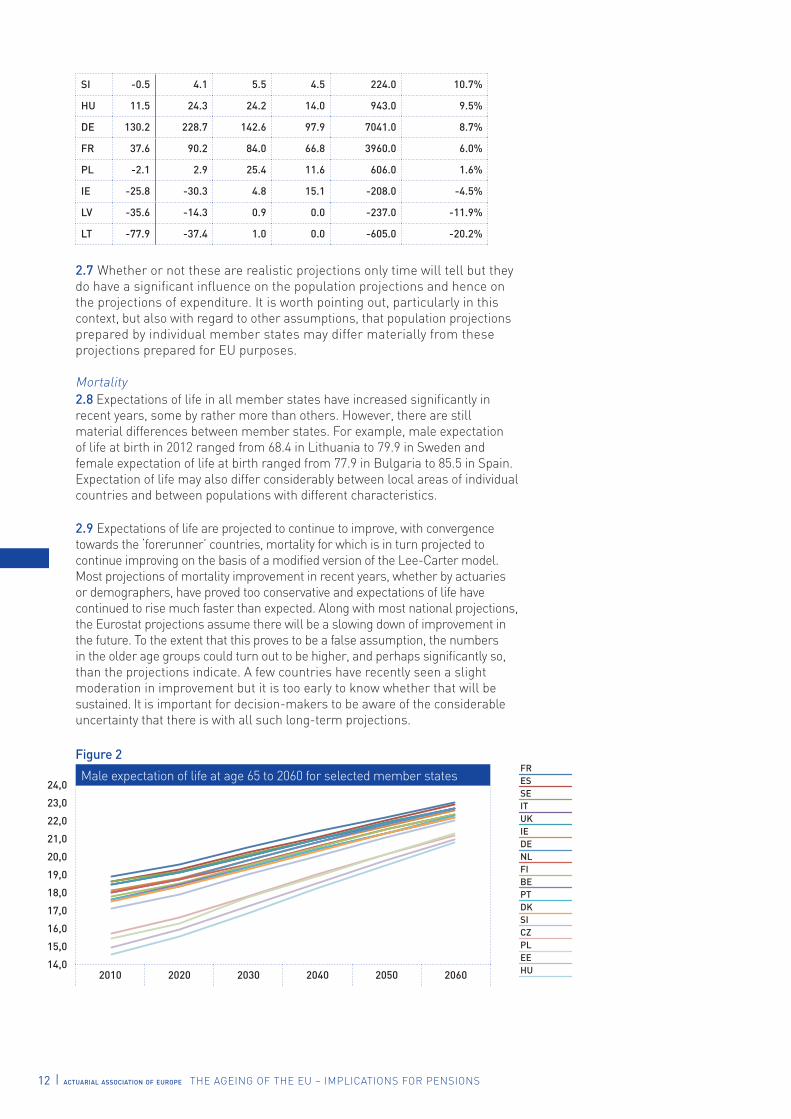
Figure 3
Female expectation of life at age 65 to 2060 for selected member states
2013 2020 2030 2040 2050 2060
2.10 Figure 2 shows projected period expectations of life at age 65 for males for a selection of member states and Figure 3 the same data for females. Although a projection of expectation of life at 65 as high as 26.6 for females in France in 2060 and 23.0 for males seems impressive, there is still projected to be a range of expectations of life down to 23.4 for females and 20.3 for males across the different EU member states. It is perhaps worth noting that current period expectations of life in Japan are about a year higher than in France.
2.11 An important point to note is that these expectations of life are calculated based on the individual age mortality rates in the particular calendar years (known as a period expectation of life). They are a measure of mortality levels in that year but they do not provide an estimate of how long those who have attained a particular age are expected to live. Cohort expectation of life, by contrast, includes an estimate of projected mortality improvement in the future years through which that generation will live, with the mortality rates assumed at each age in each future year incorporating an allowance for the anticipated reduction in mortality rates from the base year to the year for which an estimate of the mortality rate is required. Thus for someone aged 65 in year 1, the mortality rates used are those for age 65 in year 1, age 66 in year 2, age 67 in year 3 and so on, with the mortality rate in year 2 having one year’s improvement, that for year 3 having two years’ improvement and so on. The resulting mortality table for this example is a projection of the likely experience of a cohort of people aged 65 in the base year, following them through the rest of their lifespan. The resulting cohort expectation of life represents the average number of years which someone aged 65 in the base year can expect to live, allowing for the projected improvements in mortality over the rest of their lifetime.
2.12 For a male aged 65 in 2015 UK national population projections estimate 18.7 as the period expectation and 21.3 as the cohort expectation for those attaining age 65 in 2015. The equivalent figures for females are 21.0 as the period expectation of life and 23.6 as the cohort expectation of life. Cohort and period expectations of life at various ages in 2015 and 2060 (for the UK) are shown in Table 2. We would want to emphasize the considerable uncertainty implicit in cohort expectations for 2060, which take into account projected mortality up to 2110. Unfortunately the cohort expectations are not routinely published by Eurostat, even though they are more useful for determining the true expectation of life for a group of pensioners (see also paragraph 3.42 regarding the use of period instead of cohort expectations).
FR
ES
IT
FI
PT
BE
SE
DE
IE
NL
SI
UK
DK
EE
PL
CZ
HU
FRESITFIPTBESEDEIENLSIUKDKEEPLCZHU
27,0
26,0
25,0
24,0
23,0
22,0
21,0
20,0
19,0
18,0
17,0
14 I actuarial association of europe THE AGEING OF THE EU – IMPLICATIONS FOR PENSIONS
Table 2
Cohort and period expectations of life for 2015 and 2060 in the UK
Age Males 2015 Males 2060 Females 2015 Females 2060
Cohort Period Cohort Period Cohort Period Cohort Period
60 25.9 22.7 31.2 28.7 28.3 25.3 33.3 30.7
65 21.3 18.7 26.3 24.3 23.6 21.0 28.3 26.2
70 16.9 14.9 21.6 20.1 19.0 16.9 23.4 21.8
75 12.9 11.4 17.3 16.2 14.7 13.1 18.8 17.6
80 9.4 8.4 13.3 12.6 10.7 9.7 14.6 13.7
Source: Principal 2014-based population projections of the United Kingdom
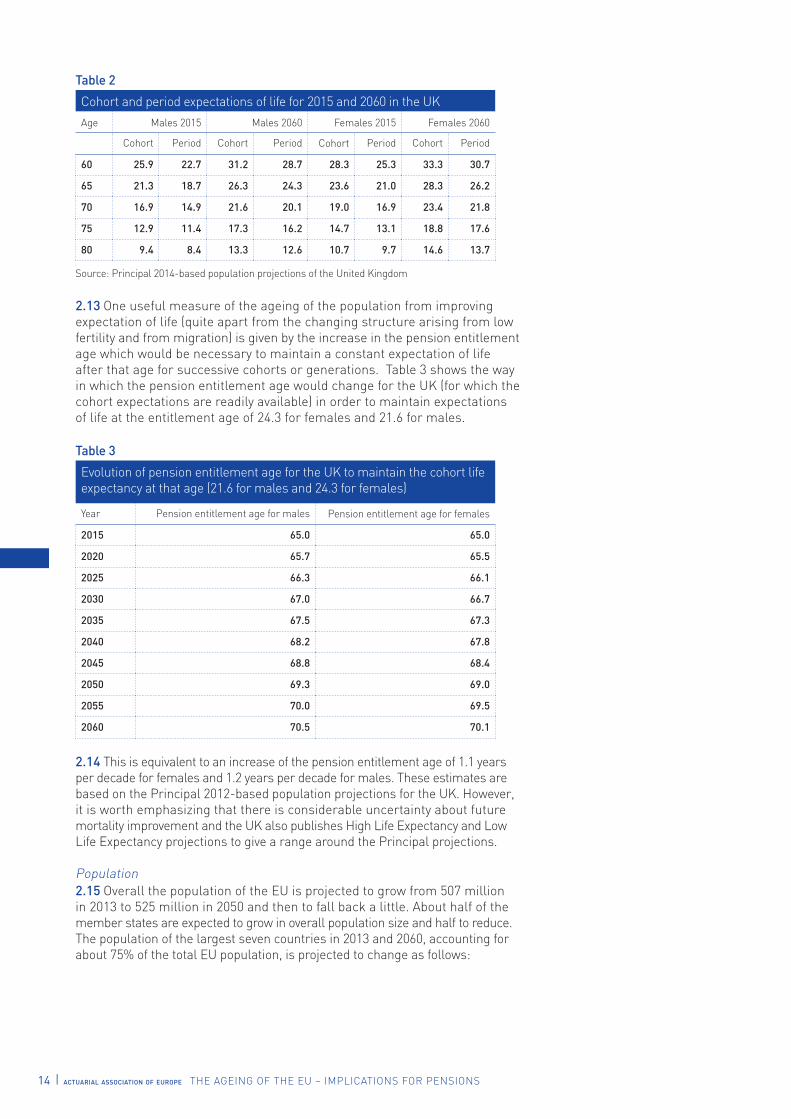
2.13 One useful measure of the ageing of the population from improving expectation of life (quite apart from the changing structure arising from low fertility and from migration) is given by the increase in the pension entitlement age which would be necessary to maintain a constant expectation of life after that age for successive cohorts or generations. Table 3 shows the way in which the pension entitlement age would change for the UK (for which the cohort expectations are readily available) in order to maintain expectations of life at the entitlement age of 24.3 for females and 21.6 for males.
Table 3
Evolution of pension entitlement age for the UK to maintain the cohort life expectancy at that age (21.6 for males and 24.3 for females)
Year Pension entitlement age for males Pension entitlement age for females
2015 65.0 65.0
2020 65.7 65.5
2025 66.3 66.1
2030 67.0 66.7
2035 67.5 67.3
2040 68.2 67.8
2045 68.8 68.4
2050 69.3 69.0
2055 70.0 69.5
2060 70.5 70.1
2.14 This is equivalent to an increase of the pension entitlement age of 1.1 years per decade for females and 1.2 years per decade for males. These estimates are based on the Principal 2012-based population projections for the UK. However, it is worth emphasizing that there is considerable uncertainty about future mortality improvement and the UK also publishes High Life Expectancy and Low Life Expectancy projections to give a range around the Principal projections.
Population 2.15 Overall the population of the EU is projected to grow from 507 million in 2013 to 525 million in 2050 and then to fall back a little. About half of the member states are expected to grow in overall population size and half to reduce. The population of the largest seven countries in 2013 and 2060, accounting for about 75% of the total EU population, is projected to change as follows:
THE AGEING OF THE EU – IMPLICATIONS FOR PENSIONS actuarial association of europe I 15
Table 4
Member states with the largest populations in 2013 and 20602013 (millions) 2060 (millions) Increase
UK 64.1 UK 80.2 +25.1%
France 65.7 France 75.6 +15.1%
Germany 81.4 Germany 70.9 -12.9%
Italy 60.2 Italy 66.3 +10.1%
Spain 46.6 Spain 46.2 -0.9%
Poland 38.6 Poland 33.3 -13.7%
Romania 20.0 Romania 17.4 -13.0%
Total EU 507.2 Total EU 522.7 +3.1%
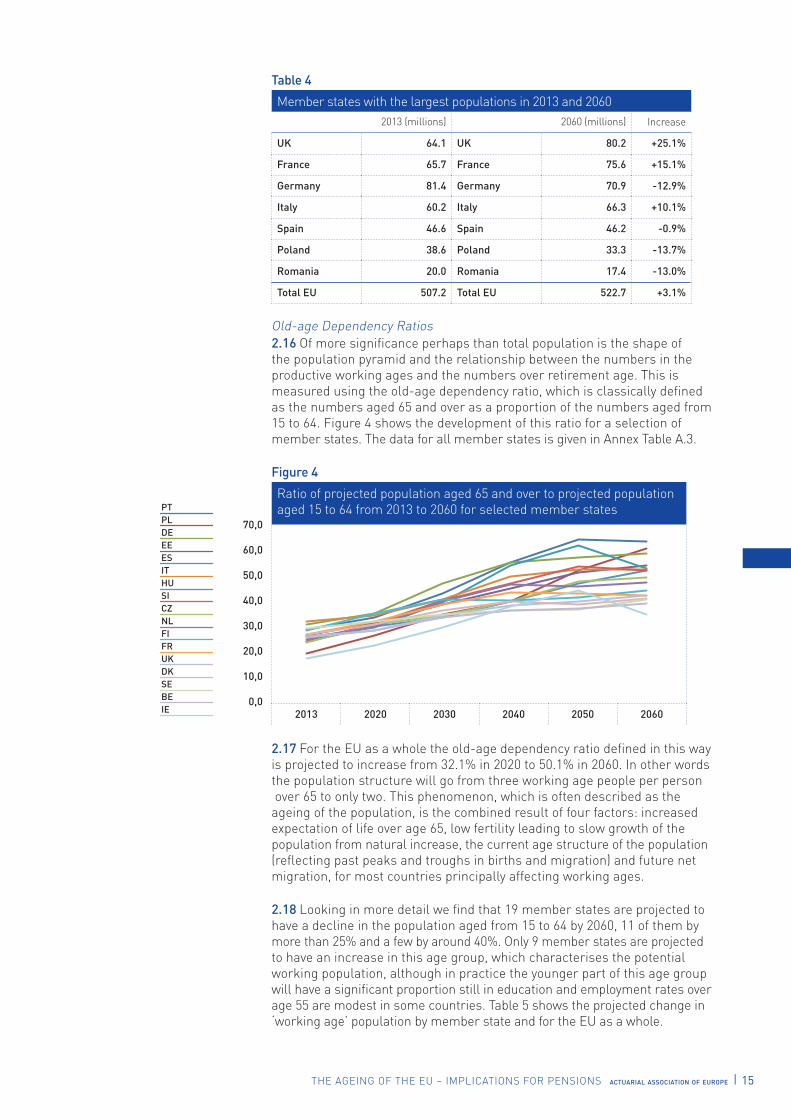
Old-age Dependency Ratios 2.16 Of more significance perhaps than total population is the shape of the population pyramid and the relationship between the numbers in the productive working ages and the numbers over retirement age. This is measured using the old-age dependency ratio, which is classically defined as the numbers aged 65 and over as a proportion of the numbers aged from 15 to 64. Figure 4 shows the development of this ratio for a selection of member states. The data for all member states is given in Annex Table A.3.
Figure 4
Ratio of projected population aged 65 and over to projected population aged 15 to 64 from 2013 to 2060 for selected member states
2013 2020 2030 2040 2050 2060
2.17 For the EU as a whole the old-age dependency ratio defined in this way is projected to increase from 32.1% in 2020 to 50.1% in 2060. In other words the population structure will go from three working age people per person over 65 to only two. This phenomenon, which is often described as the ageing of the population, is the combined result of four factors: increased expectation of life over age 65, low fertility leading to slow growth of the population from natural increase, the current age structure of the population (reflecting past peaks and troughs in births and migration) and future net migration, for most countries principally affecting working ages.
2.18 Looking in more detail we find that 19 member states are projected to have a decline in the population aged from 15 to 64 by 2060, 11 of them by more than 25% and a few by around 40%. Only 9 member states are projected to have an increase in this age group, which characterises the potential working population, although in practice the younger part of this age group will have a significant proportion still in education and employment rates over age 55 are modest in some countries. Table 5 shows the projected change in ‘working age’ population by member state and for the EU as a whole.
PT
PL
DE
EE
ES
IT
HU
SI
CZ
NL
FI
FR
UK
DK
SE
BE
IE
PTPLDEEEESITHUSICZNLFIFRUKDKSEBEIE
70,0
60,0
50,0
40,0
30,0
20,0
10,0
0,0
16 I actuarial association of europe THE AGEING OF THE EU – IMPLICATIONS FOR PENSIONS
Table 5
Projected change in population aged from 15 to 64, 2013 to 2060% Change 2013-2060 % Change 2013-2060 % Change 2013-2060
LT -47.8 HR -26.6 IE 4.6
LV -42.0 HU -23.9 FR 4.7
BG -39.1 SI -18.8 DK 6.2
SK -37.1 ES -16.3 CY 6.4
EL -35.5 CZ -12.6 UK 11.5
PT -35.5 NL -11.6 FI 13.1
PL -33.9 EU -11.6 SE 24.8
EE -31.2 MT -7.0 BE 25.3
RO -28.5 IT -3.9 LU 87.1
DE -28.0 AT -3.2
2.19 While such changes are not impossible, they would represent a major diminution of the size of the potential working population in many countries. In practice this could be offset by increased levels of net inwards migration or by a significant increase in the proportion employed at younger and older ages and, in particular, over the age of 65. Another possibility is that fertility rates may increase in response to declining population, perhaps encouraged by family friendly employment policies, including higher family benefits and better child care arrangements.
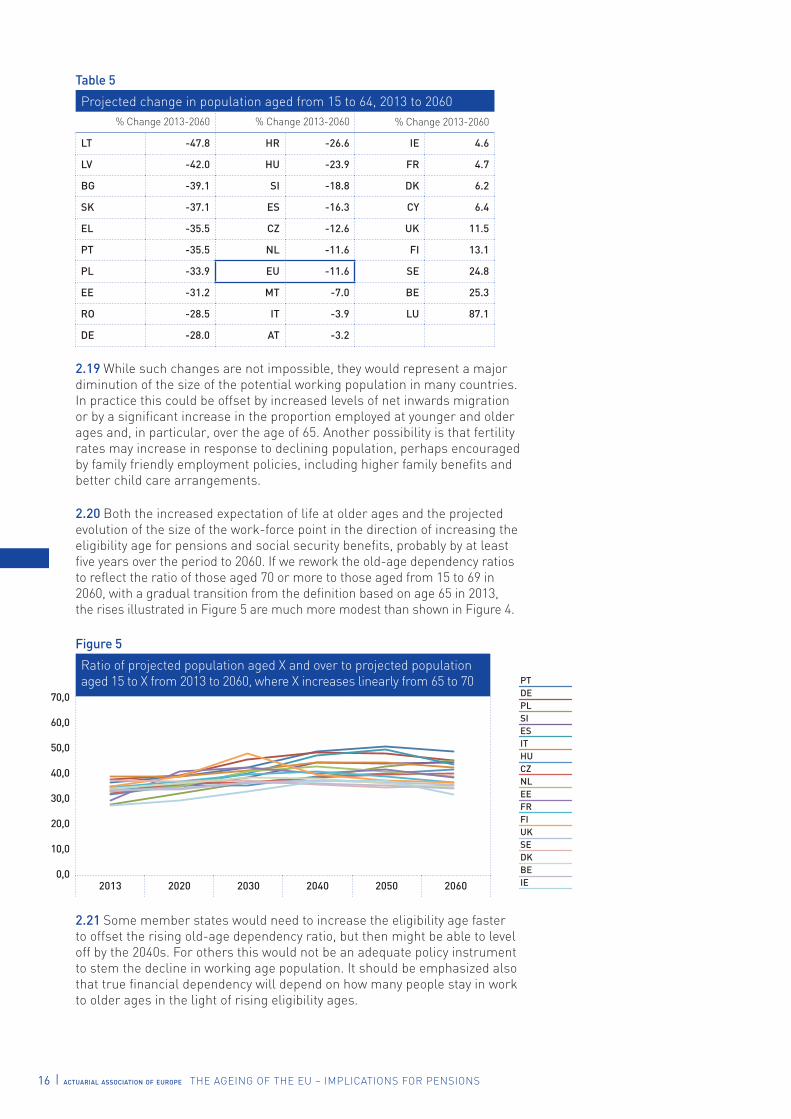
2.20 Both the increased expectation of life at older ages and the projected evolution of the size of the work-force point in the direction of increasing the eligibility age for pensions and social security benefits, probably by at least five years over the period to 2060. If we rework the old-age dependency ratios to reflect the ratio of those aged 70 or more to those aged from 15 to 69 in 2060, with a gradual transition from the definition based on age 65 in 2013, the rises illustrated in Figure 5 are much more modest than shown in Figure 4.
Figure 5
Ratio of projected population aged X and over to projected population aged 15 to X from 2013 to 2060, where X increases linearly from 65 to 70
2013 2020 2030 2040 2050 2060
2.21 Some member states would need to increase the eligibility age faster to offset the rising old-age dependency ratio, but then might be able to level off by the 2040s. For others this would not be an adequate policy instrument to stem the decline in working age population. It should be emphasized also that true financial dependency will depend on how many people stay in work to older ages in the light of rising eligibility ages.
PT
DE
PL
SI
ES
IT
HU
CZ
NL
EE
FR
FI
UK
SE
DK
BE
IE
70,0
60,0
50,0
40,0
30,0
20,0
10,0
0,0
PTDEPLSIESITHUCZNLEEFRFIUKSEDKBEIE

THE AGEING OF THE EU – IMPLICATIONS FOR PENSIONS actuarial association of europe I 17
Older age population2.22 Although the population over the age of 65 is projected to grow significantly in almost all countries, the population over the age of 80 is projected to grow much faster, trebling or more in seven member states and at least doubling in almost all. For the EU as a whole the numbers aged 80 and over are projected to increase from 25.9 million (5.1% of the total population) to 61.7 million (11.8% of the total). The eligibility age is critical for pension expenditure, but it is likely that expenditure on health care and long-term care will increase as a result of the growth in the very old population. This is a key driver of the increases in public expenditure summarised in paragraph 1.1. There is room for discussion whether the increased numbers over age 80 will in the future be significantly healthier than today’s over 80 population, which would soften the impact on health and long term care costs, but more research is needed to study likely future changes in ‘healthy life expectancy’. In a similar way to pension eligibility, one could compare the population over 85 in 2060 with the population over 80 in 2013. However, the projections of health care and long-term care costs in The 2015 Ageing Report point to large increases for all countries, in quite a few cases by over 30%.
Demographic Projections – Summary 2.23 In this section we have examined some key aspects of the Eurostat population projections which are used as the basis for the projections of future public expenditure in The Ageing Report 2015. It is important to remember that these are projections based on a set of plausible assumptions, rather than forecasts. As we have noted, some of the assumptions are rather formulaic and may not be entirely realistic. In practice the future is likely to differ, possibly materially, from the assumptions made. Particularly significant in terms of the conclusions to be drawn would be continuing faster growth in life expectancy at older ages and changing patterns of net migration at working ages. One of the challenges of achieving sustainability of pension costs is to find ways of reducing the impact of uncertainty about future mortality improvement through design features. The AAE would emphasize the importance of looking at the sensitivity of the projections to key assumptions in order to understand better the resilience of pension systems to a wide range of possible future outcomes.
18 I actuarial association of europe THE AGEING OF THE EU – IMPLICATIONS FOR PENSIONS
3: Projected growth of expenditure on pensions and measures to moderate growth ....................................................................................................................................................................................................................
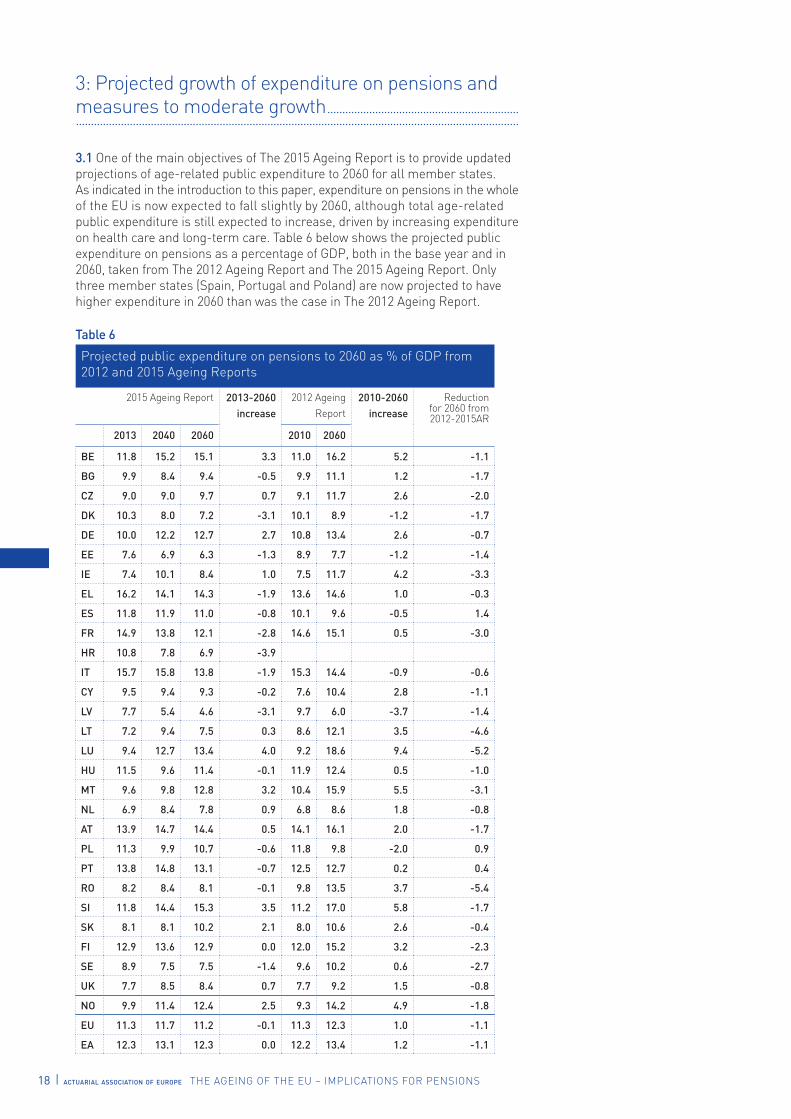
3.1 One of the main objectives of The 2015 Ageing Report is to provide updated projections of age-related public expenditure to 2060 for all member states. As indicated in the introduction to this paper, expenditure on pensions in the whole of the EU is now expected to fall slightly by 2060, although total age-related public expenditure is still expected to increase, driven by increasing expenditure on health care and long-term care. Table 6 below shows the projected public expenditure on pensions as a percentage of GDP, both in the base year and in 2060, taken from The 2012 Ageing Report and The 2015 Ageing Report. Only three member states (Spain, Portugal and Poland) are now projected to have higher expenditure in 2060 than was the case in The 2012 Ageing Report.
Table 6
Projected public expenditure on pensions to 2060 as % of GDP from 2012 and 2015 Ageing Reports
2015 Ageing Report 2013-2060 increase
2012 Ageing Report
2010-2060 increase
Reduction for 2060 from 2012-2015AR
2013 2040 2060 2010 2060
BE 11.8 15.2 15.1 3.3 11.0 16.2 5.2 -1.1
BG 9.9 8.4 9.4 -0.5 9.9 11.1 1.2 -1.7
CZ 9.0 9.0 9.7 0.7 9.1 11.7 2.6 -2.0
DK 10.3 8.0 7.2 -3.1 10.1 8.9 -1.2 -1.7
DE 10.0 12.2 12.7 2.7 10.8 13.4 2.6 -0.7
EE 7.6 6.9 6.3 -1.3 8.9 7.7 -1.2 -1.4
IE 7.4 10.1 8.4 1.0 7.5 11.7 4.2 -3.3
EL 16.2 14.1 14.3 -1.9 13.6 14.6 1.0 -0.3
ES 11.8 11.9 11.0 -0.8 10.1 9.6 -0.5 1.4
FR 14.9 13.8 12.1 -2.8 14.6 15.1 0.5 -3.0
HR 10.8 7.8 6.9 -3.9
IT 15.7 15.8 13.8 -1.9 15.3 14.4 -0.9 -0.6
CY 9.5 9.4 9.3 -0.2 7.6 10.4 2.8 -1.1
LV 7.7 5.4 4.6 -3.1 9.7 6.0 -3.7 -1.4
LT 7.2 9.4 7.5 0.3 8.6 12.1 3.5 -4.6
LU 9.4 12.7 13.4 4.0 9.2 18.6 9.4 -5.2
HU 11.5 9.6 11.4 -0.1 11.9 12.4 0.5 -1.0
MT 9.6 9.8 12.8 3.2 10.4 15.9 5.5 -3.1
NL 6.9 8.4 7.8 0.9 6.8 8.6 1.8 -0.8
AT 13.9 14.7 14.4 0.5 14.1 16.1 2.0 -1.7
PL 11.3 9.9 10.7 -0.6 11.8 9.8 -2.0 0.9
PT 13.8 14.8 13.1 -0.7 12.5 12.7 0.2 0.4
RO 8.2 8.4 8.1 -0.1 9.8 13.5 3.7 -5.4
SI 11.8 14.4 15.3 3.5 11.2 17.0 5.8 -1.7
SK 8.1 8.1 10.2 2.1 8.0 10.6 2.6 -0.4
FI 12.9 13.6 12.9 0.0 12.0 15.2 3.2 -2.3
SE 8.9 7.5 7.5 -1.4 9.6 10.2 0.6 -2.7
UK 7.7 8.5 8.4 0.7 7.7 9.2 1.5 -0.8
NO 9.9 11.4 12.4 2.5 9.3 14.2 4.9 -1.8
EU 11.3 11.7 11.2 -0.1 11.3 12.3 1.0 -1.1
EA 12.3 13.1 12.3 0.0 12.2 13.4 1.2 -1.1

THE AGEING OF THE EU – IMPLICATIONS FOR PENSIONS actuarial association of europe I 19
Source: The 2015 Ageing Report. Executive Summary Table 1 and Table II.1.31 For some countries the projections were updated after the 2012 Ageing Report following the adoption of reforms and so these tables differ from those shown in the 2012 Ageing Report
3.2 There are still a few countries which are projected to spend a significantly greater proportion of GDP on public pensions in 2060 than they do now, but the situation seems less concerning overall than it appeared three years ago and might be regarded as more fiscally sustainable. Significant reforms took place in some countries following The 2012 Ageing Report (see footnote to Table 6) and a few more have taken place since. In general the latest population projections have resulted in lower old-age dependency ratios than those used for The 2012 Ageing Report (principally because of slightly higher fertility rates and changes to the migration assumptions and the base population). There have also been changes to the assumptions about how higher eligibility ages will affect the labour force at older ages. 3.3 There are ten countries for which the pension costs (as a % of GDP) are projected to rise up to 2040 and fall thereafter. This is indicative that a significant proportion of the savings expected in the long term will only be realised in the later part of the projection period from 2040 to 2060.
3.4 However, it would be as well not to become complacent, since these are only projections based on a particular set of assumptions. Section 1.8 of Part II of The 2015 Ageing Report illustrates the results of some sensitivity tests which show how much the pension costs could rise for individual countries and for the EU as a whole if life expectancy rose more quickly, net inwards migration was lower or growth of labour productivity or Total Factor Productivity was lower. On the other hand the pension costs could increase more slowly if there was a stronger growth in employment rates, higher levels of immigration or if there was a widespread policy change to link eligibility ages to life expectancy. There are also considerable uncertainties about the impact of reforms already enacted or proposed, which may prove to be less effective than has been assumed in raising the effective age at which people retire and increasing labour force participation at older ages. On the other hand some changes which have been proposed to raise retirement age in the future have not yet been taken into account in the projections since they have not been put into statute, even though a commitment to future change has been made.
3.5 Good actuarial practice always entails an analysis of how far outcomes have deviated from previous projections and estimates, which may provide important clues to the developing experience and should also be used to inform reviews of the models and assumptions. The AAE recommends that such an analysis of actual against expected should form part of the periodic Ageing Report publications.
Successful pension reforms
Eligibility age3.6 What changes have been made or are planned which will materially improve the sustainability of pension systems? Probably the most widespread changes have been to the eligibility age for pensions (variously known as normal retirement age, social security pension age, state pension age and other similar terms). In view of the rapid increases in expectation of life at older ages, resulting in a fast growing elderly population, a natural response would seem to be to increase the age at which people move from being classified as working age to being pensioners. For many years expectation of life at retirement age has been increasing but no change was made to retirement age. In fact people have tended to start work later (because of increased levels of higher education), retire earlier and then live for longer. A fall in the size of the working population from lower birth rates, combined
20 I actuarial association of europe THE AGEING OF THE EU – IMPLICATIONS FOR PENSIONS
with outwards migration from some countries and changes in the age structure of the population resulting from fluctuations in births and migration in past years, has more recently exacerbated the worsening of the old-age dependency ratio, a trend which is set to continue.
3.7 Increasing the age of eligibility for pension has several potential benefits for the economy. It reduces the period for which pension will be received, it should in principle lead to increased numbers in employment at older ages, and hence to higher contribution income to the social security programme, and it rebalances the ratio between the period of employment and the period of retirement. The actual impact will vary according to how the change is made and will depend on behavioural responses and on the ability of economies to absorb more people staying in employment to older ages. In practice the effective age at which people on average leave the labour force may be several years before the official eligibility age for pension. Simply increasing the eligibility age for pension benefits may be equivalent to a benefit cut if workers are not able to continue in employment to the higher age.
3.8 There are many issues which need to be taken into account in adopting such policies. Raising the eligibility age for retirement benefits is not a panacea. Not everyone is fit enough to continue in employment for additional years and some types of employment do not lend themselves to a significant extension of working life. For a more detailed analysis of the impact of raising eligibility age we refer to a paper which is shortly to be published by the Population Issues Working Group of the International Actuarial Association (PIWG, 2016).
3.9 Figure A.1, taken from Graph I.2.1 of the 2015 Ageing Report, shows the average expected exit age from the labour force in 2060 on the basis of retirement age provisions prior to recent reforms and the increased expected exit ages which are anticipated as a result of the reforms. It can be seen that the effective exit age will still be below 66 for the majority of countries, even though by 2060 most countries will have raised the eligibility age to 67 or higher.
3.10 We can categorise reforms taking into account increased life expectancy at retirement into five main types:
• Legislated increases in the age at which pension can be taken without reduction [explicit pre-planned increase of retirement age];
• Formula-based reviews of the eligibility age to maintain the expectation of life in retirement or a ratio of expected period on pension to the expected period of working life [increasing eligibility age as a function of the increase in life expectancy];
• Using sustainability factors or life expectancy coefficients to apply to the pension payable at retirement [controlling the rising cost from increased life expectancy without actually increasing retirement age, but in the expectation of incentivising later retirement];• Adopting a notional (or non-financial) defined contribution structure [incentivising later retirement by a defined contribution approach]; and• Incentivising later retirement by increasing the number of years of contributions required to qualify for a full pension [incentivising later retirement].
3.11 A traditional approach to raising retirement age is to legislate for a schedule of future increases at specified times in the future, maybe with phasing in periods to avoid sudden changes in eligibility age between people born only a few days apart. One problem with this approach is its relative rigidity, as the evolution of mortality improvement at older ages may be faster or slower than has previously been expected and the labour market may not respond as hoped. In general it may be better to adopt a more flexible
THE AGEING OF THE EU – IMPLICATIONS FOR PENSIONS actuarial association of europe I 21
approach and it has been increasingly popular for countries to adopt some form of indexation of the eligibility age to expectation of life or automatic adjustment of benefits at award based on expectation of life at the eligibility age.
3.12 In Denmark a specific formula for calculating the pension age on the basis of future observed mean life expectancy for 60 year olds has been enshrined in legislation. Changes in the pension age are to be calculated every five years but they have to be confirmed by Parliament fifteen years before they take effect.
3.13 The UK has made provision for a review of pension age at least once in every six years. The reviews will consist of a report from the Government Actuary’s Department on the relationship between the expected period in receipt of a pension over the State Pension Age and the total adult life (with a benchmark that the ratio should be maintained at around one-third) and an additional report from an expert panel considering other relevant factors. Legislation is already in place to raise the State Pension Age (SPA) (for both males and females) to 66 in 2020 and to 67 over the years 2026 to 2028. The expectations from the review process are that the SPA could rise by a year every 12 years or so after 2028.
3.14 In Portugal, with effect from 2015, the entitlement age for old-age pensions is expected to increase in response to changes in life expectancy. Starting with a statutory retirement age of 66 in 2015, the retirement age will be increased each year by two-thirds of the increase in life expectancy at 65 measured two years earlier.
3.15 In Cyprus, the statutory retirement age will be automatically adjusted every five years in line with life expectancy at the statutory retirement age, the mechanism to be first applied in 2018, so that the first adjustment in statutory retirement age would cover the period 2018-2023.
3.16 As from 2021 in Greece the statutory retirement age will be adjusted every three years in line with changes in life expectancy.
3.17 In Netherlands, where the eligibility age is scheduled to increase to 67 in 2021, it will be linked thereafter to cohort life expectancy at 65, as projected by Statistics Netherlands. If the increase in life expectancy is 3 months or more, the retirement age will be increased by 3 months. If the movement is less than 3 months, the retirement age will stay as it is. The government will decide each year on this basis the retirement age to apply five years later.
3.18 In the Slovak Republic, as from 2017, the retirement age will be automatically increased each year by the year-on-year difference in a five-year moving average of unisex pensioner life expectancy.
3.19 Reform of the pension system to a notional defined contribution (NDC) format was undertaken in Sweden and Italy in 1994 and subsequently by Poland, Latvia and Norway. A full description of NDC is beyond the scope of this paper but the basic concept is for contributions that are paid by employers and employees to be accumulated in notional accounts, in a similar way to an invested defined contribution private pension plan. At the age when pension is to be taken, the accumulated contributions in the individual’s account are divided by a notional annuity value for the relevant age. The effect of this is to create a similar incentive to later retirement to that in a private DC plan, since a later retirement age implies contributing for longer and building up a larger individual account, as well as having a lower annuity value, which thus leads to a higher level of pension. Reductions in the replacement ratio (relative to final salary) can therefore be compensated by the individual deciding to retire and take the pension later, subject of course to being able to continue in employment. As life expectancy increases this can be taken
22 I actuarial association of europe THE AGEING OF THE EU – IMPLICATIONS FOR PENSIONS
into account automatically in the notional annuity values used to convert the individual account into pension.
3.20 The fourth category of reform to eligibility age is variously described as using a ‘sustainability factor’ or ‘life expectancy coefficient’. In Finland the ‘life expectancy coefficient‘ is calculated as the ratio of period life expectancy at age 62 in 2009 over the period life expectancy calculated in each future year. Application of this coefficient to the pension at award results in a reduction in the amount of the initial pension, which compensates for the longer expected period for which the pension will be drawn.
3.21 A similar ’sustainability factor’ is to be applied in Spain from 2019, whereby the initial amount of pension at award will be adjusted to take into account development of the life expectancy of pensioners.
3.22 The economic effect of this type of sustainability factor may be similar to increasing the eligibility age directly, although this will depend on whether it is permitted to draw pensions at a reduced rate before the eligibility age. A key issue for the introduction of such policy changes is to manage well the communications with members. From an actuarial perspective we would also recommend using cohort expectations of life for any indexation of eligibility age or for eligibility age sustainability factors, since they take into account directly how long the cohort retiring at that age is expected to live. Some of the reforms mentioned above clearly assume the use of cohort expectations of life, whereas others are less clear and probably imply the use of period rates.
3.23 A somewhat different ‘sustainability factor’ is applied in Germany, which is based on an overall adjustment to pensions in payment to offset changes to the old-age dependency ratio. 3.24 France has made use of the longer contribution period approach, effectively encouraging members to work longer and take their pension later in order to meet the more demanding contribution conditions.
Accrual of pensions3.25 Pension reforms have by no means been limited to changes to eligibilityage and restructuring as NDC. Other parametric reforms have been undertaken in a number of member states, involving changes to the accrual of pensions, moving to calculation of pensionable salary based on career average earnings, instead of earnings over a limited period or taking the best years, and revisions to the formula for indexation of pensions in payment, typically away from linkage to earnings to indexation in line with the consumer prices index, assumed in the longer term to be 1% or 2% a year lower on average.
3.26 In Ireland, there have been significant changes to both state and public sector pensions over the last 5 years. Public sector pensions for those recruited from January 2013 onwards have been amended from final salary DB to career average DB for all new entrants. The retirement age for state pensions has been raised from 65 to 66 with effect from 2014. This will rise further to 67 in 2021 and again to 68 in 2028. The main concerns within the pension system remain the sustainability of state pensions at the current levels but the government has established a task force to explore the implementation of mandatory pensions in the coming 5 year period.
3.27 Another key policy in some member states has been to introduce or promote the development of complementary funded occupational private pension plans. Countries such as the Netherlands and Denmark already have almost complete coverage of the employed population by occupational plans, on a traditional insured defined contribution basis in Denmark and
THE AGEING OF THE EU – IMPLICATIONS FOR PENSIONS actuarial association of europe I 23
target benefit plans (evolving out of defined benefit but with a desire to keep the contributions fixed) in the Netherlands.
3.28 In Bulgaria, Estonia, Croatia, Latvia, Lithuania, Poland and Romania mandatory complementary pensions based on individual accounts (DC) have been introduced, although some of these have been cut back in order to enable contributions to the social security program to be increased and in Poland they ceased to be mandatory in 2014. Mandatory occupational pension schemes, either by law or by labour agreements, exist in Austria, Belgium (for the private sector), Denmark, Malta, Netherlands, Portugal, Sweden and Norway.
3.29 In recent years Germany has introduced new funded pension vehicles, with an individual pension savings account known as Riesterpension and also a structure called Pensionfonds to encourage employers to implement occupational pensions with external investments, instead of the traditional book reserve (internally invested) Direktzusagen approach.
3.30 The United Kingdom has always relied on a significant part of retirement income coming from funded employer-sponsored private pension plans (with similar but often unfunded occupational pension plans in the public sector). In recent years there has been an overwhelming trend (at least in the private sector) to close defined benefit plans to future accrual and to replace them with employer-sponsored defined contribution plans. From 2013 a system of auto-enrolment has been introduced, whereby all employers are required to automatically enrol all eligible employees (those below State Pension Age and with income above a low threshold level) into a workplace pension plan. Eligible plans can be defined benefit but in practice they are nearly always defined contribution outside the public sector. Individuals can opt out but they will be auto-enrolled again every three years and if they change employer. When fully in place there will be regular contributions of 4% of earnings from the employee (plus 1% from tax relief) and 3% from the employer.
Consequences of pension developments
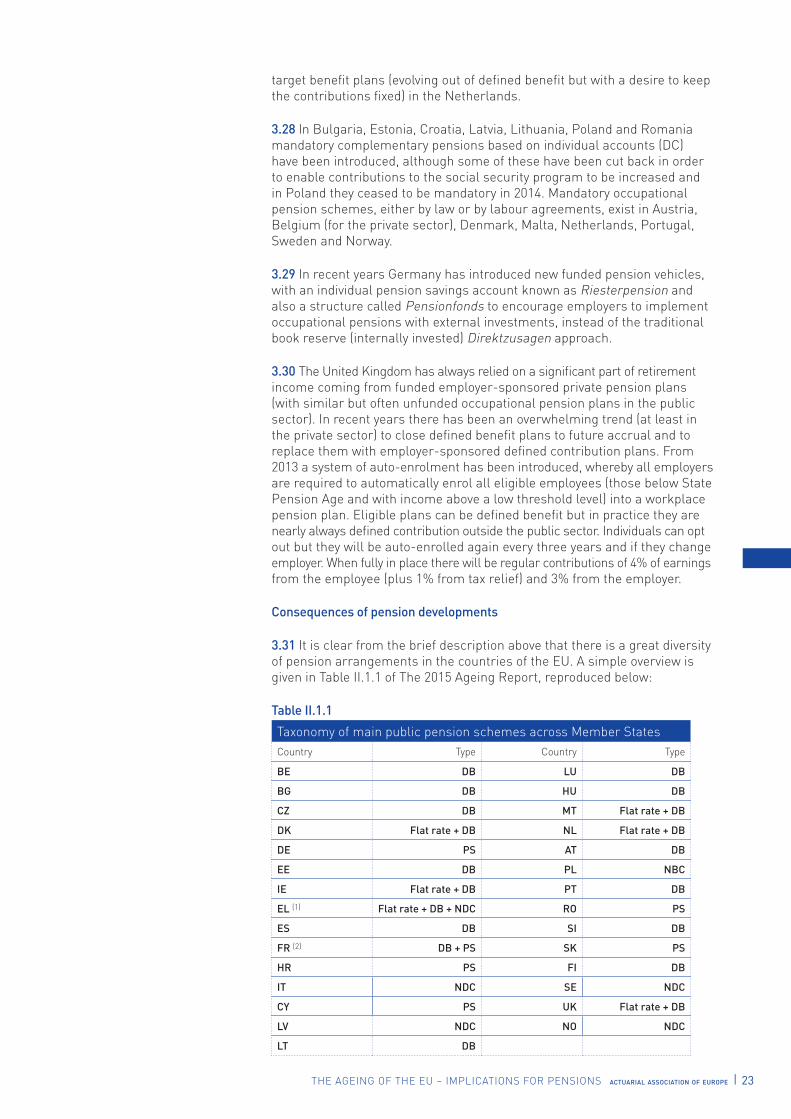
3.31 It is clear from the brief description above that there is a great diversity of pension arrangements in the countries of the EU. A simple overview is given in Table II.1.1 of The 2015 Ageing Report, reproduced below:
Table II.1.1
Taxonomy of main public pension schemes across Member StatesCountry Type Country Type
BE DB LU DB
BG DB HU DB
CZ DB MT Flat rate + DB
DK Flat rate + DB NL Flat rate + DB
DE PS AT DB
EE DB PL NBC
IE Flat rate + DB PT DB
EL (1) Flat rate + DB + NDC RO PS
ES DB SI DB
FR (2) DB + PS SK PS
HR PS FI DB
IT NDC SE NDC
CY PS UK Flat rate + DB
LV NDC NO NDC
LT DB
24 I actuarial association of europe THE AGEING OF THE EU – IMPLICATIONS FOR PENSIONS
(1) The public supplementary pension funds are NDC since 2015. (2) Point system refers to the ARRCO and AGIRC pension schemes. DB: Defined benefit systemNDC: National defined contribution schemePS: Point systemSource: Commission services, EPC.
Noteworthy are the four countries with a flat-rate basic pension providing the main plank of the social security program – Denmark, Ireland, Netherlands and the UK. The rest of the Danish system is DC, contrary to the indication in the table above, and, as already mentioned, the Netherlands has a quasi-mandatory system of target benefit plans with a DB formula. In some countries with a ‘points system’, such as France, there are many similarities to NDC.
3.32 In view of the great diversity of pension systems, the modelling of future pension costs for The 2015 Ageing Report necessitated the use of national models, rather than a single modelling approach at EU level for all countries. Concerned about the scope for differing (and potentially inconsistent) approaches the Ageing Working Group (with representatives from all the member states), together with the ECFIN Directorate of the Commission, carried out an in-depth peer review of the projections carried out by individual member states.
3.33 One aspect to note about the diversity of pension provision is that some countries tend to have lower public expenditure on pensions as a result of heavier reliance on complementary pension plans. So it is essential to consider the question of what level of cost is sustainable in the context of the total picture of how pensions are provided.
3.34 It is important to note the focus of The 2015 Ageing Report on projections of future cash flows in respect of benefits. Some commentators have tended to focus on liabilities in terms of implicit pension debt, without due regard to the way in which social security programs are financed and the interplay between different generations. Comparisons of implicit pension debt, as shown in national accounts and government statistics, can be quite misleading as a measure of future sustainability and should be treated with a great deal of caution.
3.35 Table II.1.5 of The 2015 Ageing Report shows the average effective exit age from labour market for each member state. This shows a surprisingly high proportion of countries with the effective exit age from labour market still at 65 in 2060, although statutory eligibility ages are legislated to increase significantly beyond 65 for most member states by 2060. What it does probably indicate is that in some countries the level of pensions actually coming into payment is lower due to the early retirement actuarial reduction factors applied to them. If this is the case then the projections of pension costs may be underestimated compared to what would have been provided if the effective age from labour market was assumed to be closer to the statutory pensionable age.
3.36 In its communication to the DG ECFIN in April 2013 with regards to the issue of ensuring consistency between active insured population and total employment (see point 2 of that paper), the AAE suggested that “the way in which DG ECFIN approaches the issue of achieving internal consistency between the national pension model and DG ECFIN’s labour force cohort simulation model should be fully transparent”. We wish to emphasize the importance of transparency particularly when modelling the impact of national pension reforms on the labour market using the DG ECFIN’s centralised labour force cohort simulation model.
THE AGEING OF THE EU – IMPLICATIONS FOR PENSIONS actuarial association of europe I 25
-3.0 -2.0 -1.0 0 1.0 2.0 3.0 4.0 5.0 6.0
Statutory retirement age is legislated to increase in line with increase in life expectancy
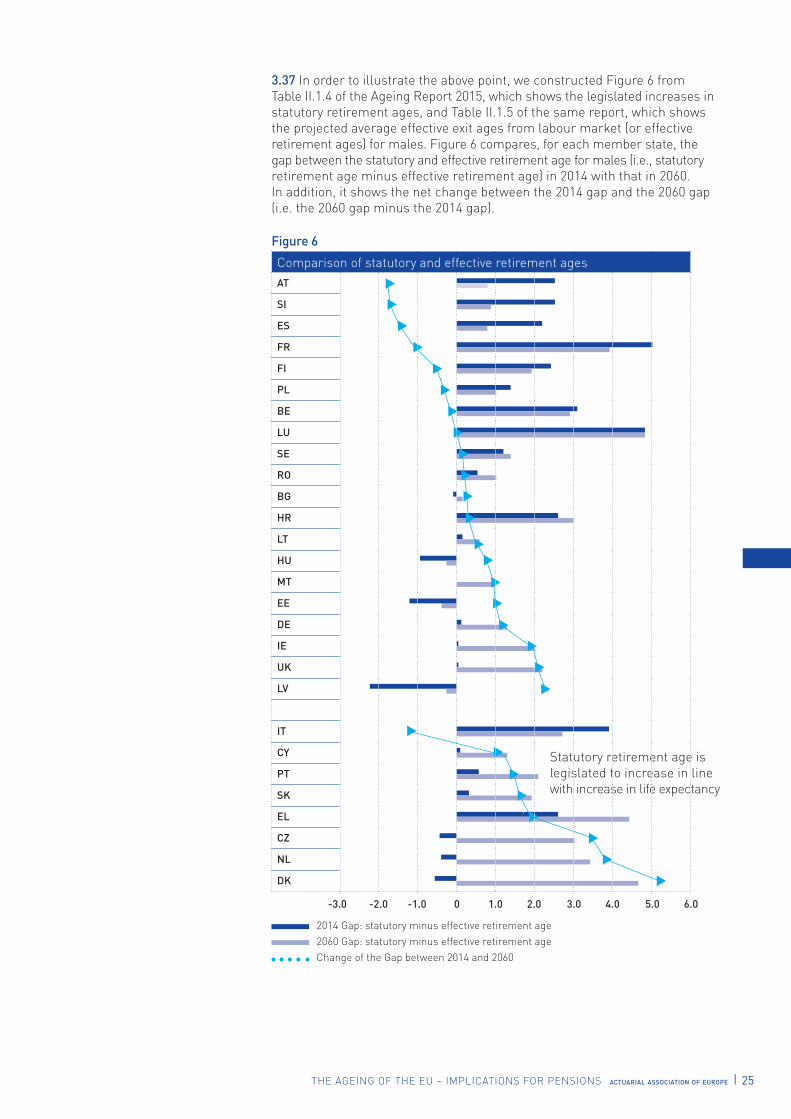
3.37 In order to illustrate the above point, we constructed Figure 6 from Table II.1.4 of the Ageing Report 2015, which shows the legislated increases in statutory retirement ages, and Table II.1.5 of the same report, which shows the projected average effective exit ages from labour market (or effective retirement ages) for males. Figure 6 compares, for each member state, the gap between the statutory and effective retirement age for males (i.e., statutory retirement age minus effective retirement age) in 2014 with that in 2060. In addition, it shows the net change between the 2014 gap and the 2060 gap (i.e. the 2060 gap minus the 2014 gap).
Figure 6
Comparison of statutory and effective retirement agesAT
SI
ES
FR
FI
PL
BE
LU
SE
RO
BG
HR
LT
HU
MT
EE
DE
IE
UK
LV
IT
CY
PT
SK
EL
CZ
NL
DK
2014 Gap: statutory minus effective retirement age 2060 Gap: statutory minus effective retirement age Change of the Gap between 2014 and 2060
26 I actuarial association of europe THE AGEING OF THE EU – IMPLICATIONS FOR PENSIONS
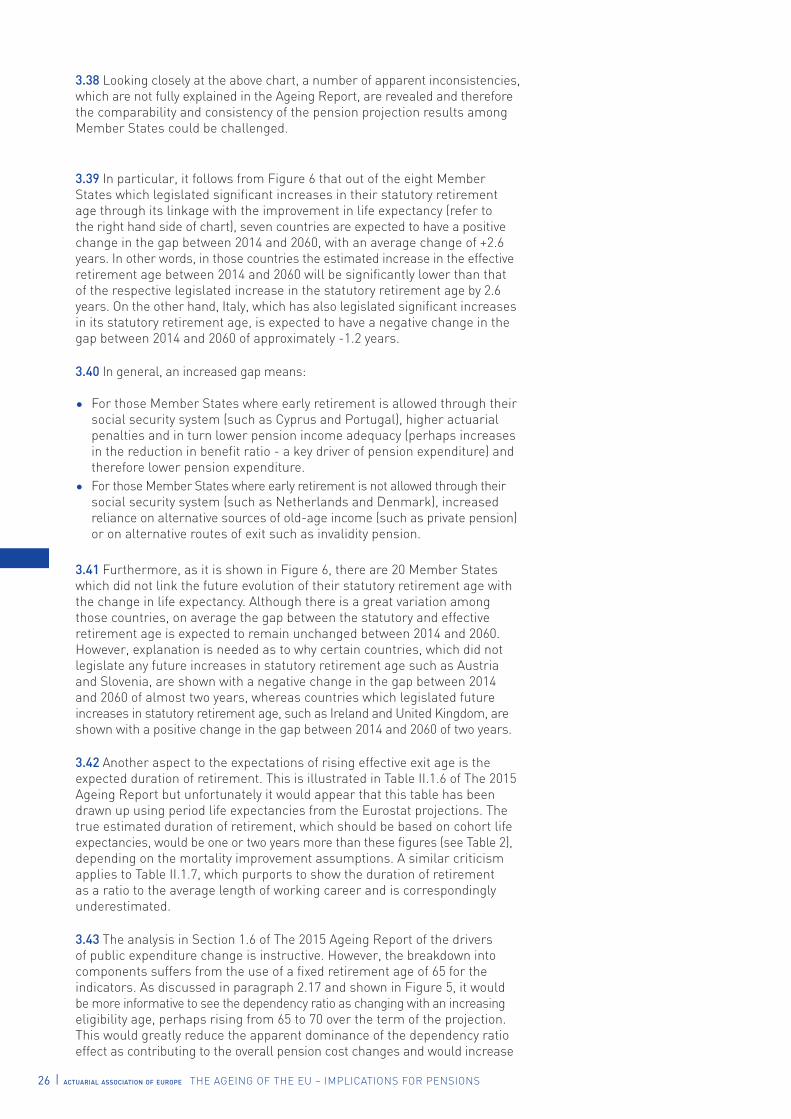
3.38 Looking closely at the above chart, a number of apparent inconsistencies, which are not fully explained in the Ageing Report, are revealed and therefore the comparability and consistency of the pension projection results among Member States could be challenged.
3.39 In particular, it follows from Figure 6 that out of the eight Member States which legislated significant increases in their statutory retirement age through its linkage with the improvement in life expectancy (refer to the right hand side of chart), seven countries are expected to have a positive change in the gap between 2014 and 2060, with an average change of +2.6 years. In other words, in those countries the estimated increase in the effective retirement age between 2014 and 2060 will be significantly lower than that of the respective legislated increase in the statutory retirement age by 2.6 years. On the other hand, Italy, which has also legislated significant increases in its statutory retirement age, is expected to have a negative change in the gap between 2014 and 2060 of approximately -1.2 years.
3.40 In general, an increased gap means:
• For those Member States where early retirement is allowed through their social security system (such as Cyprus and Portugal), higher actuarial penalties and in turn lower pension income adequacy (perhaps increases in the reduction in benefit ratio - a key driver of pension expenditure) and therefore lower pension expenditure.
• For those Member States where early retirement is not allowed through their social security system (such as Netherlands and Denmark), increased reliance on alternative sources of old-age income (such as private pension) or on alternative routes of exit such as invalidity pension.
3.41 Furthermore, as it is shown in Figure 6, there are 20 Member States which did not link the future evolution of their statutory retirement age with the change in life expectancy. Although there is a great variation among those countries, on average the gap between the statutory and effective retirement age is expected to remain unchanged between 2014 and 2060. However, explanation is needed as to why certain countries, which did not legislate any future increases in statutory retirement age such as Austria and Slovenia, are shown with a negative change in the gap between 2014 and 2060 of almost two years, whereas countries which legislated future increases in statutory retirement age, such as Ireland and United Kingdom, are shown with a positive change in the gap between 2014 and 2060 of two years.
3.42 Another aspect to the expectations of rising effective exit age is the expected duration of retirement. This is illustrated in Table II.1.6 of The 2015 Ageing Report but unfortunately it would appear that this table has been drawn up using period life expectancies from the Eurostat projections. The true estimated duration of retirement, which should be based on cohort life expectancies, would be one or two years more than these figures (see Table 2), depending on the mortality improvement assumptions. A similar criticism applies to Table II.1.7, which purports to show the duration of retirement as a ratio to the average length of working career and is correspondingly underestimated.
3.43 The analysis in Section 1.6 of The 2015 Ageing Report of the drivers of public expenditure change is instructive. However, the breakdown into components suffers from the use of a fixed retirement age of 65 for the indicators. As discussed in paragraph 2.17 and shown in Figure 5, it would be more informative to see the dependency ratio as changing with an increasing eligibility age, perhaps rising from 65 to 70 over the term of the projection. This would greatly reduce the apparent dominance of the dependency ratio effect as contributing to the overall pension cost changes and would increase
THE AGEING OF THE EU – IMPLICATIONS FOR PENSIONS actuarial association of europe I 27
the coverage ratio effect and the labour market effect, which would perhaps offer a more realistic representation. In fact there is something to be said for looking at the impact of the dependency ratio effect and the coverage ratio effect combined.
3.44 Perhaps the most significant result to highlight from the components analysis in Section 1.6 is the dramatic contribution made by falls in the benefit ratio to the evolution of pension costs. This is effectively the ratio of average pension to average wage and reductions in this factor reflect the way in which pension systems are projected to become significantly less generous. A striking comment in the accompanying text is the following:
“Although reform measures might have addressed the fiscal sustainability concerns of pension systems, social or political challenges could still arise in countries with a steep reduction in the generosity of pensions.”
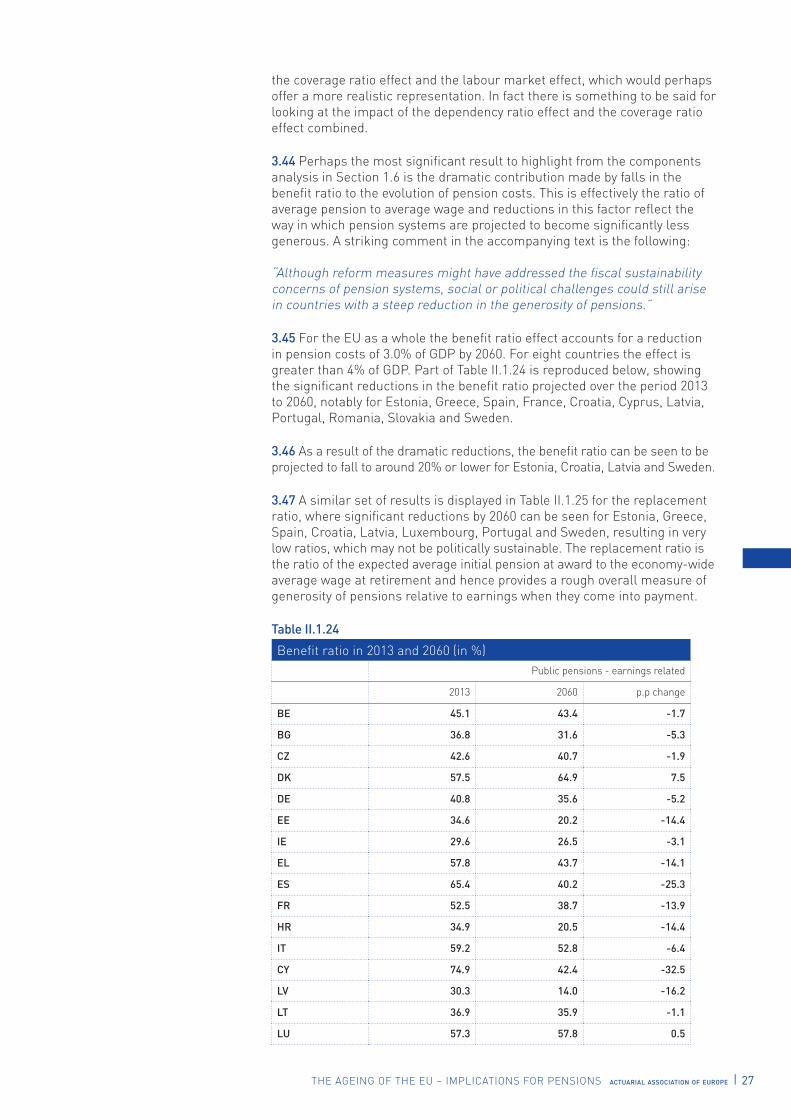
3.45 For the EU as a whole the benefit ratio effect accounts for a reduction in pension costs of 3.0% of GDP by 2060. For eight countries the effect is greater than 4% of GDP. Part of Table II.1.24 is reproduced below, showing the significant reductions in the benefit ratio projected over the period 2013 to 2060, notably for Estonia, Greece, Spain, France, Croatia, Cyprus, Latvia, Portugal, Romania, Slovakia and Sweden.
3.46 As a result of the dramatic reductions, the benefit ratio can be seen to be projected to fall to around 20% or lower for Estonia, Croatia, Latvia and Sweden.
3.47 A similar set of results is displayed in Table II.1.25 for the replacement ratio, where significant reductions by 2060 can be seen for Estonia, Greece, Spain, Croatia, Latvia, Luxembourg, Portugal and Sweden, resulting in very low ratios, which may not be politically sustainable. The replacement ratio is the ratio of the expected average initial pension at award to the economy-wide average wage at retirement and hence provides a rough overall measure of generosity of pensions relative to earnings when they come into payment.
Table II.1.24
Benefit ratio in 2013 and 2060 (in %)Public pensions - earnings related
2013 2060 p.p change
BE 45.1 43.4 -1.7
BG 36.8 31.6 -5.3
CZ 42.6 40.7 -1.9
DK 57.5 64.9 7.5
DE 40.8 35.6 -5.2
EE 34.6 20.2 -14.4
IE 29.6 26.5 -3.1
EL 57.8 43.7 -14.1
ES 65.4 40.2 -25.3
FR 52.5 38.7 -13.9
HR 34.9 20.5 -14.4
IT 59.2 52.8 -6.4
CY 74.9 42.4 -32.5
LV 30.3 14.0 -16.2
LT 36.9 35.9 -1.1
LU 57.3 57.8 0.5

28 I actuarial association of europe THE AGEING OF THE EU – IMPLICATIONS FOR PENSIONS
HU 41.4 32.6 -8.8
MT 46.5 45.5 -1.0
NL 34.2 33.1 -1.1
AT
PL
PT 59.3 43.4 -15.8
RO 40.9 26.4 -14.5
SI 37.8 32.9 -5.0
SK 46.0 30.4 -15.6
FI 48.9 42.2 -6.7
SE 37.8 20.9 -16.9
UK 33.5 32.8 -0.7
NO
EU* 46.5 38.4 -8.1
EA* 49.6 40.3 -9.3
EU** 45.5 36.5 -9.0
EA** 47.6 37.7 -9.9
(1) Public pensions earnings-related refers to old age earnings related pension. Public pensions aggregate includes disability, survivor and non-earnings-related benefits. All pension aggregate includes private occupational and private individual benefit and it is only reported when private pensions have been provided.The “Benefit ratio” is the average benefit of public pensions and public and private pensions, respectively, as a share of the economy-wide average wage (gross wages and salaries in relation to employees), as calculated by the Commission services.* Weighted average** Simple averageSource: Commission services, EPC
Summary – growth of pension expenditure
3.48 The 2015 Ageing Report shows significant reductions in the long-term fiscal public expenditure implications of pensions. In part this results from the changes that have been made to the underlying population projections and other technical assumptions, but it also reflects a wide range of pension reform activity in most member states. Amongst the most prevalent of measures are those relating to increasing retirement age, but there have also been important changes to benefit accrual, to indexation, to qualifying periods for pension and some quite radical restructuring of social security program structures, for example the move in several member states from defined benefit to notional defined contribution arrangements. Inevitably there are some question marks over how the reforms will work through in practice and how the impact of the reforms should be modelled for the purposes of the projections of pension expenditure. We have some concerns about the potential conflict between the centralised assumptions which are used to make the projections consistent across all member states and the application of national pension models in order to model the specific features that apply to individual countries.
THE AGEING OF THE EU – IMPLICATIONS FOR PENSIONS actuarial association of europe I 29
5 The 2015 Ageing Report: Underlying Assumptions and Projection Methodologies at http://ec. europa.eu/economy_finance/publications/ european_economy/2014/pdf/ee8_en.pdf
6 Sustainability of pension systems in Europe – the demographic challenge http://actuary.eu/documents/Sustainability_pension_system_%20final_020712%20270612_web.pdf
7 Melbourne Mercer Global Pension Index 2015 http://www.globalpensionindex.com
4: Sustainability of pension systems ......................................................................................................................................................................................................
4.1 One of the main objectives of The 2015 Ageing Report (and its predecessors) is to examine the evidence for the fiscal sustainability of pension systems in the EU and point towards where reforms might be needed. This is done through the European Semester Process, in which the Commission takes up issues with individual member states which they believe should be addressed in order to improve fiscal sustainability. However, in spite of the volume of figures and commentary in this 400 page report (not to mention another 413 pages of the Underlying Assumptions and Projection Methodologies report5) there is no direct conclusion in the report about which countries have sustainable systems and which not. Specific country recommendations have been issued by the Commission as part of the European Semester Process. These include pension-related recommendations for Austria, Belgium, Germany, Finland, France, Croatia, Lithuania, Luxembourg, Malta, Netherlands, Poland, Portugal, Romania and Slovenia.
4.2 In fact sustainability is quite hard to define. Levels of public expenditure on pensions which seem very high for some countries when seen from the perspective of countries with lower public pension expenditure may in fact be manageable – and sustainable – because they are part of the social fabric of the country and have been for many years. They may reflect different ways of interacting with the private sector, different priorities on public expenditure, lower expenditure on other programmes, such as international relations or defence, and many other social, economic and political differences.
4.3 Different aspects of sustainability were discussed in an earlier publication by the Actuarial Association of Europe (then known as the Groupe Consultatif Actuariel Européen) in 20126. In that report we drew attention to some of the features of pension systems which perhaps made them more sustainable. Other organisations have been less reticent about measuring sustainability and setting out league tables. A regular annual report is published by the Australian Centre for Financial Studies entitled the Melbourne Mercer Global Pension Index7. Another eminent example is the Pension Sustainability Index of Allianz Global Investors.
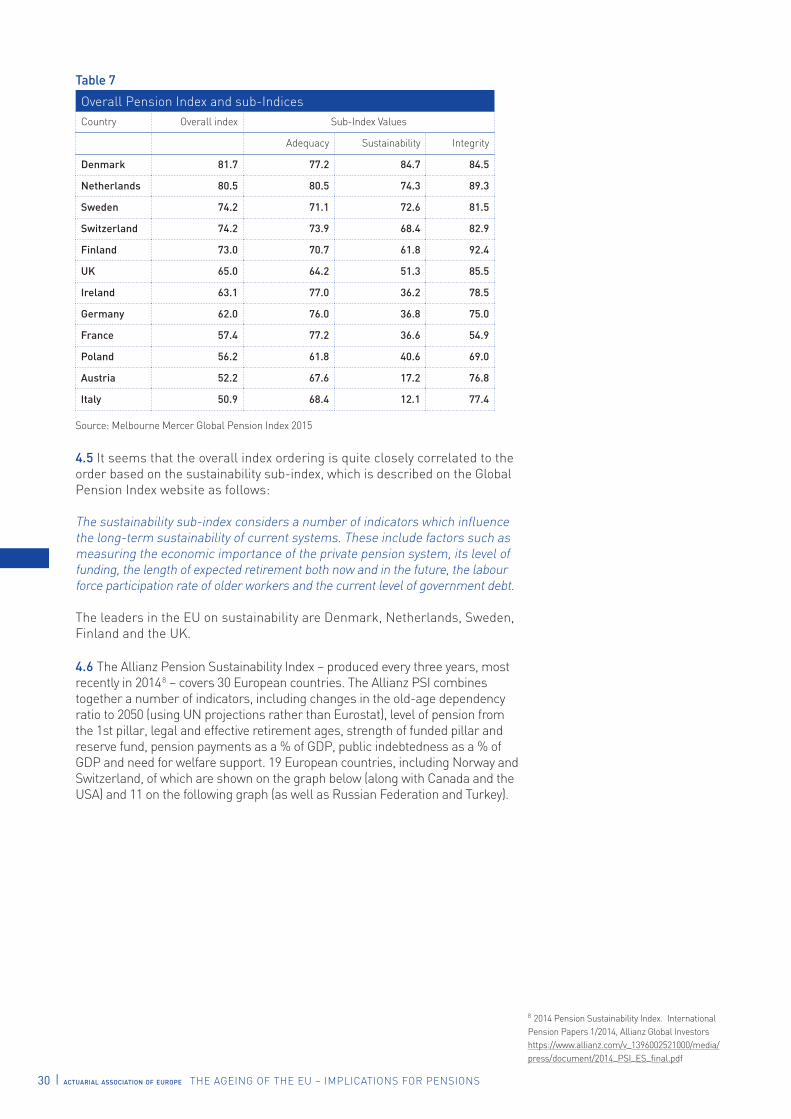
4.4 The Melbourne Mercer Index covers 25 countries, of which 12 are in Europe. Each country’s index value takes into account more than 40 indicators, some of which are based on data measurements which can be difficult to compare between countries. The report gives a warning that small differences in index values should not be taken to imply that one country’s system is materially better than the other, but larger differences should lead to firmer conclusions.
The results from the October 2015 study for the European entries are as follows:
30 I actuarial association of europe THE AGEING OF THE EU – IMPLICATIONS FOR PENSIONS
8 2014 Pension Sustainability Index. International Pension Papers 1/2014, Allianz Global Investorshttps://www.allianz.com/v_1396002521000/media/press/document/2014_PSI_ES_final.pdf
Table 7
Overall Pension Index and sub-IndicesCountry Overall index Sub-Index Values
Adequacy Sustainability Integrity
Denmark 81.7 77.2 84.7 84.5
Netherlands 80.5 80.5 74.3 89.3
Sweden 74.2 71.1 72.6 81.5
Switzerland 74.2 73.9 68.4 82.9
Finland 73.0 70.7 61.8 92.4
UK 65.0 64.2 51.3 85.5
Ireland 63.1 77.0 36.2 78.5
Germany 62.0 76.0 36.8 75.0
France 57.4 77.2 36.6 54.9
Poland 56.2 61.8 40.6 69.0
Austria 52.2 67.6 17.2 76.8
Italy 50.9 68.4 12.1 77.4
Source: Melbourne Mercer Global Pension Index 2015
4.5 It seems that the overall index ordering is quite closely correlated to the order based on the sustainability sub-index, which is described on the Global Pension Index website as follows:
The sustainability sub-index considers a number of indicators which influence the long-term sustainability of current systems. These include factors such as measuring the economic importance of the private pension system, its level of funding, the length of expected retirement both now and in the future, the labour force participation rate of older workers and the current level of government debt.
The leaders in the EU on sustainability are Denmark, Netherlands, Sweden, Finland and the UK.
4.6 The Allianz Pension Sustainability Index – produced every three years, most recently in 20148 – covers 30 European countries. The Allianz PSI combines together a number of indicators, including changes in the old-age dependency ratio to 2050 (using UN projections rather than Eurostat), level of pension from the 1st pillar, legal and effective retirement ages, strength of funded pillar and reserve fund, pension payments as a % of GDP, public indebtedness as a % of GDP and need for welfare support. 19 European countries, including Norway and Switzerland, of which are shown on the graph below (along with Canada and the USA) and 11 on the following graph (as well as Russian Federation and Turkey).

THE AGEING OF THE EU – IMPLICATIONS FOR PENSIONS actuarial association of europe I 31
Figure 3: 2014 Pension Sustainability Index for western Europe and North America
Source: Allianz Asset Management, International Pensions* Scale from 1 – 10: 10 minor need for reforms, 1 high need for reforms
Sweden
Norway
Netherlands
Denmark
Switzerland
United States
United Kingdom
Canada
Finland
Luxembourg
Ireland
Germany
Austria
Belgium
Portugal
France
Italy
Spain
Cyprus
Greece
Malta
0 2 4 6 8
Source: Allianz Asset Management, International Pensions
Figure 4: 2014 Pension Sustainability Index for selected countries in eastern Europe
Latvia
Estonia
Russian Federation
Lithuania
Czech Republic
Poland
Romania
Croatia
Bulgaria
Hungary
Turkey
Slovak Republic
Slovenia0 2 4 6 8
* Scale from 1 – 10: 10 minor need for reforms, 1 high need for reforms
Figure 7
2014 Pension Sustainability Index for western Europe and North America
* Scale from 1 – 10: 10 minor need for reforms, 1 high need for reformsSource: Allianz Asset Management, International Pensions
4.7 Integrating the two sets of results puts the following as the top ten European countries: Sweden, Norway, Netherlands, Denmark, Switzerland, Latvia, UK, Estonia, Finland and Luxembourg. Whilst there is a fair amount of overlap with other assessments of sustainability, the inclusion of Latvia, which the results referred in paragraphs 3.45 to 3.47 above show is facing a dramatic decline in benefit ratios and replacement rates, and Luxembourg, with the highest expected growth in public pension costs by 2060 of any EU country, may seem surprising.
Figure 8
2014 Pension Sustainability Index for selected countries in eastern Europe
* Scale from 1 – 10: 10 minor need for reforms, 1 high need for reforms Source: Allianz Asset Management, International Pensions

32 I actuarial association of europe THE AGEING OF THE EU – IMPLICATIONS FOR PENSIONS
Summary – Sustainability of Pension Systems
4.8 Overall it is hard to draw a definitive conclusion as to which countries have sustainable pension systems and which do not. It all depends on what factors you regard as the most important. One general conclusion might be that overall the position in the EU on sustainability seems to have improved somewhat from that shown in The 2012 Ageing Report as a result of significant pension reforms that have been undertaken in recent years, including raising the eligibility age, reducing benefits, increasing contribution requirements and incentivising later retirement. These changes – and the improved sustainability picture – all bring the focus of attention more onto the question of adequacy. In the next section we analyse some of the key results from The 2015 Pension Adequacy Report and explore some of the work that the AAE has been doing looking at how to develop better measures of adequacy and how to measure fairness.
4.9 Fiscal sustainability is often regarded (implicitly if not explicitly) as the key issue, but political sustainability is also of fundamental importance in democracies and this may depend to a significant extent on whether the resulting benefits are adequate and are seen as manifestly fair and equitable.
THE AGEING OF THE EU – IMPLICATIONS FOR PENSIONS actuarial association of europe I 33
5: Adequacy of Pensions ....................................................................................................................................................................................................................................
5.1 In any discussion of the adequacy of pension schemes or systems their essential purpose should be kept clearly in mind: providing people with income in old age that will allow them a decent living standard and protect them from poverty. The 2015 Pension Adequacy Report (PAR) examines the ability of pensions to protect retired people both currently and prospectively under a “new environment”, dominated by demographic pressures and fiscal constraints. Despite the fact that, in almost all Member States, older people have been better protected against the social impact of the recession than other age groups, several Member States still need to tackle the issues relating to significant numbers either living in, or at risk of falling into, poverty.
5.2 It is essential that the issues of pension adequacy and financial sustainability be considered jointly, not separately. If pensions are at risk of being inadequate, there may be pressure for ad hoc increases in pensions or higher demand for other benefits, jeopardizing sustainability. Equally if a pension system is unsustainable it will prove to be inadequate in the long run when sudden corrections are needed. In September 2014 the Actuarial Association of Europe (AAE) presented to the Working Group Age of the Social Policy Committee in a set of alternative or complementary approaches to pension adequacy based on different notions of “fairness”; i.e. the idea that adequacy also entails ensuring a modicum of fairness between the contributions and entitlements of different income groups, types of employment, cohorts, individuals. Starting from the question of what is “fair”, the AAE suggested distinguishing between intergenerational, social and actuarial fairness together with some recommendations as to how they may be measured. The AAE is happy to observe that these suggestions are noted in the Report, in relation to the assessment of general pension adequacy.
5.3 The report uses the hypothetical case methodology of Theoretical Replacement Rates (TRRs) in its assessment of the ability of pension systems to fulfill their income maintenance function. These indicate the extent to which pensions received “replace” prior working income. The AAE notes the importance attached to the analytical approach through assessment of a series of scenarios reflecting the main effects of pension reforms to date, i.e.
• the extension of time spent in working and thus in contributing; and
• the effort to strengthen the link between earnings related contributions and pension benefits.
5.4 We note the inclusion in the Report of analysis of a range of aspects regarding pension adequacy, so-called “wider measures”. Two of the most significant are access to housing wealth and (financial) access to appropriate health care. Older people tend on average to be in a better position than the working population in terms of home ownership while access to health care is generally observed to be at a similar level with that of the rest of the population. In many Member States, however, older people tend to benefit more widely from subsidized pharmaceuticals and medical aids. 5.5 The priority accorded to actuarial fairness at the expense of social fairness (Luckhaus and Moffat 1996) is highlighted by a gender perspective. In this context “gender” denotes not merely the categories of male and female but the social roles and relationships that shape patterns of paid and unpaid work. In developed societies, the typically “male” pattern of continuous unbroken full-time employment contrasts with a typically “female” one of interrupted and partial attachment to the labour market, often reflecting periods of family caring. Currently, women’s average pension income is lower than men’s in all Member States. In order to reduce the current gender

34 I actuarial association of europe THE AGEING OF THE EU – IMPLICATIONS FOR PENSIONS
differences in pensions at least to moderate levels, a long-term policy effort is required. This effort should combine equal opportunity policies across several fields (before individuals reach pensionable age) with changes in the pension system itself. As noted in the Report, by 2053 women aged 80 and above, who currently are disproportionately at risk of poverty, should, on average, be better educated and with longer working careers behind them. However, it is also noted that considerable complexity attaches to the gender-specific assessment of future pension adequacy.
5.6 Age should no longer rigidly determine the appropriate end of a working life. One common observation across EU countries is that the service sector seems to have become and will continue to be the engine of future employment of older workers. For both men and women with the lowest relative education levels, employment rates tend to reduce most quickly with increasing age, implying that the benefits of increased participation in the labour market are largely gained by those with stronger socio-economic characteristics. In more general terms, the obstacles to longer working lives in workplaces and labour markets can be related to factors on both the sup-ply and the demand sides. The observations indicate that there is a de facto absence of a late-career labour market in most Member States.
5.7 Benefits that reflect contributions based on earnings from work are set to constitute a significantly larger proportion of the overall pension package. Actuarially fair incentives should thus be introduced in order to ensure that working longer and delaying pension take-up will be rewarded.
5.8 Early retirement appears to pose a major risk to the pension adequacy of low wage earners in the future. It appears that such labour market exits, taking place up to five years before the Standard Pensionable Age (SPA) often result in fact from unemployment or disability, but can lead (in the majority of Member States) to a drop in pension levels of more than five percentage points.
5.9 Unemployment is a major reason for insufficient contributory records. This problem is exacerbated for the young people whose employment prospects have been heavily affected by the financial crisis, since their eventual entry into the labour market is often through short-term work contracts at low wage levels, with little or no access to pension coverage in the short term, and severely impaired long-term prospects for pensions. As labour markets are further deregulated with growth of contingent work, insecure and part-time employment, the features of pension systems which tend to correct disadvantages for women may become important for men as well, especially those who are low paid.
5.10 Many Member States have in effect reduced real pension benefits through changes in the indexation mechanisms for benefit payments. To assess the impact of changes in indexation rules on future pension adequacy, prospective replacement rates have been calculated at the point in time ten years into retirement. This variant case is calculated considering the value of an individual’s pension ten years after retirement relative to the pension of another average contributing worker retiring ten years later following a full contribution career. This helps to provide an assessment of the “pension erosion” in terms of the evolution of the relative income position of the individual once retired compared to the general level of wages over the same period. As shown in the figure below, the real value of pensions is set to decrease over time in all Member States. The decline is expected to range from less than five percentage points in nine Member States to more than ten percentage points in another seven.
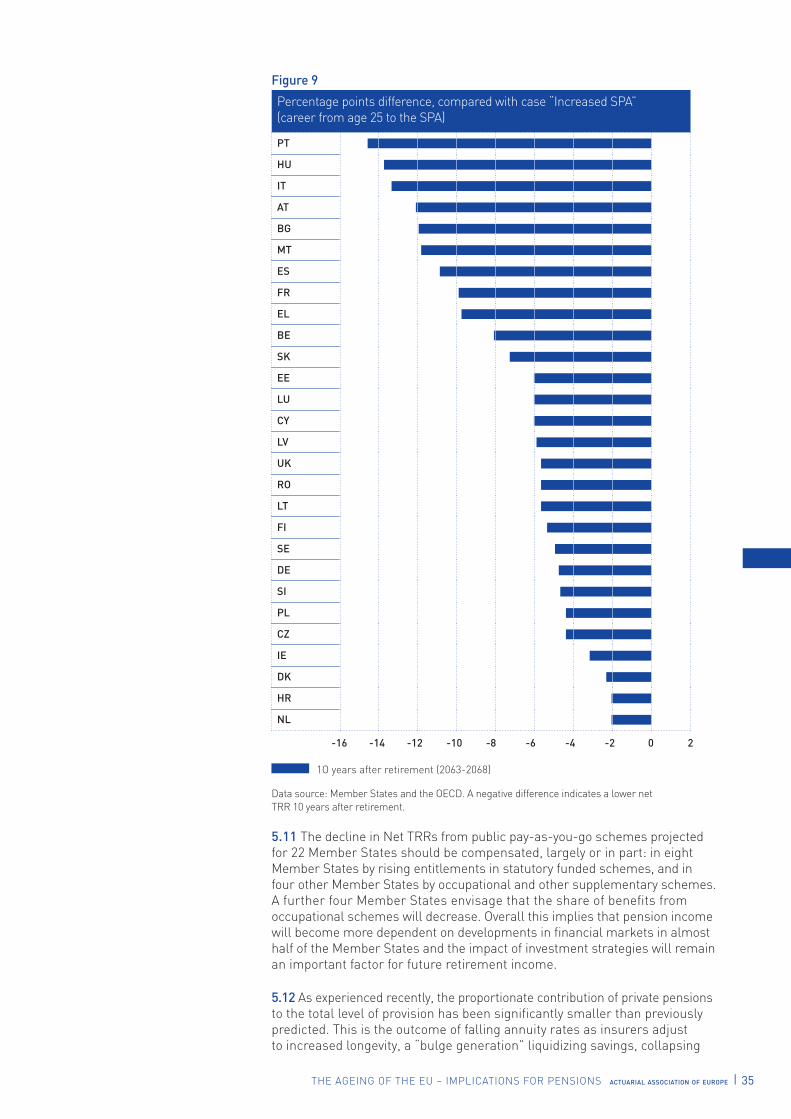
THE AGEING OF THE EU – IMPLICATIONS FOR PENSIONS actuarial association of europe I 35
-16 -14 -12 -10 -8 -6 -4 -2 0 2
Figure 9
Percentage points difference, compared with case “Increased SPA” (career from age 25 to the SPA)
PT
HU
IT
AT
BG
MT
ES
FR
EL
BE
SK
EE
LU
CY
LV
UK
RO
LT
FI
SE
DE
SI
PL
CZ
IE
DK
HR
NL
1O years after retirement (2063-2068)
Data source: Member States and the OECD. A negative difference indicates a lower net TRR 10 years after retirement.
5.11 The decline in Net TRRs from public pay-as-you-go schemes projected for 22 Member States should be compensated, largely or in part: in eight Member States by rising entitlements in statutory funded schemes, and in four other Member States by occupational and other supplementary schemes. A further four Member States envisage that the share of benefits from occupational schemes will decrease. Overall this implies that pension income will become more dependent on developments in financial markets in almost half of the Member States and the impact of investment strategies will remain an important factor for future retirement income.
5.12 As experienced recently, the proportionate contribution of private pensions to the total level of provision has been significantly smaller than previously predicted. This is the outcome of falling annuity rates as insurers adjust to increased longevity, a “bulge generation” liquidizing savings, collapsing
36 I actuarial association of europe THE AGEING OF THE EU – IMPLICATIONS FOR PENSIONS
stock market bubbles and investment losses following increased rates of company insolvency. The state, using tax revenues, pays for these market failures in one way or another. Accordingly, support has fallen away for the idea that full privatization of pensions can relieve demands on the working generation. In the contextual perspective of a long term continuation of the current low interest climate in the main financial markets, the capacity of (pre-)funding arrangements to ease the financing of pensions is severely reduced.
5.13 An important issue in terms of political economy is that of intergenerational fairness, for which a useful indicator may be that of the Internal Rate of Return, IRR, although this needs to be interpreted with care when applied to social security programs which are intended to achieve redistribution of income.
Summary – Adequacy of Pensions
5.14 The pressure to consolidate public finances as fast as possible has forced policy-makers into uncharted waters.
5.15 Increasing emphasis on actuarial fairness in pensions, implying a closer relationship between pensions and contributions, entails increasing exposure to risks associated with instability of labour markets. In addition, the general exclusion from labour markets for long periods of those who perform unpaid caring roles is clearly reflected in low pensions and poverty in later life; this represents an existing injustice whose mitigation requires urgent attention. Although most countries provide poverty relief, means-tested social assistance that requires older people to demonstrate poverty to get entitlement to benefits is no substitute for the dignity and security of an unconditional pension. The fundamental challenge is to find the right balance between actuarial fairness and social justice.
5.16 The crisis and austerity-related changes to pensions appear in several countries to have generated a climate of uncertainty and doubts regarding public pension schemes. The developing public feeling regarding future pensions has to be seriously taken into account. The new challenges need to be interpreted in a way which can be communicated effectively to the public at large; wider awareness of the issues people face is of vital importance.
5.17 The AAE suggests that the range of issues highlighted in chapter 5 (paragraphs 5.4 through 5.13) regarding the major risks to future pension adequacy and how to mitigate them are of a level of significance such as to merit special and increased attention in the next cycle of this analytical work.
5.18 The AAE endorses the final remark in the Conclusions of the Report regarding the importance of collaboration amongst countries and groupings globally, in addressing the many and evolving challenges of pension provision to be faced in common.
5.19 The AAE strongly endorses the observation of the Council of Europe in 2004: “Social Security has a cost but it can cost more economically, socially and politically to be without Social Security”.
THE AGEING OF THE EU – IMPLICATIONS FOR PENSIONS actuarial association of europe I 37
9 Model standards prepared and issued by the IAA and AAE are intended for member associations to adopt or adapt into national standards of practice to be followed by their individual actuary members.
6: Actuaries in social security and pensions .................................................................................................................................................................................
6.1 It is not the purpose of this paper to provide a comprehensive analysis of social security and pension systems across Europe. The AAE (then known as the Groupe Consultatif) has previously published reviews of different aspects of complementary pension schemes in the EU (for example Collinson et al, 2001; Brown et al, 2004; Hammer et al, 2004). Actuaries are typically involved in the financial management of all types of occupational defined benefit plans and also in many types of defined contribution plan, especially where there are embedded guarantees, and decumulation products. Many countries have a statutory role for actuaries in complementary pension plans. 6.2 A number of countries also have a statutory requirement for regular actuarial reporting on the finances of social security and this can be an important factor in ensuring sustainability of social security pension promises, as it helps to place the political pressures for more generous social security into a firm financial monitoring environment. From early days of the International Social Security Association (ISSA) nearly a century ago there has been a strong strand of thinking internationally that actuarial reporting should form a key element of good social security governance and this is underlined by social security guidelines which have been issued by the ISSA. The International Actuarial Association has published a model standard of actuarial practice (ISAP2) on Financial Analysis of Social Security Programs, developed in cooperation with the International Labour Office (ILO) and the ISSA. The ISSA-ILO Guidelines on Actuarial Work for Social Security were published in draft form for the 18th ISSA International Conference for Social Security Actuaries and Statisticians in September 2015 and are expected to be adopted by the ISSA in 2016. We recommend that these should be followed in the EU, both for actuarial work in individual countries and for EU level exercises such as The Ageing Report.
6.3 Actuarial modelling approaches and methodologies should be used to project future cash flows and assess the short, medium and long term impact of pension policies and reforms on adequacy and sustainability of pension system provision in an integrated way. This does not appear to be being done consistently across the EU at present and the AAE have interacted with ECFIN and the Ageing Working Group to suggest improvements in the methodology and disclosures in order to meet international standards for social security actuaries.
6.5 In the draft revision of the IORP Directive IORPs would be required to have an actuarial function, as is the case for insurance companies under the Solvency 2 Directive 2009/138/EC. The AAE would strongly support such a requirement, which would be consistent with the extensive use made of actuaries by IORPs in existing regulatory structures. Not all countries have an automatic requirement for an actuary in DC plans where there are no guarantees or biometric risks, although even for some of these it may be desirable to have actuarially calculated technical provisions, especially in relation to future expenses where there are limits on what deductions can be made from the plan. Asset/liability management and general risk management are actuarial issues, as is the monitoring of adequacy of resulting benefits and any drawdown or annuitisation provisions. In Spain there is a requirement for all DC occupational plans to have regular actuarial reporting.
6.6 The AAE has recently prepared a model standard regarding the actuarial function report for insurance companies under Solvency II (ESAP2) and it is likely that a similar model standard will be prepared in due course in relation to the actuarial function for IORPS9.

38 I actuarial association of europe THE AGEING OF THE EU – IMPLICATIONS FOR PENSIONS
6.7 Actuaries are professionals with expertise in the quantification and management of long-term risks which are susceptible to mathematical modelling. This includes all types of social security, as well as complementary workplace or mandatory pensions, whether funded or not. The member associations of the Actuarial Association of Europe have robust educational and professionalism requirements for those who are qualified actuaries and the AAE is also starting to issue model standards of actuarial practice for the associations to adopt for some specifically EU applications. Actuaries are well-placed to play an active role in analysing the impact of future changes on pension provision and to advise EU and national institutions.
THE AGEING OF THE EU – IMPLICATIONS FOR PENSIONS actuarial association of europe I 39
7: Overall conclusions ...........................................................................................................................................................................................................................................
7.1 Projections of pension expenditure are inherently uncertain and the outcome may be very different from that projected. It is desirable that policy changes should be robust to differing outcomes. It is very likely that people will on average live longer than has hitherto been the case and the trend is expected to continue, although the extent and speed of future change is uncertain. The expectation of life, although useful as a measure of how long people may live, is an average of a wide range of possible outcomes and dif-ferent individuals will experience different future lifetimes. Although raising the eligibility age for pension benefits is likely to continue to be favoured as a policy for addressing sustainability, it is important for other factors to be taken into account, such as the responsiveness of the labour market and the extent to which it is reasonable to expect everyone to work for longer.
7.2 The overall picture portrayed by the projections in The 2015 Ageing Report reflects notable reductions in future pension costs for some countries and a greater prospect of fiscal sustainability. However, it is important to note the scope for less favourable outcomes in the event that some of the assumptions are not fulfilled. Apart from demographic and labour market assumptions, which are themselves subject to uncertainty, there is necessarily considerable uncertainty about the way in which pension reform implementation may turn out and how people will behave under the parameters of reformed systems. Closer examination of these issues will necessitate studies being carried out for each individual country using assumptions that are tailored to the situation there, supported by extensive analysis of realistic alternative scenarios and stochastic modelling to test the variability of possible outcomes as a supplement to deterministic models based on averages.
7.3 Probably the most fundamental caveat is that the nature and extent of pension reforms that have been undertaken to bring about greater fiscal sustainability can be expected to result in pension outcomes for many people which are certainly less generous than before and may be quite inadequate for some segments of the population. They may also expose concerns about fairness and equity. Consideration needs to be given to developing a wider range of measures of adequacy and fairness, some of which may require more sophisticated analysis, so that the impact of changes can be monitored. Such monitoring is likely to reveal the need for further reforms and course corrections. In fact it can be expected that future reforms will be necessary, as no social security or pensions system will be robust to all future outcomes and there will inevitably be the need for further changes in the light of the evolving situation.
7.4 The actuarial profession, both at the European level through the Actuarial Association of Europe, and at individual country level through national actuarial associations, will be happy to play an active role in the evaluation of the effectiveness of pension reforms and the monitoring of future fiscal sustainability and adequacy.

40 I actuarial association of europe THE AGEING OF THE EU – IMPLICATIONS FOR PENSIONS
References
Actuarial Association of Europe (2015) European Standard of Actuarial Practice 2 (ESAP2). Actuarial Function Report under Directive 2009/138/EC (2015)
Allianz Global Investors (2014) 2014 Pension Sustainability Index. International Pension Papers No 1/2014
Australian Centre for Financial Studies (2015) Melbourne Mercer Global Pension Index 2015
Brown H et al (2004) Defined Contribution Arrangements in Europe. Groupe Consultatif, February 2004
Collinson D et al (2001) Actuarial Methods and Assumptions used in the Valuation of Retirement Benefits in the EU and other European countries. Groupe Consultatif, December 2001
Council of Europe (2004) Future of social security in Europe, Report of the Committee on Social, Health and Family Affairs, Parliamentary Assembly, Strasbourg: Council of Europe
European Commission (2010) Green Paper. Towards adequate, sustainable and safe European pension systems
European Commission (2012) The 2012 Ageing Report: Economic and Budgetary projections for the 27 EU member states (2010-2060). European Economy 2/2012 (Preliminary version)
European Commission (2014) The 2015 Ageing Report: Underlying Assumptions and Projection Methodologies. European Economy 8/2014
European Commission (2015) The 2015 Ageing Report: Economic and Budgetary projections for the 28 EU member states (2013-2060). European Economy 3/2015
European Commission (2015) The 2015 Pension Adequacy Report
Groupe Consultatif Actuariel Européen (2010a) Security in occupational pensions
Groupe Consultatif Actuariel Européen (2010b) Response to Green Paper towards adequate, sustainable and safe European pension systems
Groupe Consultatif Actuariel Européen (2011) Groupe Consultatif comments on EIOPA’s draft response to Call for Advice on the review of Directive 2003/ 41/EC Scope, cross-border activity, prudential regulation and governance
Groupe Consultatif Actuariel Européen (2012) Sustainability of pension systems in Europe – the demographic challenge
Hammer C et al (2005) Security Standards for Occupational Pension Schemes in the EU. Groupe Consultatif, August 2005
International Actuarial Association (2013). International Standard of Actuarial Practice 2 (ISAP2). Financial Analysis of Social Security Programs
International Social Security Association (2015) ISSA-ILO Guidelines on Actuarial Work for Social Security. September 2015
Jay G (2004), Center for Research on Pensions and Welfare Policies 5th Annual Conference, Turin, Actuarial Fairness or Social Justice? A gender perspective on redistribution in Pension systems
PIWG (2016) Determination of Retirement and Eligibility Ages: Actuarial, Social and Economic Impacts. Paper of the Population Issues Working Group of the International Actuarial Association (to be published shortly)
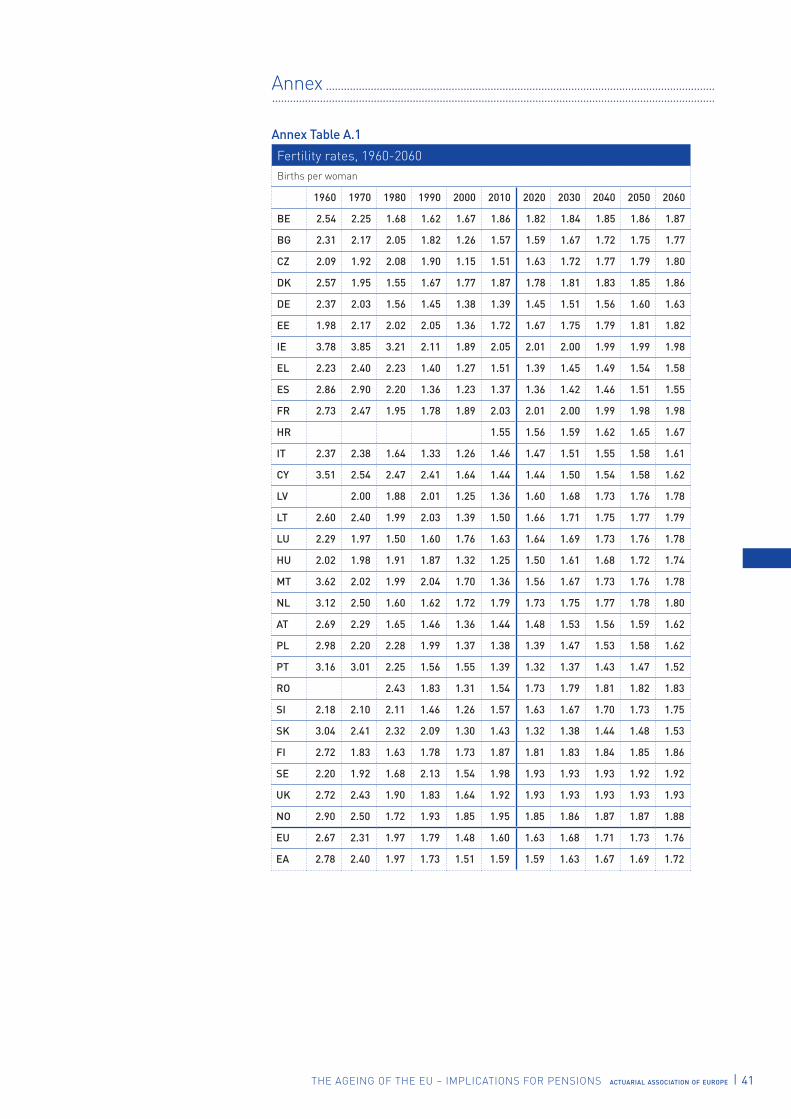
THE AGEING OF THE EU – IMPLICATIONS FOR PENSIONS actuarial association of europe I 41
Annex ......................................................................................................................................................................................................................................................................................
Annex Table A.1
Fertility rates, 1960-2060Births per woman
1960 1970 1980 1990 2000 2010 2020 2030 2040 2050 2060
BE 2.54 2.25 1.68 1.62 1.67 1.86 1.82 1.84 1.85 1.86 1.87
BG 2.31 2.17 2.05 1.82 1.26 1.57 1.59 1.67 1.72 1.75 1.77
CZ 2.09 1.92 2.08 1.90 1.15 1.51 1.63 1.72 1.77 1.79 1.80
DK 2.57 1.95 1.55 1.67 1.77 1.87 1.78 1.81 1.83 1.85 1.86
DE 2.37 2.03 1.56 1.45 1.38 1.39 1.45 1.51 1.56 1.60 1.63
EE 1.98 2.17 2.02 2.05 1.36 1.72 1.67 1.75 1.79 1.81 1.82
IE 3.78 3.85 3.21 2.11 1.89 2.05 2.01 2.00 1.99 1.99 1.98
EL 2.23 2.40 2.23 1.40 1.27 1.51 1.39 1.45 1.49 1.54 1.58
ES 2.86 2.90 2.20 1.36 1.23 1.37 1.36 1.42 1.46 1.51 1.55
FR 2.73 2.47 1.95 1.78 1.89 2.03 2.01 2.00 1.99 1.98 1.98
HR 1.55 1.56 1.59 1.62 1.65 1.67
IT 2.37 2.38 1.64 1.33 1.26 1.46 1.47 1.51 1.55 1.58 1.61
CY 3.51 2.54 2.47 2.41 1.64 1.44 1.44 1.50 1.54 1.58 1.62
LV 2.00 1.88 2.01 1.25 1.36 1.60 1.68 1.73 1.76 1.78
LT 2.60 2.40 1.99 2.03 1.39 1.50 1.66 1.71 1.75 1.77 1.79
LU 2.29 1.97 1.50 1.60 1.76 1.63 1.64 1.69 1.73 1.76 1.78
HU 2.02 1.98 1.91 1.87 1.32 1.25 1.50 1.61 1.68 1.72 1.74
MT 3.62 2.02 1.99 2.04 1.70 1.36 1.56 1.67 1.73 1.76 1.78
NL 3.12 2.50 1.60 1.62 1.72 1.79 1.73 1.75 1.77 1.78 1.80
AT 2.69 2.29 1.65 1.46 1.36 1.44 1.48 1.53 1.56 1.59 1.62
PL 2.98 2.20 2.28 1.99 1.37 1.38 1.39 1.47 1.53 1.58 1.62
PT 3.16 3.01 2.25 1.56 1.55 1.39 1.32 1.37 1.43 1.47 1.52
RO 2.43 1.83 1.31 1.54 1.73 1.79 1.81 1.82 1.83
SI 2.18 2.10 2.11 1.46 1.26 1.57 1.63 1.67 1.70 1.73 1.75
SK 3.04 2.41 2.32 2.09 1.30 1.43 1.32 1.38 1.44 1.48 1.53
FI 2.72 1.83 1.63 1.78 1.73 1.87 1.81 1.83 1.84 1.85 1.86
SE 2.20 1.92 1.68 2.13 1.54 1.98 1.93 1.93 1.93 1.92 1.92
UK 2.72 2.43 1.90 1.83 1.64 1.92 1.93 1.93 1.93 1.93 1.93
NO 2.90 2.50 1.72 1.93 1.85 1.95 1.85 1.86 1.87 1.87 1.88
EU 2.67 2.31 1.97 1.79 1.48 1.60 1.63 1.68 1.71 1.73 1.76
EA 2.78 2.40 1.97 1.73 1.51 1.59 1.59 1.63 1.67 1.69 1.72
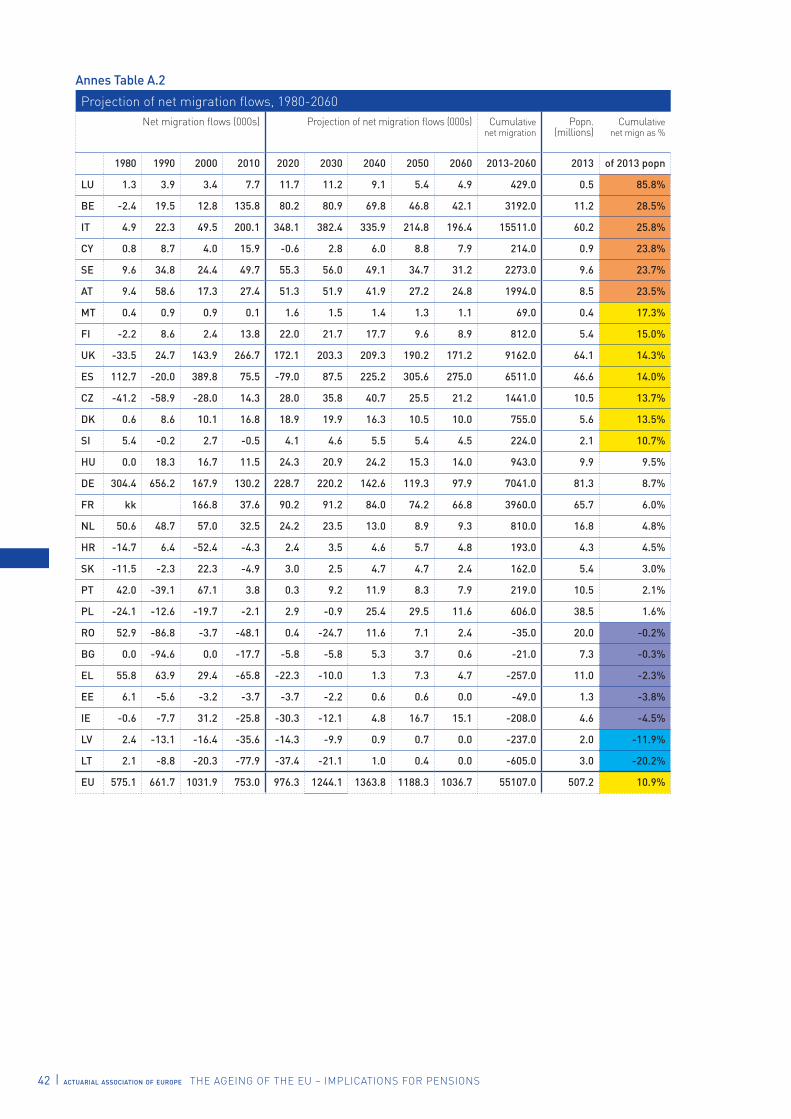
42 I actuarial association of europe THE AGEING OF THE EU – IMPLICATIONS FOR PENSIONS
Annes Table A.2
Projection of net migration flows, 1980-2060Net migration flows (000s) Projection of net migration flows (000s) Cumulative
net migrationPopn.
(millions)Cumulative
net mign as %
1980 1990 2000 2010 2020 2030 2040 2050 2060 2013-2060 2013 of 2013 popn
LU 1.3 3.9 3.4 7.7 11.7 11.2 9.1 5.4 4.9 429.0 0.5 85.8%
BE -2.4 19.5 12.8 135.8 80.2 80.9 69.8 46.8 42.1 3192.0 11.2 28.5%
IT 4.9 22.3 49.5 200.1 348.1 382.4 335.9 214.8 196.4 15511.0 60.2 25.8%
CY 0.8 8.7 4.0 15.9 -0.6 2.8 6.0 8.8 7.9 214.0 0.9 23.8%
SE 9.6 34.8 24.4 49.7 55.3 56.0 49.1 34.7 31.2 2273.0 9.6 23.7%
AT 9.4 58.6 17.3 27.4 51.3 51.9 41.9 27.2 24.8 1994.0 8.5 23.5%
MT 0.4 0.9 0.9 0.1 1.6 1.5 1.4 1.3 1.1 69.0 0.4 17.3%
FI -2.2 8.6 2.4 13.8 22.0 21.7 17.7 9.6 8.9 812.0 5.4 15.0%
UK -33.5 24.7 143.9 266.7 172.1 203.3 209.3 190.2 171.2 9162.0 64.1 14.3%
ES 112.7 -20.0 389.8 75.5 -79.0 87.5 225.2 305.6 275.0 6511.0 46.6 14.0%
CZ -41.2 -58.9 -28.0 14.3 28.0 35.8 40.7 25.5 21.2 1441.0 10.5 13.7%
DK 0.6 8.6 10.1 16.8 18.9 19.9 16.3 10.5 10.0 755.0 5.6 13.5%
SI 5.4 -0.2 2.7 -0.5 4.1 4.6 5.5 5.4 4.5 224.0 2.1 10.7%
HU 0.0 18.3 16.7 11.5 24.3 20.9 24.2 15.3 14.0 943.0 9.9 9.5%
DE 304.4 656.2 167.9 130.2 228.7 220.2 142.6 119.3 97.9 7041.0 81.3 8.7%
FR kk 166.8 37.6 90.2 91.2 84.0 74.2 66.8 3960.0 65.7 6.0%
NL 50.6 48.7 57.0 32.5 24.2 23.5 13.0 8.9 9.3 810.0 16.8 4.8%
HR -14.7 6.4 -52.4 -4.3 2.4 3.5 4.6 5.7 4.8 193.0 4.3 4.5%
SK -11.5 -2.3 22.3 -4.9 3.0 2.5 4.7 4.7 2.4 162.0 5.4 3.0%
PT 42.0 -39.1 67.1 3.8 0.3 9.2 11.9 8.3 7.9 219.0 10.5 2.1%
PL -24.1 -12.6 -19.7 -2.1 2.9 -0.9 25.4 29.5 11.6 606.0 38.5 1.6%
RO 52.9 -86.8 -3.7 -48.1 0.4 -24.7 11.6 7.1 2.4 -35.0 20.0 -0.2%
BG 0.0 -94.6 0.0 -17.7 -5.8 -5.8 5.3 3.7 0.6 -21.0 7.3 -0.3%
EL 55.8 63.9 29.4 -65.8 -22.3 -10.0 1.3 7.3 4.7 -257.0 11.0 -2.3%
EE 6.1 -5.6 -3.2 -3.7 -3.7 -2.2 0.6 0.6 0.0 -49.0 1.3 -3.8%
IE -0.6 -7.7 31.2 -25.8 -30.3 -12.1 4.8 16.7 15.1 -208.0 4.6 -4.5%
LV 2.4 -13.1 -16.4 -35.6 -14.3 -9.9 0.9 0.7 0.0 -237.0 2.0 -11.9%
LT 2.1 -8.8 -20.3 -77.9 -37.4 -21.1 1.0 0.4 0.0 -605.0 3.0 -20.2%
EU 575.1 661.7 1031.9 753.0 976.3 1244.1 1363.8 1188.3 1036.7 55107.0 507.2 10.9%
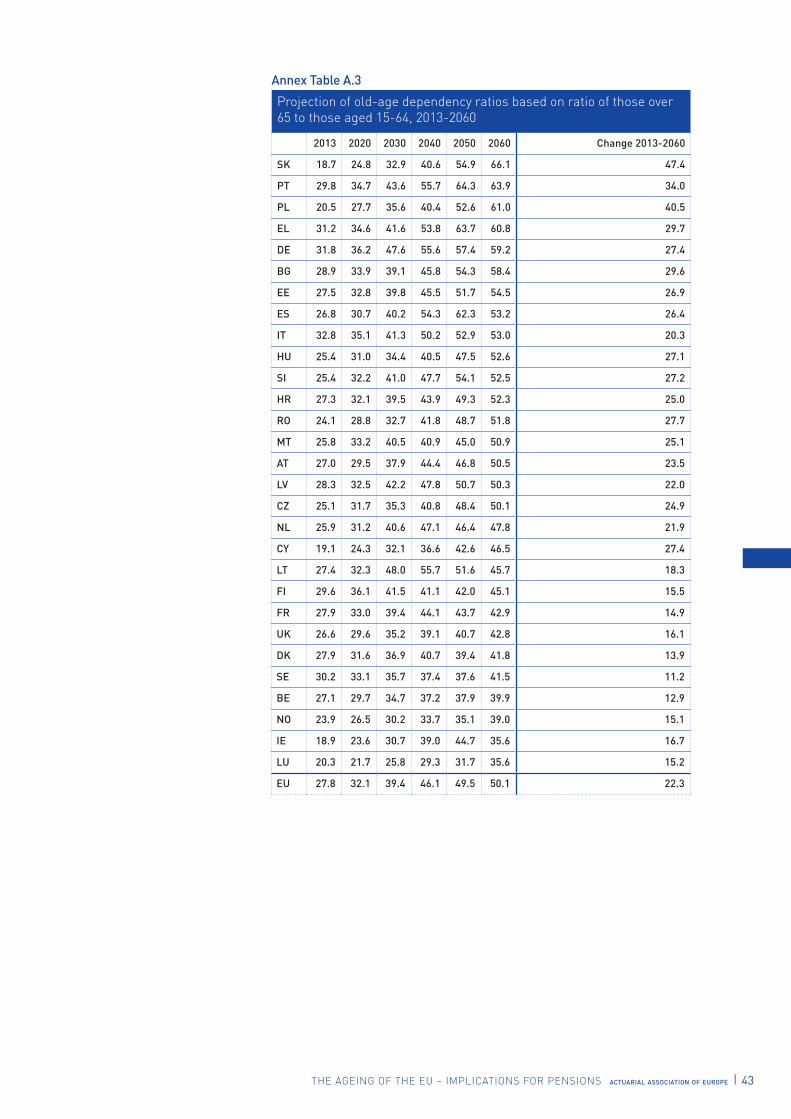
THE AGEING OF THE EU – IMPLICATIONS FOR PENSIONS actuarial association of europe I 43
Annex Table A.3
Projection of old-age dependency ratios based on ratio of those over 65 to those aged 15-64, 2013-2060
2013 2020 2030 2040 2050 2060 Change 2013-2060
SK 18.7 24.8 32.9 40.6 54.9 66.1 47.4
PT 29.8 34.7 43.6 55.7 64.3 63.9 34.0
PL 20.5 27.7 35.6 40.4 52.6 61.0 40.5
EL 31.2 34.6 41.6 53.8 63.7 60.8 29.7
DE 31.8 36.2 47.6 55.6 57.4 59.2 27.4
BG 28.9 33.9 39.1 45.8 54.3 58.4 29.6
EE 27.5 32.8 39.8 45.5 51.7 54.5 26.9
ES 26.8 30.7 40.2 54.3 62.3 53.2 26.4
IT 32.8 35.1 41.3 50.2 52.9 53.0 20.3
HU 25.4 31.0 34.4 40.5 47.5 52.6 27.1
SI 25.4 32.2 41.0 47.7 54.1 52.5 27.2
HR 27.3 32.1 39.5 43.9 49.3 52.3 25.0
RO 24.1 28.8 32.7 41.8 48.7 51.8 27.7
MT 25.8 33.2 40.5 40.9 45.0 50.9 25.1
AT 27.0 29.5 37.9 44.4 46.8 50.5 23.5
LV 28.3 32.5 42.2 47.8 50.7 50.3 22.0
CZ 25.1 31.7 35.3 40.8 48.4 50.1 24.9
NL 25.9 31.2 40.6 47.1 46.4 47.8 21.9
CY 19.1 24.3 32.1 36.6 42.6 46.5 27.4
LT 27.4 32.3 48.0 55.7 51.6 45.7 18.3
FI 29.6 36.1 41.5 41.1 42.0 45.1 15.5
FR 27.9 33.0 39.4 44.1 43.7 42.9 14.9
UK 26.6 29.6 35.2 39.1 40.7 42.8 16.1
DK 27.9 31.6 36.9 40.7 39.4 41.8 13.9
SE 30.2 33.1 35.7 37.4 37.6 41.5 11.2
BE 27.1 29.7 34.7 37.2 37.9 39.9 12.9
NO 23.9 26.5 30.2 33.7 35.1 39.0 15.1
IE 18.9 23.6 30.7 39.0 44.7 35.6 16.7
LU 20.3 21.7 25.8 29.3 31.7 35.6 15.2
EU 27.8 32.1 39.4 46.1 49.5 50.1 22.3
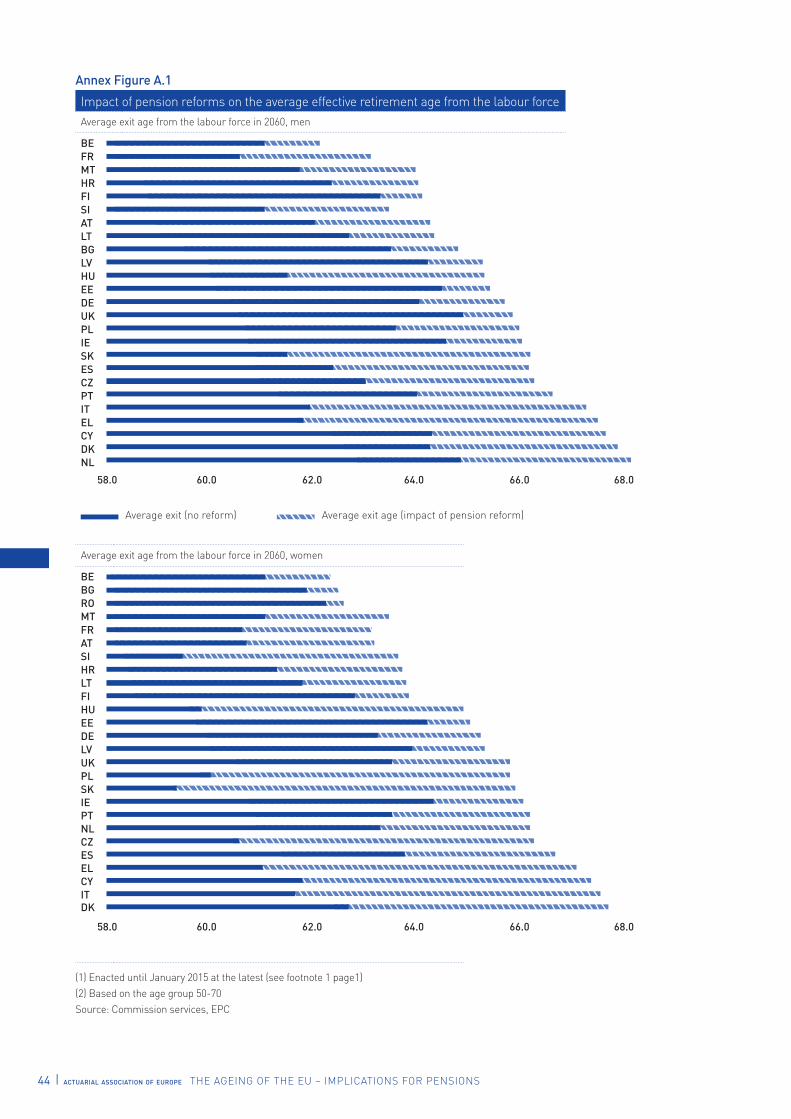
44 I actuarial association of europe THE AGEING OF THE EU – IMPLICATIONS FOR PENSIONS
Annex Figure A.1
Impact of pension reforms on the average effective retirement age from the labour force Average exit age from the labour force in 2060, men
BEFRMTHRFISIATLTBGLVHUEEDEUKPLIESKESCZPTITELCYDKNL
Average exit age from the labour force in 2060, women
BEBGROMTFRATSIHRLTFIHUEEDELVUKPLSKIEPTNLCZESELCYITDK
(1) Enacted until January 2015 at the latest (see footnote 1 page1) (2) Based on the age group 50-70 Source: Commission services, EPC
58.0 60.0 62.0 64.0 66.0 68.0
58.0 60.0 62.0 64.0 66.0 68.0
Average exit (no reform) Average exit age (impact of pension reform)


The Actuarial Association of EuropeThe Actuarial Association of Europe (AAE), founded in 1978 under the name of Groupe Consultatif Actuariel Européen, is the Brussels-based umbrella organisation, which brings together the 36 professional associations of actuaries in 35 countries of the EU, together with the countries of the European Economic Area and Switzerland and some EU candidate countries. The AAE has established and keeps up-to-date a core syllabus of education requirements, a code of conduct and discipline scheme requirements, for all its full member associations. It is also developing model actuarial standards of practice for its members to use and it oversees a mutual recognition agreement, which facilitates actuaries being able to exercise their profession in any of the countries concerned. The AAE also serves the public interest by providing advice and opinions, independent of industry interests, to the various institutions of the European Union - the Commission, The Council of Ministers, the European Parliament, ECB, EIOPA and their various committees - on actuarial issues in European legislation and regulation.
A C T U A R I A L A S S O C I AT I O N O F E U R O P E Maison des Actuaires 4 Place du Samedi B-1000 Brussels Tel +32 (0)2 217 01 21 Fax +32 (0)2 792 46 48 [email protected] www.actuary.eu
The
AA
E is
reg
iste
red
in t
he
EU
Tra
nsp
aren
cy R
egis
ter
un
der
nu
mbe
r 55
0855
9111
44-5
4