Embed Size (px)
Citation preview
The 2005 Youth Risk Behavior Survey
Vermont Department of HealthAgency of Human Services
September 27, 2005
The 2005 Vermont Youth Risk Behavior Survey
Measures the prevalence of behaviors that contribute to the leading causes of death, disease, and injury
Enables us to: Monitor trends Compare VT to US Plan, evaluate and
improve community and school programs that prevent health problems and promote healthy behavior
Over 31,000 VT students participate
The 2005 Vermont Youth Risk Behavior Survey
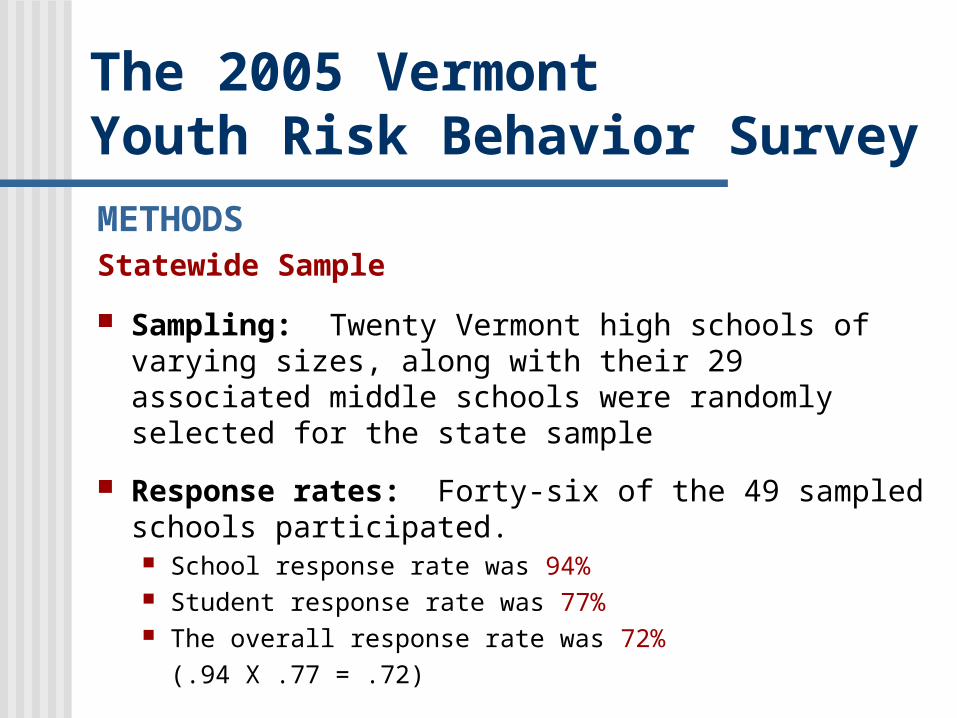
METHODSStatewide Sample
Sampling: Twenty Vermont high schools of varying sizes, along with their 29 associated middle schools were randomly selected for the state sample
Response rates: Forty-six of the 49 sampled schools participated. School response rate was 94% Student response rate was 77% The overall response rate was 72%
(.94 X .77 = .72)
The 2005 Vermont Youth Risk Behavior Survey
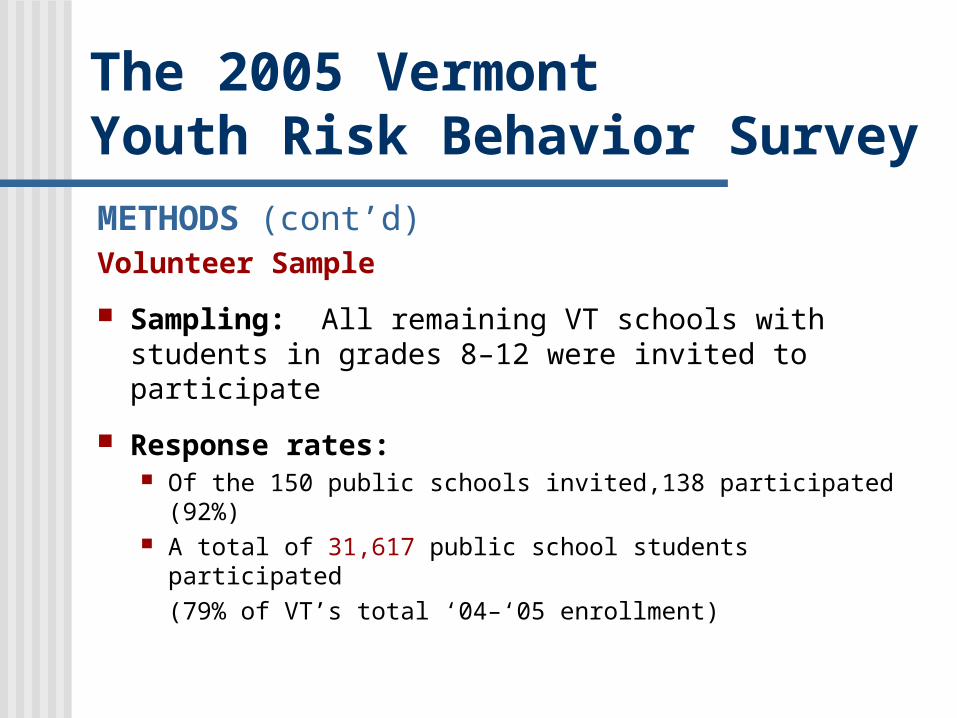
METHODS (cont’d)Volunteer Sample
Sampling: All remaining VT schools with students in grades 8–12 were invited to participate
Response rates: Of the 150 public schools invited,138 participated (92%) A total of 31,617 public school students participated
(79% of VT’s total ‘04–‘05 enrollment)
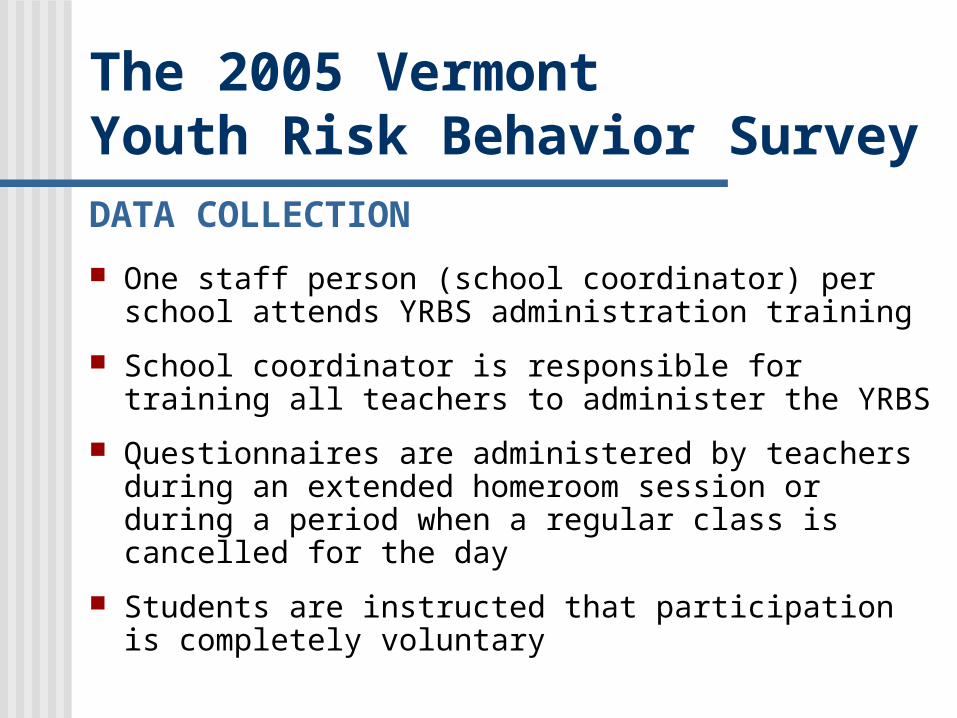
The 2005 Vermont Youth Risk Behavior SurveyDATA COLLECTION
One staff person (school coordinator) per school attends YRBS administration training
School coordinator is responsible for training all teachers to administer the YRBS
Questionnaires are administered by teachers during an extended homeroom session or during a period when a regular class is cancelled for the day
Students are instructed that participation is completely voluntary
The 2005 Vermont Youth Risk Behavior Survey
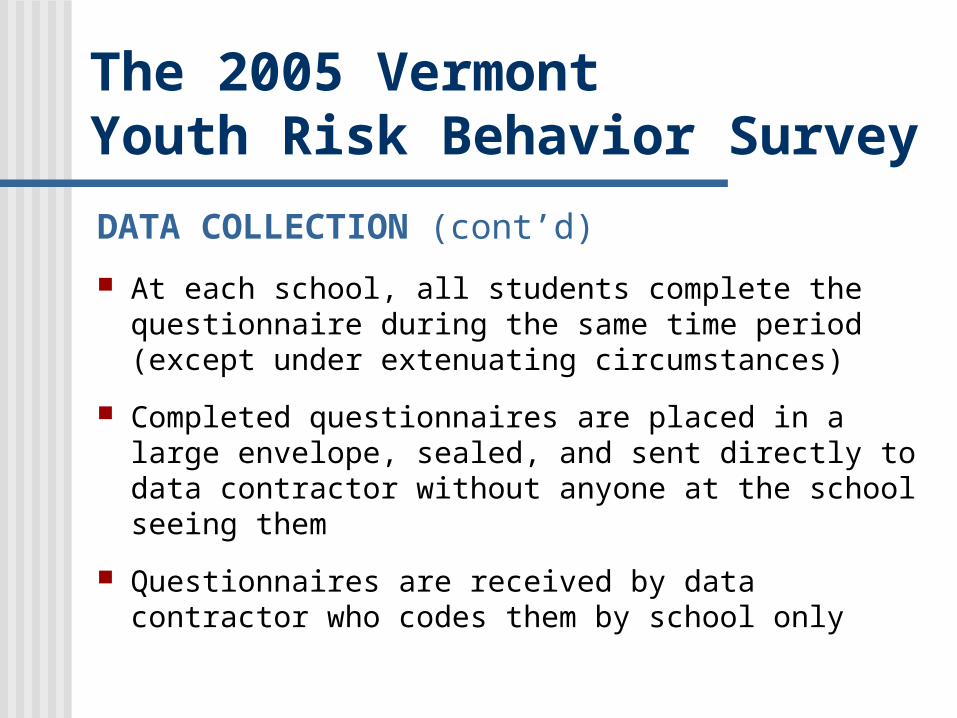
DATA COLLECTION (cont’d)
At each school, all students complete the questionnaire during the same time period (except under extenuating circumstances)
Completed questionnaires are placed in a large envelope, sealed, and sent directly to data contractor without anyone at the school seeing them
Questionnaires are received by data contractor who codes them by school only
Violence
Fewer students plan suicide 11% of students made a suicide plan during the
past year, down from 16% in 1999
15% of girls made a suicide plan vs. 8% of boys, and 9% of girls actually attempted vs. 4% boys
ViolencePhysical fighting is down from 1993. 27% of students fought, down from 45% in 1993; but
unchanged from 29% in 1999 6% of students were threatened or injured with a weapon
on school property, similar to 8% in 1999 13% of boys carried weapons to school down slightly from
19% in 1999 6% of students were hit, slapped, or physically hurt by a
boyfriend or girlfriend, similar to 8% in 1999 18% of students were bullied, and 21% someone during
the past 30 days
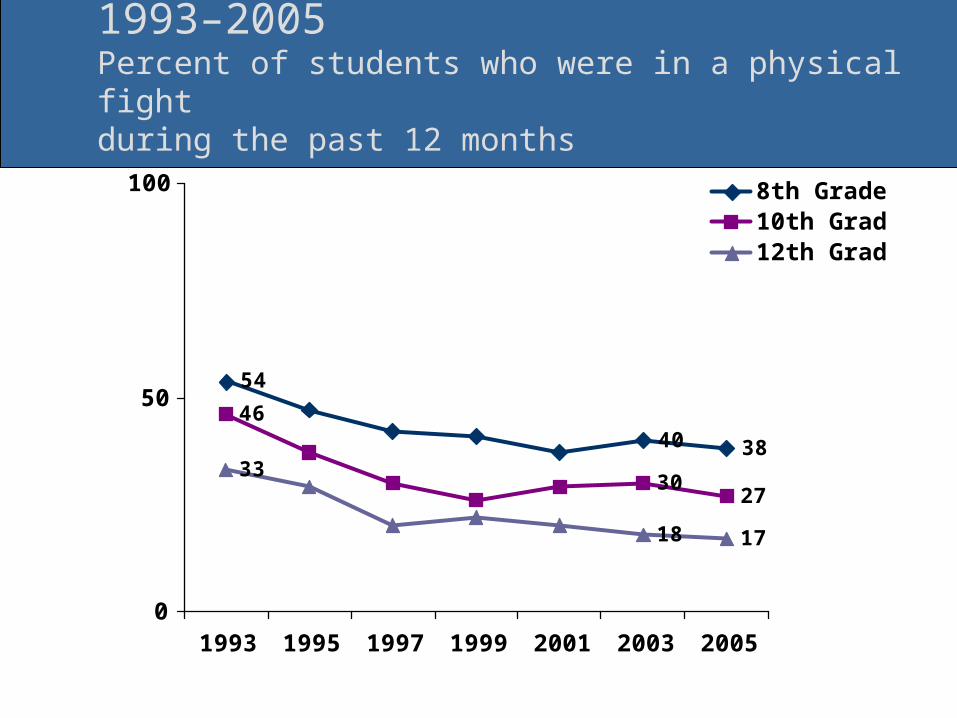
Physical Fighting in Vermont 1993–2005Percent of students who were in a physical fight during the past 12 months
54
40 38
46
3027
33
18 17
0
50
100
1993 1995 1997 1999 2001 2003 2005
8th Grade10th Grade12th Grade
DrivingRiding in a car with a drinking driver down.
Drinking and driving unchanged. 22% of students rode with a drinking driver, compared to
26% in 1999 8% of students have driven when drinking alcohol,
unchanged from 10% in 1999 23% rode with a driver who had been using mj,
compared to 30% in 1999 11% of students have driven when using mj, compared
to 16% in 1999
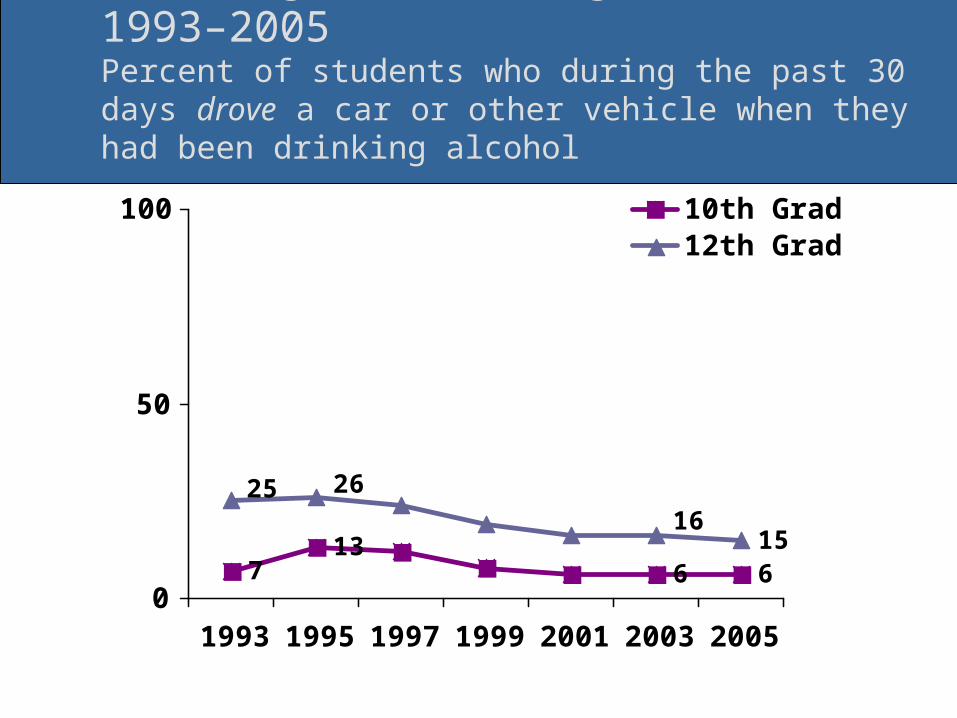
Drinking and Driving in Vermont 1993–2005Percent of students who during the past 30 days drove a car or other vehicle when they had been drinking alcohol
713
6 615
16
2625
0
50
100
1993 1995 1997 1999 2001 2003 2005
10th Grade12th Grade
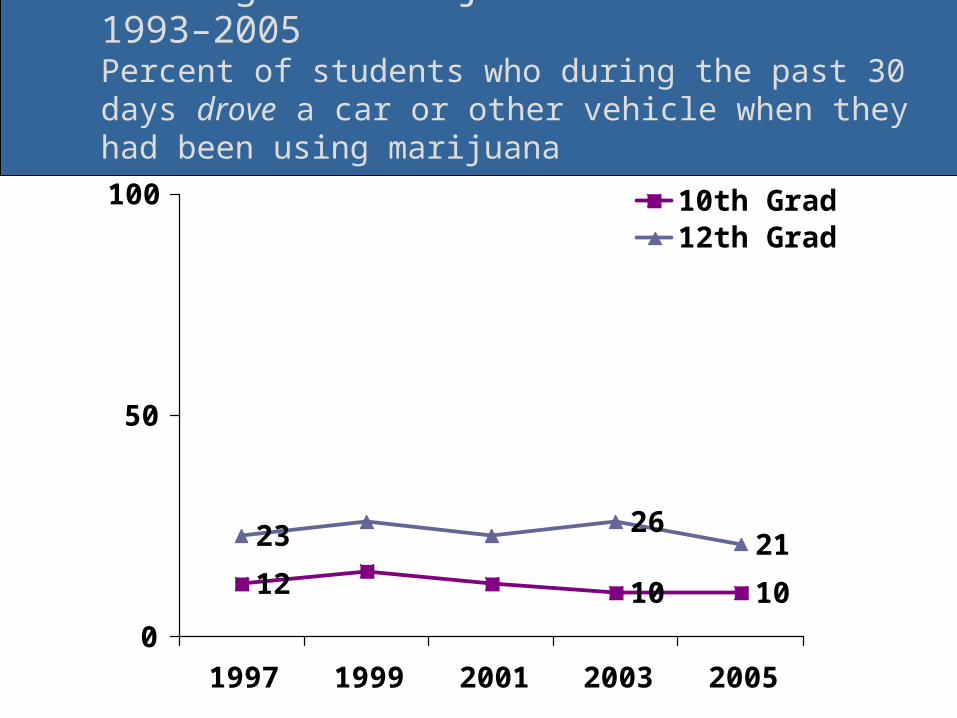
Driving and Marijuana Use in Vermont 1993–2005Percent of students who during the past 30 days drove a car or other vehicle when they had been using marijuana
12 10 10
23 2621
0
50
100
1997 1999 2001 2003 2005
10th Grade12th Grade
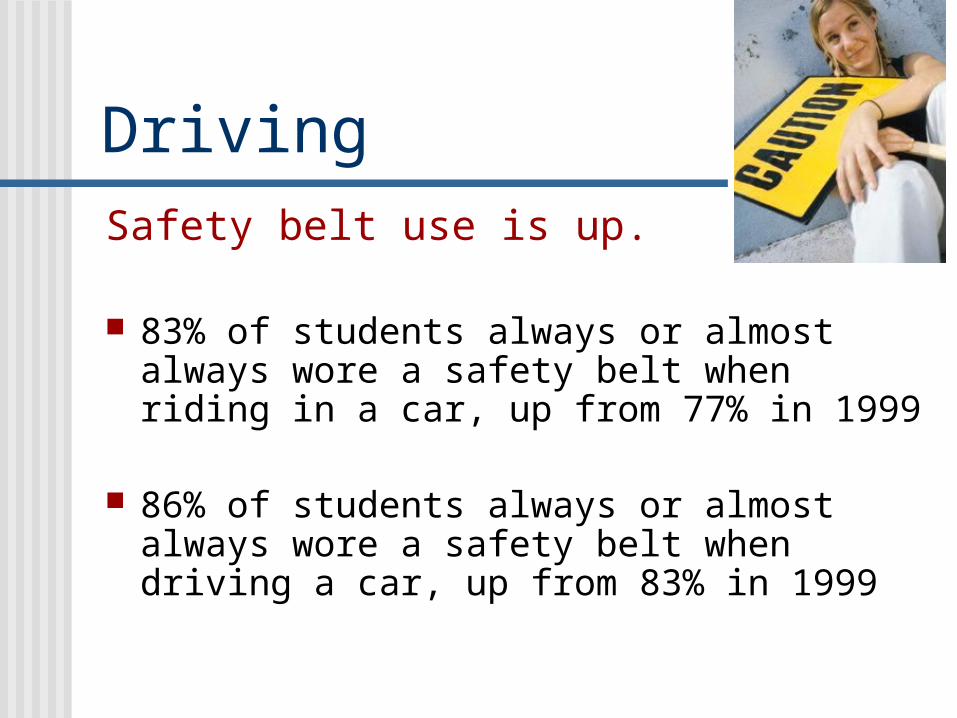
DrivingSafety belt use is up.
83% of students always or almost always wore a safety belt when riding in a car, up from 77% in 1999
86% of students always or almost always wore a safety belt when driving a car, up from 83% in 1999

SmokingCigarette smoking continues to decline.
More students disapprove of smoking. 16% of students smoked, down from 31% in 1999
14% of students smoked prior to age 13, down from 28% in 1999
69% of students report that it is easy to get cigarettes, compared to 74% in 1999
78% of students think it is wrong to smoke cigarettes, up from 57% in 1999
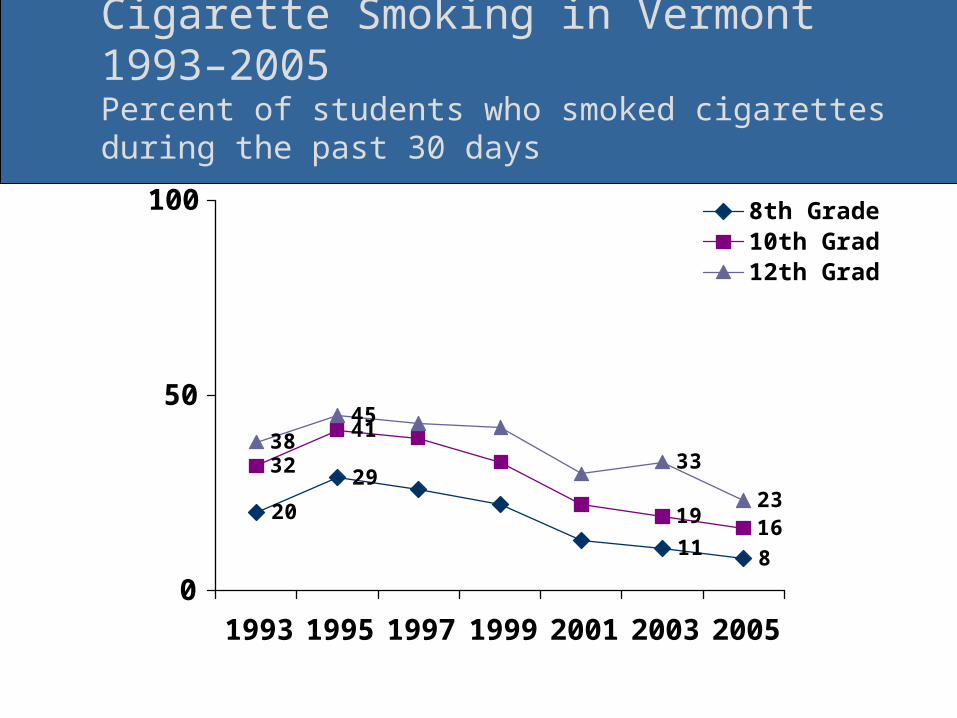
Cigarette Smoking in Vermont 1993–2005Percent of students who smoked cigarettes during the past 30 days
20
29
11 8
32
41
1916
3845
33
23
0
50
100
1993 1995 1997 1999 2001 2003 2005
8th Grade10th Grade12th Grade
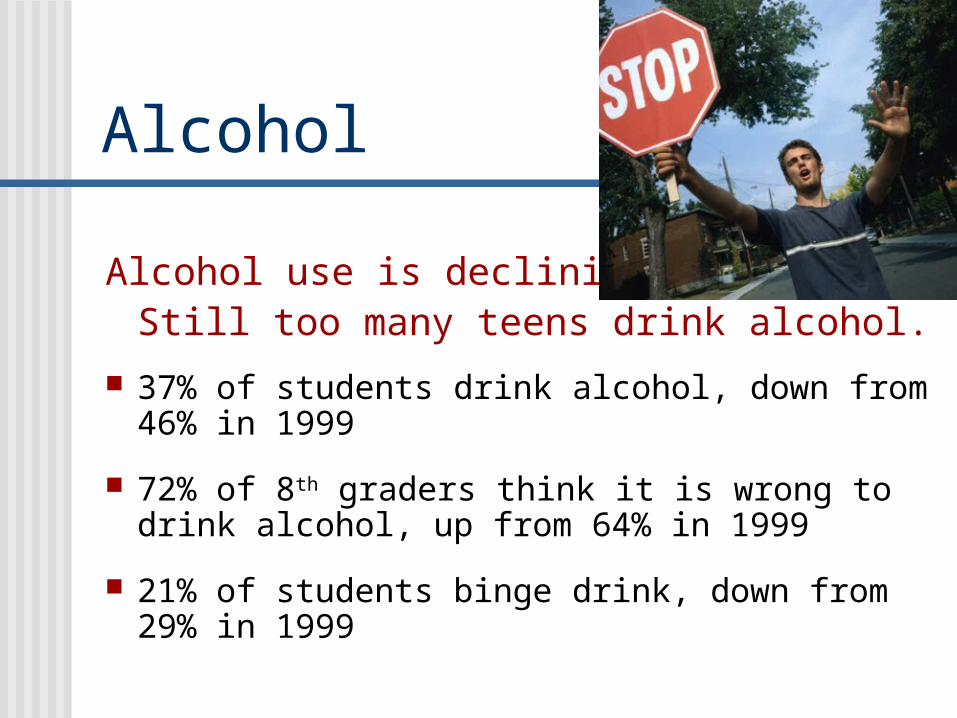
Alcohol
Alcohol use is declining. Still too many teens drink alcohol.
37% of students drink alcohol, down from 46% in 1999
72% of 8th graders think it is wrong to drink alcohol, up from 64% in 1999
21% of students binge drink, down from 29% in 1999
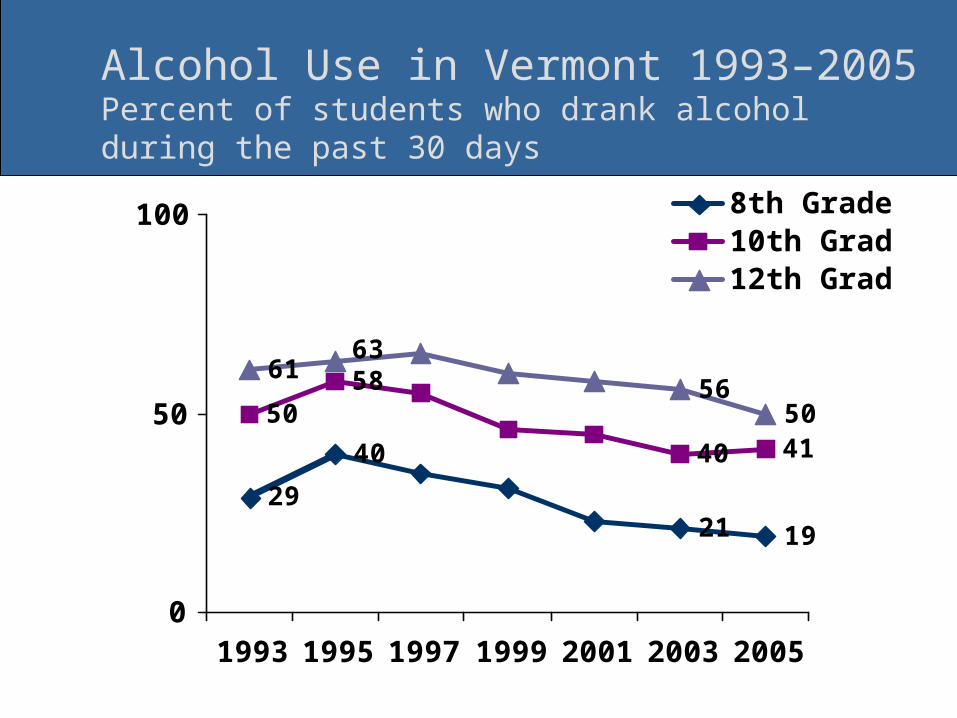
Alcohol Use in Vermont 1993–2005Percent of students who drank alcohol during the past 30 days
2921 19
5058
40 41
6156
50
40
63
0
50
100
1993 1995 1997 1999 2001 2003 2005
8th Grade10th Grade12th Grade
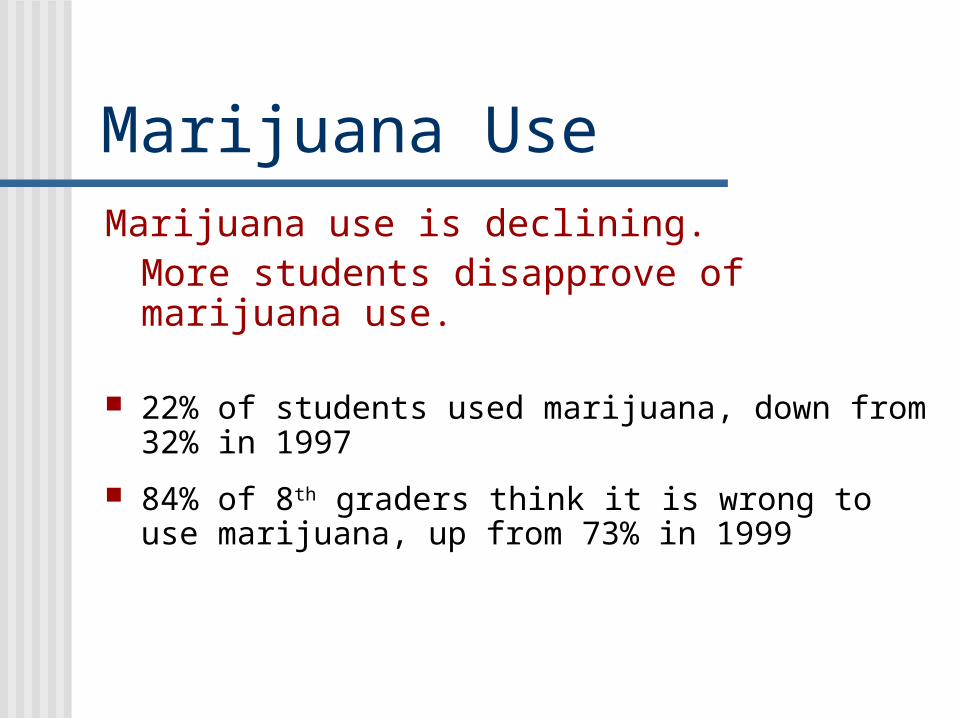
Marijuana UseMarijuana use is declining.
More students disapprove of marijuana use.
22% of students used marijuana, down from 32% in 1997
84% of 8th graders think it is wrong to use marijuana, up from 73% in 1999
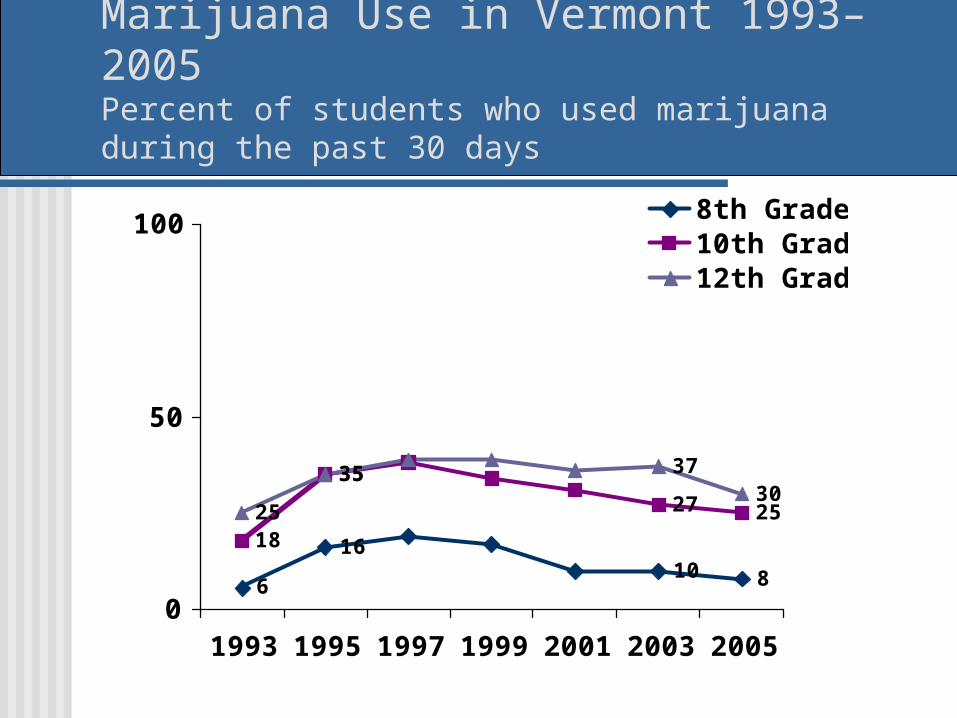
Marijuana Use in Vermont 1993–2005Percent of students who used marijuana during the past 30 days
6
1610 8
18
35
27 2525
35 3730
0
50
100
1993 1995 1997 1999 2001 2003 2005
8th Grade10th Grade12th Grade

Other drugsCocaine, methamphetamine, hallucinogen use
declining.Heroin use unchanged.
6% have ever used cocaine, down from 9% in 1999 5% have ever used methamphetamines, down from
10% in 1999 10% have ever used hallucinogens, down from 20% in
1999 3% have ever used heroin, unchanged from 4% in 1999
55% of students know an adult who uses illegal drugs and 31% know an adult who sells illegal drugs
Sex
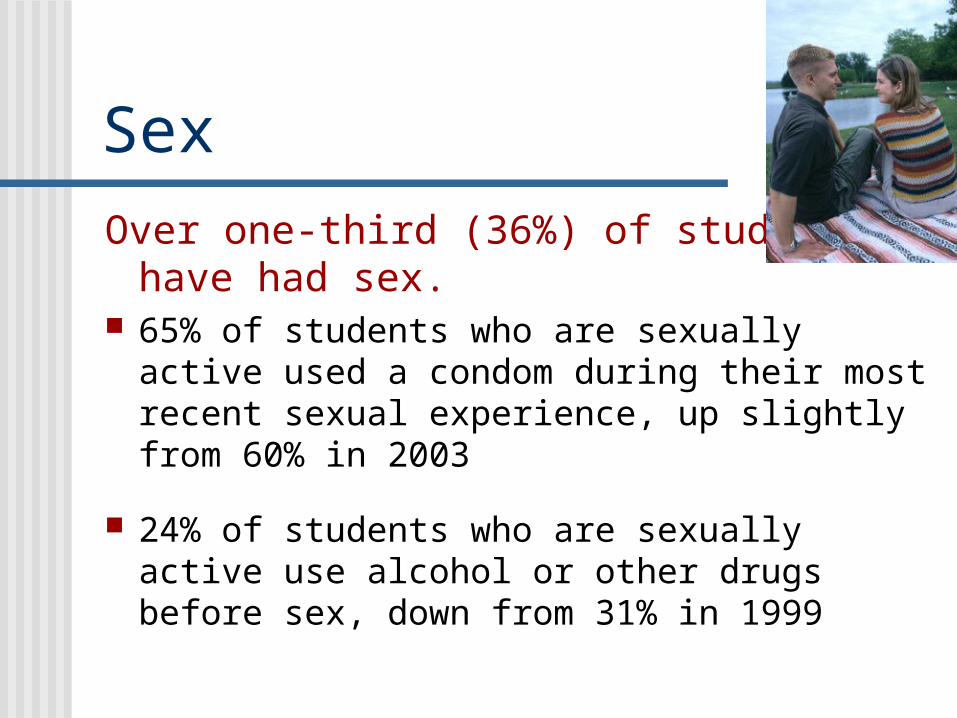
Over one-third (36%) of students have had sex.
65% of students who are sexually active used a condom during their most recent sexual experience, up slightly from 60% in 2003
24% of students who are sexually active use alcohol or other drugs before sex, down from 31% in 1999
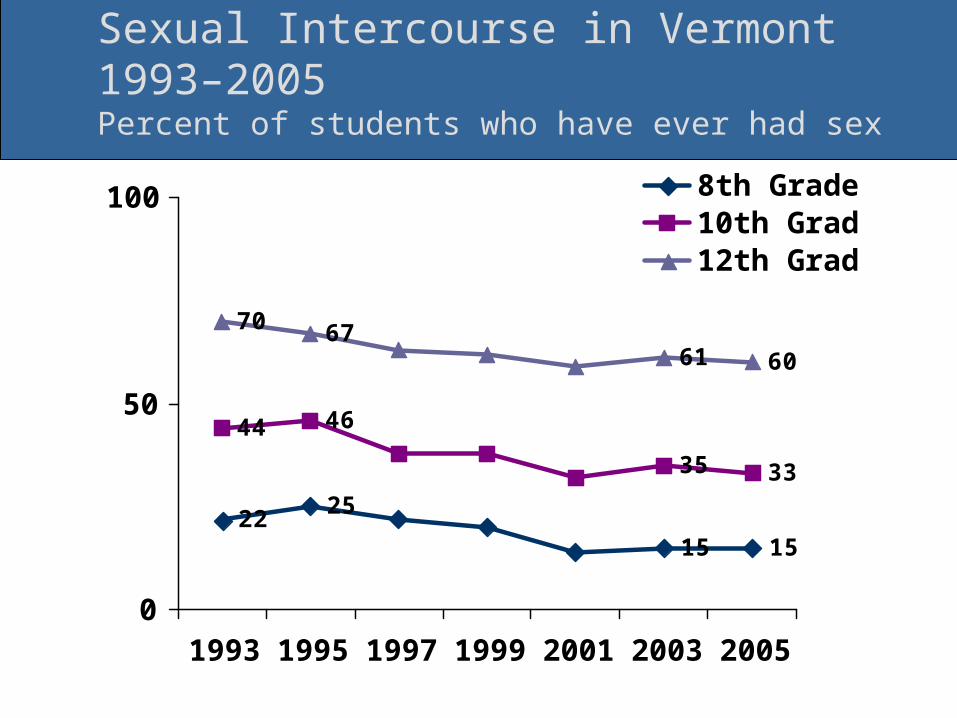
Sexual Intercourse in Vermont 1993–2005Percent of students who have ever had sex
2225
15 15
44 46
35 33
70 6761 60
0
50
100
1993 1995 1997 1999 2001 2003 2005
8th Grade10th Grade12th Grade
Diet
Less students eat enough fruits and vegetables.
24% of students eat five or more servings of fruits and vegetables per day, down from 33% in 1999
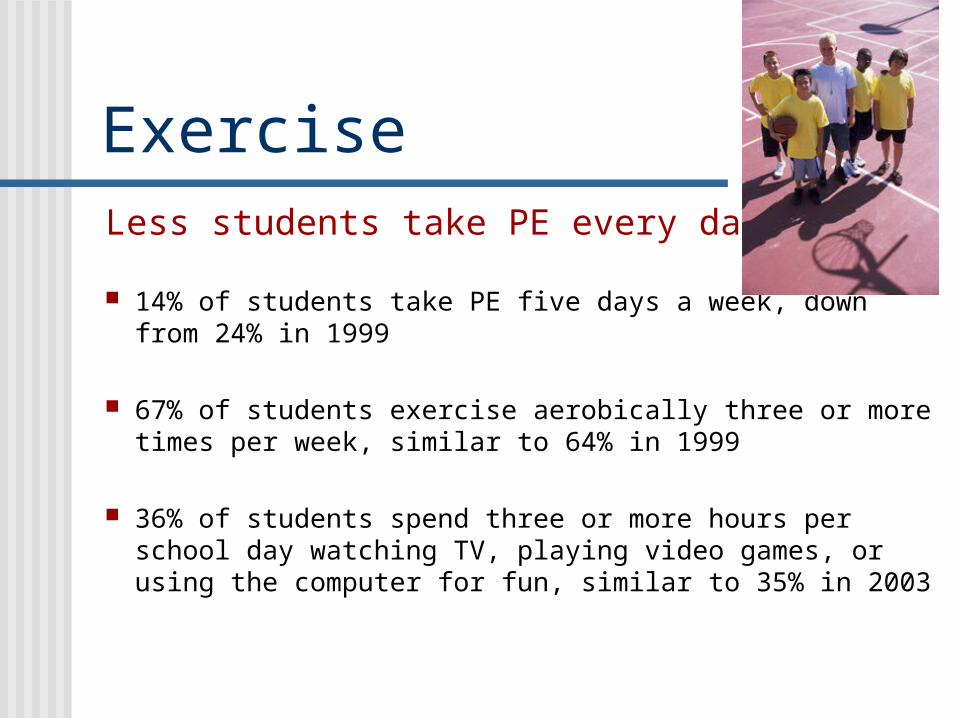
ExerciseLess students take PE every day.
14% of students take PE five days a week, down from 24% in 1999
67% of students exercise aerobically three or more times per week, similar to 64% in 1999
36% of students spend three or more hours per school day watching TV, playing video games, or using the computer for fun, similar to 35% in 2003
Youth assets
Most students talk to their parents about school.
78% of students said their parents talked with them every day or week, up slightly from 74% in 1999
31% spend 1 or more hours per week participating in clubs/organization, similar to 28% in 2003
46% spend 1 or more hours per week volunteering their time, similar to 45% in 2003
88% have an adult in their life they can turn to for help and advice
Resources
www.healthvermont.gov