Embed Size (px)
Citation preview

Thailand and Its Knowledge Economy
Arkhom Termpittayapaisith Deputy Secretary-General, Office of the
National Economic and Social Development Board, Thailand.

Development Paradigm
Old Paradigm
New Paradigm
Low Labor CostAbundant Natural Resources
Knowledge + Labor + NR
Unsustainable
Dev.
Sustainable
Dev.

Knowledge Economy: Where Does Thailand Stand?
1.Economic competitiveness: technological and scientific capabilities
- WEF Ranking
- IMD Ranking
2. Knowledge economy: Knowledge Assessment Methodology (KAM)
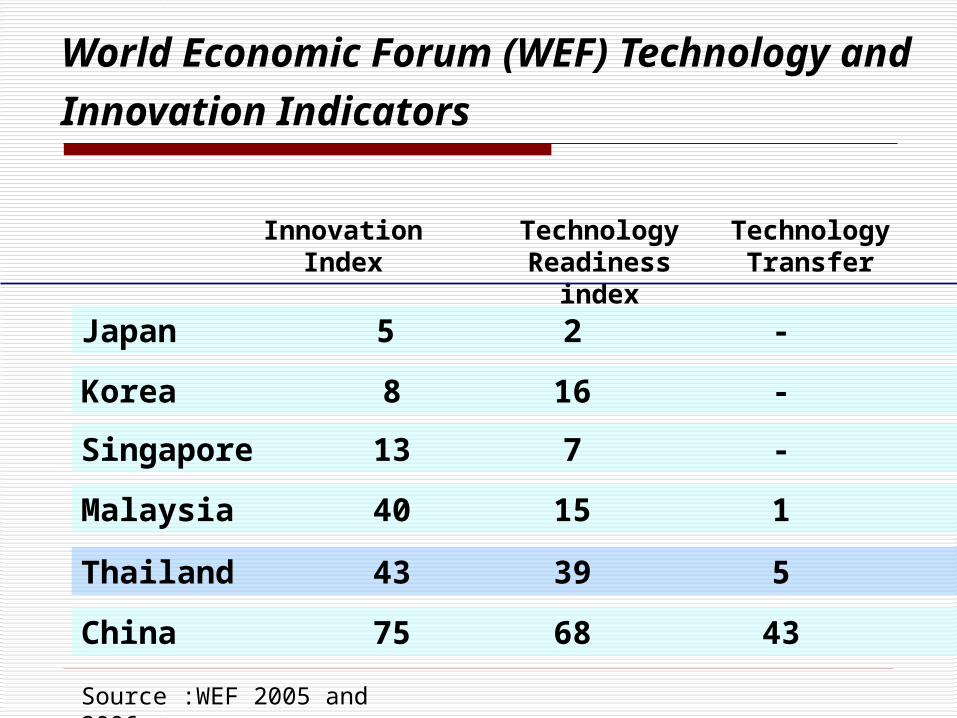
World Economic Forum (WEF)
Technology and Innovation Indicators
Innovation Index
Technology Readiness
index
Technology Transfer
Japan 5 2 -
Korea 8 16 -Singapore 13 7 -
Malaysia 40 15 1
Thailand 43 39 5
China 75 68 43
Source :WEF 2005 and 2006

IMD Science and Technology Assessment
Infrastructure
Technological Infrastructure
Scientific Infrastructure
Numbers of Countries Assessed
Source: IMD, various years.
’06
48
53
61
’04
45
55
60
’03
20
26
30
’02
43
46
49
’01
48
49
49
’00
47
47
47
’99
47
48
47
’98
43
43
47
’97
32
32
47
’05
45
56
60

Knowledge Assessment Methodology (KAM)
KAM is based on the four of pillars of KE developed by the World Bank Institute (WBI) that are
(1) economic and institutional regime, (2) educated and skilled population, (3) national innovation system, and (4) dynamic information infrastructure.
KAM is designed to help countries assessing their strengths and weaknesses in making transition to knowledge economy.
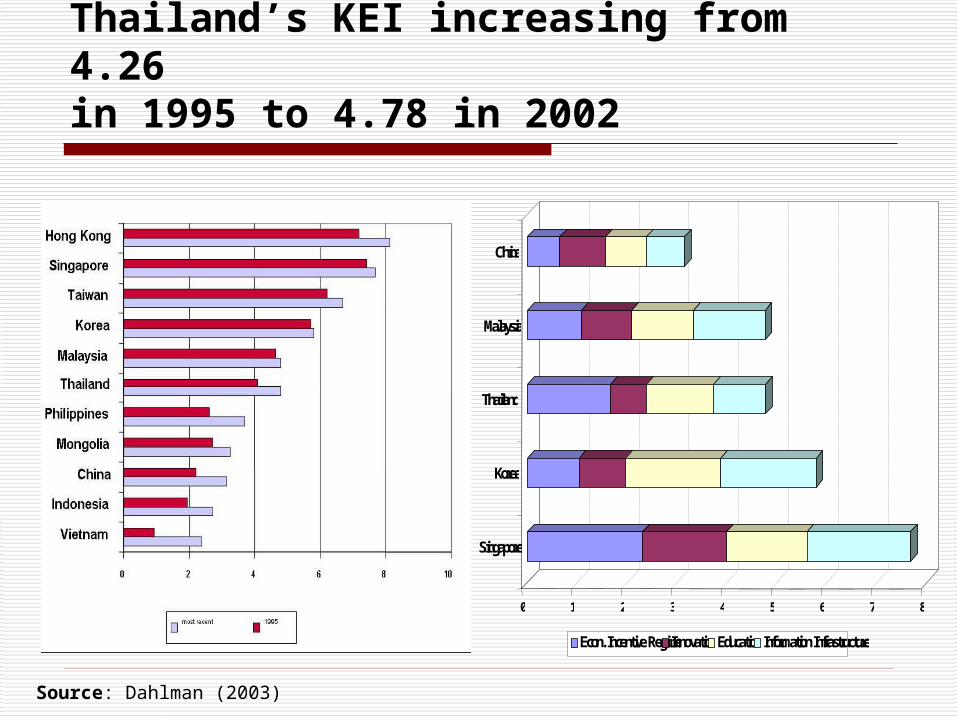
Thailand’s KEI increasing from 4.26in 1995 to 4.78 in 2002
0 1 2 3 4 5 6 7 8
Singapore
Korea
Thailand
Malaysia
China
Econ. Incentive Regime Innovation Education Information Infrastructure
Source: Dahlman (2003)

Selected 14 Variables from KAM(Detailed Analysis)
Overall Performance of the Economy
GDP Growth Poverty Index
Economic
Incentive &
Institutional
Regime
Soundness of Banks Intensity of Local Competition Government Effectiveness
Innovation System Researchers in R&D Per Million Population Total Expenditure for R&D as % of GDP Research Collaboration (UILs)
Education &Human Resources:
Average Years of Schooling Professional &Technical Workers (% of Labor Force) Quality of Science & Math Education
ICT
Internet Users Per 10,000 People E-Govt services ICT Expenditure as % of GDP

KAM Spidergram for Thailand, Japan, Korea and China
KAM of Thailand, Japan, Korea, and China
0
5
10GDP Growth(%)
Poverty Index
Soundness of Banks
Local Competition
Government Effectiveness
Researchers in R&D / million
Total Expenditure for R&D as % of GDP
University-Company Research Collaboration
Average Years of Schooling
Prof. and Tech. Workers as % of the Labor Force
Quality of Science and Math Education
Internet users per 10,000 people
E-Government Services
ICT Expenditure as % of GDP
Thailand Japan Korea ChinaSource: The World Bank Institute (2006)

Thailand, KAM Spidergram for Selected Variables of Innovation Pillar
THAILAND - INNOVATION PILLAR
0
5
10
Gross Foreign Direct Investment as % ofGDP
Researchers in R&D / million
Total Expenditure for R&D as % of GDP
Manuf. Trade as % of GDP
University-Company ResearchCollaboration
Scientific and technical journal articles /mil. pop.
Availability of Venture Capital
Patent applications granted by theUSPTO / mil. pop.
High-Tech Exports as % of Manuf.Exports
Private Sector Spending on R&D
Firm-level Technology Absorption
Value Chain Presence
Source: The World Bank Institute (2006)

Selected Indicators: Measures of Innovation
Educational Attainment of Thai Population and Workforce
Quality of the Educational Outputs R&D Expenditure and Patents

Educational Attainment
Taiwan 876 10
Thailand 6.5 12.6
Korea 10.84 6.5
Malaysia 6.8 16.2
Singapore 7.05 16.4
Country Mean Years of School
No Schooling( % of pop. aged over
15)
Source: Barro and Lee (2000) and http://www.ksg.harvard.edu/CID

Educational Attainment of Population: Thailand and Malaysia
Source: Dahlman (2003).
Primary Complete
16%
Primary Incomplete
24%Secondary Complete
16%
Secondary Incomplete
13%
Tertiary Complete
21%
No schooling7%
Tertiary Incomplete
3%
Malaysia 2000
Primary Complete
27%
No schooling13%Secondary
Incomplete11%
Primary Incomplete
34%
Secondary Complete
4%
Tertiary Complete
7%
Tertiary Incomplete
4%
Thailand 2000

Thai labor force is not well educated
Educational Attainment of Employed Persons Aged Over 15
Less than Primary35.5%
Primary22.5%
Low er Secondary14.1%
Upper Secondary11.3%
Higher Level 12.6%
Others0.1% None
3.5%
Unknow n0.4%
Source: National Statistical Office (2005), Report of the Labor Force Survey.

Workforce Employed in Thai Business Enterprises is mostly Non S&T Classification.
Percentage of S&T and Non S&T Workforce Classified by Industry
0%
20%
40%
60%
80%
100%1
. F
oo
d a
nd
An
nim
al
Fe
ed
2.
Te
xti
le a
nd
Ga
rme
nt
3.
Fo
otw
are
an
d L
ea
the
r
4.
Wo
od
en
Fu
rnit
ure
5.
Pe
tro
ch
em
ica
l
6.
Mo
ld &
Die
7.
Ru
bb
er
an
d R
ub
be
r P
rod
uc
ts
8.
Ce
ram
ics
an
d G
las
se
s
9.
Iro
n a
nd
Ste
el
10
. E
lec
tric
al
an
d E
lec
tro
nic
Su
pp
lie
nc
es
11
. A
uto
mo
bil
e a
nd
Pa
rts
12
. G
em
s a
nd
Je
we
lrie
s
NonS&T/2003
S&T/2003
Source: Thailand Research and Development Institute (2004).

Quality of the Educational Outputs
Thai secondary education students performed below average and poorly as compared with students in other East Asian countries.
Source: Trend in Mathematic and Science Study (TIMSS), as cited in the World Bank (2005).
Math
604.4
587.2
585.1
582.1
578.6
519.3
467.4
403.1
344.9
Science
567.9
548.6
569.1
529.6
549.7
492.4
482.3
435.5
345.2
Science
580.4
545. 8
509.7
554.5
510.1
Math
608.6
580.7
568.9
581.1
516.2
Country
Singapore
South Korea
Taiwan
Hong Kong
Japan
Malaysia
Thailand
Indonesia
Philippines
1995 1999

Thai students under the supervision of IPST were reported their great performance in Olympiad programme
Source: Program for International Student Assessment (PISA), (OECD) as cited in the World Bank (2005).
2003
Japan
Korea
Hong Kong
Indonesia
Macao-China
Thailand
OECD Average
Math
553
552
558
361
528
424
496
Science
548
538
539
395
525
429
500
Reading
598
534
510
382
498
420
494
Program for International Student Assessment (PISA) Score

R&D Expenditure
Thailand requires more national R&D spending
R&D spending, a more focus on research/knowledge commercialization through increased patenting and a more entrepreneurial dimension has to be in place
Source: R&D Survey, NSO.
R&D exp.
R&D exp. per capita (bath)
R&D exp. as % of GDP
Govt. budget outlays for R&D
1996
5,528.1
92.0
0.1
3,395.2
1999
5,021.7
81.3
0.12
2,182.7
(Million Bath)2003
15,499.2
242.2
0.3
7,36460

R&D Expenditure classified by Field of Research and Sector of Performance
Business enterprises and higher education are key players in research and development
0 1,000 2,000 3,000 4,000 5,000 6,000 7,000
Government
HigherEd. (pub.)
Higher Ed. (priv.)
P ublic Enterprise
P rivate Enterprise
P rivate non-profit
Natural Sciences Engineering Technologies
Medical Sciences Agricultural Sciences
Social Sciences Humanities
Source: R&D Survey, NSO.

Patents per 100,000 Populations
Source: US Patent and Trademark Office as cited in the World Bank (2006), East Asia Update.
East Asia & PacificTaiwan, ChinaSingaporeHong KongKoreaMalaysiaThailandChinaPhilippinesIndonesia
OECDUnited StatesJapanAustralia
0.041.810.311.670.200.020.000.000.010.009.83
18.4712.622.80
0.209.241.863.652.590.080.020.000.010.00
12.8324.5018.752.99
0.6630.179.879.328.670.280.070.030.020.01
19.0033.5628.545.26
225.6226.6431.7154.9235.4238.6276.0636.0377.2132.448.1
37.052.276.3
% Change 1993-96-2001-
04 2001-04 1993-96 1985-88

Government Policy in Enhancing Knowledge Economy
Development goals for S&T development in the 9th National Economic and Social Development Plan
qualitative goals • Enhancing capability in technological innovation; Setting up mechanisms and institutions for knowledge diffusion and knowledge transfer• Focusing on quality improvement for teaching in all S&T educational levels.
quantitative goals• Increasing R&D expenditure to be not less than 0.4 % of GDP • Increasing numbers of researchers to 3.5 persons per 10,000 populations.

Policy Implementations
The National Science and Technology Development Agency (NSTDA)
Office of Knowledge Management and Development (OKMD) administers 7 offices :1.Thailand Design Center, TDC;2.Thailand Center of Excellence for Life Science;3. National Center for the Gifted and Talented;4. Thai Knowledge Park;5. National Discovery Museum Institute;6. Center for the Promotion of National Strength on Moral Ethics and Values; 7. National Institute for Brain-based Learning
National Innovation Agency
Science Park
Software Park
Software Industry Promotion Agency (SIPA).
Role: stimulating technology development and providing incentive structure for a society of knowledge and innovativeness of the country.
Institutional arrangements in Thailand in relation to innovativeness and knowledge

University and Industry Linkages (UILs)in Thailand
Prominent role of the university is put onto
educating people while other roles are still at
minimum.
Firms have generally not exhibited strong
interest in UILs
Effective UILs are heavily tied with large firms
such as large garment exporters, Seagate in
hard disk drives, and the CP group in shrimps

Thai firms and their major partners
0
10
20
30
40
50
60
70
80
90
Gov
ernm
ent o
rpr
ivat
e no
n-pr
ofit
rese
arch
inst
itute
s
Uni
vers
ities
orot
her
high
ered
ucat
ion
inst
itute
s
Com
petit
ors
For
eign
-ow
ned
supp
liers
Loca
lly-o
wne
dsu
pplie
rs
Par
ent/A
ssoc
iate
com
pani
es Clie
nts
Percent of Firms Identifying their External Information Sources%
Clients, parent/associate companies, local and foreign suppliers are major partners of Thai firm
R&D institutes and universities including government have played a minor role in building technology/innovation capabilities of firms.
Source: Based on Thailand National Science & Technology Development Agency R&D/Innovation Survey 2002, cited in Intarakumnerd (2005).

Brief review of UILs in Thailand
Mitr Phol sugarcane research center has linkages with public technology institutions like National Science and Technology Development Agency, and MTEC more than those with university.
Toyota Technical Center—Asia Pacific (TTCAP) has had significant linkages and collaboration extending beyond the national boundary where the center is located. However, TTCAP is reported to have a simple network to recruit employees with Thai universities.
Seagate: Qualified engineers are produced in collaboration with Thai universities and the first joint Seagate/AIT academic course has been offered in the Master's program since 1999.
Sources: Brimble (2006), Asian Institute of Technology(2006).
NSTDA : Major actor in national innovation system The National Center for Genetic Engineering and Biotechnology
(BIOTEC) has led the research in modern biotechnology that helped prevent disastrous losses in shrimp production,
The Cassava and Starch Technology Unit induces research and development for improvement in Thai cassava and starch, e.g. industrial application of cassava and starch in both food and non-food industries—process for the production of ethanol and renewable fuel (BIOTEC, 2006). ,
Set up the Software Park Thailand (SPT) one successful example that received strong support from well-known transnational corporations (such as IBM, HP, SUN, and ORACLE) and established collaboration with Canegie-Mellon university for offering training and certification on the Capability Maturity Model to raise the standard of software production of STP’s tenant companies (Virasa, 2005, p. 104)

National Competitiveness Committee (NCC)
NESDB under NCC has set up action plans for human resource development in major industries
Petrochemical-industry group under the Thai Industry Federation, Petroleum Institute of Thailand, the Office of
Vocational Education Commission and the NESDB have signed MOU for implementation of a pilot project on human resource
development in petrochemical industry
The Constructionism-Chemical Engineering Practice School (C-
ChEPS) was designed for improving skills of workers in
petrochemical industry. Training programmes under C-ChEPS was initiated in 2000 by a
private corporation, the Siam Cement Group under a collaboration with the King Mongkut’s University of Technology
Thonburi.

Some Policy Recommendations:Given the framework of knowledge economy, Thailand’s innovation and education systems have confirmed the weakest arena among others.
Strengthening education system (i.e. education reform) and outputs to increase qualified workforce particularly in S&T skills, including putting in place incentives for firms in the-job training system;
Building new knowledge through basic research, R&D spending, technology transfer including developing strong linkages in universities, research institutes and firms (i.e. university-industry linkages) as foundation for knowledge generation and technology catching-up;
Ensuring sufficient incentives for firms to innovate in new products and processes for industry and services sectors, given new trend in technology and market demand;
Establishing S&T infrastructure (e.g. science parks, research funding, IT infrastructure etc.) and increasing private involvement in developing the knowledge economy.