Embed Size (px)
Citation preview
Testing Theories: Three Reasons Why Data Might not Match the Theory
Psych 437
Theory testing
• Part of what differentiates science from non-science is the process of theory testing.
• When a theory has been articulated carefully, it should be possible to derive quantitative hypotheses from the theory—propositions about what should be observed under specific conditions.
Example
• Example: Imagine that we have a theory concerning the relationship between television habits and obesity. According to our theory, there is a correlation between the amount of television that people watch and their obesity levels. Our theory, however, does not assume that this correlation is due to a causal relationship between the two variables. Rather, our theory assumes that exercise causally influences obesity, and that people tend to get less exercise when they are watching TV.
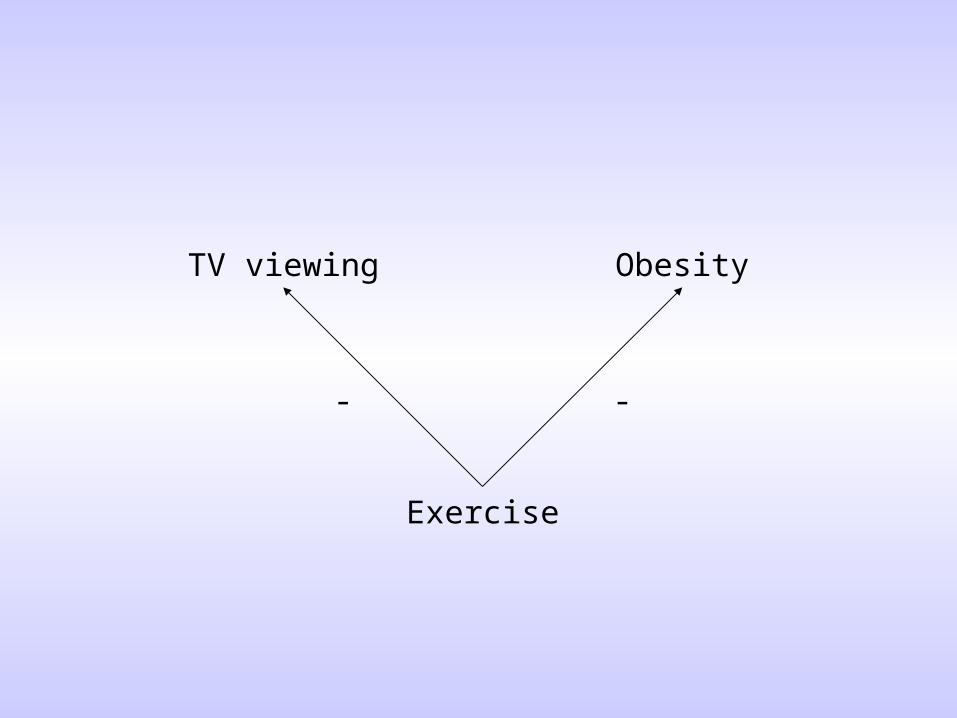
Exercise
ObesityTV viewing
- -

Hypotheses
• Given this simple theory, there are a number of hypotheses that we can derive. Here are four:
– there will be a positive correlation between television viewing and obesity
– there will be a negative correlation between time spent exercising and obesity
– there will be a negative correlation between television viewing and time spent exercising
– if we hold exercise constant (statistical control), we will not observe a correlation between television viewing and obesity
Hypotheses
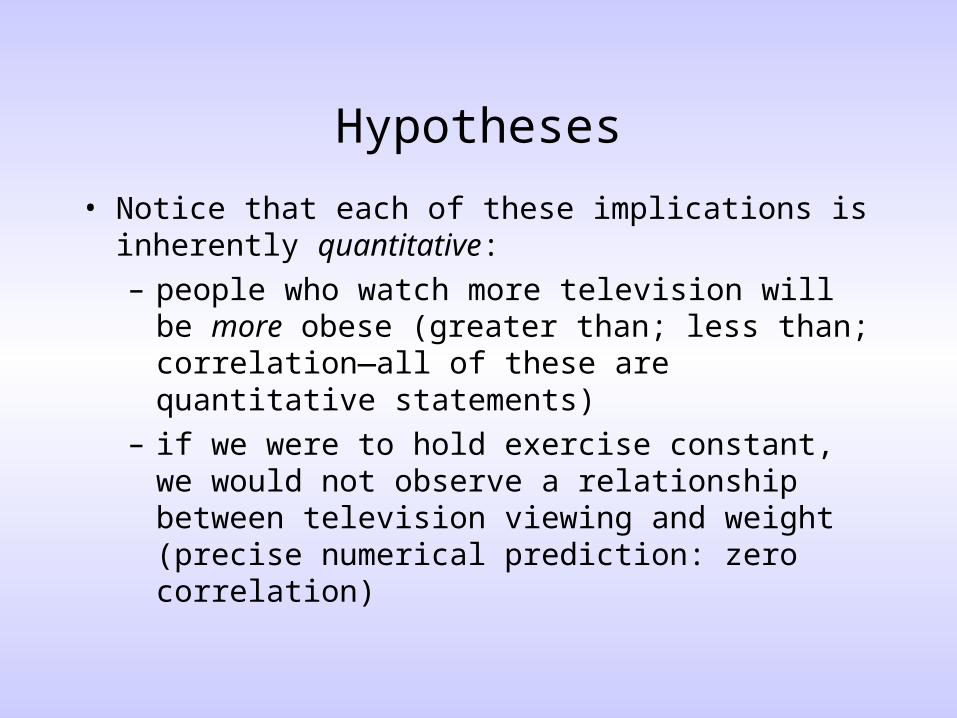
• Notice that each of these implications is inherently quantitative:– people who watch more television will be more
obese (greater than; less than; correlation—all of these are quantitative statements)
– if we were to hold exercise constant, we would not observe a relationship between television viewing and weight (precise numerical prediction: zero correlation)
Directional predictions
• The first kind of hypothesis is what we call a directional hypothesis or a directional prediction.
• A directional prediction concerns the direction of a difference between two groups or the sign (+ vs. -) of a correlation between two variables.
• Example: If we had two groups of people, those who watch TV and those who do not, we would predict that the average weight of the TV group to be higher than that of the no-TV group (MTV > Mno-TV)

Testing directional predictions
• How do we test directional predictions?• Virtually all approaches to testing quantitative
hypotheses are based on the logic that the difference between a prediction and an empirical observation should be small: (T – O)
Testing directional predictions
• We can apply this logic easily in this circumstance. We simply find the average weight for the two groups and compare them. If our hypothesis (that MTV > Mno-
TV) is correct, then MTV - Mno-TV should be > 0.
• Thus, we find support for our hypothesis if this difference is greater than zero (i.e., positive). We disconfirm the hypothesis if the difference is less than or equal to zero.
The weakness of directional tests
• It is important to keep in mind that testing directional hypotheses is a relatively weak way to test a theory.
• Imagine for a moment that our model is wrong and that, in addition, there is no association between TV viewing and obesity.
• The measured correlation between TV viewing and obesity will not literally be 0, for many reasons, some of which we’ll discuss later.
• In this circumstance, we have a 50% chance of getting the prediction correct, even if the theory is misguided.
Point predictions
• Sometimes our hypothesis may be precise enough to make a specific, rather than a directional, quantitative prediction
• For example, in the previous example, our theory allows us to derive a point prediction: the difference between the groups will be zero (exactly zero) when exercise is held constant.
• How do we test point predictions?

Testing point predictions
Person X Y
a 1 1
b 3 3
c 6 2
d 12 4
r = .16
The correlation between these two variables is .16.
Clearly the prediction is incorrect, but not by much.
How do we quantify how much?
(predicted – observed)2
(.00 - .16)2 = .025
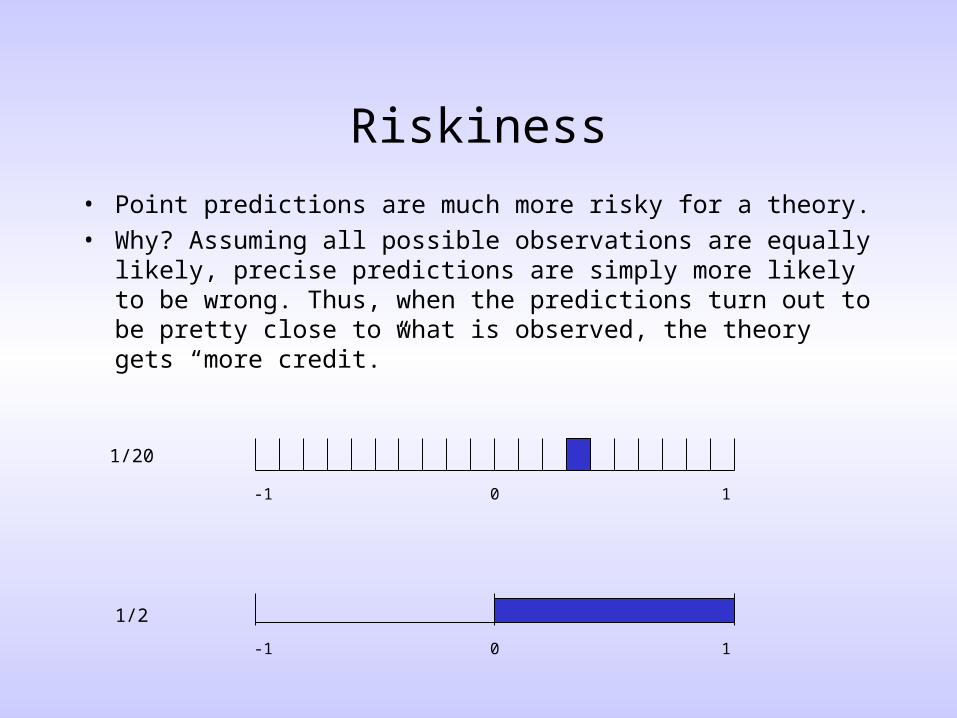
Riskiness
• Point predictions are much more risky for a theory.• Why? Assuming all possible observations are equally likely,
precise predictions are simply more likely to be wrong. Thus, when the predictions turn out to be pretty close to what is observed, the theory gets “more credit.”
-1 10
-1 10
1/20
1/2

Riskiness
• As a result, scholars are typically more tolerant of errors when they involve precise predictions.
• A theory that makes a precise prediction and gets it “not quite right” is generally considered more successful than a theory that makes a weak directional prediction and gets it exactly right.
-1 10
-1 10
1/20
1/2

Evaluating point predictions
• How much of an error is too much of an error when a point prediction is being tested?
• There is no “standard” for making this decision, and, arguably, the amount of error that one is willing to tolerate may vary from one research context to the next.
• It is useful, however, to examine the comparative accuracy of alternative or competing hypotheses—hypotheses derived from different theories.
Competing theories and hypotheses
• In our example, there could be an alternative theory that predicts that there should be a correlation between television viewing and obesity equal to .50.
• If we were to observe a correlation of .16, the original theory clearly is more accurate than the other, despite the fact that it was slightly off.
• (If the alternative theory predicted a correlation of about .32, the evidence would be equivocal. (.16 falls between the two predictions of .00 and .32.))
What do errors mean?
• What does it mean when there is a difference between the value predicted and the value observed?
– There are variables that matter that were not included in the theory
– Imprecision in measurement (noise in the data)
– Sampling error
What do errors mean?• Where does error come from?
– (1) Psychologically interesting variables that matter, but are not included in the theory
• This represents a problem with the theory. It might be incomplete (not too much of a problem), or just dead wrong (big problem).
• Let’s assume that, in reality, some variable of interest (e.g., obesity) is a positive function of x (e.g., television viewing) and the square of x:
y = 2 + 2x + 2x2

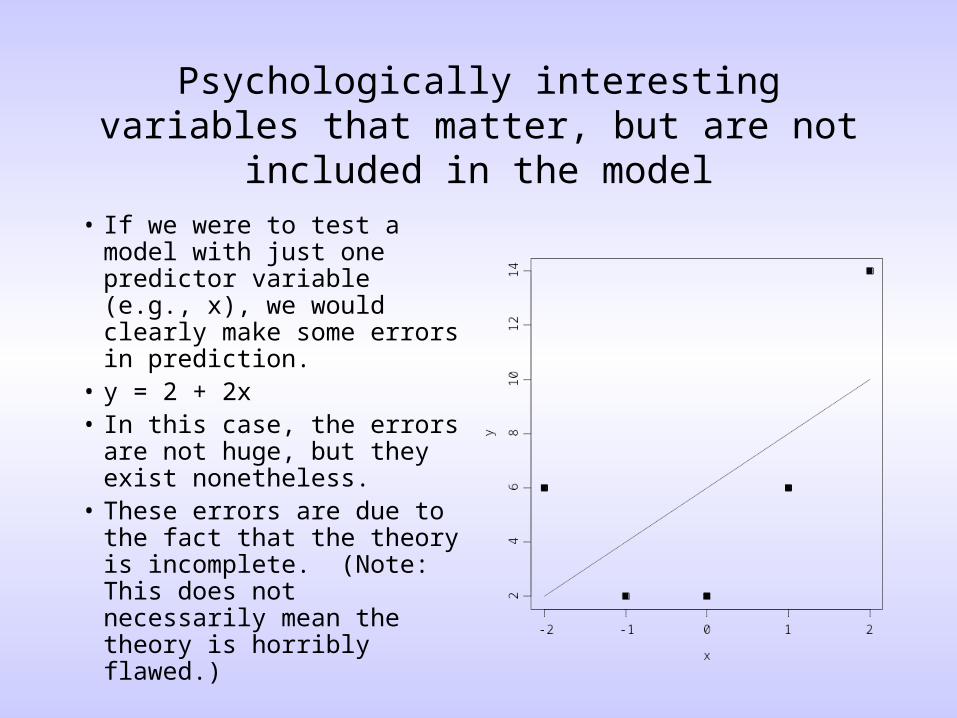
Psychologically interesting variables that matter, but are not included in the model
real model:
y = 2 + 2x + 2x2
Thus, if we had 5 people with scores on x of –2, -1, 0, 1, and 2, their values of y would be 6, 2, 2, 6, and 14, respectively.
Psychologically interesting variables that matter, but are not included in the model
• If we were to test a model with just one predictor variable (e.g., x), we would clearly make some errors in prediction.
• y = 2 + 2x• In this case, the errors are not
huge, but they exist nonetheless.
• These errors are due to the fact that the theory is incomplete. (Note: This does not necessarily mean the theory is horribly flawed.)
What do errors mean?• Where does error come from?
– (2) Imprecision in measurement (noise in the data)• This represents a problem with the data, and the
measurement process that produced it. It is not a problem with the theory per se.

Imprecision in measurement (noise in the data)
• As we discussed previously, a measured score can be broken down into three components:
• O = T + E + S– O = observed score– T = “True” score– E = random error component– S = systematic error component (we’ll ignore this component
for now since we could construe it as a variable that was omitted from the model)
• O = T + E
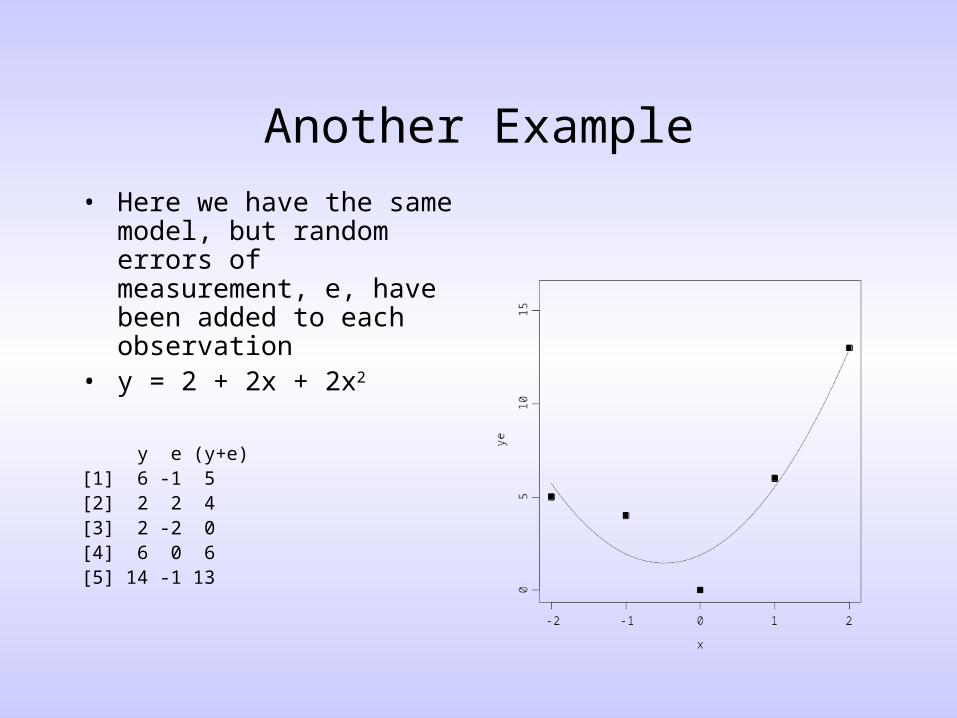
Another Example
• Here we have the same model, but random errors of measurement, e, have been added to each observation
• y = 2 + 2x + 2x2
y e (y+e) [1] 6 -1 5[2] 2 2 4[3] 2 -2 0[4] 6 0 6[5] 14 -1 13
What do errors mean?• Where does error come from?
– (3) Sampling error• This represents a problem with the data too, and the
sampling process that generated it. It is not a problem with the theory per se.
Sampling error
• Error that occurs in data due to inadequacies in sampling from a population– Population: the group of interest (e.g., all people with access
to televisions)– Sample: a subset of the population that is studied (i.e.,
people in this class)• Note: In published research, the problem of sampling error
seems to be the one that concerns psychologists the most, and we’ll discuss some of the methods psychologists use to deal with it in our next lecture.

One of the advantages of comparative theory testing
• It is important to note that these last two sources of error (measurement errors and sampling errors) are specific to a data set. They are properties of the data (i.e., the measures used or the way the sample was obtained), not the theory.
• As such, these two problems are not too fatal if we are testing two competing theories.
• Why? Because the errors will count against both theories, and what is left over is the differences in the predictions of the two theories.