Embed Size (px)
Citation preview
How to cite this paper: Omary J. Ally and Dr. Kembo M. Bwana (2019), Paper Title: Testing Financial Distress of Manufacturing
Firms in Tanzania: An Application of Altman Z-Score Model. Business Education Journal (BEJ), Volume II, Issue II, 13 Pages.
www.cbe.ac.tz/bej
1
Business Education Journal
Volume II Issue II
Email: [email protected]
Published Online January, 2019 in http://www.cbe.ac.tz/bej
TESTING FINANCIAL DISTRESS OF MANUFACTURING FIRMS IN TANZANIA: AN
APPLICATION OF ALTMAN Z-SCORE MODEL
Omary J. Ally; College of Business Education – Dodoma Campus, Accountancy Department, P. o. Box 2077 Dodoma
and
Kembo M. Bwana (PhD), College of Business Education – Dodoma Campus, Accountancy Department, P. o. Box 2077 Dodoma
Corresponding Email: [email protected]
ABSTRACT There are several indicators of poor financial performance and one of them is financial distress. If financial distress
is not predicted on time and quick measures been taken then bankruptcy is likely to occur. The costs associated with
bankruptcy are enormous and normally tend to affect all stakeholders of the firm. The study applies Multi Discriminant Analysis (MDA) which involves consolidation of effects from all ratios which are measuring the key
aspects of financial health. Keeping the above view in mind, the model has been employed to test the financial
distress of six (6) manufacturing firms listed in Dar es Salaam Stock Exchange (DSE) in Tanzania from 2010 -2014.
The study was based on the published secondary data extracted from annual financial report. Findings revealed
that five firms were experiencing financial healthy (average Z-score above 2.99) while the remaining two manifested financial distress (average Z-score is less than 1.88) over the study period. Further findings shows that,
management needs special attention on those variables which are very sensitive with regards to financial health of
the firms under discussion.
Keywords: Financial distress, Altman’s Z-score, manufacturing firms, Tanzania.
1. INTRODUCTION Financial distress implies the situation where the firm is facing financial difficulties to an extent of failing to carry
out smoothly day to day operating activities. The word financial distress can also refer to the inability of the firm to
meet short term financial obligations as they come due (Altman, 1993). According to Platt and Platt (2006) a
company is said to be in financial distress when it cannot honor its financial obligations when they come due whether
it is financially, operationally or legally. They provide multiple approaches of determining whether an entity is
financially distressed by checking whether it has reported negative earnings before special items such as interest,
depreciation, amortization and tax. This implies that entities which were financially distressed often reported a loss
from their key operational activities.
Most of the studies conducted during these recent years show the annual flow of business failure of companies is
increasing especially during the periods of financial crisis (Sami, 2013). Specific case can be seen on Enron Corp,
WorldCom, Xerox, Lehman Brothers, AIG, and Freddie. In Ghana, recent cases of business failures include the
Gateway Broadcasting Services, Ghana Co-operative Bank, Bank for Housing and Construction, National Savings
and Credit Bank (Appiah, 2011). In Kenya, recent cases of corporate failure include Uchumi Supermarket as shown
in the study by Kipruto (2011) and Shisia et al., (2014).
Manufacturing sector in Tanzania is relatively small and over the long period it has failed to develop. According to
Dinh and Monga (2013) manufacturing sector in Tanzania today contributes less to GDP than it did in 1970`s.
Analysis on different sectors in Tanzania indicates that, from 2001 to 2011, the service sector contributed 57%,
whereas industry contributed 27%.The contribution of agriculture to GDP was 16%(Africa Develop Bank group,
2014). Literature show that less attention have been given to research on the financial distress of manufacturing
firms in Tanzania with regard to Altman’s Z score model. Therefore this study endeavors to bridge the gap by
applying Altman (1968) Z score model on Dar es salaam Stock Exchange (DSE) listed manufacturing firms in
Tanzania.
1.1. Research Problem
The study conducted by Koes Pranowo et al. (2010) revealed that financial distress actually has a negative effect on
profitability, efficiency and liquidity of manufacturing firms. If financial distress is not predicted on time and quick
How to cite this paper: Omary J. Ally and Dr. Kembo M. Bwana (2019), Paper Title: Testing Financial Distress of Manufacturing
Firms in Tanzania: An Application of Altman Z-Score Model. Business Education Journal (BEJ), Volume II, Issue II, 13 Pages.
www.cbe.ac.tz/bej
2
measures not taken then bankruptcy is likely to occur. The costs associated with bankruptcy are enormous and
normally tend to affect all stakeholders of the firm (Altman 1984; Andrade & Kaplan, 1998; Altman & Hotchkiss,
2006; Natalia, 2007; Opler & Titman, 1994). Early prediction allows the firm to make appropriate measures to
reduce the risk (Natalia, 2007). Given the fact that manufacturing sector in Tanzania is still at infancy stage this study
finds it necessary to focus on prediction of financial distress of the manufacturing firms in Tanzania
1.2. Research Objective
General objective of this study is to test financial distress of listed manufacturing companies on DSE. Specifically,
the study aims at :
i. Determining how inadequate working capital, inability to generate profit, amount of earnings reinvested,
change in total liability in relation market value of the firm and inefficient use of the assets may lead to
financial distress of firms under the review
ii. Identifying the best performing as well as worst performing listed manufacturing firms.
iii. Identifying factors that contributing to the performance of the worst performing firms
1.3. Significance of the study
The study is significant since it involves prediction of the financial distress of the listed manufacturing firms. Testing
of financial distress enables the management to act proactively before the situation go beyond control. When the firm
undergoes financial distress, there are some costs associated with financial distress such as restructuring fees,
auditor`s remuneration, consultancy fee paid to lawyers and management compensation. Finding of the study will
enable shareholders to know about the status of companies listed on the DSE. Testing financial distress brings
benefits to company such as reduction in losses by providing a pre-warning to stakeholders of firms (Shah, 2014). As
contended by Ray (2011), financial distress prediction assist manager to keep track of a firm’s performance over a
number of years and act proactively in identifying important trends. Therefore, testing financial distress in
manufacturing firms in Tanzania will allow managers to have a close follow up on the performance and to take
actions before things get worse. This is very important since manufacturing firms are publicly owned; this study will
serve the entire public interest.
Researchers and scholars may use this study as a base for further research in the domestic market. The study will
contribute to the existing body of knowledge on financial distress prediction in Tanzania. It will also stimulate
prospective researchers to replicate the study in other sectors of the economy for those firms listed on DSE.
2. LITERATURE REVIEW The testing of financial distress has attracted the attention of academic researcher, auditors, investors and business
management. Numbers of prediction models have evolved over a long period. Since late 1960’s a lot of studies have
been conducted on business failure prediction models to help reduce enormous loss resulting from business
bankruptcy (Altman, 1984; Dimitras, et al, 1996, Altman and Narayanan 1997). Altman Z-score model is a
Multivariate Discriminate Analysis (MDA) technique that can handle prediction of firms’ financial distress. Studies
show that descriptive analysis has been used in reporting the findings of Altman Z score model. For example, study
conducted by Mohamed (2013) using descriptive analysis was used to present the result from Altman Z score model
which was conducted on listed Kenyan firms. In another similar study by Kariuki (2013), Mamo (2011), Shisia et al.
(2014) and Mohamed (2012) Altman Z score model was used in testing financial distress of listed companies in
Kenya. With the list of mentioned studies in Kenya, it shows that studies on the financial distress of the listed firms
had been widely conducted in Kenya compared to the Tanzania counterpart. Evidence from the literature show that
the prediction of financial distress of the listed firms in Tanzania had been overlooked; something which brings the
gap which the quest for the study is built upon. To make sure that findings revealed from the Altman Z score model
are genuine and important, researchers have tested the power of the model. For example, Kipruto (2013) tested the
validity of Altman’s Z score model for predicting financial distress in Uchumi supermarkets and the findings
concluded that the model was an accurate predictor of firms’ financial distress. Findings show that, 21 firms recorded
declining of Z score values which implies that they were facing financial distress and hence the reason for firms to
be delisted from the NSE in 2006.
Therefore, MDA is one of the most popular quantitative techniques in identifying business failure as it sets standard
for comparison of bankruptcy prediction models (Altman et al., 2000). Literature reveal that MDA models rank
number 1 out of 16 model types and is expected to provide a reliable bankruptcy prediction method. According to
How to cite this paper: Omary J. Ally and Dr. Kembo M. Bwana (2019), Paper Title: Testing Financial Distress of Manufacturing
Firms in Tanzania: An Application of Altman Z-Score Model. Business Education Journal (BEJ), Volume II, Issue II, 13 Pages.
www.cbe.ac.tz/bej
3
Aziz et al, (2006) the MDA model has an average accuracy of more than 85% in bankruptcy prediction (Aziz et al.,
2006). Building on recommendation from Gerantonis and Christopoulos (2009), managers, researchers, lenders,
credit bureaus, regulatory organs are also urged to use model and particularly in managing risks associated with
lending as well as regulating the listed companies, particularly those experiencing unsound financial status.
According to Altman et al., (2014) the financial ratios engaged in model building were extracted from the balance
sheet and income statement data. In previous studies, a very large number of variables were found to be significant
indicators of financial difficulties. Therefore, Altman compiled a list of 22 potentially important financial ratios for
evaluation. He classified these variables into five standard ratio categories: liquidity, profitability, leverage, solvency,
and activity ratios. The ratios were chosen on the basis of their 1) popularity in the literature and 2) potential
relevancy to the study. The list included only a few “new” ratios. In addition, Altman did not consider cash flow
ratios because of the lack of consistent and precise depreciation data. From the original list of 22 financial ratios,
Altman selected five ratios for the profile as doing the “best” overall job in the prediction of corporate bankruptcy.
This profile did not contain all of the most significant variables measured independently. Instead, the contribution of
the entire profile was evaluated. To arrive at a final profile of variables, Altman utilized the following procedures: 1)
observation of the statistical significance of various alternative functions including determination of the relative
contributions of each independent variable, 2) evaluation of inter-correlations between the relevant variables, 3)
observation of the predictive accuracy of the various profiles, and 4) judgment of the analyst.
3. METHODOLOGY This part comprises the techniques applied in this study. Specifically, the techniques include research design, data
collection techniques and data analysis techniques.
3.1 Research Design
The study employed a data set extracted from six manufacturing firms in Tanzania, covering the period from 2010 to
2014. Descriptive research analysis was used to present the result from the Multivariate Discriminate Analysis
(MDA) technique. Descriptive analysis mainly involved specific prediction and narration of facts, it also included the
use of tables, figures and charts in presenting the facts. In previous similar study the descriptive research design was
used by Shisia et al. (2014) in analyzing the financial distress in Uchumi supermarkets limited in Kenya.
This study employed the Altman (1968) Z-score model in testing financial distress of listed manufacturing firms in
Tanzania. Altman suggested MDA as the appropriate statistical technique for testing distressed and non-distressed
firms. The Multivariate Discriminate Analysis (MDA) technique is used to determine significant level on a set of
variables provided for a single group, it classifies an observation into one of several priori groupings dependent upon
individual characteristics of observations. For the adaption of the MDA model, it is crucial how the sample of the
firm for the two groups of interest, distressed and non-distressed, and the variables of the model were originally
selected. In this study variables were selected based on the requirements of the Atman Z-score model. The financial
distress model score sorts firms into distressed and non-distressed categories based on their characteristics.
3.2 Population, Variables Selection and Model Specification
The population of this study consists of six manufacturing firms listed on DSE. The study adopted a census for the
companies listed on DSE as at 31st December 2014. Relevant variables included can be categorized into dependent
and independent variables. Dependent variable is Z which is the discriminate variable that was used to measure
financial distress. Its result determines whether the firm is financially distressed or healthy. It is a dichotomous
variable that is used in classification of mutually exclusive events. Along each independent variables X1, X2, X3, X4
and X5 there is corresponding coefficient value which remains unchanged, and this is according to requirement of the
Altman Z score model. The Z-Score can be characterized as a linear combination of 4-5 common business ratios.
These ratios are weighted by coefficients which are estimated by spotting a set of firms which had declared a
bankruptcy. Thereafter, a matched sample of firms is collected for the surviving firms, with matching by industry and
estimated assets. This formula for Altman Z-Score is helpful in calculating and predicting the probability that a
company will go into bankruptcy within two years.
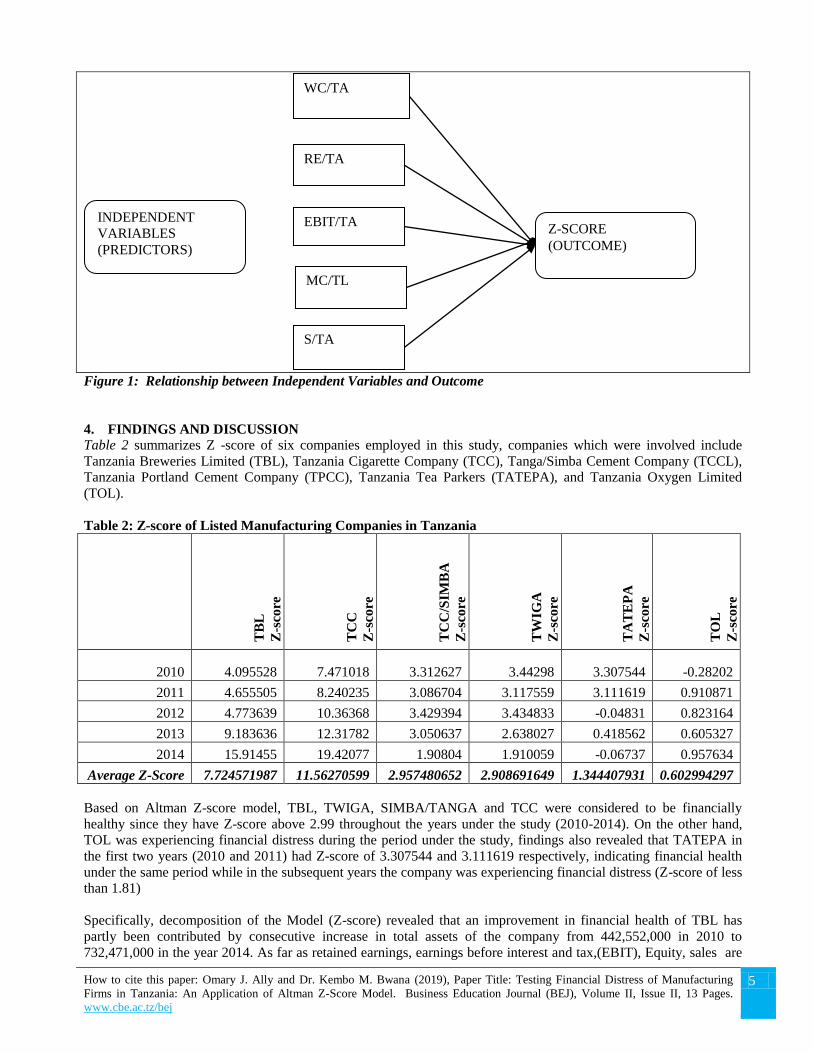
Z=1.2X1+1.4X2+3.3X3+0.6X4+1.0X5 Where:
X1 - is the ratio of working capital to total assets (WC/TA)
How to cite this paper: Omary J. Ally and Dr. Kembo M. Bwana (2019), Paper Title: Testing Financial Distress of Manufacturing
Firms in Tanzania: An Application of Altman Z-Score Model. Business Education Journal (BEJ), Volume II, Issue II, 13 Pages.
www.cbe.ac.tz/bej
4
It measure net liquidity assets of the company in relation to the total assets of the firm. Generally, working capital
plays very important role since it is used in financing day to day activities of the firm. It is normally determined by
the level of current assets and current liabilities. Current assets comprise cash in hand, accounts receivable and
inventory while Current liabilities involves firm’s financial obligations, short term debt and accounts
payable which will be met during the operating cycle. A positive or increase in working capital is an indication of an
increase in the firm’s ability to settle the bills. A negative or decrease working capital implies difficulties in meeting
short term financial obligations. The working capital to total assets ratio is a measure of liquidity assets of the firm in
relation to total capitalization.
X2 - is the ratio of retained earnings to total assets (RE/TA) Retained earnings are profit not distributed to shareholders as dividend, instead plough back in the firm as the
internal source of financing. The ratio gauges the degree of financing of total assets via surplus profits. It also
measures the degree of leverage of a company. In other words the ratio gauge cumulative profitability of a firm
and indicates the firm’s earning power as well as age. The higher the ratio, the healthier the company is
financially.
X3 - is the ratio of earnings before interest and tax to total assets (EBIT/TA)
Earnings before interest and taxes (EBIT) implies to the earnings resulting from the core function of the firm or
operating activities of the firm. The ratio measures the efficiency of assets in generating profits. Low ratio
indicates that the firm is not using the assets efficiently in generating profits. This ratio estimates the cash
supply available for allocation to the creditors/lenders, government and shareholders
X4 - is the ratio of market value of owners’ equity to book value of total liabilities (MC/TL).
Equity is gauged by the total value of preference shares and ordinary shares. The ratio MC/TL measures the extent to
which the assets must decline in value before the firm is rendered insolvent. This ratio incorporates the market
dimension to the model of financial distress prediction.
X5 - is the ratio of sales to total assets (S/TA)
The ratio shows the ability of the firm in utilizing assets in generation of revenues, the lower the ratio of X5, the
greater the chance of the company not being able to fight competition. Generally, a company is considered to be
healthy if the Z score exceeds 2.99. If the score is lower than 1.81, then the company is considered to be in financial
distress. If a company’s Z value lies in between, then the company is referred to be on grey zone and it needs to be
monitored closely (Makini, 2015). Discrimination zones are summarized below:
Z > 2.99, “Safe” zone,
1.81<Z< 2.99 “Grey” zone,
Z < 1.81 “Distress” zone
The models have gained wide acceptance for the past two decades by auditors, management consultants, courts of
law and even used in database systems used for loan evaluations (Eidleman, 1995; Mohamedi, 2012). Some of the
advantages that many practitioners argue for the use of Z-scores approach include: It is more precise and leads to
clearer conclusions than contradictory ratios as well as they measure the extent of uncertainty. It is uniform and
leaves less room for inaccuracies of judgment. It is more reliable and can be evaluated statistically. It is faster and
less costly to work with than traditional tools. Figure 1 below depicts the relationship between the independent
variables (predictors) and the Z-score (outcome)
How to cite this paper: Omary J. Ally and Dr. Kembo M. Bwana (2019), Paper Title: Testing Financial Distress of Manufacturing
Firms in Tanzania: An Application of Altman Z-Score Model. Business Education Journal (BEJ), Volume II, Issue II, 13 Pages.
www.cbe.ac.tz/bej
5
Figure 1: Relationship between Independent Variables and Outcome
4. FINDINGS AND DISCUSSION
Table 2 summarizes Z -score of six companies employed in this study, companies which were involved include
Tanzania Breweries Limited (TBL), Tanzania Cigarette Company (TCC), Tanga/Simba Cement Company (TCCL),
Tanzania Portland Cement Company (TPCC), Tanzania Tea Parkers (TATEPA), and Tanzania Oxygen Limited
(TOL).
Table 2: Z-score of Listed Manufacturing Companies in Tanzania
TB
L
Z-s
core
TC
C
Z-s
core
TC
C/S
IMB
A
Z-s
core
TW
IGA
Z-s
core
TA
TE
PA
Z-s
core
TO
L
Z-s
core
2010 4.095528 7.471018 3.312627 3.44298 3.307544 -0.28202
2011 4.655505 8.240235 3.086704 3.117559 3.111619 0.910871
2012 4.773639 10.36368 3.429394 3.434833 -0.04831 0.823164
2013 9.183636 12.31782 3.050637 2.638027 0.418562 0.605327
2014 15.91455 19.42077 1.90804 1.910059 -0.06737 0.957634
Average Z-Score 7.724571987 11.56270599 2.957480652 2.908691649 1.344407931 0.602994297
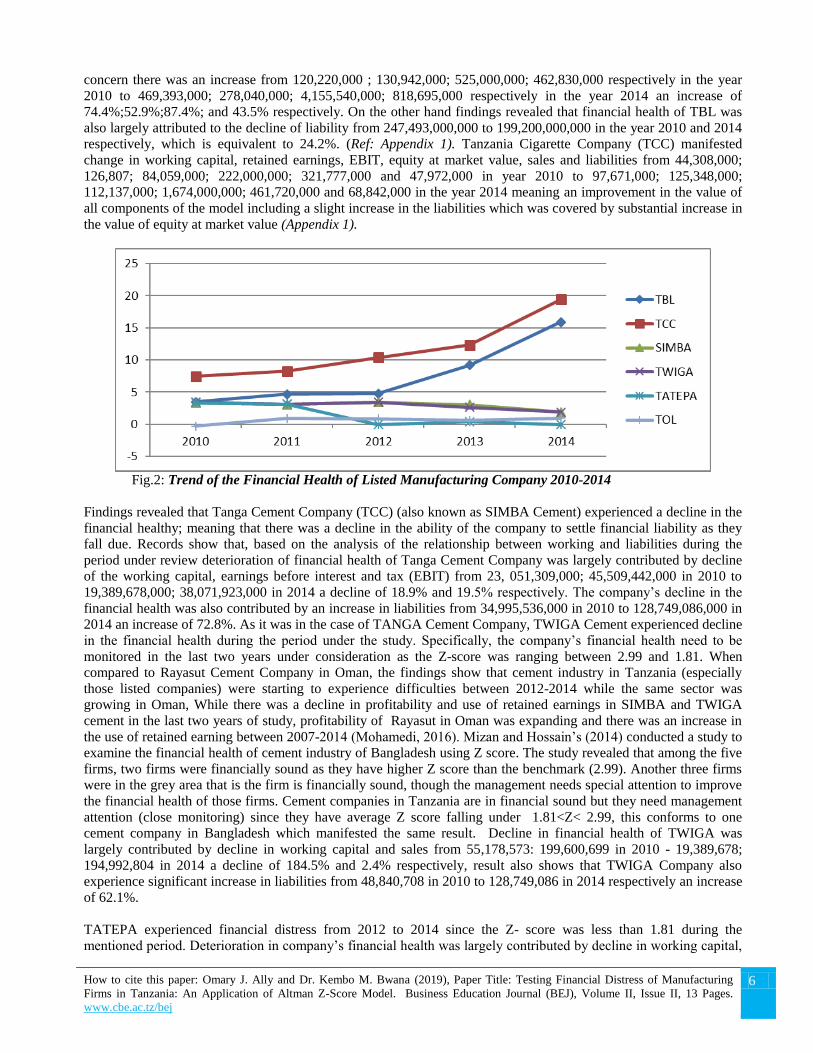
Based on Altman Z-score model, TBL, TWIGA, SIMBA/TANGA and TCC were considered to be financially
healthy since they have Z-score above 2.99 throughout the years under the study (2010-2014). On the other hand,
TOL was experiencing financial distress during the period under the study, findings also revealed that TATEPA in
the first two years (2010 and 2011) had Z-score of 3.307544 and 3.111619 respectively, indicating financial health
under the same period while in the subsequent years the company was experiencing financial distress (Z-score of less
than 1.81)
Specifically, decomposition of the Model (Z-score) revealed that an improvement in financial health of TBL has
partly been contributed by consecutive increase in total assets of the company from 442,552,000 in 2010 to
732,471,000 in the year 2014. As far as retained earnings, earnings before interest and tax,(EBIT), Equity, sales are
RE/TA
MC/TL
WC/TA
EBIT/TA INDEPENDENT
VARIABLES
(PREDICTORS)
S/TA
Z-SCORE
(OUTCOME)
How to cite this paper: Omary J. Ally and Dr. Kembo M. Bwana (2019), Paper Title: Testing Financial Distress of Manufacturing
Firms in Tanzania: An Application of Altman Z-Score Model. Business Education Journal (BEJ), Volume II, Issue II, 13 Pages.
www.cbe.ac.tz/bej
6
concern there was an increase from 120,220,000 ; 130,942,000; 525,000,000; 462,830,000 respectively in the year
2010 to 469,393,000; 278,040,000; 4,155,540,000; 818,695,000 respectively in the year 2014 an increase of
74.4%;52.9%;87.4%; and 43.5% respectively. On the other hand findings revealed that financial health of TBL was
also largely attributed to the decline of liability from 247,493,000,000 to 199,200,000,000 in the year 2010 and 2014
respectively, which is equivalent to 24.2%. (Ref: Appendix 1). Tanzania Cigarette Company (TCC) manifested
change in working capital, retained earnings, EBIT, equity at market value, sales and liabilities from 44,308,000;
126,807; 84,059,000; 222,000,000; 321,777,000 and 47,972,000 in year 2010 to 97,671,000; 125,348,000;
112,137,000; 1,674,000,000; 461,720,000 and 68,842,000 in the year 2014 meaning an improvement in the value of
all components of the model including a slight increase in the liabilities which was covered by substantial increase in
the value of equity at market value (Appendix 1).
Fig.2: Trend of the Financial Health of Listed Manufacturing Company 2010-2014
Findings revealed that Tanga Cement Company (TCC) (also known as SIMBA Cement) experienced a decline in the
financial healthy; meaning that there was a decline in the ability of the company to settle financial liability as they
fall due. Records show that, based on the analysis of the relationship between working and liabilities during the
period under review deterioration of financial health of Tanga Cement Company was largely contributed by decline
of the working capital, earnings before interest and tax (EBIT) from 23, 051,309,000; 45,509,442,000 in 2010 to
19,389,678,000; 38,071,923,000 in 2014 a decline of 18.9% and 19.5% respectively. The company’s decline in the
financial health was also contributed by an increase in liabilities from 34,995,536,000 in 2010 to 128,749,086,000 in
2014 an increase of 72.8%. As it was in the case of TANGA Cement Company, TWIGA Cement experienced decline
in the financial health during the period under the study. Specifically, the company’s financial health need to be
monitored in the last two years under consideration as the Z-score was ranging between 2.99 and 1.81. When
compared to Rayasut Cement Company in Oman, the findings show that cement industry in Tanzania (especially
those listed companies) were starting to experience difficulties between 2012-2014 while the same sector was
growing in Oman, While there was a decline in profitability and use of retained earnings in SIMBA and TWIGA
cement in the last two years of study, profitability of Rayasut in Oman was expanding and there was an increase in
the use of retained earning between 2007-2014 (Mohamedi, 2016). Mizan and Hossain’s (2014) conducted a study to
examine the financial health of cement industry of Bangladesh using Z score. The study revealed that among the five
firms, two firms were financially sound as they have higher Z score than the benchmark (2.99). Another three firms
were in the grey area that is the firm is financially sound, though the management needs special attention to improve
the financial health of those firms. Cement companies in Tanzania are in financial sound but they need management
attention (close monitoring) since they have average Z score falling under 1.81<Z< 2.99, this conforms to one
cement company in Bangladesh which manifested the same result. Decline in financial health of TWIGA was
largely contributed by decline in working capital and sales from 55,178,573: 199,600,699 in 2010 - 19,389,678;
194,992,804 in 2014 a decline of 184.5% and 2.4% respectively, result also shows that TWIGA Company also
experience significant increase in liabilities from 48,840,708 in 2010 to 128,749,086 in 2014 respectively an increase
of 62.1%.
TATEPA experienced financial distress from 2012 to 2014 since the Z- score was less than 1.81 during the
mentioned period. Deterioration in company’s financial health was largely contributed by decline in working capital,
How to cite this paper: Omary J. Ally and Dr. Kembo M. Bwana (2019), Paper Title: Testing Financial Distress of Manufacturing
Firms in Tanzania: An Application of Altman Z-Score Model. Business Education Journal (BEJ), Volume II, Issue II, 13 Pages.
www.cbe.ac.tz/bej
7
EBIT and sales from 622,794; 8,600 and 9,353,000 in 2010 to 52,330; -209,446; 142,658 in 2014. Result also shows
that TATEPA Company also experience significant increase in liabilities from 172,483 in 2010 to 558,930 in 2014 an
increase of 69.1%. TCC and TBL manifested improvement in financial health throughout the years under
consideration since their Z- score was above 2.99. Improvement in company’s financial health was largely
contributed by growth in sales, working capita EBIT and other indicators/measures of financial health. Lastly, the
findings record that Tanzania Oxygen Ltd (TOL) was experiencing deterioration in financial health/ financial distress
over the study period, the deriving cause of the financial distress was primarily caused by inadequate working capital
and serious increase in the company’s liabilities. Though there was a slight increase in sales and EBIT but this could
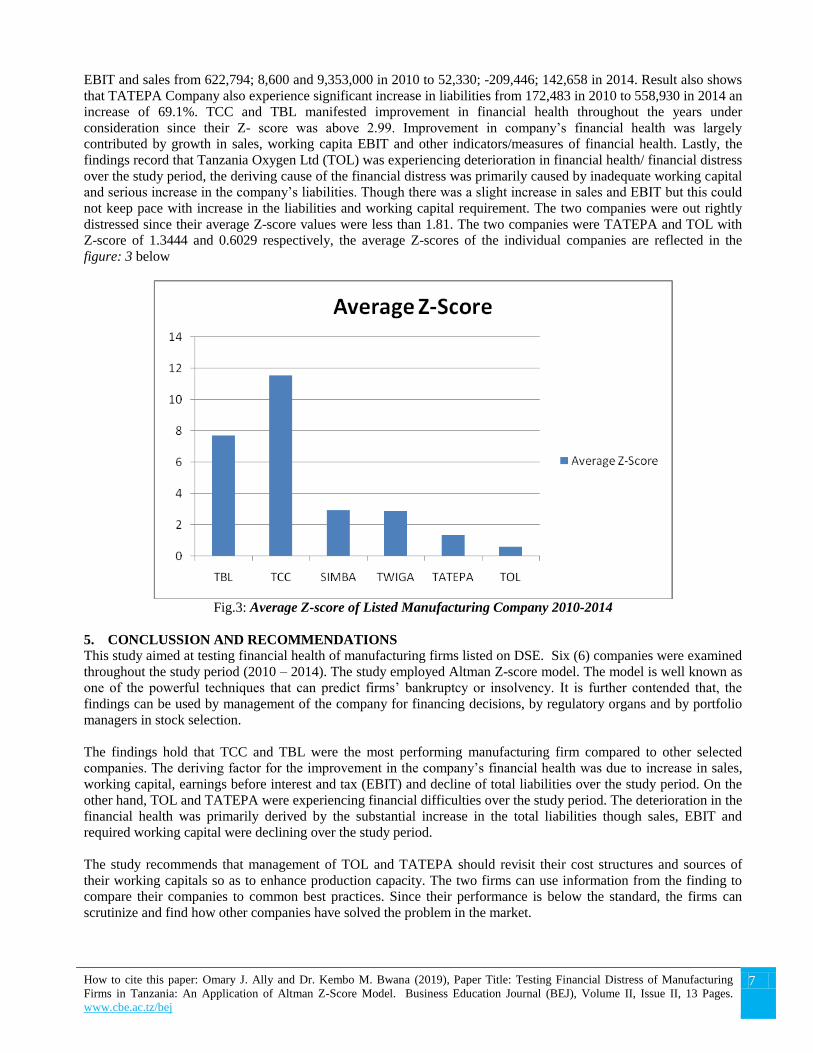
not keep pace with increase in the liabilities and working capital requirement. The two companies were out rightly
distressed since their average Z-score values were less than 1.81. The two companies were TATEPA and TOL with
Z-score of 1.3444 and 0.6029 respectively, the average Z-scores of the individual companies are reflected in the
figure: 3 below
Fig.3: Average Z-score of Listed Manufacturing Company 2010-2014
5. CONCLUSSION AND RECOMMENDATIONS
This study aimed at testing financial health of manufacturing firms listed on DSE. Six (6) companies were examined
throughout the study period (2010 – 2014). The study employed Altman Z-score model. The model is well known as
one of the powerful techniques that can predict firms’ bankruptcy or insolvency. It is further contended that, the
findings can be used by management of the company for financing decisions, by regulatory organs and by portfolio
managers in stock selection.
The findings hold that TCC and TBL were the most performing manufacturing firm compared to other selected
companies. The deriving factor for the improvement in the company’s financial health was due to increase in sales,
working capital, earnings before interest and tax (EBIT) and decline of total liabilities over the study period. On the
other hand, TOL and TATEPA were experiencing financial difficulties over the study period. The deterioration in the
financial health was primarily derived by the substantial increase in the total liabilities though sales, EBIT and
required working capital were declining over the study period.
The study recommends that management of TOL and TATEPA should revisit their cost structures and sources of
their working capitals so as to enhance production capacity. The two firms can use information from the finding to
compare their companies to common best practices. Since their performance is below the standard, the firms can
scrutinize and find how other companies have solved the problem in the market.
How to cite this paper: Omary J. Ally and Dr. Kembo M. Bwana (2019), Paper Title: Testing Financial Distress of Manufacturing
Firms in Tanzania: An Application of Altman Z-Score Model. Business Education Journal (BEJ), Volume II, Issue II, 13 Pages.
www.cbe.ac.tz/bej
8
The study suggests that natural extension of this work should focus on the use of alternative model of bankruptcy
predictions so as to confirm the validity of the findings of this study. The future study should also include other
companies apart from manufacturing companies only.
REFERENCES
Africa Development Group(2014) Eastern Africa Manufacturing Sector: Promoting Technology , innovation, productivity and Linkages, Tanzania Country Report
Makini, P. A. (2015). Validity of Altman’s Z-score Model in Predicting Financial Distress of Listed Companies at
the Nairobi Securities Exchange. Unpublished MBA project, University of Nairobi. Altman, E. I. (1968). Financial ratio analysis, Discriminant analysis and the prediction of corporate bankruptcy.
Journal of Finance, 23(4), 589-609. Altman, E. (1993). Corporate financial distress: A complete guide to predicting, avoiding and dealing with
bankruptcy, (2nd Ed.). New York: John Wiley & Sons.
Shisia, A.,Sand , W., &Okibo W. B. (2014). An in depth analysis of the Altman’s failure prediction model on
corporate financial distress in Uchumi supermarket in Kenya. European Journal of Business
Management, 6(23). 27-41
Mohamed, S. (2013). Bankruptcy prediction of firms listed at the Nairobi Securities Exchange. Unpublished MSc
Research Project, University of Nairobi
Mamo, A. Q. (2011). Applicability of Altman (1968) model in predicting financial distress of commercial banks in
Kenya. Unpublished MBA Research Project, University of Nairobi
Kariuki, H. N. (2013). The effect of financial distress on financial performance of commercial banks in Kenya.
Unpublished MBA Research Project, University of Nairobi Robinson, R.A. and M. G. Maguire (2001) “Top common causes of construction contractor failures”, Journal of
Construction Accounting and Taxation, Jan/Feb 2003. Eidleman, E.B. (2007) “A discriminant analysis of predictors of business failure,” Journal of Accounting Research,
Spring, Institute of Professional Accounting, Chicago, I ll., 167- 179.
Mohammed, S (2016), Bankruptcy Prediction by Using the Altman Z-score Model in Oman: A Case Study of
Raysut Cement Company SAOG and its subsidiaries, Australasian Accounting, Business and Finance
Journal, 10(4), 70-80. doi:10.14453/aabfj.v10i4.6
Gerantonis, N., Vergos, K. and Christopoulos, A.G. (2009). “Can Altman Z-score Models Predict Business
Failures in Greece?”, Research Journal of International Studies, 12: 21- 28
Mizan AN and Hossain MM. 2014. Financial Soundness of Cement Industry of Bangladesh: An Empirical
Investigation Using Z-score, American Journal of Trade and Policy, 1, 16-22
Appiah, K. O. (2011). Corporate Failure Prediction: Some Empirical Evidence from listed firms in Ghana. China-
USA Business Review, 10(1), 32–41.
Altman, E. (1993). Corporate financial distress: A complete guide to predicting, avoiding and dealing with
bankruptcy, (2nd Ed.). New York: John Wiley & Sons.
Altman, E. I. (1984). Empirical investigation of the bankruptcy cost question. The Journal of Finance, 39(4), 1067-
1089.
Altman, E, I. & Hotchkiss E. (2006). Corporate financial distress and bankruptcy: Predict and avoid bankruptcy,
Analyze and invest in distressed debt. John Wiley & sons Inc., Hoboken, New Jersey. Third Edition.
Dinh, Hinh T. and Célestin Monga (2013). Light Manufacturing in Tanzania. A Reform Agenda for Job Creation and
Prosperity. Washington DC: The World Bank. Andrade, G. & Kaplan, S. (1998). How costly is financial (Not economic) distress? Evidence from highly leveraged
transactions that became distressed. The Journal of Finance, 53, (5), 1443-1493. Kipruto, E. K. (2013). The validity of Altman’s failure prediction model in predicting Corporate financial distress in
Uchumi Supermarket in Kenya, Unpublished MBA Project, University of Nairobi
Opler, T.C., & Titman, S. (1994). Financial distress and corporate performance. The Journal of finance, 49(3), 1015-
1040.
Natalia, O. (2007). Corporate financial distress: An empirical analysis of distress risk. Doctoral Dissertation No.
3430, University of St. Gallen, Switzerland
Platt, H. D., & Platt, M. B. (2006).Understanding differences between financial distress and bankruptcy. Review of
Applied Economics, 2(2), 141-157
How to cite this paper: Omary J. Ally and Dr. Kembo M. Bwana (2019), Paper Title: Testing Financial Distress of Manufacturing
Firms in Tanzania: An Application of Altman Z-Score Model. Business Education Journal (BEJ), Volume II, Issue II, 13 Pages.
www.cbe.ac.tz/bej
9
Pranowo, K. Azam, N. Achsani, Manurung, AH., Nuryartono, N. (2010). ‘Determinant of Corporate Financial
Distress in an Emerging Market Economy.’ Empirical Evidence from the Indonesian Stock Exchange 2004-
2008
Shisia, A.,Sand , W., &Okibo W. B. (2014). An in depth analysis of the Altman’s failure Prediction model on
corporate financial distress in Uchumi supermarket in Kenya, European Journal of Business Management,
6(23), 27-41
Sami, B. J. (2013). Financial Distress and Bankruptcy costs. In H. Dincer & U. Hacioglu. Global Strategies for Banking and Finance (369–379). United States: IGI Global.
Ray, S. (2011). Assessing Corporate Financial Distress in Automobile Industry of India: An Application of Altman’s
Model. Research Journal of Finance and Accounting, 2(3), 155–169.
Shah, N. (2014). Developing Financial Distress Prediction Models Using Cutting Edge Recursive Partitioning
Techniques: A Study of Australian Mining Performance. Review of Integrative Business and Economics Research, 3(2), 103–143.
How to cite this paper: Omary J. Ally and Dr. Kembo M. Bwana (2019), Paper Title: Testing Financial Distress of Manufacturing
Firms in Tanzania: An Application of Altman Z-Score Model. Business Education Journal (BEJ), Volume II, Issue II, 13 Pages.
www.cbe.ac.tz/bej
10
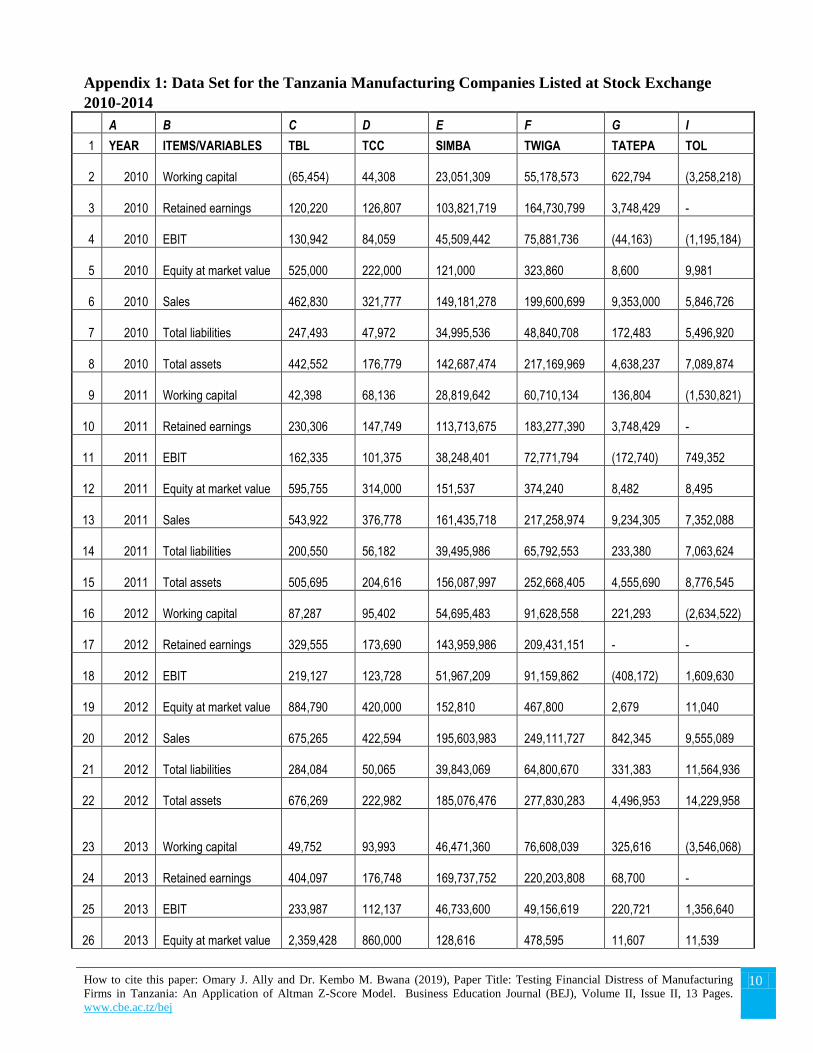
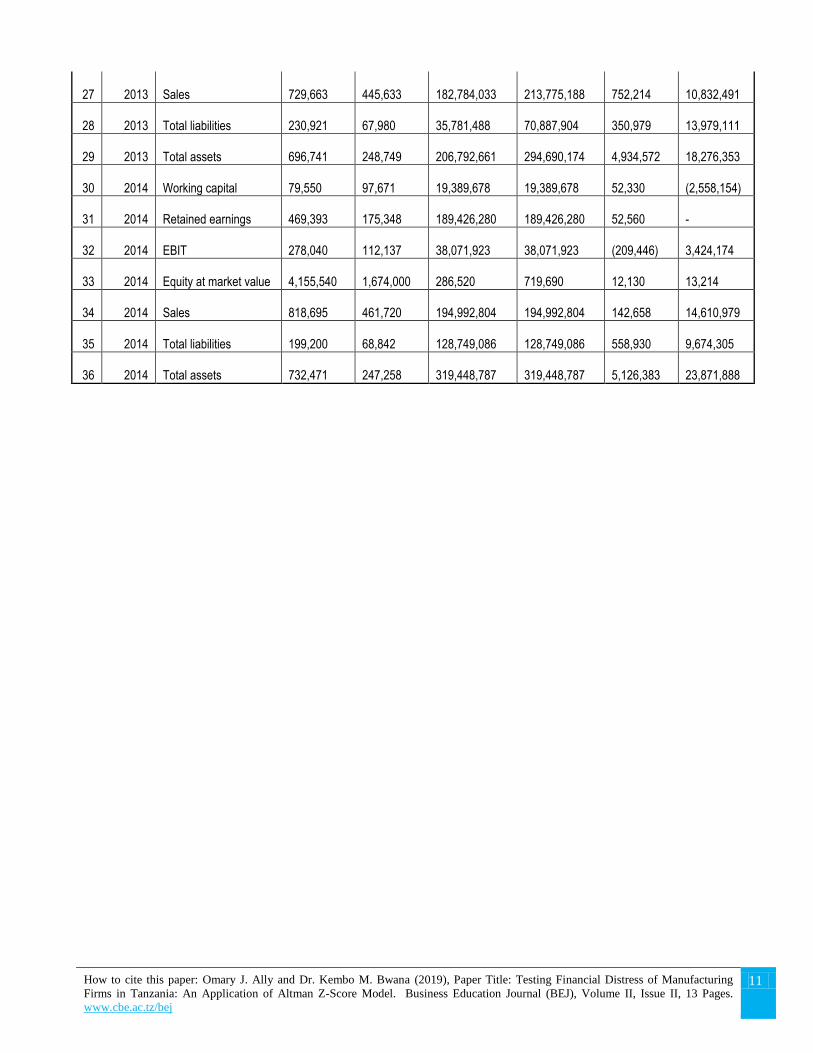
Appendix 1: Data Set for the Tanzania Manufacturing Companies Listed at Stock Exchange
2010-2014
A B C D E F G I
1 YEAR ITEMS/VARIABLES TBL TCC SIMBA TWIGA TATEPA TOL
2 2010 Working capital (65,454)
44,308
23,051,309
55,178,573
622,794
(3,258,218)
3 2010 Retained earnings 120,220
126,807
103,821,719
164,730,799
3,748,429
-
4 2010 EBIT 130,942
84,059
45,509,442
75,881,736
(44,163)
(1,195,184)
5 2010 Equity at market value 525,000
222,000
121,000
323,860
8,600
9,981
6 2010 Sales 462,830
321,777
149,181,278
199,600,699
9,353,000
5,846,726
7 2010 Total liabilities 247,493
47,972
34,995,536
48,840,708
172,483
5,496,920
8 2010 Total assets 442,552
176,779
142,687,474
217,169,969
4,638,237
7,089,874
9 2011 Working capital 42,398
68,136
28,819,642
60,710,134
136,804
(1,530,821)
10 2011 Retained earnings 230,306
147,749
113,713,675
183,277,390
3,748,429
-
11 2011 EBIT 162,335
101,375
38,248,401
72,771,794
(172,740)
749,352
12 2011 Equity at market value 595,755
314,000
151,537
374,240
8,482
8,495
13 2011 Sales 543,922
376,778
161,435,718
217,258,974
9,234,305
7,352,088
14 2011 Total liabilities 200,550
56,182
39,495,986
65,792,553
233,380
7,063,624
15 2011 Total assets 505,695
204,616
156,087,997
252,668,405
4,555,690
8,776,545
16 2012 Working capital 87,287
95,402
54,695,483
91,628,558
221,293
(2,634,522)
17 2012 Retained earnings 329,555
173,690
143,959,986
209,431,151
-
-
18 2012 EBIT 219,127
123,728
51,967,209
91,159,862
(408,172)
1,609,630
19 2012 Equity at market value 884,790
420,000
152,810
467,800
2,679
11,040
20 2012 Sales 675,265
422,594
195,603,983
249,111,727
842,345
9,555,089
21 2012 Total liabilities 284,084
50,065
39,843,069
64,800,670
331,383
11,564,936
22 2012 Total assets 676,269
222,982
185,076,476
277,830,283
4,496,953
14,229,958
23 2013 Working capital 49,752
93,993
46,471,360
76,608,039
325,616
(3,546,068)
24 2013 Retained earnings 404,097
176,748
169,737,752
220,203,808
68,700
-
25 2013 EBIT 233,987
112,137
46,733,600
49,156,619
220,721
1,356,640
26 2013 Equity at market value 2,359,428
860,000
128,616
478,595
11,607
11,539
How to cite this paper: Omary J. Ally and Dr. Kembo M. Bwana (2019), Paper Title: Testing Financial Distress of Manufacturing
Firms in Tanzania: An Application of Altman Z-Score Model. Business Education Journal (BEJ), Volume II, Issue II, 13 Pages.
www.cbe.ac.tz/bej
11
27 2013 Sales 729,663
445,633
182,784,033
213,775,188
752,214
10,832,491
28 2013 Total liabilities 230,921
67,980
35,781,488
70,887,904
350,979
13,979,111
29 2013 Total assets 696,741
248,749
206,792,661
294,690,174
4,934,572
18,276,353
30 2014 Working capital 79,550
97,671
19,389,678
19,389,678
52,330
(2,558,154)
31 2014 Retained earnings 469,393
175,348
189,426,280
189,426,280
52,560
-
32 2014 EBIT 278,040
112,137
38,071,923
38,071,923
(209,446)
3,424,174
33 2014 Equity at market value 4,155,540
1,674,000
286,520
719,690
12,130
13,214
34 2014 Sales 818,695
461,720
194,992,804
194,992,804
142,658
14,610,979
35 2014 Total liabilities 199,200
68,842
128,749,086
128,749,086
558,930
9,674,305
36 2014 Total assets 732,471
247,258
319,448,787
319,448,787
5,126,383
23,871,888
How to cite this paper: Omary J. Ally and Dr. Kembo M. Bwana (2019), Paper Title: Testing Financial Distress of Manufacturing
Firms in Tanzania: An Application of Altman Z-Score Model. Business Education Journal (BEJ), Volume II, Issue II, 13 Pages.
www.cbe.ac.tz/bej
12
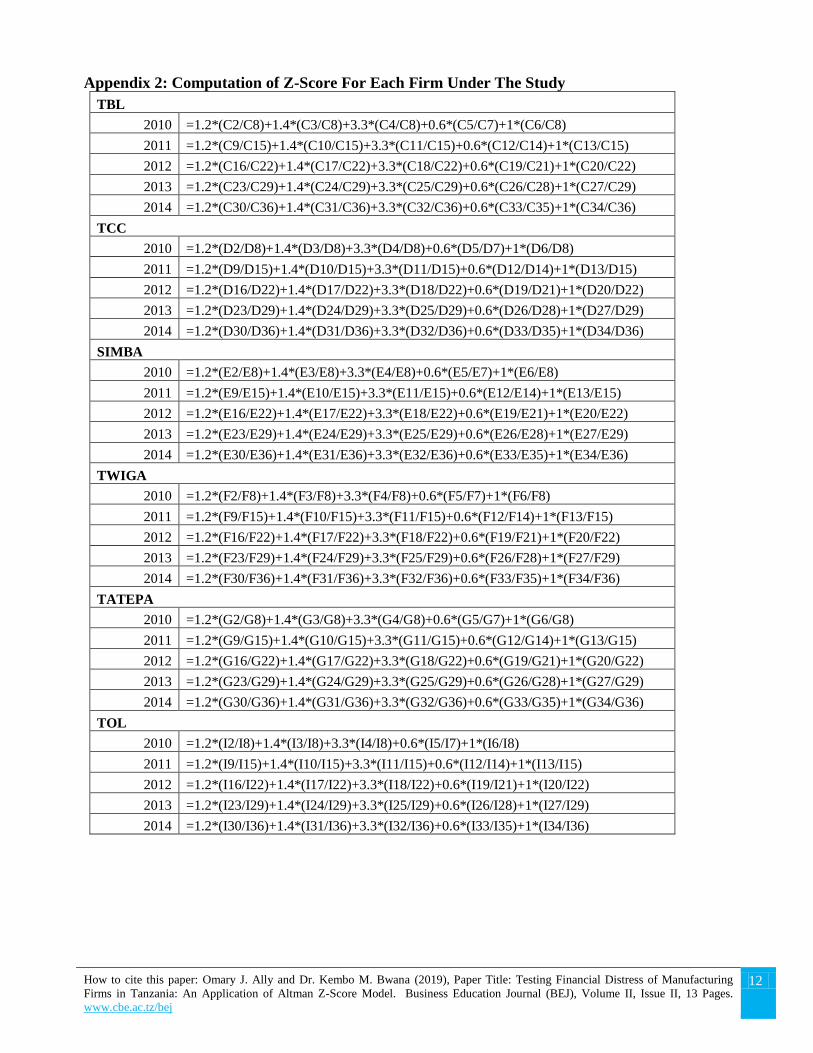
Appendix 2: Computation of Z-Score For Each Firm Under The Study
TBL
2010 =1.2*(C2/C8)+1.4*(C3/C8)+3.3*(C4/C8)+0.6*(C5/C7)+1*(C6/C8)
2011 =1.2*(C9/C15)+1.4*(C10/C15)+3.3*(C11/C15)+0.6*(C12/C14)+1*(C13/C15)
2012 =1.2*(C16/C22)+1.4*(C17/C22)+3.3*(C18/C22)+0.6*(C19/C21)+1*(C20/C22)
2013 =1.2*(C23/C29)+1.4*(C24/C29)+3.3*(C25/C29)+0.6*(C26/C28)+1*(C27/C29)
2014 =1.2*(C30/C36)+1.4*(C31/C36)+3.3*(C32/C36)+0.6*(C33/C35)+1*(C34/C36)
TCC
2010 =1.2*(D2/D8)+1.4*(D3/D8)+3.3*(D4/D8)+0.6*(D5/D7)+1*(D6/D8)
2011 =1.2*(D9/D15)+1.4*(D10/D15)+3.3*(D11/D15)+0.6*(D12/D14)+1*(D13/D15)
2012 =1.2*(D16/D22)+1.4*(D17/D22)+3.3*(D18/D22)+0.6*(D19/D21)+1*(D20/D22)
2013 =1.2*(D23/D29)+1.4*(D24/D29)+3.3*(D25/D29)+0.6*(D26/D28)+1*(D27/D29)
2014 =1.2*(D30/D36)+1.4*(D31/D36)+3.3*(D32/D36)+0.6*(D33/D35)+1*(D34/D36)
SIMBA
2010 =1.2*(E2/E8)+1.4*(E3/E8)+3.3*(E4/E8)+0.6*(E5/E7)+1*(E6/E8)
2011 =1.2*(E9/E15)+1.4*(E10/E15)+3.3*(E11/E15)+0.6*(E12/E14)+1*(E13/E15)
2012 =1.2*(E16/E22)+1.4*(E17/E22)+3.3*(E18/E22)+0.6*(E19/E21)+1*(E20/E22)
2013 =1.2*(E23/E29)+1.4*(E24/E29)+3.3*(E25/E29)+0.6*(E26/E28)+1*(E27/E29)
2014 =1.2*(E30/E36)+1.4*(E31/E36)+3.3*(E32/E36)+0.6*(E33/E35)+1*(E34/E36)
TWIGA
2010 =1.2*(F2/F8)+1.4*(F3/F8)+3.3*(F4/F8)+0.6*(F5/F7)+1*(F6/F8)
2011 =1.2*(F9/F15)+1.4*(F10/F15)+3.3*(F11/F15)+0.6*(F12/F14)+1*(F13/F15)
2012 =1.2*(F16/F22)+1.4*(F17/F22)+3.3*(F18/F22)+0.6*(F19/F21)+1*(F20/F22)
2013 =1.2*(F23/F29)+1.4*(F24/F29)+3.3*(F25/F29)+0.6*(F26/F28)+1*(F27/F29)
2014 =1.2*(F30/F36)+1.4*(F31/F36)+3.3*(F32/F36)+0.6*(F33/F35)+1*(F34/F36)
TATEPA
2010 =1.2*(G2/G8)+1.4*(G3/G8)+3.3*(G4/G8)+0.6*(G5/G7)+1*(G6/G8)
2011 =1.2*(G9/G15)+1.4*(G10/G15)+3.3*(G11/G15)+0.6*(G12/G14)+1*(G13/G15)
2012 =1.2*(G16/G22)+1.4*(G17/G22)+3.3*(G18/G22)+0.6*(G19/G21)+1*(G20/G22)
2013 =1.2*(G23/G29)+1.4*(G24/G29)+3.3*(G25/G29)+0.6*(G26/G28)+1*(G27/G29)
2014 =1.2*(G30/G36)+1.4*(G31/G36)+3.3*(G32/G36)+0.6*(G33/G35)+1*(G34/G36)
TOL
2010 =1.2*(I2/I8)+1.4*(I3/I8)+3.3*(I4/I8)+0.6*(I5/I7)+1*(I6/I8)
2011 =1.2*(I9/I15)+1.4*(I10/I15)+3.3*(I11/I15)+0.6*(I12/I14)+1*(I13/I15)
2012 =1.2*(I16/I22)+1.4*(I17/I22)+3.3*(I18/I22)+0.6*(I19/I21)+1*(I20/I22)
2013 =1.2*(I23/I29)+1.4*(I24/I29)+3.3*(I25/I29)+0.6*(I26/I28)+1*(I27/I29)
2014 =1.2*(I30/I36)+1.4*(I31/I36)+3.3*(I32/I36)+0.6*(I33/I35)+1*(I34/I36)
How to cite this paper: Omary J. Ally and Dr. Kembo M. Bwana (2019), Paper Title: Testing Financial Distress of Manufacturing
Firms in Tanzania: An Application of Altman Z-Score Model. Business Education Journal (BEJ), Volume II, Issue II, 13 Pages.
www.cbe.ac.tz/bej
13
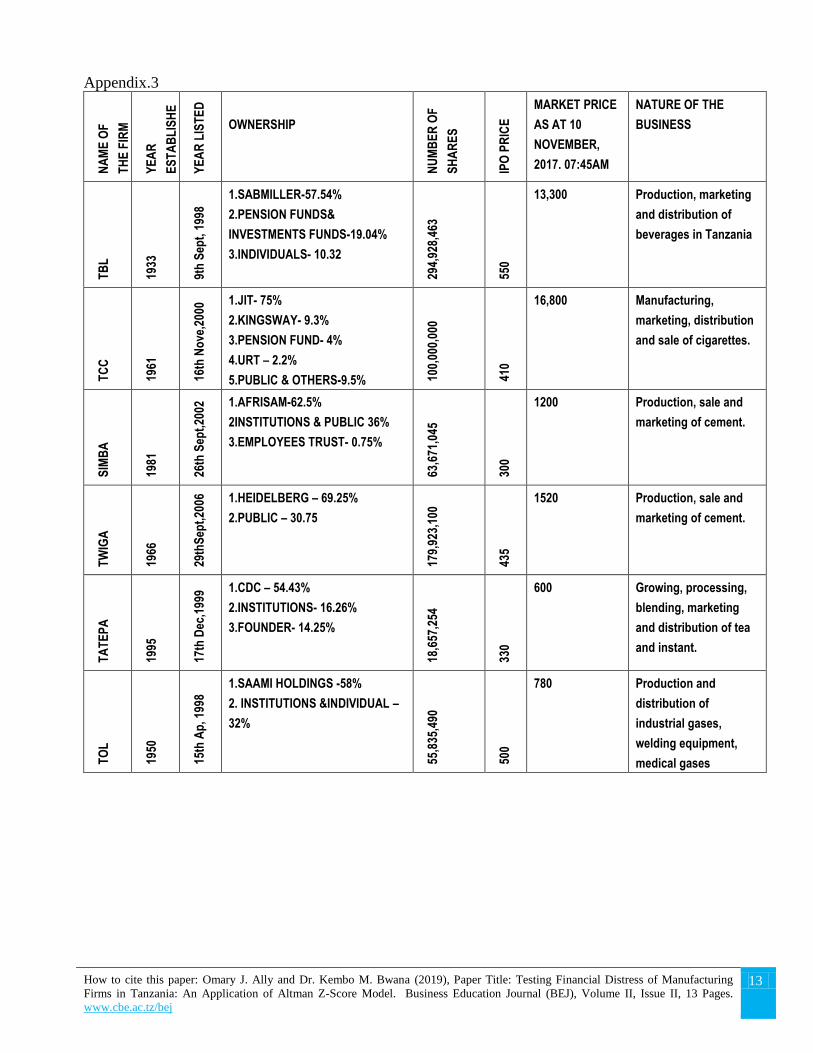
Appendix.3
NA
ME
OF
TH
E F
IRM
YE
AR
ES
TA
BL
ISH
E
D
YE
AR
LIS
TE
D
OWNERSHIP
NU
MB
ER
OF
SH
AR
ES
IPO
PR
ICE
MARKET PRICE
AS AT 10
NOVEMBER,
2017. 07:45AM
NATURE OF THE
BUSINESS
TB
L
1933
9th
Sep
t, 1
998
1.SABMILLER-57.54%
2.PENSION FUNDS&
INVESTMENTS FUNDS-19.04%
3.INDIVIDUALS- 10.32
294,
928,
463
550
13,300 Production, marketing
and distribution of
beverages in Tanzania
TC
C
1961
16th
No
ve,2
000 1.JIT- 75%
2.KINGSWAY- 9.3%
3.PENSION FUND- 4%
4.URT – 2.2%
5.PUBLIC & OTHERS-9.5% 100,
000,
000
410
16,800 Manufacturing,
marketing, distribution
and sale of cigarettes.
SIM
BA
1981
26th
Sep
t,20
02 1.AFRISAM-62.5%
2INSTITUTIONS & PUBLIC 36%
3.EMPLOYEES TRUST- 0.75% 63
,671
,045
300
1200 Production, sale and
marketing of cement.
TW
IGA
1966
29th
Sep
t,20
06
1.HEIDELBERG – 69.25%
2.PUBLIC – 30.75
179,
923,
100
435
1520 Production, sale and
marketing of cement.
TA
TE
PA
1995
17th
Dec
,199
9 1.CDC – 54.43%
2.INSTITUTIONS- 16.26%
3.FOUNDER- 14.25%
18,6
57,2
54
330
600 Growing, processing,
blending, marketing
and distribution of tea
and instant.
TO
L
1950
15th
Ap
, 199
8
1.SAAMI HOLDINGS -58%
2. INSTITUTIONS &INDIVIDUAL –
32%
55,8
35,4
90
500
780 Production and
distribution of
industrial gases,
welding equipment,
medical gases