Embed Size (px)
Citation preview

Manufacturing firms 2017Industry benchmark data supplement to How America Saves

IntroductionTo help defined contribution (DC) plan sponsors understand how their industry’s plans compare with Vanguard-recordkept DC plans, we are pleased to offer this industry benchmark report. It is based on 2016 Vanguard recordkeeping data and compiled from our comprehensive data systems—systems that are the backbone of the research and analysis that have made Vanguard a valued resource within the retirement plan industry. We believe this information can help you make more effective plan decisions and will serve as a valuable reference tool as you continue to develop your retirement programs.
The report’s data is for manufacturing firms with qualified Vanguard-recordkept DC plans. These are firms listed under the North American Industry Classification System (NAICS) sectors 31–33. This classification includes companies engaged in the mechanical, physical, or chemical transformation of materials, substances, or components into new products.
Throughout this document, we divide the data for manufacturing firms into two groups based on the number of participants in the plans. This breakout should make the data more relevant for plan sponsors. Data is labeled as “Manufacturing <1,000 participants” for plans with fewer than 1,000 participants and “Manufacturing 1,000+ participants” for plans with 1,000 or more participants.
Contents
Benchmark population.......................................................................................................................................................................... Figure 1
Accumulating plan assets
Participation rates.....................................................................................................................................................................................Figure 2
Deferral rates............................................................................................................................................................................................Figure 3
Aggregate participant and employer contribution rates..........................................................................................................................Figure 4
Automatic enrollment design...................................................................................................................................................................Figure 5
Catch-up contributions............................................................................................................................................................................. Figure 6
Roth contributions....................................................................................................................................................................................Figure 7
After-tax contributions..............................................................................................................................................................................Figure 8
Account balances.....................................................................................................................................................................................Figure 9
Managing participant accounts
Asset and contribution allocations...........................................................................................................................................................Figure 10
Number of investment options offered...................................................................................................................................................Figure 11
Number of investment options used.......................................................................................................................................................Figure 12
Types of investment options offered and used...................................................................................................................................... Figure 13
Participants with professionally managed allocations.............................................................................................................................Figure 14
Participants with professionally managed allocations, new plan entrants during the year....................................................................Figure 15
Plan use of target-date funds...................................................................................................................................................................Figure 16
Participant use of target-date funds.........................................................................................................................................................Figure 17
Distribution of equity exposure................................................................................................................................................................Figure 18
Advice offered..........................................................................................................................................................................................Figure 19
Accessing plan assets
Participant loans....................................................................................................................................................................................... Figure 20
Participant in-service withdrawals............................................................................................................................................................Figure 21

Figure 1. Benchmark population, 2016
Vanguard defined contribution plans
Manufacturing
<1,000 participants
Manufacturing
1,000+ participants
Vanguard
DC plans
Number of plans 329 179 1.9 thousand
Number of participants 108,963 837,087 4.4 million
Average number of participants 331 4,676 2,250
Median number of participants 277 2,442 397
Amount of plan assets $10 billion $89 billion $420 billion
Average plan assets $31 million $495 million $216 million
Median plan assets $20 million $234 million $41 million
Source: Vanguard, 2017.
Manufacturing firms > 1
Figure 1. The benchmark population includes all participants in full-service qualified Vanguard DC plans sponsored by firms engaged in the mechanical, physical, or chemical transformation of materials, substances, or components into new products. Most figures in this booklet compare data for this population with that of all qualified Vanguard DC plans. Figures 2, 3, and 4 are estimated for 20161.
Accumulating plan assets
Figure 2. The participation rate is the broadest metric for gauging 401(k) performance. Plan-weighted participation is calculated by taking the average of participation rates among all plans. Participant-weighted participation considers all employees in all plans as if they were in a single plan.
1 Please see Methodology section on page 13.
Figure 2. Participation rates, 2016 estimated
Plan-weighted
Participation rates, 2016 estimatedFigure 2.
Source: Vanguard, 2017.
Participant-weighted
Vanguard de�ned contribution plans
VanguardDC plans
Manufacturing<1,000 participants
Manufacturing1,000+ participants
90%
0%
79%85%
79%86%
81%79%
Source: Vanguard, 2017
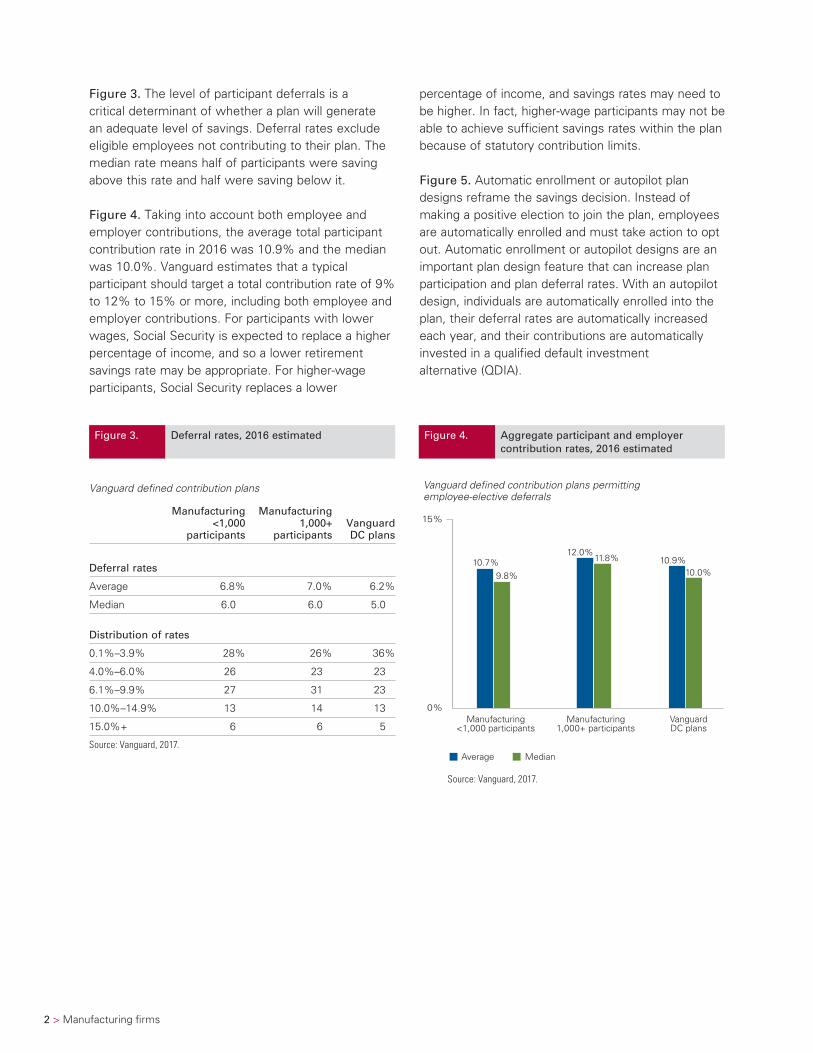
Figure 3. The level of participant deferrals is a critical determinant of whether a plan will generate an adequate level of savings. Deferral rates exclude eligible employees not contributing to their plan. The median rate means half of participants were saving above this rate and half were saving below it.
Figure 4. Taking into account both employee and employer contributions, the average total participant contribution rate in 2016 was 10.9% and the median was 10.0%. Vanguard estimates that a typical participant should target a total contribution rate of 9% to 12% to 15% or more, including both employee and employer contributions. For participants with lower wages, Social Security is expected to replace a higher percentage of income, and so a lower retirement savings rate may be appropriate. For higher-wage participants, Social Security replaces a lower
percentage of income, and savings rates may need to be higher. In fact, higher-wage participants may not be able to achieve sufficient savings rates within the plan because of statutory contribution limits.
Figure 5. Automatic enrollment or autopilot plan designs reframe the savings decision. Instead of making a positive election to join the plan, employees are automatically enrolled and must take action to opt out. Automatic enrollment or autopilot designs are an important plan design feature that can increase plan participation and plan deferral rates. With an autopilot design, individuals are automatically enrolled into the plan, their deferral rates are automatically increased each year, and their contributions are automatically invested in a qualified default investment alternative (QDIA).
2 > Manufacturing firms
Figure 3. Deferral rates, 2016 estimated
Vanguard defined contribution plans
Manufacturing <1,000
participants
Manufacturing 1,000+
participantsVanguard DC plans
Deferral rates
Average 6.8% 7.0% 6.2%
Median 6.0 6.0 5.0
Distribution of rates
0.1%–3.9% 28% 26% 36%
4.0%–6.0% 26 23 23
6.1%–9.9% 27 31 23
10.0%–14.9% 13 14 13
15.0%+ 6 6 5
Source: Vanguard, 2017.
Figure 4. Aggregate participant and employer contribution rates, 2016 estimated
Source: Vanguard, 2017.
Average Median
Aggregate participant and employer contribution rates, 2016 estimated
Figure 4.
Vanguard de�ned contribution plans permitting employee-elective deferrals
Manufacturing<1,000 participants
Manufacturing1,000+ participants
VanguardDC plans
15%
0%
10.7%12.0%
10.9%
9.8%
11.8%
10.0%
Source: Vanguard, 2017.

Manufacturing firms > 3
Figure 6. Nearly all Vanguard plans offer catch-up contributions.
Figure 7. The Roth feature is offered by 65% of Vanguard plans.
Figure 8. After-tax employee-elective deferrals are available to participants in about one-fifth of Vanguard plans. The after-tax feature is more likely to be offered by large plans.
Figure 5. Automatic enrollement design, 2016
Vanguard defined contribution plans with automatic enrollment
Manufacturing <1,000
participants
Manufacturing 1,000+
participantsVanguard DC plans
Automatic enrollment adoption
Percentage of plans 45% 81% 45%
Default automatic enrollment rate
1 percent 1% 1% 1%
2 percent 6 7 7
3 percent 47 44 44
4 percent 14 13 15
5 percent 17 13 13
6 percent or more 15 22 20
Default automatic increase rate
1 percent 70% 79% 65%
2 percent 2 1 2
Voluntary election 19 15 24
Not offered 9 5 9
Default fund
Target-date fund 98% 99% 97%
Other balanced fund 1 1 2
Subtotal 99% 100% 99%
Money market or stable value fund 1% 0% 1%
Source: Vanguard, 2017.
Figure 6. Catch-up contributions, 2016
Vanguard defined contribution plans permitting catch-up contributions
Manufacturing <1,000
participants
Manufacturing 1,000+
participantsVanguard DC plans
Percentage of plans offering 96% 100% 98%
Percentage of participants offered 98 100 99
Percentage of participants using 10 11 12
Source: Vanguard, 2017.
Figure 7. Roth contributions, 2016
Vanguard defined contribution plans permitting Roth contributions
Manufacturing <1,000
participants
Manufacturing 1,000+
participantsVanguard DC plans
Percentage of plans offering 47% 77% 65%
Percentage of participants offered 58 84 68
Percentage of participants using 8 8 13
Source: Vanguard, 2017.
Figure 8. After-tax contributions, 2016
Vanguard defined contribution plans permitting after-tax contributions
Manufacturing <1,000
participants
Manufacturing 1,000+
participantsVanguard DC plans
Percentage of plans offering 20% 44% 18%
Percentage of participants offered 24 45 33
Percentage of participants using 7 4 8
Source: Vanguard, 2017.

4 > Manufacturing firms
Figure 9. Account balances are a widely cited measure of the overall effectiveness of DC plans. However, current balances may not reflect lifetime savings and are only a partial measure of retirement preparedness for many participants. The median balance represents the typical participant: Half of all participants have balances above the median and half have balances below.
Managing participant accounts
Figure 10. Participant investment decisions are a critical determinant of long-term growth of retirement savings. With the growing use of automatic enrollment in DC plans, an increasing number of participants are not making active investment choices but are defaulted into a sponsor-designated investment portfolio. Plan asset allocation shows the asset allocations as of December 31, 2016. Participant contribution allocation shows where 2016 contributions were allocated. The percentage of equities includes company stock, diversified equity funds, and the equity portion of balanced funds.
Figure 9. Account balances, 2016
Source: Vanguard, 2017.
Average Median
Account balances, 2016Figure 9.
Vanguard de�ned contribution plans
Manufacturing<1,000 participants
Manufacturing1,000+ participants
VanguardDC plans
$120,000
$0
$92,654
$105,766 $96,495
$27,648 $33,772
$24,713
Source: Vanguard, 2017
Figure 10. Asset and contribution allocations, 2016
Source: Vanguard, 2017.portion of balanceortion of balanced funds.
VanguardDC plans
VanguardDC plans
Vanguard de�ned contribution plans
74%equities
Asset and contribution allocations, 2016
Plan asset allocation Participant contribution allocation
Figure 10.
67%equities*
70%equities
71%equities
71%equities
74%equities
0%
100%
Company stock Diversified equity funds Other balanced funds Bond funds CashBrokerage Target-date funds
Manufacturing<1,000
participants
Manufacturing1,000+
participants
Manufacturing<1,000
participants
Manufacturing1,000+
participants
41%
30%
8%
7%
13%
39%
32%
5%
6%
41%
28%
6%
7%
11%
32%
47%
6%
5%
9%
28%
52%
6%
5%6%
30%
49%
5%
6%
7%12%
7%
5%
Source: Vanguard, 2017
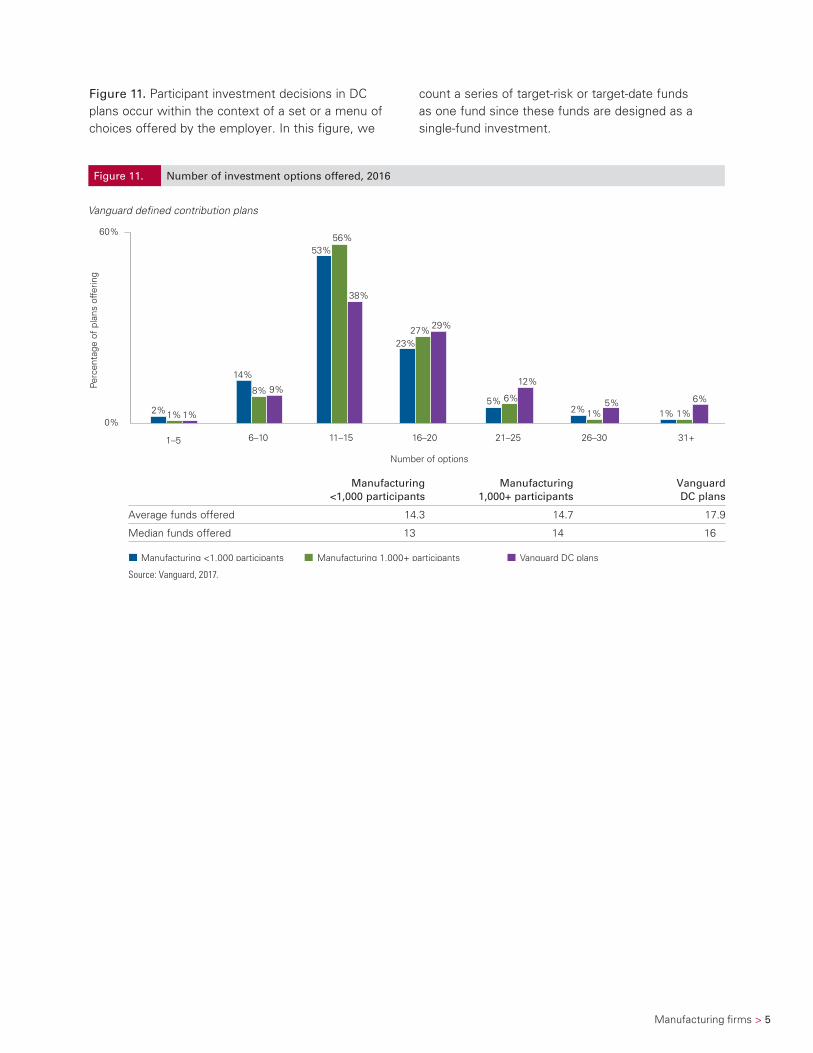
Figure 11. Number of investment options offered, 2016Number of investment options offered, 2016Figure 11.
Perc
enta
ge o
f pl
ans
offe
ring
Vanguard de�ned contribution plans
Number of options
1–5 11–15 16–20 21–25 26–30 31+6–10
Manufacturing <1,000 participants Manufacturing 1,000+ participants Vanguard DC plans
60%
0% 2% 1%
14%
9%12%
2% 1% 1% 1%
6%5%
53%
38%
23%27% 29%
5% 6%
56%
8%
1%
Manufacturing firms > 5
Figure 11. Participant investment decisions in DC plans occur within the context of a set or a menu of choices offered by the employer. In this figure, we
count a series of target-risk or target-date funds as one fund since these funds are designed as a single-fund investment.
Manufacturing <1,000 participants
Manufacturing 1,000+ participants
Vanguard DC plans
Average funds offered 14.3 14.7 17.9
Median funds offered 13 14 16
Source: Vanguard, 2017.
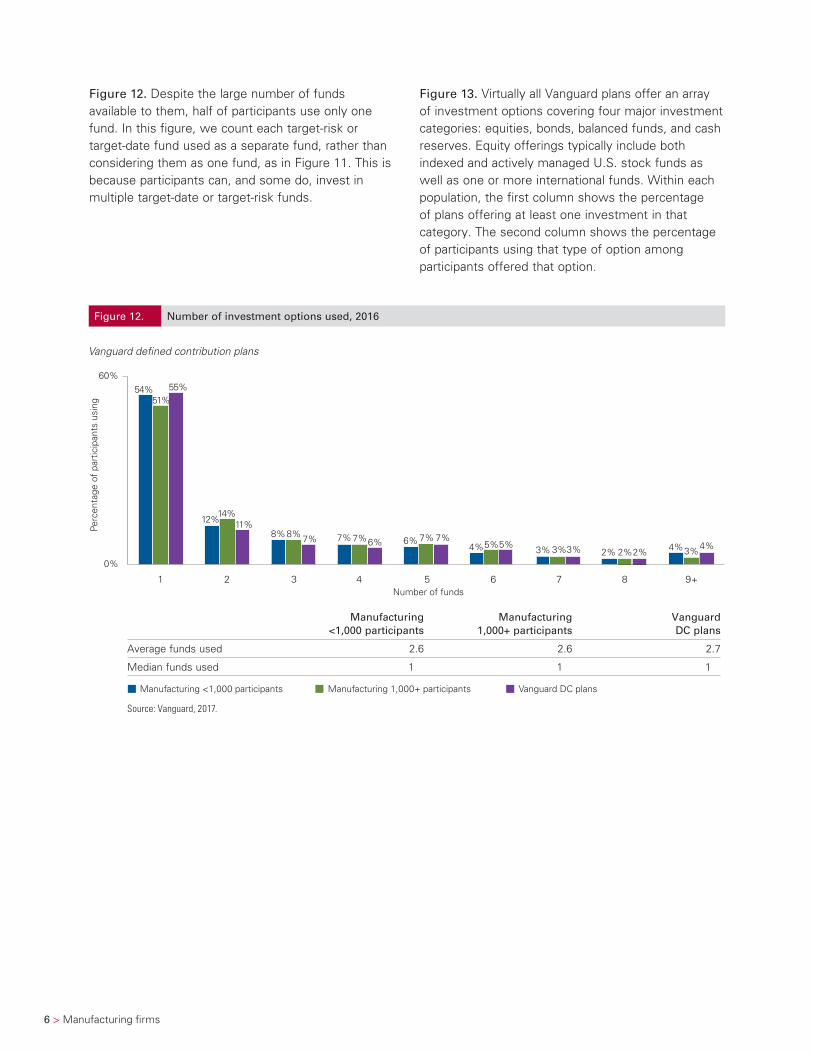
Figure 12. Number of investment options used, 2016Number of investment options used, 2016Figure 12.
Perc
enta
ge o
f pa
rtic
ipan
ts u
sing
Vanguard de�ned contribution plans
Number of funds1 2 3 4 5 6 7 8 9+
Manufacturing <1,000 participants Manufacturing 1,000+ participants Vanguard DC plans
54% 55%
12% 11%8%8% 7% 7%
4%7%
4% 5%3%3% 3%3% 4%
2% 2%2%5%
7%7%6% 6%
14%
60%
0%
51%
6 > Manufacturing firms
Figure 13. Virtually all Vanguard plans offer an array of investment options covering four major investment categories: equities, bonds, balanced funds, and cash reserves. Equity offerings typically include both indexed and actively managed U.S. stock funds as well as one or more international funds. Within each population, the first column shows the percentage of plans offering at least one investment in that category. The second column shows the percentage of participants using that type of option among participants offered that option.
Figure 12. Despite the large number of funds available to them, half of participants use only one fund. In this figure, we count each target-risk or target-date fund used as a separate fund, rather than considering them as one fund, as in Figure 11. This is because participants can, and some do, invest in multiple target-date or target-risk funds.
Manufacturing <1,000 participants
Manufacturing 1,000+ participants
Vanguard DC plans
Average funds used 2.6 2.6 2.7
Median funds used 1 1 1
Source: Vanguard, 2017.

Manufacturing firms > 7
Figure 13. Types of investment options offered and used, 2016
Vanguard defined contribution plans
Manufacturing
<1,000 participantsManufacturing
1,000+ participantsVanguard DC plans
Percentage of plans offering
Percentage of participants
offered usingPercentage of plans offering
Percentage of participants
offered usingPercentage of plans offering
Percentage of participants
offered using
Cash 98% 26% 100% 21% 99% 19%
Money market 61 16 58 8 67 12
Stable value/Investment contract 66 24 82 20 63 17
Bond funds 98% 19% 99% 19% 98% 20%
Active 60 12 72 9 72 10
Index 86 16 89 16 89 16
Inflation-protected securities 18 5 21 4 33 4
High-yield 9 8 6 4 19 5
International 13 3 18 2 19 2
Balanced funds 99% 77% 99% 81% 99% 81%
Traditional balanced 72 21 60 17 70 20
Target-risk 12 27 8 5 17 5
Target-date 90 67 99 75 92 74
Equity funds 99% 40% 100% 37% 99% 36%
Domestic equity funds 99% 39% 100% 36% 99% 35%
Active domestic 93 29 92 25 94 23
Index domestic 98 30 99 29 99 28
Large-cap value 88 16 84 14 90 13
Large-cap growth 90 20 89 17 90 17
Large-cap blend 96 26 98 25 97 24
Mid-cap 86 16 92 17 89 17
Small-cap 86 15 84 14 88 13
Socially responsible 0 3 1 6 8 3
International equity funds 95% 19% 99% 20% 97% 21%
Active international 83 16 88 14 85 15
Index international 53 10 73 12 66 13
Emerging markets 19 6 27 5 32 7
Sector funds 23% 10% 16% 5% 35% 10%
REIT 19 8 15 5 31 7
Health care 6 18 2 8 11 8
Energy 2 7 1 2 7 6
Precious metals 1 10 0 0 4 2
Technology 0 0 1 9 2 8
Utilities 1 2 0 0 1 4
Natural resources 0 0 0 0 1 3
Financials <0.5 9 0 0 1 3
Communications 0 0 0 0 <0.5 6
Commodities 0 0 0 0 <0.5 5
Consumer 0 0 0 0 <0.5 2
Company stock 7% 36% 30% 49% 9% 48%
Self-directed brokerage 5% 2% 13% 1% 17% 1%
Managed account program 16% 5% 55% 7% 27% 7%
Source: Vanguard, 2017.

8 > Manufacturing firms
Figure 14. An important development in DC plans is the rising prominence of professionally managed allocations. Participants with professionally managed allocations are those who have their entire account balance invested in a single target-date or balanced fund or a managed account advisory service. These professionally managed investment options signal a shift in responsibility for investment decision-making away from the participant and toward employer-selected investment and advice programs.
By 2021, we expect that nearly three-quarters of all Vanguard participants will be using a professionally managed allocation.
Figure 15. Among new plan entrants (participants entering the plan for the first time in 2016), the professionally managed allocation trend is even more pronounced.
Figure 16. Target-date strategies continue to grow in importance in DC plan investment menus. The funds replace the complex task of portfolio construction with a simplified choice—the choice of an expected date of retirement—and provide automatic age-based rebalancing over time. They are likely to appeal to less sophisticated or less engaged investors looking for a streamlined portfolio choice, as well as to sponsors seeking a default investment for automatic enrollment.
Figure 17. Participants invest in target-date funds in one of two ways. “Pure” investors hold a single target-date fund and no other investments. “Mixed” investors hold a target-date fund in combination with other investments, including other target-date funds.
Note: Investments in target-date funds are subject to the risks of their underlying funds. The year in the fund name refers to the approximate year (the target date) when an investor in the fund would retire and leave the workforce. The fund will gradually shift its emphasis from more aggressive investments to more conservative ones based on its target date. An investment in target-date funds is not guaranteed at any time, including on or after the target date.
Figure 15. Participants with professionally managed allocations, new plan entrants during the year, 2016
Source: Vanguard, 2017.
Single target-date fund
Single balanced fund
Managed account program
Participants with professionally managed allocations, new plan entrants during the year, 2016
Figure 15.
Vanguard de�ned contribution plans
Manufacturing<1,000 participants
Manufacturing1,000+ participants
VanguardDC plans
100%
0%
40%
82%
85%81%
86%
81%
85%
Source: Vanguard, 2017
Figure 14. Participants with professionally managed allocations, 2016
Source: Vanguard, 2017.
Single target-date fund
Single balanced fund
Managed account program
Participants with professionally managed allocations, 2016
Figure 14.
Vanguard de�ned contribution plans
Manufacturing<1,000 participants
100%
0%
43%
46%
Manufacturing1,000+ participants
VanguardDC plans
44%
49%
46%
53%
Source: Vanguard, 2017

Manufacturing firms > 9
Figure 16. Plan use of target-date funds, 2016
Vanguard defined contribution plans
Manufacturing
<1,000 participantsManufacturing
1,000+ participantsVanguard DC plans
Percentage of all plans offering target-date funds 90% 99% 92%
Percentage of all recordkeeping assets in target-date funds 30% 32% 28%
Percentage of all contributions directed to target-date funds 47% 52% 49%
Percentage of all participants invested in target-date funds 64% 75% 72%
Among plans offering target-date funds
Percentage of plan assets invested in target-date funds 31% 32% 29%
Percentage of plan contributions directed to target-date funds 49% 52% 50%
Source: Vanguard, 2017.
Figure 17. Participant use of target-date funds, 2016
Vanguard defined contribution participants using target-date funds
Manufacturing
<1,000 participantsManufacturing
1,000+ participantsVanguard DC plans
Percentage of all participants offered target-date funds 96% 99% 97%
Percentage of participants using target-date funds when offered 67% 75% 74%
Percentage of participant account balances in target-date funds 59% 54% 53%
Percentage of total participant and employer contributions in target-date funds 80% 75% 78%
Distribution of percentage of participant assets in target-date funds
1%–24% 12% 14% 13%
25%–49% 8 9 8
50%–74% 5 6 6
75%–99% 5 10 7
100% 70 61 66
Distribution of percentage of total participant and employer contributions in target-date funds
1%–24% 7% 10% 8%
25%–49% 7 9 7
50%–74% 3 5 4
75%–99% 2 6 5
100% 81 70 76
Percentage of participants owning
One target-date fund only 67% 59% 65%
One target-date fund plus other funds 26 34 28
Two or more target-date funds only 3 2 2
Two or more target-date funds plus other funds 4 5 5
Source: Vanguard, 2017.

Figure 18. Distribution of equity exposure, 2016
Vanguard de�ned contribution participants
Distribution of equity exposure, 2016Figure 18.
Perc
enta
ge o
f pa
rtic
ipan
ts
Percentage in equities
0% 100%1%–30% 31%–40% 41%–50% 51%–60% 61%–70% 71%–80% 81%–90% 91%–99%
Manufacturing <1,000 participants Manufacturing 1,000+ participants Vanguard DC plans
40%
0%
5%
2% 2% 4%
8% 6%
8% 6%
9%
6% 6%
12% 10%
6%
9% 11%
18% 18% 16%
6%
31%
37%38%
4% 3% 3% 4% 4% 4% 4%
Manufacturing <1,000 participants
Manufacturing 1,000+ participants
Vanguard DC plans
Average percentage equities 69% 74% 74%
Median percentage equities 79 82 85
Source: Vanguard, 2017.
10 > Manufacturing firms
Figure 18. From an investment perspective, an average asset allocation to equities of approximately two-thirds or more may be appropriate in light of the long-term retirement objectives of most DC plan
participants. However, the allocation to equities varies dramatically among participants. Extreme allocations of 0% or 100% may be problematic, depending on individual circumstances.

Manufacturing firms > 11
Figure 19. Many participants in DC plans may lack the financial planning skills, time, or interest to make appropriate investment decisions. To address participants’ need for assistance with investment decisions, plan sponsors using Vanguard as recordkeeper offer a range of advice programs, including Personal Online Advisor, an online advice service; Vanguard Managed Account Program, a managed account advisory service; and Vanguard
Financial Planning Services. The online advice service and managed account program are provided by Financial Engines, a third-party advisor. The financial planning services are provided by Vanguard Advisers, Inc. Each of these programs allows participants to include information about assets they have outside of the plan, which may affect the selection of in-plan investments.
Figure 19. Advice offered, 2016Advice offered, 2016Figure 19.
Vanguard de�ned contribution plans
Perc
enta
ge o
f pl
ans
offe
ring
Source: Vanguard, 2017.
Managed account advice
Financial planning services age 55+
Online advice
Manufacturing <1,000 participants Manufacturing 1,000+ participants Vanguard DC plans
100%
0%
27%
63%
27%
67%
80%
67%
16%
55%
39%
Source: Vanguard, 2017

12 > Manufacturing firms
Accessing plan assets
Figure 20. If permitted by the plan, participants can borrow up to 50% of their balance (up to a maximum of $50,000) from their DC plan account. Plan loans allow DC participants to access their plan savings before retirement without incurring income taxes or tax penalties.
Figure 21. Plan withdrawals allow participants to access their plan savings before a job change or retirement. Withdrawals are optional plan provisions, and availability varies from plan to plan. Plan withdrawals are used infrequently in the aggregate. Certain participants could, over time, jeopardize their retirement program if they continue to rely on this feature throughout their working careers.
Figure 20. Participant loans, 2016
Vanguard defined contribution plans offering loans
Manufacturing
<1,000 participants
Manufacturing
1,000+ participantsVanguard DC plans
Outstanding loans
Percentage of participants with outstanding loans 19% 19% 16%
Percentage of account balance in loans 11% 10% 11%
Average loan balance 8,836 9,148 9,693
Number of outstanding loans per participant
0 loans 81% 81% 84%
1 loan 16 16 12
2 loans 3 3 3
3+ loans 0 0 1
Source: Vanguard, 2017.
Figure 21. Participant in-service withdrawals, 2016
Vanguard defined contribution plans offering in-service withdrawals
Manufacturing
<1,000 participantsManufacturing
1,000+ participantsVanguard DC plans
Percentage of participants using 3.8% 4.3% 3.4%
Percentage of assets withdrawn 1.2 1.1 0.9
Percentage of participant account assets withdrawn 35.7 33.2 32.3
Source: Vanguard, 2017.

Methodology
Vanguard participation and deferral rates Data on participation and deferral rates is drawn from a subset of Vanguard recordkeeping clients for whom we perform nondiscrimination testing. Selected plan design features are also derived from this data. For the 2016 analysis, the subset is composed of plans that complete their testing by March and represents approximately one-third of the clients for whom we perform testing. Plans that complete their testing by March generally have lower participation rates and generally include plans with concerns related to passing testing. When all plans have completed their testing by the end of 2017, the participation rates improve. Plan design features derived from this data also improve. Interestingly, the deferral rates do not change significantly.
Based on the trends experienced over the prior three years, we have estimated participation rates for 2016. The estimations use a combination of linear extrapolation and subjective estimation. The same approach is applied to plan design features derived from this data. We will continue to restate these results in the following year based on the final compliance testing results.
Industry-specific supplements
Benchmark data supplements to How America Saves are available for the following sectors:
• Ambulatory health care services
• Architecture and engineering
• Finance and insurance
• Information
• Legal services
• Manufacturing
• Mining, oil, and gas extraction
• Technology
If the sector you are interested in is not available at this time, please contact your sales executive or relationship manager.
Acknowledgments
We extend our thanks to the following Vanguard crew members who made this publication possible:
Jeffrey W. Clark William G. Doughty John A. Lamancusa Daniel C. Proctor Jean A. Young
Manufacturing firms > 13

The Vanguard Group has partnered with Financial Engines Advisors LLC to provide subadvisory services to the Vanguard Managed Account Program and Personal Online Advisor. Financial Engines Advisors LLC is an independent, federally registered investment advisor that does not sell investments or receive commission for the investments it recommends. Advice is provided by Vanguard Advisers, Inc. (VAI), a federally registered investment advisor and an affiliate of The Vanguard Group, Inc. (Vanguard). Eligibility restrictions may apply. Neither Vanguard, Financial Engines, nor their respective affiliates guarantee future results.
Vanguard Financial Planning Services are provided by Vanguard Advisers, Inc., a registered investment advisor.
Vanguard research > Vanguard Center for Investor Research Vanguard Investment Strategy Group
All investing is subject to risk, including the possible loss of the money you invest. Be aware that fluctuations in the financial markets and other factors may cause declines in the value of your account. There is no guarantee that any particular asset allocation or mix of funds will meet your investment objectives or provide you with a given level of income.
Vanguard Institutional Investor Group
P.O. Box 2900 Valley Forge, PA 19482-2900
© 2017 The Vanguard Group, Inc. All rights reserved.
HASMAN 062017
Connect with Vanguard® > institutional.vanguard.com > global.vanguard.com (non-U.S. investors)