Embed Size (px)
Citation preview
TRAMES, 2013, 17(67/62), 4, 433–448
TEST-TAKING EFFORT AS A PREDICTOR OF PERFORMANCE
IN LOW-STAKES TESTS
Gerli Silm, Olev Must, and Karin Täht
University of Tartu Abstract. We studied how time measures can be used as predictors of test-taking performance in low-stakes tests. Our sample consisted of undergraduate students (N = 327) who took a computer-based cognitive abilities test. Our aim was to find how test-takers’ motivation manifests itself in test-taking effort. We found that a high test-taking speed is related to low test scores (the correlation between test score and Response Time Effort was r = .71). Also, the mean time for wrong answers per item was smaller than the time for right answers (mean effect size d = .22). We found that performance in low-stakes tests is influenced by two test-taking effort characteristics: the number of items the test-taker attempts to solve and the mean time that is devoted to solve an item (β = .4–.5).We suggest that test-taking motivation should be studied further as it may provide useful information for interpreting results of tests and examinations. Keywords: test-taking effort, test-taking motivation, solution-seeking behaviour, rapid guessing, cognitive ability tests, response time effort, computer based tests, low-stakes tests DOI: 10.3176/tr.2013.4.08
1. Introduction
Different tests are used to measure cognitive abilities. It has been a common belief that cognitive tests give an objective and unbiased measure of students’ cognitive abilities and skills. However, there are several publications indicating that test results may be influenced by several additional variables, for instance test-taking motivation, test-taking effort, and test-taking patterns can all be covariates of cognitive ability test results (e.g. Barry, Horst, Finney, Brown, and Kopp 2010, Baumert and Demmrich 2001, Eklöf 2006, 2010, Wise and DeMars 2005). Therefore, it could be complicated to get ‘pure’ test scores – there are reasons to expect additional influences from the motivational side of test-taking. The
Gerli Silm et al. 434
Standards for Educational and Psychological Testing (American Educational Research Association, American Psychological Association, and National Council for Measurement in Education 1999) suggest that test-taking effort should be collected, reported, and used in the interpretation of test scores.
1.1. Different sides of intelligent behaviour
Early pioneers in cognitive abilities research recognized that intelligent behaviour has different dimensions. Thorndike (1927) suggested that at least three measures are needed to describe cognitive abilities: altitude, width, and speed. According to Thorndike, altitude means the measure of complexity or difficulty of operations one can perform. Width means the variety of tasks humans can solve. Speed is the number of tasks one can complete in a given time. Spearman (1927) also recognized that cognitive abilities should be described with several para-meters and covariates (including speed and will), but his emphasis on general intelligence (g) had the strongest impact on the subsequent development of the intelligence (IQ) conception and measurement. Decades after Spearman, Furneaux (1960) made an attempt to view cognitive abilities as a problem-solving behaviour. Furneaux took into account previous ideas about the balance between speed and accuracy for describing problem-solving behaviour, but added one additional and somewhat subjective category – continuance. According to Furneaux, continuance refers to the fact that test-takers are not willing to spend unlimited time on one item and evidently they seek reasonable time allocation. For time efficiency, they can make the decision to abandon some items and try to be efficient in more familiar cases. This decision-making process can influence the assessment of cognitive abilities.
Ideas analogous to Furneaux’s continuance emerged decades later in the context of analysing power and speed in cognitive testing (e.g. Partchev, De Boeck, and Steyer 2011, Sheppard and Vernon 2008, van der Maas, Molneaar, Maris, Kievit, and Borsboom 2011, van der Linden 2011). The crucial element here is the trade-off between speed and accuracy. Test-taking speed may be increased at the cost of accuracy and vice versa (Klein Entnik, Hornke, Kuhn, and Fox 2009, Parchev et al. 2011). Mental speed is measured via different indicators measuring the speed of information processing in relatively simple cognitive tasks – reaction time, general speed of processing, speed of short-term memory pro-cessing, inspection time, etc. (Sheppard and Vernon 2008). With these indicators, the mean correlation with psychometrically measured IQ is about r = .24 (Sheppard and Vernon 2008:542). But this modest correlation does not mean that better results in cognitive reasoning tests have been gained via faster test-taking. Wilhelm and Schulze (2002) argue that time constraints can have an impact on test performance because, due to this, some test-takers may start hurrying. Test-taking speed and mental speed are different concepts. Test-taking interest, strategy, and speed are clearly motivational ones.
Test-taking time, effort and motivation 435
1.2. Test-taking motivation Test-taking motivation is defined as the extent to which examinees give their
“best effort to the test, with the goal being to accurately represent what one knows and can do in the content area covered by the test” (Wise and DeMars 2005:2). To differentiate the degree to which the test for the test-taker is significant, the terms low-stakes and high-stakes test were adopted (see Cole and Osterlind 2008, Mislevy 1995, Sundre and Kitsantas 2004).
In education, high-stakes tests have significant consequences for the student, such as getting into university, getting his/her driver’s license, and so on. Low-stakes tests, for example taking part in a survey, do not have any remarkable consequences for the student, there are no benefits attached to attaining a good result, nor are there any sanctions for a bad result. It has been found by several researchers that, in high-stakes tests, students are more motivated and get better test results than in low-stakes tests (Barry et al. 2010, Baumert and Demmrich 2001, Eklöf 2006, 2010, Sundre and Kitsantas 2004, Wise and DeMars 2005, 2010). Duckworth, Quinn, Lynam, Loeber, and Stouthamer-Loeber (2011) investi-gated the role of test-taking motivation in intelligence testing and concluded that under low-stakes conditions (when test results have no consequences), some individuals try harder than others. This indicates that motivation is not always low in low-stakes tests, but can vary individually. Such individuals enjoy problem-solving for its own sake, which may be a crucial factor in intellectual life.
Eklöf (2006) found that several aspects motivate some students to do their best in low-stakes tests. For example, some wanted to get better results than their peers. Another group gave social responsibility as the main reason for trying their best. A third group tried their hardest to find out about their own abilities.
Test motivation can act as a confound factor that inflates the estimates of the predictive validity of intelligence (Wicherts and Zand Scholten 2010). To under-stand the vulnerability of testing results due to time pressures and motivational aspects, the concepts Response Time Effort (RTE) and rapid-guessing behaviour are valuable (Wise and Kong 2005, Wise, Pastor, and Kong 2009). The relation-ship between test-taking speed and power and that test-takers’ attitudes toward themselves and toward task performance have a profound influence on the response to tests was already recognized by Cronbach (1984).
With an aim to show that different items may need different amounts of work, Wolf, Smith, and Birnbaum (1995) coined the term ‘mentally taxing items’. This directly pinpoints the amount of work item-solving needs. They found that the more difficult or time consuming the task was, the less the test-takers were motivated to invest their time and effort.
In the last decades, IQ testing methods have included computer online testing. Testing with computers has added one additional analytical measure that was absent in pencil-and-paper testing – it is possible to measure the exact time test-takers devote to the test, including at the item level.
Gerli Silm et al. 436
1.3. Test-taking motivation as a belief According to expectancy-value theory (Atkinson 1957), individuals’ per-
formance can be explained by their beliefs about how well they will do on the activity (expectancies) and the extent to which they value the activity. Or, in other words, expectancy theory states that the relative value and probability of success are the key determinants (see Eccles and Wigfield 2002, Wigfield and Eccles 2000, Barry and Finney 2009).
As test-taking motivation is considered to be a belief, many researchers have used self-report questionnaires, mostly the Student Opinion Scale (Sundre and Moore 2002), to study test-takers’ motivation and effort. However, it has been noted that the results of the questionnaire may be biased by social desirability and test-taking experience. This is why researchers have been trying to find behavioural parallels to motivational beliefs. Analysing test-taking behaviour through time parameters could give a more objective sense of test-taking motivation, and how it manifests in the results through test-taking effort than self-reports.
1.4. Describing motivation and effort through time parameters
The concept of motivation is very general, meaning the energisation and direc-tion of behaviour. Test-taking effort is behaviour, or in other words motivation put into action. There have been the first promising attempts to describe test-taking motivation and effort through time parameters (Wise and Kong 2005). Besides self-reports, motivation and effort in the testing situation can be described by some simple indicators, especially in a low-stakes testing situation:
1. The amount of work: the number of items that test-takers tried to solve. 2. The quality of work: the number of right answers. 3. The time devoted to the test. 4. The speed of accomplishments (ratio of the amount of work to the time
used for testing). One prolific example of using behavioural indices for describing test-taking
motivation is that of Wise and Kong (2005), who introduced the method of Response Time Effort (RTE), which is based on item response time to measure examinee test-taking effort on computer-based test items. RTE is based on the hypothesis that when an item is administered, unmotivated examinees will answer too quickly (i.e. before they have time to read and fully consider the item).
1.5. The aim and hypothesis of the current paper
The aim of the current paper is to find how test-takers’ motivation through test-taking effort manifests itself in test results using test-taking time parameters as measures of test-taking effort.
Various sources have shown substantial differences between power and speed dimensions in cognitive test performance (e.g. Partchev et al. 2011, van der Linden 2011); these findings concerning the differences in the mental taxation of items (Wolf et al. 1995), RTE, and rapid guessing (Wise and DeMars 2005, Wise
Test-taking time, effort and motivation 437
and Kong 2005, Wise et al. 2009), as well as the perceived consequences of the test results on the test-takers (Wolf and Smith 1995), allow us to propose the following hypothesis for the current investigation:
Test results in low-stakes testing situations are partly explained by test-taking effort, which can be described with test-taking time parameters.
More specifically: 1. High test-taking speed is related to low test scores; 2. The mean time for wrong answers per item is smaller than the time for right answers per item; and 3. Estimated performance in a low-stakes testing situation is influenced by two test-taking effort characteristics: the number of items the test-taker attempts to solve and the mean time that is devoted to solve an item.
2. Method
2.1. Sample and procedure We investigated the test-taking behaviour of first-year students under the con-
dition of absent external reward for testing results, meaning the test can be con-sidered as a low-stakes test. Our research is a part of a bigger project focusing on students’ self-evaluations, learning motivation, and mental abilities. In this paper, we concentrate only on the results of a mental ability test. Our sample consists of 327 first-year students from Estonian institutions of higher education; 86 (26.3%) of them were male and 241 (73.7%) female. Participation was voluntary. We invited them to participate in our research through mailing lists and visited some colleges, where we had the opportunity to introduce our study. The only external motivator was the opportunity to get personal feedback.
2.2. Mental abilities test
The mental abilities test we used is the short version of the scholastic aptitude test of the University of Tartu (Must and Allik 2002). It consists of three subscales – vocabulary, mathematics, and spatial reasoning – with 15 items in each, and altogether 45 items. The test was assembled from scholastic aptitude test items from the years 2008–2012, considering their empirical level of difficulty (M = .58, SD = .09), meaning that selected test items in all subtests should be equally difficult – that is, the difficulty level throughout the test is not progressive. The research was conducted via the Internet in an online research environment and there was a 60 minute time limit for the test, which should be long enough to answer all the items with no time pressure. The time limit was set to ensure that items were answered sequentially, with no long disruptions.
The questions in the subtests are somewhat different in their nature. For example, here are two different questions from the vocabulary subtest: 1) The meanings of the words egg and seed are
a) similar b) opposite c) neither similar nor opposite
Gerli Silm et al. 438
2) Here are five sentences in which the words have similar functions. Find one sentence that is different from the rest. A) A boy is running in a forest B) A girl is walking in a park C) A farmer is disappointed in the field D) Father is jumping in the garden E) Brother is swimming in the pool
An example from the mathematics subtest: There are 40 boys in the class. 18 of them play football and 24 play basketball. 12 boys play both games. How many of them don’t play either of these games? A 8 B 10 C 12 D 14 E 16
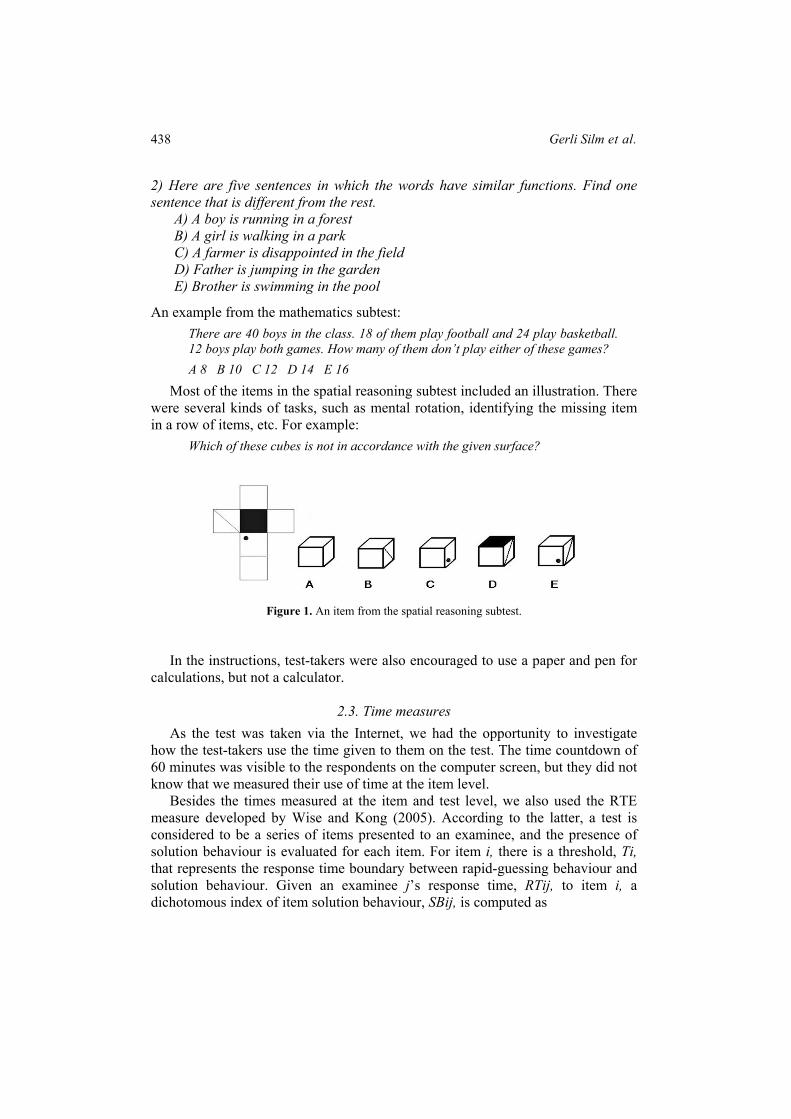
Most of the items in the spatial reasoning subtest included an illustration. There were several kinds of tasks, such as mental rotation, identifying the missing item in a row of items, etc. For example:
Which of these cubes is not in accordance with the given surface?
Figure 1. An item from the spatial reasoning subtest.
In the instructions, test-takers were also encouraged to use a paper and pen for
calculations, but not a calculator.
2.3. Time measures As the test was taken via the Internet, we had the opportunity to investigate
how the test-takers use the time given to them on the test. The time countdown of 60 minutes was visible to the respondents on the computer screen, but they did not know that we measured their use of time at the item level.
Besides the times measured at the item and test level, we also used the RTE measure developed by Wise and Kong (2005). According to the latter, a test is considered to be a series of items presented to an examinee, and the presence of solution behaviour is evaluated for each item. For item i, there is a threshold, Ti, that represents the response time boundary between rapid-guessing behaviour and solution behaviour. Given an examinee j’s response time, RTij, to item i, a dichotomous index of item solution behaviour, SBij, is computed as
Test-taking time, effort and motivation 439
1 if0 otherwise
ij iij
RT TSB
≥ =
(1)
The index of overall RTE for examinee j to the test is given by
ijj
SBRTE
kΣ
= (2)
where k = the number of items in the test. RTE scores range from 0 to 1 and represent the proportion of test items for which the examinees exhibited solution behaviour. RTE values near 1 indicate strong examinee effort to the test, and the further a value falls below 1, the less effort the examinee expended (Wise and Kong 2005).
To find the threshold for every test item, which is the boundary between rapid guessing and solution behaviours, we took into account the length and nature of the item. Wise and Kong (2005, p. 171) used 3 thresholds for the classification of test-taking depending on the item length. If an item was shorter than 200 characters, a 3-second threshold was used. If an item was longer than 1,000 characters, a 10-second threshold was used. For the remaining items, a 5-second threshold was used. Those thresholds were empirical and partly explained by the fact that the frequencies of item response times had two tops which allowed such separation.
We did not find a similar pattern in the frequency graphs to Wise and Kong (2005), and therefore we could not use this in identifying thresholds. However, we took into account the length of items, which in our case was no longer than 1,000 characters. For all the items in the mathematics and spatial reasoning sub-test, both under and over 200 characters, we used a threshold of 5 seconds. We decided to use a 5 second threshold instead of a 3 second threshold for items under 200 characters, because, in these subtests, the item needs more attention than just reading them through, namely, calculation and mentally processing the figures.
In the vocabulary subtest, we used a threshold of 5 seconds on 10 items and, on the remaining 5 items, 3 seconds, based on item length. Therefore our thresholds are analogous to the ones used by Wise and Kong (2005).
2.4. Predicting performance in low-stakes tests
The concept of general intelligence claims that cognitive abilities can be described with one latent variable – the g factor (see Jensen 1998). In low-stakes tests, it seems that besides intelligence, other factors, such as motivation and effort, play a role in test performance. Therefore, we view test-taking performance as a latent variable in low-stakes testing results, indicating that, besides cognitive ability, it contains test-taking motivation. Our aim is to create a model describing how test-taking performance is influenced by two test-taking effort characteristics: the number of items the test-taker attempts to solve (continuance) and the mean time devoted to solve an item (speed).
Gerli Silm et al. 440
Similarly to general intelligence theory, we hypothesize that behind the results of the three subtests, there is one common latent variable – performance in low-stakes tests – which is regressed on two test-taking effort characteristics: the number of solved items and mean time on an item.
3. Results
3.1. Results of the cognitive abilities test The maximum possible score for the test was 45 points: 15 points for every
subtest. In our study, the maximum score obtained was 43 points. The mean scores of all subtests, with mean times for passing the subtests, are
provided in Table 1.
Table 1. Mean scores and test-taking time for each subtest (N = 327)
Subtests Mean score SD Max Min Mean time (min) SD
Vocabulary 8.62 3.05 15 0 6.60 2.38 Mathematics 8.35 4.79 15 0 15.02 8.83 Spatial reasoning 7.33 4.47 15 0 12.17 7.03 Total test score 24.31 10.75 43 0 33.80 15.14 The highest mean score was in the vocabulary subtest and the lowest in the
spatial reasoning. In every subtest, the maximum possible score was reached by at least one test-taker, but no one obtained the maximum score in all three subtests.
3.2. Test-taking time and perseverance of test-takers
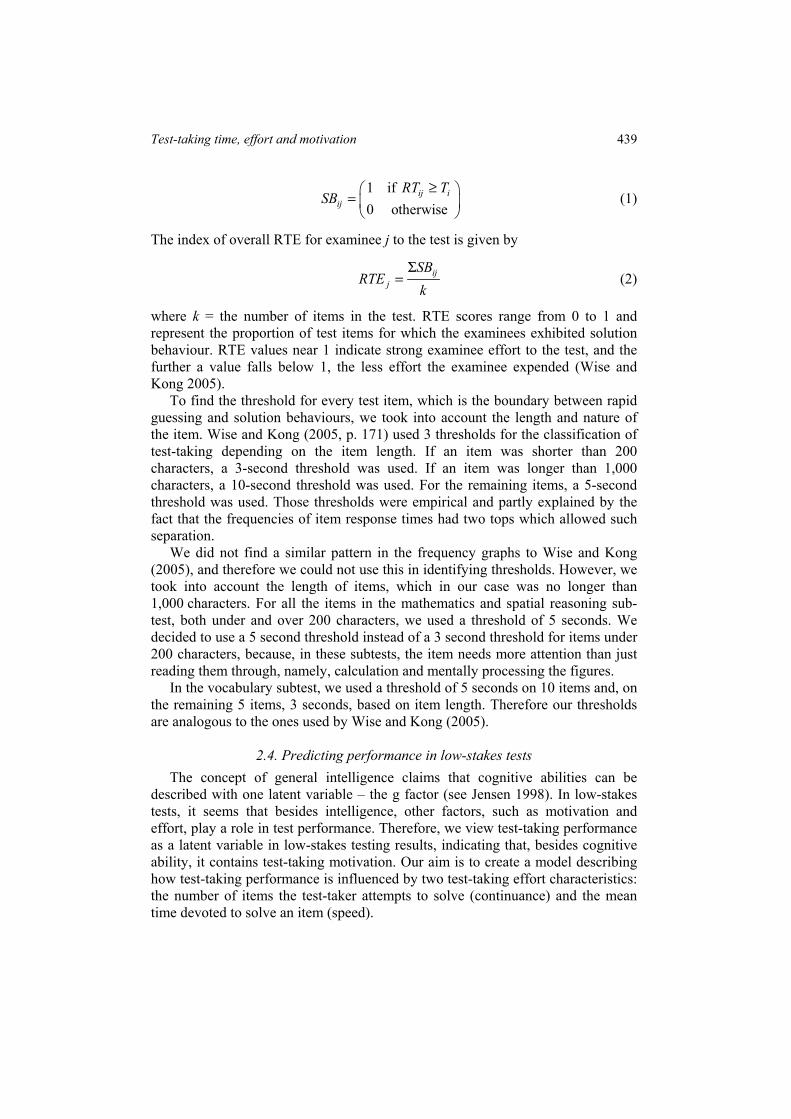
When looking at test-taking patterns, it can be seen that many students abandon the test-taking process before the given 60 minutes for the test. The portion of students who abandoned the test-taking before reaching the third subtest was 16%, meaning that plenty of students did not pass the whole test and abandoned the test with only some experience with it. Test-taking time for all 45 items varied considerably– ranging from 6 to 60 minutes. Figure 2 illustrates at what stage test-takers abandoned the test.
As can be seen, the largest drop comes after question number 15 – this is where vocabulary subtest ends and mathematics subtest begins.
The correlation between the test score and total test-taking time was r = .716. The correlations are different within subtests, being the highest in the spatial reasoning (r = .789) and mathematics (r = .622) and the lowest in the vocabulary subtest (r = .236).
Test-taking time, effort and motivation 441
Figure 2. Test abandoning tendencies throughout the test.
3.3. Test results and response time effort Based on the set time thresholds and response times for every item, we
calculated the RTE index (see Equations 1 and 2) for every test-taker. The index can vary from 0 to 1 and shows the number of test items on which the respondent took enough time to read and answer the question. For example, RTE index .70 means that, on 70% of the items, the response time was over the threshold and to the remaining 30% of the items the answers were given too quickly.
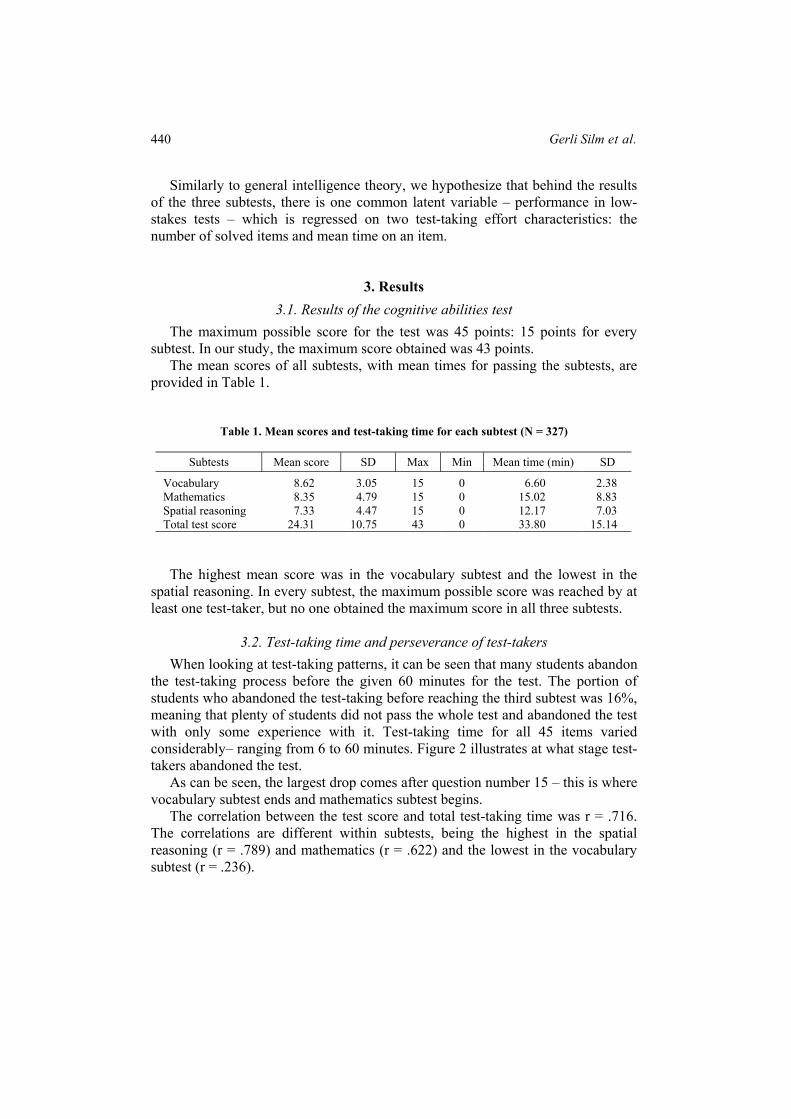
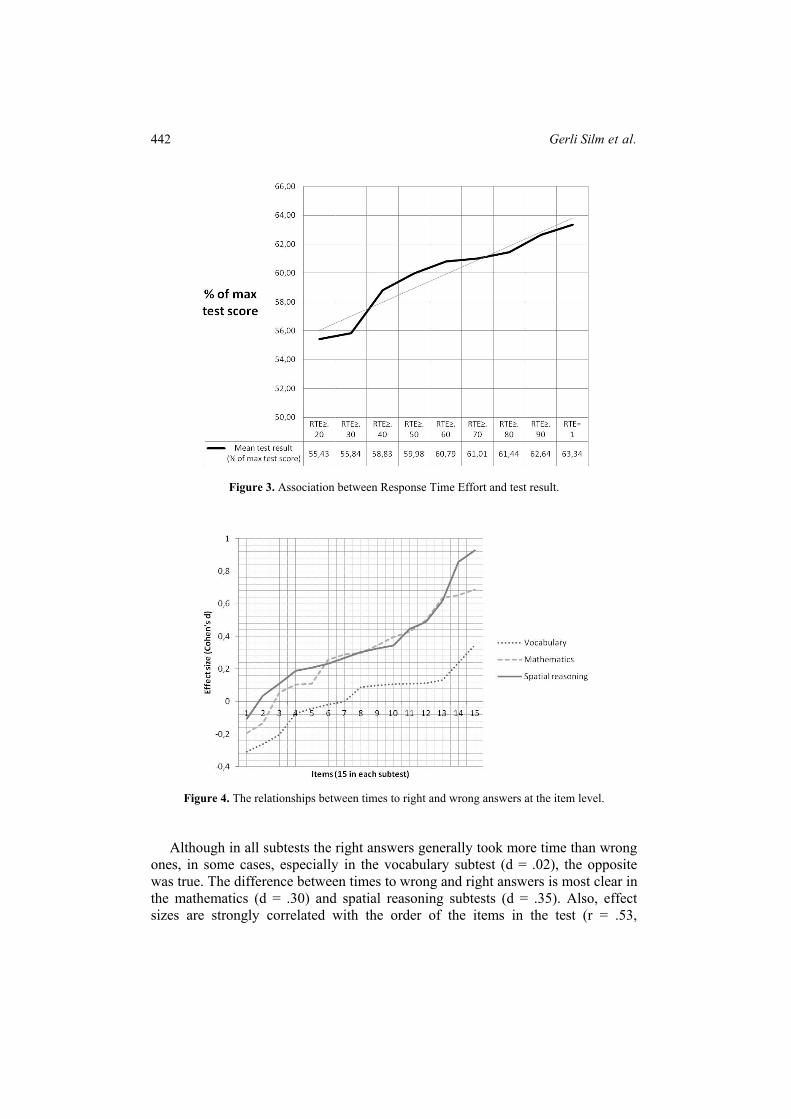
Figure 3 illustrates how the mean score of the test changes when we take into account the different RTE results of the test-takers. The correlation between RTE and total test score is r = .71.
It is evident that students with an RTE of less than .20 obtained only 55.4% of the possible score, whereas students with an RTE of over .90 obtained 62.6% of the possible score. The association between RTE and test score is close to linear.
3.4. Response times to right and wrong answers.
Secondly, we supposed that wrong answers are given more quickly than right answers, indicating that right answers demand time investment, and wrong answers may be given due to hurrying. For every item we calculated the mean answering times for right answers and wrong answers, and found the effect size Cohen’s d (d) between means.
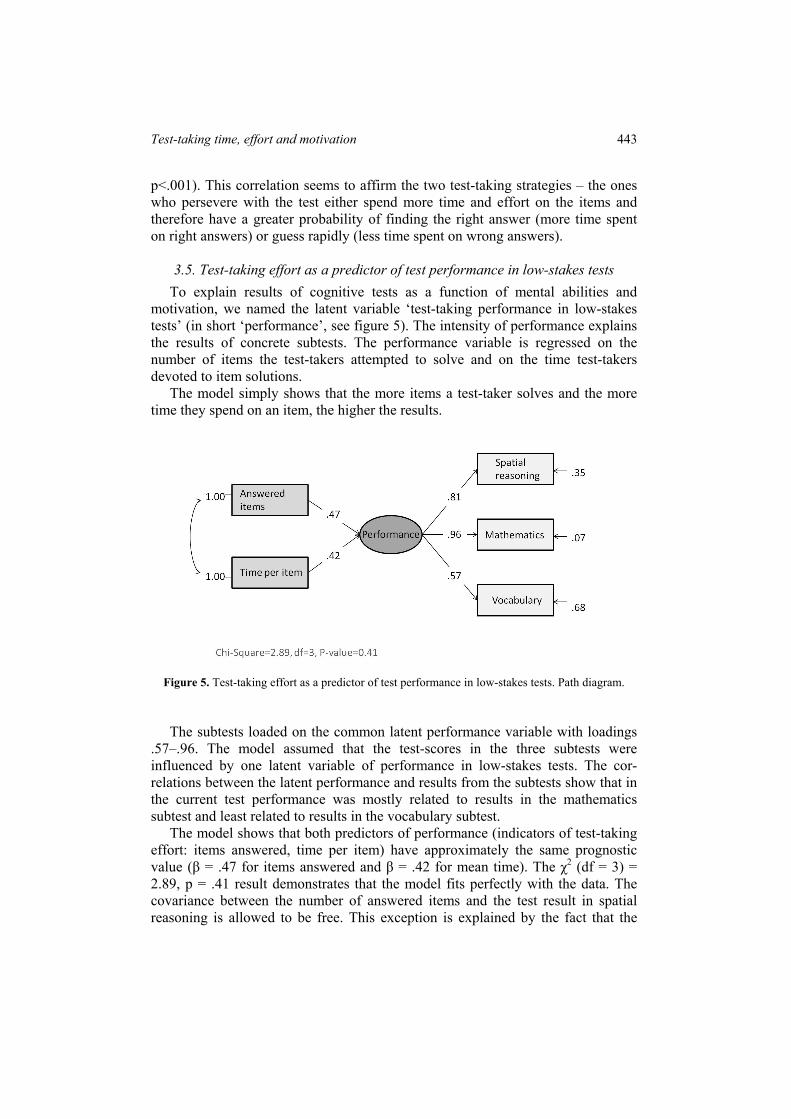
The relationships between times to right and wrong answers at the item level are shown in Figure 4. A positive effect size indicates that wrong answers were given faster than right answers. For greater clarity, the effects are in ascending order (there were 15 items in every subtest).
Gerli Silm et al. 442
Figure 3. Association between Response Time Effort and test result.
Figure 4. The relationships between times to right and wrong answers at the item level.
Although in all subtests the right answers generally took more time than wrong
ones, in some cases, especially in the vocabulary subtest (d = .02), the opposite was true. The difference between times to wrong and right answers is most clear in the mathematics (d = .30) and spatial reasoning subtests (d = .35). Also, effect sizes are strongly correlated with the order of the items in the test (r = .53,
Test-taking time, effort and motivation 443
p<.001). This correlation seems to affirm the two test-taking strategies – the ones who persevere with the test either spend more time and effort on the items and therefore have a greater probability of finding the right answer (more time spent on right answers) or guess rapidly (less time spent on wrong answers).
3.5. Test-taking effort as a predictor of test performance in low-stakes tests
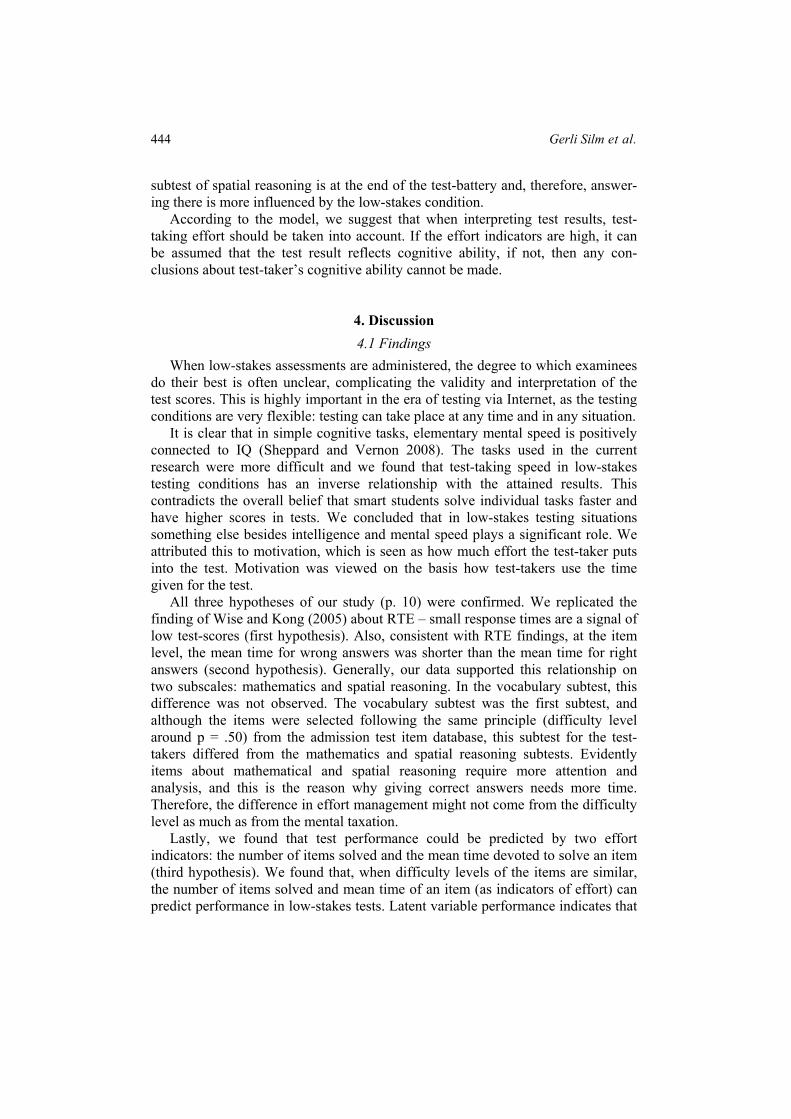
To explain results of cognitive tests as a function of mental abilities and motivation, we named the latent variable ‘test-taking performance in low-stakes tests’ (in short ‘performance’, see figure 5). The intensity of performance explains the results of concrete subtests. The performance variable is regressed on the number of items the test-takers attempted to solve and on the time test-takers devoted to item solutions.
The model simply shows that the more items a test-taker solves and the more time they spend on an item, the higher the results.
Figure 5. Test-taking effort as a predictor of test performance in low-stakes tests. Path diagram. The subtests loaded on the common latent performance variable with loadings
.57–.96. The model assumed that the test-scores in the three subtests were influenced by one latent variable of performance in low-stakes tests. The cor-relations between the latent performance and results from the subtests show that in the current test performance was mostly related to results in the mathematics subtest and least related to results in the vocabulary subtest.
The model shows that both predictors of performance (indicators of test-taking effort: items answered, time per item) have approximately the same prognostic value (β = .47 for items answered and β = .42 for mean time). The χ2 (df = 3) = 2.89, p = .41 result demonstrates that the model fits perfectly with the data. The covariance between the number of answered items and the test result in spatial reasoning is allowed to be free. This exception is explained by the fact that the
Gerli Silm et al. 444
subtest of spatial reasoning is at the end of the test-battery and, therefore, answer-ing there is more influenced by the low-stakes condition.
According to the model, we suggest that when interpreting test results, test-taking effort should be taken into account. If the effort indicators are high, it can be assumed that the test result reflects cognitive ability, if not, then any con-clusions about test-taker’s cognitive ability cannot be made.
4. Discussion
4.1 Findings When low-stakes assessments are administered, the degree to which examinees
do their best is often unclear, complicating the validity and interpretation of the test scores. This is highly important in the era of testing via Internet, as the testing conditions are very flexible: testing can take place at any time and in any situation.
It is clear that in simple cognitive tasks, elementary mental speed is positively connected to IQ (Sheppard and Vernon 2008). The tasks used in the current research were more difficult and we found that test-taking speed in low-stakes testing conditions has an inverse relationship with the attained results. This contradicts the overall belief that smart students solve individual tasks faster and have higher scores in tests. We concluded that in low-stakes testing situations something else besides intelligence and mental speed plays a significant role. We attributed this to motivation, which is seen as how much effort the test-taker puts into the test. Motivation was viewed on the basis how test-takers use the time given for the test.
All three hypotheses of our study (p. 10) were confirmed. We replicated the finding of Wise and Kong (2005) about RTE – small response times are a signal of low test-scores (first hypothesis). Also, consistent with RTE findings, at the item level, the mean time for wrong answers was shorter than the mean time for right answers (second hypothesis). Generally, our data supported this relationship on two subscales: mathematics and spatial reasoning. In the vocabulary subtest, this difference was not observed. The vocabulary subtest was the first subtest, and although the items were selected following the same principle (difficulty level around p = .50) from the admission test item database, this subtest for the test-takers differed from the mathematics and spatial reasoning subtests. Evidently items about mathematical and spatial reasoning require more attention and analysis, and this is the reason why giving correct answers needs more time. Therefore, the difference in effort management might not come from the difficulty level as much as from the mental taxation.
Lastly, we found that test performance could be predicted by two effort indicators: the number of items solved and the mean time devoted to solve an item (third hypothesis). We found that, when difficulty levels of the items are similar, the number of items solved and mean time of an item (as indicators of effort) can predict performance in low-stakes tests. Latent variable performance indicates that
Test-taking time, effort and motivation 445
the obtained result is not only connected to mental abilities but also influenced by the manifestation of motivation in behavior.
4.2. Limitations
Using the concept of RTE has some limitations. Firstly, the thresholds are set considering basically only the length of items. With more precise thresholds, RTE could be more salient and informative. One way in which to do this is to get data from a high-stakes testing situation and find the minimal times for giving the right answer to every item. In the present study, the correlation between RTE and test result (r = .710) was very similar to the correlation between test result and test-taking time (r = .716). Still, RTE could distinguish the motivated from the unmotivated better. For example, we may have two test-takers who both have the same test-taking time, but different RTE indexes. Especially in online testing, we cannot be sure under what circumstances the test is being done. When doing other things at the same time, one might only answer a few questions in the given time for the test – in that case, test-taking time can be long but the RTE index low, because of the unanswered questions.
4.3. Implications and recommendations
The current research can be interpreted within the broader context of higher education today. On the one hand, Unt, Täht, Saar, and Helemäe (2013) write about the possible devaluation of higher education in Estonia, meaning that, in the last decades, higher education has become more obtainable and the number of students in Estonia has almost trippled in the last twenty years. On the other hand, the researchers also found that, for many students, a degree in itself has become more important than the field of study or major in which it has been acquired. Therefore, it is possible that many education-related tasks are low-stakes, because the main purpose is to pass, not for students to try their hardest or master the subject matter.
It would be important to learn about students’ motivation and effort manage-ment in educational situations which should be high-stakes for them, such as exams and tests necessary for getting credit points. Nowadays, some exams are already taken on computers and these would be ideal for learning about motivation using time measures. It is especially the case that this should be studied in multiple choice tests, where students have the theoretical opportunity to pass by random guessing (“bingo“). The results of this kind of research could give insight into our education system and students’ learning motivation. Longitudinal data could be informative about the usefulness and outcomes of different kinds of test-taking and learning strategies.
The availability and therefore the possible devaluation of education in different countries could vary considerably. This means that the students’ attitude and motivation towards educational tasks are probably different which, in turn, means that comparing educational outcomes or results in tests across nations may not give the information we expect, for the balance between intelligence and motiva-
Gerli Silm et al. 446
tion may be different. The same test or any other educational task that is high-stakes for one, could be low-stakes for others. What may seem like a difference in intelligence may be a difference in motivation, or both.
One opportunity for getting more reliable data, is to try to ensure the test is high-stakes to the test-taker, meaning that the result should have a meaningful con-sequence or value. If time measures are taken into account in surveys, the possibility of filtrating the data can be considered. This could be done using the Response Time Effort index, for example, using only data from test-takers with an RTE over .90. Filtering could be especially important when comparing two groups where motivation and effort have been different.
In today’s world, we have many opportunities to choose from, but only a limited amount of resources. Priorities and values largely determine where and in what we invest our time and energy. The more value anything has to an individual, the more effort they are willing to put into it. Without knowing the backround, we can make wrong interpretations when we only know the outcome. When our aim is to determine maximum abilities, we have to be sure we are looking at a situation where the person has invested maximal effort. As actions sometimes speak louder than words, it is good to use behavioral measures beside self-reports, for they both could provide useful information.
Acknowledgements A Primus grant (#3-8.2/60) from European Social Fund to Anu Realo and by
the Estonian Centre of Behavioral and Health Sciences supported the preparation of this article. We are very grateful for the suggestions made by the anonymous reviewers.
Address: Gerli Silm Institute of Psychology University of Tartu Näituse 2 50409 Tartu, Estonia
Tel.: +372 56 479 324 E-mail: [email protected]
References American Educational Research Association, American Psychological Association, and National
Council for Measurement in Education (AERA, APA, and NCME) (1999) Standards for educational and psychological testing. Washington DC: American Educational Research Association.
Atkinson, John W. (1957) “Motivational determinants of risk-taking behaviour”. Psychological Review 64, 359–372.
Test-taking time, effort and motivation 447
Baumert, Jürgen and Anke Demmrich (2001) “Test motivation in the assessment of student skills: the effects of incentives on motivation and performance”. European Journal of Psychology of Education 16, 441–462.
Barry, Carol L. and Sara J. Finney (2009) “Exploring change in test-taking motivation”. Paper presented at the 2009 annual meeting of the Northeastern Educational Research Association, October, in Rocky Hill, CT.
Barry, Carol L., S. Jeanne Horst, Sara J. Finney, Allison R. Brown, and Jason P. Kopp (2010) “do examinees have similar test-taking effort? A high-stakes question for low-stakes testing”. International Journal of Testing 10, 342–363.
Brand, Christopher (1996) The g factor: general intelligence and its implications. New York: John Wiley and Sons Inc.
Cole, James S. and Steven J. Osterlind (2008) “Investigating differences between low- and high-stakes test performance on a general education exam”. The Journal of General Education 57, 119–130.
Cronbach, Lee J. (1984) Essentials of psychological testing. New York: Harper and Row. Duckworth, Angela Lee, Patrick D. Quinn, Donald R. Lynam, Rolf Loeber, and Magda Stouthamer-
Loeber (2011) “Role of test motivation in intelligence testing”. Proceedings of the National Academy of Sciences of the United States of America 108, 7716–7720.
Eccles, Jacquelynne S. and Allan Wigfield (2002) “Motivational beliefs, values, and goals”. Annual Review of Psychology 53, 109–132.
Eklöf, Hanna (2006) “Development and validation of scores from an instrument measuring student test-taking motivation”. Educational and Psychological Measurement 66, 4, 643–56.
Eklöf, Hanna (2010) “Skill and will: test-taking motivation and assessment quality”. Assessment in Education: Principles, Policy and Practice 17, 4, 345–356.
Furneaux, W. D. (1960) “Intellectual abilities and problem solving behaviour”. In Handbook of abnormal psychology, 167–192. H. J. Eysenck, ed. London: Pergamon Press.
Herrnstein, Richard J. and Charles Murray (1994) The Bell curve. New York: A Free Press. Jensen, Arthur (1998) The g factor: the science of mental ability. Westport: Praeger. Klein Entink, R., J. Kuhn, L. Hornke, and J. Fox (2009) “Evaluating cognitive theory: a joint model-
ing approach using responses and response times”. Psychological Methods 14, 54–75. Mislevy, Robert J. (1995a) “What can we learn from international assessments?”. Educational
Evaluation and Policy Analysis 17, 419–437. Must, Olev and Jüri Allik (2002) “Tunne oma võimeid. Abivahend eneseanalüüsiks”. [Know your
abilities: a tool for self-analysis.] Tartu: Tartu University Press. Partchev, Ivailo, Paul De Boeck, and Rolf Steyer (2011) “How much power and speed is measured
in this test?” Assessment 20, 242–252. Schnipke, Deborah L. and David J. Scrams (1997) “Modeling item response times with a two-state
mixture model: a new method of measuring speededness“. Journal of Educational Measure-ment 34, 3, 213–232.
Sheppard, Leah D. and Philip A. Vernon (2008) “Intelligence and speed of information-processing: a review of 50 years of research”. Personality and Individual Differences 44, 535–551.
Spearman, Charles E. (1927) The abilities of man: their nature and measurement. London: Macmillan and Co.
Sundre, Donna L. and Anastasia Kitsantas (2004) “An exploration of the psychology of the examinee: can examinee self-regulation and test-taking motivation predict consequential and non consequential test performance?”. Contemporary Educational Psychology 29, 1, 6–26.
Sundre, Donna L. and Deborah L. Moore (2002) “The student opinion scale: a measure of examinee motivation”. Assessment Update 14, 1, 8–9.
Thorndike, Edward L. (1927) The measurement of intelligence. New York: Bureau of Publications Teachers College, Columbia University.
Unt, Marge, Kadri Täht, Ellu Saar, and Jelena Helemäe (2013) “The expansion of higher education: devaluation or differentiation?” In Higher education at a crossroad: the case of Estonia, 367–390. Ellu Saar and René Mõttus, eds. Frankfurt am Main: Peter Lang.
Gerli Silm et al. 448
van der Linden, Wim J. (2011) “Test design and speededness”. Journal of Educational Measurement 48, 44–60.
van der Maas, H., D. Molneaar, G. Maris, R. Kievit, and D. Borsboom (2011) “Cognitive psychology meets psychometric theory: on the relation between process models for decision making and latent variable models for individual differences”. Psychological Review 118, 339–356.
Wicherts, Jelte M. and Annemarie Zand Scholten (2010) “Test anxiety and the validity of cognitive tests: a confirmatory factor analysis perspective and some empirical findings”. Intelligence 38, 169–178.
Wigfield, Allan and Jacquelynne S. Eccles (2000) “Expectancy-value theory of achievement motiva-tion”. Contemporary Educational Psychology 25, 68–81.
Wilhelm, Oliver and Ralf Schulze (2002) “The relation of speeded and unspeeded reasoning with mental speed”. Intelligence 30, 537–554.
Wise, Steven L. and Christine E. DeMars (2005) “Low examinee effort in low-stakes assessment: problems and potential solutions”. Educational Assessment 10, 1, 1–17.
Wise, Steven L. and Christine. E. DeMars (2010) “Examinee noneffort and the validity of program assessment results”. Educational Assessment 15, 1, 27–41.
Wise, Steven L. and Xiaojing Kong (2005) “Response time effort: a new measure of examinee motivation in computer-based tests”. Applied Measurement in Education 18, 163–183.
Wise, Steven L., Dena A. Pastor, and Xiaojing J. Kong (2009) “Correlates of rapid-guessing behaviour in low-stakes testing: implications for test development and measurement practice”. Applied Measurement in Education 22, 185–205
Wolf, Lisa F., Jeffrey K. Smith, and Marilyn E. Birnbaum (1995) “Consequence of performance, test motivation, and mentally taxing items”. Applied Measurement in Education 8, 4, 341–351.