Embed Size (px)
Citation preview

Test Report
Product Name : Notebook PC
Model No. : MS-N014
Marking Name : U130, U135
Applicant : Micro-Star Int’L Co., Ltd.
Address : No. 69, Li-De St., Chung-Ho City, Taipei Hsien, Taiwan
Date of Receipt : 2009.11.11
Issued Date : 2009.11.26
Report No. : 09BS046-RF-CE-P01V01
Report Version : V1.0
The test results relate only to the samples tested.The test results shown in the test report are traceable to the national/international standard through the calibration of the equipment and evaluated measurement uncertainty herein. This report must not be used to claim product endorsement by TAF, NVLAP or any agency of the Government. The test report shall not be reproduced except in full without the written approval of QuieTek Corporation.

Report No: 09BS046-RF-CE-P01V01
Page: 2 of 165
Test Report Cert i f icat ion Issued Date : 2009.11.26 Report No. : 09BS046-RF-CE-P01V01
Product Name : Notebook PC
Applicant : Micro-Star Int’L Co., Ltd.
Address : No. 69, Li-De St., Chung-Ho City, Taipei Hsien, Taiwan
Manufacturer : MSI ELECTRONICS(KUNSHANG) CO., LTD.
Model No. : MS-N014
Marking Name : U130, U135
Brand Name : msi
EUT Voltage : AC 100-240 V / 50-60 Hz
Applicable Standard : ETSI EN 301 489-1 V1.8.1 (2008)
ETSI EN 301 489-17 V1.3.2 (2008)
Test Result : Complied
Performed Location : Suzhou EMC Laboratory
No.99 Hongye Rd., Suzhou Industrial Park Loufeng
Hi-Tech Development Zone., Suzhou, China
TEL: +86-512-62515088 / FAX: +86-512-62515098
Documented By :
( Engineering ADM: Any Liu )
Reviewed By :
( Engineering Supervisor: Coffon Ye )
Approved By :
( Engineering Manager: Dream Cao )

Report No: 09BS046-RF-CE-P01V01
Page: 3 of 165
Laboratory Information
We, QuieTek Corporation, are an independent EMC and safety consultancy that was established the whole facility in our laboratories. The test facility has been accredited/accepted(audited or listed) by the following related bodies in compliance with ISO 17025, EN 45001 and specified testing scope:
The related certificate for our laboratories about the test site and management system can be downloaded from QuieTek Corporation’s Web Site : http://www.quietek.com/tw/emc/accreditations/accreditations.htm The address and introduction of QuieTek Corporation’s laboratories can be founded in our Web site : http://www.quietek.com/ If you have any comments, Please don’t hesitate to contact us. Our contact information is as below: HsinChu Testing Laboratory :
No.75-2, 3rd Lin, Wangye Keng, Yonghxing Tsuen, Qionglin Shiang, Hsinchu County 307, Taiwan, R.O.C. TEL:+886-3-592-8858 / FAX:+886-3-592-8859 E-Mail : [email protected]
LinKou Testing Laboratory :
No. 5, Ruei-Shu Valley, Ruei-Ping Tsuen, Lin-Kou Shiang, Taipei, Taiwan, R.O.C. TEL : +886-2-8601-3788 / FAX : 886-2-8601-3789 E-Mail : [email protected]
Suzhou Testing Laboratory : No.99 Hongye Rd., Suzhou Industrial Park Loufeng Hi-Tech Development Zone., SuZhou, China
TEL : +86-512-6251-5088 / FAX : 86-512-6251-5098 E-Mail : [email protected]
Taiwan R.O.C. : BSMI, NCC, TAF
Germany : TUV Rheinland
Norway : Nemko, DNV
USA : FCC, NVLAP
Japan : VCCI

Report No: 09BS046-RF-CE-P01V01
Page: 4 of 165
TABLE OF CONTENTS Description Page 1. General Information .......................................................................................................7 1.1. EUT Description .........................................................................................................7 1.2. Mode of Operation .....................................................................................................8 1.3. Tested System Details................................................................................................9 1.4. Configuration of Tested System ...............................................................................10 1.5. EUT Exercise Software ............................................................................................ 11 2. Technical Test ..............................................................................................................12 2.1. Summary of Test Result ...........................................................................................12 2.2. List of Test Equipment ..............................................................................................13 2.3. Measurement Uncertainty ........................................................................................16 2.4. Performance Criteria ................................................................................................17 3. Conducted emission ....................................................................................................21 3.1. Test Specification .....................................................................................................21 3.2. Test Setup ................................................................................................................21 3.3. Limit………………….................................................................................................21 3.4. Test Procedure .........................................................................................................23 3.5. Deviation from Test Standard ...................................................................................24 3.6. Test Result ...............................................................................................................25 3.7. Test Photograph .......................................................................................................49 4. Radiated emission .......................................................................................................53 4.1. Test Specification .....................................................................................................53 4.2. Test Setup ................................................................................................................53 4.3. Limit………………….................................................................................................54 4.4. Test Procedure .........................................................................................................54 4.5. Deviation from Test Standard ...................................................................................55 4.6. Test Result ...............................................................................................................56 4.7. Test Photograph .......................................................................................................68 5. Harmonic current emissions ........................................................................................72 5.1. Test Specification .....................................................................................................72 5.2. Test Setup ................................................................................................................72 5.3. Limit………………….................................................................................................72 5.4. Test Procedure .........................................................................................................74 5.5. Deviation from Test Standard ...................................................................................74 5.6. Test Result ...............................................................................................................75 5.7. Test Photograph .......................................................................................................79 6. Voltage fluctuations and flicker ....................................................................................80 6.1. Test Specification .....................................................................................................80

Report No: 09BS046-RF-CE-P01V01
Page: 5 of 165
6.2. Test Setup ................................................................................................................80 6.3. Limit………………….................................................................................................80 6.4. Test Procedure .........................................................................................................81 6.5. Deviation from Test Standard ...................................................................................81 6.6. Test Result ...............................................................................................................82 6.7. Test Photograph .......................................................................................................84 7. Electrostatic discharge.................................................................................................85 7.1. Test Specification .....................................................................................................85 7.2. Test Setup ................................................................................................................85 7.3. Limit………………….................................................................................................85 7.4. Test Procedure .........................................................................................................85 7.5. Deviation from Test Standard ...................................................................................86 7.6. Test Result ...............................................................................................................87 7.7. Test Photograph .......................................................................................................99 8. Radio frequency electromagnetic field.......................................................................104 8.1. Test Specification ...................................................................................................104 8.2. Test Setup ..............................................................................................................104 8.3. Limit……………….. ................................................................................................104 8.4. Test Procedure .......................................................................................................104 8.5. Deviation from Test Standard .................................................................................105 8.6. Test Result .............................................................................................................106 8.7. Test Photograph ..................................................................................................... 110 9. Fast transients common mode................................................................................... 112 9.1. Test Specification ................................................................................................... 112 9.2. Test Setup .............................................................................................................. 112 9.3. Limit……………………........................................................................................... 112 9.4. Test Procedure ....................................................................................................... 113 9.5. Deviation from Test Standard ................................................................................. 113 9.6. Test Result ............................................................................................................. 114 9.7. Test Photograph ..................................................................................................... 118 10. Surges…………… .....................................................................................................122 10.1. Test Specification ...................................................................................................122 10.2. Test Setup ..............................................................................................................122 10.3. Limit……….............................................................................................................122 10.4. Test Procedure .......................................................................................................123 10.5. Deviation from Test Standard .................................................................................123 10.6. Test Result .............................................................................................................124 10.7. Test Photograph .....................................................................................................128

Report No: 09BS046-RF-CE-P01V01
Page: 6 of 165
11. Radio frequency common mode ................................................................................130 11.1. Test Specification ...................................................................................................130 11.2. Test Setup ..............................................................................................................130 11.3. Limit…… ................................................................................................................131 11.4. Test Procedure .......................................................................................................131 11.5. Deviation from Test Standard .................................................................................132 11.6. Test Result .............................................................................................................133 11.7. Test Photograph .....................................................................................................137 12. Voltage dips and interruptions....................................................................................141 12.1. Test Specification ...................................................................................................141 12.2. Test Setup ..............................................................................................................141 12.3. Limit….. ..................................................................................................................141 12.4. Test Procedure .......................................................................................................141 12.5. Deviation from Test Standard .................................................................................142 12.6. Test Result .............................................................................................................143 12.7. Test Photograph .....................................................................................................147 13. Transients and surges ...............................................................................................149 13.1. Test Specification ...................................................................................................149 13.2. Test Setup ..............................................................................................................149 13.3. Limit…… ................................................................................................................149 13.4. Test Procedure .......................................................................................................149 13.5. Deviation from Test Standard .................................................................................150 13.6. Test Result .............................................................................................................150 14. Attachment.................................................................................................................151 EUT Photograph.....................................................................................................151
Report No: 09BS046-RF-CE-P01V01
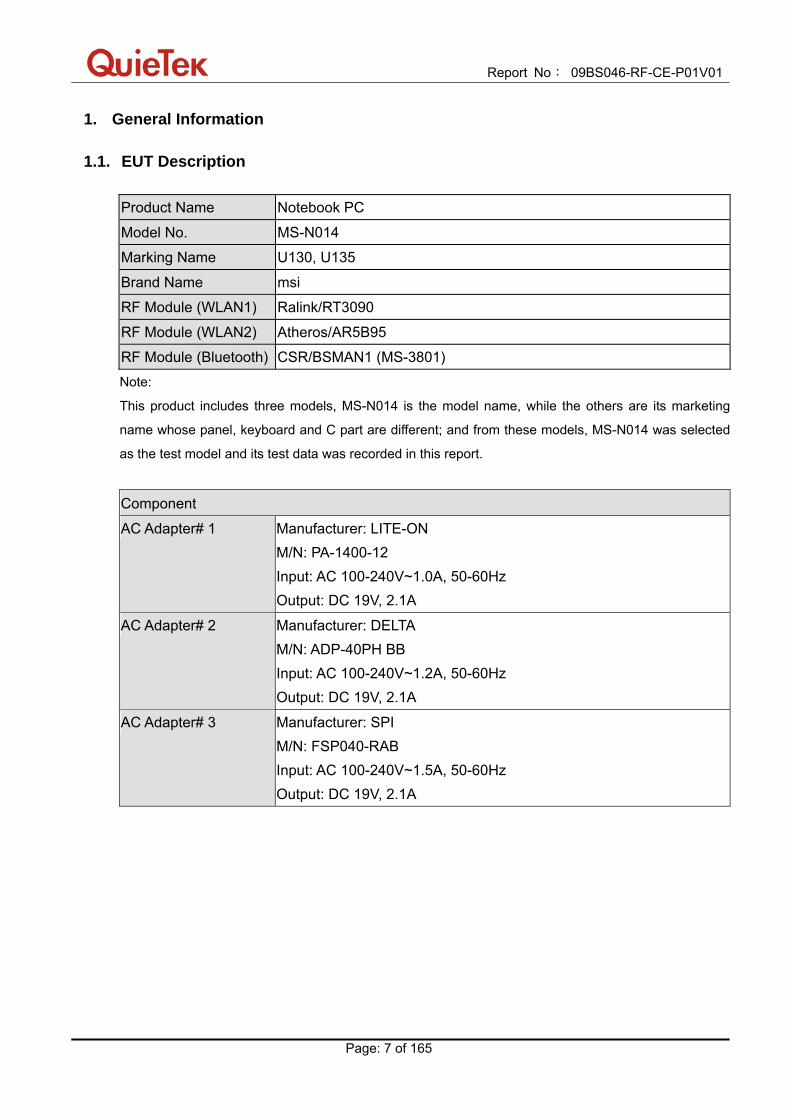
Page: 7 of 165
1. General Information 1.1. EUT Description
Product Name Notebook PC
Model No. MS-N014
Marking Name U130, U135
Brand Name msi
RF Module (WLAN1) Ralink/RT3090
RF Module (WLAN2) Atheros/AR5B95
RF Module (Bluetooth) CSR/BSMAN1 (MS-3801)
Note:
This product includes three models, MS-N014 is the model name, while the others are its marketing
name whose panel, keyboard and C part are different; and from these models, MS-N014 was selected
as the test model and its test data was recorded in this report.
Component
AC Adapter# 1 Manufacturer: LITE-ON M/N: PA-1400-12 Input: AC 100-240V~1.0A, 50-60Hz Output: DC 19V, 2.1A
AC Adapter# 2 Manufacturer: DELTA M/N: ADP-40PH BB Input: AC 100-240V~1.2A, 50-60Hz Output: DC 19V, 2.1A
AC Adapter# 3 Manufacturer: SPI M/N: FSP040-RAB Input: AC 100-240V~1.5A, 50-60Hz Output: DC 19V, 2.1A

Report No: 09BS046-RF-CE-P01V01
Page: 8 of 165
1.2. Mode of Operation QuieTek has verified the construction and function in typical operation. All the test modes were carried out with the EUT in normal operation, which was shown in this test report and defined as: Test Mode
Mode 1: Transmission Data by WLAN1 and Bluetooth Emission
Mode 3: Transmission Data by WLAN2 and Bluetooth
Mode 1: Transmission Data by WLAN1 + Bluetooth
Mode 2: Standby
Mode 3: Transmission Data by WLAN2 and Bluetooth Immunity
Mode 4: Standby

Report No: 09BS046-RF-CE-P01V01
Page: 9 of 165
1.3. Tested System Details The types for all equipments, plus descriptions of all cables used in the tested system (including inserted cards) are:
Product Manufacturer Model No. Serial No. Power Cord
1 Printer EPSON B241A 7094256 Non-Shielded, 1.8m
2 CRT ‘’21 IBM 6652-U3N 1 Non-Shielded, 1.8m
3 iPod Apple A1199 6U715YSVVQ5 Power by PC
4 Microphone & Earphone SALAR N/A 4 N/A
5 USB Mouse DELL MO56UOA GOQ02414 Power by PC
6 SD Card Kingston 1GB N/A N/A
7 MacBook Apple MB061CH W8732B4TZ5V Power by adapter
8 Notebook DELL PP19L JH097 A01 Power by adapter

Report No: 09BS046-RF-CE-P01V01
Page: 10 of 165
1.4. Configuration of Tested System
Connection Diagram
Signal Cable Type Signal cable Description A USB Cable Shielded, 1.8m B D-Sub Cable Shielded, 1.8m, with two ferrite cores Bonded C USB Cable Shielded, 1.0m D Earphone & Microphone Cable Non-Shielded, 1.8m E USB Cable Shielded, 1.8m F LAN Cable Non-Shielded, >10m
Report No: 09BS046-RF-CE-P01V01
Page: 11 of 165
1.5. EUT Exercise Software
1 Setup the EUT and simulators as shown on above.
2 Turn on the power of all equipment.
3 EUT will send and receive data through LAN using “Ping” function.
4 EUT communicates with another Notebook P.C. by WLAN and Bluetooth.
5 Execute the HDD running Program using Burn In Test 5.1 software.
6 Run EMC test program using Burn In Test 5.1 software and send “H” pattern to the monitor.
7 Open the camera and play music using Media player program.

Report No: 09BS046-RF-CE-P01V01
Page: 12 of 165
2. Technical Test 2.1. Summary of Test Result
No deviations from the test standards Deviations from the test standards as below description:
Emission
Performed Test Item Normative References Test Performed Deviation
Conducted emission EN 55022: 2006
CISPR 25: 2002
Yes No
Radiated emission EN 55022: 2006 Yes No
Harmonic current emissions EN 61000-3-2: 2006 Yes No
Voltage fluctuations and flicker EN 61000-3-3: 1995+A1: 2001+A2: 2005 Yes No
Immunity
Performed Test Item Normative References Test Performed Deviation
Electrostatic discharge EN 61000-4-2: 2001 Yes No
Radio frequency electromagnetic
field
EN 61000-4-3: 2006 Yes No
Fast transients common mode EN 61000-4-4: 2004 Yes No
Surges EN 61000-4-5: 2006 Yes No
Radio frequency common mode EN 61000-4-6: 2005 Yes No
Voltage dips and interruptions EN 61000-4-11: 2004 Yes No
Transients and surges ISO 7637-2: 2004 N/A N/A

Report No: 09BS046-RF-CE-P01V01
Page: 13 of 165
2.2. List of Test Equipment Conducted disturbance / SR-1 Instrument Manufacturer Model No. Serial No. Calibrated Date EMI Test Receiver R&S ESCI 100726 2009.04.23 Two-Line V-Network R&S ENV216 100013 2009.06.11 Two-Line V-Network R&S ENV216 100014 2009.04.23 Balanced Telecom ISN Fischer FCC-TLISN-T2-02 20352 2009.02.03 Balanced Telecom ISN Fischer FCC-TLISN-T4-02 20353 2009.02.03 Balanced Telecom ISN Fischer FCC-TLISN-T8-02 20354 2009.02.03 Current Probe R&S EZ-17 100255 2009.04.18 50ohm Termination SHX TF2 07081401 2009.09.29 50ohm Termination SHX TF2 07081402 2009.09.29 50ohm Termination SHX TF2 07081403 2009.09.15 50ohm Coaxial Switch Anritsu MP59B 6200464462 2009.11.26 Coaxial Cable Suhner RG 223 SR1-C1 2009.05.25 Temperature/Humidity Meter zhicheng ZC1-2 SR1-TH 2009.03.31 Radiated disturbance / AC-1 Instrument Manufacturer Model No. Serial No. Calibrated Date Spectrum Analyzer Agilent E4403B MY45102715 N/A Spectrum Analyzer Agilent E4403B MY45102798 N/A Spectrum Analyzer Agilent N9010A MY48030494 2009.04.23 EMI Test Receiver R&S ESCI 100175 2009.11.11 Preamplifier Quietek AP-025C CHM-0511006 2009.05.25 Preamplifier Quietek AP-025C CHM-0609028 2009.05.25 Preamplifier Quietek AP-180C CHM-0602013 2009.05.25 Bilog Antenna Schaffner CBL6112B 2933 2009.11.12 Bilog Antenna Schaffner CBL6112B 2931 2009.11.12 Broad-Band Horn Antenna Schwarzbeck BBHA9120D 499 2009.06.11 50ohm Coaxial Switch Anritsu MP59B 6200447303 2009.11.26 50ohm Coaxial Switch Anritsu MP59B 6200464461 2009.11.26 50ohm Coaxial Switch Anritsu MP59B 6200447305 2009.11.26 Coaxial Cable Huber+Suhner SUCOFLEX 106 AC1-L 2009.05.25 Coaxial Cable Huber+Suhner SUCOFLEX 106 AC1-R 2009.05.25 Coaxial Cable Huber+Suhner SUCOFLEX 106 AC1-C 2009.05.25 Temperature/Humidity Meter zhicheng ZC1-2 AC1-TH 2009.03.31 Radiated disturbance / AC-2 Instrument Manufacturer Model No. Serial No. Calibrated Date EMI Test Receiver R&S ESCI 100573 2009.04.23 Bilog Antenna Teseq GmbH CBL6112D 27611 2009.11.12 Coaxial Cable Huber+Suhner SUCOFLEX 106 AC2-C 2009.05.25 Temperature/Humidity Meter zhicheng ZC1-2 AC2-TH 2009.03.31 Radiated disturbance / AC-3 Instrument Manufacturer Model No. Serial No. Calibrated Date EMI Test Receiver R&S ESCI 100176 2009.11.11 Bilog Antenna Teseq GmbH CBL6112D 27613 2009.11.12 Coaxial Cable Huber+Suhner SUCOFLEX 106 AC3-C 2009.05.25 Temperature/Humidity Meter zhicheng ZC1-2 AC3-TH 2009.03.31

Report No: 09BS046-RF-CE-P01V01
Page: 14 of 165
Radiated disturbance / AC-5 Instrument Manufacturer Model No. Serial No. Calibrated Date Spectrum Analyzer Agilent N9010A MY48030494 2009.04.23 EMI Test Receiver R&S ESCI 100906 2009.02.16 Preamplifier Quietek AP-180C CHM-0602013 2009.05.25 Bilog Antenna Teseq GmbH CBL6112D 27612 2009.11.12 Broad-Band Horn Antenna Schwarzbeck BBHA9120D 499 2009.06.11 Coaxial Cable Huber+Suhner SUCOFLEX 106 AC5-C1 2009.05.25 Temperature/Humidity Meter zhicheng ZC1-2 AC5-TH 2009.03.31 Harmonic current emissions / SR-1 Instrument Manufacturer Model No. Serial No. Calibrated Date Power Analyzer California PACS-1 72419 2009.11.11 AC Power Source California 5001iX-208 56741 2009.11.11 Temperature/Humidity Meter zhicheng ZC1-2 SR1-TH 2009.03.31 Voltage fluctuation and flicker / SR-1 Instrument Manufacturer Model No. Serial No. Calibrated Date Power Analyzer California PACS-1 72419 2009.11.11 AC Power Source California 5001iX-208 56741 2009.11.11 Temperature/Humidity Meter zhicheng ZC1-2 SR1-TH 2009.03.31 Electrostatic discharge / SR-3 Instrument Manufacturer Model No. Serial No. Calibrated Date ESD Simulator EM TEST Dito V0616101367 2009.08.07 ESD Simulator EMC PARTNER ESD3000DN1 140 2009.05.05 Barometer Fengyun DYM3 0506048 2008.12.07 Temperature/Humidity Meter zhicheng ZC1-2 SR3-TH 2009.03.31 Radio frequency electromagnetic field / AC-4 Instrument Manufacturer Model No. Serial No. Calibrated Date Signal Generator R&S SML03 102324 2009.10.21 Power Meter Boonton 4231A 144502 2009.10.21 Power Sensor Boonton 51011-EMC 33859 2009.10.21 RF Switch Network Schaffner RFS N100 21799 N/A Power Amplifier Schaffner CBA9413B 43526 NA Power Amplifier Schaffner CBA9428 43516 NA Directional Coupler Schaffner CHA 9652B 0121 N/A Directional Coupler A&R DC7144A 312249 N/A Electric Field Probe Type 8.3 narda 2244/90.21 AZ-0030 2009.06.11 Electromagnetic Radiation Meter
narda 2244/70 AW-0074 2009.06.11
Bilog Antenna Schaffner CBL6141A 4278 N/A Horn Antenna A&R AT4002A 312312 N/A Temperature/Humidity Meter Zhicheng ZC1-2 AC4-TH 2009.03.31 Fast transients common mode / SR-2 Instrument Manufacturer Model No. Serial No. Calibrated Date Immunity Test System KeyTek EMCpro PLUS 508273 2009.04.23 CCL KeyTek CCL 0510181 2009.04.23 Temperature/Humidity Meter zhicheng ZC1-2 SR2-TH 2009.03.31

Report No: 09BS046-RF-CE-P01V01
Page: 15 of 165
Surges / SR-2 Instrument Manufacturer Model No. Serial No. Calibrated Date Immunity Test System KeyTek EMCpro PLUS 508273 2009.04.23 Coupler/Decoupler Telecom Line
KeyTek CM-TELCD 0506277 N/A
Coupler/Decoupler Signal Line
KeyTek CM-I/OCD 0508206 N/A
Temperature/Humidity Meter zhicheng ZC1-2 SR2-TH 2009.03.31 Radio frequency common mode / SR-2 Instrument Manufacturer Model No. Serial No. Calibrated Date RF-Generator Schaffner NSG2070 1120 2009.11.11 Attenuator Schaffner INA2070-1 2120 2009.11.11 Coupling / Decoupling Network
Schaffner CDN M016 21249 2009.11.11
Coupling / Decoupling Network
Teseq GmbH CDN M016 24484 2009.09.01
Coupling / Decoupling Network
Schaffner CDN T400 19083 2009.11.11
Coupling / Decoupling Network
Teseq GmbH CDN T400 22461 2009.09.01
Coupling / Decoupling Network
Teseq GmbH CDN T800 26167 2009.09.03
Temperature/Humidity Meter zhicheng ZC1-2 SR2-TH 2009.03.31 Voltage dips and interruptions / SR-2 Instrument Manufacturer Model No. Serial No. Calibrated Date Immunity Test System KeyTek EMCpro PLUS 508273 2009.04.23 Temperature/Humidity Meter zhicheng ZC1-2 SR2-TH 2009.03.31 * Transients and Surges / No.4 Shielded Rom Instrument Manufacturer Model No. Serial No. Calibrated Date Transient Generator Schaffner MT5510-750-0034 67 2009.11.01 Burst Generator Schaffner FT5530-70-0033r01 74 2009.11.01 Load Dump Generator Schaffner LD5505-750-0045r01 35 2009.11.01 Impedance Generator Schaffner RM5505-750-057r01 14 2009.11.01 Power Amplifier Generator Schaffner PA5840-75 / 581-0005 2009.11.01 Function/Wave Generator
Schaffner FG5620-750-0051-00 35 2009.11.01
Note: “*” means this test item is performed in HsinChu EMC Testing Laboratory of Quietek.

Report No: 09BS046-RF-CE-P01V01
Page: 16 of 165
2.3. Measurement Uncertainty
Conducted emission
The maximum measurement uncertainty is evaluated as ± 3.48dB.
Radiated emission
The maximum measurement uncertainty is evaluated as ± 4.27dB.
Harmonic current emissions The maximum measurement uncertainty is evaluated as ± 0.2%.
Voltage fluctuation and flicker The maximum measurement uncertainty is evaluated as dc and dmax: ± 0.095%, Pst and Plt: ± 4%, d(t): ± 1.5%
Electrostatic discharge The maximum measurement uncertainty is evaluated as Voltage: ± 1.63%, Time: ± 2.76%.
Radio frequency electromagnetic field The maximum measurement uncertainty is evaluated as ± 2.72dB.
Fast transients common mode The maximum measurement uncertainty is evaluated as Voltage: ± 1.63%, Frequency: ± 2.8 x 10⁻¹⁰, Time: ± 2.76%.
Surges The maximum measurement uncertainty is evaluated as Voltage: ± 1.63%, Time: ± 2.76%.
Radio frequency common mode The maximum measurement uncertainty is evaluated as ± 3.72dB.
Voltage dips and interruptions The maximum measurement uncertainty is evaluated as Voltage: ± 1.63%, Time: ± 2.76%.
Transients and surges The maximum measurement uncertainty is evaluated as Voltage: ± 1.60%, Time: ± 2.60%.

Report No: 09BS046-RF-CE-P01V01
Page: 17 of 165
2.4. Performance Criteria The performance criteria criteria are used to take a decision on whether a radio equipment passes or fails immunity tests. For the purpose of the present document four categories of performance criteria apply:
performance criteria for continuous phenomena applied to transmitters; performance criteria for transient phenomena applied to transmitters; performance criteria for continuous phenomena applied to receivers; performance criteria for transient phenomena applied to receivers.
Normally, the performance criteria depend on the type of radio equipment. Thus, the present document only contains general performance criteria commonly used for the assessment of radio equipment. More specific and product-related performance criteria for a dedicated type of radio equipment may be found in the part of EN 301 489 series [11] dealing with the particular type of radio equipment. (1) Performance criteria for continuous phenomena applied to transmitters and receivers If no further details are given in the relevant part of EN 301 489 series [11] dealing with the particular type of radio equipment, the following general performance criteria for continuous phenomena shall apply. During and after the test, the apparatus shall continue to operate as intended. No degradation of performance or loss of function is allowed a permissible performance level specified by the manufacturer when the apparatus is used as intended. In some cases this permissible performance level may be replaced by a permissible loss of performance. During the test the EUT shall not unintentionally transmit or change its actual operating state and stored data. If the minimum performance level or the permissible performance loss is not specified by the manufacturer, then either of these may be deduced from the product description and documentation and what the user may reasonably expect from the apparatus if used as intended. (2) Performance criteria for transient phenomena applied to transmitters and receivers If no further details are given in the relevant part of EN 301 489 series [11] dealing with the particular type of radio equipment, the following general performance criteria for transient phenomena shall apply. After the test, the apparatus shall continue to operate as intended. No degradation of performance or loss of function is allowed below a permissible performance level specified by the manufacturer, when the apparatus is used as intended. In some cases this permissible performance level may be replaced by a permissible loss of performance. During the EMC exposure to an electromagnetic phenomenon, a degradation of performance is, however, allowed. No change of the actual mode of operation (e.g. unintended transmission) or
Report No: 09BS046-RF-CE-P01V01
Page: 18 of 165
stored data is allowed. If the minimum performance level or the permissible performance loss is not specified by the manufacturer, then either of these may be deduced from the product description and documentation and what the user may reasonably expect from the apparatus if used as intended. (3) Performance criteria for equipment which does not provide a continuous communication
link For radio equipment which does not provide a continuous communication link, the performance criteria described in clauses (1) and (2) are not appropriate, then the manufacturer shall declare, for inclusion in the test report, his own specification for an acceptable level of performance or degradation of performance during and/or after the immunity tests. The performance specification shall be included in the product description and documentation. The related specifications set out in clause 5.3 of EN 301 489-1 V1.8.1 (2008-04) have also to be taken into account. The performance criteria specified by the manufacturer shall give the same degree of immunity protection as called for in clauses (1) and (2). (4) Performance criteria for ancillary equipment tested on a stand alone basis If ancillary equipment is intended to be tested on a stand alone basis, the performance criteria described in clauses (1) and (2) are not appropriate, then the manufacturer shall declare, for inclusion in the test report, his own specification for an acceptable level of performance or degradation of performance during and/or after the immunity tests. The performance specification shall be included in the product description and documentation. The related specifications set out in clause 5.3 of EN 301 489-1 V1.8.1 (2008-04) have also to be taken into account. The performance criteria specified by the manufacturer shall give the same degree of immunity protection as called for in clauses (1) and (2).

Report No: 09BS046-RF-CE-P01V01
Page: 19 of 165
General performance criteria The performance criteria are: performance criteria A for immunity tests with phenomena of a continuous nature; performance criteria B for immunity tests with phenomena of a transient nature; performance criteria C for immunity tests with power interruptions exceeding a certain time.
The equipment shall meet the minimum performance criteria as specified in the following clauses.
Performance criteria for Continuous phenomena applied toTransmitters (CT) The performance criteria A shall apply. Tests shall be repeated with the EUT in standby mode (if applicable) to ensure that unintentional transmission does not occur. In systems using acknowledgement signals, it is recognized that an ACKnowledgement (ACK) or Not ACKnowledgement (NACK) transmission may occur, and steps should be taken to ensure that any transmission resulting from the application of the test is correctly interpreted.
Performance criteria for Transient phenomena applied to Transmitters (TT) The performance criteria B shall apply, except for voltage dips of 100 ms and voltage interruptions of 5 000 ms duration, for which performance criteria C shall apply. Tests shall be repeated with the EUT in standby mode (if applicable) to ensure that unintentional transmission does not occur. In systems using acknowledgement signals, it is recognized that an acknowledgement (ACK) or not-acknowledgement (NACK) transmission may occur, and steps should be taken to ensure that any transmission resulting from the application of the test is correctly interpreted.
Performance criteria for Continuous phenomena applied to Receivers (CR) The performance criteria A shall apply. Where the EUT is a transceiver, under no circumstances, shall the transmitter operate unintentionally during the test. In systems using acknowledgement signals, it is recognized that an ACK or NACK transmission may occur, and steps should be taken to ensure that any transmission resulting from the application of the test is correctly interpreted.
Performance criteria for Transient phenomena applied to Receivers (TR) The performance criteria B shall apply, except for voltage dips of 100 ms and voltage interruptions of 5 000 ms duration for which performance criteria C shall apply. Where the EUT is a transceiver, under no circumstances, shall the transmitter operate unintentionally during the test. In systems using acknowledgement signals, it is recognized that an ACK or NACK transmission may occur, and steps should be taken to ensure that any transmission resulting from the application of the test is correctly interpreted.

Report No: 09BS046-RF-CE-P01V01
Page: 20 of 165
Performance criteria Criteria During Test After test
A Shall operate as intended May show degradation of performance (see note 1) Shall be no loss of function Shall be no unintentional transmissions
Shall operate as intended Shall be no degradation of performance (see note 2) Shall be no loss of function Shall be no loss of stored data or user programmable functions
B May show loss of function (one or more) May show degradation of performance (see note 1) No unintentional transmission
Functions shall be self-recoverable Shall operate as intended after recoveringShall be no degradation of performance (see note 2) Shall be no loss of stored data or user programmable functions
C May be loss of function (one or more)
Functions shall be recoverable by the operator Shall operate as intended after recoveringShall be no degradation of performance (see note 2)
NOTE 1: Degradation of performance during the test is understood as a degradation to a level not below a minimum performance level specified by the manufacturer for the use of the apparatus as intended. In some cases the specified minimum performance level may be replaced by a permissible degradation of performance. If the minimum performance level or the permissible performance degradation is not specified by the manufacturer then either of these may be derived from the product description and documentation (including leaflets and advertising) and what the user may reasonably expect from the apparatus if used as intended.
NOTE 2: No degradation of performance after the test is understood as no degradation below a minimum performance level specified by the manufacturer for the use of the apparatus as intended. In some cases the specified minimum performance level may be replaced by a permissible degradation of performance. After the test no change of actual operating data or user retrievable data is allowed. If the minimum performance level or the permissible performance degradation is not specified by the manufacturer then either of these may be derived from the product description and documentation (including leaflets and advertising) and what the user may reasonably expect from the apparatus if used as intended.

Report No: 09BS046-RF-CE-P01V01
Page: 21 of 165
3. Conducted emission
3.1. Test Specification
According to EMC Standard: EN 55022
3.2. Test Setup
3.3. Limit
Limits of conducted emission for AC mains power input/output ports
Limits dB(μV) Frequency range
MHz Quasi-peak Average
0.15 to 0.50 66 to 56 56 to 46
0.50 to 5 56 46
5 to 30 60 50
NOTE 1: The lower limit shall apply at the transition frequencies. NOTE 2: The limit decreases linearly with the logarithm of the frequency in the range 0.15MHz to 0.50MHz.
Limits of conducted emission for DC power input/output ports

Report No: 09BS046-RF-CE-P01V01
Page: 22 of 165
Limits dB(μV) Frequency range
MHz Quasi-peak Average
0.15 to 0.50 66 to 56 56 to 46
0.50 to 5 56 46
5 to 30 60 50
NOTE 1: The lower limit shall apply at the transition frequencies. NOTE 2: The limit decreases linearly with the logarithm of the frequency in the range 0.15MHz to 0.50MHz.
Equipment intended to be used in telecommunication centres only
Limits dB(μV) Frequency range
MHz Quasi-peak Average
0.15 to 0.50 79 66
0.50 to 30 73 60
NOTE: The lower limit shall apply at the transition frequency. Limits of conducted emission for DC power input/output ports
Limits of conducted emission for telecommunication ports
Voltage Limits dB(μV)
Current limits dB(μA) Frequency range
MHz Quasi-peak Average Quasi-peak Average
0.15 to 0.50 84 to 74 74 to 64 40 to 30 30 to 20
0.50 to 30 74 64 30 20
NOTE 1: The limits decrease linearly with the logarithm of the frequency in the range 0.15MHz to 0.5MHz. NOTE 2: The current and voltage disturbance limits are derived for use with an impedance stabilization network (ISN) which presents a common mode (asymmetric mode) impedance of 150Ω to the telecommunication port under test (conversion factor is 20 log10150 / I = 44dB).
Equipment intended to be used in telecommunication centres only
Voltage Limits dB(μV)
Current limits dB(μA) Frequency range
MHz Quasi-peak Average Quasi-peak Average
0.15 to 0.50 97 to 87 84 to 74 53 to 43 40 to 30

Report No: 09BS046-RF-CE-P01V01
Page: 23 of 165
0.50 to 30 87 74 43 30
NOTE 1: The limits decrease linearly with the logarithm of the frequency in the range 0.15MHz to 0.5MHz. NOTE 2: The current and voltage disturbance limits are derived for use with an impedance stabilization network (ISN) which presents a common mode (asymmetric mode) impedance of 150Ω to the telecommunication port under test (conversion factor is 20 log10150 / I = 44dB).
3.4. Test Procedure For AC mains power input/output ports: The EUT and simulators are connected to the main power through a line impedance stabilization network (L.I.S.N.). This provides a 50Ω / 50μH or 50Ω / 50μH + 5Ω coupling impedance for the measuring equipment. The peripheral devices are also connected to the main power through a LISN that provides a 50Ω / 50μH or 50Ω / 50μH + 5Ω coupling mpedance with 50Ω termination. Both sides of A.C. line are checked for maximum conducted interference. Conducted emissions were invested over the frequency range from 0.15MHz to 30MHz using a receiver bandwidth of 9kHz. For DC power input/output ports: The EUT and simulators are connected to the main power through a Artificial Mains Networks (AMN). For radio and ancillary equipment for fixed use, the Artificial Mains Networks (AMN) as specified in EN 55022 [1] shall be used and be connected to a DC power source. For mobile radio and ancillary equipment intended to be connected to the vehicles’s onboard DC mains, an Artificial Network (AN) as specified in CISPR 25 [10] shall be used and be connected to a DC power source. Both sides of lines are checked for maximum conducted interference. Conducted emissions were invested over the frequency range from 0.15MHz to 30MHz using a receiver bandwidth of 9kHz. For telecommunication ports:
The mains voltage shall be supplied to the EUT via the LISN when the measurement of telecommunication port is performed. The common mode disturbances at the telecommunication port shall be connected to the ISN, which is 150Ω impedance. Both alternative cables are tested related to the LCL requested. Conducted emissions were invested over the frequency range from 0.15MHz to 30MHz using a receiver bandwidth of 9kHz.

Report No: 09BS046-RF-CE-P01V01
Page: 24 of 165
3.5. Deviation from Test Standard No deviation.
Report No: 09BS046-RF-CE-P01V01
Page: 25 of 165
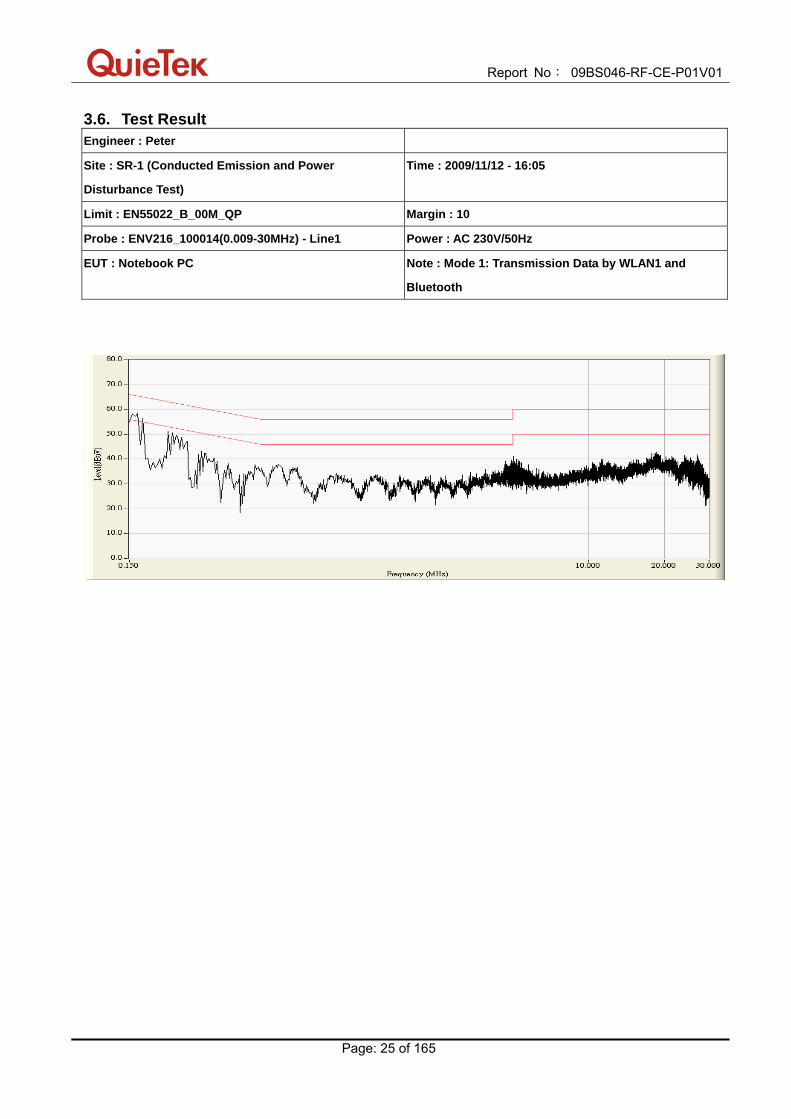
3.6. Test Result Engineer : Peter
Site : SR-1 (Conducted Emission and Power
Disturbance Test)
Time : 2009/11/12 - 16:05
Limit : EN55022_B_00M_QP Margin : 10
Probe : ENV216_100014(0.009-30MHz) - Line1 Power : AC 230V/50Hz
EUT : Notebook PC Note : Mode 1: Transmission Data by WLAN1 and
Bluetooth

Report No: 09BS046-RF-CE-P01V01
Page: 26 of 165
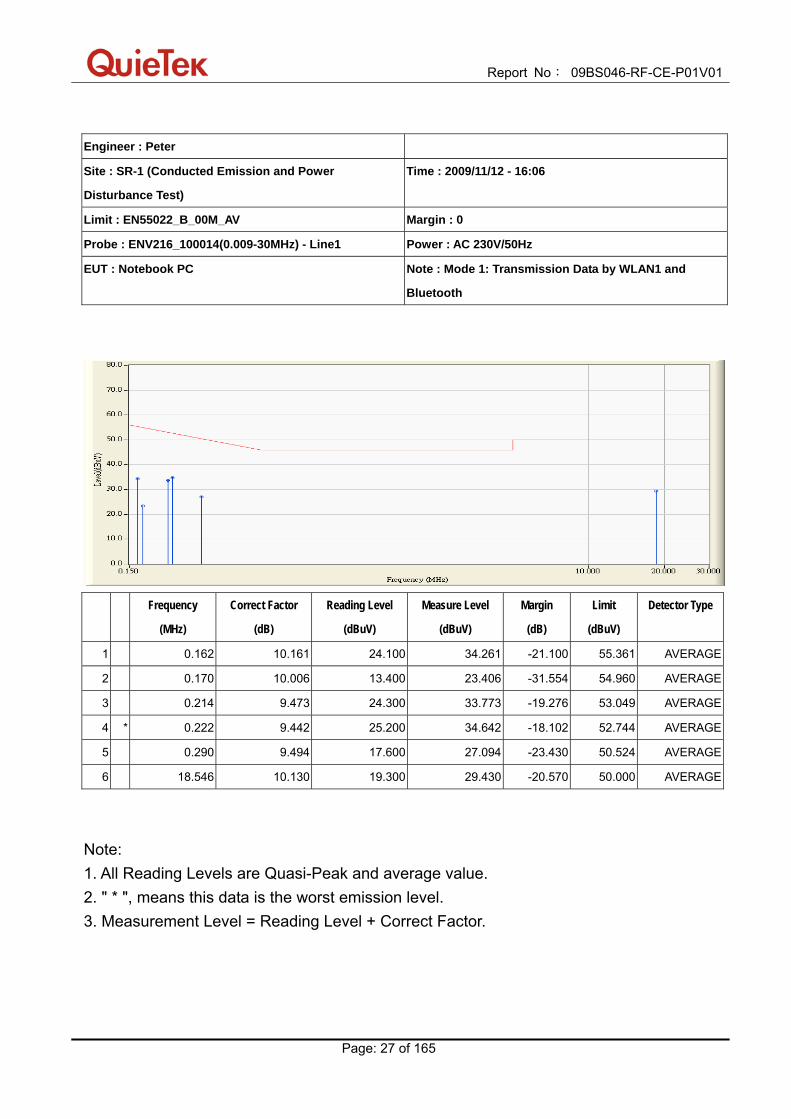
Engineer : Peter
Site : SR-1 (Conducted Emission and Power
Disturbance Test)
Time : 2009/11/12 - 16:06
Limit : EN55022_B_00M_QP Margin : 0
Probe : ENV216_100014(0.009-30MHz) - Line1 Power : AC 230V/50Hz
EUT : Notebook PC Note : Mode 1: Transmission Data by WLAN1 and
Bluetooth
Frequency
(MHz)
Correct Factor
(dB)
Reading Level
(dBuV)
Measure Level
(dBuV)
Margin
(dB)
Limit
(dBuV)
Detector Type
1 * 0.162 10.161 42.900 53.061 -12.300 65.361 QUASIPEAK
2 0.170 10.006 36.300 46.306 -18.654 64.960 QUASIPEAK
3 0.214 9.473 37.700 47.173 -15.876 63.049 QUASIPEAK
4 0.222 9.442 37.200 46.642 -16.102 62.744 QUASIPEAK
5 0.290 9.494 29.500 38.994 -21.530 60.524 QUASIPEAK
6 18.546 10.130 25.500 35.630 -24.370 60.000 QUASIPEAK
Note: 1. All Reading Levels are Quasi-Peak and average value. 2. " * ", means this data is the worst emission level. 3. Measurement Level = Reading Level + Correct Factor.
Report No: 09BS046-RF-CE-P01V01
Page: 27 of 165
Engineer : Peter
Site : SR-1 (Conducted Emission and Power
Disturbance Test)
Time : 2009/11/12 - 16:06
Limit : EN55022_B_00M_AV Margin : 0
Probe : ENV216_100014(0.009-30MHz) - Line1 Power : AC 230V/50Hz
EUT : Notebook PC Note : Mode 1: Transmission Data by WLAN1 and
Bluetooth
Frequency
(MHz)
Correct Factor
(dB)
Reading Level
(dBuV)
Measure Level
(dBuV)
Margin
(dB)
Limit
(dBuV)
Detector Type
1 0.162 10.161 24.100 34.261 -21.100 55.361 AVERAGE
2 0.170 10.006 13.400 23.406 -31.554 54.960 AVERAGE
3 0.214 9.473 24.300 33.773 -19.276 53.049 AVERAGE
4 * 0.222 9.442 25.200 34.642 -18.102 52.744 AVERAGE
5 0.290 9.494 17.600 27.094 -23.430 50.524 AVERAGE
6 18.546 10.130 19.300 29.430 -20.570 50.000 AVERAGE
Note: 1. All Reading Levels are Quasi-Peak and average value. 2. " * ", means this data is the worst emission level. 3. Measurement Level = Reading Level + Correct Factor.

Report No: 09BS046-RF-CE-P01V01
Page: 28 of 165
Engineer : Peter
Site : SR-1 (Conducted Emission and Power
Disturbance Test)
Time : 2009/11/12 - 16:08
Limit : EN55022_B_00M_QP Margin : 10
Probe : ENV216_100014(0.009-30MHz) - Line2 Power : AC 230V/50Hz
EUT : Notebook PC Note : Mode 1: Transmission Data by WLAN1 and
Bluetooth

Report No: 09BS046-RF-CE-P01V01
Page: 29 of 165
Engineer : Peter
Site : SR-1 (Conducted Emission and Power
Disturbance Test)
Time : 2009/11/12 - 16:09
Limit : EN55022_B_00M_QP Margin : 0
Probe : ENV216_100014(0.009-30MHz) - Line2 Power : AC 230V/50Hz
EUT : Notebook PC Note : Mode 1: Transmission Data by WLAN1 and
Bluetooth
Frequency
(MHz)
Correct Factor
(dB)
Reading Level
(dBuV)
Measure Level
(dBuV)
Margin
(dB)
Limit
(dBuV)
Detector Type
1 * 0.154 10.017 41.800 51.817 -13.964 65.781 QUASIPEAK
2 0.194 9.680 35.500 45.180 -18.684 63.864 QUASIPEAK
3 0.222 9.580 35.500 45.080 -17.664 62.744 QUASIPEAK
4 0.262 9.584 28.900 38.484 -22.884 61.368 QUASIPEAK
5 11.238 9.930 26.400 36.330 -23.670 60.000 QUASIPEAK
6 18.350 10.160 25.800 35.960 -24.040 60.000 QUASIPEAK
Note: 1. All Reading Levels are Quasi-Peak and average value. 2. " * ", means this data is the worst emission level. 3. Measurement Level = Reading Level + Correct Factor.

Report No: 09BS046-RF-CE-P01V01
Page: 30 of 165
Engineer : Peter
Site : SR-1 (Conducted Emission and Power
Disturbance Test)
Time : 2009/11/12 - 16:09
Limit : EN55022_B_00M_AV Margin : 0
Probe : ENV216_100014(0.009-30MHz) - Line2 Power : AC 230V/50Hz
EUT : Notebook PC Note : Mode 1: Transmission Data by WLAN1 and
Bluetooth
Frequency
(MHz)
Correct Factor
(dB)
Reading Level
(dBuV)
Measure Level
(dBuV)
Margin
(dB)
Limit
(dBuV)
Detector Type
1 0.154 10.017 24.400 34.417 -21.364 55.781 AVERAGE
2 0.194 9.680 20.700 30.380 -23.484 53.864 AVERAGE
3 0.222 9.580 23.600 33.180 -19.564 52.744 AVERAGE
4 0.262 9.584 17.300 26.884 -24.484 51.368 AVERAGE
5 * 11.238 9.930 21.500 31.430 -18.570 50.000 AVERAGE
6 18.350 10.160 19.600 29.760 -20.240 50.000 AVERAGE
Note: 1. All Reading Levels are Quasi-Peak and average value. 2. " * ", means this data is the worst emission level. 3. Measurement Level = Reading Level + Correct Factor.

Report No: 09BS046-RF-CE-P01V01
Page: 31 of 165
Engineer : Peter
Site : SR-1 (Conducted Emission and Power
Disturbance Test)
Time : 2009/11/16 - 16:35
Limit : EN55022_B_00M_QP Margin : 10
Probe : ENV216_100014(0.009-30MHz) - Line1 Power : AC 230V/50Hz
EUT : Notebook PC Note : Mode 3: Transmission Data by WLAN2 and
Bluetooth

Report No: 09BS046-RF-CE-P01V01
Page: 32 of 165
Engineer : Peter
Site : SR-1 (Conducted Emission and Power
Disturbance Test)
Time : 2009/11/16 - 16:38
Limit : EN55022_B_00M_QP Margin : 0
Probe : ENV216_100014(0.009-30MHz) - Line1 Power : AC 230V/50Hz
EUT : Notebook PC Note : Mode 3: Transmission Data by WLAN2 and
Bluetooth
Frequency
(MHz)
Correct Factor
(dB)
Reading Level
(dBuV)
Measure Level
(dBuV)
Margin
(dB)
Limit
(dBuV)
Detector Type
1 * 0.154 10.187 44.800 54.987 -10.794 65.781 QUASIPEAK
2 0.238 9.453 35.800 45.253 -16.913 62.166 QUASIPEAK
3 0.250 9.461 33.600 43.061 -18.696 61.757 QUASIPEAK
4 0.298 9.503 26.700 36.202 -24.096 60.298 QUASIPEAK
5 5.102 9.880 23.600 33.480 -26.520 60.000 QUASIPEAK
6 25.330 10.370 25.000 35.370 -24.630 60.000 QUASIPEAK
Note: 1. All Reading Levels are Quasi-Peak and average value. 2. " * ", means this data is the worst emission level. 3. Measurement Level = Reading Level + Correct Factor.

Report No: 09BS046-RF-CE-P01V01
Page: 33 of 165
Engineer : Peter
Site : SR-1 (Conducted Emission and Power
Disturbance Test)
Time : 2009/11/16 - 16:38
Limit : EN55022_B_00M_AV Margin : 0
Probe : ENV216_100014(0.009-30MHz) - Line1 Power : AC 230V/50Hz
EUT : Notebook PC Note : Mode 3: Transmission Data by WLAN2 and
Bluetooth
Frequency
(MHz)
Correct Factor
(dB)
Reading Level
(dBuV)
Measure Level
(dBuV)
Margin
(dB)
Limit
(dBuV)
Detector Type
1 * 0.154 10.187 30.200 40.387 -15.394 55.781 AVERAGE
2 0.238 9.453 24.400 33.853 -18.313 52.166 AVERAGE
3 0.250 9.461 18.400 27.861 -23.896 51.757 AVERAGE
4 0.298 9.503 14.500 24.002 -26.296 50.298 AVERAGE
5 5.102 9.880 12.400 22.280 -27.720 50.000 AVERAGE
6 25.330 10.370 16.700 27.070 -22.930 50.000 AVERAGE
Note: 1. All Reading Levels are Quasi-Peak and average value. 2. " * ", means this data is the worst emission level. 3. Measurement Level = Reading Level + Correct Factor.

Report No: 09BS046-RF-CE-P01V01
Page: 34 of 165
Engineer : Peter
Site : SR-1 (Conducted Emission and Power
Disturbance Test)
Time : 2009/11/16 - 16:59
Limit : EN55022_B_00M_QP Margin : 10
Probe : ENV216_100014(0.009-30MHz) - Line2 Power : AC 230V/50Hz
EUT : Notebook PC Note : Mode 3: Transmission Data by WLAN2 and
Bluetooth

Report No: 09BS046-RF-CE-P01V01
Page: 35 of 165
Engineer : Peter
Site : SR-1 (Conducted Emission and Power
Disturbance Test)
Time : 2009/11/16 - 17:01
Limit : EN55022_B_00M_QP Margin : 0
Probe : ENV216_100014(0.009-30MHz) - Line2 Power : AC 230V/50Hz
EUT : Notebook PC Note : Mode 3: Transmission Data by WLAN2 and
Bluetooth
Frequency
(MHz)
Correct Factor
(dB)
Reading Level
(dBuV)
Measure Level
(dBuV)
Margin
(dB)
Limit
(dBuV)
Detector Type
1 * 0.151 10.009 40.600 50.609 -15.336 65.945 QUASIPEAK
2 0.226 9.580 33.900 43.480 -19.115 62.595 QUASIPEAK
3 0.314 9.600 29.100 38.700 -21.164 59.864 QUASIPEAK
4 0.586 9.691 27.100 36.791 -19.209 56.000 QUASIPEAK
5 5.002 9.730 23.600 33.330 -26.670 60.000 QUASIPEAK
6 17.550 10.140 24.100 34.240 -25.760 60.000 QUASIPEAK
Note: 1. All Reading Levels are Quasi-Peak and average value. 2. " * ", means this data is the worst emission level. 3. Measurement Level = Reading Level + Correct Factor.

Report No: 09BS046-RF-CE-P01V01
Page: 36 of 165
Engineer : Peter
Site : SR-1 (Conducted Emission and Power
Disturbance Test)
Time : 2009/11/16 - 17:01
Limit : EN55022_B_00M_AV Margin : 0
Probe : ENV216_100014(0.009-30MHz) - Line2 Power : AC 230V/50Hz
EUT : Notebook PC Note : Mode 3: Transmission Data by WLAN2 and
Bluetooth
Frequency
(MHz)
Correct Factor
(dB)
Reading Level
(dBuV)
Measure Level
(dBuV)
Margin
(dB)
Limit
(dBuV)
Detector Type
1 0.151 10.009 26.700 36.709 -19.236 55.945 AVERAGE
2 0.226 9.580 23.300 32.880 -19.715 52.595 AVERAGE
3 * 0.314 9.600 21.100 30.700 -19.164 49.864 AVERAGE
4 0.586 9.691 12.900 22.591 -23.409 46.000 AVERAGE
5 5.002 9.730 12.400 22.130 -27.870 50.000 AVERAGE
6 17.550 10.140 17.900 28.040 -21.960 50.000 AVERAGE
Note: 1. All Reading Levels are Quasi-Peak and average value. 2. " * ", means this data is the worst emission level. 3. Measurement Level = Reading Level + Correct Factor.

Report No: 09BS046-RF-CE-P01V01
Page: 37 of 165
Engineer : Peter
Site : SR-1 (Conducted Emission and Power
Disturbance Test)
Time : 2009/11/12 - 16:17
Limit : ISN_Voltage_B_00M_QP Margin : 10
Probe : FCC-TLISN-T4_20353(0.15-30MHz) - Line1 Power : AC 230V/50Hz
EUT : Notebook PC Note : Mode 1: Transmission Data by WLAN1 and
Bluetooth - LAN 10Mbps

Report No: 09BS046-RF-CE-P01V01
Page: 38 of 165
Engineer : Peter
Site : SR-1 (Conducted Emission and Power
Disturbance Test)
Time : 2009/11/12 - 16:20
Limit : ISN_Voltage_B_00M_QP Margin : 0
Probe : FCC-TLISN-T4_20353(0.15-30MHz) - Line1 Power : AC 230V/50Hz
EUT : Notebook PC Note : Mode 1: Transmission Data by WLAN1 and
Bluetooth - LAN 10Mbps
Frequency
(MHz)
Correct Factor
(dB)
Reading Level
(dBuV)
Measure Level
(dBuV)
Margin
(dB)
Limit
(dBuV)
Detector Type
1 3.750 9.790 48.800 58.590 -15.410 74.000 QUASIPEAK
2 7.494 9.860 50.100 59.961 -14.039 74.000 QUASIPEAK
3 8.586 9.880 47.300 57.180 -16.820 74.000 QUASIPEAK
4 9.674 9.900 46.700 56.600 -17.400 74.000 QUASIPEAK
5 * 12.446 9.920 51.000 60.920 -13.080 74.000 QUASIPEAK
6 12.826 9.930 44.800 54.730 -19.270 74.000 QUASIPEAK
Note: 1. All Reading Levels are Quasi-Peak and average value. 2. " * ", means this data is the worst emission level. 3. Measurement Level = Reading Level + Correct Factor.

Report No: 09BS046-RF-CE-P01V01
Page: 39 of 165
Engineer : Peter
Site : SR-1 (Conducted Emission and Power
Disturbance Test)
Time : 2009/11/12 - 16:20
Limit : ISN_Voltage_B_00M_AV Margin : 0
Probe : FCC-TLISN-T4_20353(0.15-30MHz) - Line1 Power : AC 230V/50Hz
EUT : Notebook PC Note : Mode 1: Transmission Data by WLAN1 and
Bluetooth - LAN 10Mbps
Frequency
(MHz)
Correct Factor
(dB)
Reading Level
(dBuV)
Measure Level
(dBuV)
Margin
(dB)
Limit
(dBuV)
Detector Type
1 3.750 9.790 36.300 46.090 -17.910 64.000 AVERAGE
2 7.494 9.860 36.800 46.661 -17.339 64.000 AVERAGE
3 8.586 9.880 34.400 44.280 -19.720 64.000 AVERAGE
4 9.674 9.900 34.800 44.700 -19.300 64.000 AVERAGE
5 * 12.446 9.920 37.500 47.420 -16.580 64.000 AVERAGE
6 12.826 9.930 36.200 46.130 -17.870 64.000 AVERAGE
Note: 1. All Reading Levels are Quasi-Peak and average value. 2. " * ", means this data is the worst emission level. 3. Measurement Level = Reading Level + Correct Factor.

Report No: 09BS046-RF-CE-P01V01
Page: 40 of 165
Engineer : Peter
Site : SR-1 (Conducted Emission and Power
Disturbance Test)
Time : 2009/11/12 - 16:27
Limit : ISN_Voltage_B_00M_QP Margin : 10
Probe : FCC-TLISN-T4_20353(0.15-30MHz) - Line1 Power : AC 230V/50Hz
EUT : Notebook PC Note : Mode 1: Transmission Data by WLAN1 and
Bluetooth - LAN 100Mbps

Report No: 09BS046-RF-CE-P01V01
Page: 41 of 165
Engineer : Peter
Site : SR-1 (Conducted Emission and Power
Disturbance Test)
Time : 2009/11/12 - 16:30
Limit : ISN_Voltage_B_00M_QP Margin : 0
Probe : FCC-TLISN-T4_20353(0.15-30MHz) - Line1 Power : AC 230V/50Hz
EUT : Notebook PC Note : Mode 1: Transmission Data by WLAN1 and
Bluetooth - LAN 100Mbps
Frequency
(MHz)
Correct Factor
(dB)
Reading Level
(dBuV)
Measure Level
(dBuV)
Margin
(dB)
Limit
(dBuV)
Detector Type
1 13.418 9.930 50.000 59.930 -14.070 74.000 QUASIPEAK
2 16.230 9.970 50.700 60.670 -13.330 74.000 QUASIPEAK
3 * 17.694 9.990 51.600 61.590 -12.410 74.000 QUASIPEAK
4 18.242 9.990 51.400 61.390 -12.610 74.000 QUASIPEAK
5 19.710 10.010 50.100 60.110 -13.890 74.000 QUASIPEAK
6 23.130 10.050 50.200 60.250 -13.750 74.000 QUASIPEAK
Note: 1. All Reading Levels are Quasi-Peak and average value. 2. " * ", means this data is the worst emission level. 3. Measurement Level = Reading Level + Correct Factor.

Report No: 09BS046-RF-CE-P01V01
Page: 42 of 165
Engineer : Peter
Site : SR-1 (Conducted Emission and Power
Disturbance Test)
Time : 2009/11/12 - 16:30
Limit : ISN_Voltage_B_00M_AV Margin : 0
Probe : FCC-TLISN-T4_20353(0.15-30MHz) - Line1 Power : AC 230V/50Hz
EUT : Notebook PC Note : Mode 1: Transmission Data by WLAN1 and
Bluetooth - LAN 100Mbps
Frequency
(MHz)
Correct Factor
(dB)
Reading Level
(dBuV)
Measure Level
(dBuV)
Margin
(dB)
Limit
(dBuV)
Detector Type
1 13.418 9.930 47.500 57.430 -6.570 64.000 AVERAGE
2 16.230 9.970 48.500 58.470 -5.530 64.000 AVERAGE
3 17.694 9.990 50.100 60.090 -3.910 64.000 AVERAGE
4 * 18.242 9.990 50.400 60.390 -3.610 64.000 AVERAGE
5 19.710 10.010 49.200 59.210 -4.790 64.000 AVERAGE
6 23.130 10.050 49.100 59.150 -4.850 64.000 AVERAGE
Note: 1. All Reading Levels are Quasi-Peak and average value. 2. " * ", means this data is the worst emission level. 3. Measurement Level = Reading Level + Correct Factor.

Report No: 09BS046-RF-CE-P01V01
Page: 43 of 165
Engineer : Peter
Site : SR-1 (Conducted Emission and Power
Disturbance Test)
Time : 2009/11/16 - 17:10
Limit : ISN_Voltage_B_00M_QP Margin : 10
Probe : FCC-TLISN-T4_20353(0.15-30MHz) - Line1 Power : AC 230V/50Hz
EUT : Notebook PC Note : Mode 3: Transmission Data by WLAN2 and
Bluetooth – LAN 10Mbps

Report No: 09BS046-RF-CE-P01V01
Page: 44 of 165
Engineer : Peter
Site : SR-1 (Conducted Emission and Power
Disturbance Test)
Time : 2009/11/16 - 17:12
Limit : ISN_Voltage_B_00M_QP Margin : 0
Probe : FCC-TLISN-T4_20353(0.15-30MHz) - Line1 Power : AC 230V/50Hz
EUT : Notebook PC Note : Mode 3: Transmission Data by WLAN2 and
Bluetooth – LAN 10Mbps
Frequency
(MHz)
Correct Factor
(dB)
Reading Level
(dBuV)
Measure Level
(dBuV)
Margin
(dB)
Limit
(dBuV)
Detector Type
1 5.058 9.820 44.000 53.820 -20.180 74.000 QUASIPEAK
2 7.338 9.860 47.300 57.160 -16.840 74.000 QUASIPEAK
3 8.642 9.880 46.000 55.880 -18.120 74.000 QUASIPEAK
4 10.006 9.900 46.400 56.300 -17.700 74.000 QUASIPEAK
5 10.992 9.910 45.800 55.710 -18.290 74.000 QUASIPEAK
6 * 12.498 9.927 55.700 65.627 -8.373 74.000 QUASIPEAK
Note: 1. All Reading Levels are Quasi-Peak and average value. 2. " * ", means this data is the worst emission level. 3. Measurement Level = Reading Level + Correct Factor.

Report No: 09BS046-RF-CE-P01V01
Page: 45 of 165
Engineer : Peter
Site : SR-1 (Conducted Emission and Power
Disturbance Test)
Time : 2009/11/16 - 17:12
Limit : ISN_Voltage_B_00M_AV Margin : 0
Probe : FCC-TLISN-T4_20353(0.15-30MHz) - Line1 Power : AC 230V/50Hz
EUT : Notebook PC Note : Mode 3: Transmission Data by WLAN2 and
Bluetooth – LAN 10Mbps
Frequency
(MHz)
Correct Factor
(dB)
Reading Level
(dBuV)
Measure Level
(dBuV)
Margin
(dB)
Limit
(dBuV)
Detector Type
1 5.058 9.820 35.900 45.720 -18.280 64.000 AVERAGE
2 7.338 9.860 34.100 43.960 -20.040 64.000 AVERAGE
3 8.642 9.880 33.000 42.880 -21.120 64.000 AVERAGE
4 10.006 9.900 26.300 36.200 -27.800 64.000 AVERAGE
5 10.992 9.910 31.800 41.710 -22.290 64.000 AVERAGE
6 * 12.498 9.927 46.300 56.227 -7.773 64.000 AVERAGE
Note: 1. All Reading Levels are Quasi-Peak and average value. 2. " * ", means this data is the worst emission level. 3. Measurement Level = Reading Level + Correct Factor.

Report No: 09BS046-RF-CE-P01V01
Page: 46 of 165
Engineer : Peter
Site : SR-1 (Conducted Emission and Power
Disturbance Test)
Time : 2009/11/16 - 17:15
Limit : ISN_Voltage_B_00M_QP Margin : 10
Probe : FCC-TLISN-T4_20353(0.15-30MHz) - Line1 Power : AC 230V/50Hz
EUT : Notebook PC Note : Mode 3: Transmission Data by WLAN2 and
Bluetooth – LAN 100Mbps

Report No: 09BS046-RF-CE-P01V01
Page: 47 of 165
Engineer : Peter
Site : SR-1 (Conducted Emission and Power
Disturbance Test)
Time : 2009/11/16 - 17:16
Limit : ISN_Voltage_B_00M_QP Margin : 0
Probe : FCC-TLISN-T4_20353(0.15-30MHz) - Line1 Power : AC 230V/50Hz
EUT : Notebook PC Note : Mode 3: Transmission Data by WLAN2 and
Bluetooth – LAN 100Mbps
Frequency
(MHz)
Correct Factor
(dB)
Reading Level
(dBuV)
Measure Level
(dBuV)
Margin
(dB)
Limit
(dBuV)
Detector Type
1 1.506 9.790 47.700 57.490 -16.510 74.000 QUASIPEAK
2 16.230 9.970 50.900 60.870 -13.130 74.000 QUASIPEAK
3 * 17.694 9.990 51.000 60.990 -13.010 74.000 QUASIPEAK
4 18.242 9.990 50.800 60.790 -13.210 74.000 QUASIPEAK
5 19.710 10.010 50.000 60.010 -13.990 74.000 QUASIPEAK
6 23.130 10.050 49.400 59.450 -14.550 74.000 QUASIPEAK
Note: 1. All Reading Levels are Quasi-Peak and average value. 2. " * ", means this data is the worst emission level. 3. Measurement Level = Reading Level + Correct Factor.

Report No: 09BS046-RF-CE-P01V01
Page: 48 of 165
Engineer : Peter
Site : SR-1 (Conducted Emission and Power
Disturbance Test)
Time : 2009/11/16 - 17:16
Limit : ISN_Voltage_B_00M_AV Margin : 0
Probe : FCC-TLISN-T4_20353(0.15-30MHz) - Line1 Power : AC 230V/50Hz
EUT : Notebook PC Note : Mode 3: Transmission Data by WLAN2 and
Bluetooth – LAN 100Mbps
Frequency
(MHz)
Correct Factor
(dB)
Reading Level
(dBuV)
Measure Level
(dBuV)
Margin
(dB)
Limit
(dBuV)
Detector Type
1 1.506 9.790 42.200 51.990 -12.010 64.000 AVERAGE
2 16.230 9.970 49.900 59.870 -4.130 64.000 AVERAGE
3 * 17.694 9.990 50.300 60.290 -3.710 64.000 AVERAGE
4 18.242 9.990 49.900 59.890 -4.110 64.000 AVERAGE
5 19.710 10.010 48.600 58.610 -5.390 64.000 AVERAGE
6 23.130 10.050 48.700 58.750 -5.250 64.000 AVERAGE
Note: 1. All Reading Levels are Quasi-Peak and average value. 2. " * ", means this data is the worst emission level. 3. Measurement Level = Reading Level + Correct Factor.

Report No: 09BS046-RF-CE-P01V01
Page: 49 of 165
3.7. Test Photograph
Test Mode: Mode 1: Transmission Data by WLAN1 and Bluetooth Description: Front View of Conducted disturbance at mains terminals Test Setup
Test Mode: Mode 1: Transmission Data by WLAN1 and Bluetooth Description: Side View of Conducted disturbance at mains terminals Test Setup

Report No: 09BS046-RF-CE-P01V01
Page: 50 of 165
Test Mode: Mode 1: Transmission Data by WLAN1 and Bluetooth Description: Front View of Conducted disturbance at telecommunication ports Test Setup (LAN)
Test Mode: Mode 1: Transmission Data by WLAN1 and Bluetooth Description: Side View of Conducted disturbance at telecommunication ports Test Setup (LAN)
Report No: 09BS046-RF-CE-P01V01
Page: 51 of 165
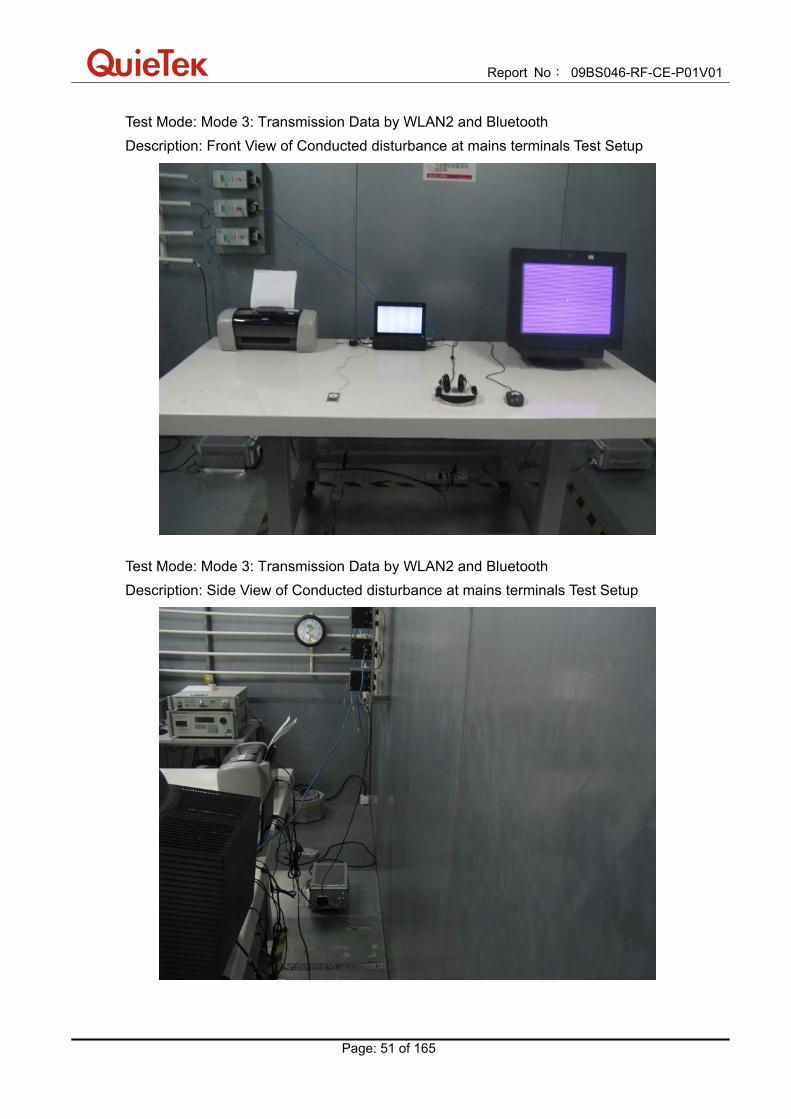
Test Mode: Mode 3: Transmission Data by WLAN2 and Bluetooth Description: Front View of Conducted disturbance at mains terminals Test Setup
Test Mode: Mode 3: Transmission Data by WLAN2 and Bluetooth Description: Side View of Conducted disturbance at mains terminals Test Setup

Report No: 09BS046-RF-CE-P01V01
Page: 52 of 165
Test Mode: Mode 3: Transmission Data by WLAN2 and Bluetooth Description: Front View of Conducted disturbance at telecommunication ports Test Setup (LAN)
Test Mode: Mode 3: Transmission Data by WLAN2 and Bluetooth Description: Side View of Conducted disturbance at telecommunication ports Test Setup (LAN)

Report No: 09BS046-RF-CE-P01V01
Page: 53 of 165
4. Radiated emission
4.1. Test Specification
According to EMC Standard: EN 55022
4.2. Test Setup Below 1GHz Test Setup
Above 1GHz Test Setup

Report No: 09BS046-RF-CE-P01V01
Page: 54 of 165
4.3. Limit Limits below 1GHz
Limits for radiated emission at a measuring distance of 10m
Frequency range MHz
Quasi-peak limis dB(μV/m)
30 to 230 30
230 to 1000 37
NOTE 1: The lower limit shall apply at the transition frequency. NOTE 2: Additional provisions may be required for cases where interference occurs. Limits above 1GHz
Limits for radiated emission at a measuring distance of 3m
Frequency range GHz
Average limit dB(μV/m)
Peak-peak dB(μV/m)
1 to 3 50 70
3 to 6 54 74
NOTE: The lower limit applies at transition frequency.
Ancillary equipment intended to be used in telecommunication centres only
Frequency range GHz
Average limit dB(μV/m)
Peak-peak dB(μV/m)
1 to 3 56 76
3 to 6 60 80
NOTE: The lower limit applies at transition frequency.
4.4. Test Procedure The EUT and its simulators are placed on a turntable which is 0.8 meter above ground. The turntable can rotate 360 degrees to determine the position of the maximum emission level. The EUT was positioned such that the distance from antenna to the EUT was 10 meters for below 1GHz and 3 meters for above 1GHz. The antenna can move up and down between 1 meter and 4 meters to find out the maximum emission level. Both horizontal and vertical polarization of the antenna are set on measurement. In order to find the maximum emission, all of the interface cables must be changed during radiated
Report No: 09BS046-RF-CE-P01V01
Page: 55 of 165
measurement.
The bandwidth below 1GHz setting on the reveiver is 120kHz and above 1GHz is 1MHz.
4.5. Deviation from Test Standard No deviation.

Report No: 09BS046-RF-CE-P01V01
Page: 56 of 165
4.6. Test Result Engineer : Sunny
Site : AC-1 (10m Semi-Anechoic Chamber) Time : 2009/11/13 - 07:42
Limit : EN55022_B_10M_QP Margin : 6
EUT : Notebook PC Probe : CBL6112B_2931(30-1000MHz) - HORIZONTAL
Power : AC 230V/50Hz Note : Mode 1: Transmission Data by WLAN1 and
Bluetooth
Frequency
(MHz)
Correct Factor
(dB)
Reading Level
(dBuV)
Measure Level
(dBuV/m)
Margin
(dB)
Limit
(dBuV/m)
Detector Type Ant Pos
(cm)
Table Pos
(deg)
1 114.875 -20.305 43.433 23.128 -6.872 30.000 QUASIPEAK 400.000 207.600
2 * 180.350 -22.620 47.114 24.494 -5.506 30.000 QUASIPEAK 400.000 274.100
3 204.600 -22.660 46.980 24.320 -5.680 30.000 QUASIPEAK 400.000 117.600
4 253.100 -18.410 45.116 26.706 -10.294 37.000 QUASIPEAK 400.000 207.600
5 333.125 -16.235 39.138 22.903 -14.097 37.000 QUASIPEAK 400.000 197.600
6 510.150 -11.700 37.979 26.279 -10.721 37.000 QUASIPEAK 400.000 289.100
Note: 1. All Readings below 1GHz are Quasi-Peak, above are performed with peak and/or average measurements as necessary. 2. " * ", means this data is the worst emission level. 3. Measurement Level = Reading Level + Correct Factor

Report No: 09BS046-RF-CE-P01V01
Page: 57 of 165
Engineer : Sunny
Site : AC-1 (10m Semi-Anechoic Chamber) Time : 2009/11/13 - 07:42
Limit : EN55022_B_10M_QP Margin : 6
EUT : Notebook PC Probe : CBL6112B_2933(30-1000MHz) - VERTICAL
Power : AC 230V/50Hz Note : Mode 1: Transmission Data by WLAN1 and
Bluetooth
Frequency
(MHz)
Correct Factor
(dB)
Reading Level
(dBuV)
Measure Level
(dBuV/m)
Margin
(dB)
Limit
(dBuV/m)
Detector Type Ant Pos
(cm)
Table Pos
(deg)
1 46.975 -22.825 44.073 21.248 -8.752 30.000 QUASIPEAK 100.000 11.600
2 136.700 -20.240 45.083 24.843 -5.157 30.000 QUASIPEAK 100.000 209.700
3 * 204.600 -22.290 47.439 25.149 -4.851 30.000 QUASIPEAK 100.000 309.200
4 255.525 -17.900 43.944 26.044 -10.956 37.000 QUASIPEAK 100.000 58.400
5 510.150 -11.350 37.936 26.586 -10.414 37.000 QUASIPEAK 100.000 247.100
6 832.675 -5.465 36.165 30.700 -6.300 37.000 QUASIPEAK 100.000 116.700
Note: 1. All Readings below 1GHz are Quasi-Peak, above are performed with peak and/or average measurements as necessary. 2. " * ", means this data is the worst emission level. 3. Measurement Level = Reading Level + Correct Factor

Report No: 09BS046-RF-CE-P01V01
Page: 58 of 165
Engineer : Lee
Site : AC-5 (3m Semi-Anechoic Chamber) Time : 2009/11/13 - 13:44
Limit : EN55022_B_(Above_1G)_03M_PK Margin : 0
Probe : 9120D_499(1-18GHz) - HORIZONTAL Power : AC 230V/50Hz
EUT : Notebook PC Note : Mode 1: Transmission Data by WLAN1 and
Bluetooth
Frequency
(MHz)
Correct Factor
(dB)
Reading Level
(dBuV)
Measure Level
(dBuV/m)
Margin
(dB)
Limit
(dBuV/m)
Detector Type Ant Pos
(cm)
Table Pos
(deg)
1 * 1045.000 -10.428 53.470 43.042 -26.958 70.000 PEAK 100.800 349.300
2 1520.000 -9.143 51.186 42.043 -27.957 70.000 PEAK 188.600 45.600
3 1610.000 -9.002 50.845 41.843 -28.157 70.000 PEAK 120.600 33.200
Note: 1. All Readings below 1GHz are Quasi-Peak, above are performed with peak and/or average measurements as necessary. 2. " * ", means this data is the worst emission level. 3. Measurement Level = Reading Level + Correct Factor. 4. The average measurement was not performed when the peak measured data under the limit of average detection. If the readings given are average, peak measurement should also be supplied.

Report No: 09BS046-RF-CE-P01V01
Page: 59 of 165
Engineer : Lee
Site : AC-5 (3m Semi-Anechoic Chamber) Time : 2009/11/13 - 13:44
Limit : EN55022_B_(Above_1G)_03M_AV Margin : 0
Probe : 9120D_499(1-18GHz) - HORIZONTAL Power : AC 230V/50Hz
EUT : Notebook PC Note : Mode 1: Transmission Data by WLAN1 and
Bluetooth
Frequency
(MHz)
Correct Factor
(dB)
Reading Level
(dBuV)
Measure Level
(dBuV/m)
Margin
(dB)
Limit
(dBuV/m)
Detector Type Ant Pos
(cm)
Table Pos
(deg)
1 1045.000 -10.428 30.995 20.567 -29.433 50.000 AVERAGE 100.800 349.300
2 * 1520.000 -9.143 29.887 20.744 -29.256 50.000 AVERAGE 188.600 45.600
3 1610.000 -9.002 27.223 18.221 -31.779 50.000 AVERAGE 120.600 33.200
Note: 1. All Readings below 1GHz are Quasi-Peak, above are performed with peak and/or average measurements as necessary. 2. " * ", means this data is the worst emission level. 3. Measurement Level = Reading Level + Correct Factor. 4. The average measurement was not performed when the peak measured data under the limit of average detection. If the readings given are average, peak measurement should also be supplied.

Report No: 09BS046-RF-CE-P01V01
Page: 60 of 165
Engineer : Lee
Site : AC-5 (3m Semi-Anechoic Chamber) Time : 2009/11/13 - 13:45
Limit : EN55022_B_(Above_1G)_03M_PK Margin : 0
Probe : 9120D_499(1-18GHz) - VERTICAL Power : AC 230V/50Hz
EUT : Notebook PC Note : Mode 1: Transmission Data by WLAN1 and
Bluetooth
Frequency
(MHz)
Correct Factor
(dB)
Reading Level
(dBuV)
Measure Level
(dBuV/m)
Margin
(dB)
Limit
(dBuV/m)
Detector Type Ant Pos
(cm)
Table Pos
(deg)
1 * 1000.000 -10.415 64.130 53.715 -16.285 70.000 PEAK 111.700 355.400
2 1520.000 -9.143 60.538 51.395 -18.605 70.000 PEAK 150.200 11.700
3 1615.000 -9.001 56.175 47.173 -22.827 70.000 PEAK 120.700 54.200
Note: 1. All Readings below 1GHz are Quasi-Peak, above are performed with peak and/or average measurements as necessary. 2. " * ", means this data is the worst emission level. 3. Measurement Level = Reading Level + Correct Factor. 4. The average measurement was not performed when the peak measured data under the limit of average detection. If the readings given are average, peak measurement should also be supplied.

Report No: 09BS046-RF-CE-P01V01
Page: 61 of 165
Engineer : Lee
Site : AC-5 (3m Semi-Anechoic Chamber) Time : 2009/11/13 - 13:45
Limit : EN55022_B_(Above_1G)_03M_AV Margin : 0
Probe : 9120D_499(1-18GHz) - VERTICAL Power : AC 230V/50Hz
EUT : Notebook PC Note : Mode 1: Transmission Data by WLAN1 and
Bluetooth
Frequency
(MHz)
Correct Factor
(dB)
Reading Level
(dBuV)
Measure Level
(dBuV/m)
Margin
(dB)
Limit
(dBuV/m)
Detector Type Ant Pos
(cm)
Table Pos
(deg)
1 * 1000.000 -10.415 40.556 30.141 -19.859 50.000 AVERAGE 111.700 355.400
2 1520.000 -9.143 37.228 28.085 -21.915 50.000 AVERAGE 150.200 11.700
3 1615.000 -9.001 33.778 24.776 -25.224 50.000 AVERAGE 120.700 54.200
Note: 1. All Readings below 1GHz are Quasi-Peak, above are performed with peak and/or average measurements as necessary. 2. " * ", means this data is the worst emission level. 3. Measurement Level = Reading Level + Correct Factor. 4. The average measurement was not performed when the peak measured data under the limit of average detection. If the readings given are average, peak measurement should also be supplied.

Report No: 09BS046-RF-CE-P01V01
Page: 62 of 165
Engineer : Sunny
Site : AC-1 (10m Semi-Anechoic Chamber) Time : 2009/11/13 - 07:43
Limit : EN55022_B_10M_QP Margin : 6
EUT : Notebook PC Probe : CBL6112B_2931(30-1000MHz) - HORIZONTAL
Power : AC 230V/50Hz Note : Mode 3: Transmission Data by WLAN2 and
Bluetooth
Frequency
(MHz)
Correct Factor
(dB)
Reading Level
(dBuV)
Measure Level
(dBuV/m)
Margin
(dB)
Limit
(dBuV/m)
Detector Type Ant Pos
(cm)
Table Pos
(deg)
1 46.975 -22.980 46.275 23.295 -6.705 30.000 QUASIPEAK 100.000 314.000
2 85.775 -24.400 48.291 23.891 -6.109 30.000 QUASIPEAK 358.000 72.000
3 112.450 -20.450 43.614 D23.164 -6.836 30.000 QUASIPEAK 400.000 305.000
4 * 185.200 -22.830 49.401 26.571 -3.429 30.000 QUASIPEAK 400.000 185.600
5 357.375 -14.745 43.702 28.957 -8.043 37.000 QUASIPEAK 360.000 163.200
6 602.300 -9.500 36.454 26.954 -10.046 37.000 QUASIPEAK 100.000 169.500
Note: 1. All Readings below 1GHz are Quasi-Peak, above are performed with peak and/or average measurements as necessary. 2. " * ", means this data is the worst emission level. 3. Measurement Level = Reading Level + Correct Factor

Report No: 09BS046-RF-CE-P01V01
Page: 63 of 165
Engineer : Sunny
Site : AC-1 (10m Semi-Anechoic Chamber) Time : 2009/11/13 - 07:43
Limit : EN55022_B_10M_QP Margin : 6
EUT : Notebook PC Probe : CBL6112B_2933(30-1000MHz) - VERTICAL
Power : AC 230V/50Hz Note : Mode 3: Transmission Data by WLAN2 and
Bluetooth
Frequency
(MHz)
Correct Factor
(dB)
Reading Level
(dBuV)
Measure Level
(dBuV/m)
Margin
(dB)
Limit
(dBuV/m)
Detector Type Ant Pos
(cm)
Table Pos
(deg)
1 * 39.700 -19.220 45.292 26.072 -3.928 30.000 QUASIPEAK 100.000 360.000
2 73.650 -26.300 48.729 22.429 -7.571 30.000 QUASIPEAK 100.000 185.600
3 114.875 -20.095 45.717 25.622 -4.378 30.000 QUASIPEAK 100.000 168.500
4 169.190 -21.825 43.600 21.775 -8.225 30.000 QUASIPEAK 100.000 126.000
5 250.675 -18.140 43.428 25.288 -11.712 37.000 QUASIPEAK 100.000 185.200
6 597.450 -9.260 37.002 27.742 -9.258 37.000 QUASIPEAK 100.000 39.600
Note: 1. All Readings below 1GHz are Quasi-Peak, above are performed with peak and/or average measurements as necessary. 2. " * ", means this data is the worst emission level. 3. Measurement Level = Reading Level + Correct Factor

Report No: 09BS046-RF-CE-P01V01
Page: 64 of 165
Engineer : Lee
Site : AC-5 (3m Semi-Anechoic Chamber) Time : 2009/11/13 - 13:45
Limit : EN55022_B_(Above_1G)_03M_PK Margin : 0
Probe : 9120D_499(1-18GHz) - HORIZONTAL Power : AC 230V/50Hz
EUT : Notebook PC Note : Mode 3: Transmission Data by WLAN2 and
Bluetooth
Frequency
(MHz)
Correct Factor
(dB)
Reading Level
(dBuV)
Measure Level
(dBuV/m)
Margin
(dB)
Limit
(dBuV/m)
Detector Type Ant Pos
(cm)
Table Pos
(deg)
1 * 1045.000 -10.428 52.526 42.098 -27.902 70.000 PEAK 188.200 12.300
2 1520.000 -9.143 50.747 41.604 -28.396 70.000 PEAK 205.200 334.600
3 1810.000 -8.865 48.925 40.060 -29.940 70.000 PEAK 150.100 55.300
Note: 1. All Readings below 1GHz are Quasi-Peak, above are performed with peak and/or average measurements as necessary. 2. " * ", means this data is the worst emission level. 3. Measurement Level = Reading Level + Correct Factor. 4. The average measurement was not performed when the peak measured data under the limit of average detection. If the readings given are average, peak measurement should also be supplied.

Report No: 09BS046-RF-CE-P01V01
Page: 65 of 165
Engineer : Lee
Site : AC-5 (3m Semi-Anechoic Chamber) Time : 2009/11/13 - 13:45
Limit : EN55022_B_(Above_1G)_03M_AV Margin : 0
Probe : 9120D_499(1-18GHz) - HORIZONTAL Power : AC 230V/50Hz
EUT : Notebook PC Note : Mode 3: Transmission Data by WLAN2 and
Bluetooth
Frequency
(MHz)
Correct Factor
(dB)
Reading Level
(dBuV)
Measure Level
(dBuV/m)
Margin
(dB)
Limit
(dBuV/m)
Detector Type Ant Pos
(cm)
Table Pos
(deg)
1 * 1045.000 -10.428 30.235 19.807 -30.193 50.000 AVERAGE 188.200 12.300
2 1520.000 -9.143 27.525 18.382 -31.618 50.000 AVERAGE 205.200 334.600
3 1810.000 -8.865 25.364 16.499 -33.501 50.000 AVERAGE 150.100 55.300
Note: 1. All Readings below 1GHz are Quasi-Peak, above are performed with peak and/or average measurements as necessary. 2. " * ", means this data is the worst emission level. 3. Measurement Level = Reading Level + Correct Factor. 4. The average measurement was not performed when the peak measured data under the limit of average detection. If the readings given are average, peak measurement should also be supplied.

Report No: 09BS046-RF-CE-P01V01
Page: 66 of 165
Engineer : Lee
Site : AC-5 (3m Semi-Anechoic Chamber) Time : 2009/11/13 - 13:45
Limit : EN55022_B_(Above_1G)_03M_PK Margin : 0
Probe : 9120D_499(1-18GHz) - VERTICAL Power : AC 230V/50Hz
EUT : Notebook PC Note : Mode 3: Transmission Data by WLAN2 and
Bluetooth
Frequency
(MHz)
Correct Factor
(dB)
Reading Level
(dBuV)
Measure Level
(dBuV/m)
Margin
(dB)
Limit
(dBuV/m)
Detector Type Ant Pos
(cm)
Table Pos
(deg)
1 1075.000 -10.380 56.237 45.857 -24.143 70.000 PEAK 105.200 359.900
2 * 1520.000 -9.143 58.075 48.932 -21.068 70.000 PEAK 108.200 22.500
3 1620.000 -9.003 57.765 48.762 -21.238 70.000 PEAK 168.200 35.200
Note: 1. All Readings below 1GHz are Quasi-Peak, above are performed with peak and/or average measurements as necessary. 2. " * ", means this data is the worst emission level. 3. Measurement Level = Reading Level + Correct Factor. 4. The average measurement was not performed when the peak measured data under the limit of average detection. If the readings given are average, peak measurement should also be supplied.

Report No: 09BS046-RF-CE-P01V01
Page: 67 of 165
Engineer : Lee
Site : AC-5 (3m Semi-Anechoic Chamber) Time : 2009/11/13 - 13:45
Limit : EN55022_B_(Above_1G)_03M_AV Margin : 0
Probe : 9120D_499(1-18GHz) - VERTICAL Power : AC 230V/50Hz
EUT : Notebook PC Note : Mode 3: Transmission Data by WLAN2 and
Bluetooth
Frequency
(MHz)
Correct Factor
(dB)
Reading Level
(dBuV)
Measure Level
(dBuV/m)
Margin
(dB)
Limit
(dBuV/m)
Detector Type Ant Pos
(cm)
Table Pos
(deg)
1 1075.000 -10.380 33.029 22.649 -27.351 50.000 AVERAGE 105.200 359.900
2 1520.000 -9.143 26.225 17.082 -32.918 50.000 AVERAGE 108.200 22.500
3 * 1620.000 -9.003 35.886 26.883 -23.117 50.000 AVERAGE 168.200 35.200
Note: 1. All Readings below 1GHz are Quasi-Peak, above are performed with peak and/or average measurements as necessary. 2. " * ", means this data is the worst emission level. 3. Measurement Level = Reading Level + Correct Factor. 4. The average measurement was not performed when the peak measured data under the limit of average detection. If the readings given are average, peak measurement should also be supplied.

Report No: 09BS046-RF-CE-P01V01
Page: 68 of 165
4.7. Test Photograph Test Mode: Mode 1: Transmission Data by WLAN1 and Bluetooth Description: Front View of Radiated disturbance Test Setup (Below 1GHz)
Test Mode: Mode 1: Transmission Data by WLAN1 and Bluetooth Description: Rear View of Radiated disturbance Test Setup (Below 1GHz)

Report No: 09BS046-RF-CE-P01V01
Page: 69 of 165
Test Mode: Mode 1: Transmission Data by WLAN1 and Bluetooth Description: Front View of Radiated disturbance Test Setup (Above 1GHz)
Test Mode: Mode 1: Transmission Data by WLAN1 and Bluetooth Description: Rear View of Radiated disturbance Test Setup (Above 1GHz)

Report No: 09BS046-RF-CE-P01V01
Page: 70 of 165
Test Mode: Mode 3: Transmission Data by WLAN2 and Bluetooth Description: Front View of Radiated disturbance Test Setup (Below 1GHz)
Test Mode: Mode 3: Transmission Data by WLAN2 and Bluetooth Description: Rear View of Radiated disturbance Test Setup (Below 1GHz)

Report No: 09BS046-RF-CE-P01V01
Page: 71 of 165
Test Mode: Mode 3: Transmission Data by WLAN2 and Bluetooth Description: Front View of Radiated disturbance Test Setup (Above 1GHz)
Test Mode: Mode 3: Transmission Data by WLAN2 and Bluetooth Description: Rear View of Radiated disturbance Test Setup (Above 1GHz)

Report No: 09BS046-RF-CE-P01V01
Page: 72 of 165
5. Harmonic current emissions
5.1. Test Specification
According to EMC Standard: EN 61000-3-2
5.2. Test Setup
5.3. Limit (a) Limits of Class A Harmonics Currents
Harmonics Order
n
Maximum Permissible harmonic current
A
Harmonics Order
n
Maximum Permissible harmonic current
A
Odd harmonics Even harmonics
3 2.30 2 1.08
5 1.14 4 0.43
7 0.77 6 0.30
9 0.40 8 ≤ n ≤ 40 0.23 * 8/n
11 0.33
13 0.21
15 ≤ n ≤ 39 0.15 * 15/n

Report No: 09BS046-RF-CE-P01V01
Page: 73 of 165
(b) Limits of Class B Harmonics Currents
For Class B equipment, the harmonic of the input current shall not exceed the maximum permissible values given in table that is the limit of Class A multiplied by a factor of 1.5.
(c) Limits of Class C Harmonics Currents
Harmonics Order
n
Maximum Permissible harmonic current Expressed as a percentage of the input current at the fundamental frequency
%
2 2
3 30.λ*
5 10
7 7
9 5
11 ≤ n ≤ 39 (odd harmonics only)
3
*λ is the circuit power factor
(d) Limits of Class D Harmonics Currents
Harmonics Order
n
Maximum Permissible harmonic current per watt
mA/W
Maximum Permissible harmonic current
A
3 3.4 2.30
5 1.9 1.14
7 1.0 0.77
9 0.5 0.40
11 0.35 0.33
11 ≤ n ≤ 39 (odd harmonics only)
3.85/n See limit of Class A

Report No: 09BS046-RF-CE-P01V01
Page: 74 of 165
5.4. Test Procedure
The EUT is supplied in series with power analyzer from a power source having the same normal voltage and frequency as the rated supply voltage and the equipment under test. And the rated voltage at the supply voltage of EUT of 0.94 times and 1.06 times shall be performed.
5.5. Deviation from Test Standard No deviation.

Report No: 09BS046-RF-CE-P01V01
Page: 75 of 165
5.6. Test Result Test Mode Mode 1: Transmission Data by WLAN1 and Bluetooth
Test Site SR-1 Date of Test 2009.11.22
Temperature 25°C Humidity 48%RH Barometric Pressure
101kPa Test Engineer Peter
Test Result: Pass Source qualification: Normal
Current & voltage waveforms
-15-10
-505
1015
-300-200-1000100200300
Cur
rent
(Am
ps)
Voltage (V
olts)
Harmonics and Class D limit line European Limits
0.0000.0250.0500.0750.1000.1250.1500.1750.200
Cur
rent
RM
S(A
mps
)
Harmonic #4 8 12 16 20 24 28 32 36 40
Test result: Pass

Report No: 09BS046-RF-CE-P01V01
Page: 76 of 165
Test Result: Pass Source qualification: Normal THC(A): 0.00 I-THD(%): 0.00 POHC(A): 0.000 POHC Limit(A): 0.000 Highest parameter values during test:
V_RMS (Volts): 229.83 Frequency(Hz): 50.00 I_Peak (Amps): 9.807 I_RMS (Amps): 0.731 I_Fund (Amps): 0.180 Crest Factor: 14.848 Power (Watts): 41.8 Power Factor: 0.435
Harm# Harms(avg) 100%Limit %of Limit Harms(max) 150%Limit %of Limit Status 2 0.043 3 0.162 0.142 0.0 0.176 0.213 0.00 Pass 4 0.046 5 0.155 0.080 0.0 0.171 0.119 0.00 Pass 6 0.049 7 0.145 0.042 0.0 0.166 0.063 0.00 Pass 8 0.053 9 0.132 0.021 0.0 0.159 0.031 0.00 Pass 10 0.056 11 0.118 0.015 0.0 0.153 0.022 0.00 Pass 12 0.059 13 0.102 0.013 0.0 0.146 0.019 0.00 Pass 14 0.062 15 0.087 0.011 0.0 0.138 0.016 0.00 Pass 16 0.064 17 0.072 0.010 0.0 0.130 0.014 0.00 Pass 18 0.066 19 0.059 0.008 0.0 0.123 0.013 0.00 Pass 20 0.066 21 0.049 0.008 0.0 0.115 0.012 0.00 Pass 22 0.066 23 0.041 0.007 0.0 0.107 0.011 0.00 Pass 24 0.065 25 0.037 0.006 0.0 0.100 0.010 0.00 Pass 26 0.064 27 0.036 0.006 0.0 0.093 0.009 0.00 Pass 28 0.062 29 0.035 0.006 0.0 0.086 0.008 0.00 Pass 30 0.059 31 0.033 0.005 0.0 0.079 0.008 0.00 Pass 32 0.057 33 0.031 0.005 0.0 0.073 0.007 0.00 Pass 34 0.055 35 0.028 0.005 0.0 0.066 0.007 0.00 Pass 36 0.052 37 0.024 0.004 0.0 0.061 0.007 0.00 Pass 38 0.049 39 0.021 0.004 0.0 0.055 0.006 0.00 Pass 40 0.034
1. Dynamic limits were applied for this test. The highest harmonics values in the above table may not
occur at the same window as the maximum harmonics/limit ratio.
2. According to EN61000-3-2 paragraph 7 the note 1 and 2 are valid for all applications having an active
input power >75W. Others the result should be pass.
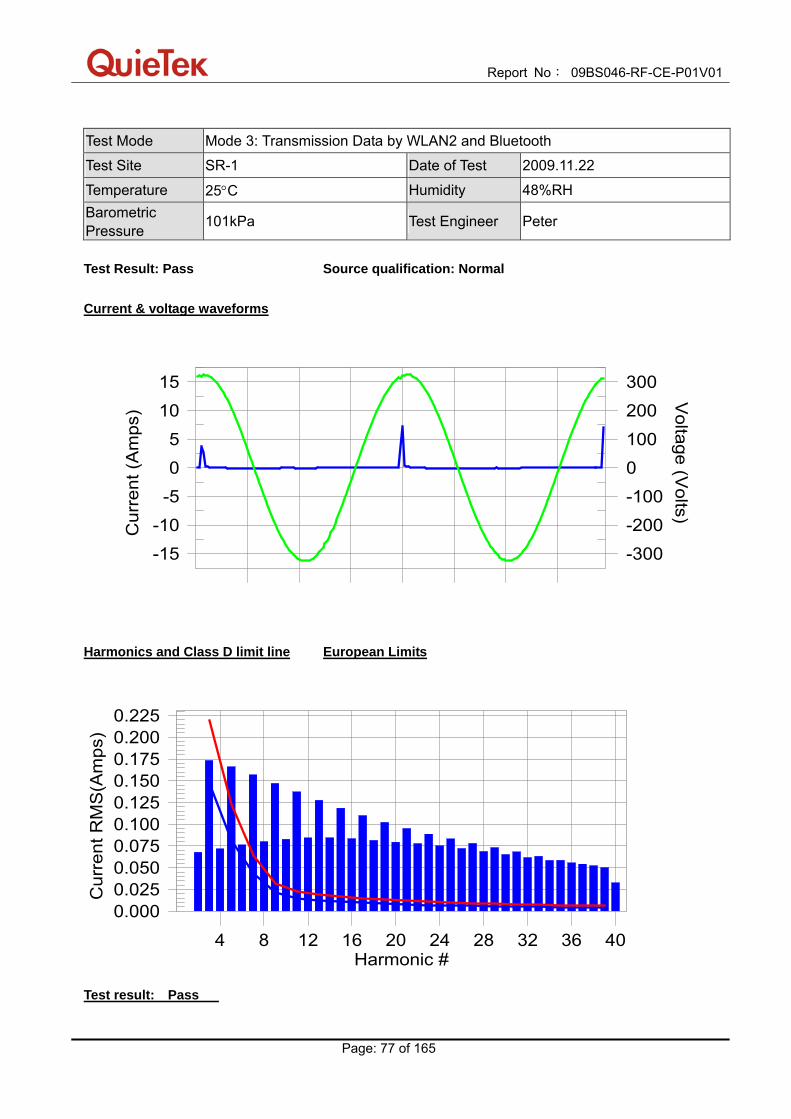
Report No: 09BS046-RF-CE-P01V01
Page: 77 of 165
Test Mode Mode 3: Transmission Data by WLAN2 and Bluetooth
Test Site SR-1 Date of Test 2009.11.22
Temperature 25°C Humidity 48%RH Barometric Pressure
101kPa Test Engineer Peter
Test Result: Pass Source qualification: Normal
Current & voltage waveforms
-15-10
-505
1015
-300-200-1000100200300
Cur
rent
(Am
ps)
Voltage (V
olts)
Harmonics and Class D limit line European Limits
0.0000.0250.0500.0750.1000.1250.1500.1750.2000.225
Cur
rent
RM
S(A
mps
)
Harmonic #4 8 12 16 20 24 28 32 36 40
Test result: Pass

Report No: 09BS046-RF-CE-P01V01
Page: 78 of 165
Test Result: Pass Source qualification: Normal THC(A): 0.00 I-THD(%): 0.00 POHC(A): 0.000 POHC Limit(A): 0.000 Highest parameter values during test:
V_RMS (Volts): 229.84 Frequency(Hz): 50.00 I_Peak (Amps): 8.831 I_RMS (Amps): 0.731 I_Fund (Amps): 0.182 Crest Factor: 15.684 Power (Watts): 43.0 Power Factor: 0.453
Harm# Harms(avg) 100%Limit %of Limit Harms(max) 150%Limit %of Limit Status 2 0.068 3 0.167 0.146 0.0 0.173 0.220 0.00 Pass 4 0.072 5 0.158 0.082 0.0 0.166 0.123 0.00 Pass 6 0.076 7 0.146 0.043 0.0 0.157 0.065 0.00 Pass 8 0.080 9 0.133 0.022 0.0 0.147 0.032 0.00 Pass 10 0.083 11 0.119 0.015 0.0 0.137 0.023 0.00 Pass 12 0.084 13 0.105 0.013 0.0 0.128 0.019 0.00 Pass 14 0.084 15 0.092 0.011 0.0 0.119 0.017 0.00 Pass 16 0.083 17 0.080 0.010 0.0 0.110 0.015 0.00 Pass 18 0.082 19 0.070 0.009 0.0 0.102 0.013 0.00 Pass 20 0.080 21 0.062 0.008 0.0 0.095 0.012 0.00 Pass 22 0.078 23 0.056 0.007 0.0 0.089 0.011 0.00 Pass 24 0.075 25 0.052 0.007 0.0 0.083 0.010 0.00 Pass 26 0.072 27 0.048 0.006 0.0 0.078 0.009 0.00 Pass 28 0.069 29 0.045 0.006 0.0 0.073 0.009 0.00 Pass 30 0.065 31 0.042 0.005 0.0 0.068 0.008 0.00 Pass 32 0.062 33 0.038 0.005 0.0 0.063 0.008 0.00 Pass 34 0.058 35 0.035 0.005 0.0 0.059 0.007 0.00 Pass 36 0.055 37 0.032 0.004 0.0 0.054 0.007 0.00 Pass 38 0.052 39 0.029 0.004 0.0 0.050 0.006 0.00 Pass 40 0.033
1. Dynamic limits were applied for this test. The highest harmonics values in the above table may not
occur at the same window as the maximum harmonics/limit ratio. 2. According to EN61000-3-2 paragraph 7 the note 1 and 2 are valid for all applications having an active input power >75W. Others the result should be pass.
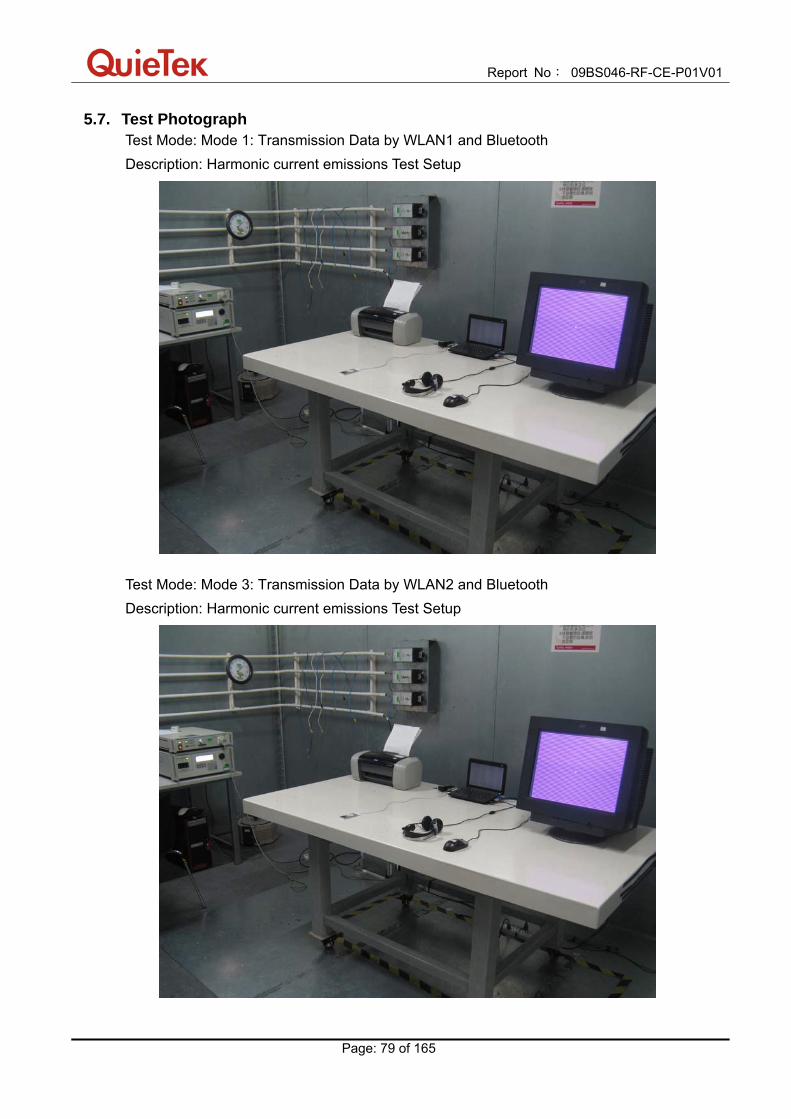
Report No: 09BS046-RF-CE-P01V01
Page: 79 of 165
5.7. Test Photograph Test Mode: Mode 1: Transmission Data by WLAN1 and Bluetooth Description: Harmonic current emissions Test Setup
Test Mode: Mode 3: Transmission Data by WLAN2 and Bluetooth Description: Harmonic current emissions Test Setup
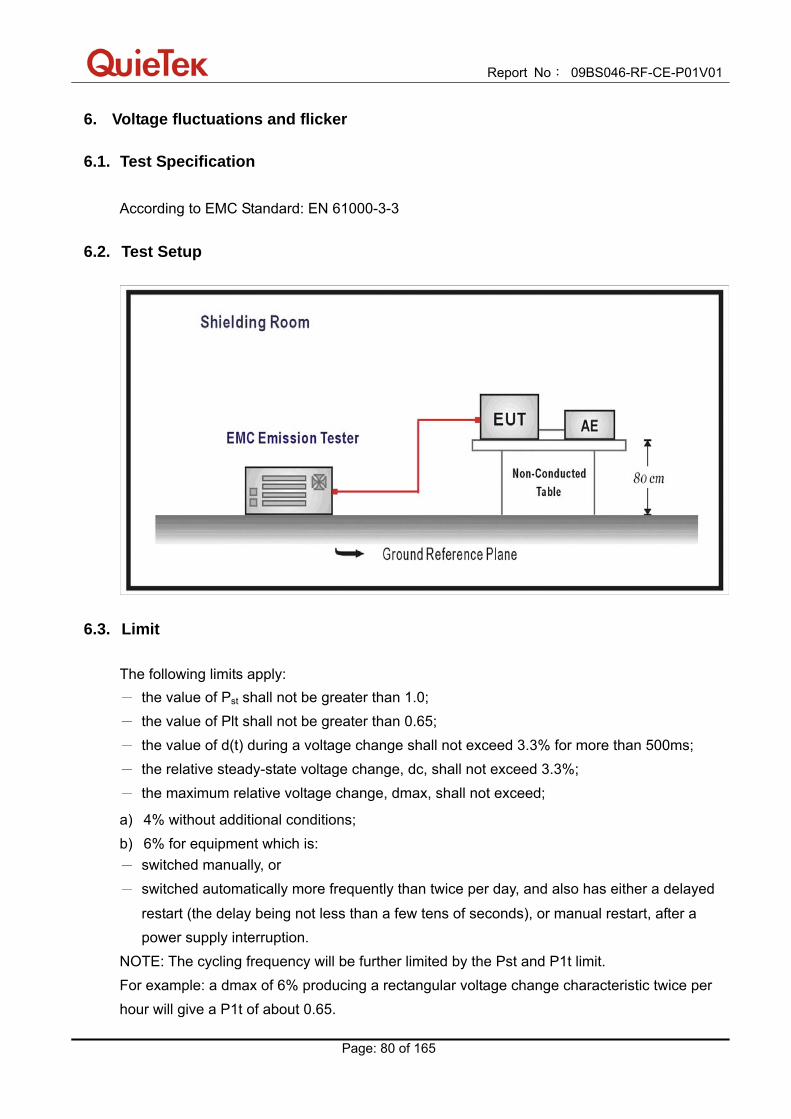
Report No: 09BS046-RF-CE-P01V01
Page: 80 of 165
6. Voltage fluctuations and flicker
6.1. Test Specification
According to EMC Standard: EN 61000-3-3
6.2. Test Setup
6.3. Limit The following limits apply: - the value of Pst shall not be greater than 1.0; - the value of Plt shall not be greater than 0.65; - the value of d(t) during a voltage change shall not exceed 3.3% for more than 500ms; - the relative steady-state voltage change, dc, shall not exceed 3.3%; - the maximum relative voltage change, dmax, shall not exceed;
a) 4% without additional conditions; b) 6% for equipment which is: - switched manually, or - switched automatically more frequently than twice per day, and also has either a delayed
restart (the delay being not less than a few tens of seconds), or manual restart, after a power supply interruption.
NOTE: The cycling frequency will be further limited by the Pst and P1t limit. For example: a dmax of 6% producing a rectangular voltage change characteristic twice per hour will give a P1t of about 0.65.

Report No: 09BS046-RF-CE-P01V01
Page: 81 of 165
c) 7% for equipment which is: - attended whilst in use (for example: hair dryers, vacuum cleaners, kitchen equipment such
as mixers, garden equipment such as lawn mowers, portable tools such as electric drills), or - switched on automatically, or is intended to be switched on manually, no more than twice
per day, and also has either a delayed restart (the delay being not less than a few tens of seconds) or manual restart, after a power supply interruption.
Pst and P1t requirements shall not be applied to voltage changes caused by manual switching.
6.4. Test Procedure The EUT is supplied in series with power analyzer from a power source having the same normal voltage and frequency as the rated supply voltage and the equipment under test. And the rated voltage at the supply voltage of EUT of 0.94 times and 1.06 times shall be performed.
6.5. Deviation from Test Standard No deviation.

Report No: 09BS046-RF-CE-P01V01
Page: 82 of 165
6.6. Test Result Test Mode Mode 1: Transmission Data by WLAN1 and Bluetooth
Test Site SR-1 Date of Test 2009.11.22
Temperature 25°C Humidity 48%RH Barometric Pressure 101kPa Test Engineer Peter
Test Result: Pass Status: Test Completed
Psti and limit line European Limits
0.25
0.50
0.75
1.00
Pst
18:3
7:2
2
Plt and limit line
0.10.20.30.40.50.6
Plt
18:37:22
Parameter values recorded during the test: Vrms at the end of test (Volt): 229.81 Highest dt (%): -0.31 Test limit (%): 3.30 Pass Time(mS) > dt: 0.0 Test limit (mS): 500.0 Pass Highest dc (%): 0.00 Test limit (%): 3.30 Pass Highest dmax (%): -0.18 Test limit (%): 4.00 Pass Highest Pst (10 min. period): 0.160 Test limit: 1.000 Pass Highest Plt (2 hr. period): 0.070 Test limit: 0.650 Pass

Report No: 09BS046-RF-CE-P01V01
Page: 83 of 165
Test Mode Mode 3: Transmission Data by WLAN2 and Bluetooth Test Site SR-1 Date of Test 2009.11.22
Temperature 25°C Humidity 48%RH Barometric Pressure 101kPa Test Engineer Peter
Test Result: Pass Status: Test Completed
Psti and limit line European Limits
0.25
0.50
0.75
1.00
Pst
19:09:14
Plt and limit line
0.10.20.30.40.50.6
Plt
19:09:14
Parameter values recorded during the test: Vrms at the end of test (Volt): 229.82 Highest dt (%): 0.39 Test limit (%): 3.30 Pass Time(mS) > dt: 0.0 Test limit (mS): 500.0 Pass Highest dc (%): 0.00 Test limit (%): 3.30 Pass Highest dmax (%): -0.20 Test limit (%): 4.00 Pass Highest Pst (10 min. period): 0.160 Test limit: 1.000 Pass Highest Plt (2 hr. period): 0.070 Test limit: 0.650 Pass

Report No: 09BS046-RF-CE-P01V01
Page: 84 of 165
6.7. Test Photograph Test Mode: Mode 1: Transmission Data by WLAN1 and Bluetooth Description: Voltage fluctuations and flicker Test Setup
Test Mode: Mode 3: Transmission Data by WLAN2 and Bluetooth Description: Voltage fluctuations and flicker Test Setup

Report No: 09BS046-RF-CE-P01V01
Page: 85 of 165
7. Electrostatic discharge
7.1. Test Specification
According to EMC Standard: EN 61000-4-2
7.2. Test Setup
7.3. Limit
Environmental phenomenon
Test specification Units Performance criterion
Enclosure port
Electrostatic discharge
±4 (Contact discharge) ±8 (Air discharge)
kV (Charge voltage) kV (Charge voltage)
B
7.4. Test Procedure
Direct application of discharges to the EUT: Contact discharge was applied only to conductive surfaces of the EUT. Air discharges were applied only to non-conductive surfaces of the EUT. During the test, it was performed with single discharges. For the single discharge time between successive single discharges will be keep longer 1 second. It was at least ten single discharges with positive and negative at the same selected point.

Report No: 09BS046-RF-CE-P01V01
Page: 86 of 165
The selected point, which was performed with electrostatic discharge, was marked on the red label of the EUT. Indirect application of discharges to the EUT: Vertical Coupling Plane (VCP): The coupling plane, of dimensions 0.5m x 0.5m, is placed parallel to, and positioned at a distance 0.1m from, the EUT, with the Discharge Electrode touching the coupling plane. The four faces of the EUT will be performed with electrostatic discharge. It was at least ten single discharges with positive and negative at the same selected point. Horizontal Coupling Plane (HCP): The coupling plane is placed under to the EUT. The generator shall be positioned vertically at a distance of 0.1m from the EUT, with the Discharge Electrode touching the coupling plane. The four faces of the EUT will be performed with electrostatic discharge. It was at least ten single discharges with positive and negative at the same selected point.
7.5. Deviation from Test Standard No deviation.

Report No: 09BS046-RF-CE-P01V01
Page: 87 of 165
7.6. Test Result Test Mode Mode 1: Transmission by WLAN1 and Bluetooth
Test Site SR-3 Date of Test 2009.11.23
Temperature 22°C Humidity 42%RH Barometric Pressure 101kPa Test Engineer Seven
Air Discharge
Test Level Test Location
+2kV -2kV +4kV -4kV +8kV -8kVObservation Result
1 A A A A A A Note Pass
2 A A A A A A Note Pass
3 A A A A A A Note Pass
4 A A A A A A Note Pass
5 A A A A A A Note Pass
6 A A A A A A Note Pass
7 A A A A A A Note Pass
8 A A A A A A Note Pass
9 A A A A A A Note Pass
10 A A A A A A Note Pass
11 A A A A A A Note Pass
12 A A A A A A Note Pass
13 A A A A A A Note Pass
14 A A A A A A Note Pass
15 A A A A A A Note Pass
16 A A A A A A Note Pass
17 A A A A A A Note Pass
18 A A A A A A Note Pass
19 A A A A A A Note Pass
20 A A A A A A Note Pass
21 A A A A A A Note Pass
22 A A A A A A Note Pass
23 A A A A A A Note Pass
24 A A A A A A Note Pass
25 A A A A A A Note Pass
26 A A A A A A Note Pass
27 A A A A A A Note Pass
28 A A A A A A Note Pass

Report No: 09BS046-RF-CE-P01V01
Page: 88 of 165
29 A A A A A A Note Pass
30 A A A A A A Note Pass
31 A A A A A A Note Pass
32 A A A A A A Note Pass
33 A A A A A A Note Pass
34 A A A A A A Note Pass
35 A A A A A A Note Pass
36 A A A A A A Note Pass
38 A A A A A A Note Pass
39 A A A A A A Note Pass
40 A A A A A A Note Pass
41 A A A A A A Note Pass
42 A A A A A A Note Pass
43 A A A A A A Note Pass
44 A A A A A A Note Pass
45 A A A A A A Note Pass
46 A A A A A A Note Pass
47 A A A A A A Note Pass
48 A A A A A A Note Pass
49 A A A A A A Note Pass
50 A A A A A A Note Pass
51 A A A A A A Note Pass
52 A A A A A A Note Pass
53 A A A A A A Note Pass
54 A A A A A A Note Pass
Contact Discharge
Test Level Test Location
+2kV -2kV +4kV -4kV Observation Result
37 A A A A Note Pass

Report No: 09BS046-RF-CE-P01V01
Page: 89 of 165
Horizontal Coupling
Test Level Test Location
+2kV -2kV +4kV -4kV Observation Result
Front A A A A Note Pass
Rear A A A A Note Pass
Left A A A A Note Pass
Right A A A A Note Pass
Vertical Coupling
Test Level Test Location
+2kV -2kV +4kV -4kV Observation Result
Front A A A A Note Pass
Rear A A A A Note Pass
Left A A A A Note Pass
Right A A A A Note Pass
NOTE: There was no change compared with initial operation during the test.

Report No: 09BS046-RF-CE-P01V01
Page: 90 of 165
Test Mode Mode 2: Standby
Test Site SR-3 Date of Test 2009.11.23
Temperature 22°C Humidity 42%RH Barometric Pressure 101kPa Test Engineer Seven
Air Discharge
Test Level Test Location
+2kV -2kV +4kV -4kV +8kV -8kVObservation Result
1 A A A A A A Note Pass
2 A A A A A A Note Pass
3 A A A A A A Note Pass
4 A A A A A A Note Pass
5 A A A A A A Note Pass
6 A A A A A A Note Pass
7 A A A A A A Note Pass
8 A A A A A A Note Pass
9 A A A A A A Note Pass
10 A A A A A A Note Pass
11 A A A A A A Note Pass
12 A A A A A A Note Pass
13 A A A A A A Note Pass
14 A A A A A A Note Pass
15 A A A A A A Note Pass
16 A A A A A A Note Pass
17 A A A A A A Note Pass
18 A A A A A A Note Pass
19 A A A A A A Note Pass
20 A A A A A A Note Pass
21 A A A A A A Note Pass
22 A A A A A A Note Pass
23 A A A A A A Note Pass
24 A A A A A A Note Pass
25 A A A A A A Note Pass
26 A A A A A A Note Pass
27 A A A A A A Note Pass
28 A A A A A A Note Pass

Report No: 09BS046-RF-CE-P01V01
Page: 91 of 165
29 A A A A A A Note Pass
30 A A A A A A Note Pass
31 A A A A A A Note Pass
32 A A A A A A Note Pass
33 A A A A A A Note Pass
34 A A A A A A Note Pass
35 A A A A A A Note Pass
36 A A A A A A Note Pass
38 A A A A A A Note Pass
39 A A A A A A Note Pass
40 A A A A A A Note Pass
41 A A A A A A Note Pass
42 A A A A A A Note Pass
43 A A A A A A Note Pass
44 A A A A A A Note Pass
45 A A A A A A Note Pass
46 A A A A A A Note Pass
47 A A A A A A Note Pass
48 A A A A A A Note Pass
49 A A A A A A Note Pass
50 A A A A A A Note Pass
51 A A A A A A Note Pass
52 A A A A A A Note Pass
53 A A A A A A Note Pass
54 A A A A A A Note Pass
Contact Discharge
Test Level Test Location
+2kV -2kV +4kV -4kV Observation Result
37 A A A A Note Pass

Report No: 09BS046-RF-CE-P01V01
Page: 92 of 165
Horizontal Coupling
Test Level Test Location
+2kV -2kV +4kV -4kV Observation Result
Front A A A A Note Pass
Rear A A A A Note Pass
Left A A A A Note Pass
Right A A A A Note Pass
Vertical Coupling
Test Level Test Location
+2kV -2kV +4kV -4kV Observation Result
Front A A A A Note Pass
Rear A A A A Note Pass
Left A A A A Note Pass
Right A A A A Note Pass
NOTE: There was no change compared with initial operation during the test.

Report No: 09BS046-RF-CE-P01V01
Page: 93 of 165
Test Mode Mode 3: Transmission by WLAN2 and Bluetooth
Test Site SR-3 Date of Test 2009.11.23
Temperature 22°C Humidity 42%RH Barometric Pressure 101kPa Test Engineer Seven
Air Discharge
Test Level Test Location
+2kV -2kV +4kV -4kV +8kV -8kVObservation Result
1 A A A A A A Note Pass
2 A A A A A A Note Pass
3 A A A A A A Note Pass
4 A A A A A A Note Pass
5 A A A A A A Note Pass
6 A A A A A A Note Pass
7 A A A A A A Note Pass
8 A A A A A A Note Pass
9 A A A A A A Note Pass
10 A A A A A A Note Pass
11 A A A A A A Note Pass
12 A A A A A A Note Pass
13 A A A A A A Note Pass
14 A A A A A A Note Pass
15 A A A A A A Note Pass
16 A A A A A A Note Pass
17 A A A A A A Note Pass
18 A A A A A A Note Pass
19 A A A A A A Note Pass
20 A A A A A A Note Pass
21 A A A A A A Note Pass
22 A A A A A A Note Pass
23 A A A A A A Note Pass
24 A A A A A A Note Pass
25 A A A A A A Note Pass
26 A A A A A A Note Pass
27 A A A A A A Note Pass
28 A A A A A A Note Pass

Report No: 09BS046-RF-CE-P01V01
Page: 94 of 165
29 A A A A A A Note Pass
30 A A A A A A Note Pass
31 A A A A A A Note Pass
32 A A A A A A Note Pass
33 A A A A A A Note Pass
34 A A A A A A Note Pass
35 A A A A A A Note Pass
36 A A A A A A Note Pass
38 A A A A A A Note Pass
39 A A A A A A Note Pass
40 A A A A A A Note Pass
41 A A A A A A Note Pass
42 A A A A A A Note Pass
43 A A A A A A Note Pass
44 A A A A A A Note Pass
45 A A A A A A Note Pass
46 A A A A A A Note Pass
47 A A A A A A Note Pass
48 A A A A A A Note Pass
49 A A A A A A Note Pass
50 A A A A A A Note Pass
51 A A A A A A Note Pass
52 A A A A A A Note Pass
53 A A A A A A Note Pass
54 A A A A A A Note Pass
Contact Discharge
Test Level Test Location
+2kV -2kV +4kV -4kV Observation Result
37 A A A A Note Pass

Report No: 09BS046-RF-CE-P01V01
Page: 95 of 165
Horizontal Coupling
Test Level Test Location
+2kV -2kV +4kV -4kV Observation Result
Front A A A A Note Pass
Rear A A A A Note Pass
Left A A A A Note Pass
Right A A A A Note Pass
Vertical Coupling
Test Level Test Location
+2kV -2kV +4kV -4kV Observation Result
Front A A A A Note Pass
Rear A A A A Note Pass
Left A A A A Note Pass
Right A A A A Note Pass
NOTE: There was no change compared with initial operation during the test.

Report No: 09BS046-RF-CE-P01V01
Page: 96 of 165
Test Mode Mode 4: Standby
Test Site SR-3 Date of Test 2009.11.23
Temperature 22°C Humidity 42%RH Barometric Pressure 101kPa Test Engineer Seven
Air Discharge
Test Level Test Location
+2kV -2kV +4kV -4kV +8kV -8kVObservation Result
1 A A A A A A Note Pass
2 A A A A A A Note Pass
3 A A A A A A Note Pass
4 A A A A A A Note Pass
5 A A A A A A Note Pass
6 A A A A A A Note Pass
7 A A A A A A Note Pass
8 A A A A A A Note Pass
9 A A A A A A Note Pass
10 A A A A A A Note Pass
11 A A A A A A Note Pass
12 A A A A A A Note Pass
13 A A A A A A Note Pass
14 A A A A A A Note Pass
15 A A A A A A Note Pass
16 A A A A A A Note Pass
17 A A A A A A Note Pass
18 A A A A A A Note Pass
19 A A A A A A Note Pass
20 A A A A A A Note Pass
21 A A A A A A Note Pass
22 A A A A A A Note Pass
23 A A A A A A Note Pass
24 A A A A A A Note Pass
25 A A A A A A Note Pass
26 A A A A A A Note Pass
27 A A A A A A Note Pass
28 A A A A A A Note Pass
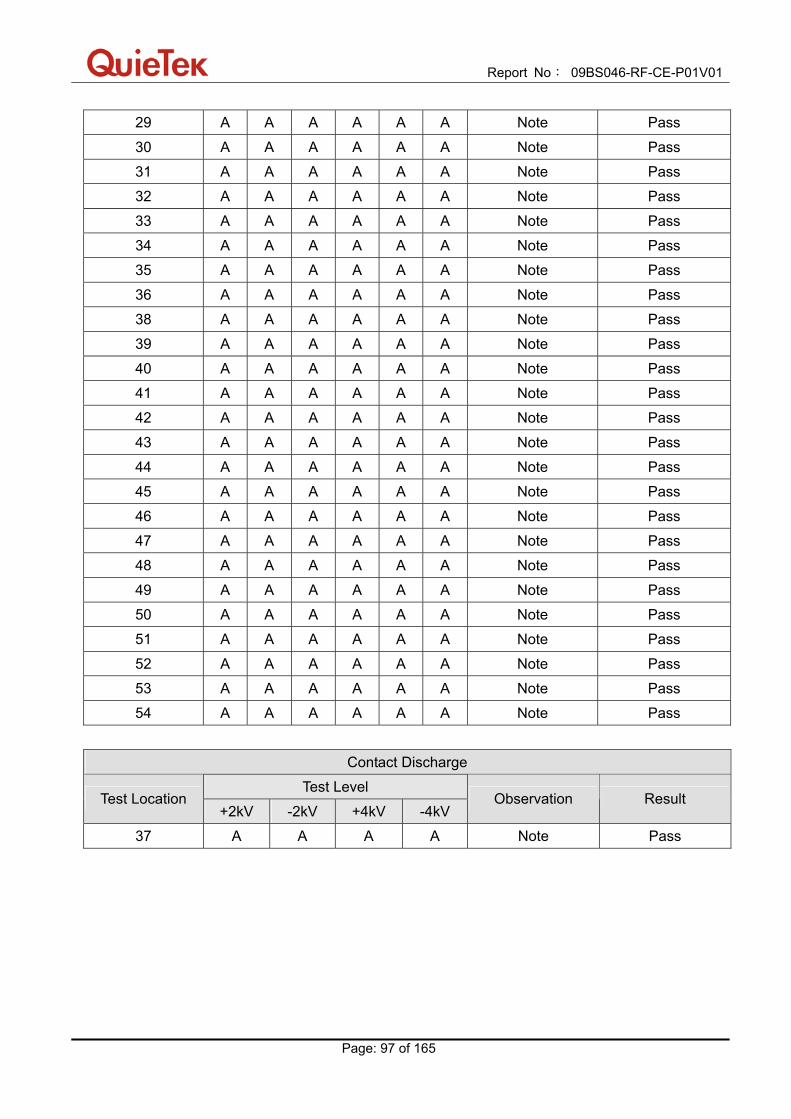
Report No: 09BS046-RF-CE-P01V01
Page: 97 of 165
29 A A A A A A Note Pass
30 A A A A A A Note Pass
31 A A A A A A Note Pass
32 A A A A A A Note Pass
33 A A A A A A Note Pass
34 A A A A A A Note Pass
35 A A A A A A Note Pass
36 A A A A A A Note Pass
38 A A A A A A Note Pass
39 A A A A A A Note Pass
40 A A A A A A Note Pass
41 A A A A A A Note Pass
42 A A A A A A Note Pass
43 A A A A A A Note Pass
44 A A A A A A Note Pass
45 A A A A A A Note Pass
46 A A A A A A Note Pass
47 A A A A A A Note Pass
48 A A A A A A Note Pass
49 A A A A A A Note Pass
50 A A A A A A Note Pass
51 A A A A A A Note Pass
52 A A A A A A Note Pass
53 A A A A A A Note Pass
54 A A A A A A Note Pass
Contact Discharge
Test Level Test Location
+2kV -2kV +4kV -4kV Observation Result
37 A A A A Note Pass

Report No: 09BS046-RF-CE-P01V01
Page: 98 of 165
Horizontal Coupling
Test Level Test Location
+2kV -2kV +4kV -4kV Observation Result
Front A A A A Note Pass
Rear A A A A Note Pass
Left A A A A Note Pass
Right A A A A Note Pass
Vertical Coupling
Test Level Test Location
+2kV -2kV +4kV -4kV Observation Result
Front A A A A Note Pass
Rear A A A A Note Pass
Left A A A A Note Pass
Right A A A A Note Pass
NOTE: There was no change compared with initial operation during the test.

Report No: 09BS046-RF-CE-P01V01
Page: 99 of 165
7.7. Test Photograph Test Mode: Mode 1: Transmission Data by WLAN1 and Bluetooth Description: Electrostatic discharge Test Setup
Test Mode: Mode 2: Standby Description: Electrostatic discharge Test Setup

Report No: 09BS046-RF-CE-P01V01
Page: 100 of 165
Test Mode: Mode 3: Transmission Data by WLAN2 and Bluetooth Description: Electrostatic discharge Test Setup
Test Mode: Mode 4: Standby Description: Electrostatic discharge Test Setup

Report No: 09BS046-RF-CE-P01V01
Page: 101 of 165
Electrostatic discharge Test Location

Report No: 09BS046-RF-CE-P01V01
Page: 102 of 165

Report No: 09BS046-RF-CE-P01V01
Page: 103 of 165

Report No: 09BS046-RF-CE-P01V01
Page: 104 of 165
8. Radio frequency electromagnetic field
8.1. Test Specification
According to EMC Standard: EN 61000-4-3
8.2. Test Setup
8.3. Limit
Environmental phenomenon
Test specification Units Performance criterion
Enclosure port
Radio frequency electromagnetic field
80 - 1000, 1400 - 2700 3 80
MHz V/m (unmodulated, r.m.s) % AM (1kHz)
A
NOTE 1: If the wanted signal is modulated at 1000Hz, then an audio signal of 400Hz shall be used. NOTE 2: The test shall be performed over the frequency range 80MHz to 1000MHz and 1400MHz to 2700MHz with the exception of the exclusion band for transmitters, receivers and duplex transceivers [see clause 4 of EN 301 489-1 V1.8.1 (2008-04)], as appropriate.
8.4. Test Procedure The EUT and load, which are placed on a table that is 0.8 meter above ground, are placed with one coincident with the calibration plane such that the distance from antenna to the EUT was 3 meters.

Report No: 09BS046-RF-CE-P01V01
Page: 105 of 165
Both horizontal and vertical polarization of the antenna and four sides of the EUT are set on measurement. In order to judge the EUT performance, a CCD camera is used to monitor EUT screen. All the scanning conditions are as follows:
Condition of Test Remarks
1. Field Strength 3V/m
2. Radiated Signal AM 80% Modulated with 1kHz
3. Scanning Frequency 80 - 1000MHz, 1400 - 2700MHz
4 Dwell Time 3 Seconds
5. Frequency Step Size Δ f 1%
6. The Rate of Sweep of Frequency 1.5 x 10⁻³ decades/s
8.5. Deviation from Test Standard
No deviation.

Report No: 09BS046-RF-CE-P01V01
Page: 106 of 165
8.6. Test Result Test Mode Mode 1: Transmission Data by WLAN1 and Bluetooth
Test Site AC-4 Date of Test 2009.11.22
Temperature 25°C Humidity 48%RH Barometric Pressure 101kPa Test Engineer Allen
Frequency
(MHz) Polarity Position
Field Strength(V/m)
Complied to Criteria
Observation Result
80-1000 Horizontal Front 3 A Note Pass
80-1000 Vertical Front 3 A Note Pass
80-1000 Horizontal Rear 3 A Note Pass
80-1000 Vertical Rear 3 A Note Pass
80-1000 Horizontal Left 3 A Note Pass
80-1000 Vertical Left 3 A Note Pass
80-1000 Horizontal Right 3 A Note Pass
80-1000 Vertical Right 3 A Note Pass
1400-2700 Horizontal Front 3 A Note Pass
1400-2700 Vertical Front 3 A Note Pass
1400-2700 Horizontal Rear 3 A Note Pass
1400-2700 Vertical Rear 3 A Note Pass
1400-2700 Horizontal Left 3 A Note Pass
1400-2700 Vertical Left 3 A Note Pass
1400-2700 Horizontal Right 3 A Note Pass
1400-2700 Vertical Right 3 A Note Pass
NOTE: There was no change compared with initial operation during the test.

Report No: 09BS046-RF-CE-P01V01
Page: 107 of 165
Test Mode Mode 2: Standby
Test Site AC-4 Date of Test 2009.11.22
Temperature 25°C Humidity 48%RH Barometric Pressure 101kPa Test Engineer Allen
Frequency
(MHz) Polarity Position
Field Strength(V/m)
Complied to Criteria
Observation Result
80-1000 Horizontal Front 3 A Note Pass
80-1000 Vertical Front 3 A Note Pass
80-1000 Horizontal Rear 3 A Note Pass
80-1000 Vertical Rear 3 A Note Pass
80-1000 Horizontal Left 3 A Note Pass
80-1000 Vertical Left 3 A Note Pass
80-1000 Horizontal Right 3 A Note Pass
80-1000 Vertical Right 3 A Note Pass
1400-2700 Horizontal Front 3 A Note Pass
1400-2700 Vertical Front 3 A Note Pass
1400-2700 Horizontal Rear 3 A Note Pass
1400-2700 Vertical Rear 3 A Note Pass
1400-2700 Horizontal Left 3 A Note Pass
1400-2700 Vertical Left 3 A Note Pass
1400-2700 Horizontal Right 3 A Note Pass
1400-2700 Vertical Right 3 A Note Pass
NOTE: There was no change compared with initial operation during the test.

Report No: 09BS046-RF-CE-P01V01
Page: 108 of 165
Test Mode Mode 3: Transmission Data by WLAN2 and Bluetooth
Test Site AC-4 Date of Test 2009.11.22
Temperature 25°C Humidity 48%RH Barometric Pressure 101kPa Test Engineer Allen
Frequency
(MHz) Polarity Position
Field Strength(V/m)
Complied to Criteria
Observation Result
80-1000 Horizontal Front 3 A Note Pass
80-1000 Vertical Front 3 A Note Pass
80-1000 Horizontal Rear 3 A Note Pass
80-1000 Vertical Rear 3 A Note Pass
80-1000 Horizontal Left 3 A Note Pass
80-1000 Vertical Left 3 A Note Pass
80-1000 Horizontal Right 3 A Note Pass
80-1000 Vertical Right 3 A Note Pass
1400-2700 Horizontal Front 3 A Note Pass
1400-2700 Vertical Front 3 A Note Pass
1400-2700 Horizontal Rear 3 A Note Pass
1400-2700 Vertical Rear 3 A Note Pass
1400-2700 Horizontal Left 3 A Note Pass
1400-2700 Vertical Left 3 A Note Pass
1400-2700 Horizontal Right 3 A Note Pass
1400-2700 Vertical Right 3 A Note Pass
NOTE: There was no change compared with initial operation during the test.

Report No: 09BS046-RF-CE-P01V01
Page: 109 of 165
Test Mode Mode 4: Standby
Test Site AC-4 Date of Test 2009.11.22
Temperature 25°C Humidity 48%RH Barometric Pressure 101kPa Test Engineer Allen
Frequency
(MHz) Polarity Position
Field Strength(V/m)
Complied to Criteria
Observation Result
80-1000 Horizontal Front 3 A Note Pass
80-1000 Vertical Front 3 A Note Pass
80-1000 Horizontal Rear 3 A Note Pass
80-1000 Vertical Rear 3 A Note Pass
80-1000 Horizontal Left 3 A Note Pass
80-1000 Vertical Left 3 A Note Pass
80-1000 Horizontal Right 3 A Note Pass
80-1000 Vertical Right 3 A Note Pass
1400-2700 Horizontal Front 3 A Note Pass
1400-2700 Vertical Front 3 A Note Pass
1400-2700 Horizontal Rear 3 A Note Pass
1400-2700 Vertical Rear 3 A Note Pass
1400-2700 Horizontal Left 3 A Note Pass
1400-2700 Vertical Left 3 A Note Pass
1400-2700 Horizontal Right 3 A Note Pass
1400-2700 Vertical Right 3 A Note Pass
NOTE: There was no change compared with initial operation during the test.
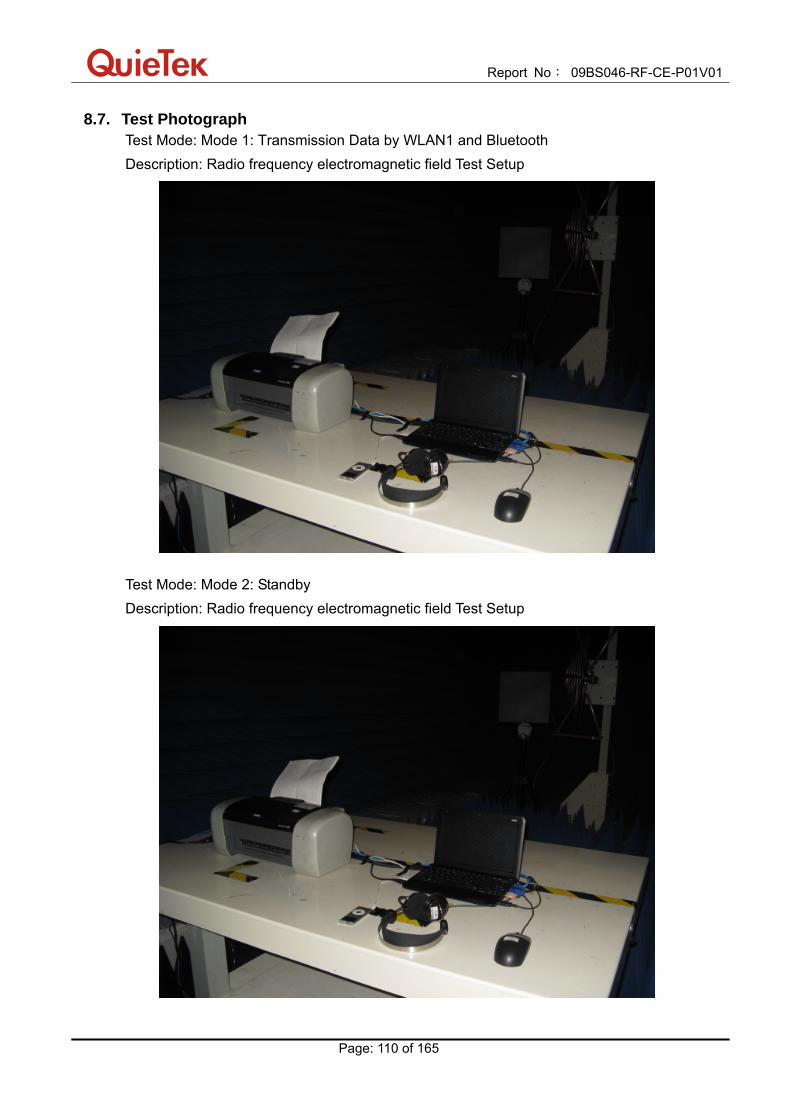
Report No: 09BS046-RF-CE-P01V01
Page: 110 of 165
8.7. Test Photograph Test Mode: Mode 1: Transmission Data by WLAN1 and Bluetooth Description: Radio frequency electromagnetic field Test Setup
Test Mode: Mode 2: Standby Description: Radio frequency electromagnetic field Test Setup

Report No: 09BS046-RF-CE-P01V01
Page: 111 of 165
Test Mode: Mode 3: Transmission Data by WLAN2 and Bluetooth Description: Radio frequency electromagnetic field Test Setup
Test Mode: Mode 4: Standby Description: Radio frequency electromagnetic field Test Setup

Report No: 09BS046-RF-CE-P01V01
Page: 112 of 165
9. Fast transients common mode
9.1. Test Specification
According to EMC Standard: EN 61000-4-4
9.2. Test Setup
9.3. Limit
Environmental phenomenon
Test specification Units Performance criterion
AC mains power input ports
Fast transients common mode
±1.0 5/50 5
kV (peak) Tr/Th ns Repetition frequency kHz
B
DC power input ports (See Note)
Fast transients common mode
±0.5 5/50 5
kV (peak) Tr/Th ns Repetition frequency kHz
B
Singal ports, telecommunication ports, and control ports (See Note)
Fast transients common mode
±0.5 5/50
kV (peak) Tr/Th ns
B
Report No: 09BS046-RF-CE-P01V01
Page: 113 of 165
5 Repetition frequency kHz
NOTE: This test shall be additionally performed on signal ports, telecommunication ports, control ports, and DC power ports, of radio equipment and associated ancillary equipment, if the cables may be longer than 3m.
9.4. Test Procedure The EUT is placed on a table that is 0.8 meter height. A ground reference plane is placed on the table, and uses a 0.1m insulation between the EUT and ground reference plane.
The minimum area of the ground reference plane is 1m*1m, and 0.65mm thick min, and projected beyond the EUT by at least 0.1m on all sides. For AC mains power input ports and DC power input ports: The EUT is connected to the power mains through a coupling device that directly couples the EFT/B interference signal. Each of the line conductors is impressed with burst noise for 1 minute. The length of the power lines between the coupling device and the EUT is 0.5m. For signal ports, telecommunication ports, and control ports: The EFT interference signal is through a coupling clamp device couples to the signal of the EUT with burst noise for 1 minute. The length of the signal lines between the coupling device and the EUT is 0.5m.
9.5. Deviation from Test Standard No deviation.

Report No: 09BS046-RF-CE-P01V01
Page: 114 of 165
9.6. Test Result Test Mode Mode 1: Transmission Data by WLAN1 and Bluetooth
Test Site SR-2 Date of Test 2009.11.22
Temperature 25°C Humidity 48%RH Barometric Pressure 101kPa Test Engineer Seven
Inject Line
Polarity Test Level
(kV) Test Duration
(second) Inject
MethodComplied to Criteria
Observation Result
L + 1 60 Direct A Note Pass
L - 1 60 Direct A Note Pass
N + 1 60 Direct A Note Pass
N - 1 60 Direct A Note Pass
PE + 1 60 Direct A Note Pass
PE - 1 60 Direct A Note Pass
L+N+PE + 1 60 Direct A Note Pass
L+N+PE - 1 60 Direct A Note Pass
LAN + 0.5 60 Clamp A Note Pass
LAN - 0.5 60 Clamp A Note Pass
NOTE: There was no change compared with initial operation during the test.

Report No: 09BS046-RF-CE-P01V01
Page: 115 of 165
Test Mode Mode 2: Standby
Test Site SR-2 Date of Test 2009.11.22
Temperature 25°C Humidity 48%RH Barometric Pressure 101kPa Test Engineer Seven
Inject Line
Polarity Test Level
(kV) Test Duration
(second) Inject
MethodComplied to Criteria
Observation Result
L + 1 60 Direct A Note Pass
L - 1 60 Direct A Note Pass
N + 1 60 Direct A Note Pass
N - 1 60 Direct A Note Pass
PE + 1 60 Direct A Note Pass
PE - 1 60 Direct A Note Pass
L+N+PE + 1 60 Direct A Note Pass
L+N+PE - 1 60 Direct A Note Pass
LAN + 0.5 60 Clamp A Note Pass
LAN - 0.5 60 Clamp A Note Pass
NOTE: There was no change compared with initial operation during the test.

Report No: 09BS046-RF-CE-P01V01
Page: 116 of 165
Test Mode Mode 3: Transmission Data by WLAN2 and Bluetooth
Test Site SR-2 Date of Test 2009.11.22
Temperature 25°C Humidity 48%RH Barometric Pressure 101kPa Test Engineer Seven
Inject Line
Polarity Test Level
(kV) Test Duration
(second) Inject
MethodComplied to Criteria
Observation Result
L + 1 60 Direct A Note Pass
L - 1 60 Direct A Note Pass
N + 1 60 Direct A Note Pass
N - 1 60 Direct A Note Pass
PE + 1 60 Direct A Note Pass
PE - 1 60 Direct A Note Pass
L+N+PE + 1 60 Direct A Note Pass
L+N+PE - 1 60 Direct A Note Pass
LAN + 0.5 60 Clamp A Note Pass
LAN - 0.5 60 Clamp A Note Pass
NOTE: There was no change compared with initial operation during the test.

Report No: 09BS046-RF-CE-P01V01
Page: 117 of 165
Test Mode Mode 4: Standby
Test Site SR-2 Date of Test 2009.11.22
Temperature 25°C Humidity 48%RH Barometric Pressure 101kPa Test Engineer Seven
Inject Line
Polarity Test Level
(kV) Test Duration
(second) Inject
MethodComplied to Criteria
Observation Result
L + 1 60 Direct A Note Pass
L - 1 60 Direct A Note Pass
N + 1 60 Direct A Note Pass
N - 1 60 Direct A Note Pass
PE + 1 60 Direct A Note Pass
PE - 1 60 Direct A Note Pass
L+N+PE + 1 60 Direct A Note Pass
L+N+PE - 1 60 Direct A Note Pass
LAN + 0.5 60 Clamp A Note Pass
LAN - 0.5 60 Clamp A Note Pass
NOTE: There was no change compared with initial operation during the test.

Report No: 09BS046-RF-CE-P01V01
Page: 118 of 165
9.7. Test Photograph Test Mode: Mode 1: Transmission Data by WLAN1 and Bluetooth Description: Fast transients common mode Test Setup (AC mains power input ports)
Test Mode: Mode 1: Transmission Data by WLAN1 and Bluetooth Description: Fast transients common mode Test Setup (LAN)

Report No: 09BS046-RF-CE-P01V01
Page: 119 of 165
Test Mode: Mode 2: Standby Description: Fast transients common mode Test Setup (AC mains power input ports)
Test Mode: Mode 2: Standby Description: Fast transients common mode Test Setup (LAN)

Report No: 09BS046-RF-CE-P01V01
Page: 120 of 165
Test Mode: Mode 3: Transmission Data by WLAN2 and Bluetooth Description: Fast transients common mode Test Setup (AC mains power input ports)
Test Mode: Mode 3: Transmission Data by WLAN2 and Bluetooth Description: Fast transients common mode Test Setup (LAN)

Report No: 09BS046-RF-CE-P01V01
Page: 121 of 165
Test Mode: Mode 4: Standby Description: Fast transients common mode Test Setup (AC mains power input ports)
Test Mode: Mode 4: Standby Description: Fast transients common mode Test Setup (LAN)
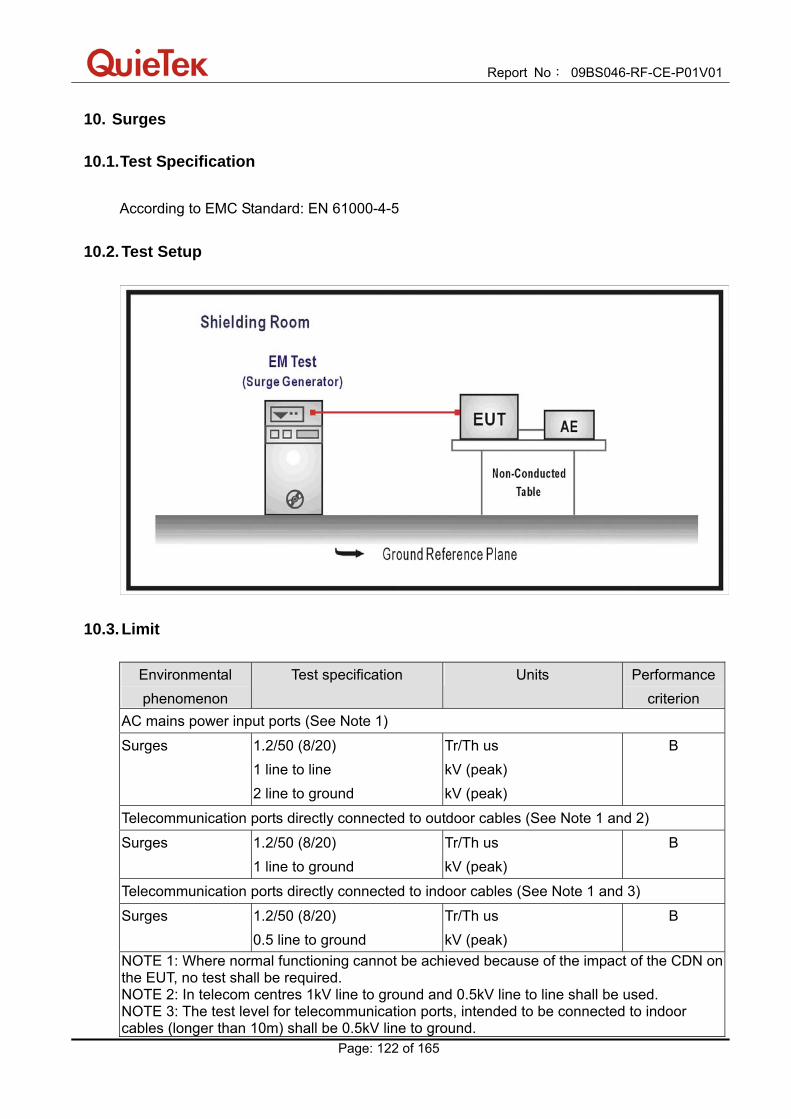
Report No: 09BS046-RF-CE-P01V01
Page: 122 of 165
10. Surges
10.1. Test Specification
According to EMC Standard: EN 61000-4-5
10.2. Test Setup
10.3. Limit
Environmental phenomenon
Test specification Units Performance criterion
AC mains power input ports (See Note 1)
Surges 1.2/50 (8/20) 1 line to line 2 line to ground
Tr/Th us kV (peak) kV (peak)
B
Telecommunication ports directly connected to outdoor cables (See Note 1 and 2)
Surges 1.2/50 (8/20) 1 line to ground
Tr/Th us kV (peak)
B
Telecommunication ports directly connected to indoor cables (See Note 1 and 3)
Surges 1.2/50 (8/20) 0.5 line to ground
Tr/Th us kV (peak)
B
NOTE 1: Where normal functioning cannot be achieved because of the impact of the CDN on the EUT, no test shall be required. NOTE 2: In telecom centres 1kV line to ground and 0.5kV line to line shall be used. NOTE 3: The test level for telecommunication ports, intended to be connected to indoor cables (longer than 10m) shall be 0.5kV line to ground.

Report No: 09BS046-RF-CE-P01V01
Page: 123 of 165
10.4. Test Procedure
The EUT is placed on a table that is 0.8 meter above a metal ground plane measured 1m*1m minimum and 0.65mm thick minimum and projected beyond the EUT by at least 0.1m on all sides. The length of power cord between the coupling device and the EUT shall be 2m or less. For AC mains power input ports: The EUT is connected to the power mains through a coupling device that directly couples the surge interference signal. The surge noise shall be applied synchronized to the voltage phase at 00, 900, 1800, 2700 and the peak value of the a.c. voltage wave. (Positive and negative) Each of Line to Earth and Line to Line is impressed with a sequence of five surge voltages with interval of 1 minute. For telecommunication ports: The signal line of EUT is connected to coupling and decoupling network that directly couples the surge interference signal. Only Line to ground is impressed with a sequence of five surge voltages with interval of 1
minute.
10.5. Deviation from Test Standard No deviation.

Report No: 09BS046-RF-CE-P01V01
Page: 124 of 165
10.6. Test Result Test Mode Mode 1: Transmission Data by WLAN1 and Bluetooth
Test Site SR-2 Date of Test 2009.11.22
Temperature 25°C Humidity 48%RH Barometric Pressure 101kPa Test Engineer Allen
Inject Line
Polarity Angle
(degree) Test Level
(kV) Test Interval
(second) Complied to Criteria
Observation Result
L+N + 0 1 60 A Note Pass
L+N - 0 1 60 A Note Pass
L+N + 90 1 60 A Note Pass
L+N - 90 1 60 A Note Pass
L+N + 180 1 60 A Note Pass
L+N - 180 1 60 A Note Pass
L+N + 270 1 60 A Note Pass
L+N - 270 1 60 A Note Pass
L+PE + 0 2 60 A Note Pass
L+PE - 0 2 60 A Note Pass
L+PE + 90 2 60 A Note Pass
L+PE - 90 2 60 A Note Pass
L+PE + 180 2 60 A Note Pass
L+PE - 180 2 60 A Note Pass
L+PE + 270 2 60 A Note Pass
L+PE - 270 2 60 A Note Pass
N+PE + 0 2 60 A Note Pass
N+PE - 0 2 60 A Note Pass
N+PE + 90 2 60 A Note Pass
N+PE - 90 2 60 A Note Pass
N+PE + 180 2 60 A Note Pass
N+PE - 180 2 60 A Note Pass
N+PE + 270 2 60 A Note Pass
N+PE - 270 2 60 A Note Pass
NOTE: There was no change compared with initial operation during the test.
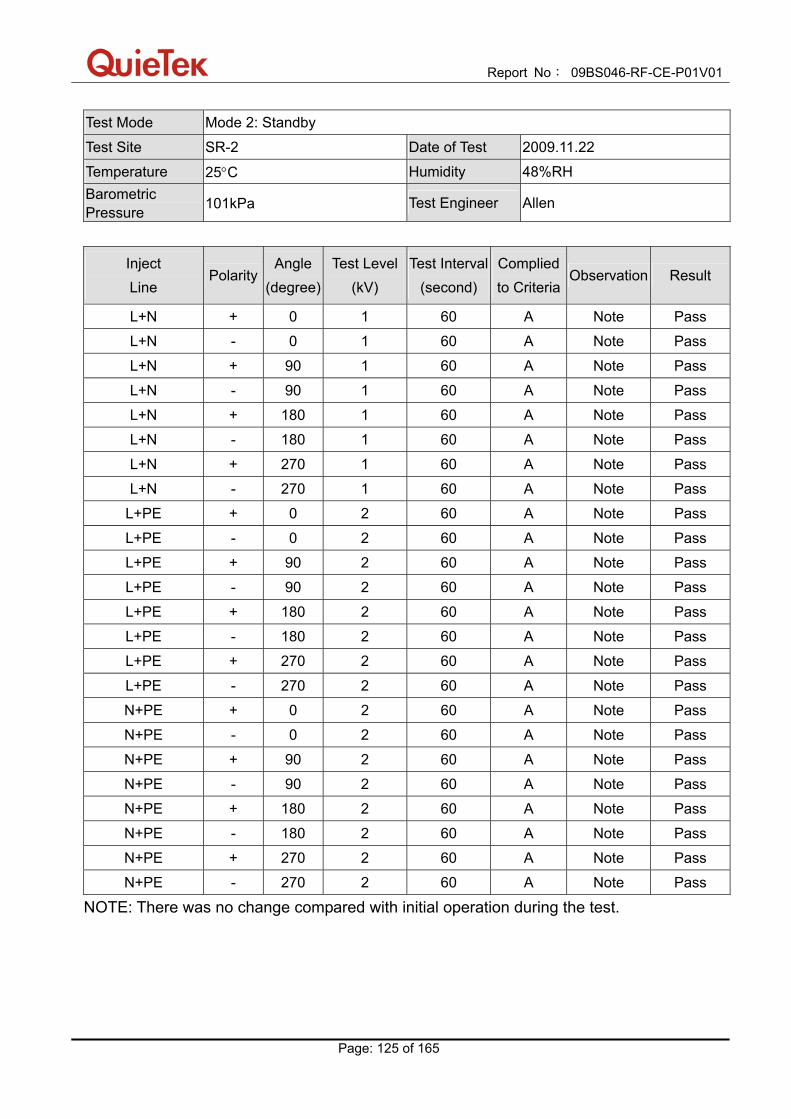
Report No: 09BS046-RF-CE-P01V01
Page: 125 of 165
Test Mode Mode 2: Standby
Test Site SR-2 Date of Test 2009.11.22
Temperature 25°C Humidity 48%RH Barometric Pressure 101kPa Test Engineer Allen
Inject Line
Polarity Angle
(degree) Test Level
(kV) Test Interval
(second) Complied to Criteria
Observation Result
L+N + 0 1 60 A Note Pass
L+N - 0 1 60 A Note Pass
L+N + 90 1 60 A Note Pass
L+N - 90 1 60 A Note Pass
L+N + 180 1 60 A Note Pass
L+N - 180 1 60 A Note Pass
L+N + 270 1 60 A Note Pass
L+N - 270 1 60 A Note Pass
L+PE + 0 2 60 A Note Pass
L+PE - 0 2 60 A Note Pass
L+PE + 90 2 60 A Note Pass
L+PE - 90 2 60 A Note Pass
L+PE + 180 2 60 A Note Pass
L+PE - 180 2 60 A Note Pass
L+PE + 270 2 60 A Note Pass
L+PE - 270 2 60 A Note Pass
N+PE + 0 2 60 A Note Pass
N+PE - 0 2 60 A Note Pass
N+PE + 90 2 60 A Note Pass
N+PE - 90 2 60 A Note Pass
N+PE + 180 2 60 A Note Pass
N+PE - 180 2 60 A Note Pass
N+PE + 270 2 60 A Note Pass
N+PE - 270 2 60 A Note Pass
NOTE: There was no change compared with initial operation during the test.

Report No: 09BS046-RF-CE-P01V01
Page: 126 of 165
Test Mode Mode 3: Transmission Data by WLAN2 and Bluetooth
Test Site SR-2 Date of Test 2009.11.22
Temperature 25°C Humidity 48%RH Barometric Pressure 101kPa Test Engineer Allen
Inject Line
Polarity Angle
(degree) Test Level
(kV) Test Interval
(second) Complied to Criteria
Observation Result
L+N + 0 1 60 A Note Pass
L+N - 0 1 60 A Note Pass
L+N + 90 1 60 A Note Pass
L+N - 90 1 60 A Note Pass
L+N + 180 1 60 A Note Pass
L+N - 180 1 60 A Note Pass
L+N + 270 1 60 A Note Pass
L+N - 270 1 60 A Note Pass
L+PE + 0 2 60 A Note Pass
L+PE - 0 2 60 A Note Pass
L+PE + 90 2 60 A Note Pass
L+PE - 90 2 60 A Note Pass
L+PE + 180 2 60 A Note Pass
L+PE - 180 2 60 A Note Pass
L+PE + 270 2 60 A Note Pass
L+PE - 270 2 60 A Note Pass
N+PE + 0 2 60 A Note Pass
N+PE - 0 2 60 A Note Pass
N+PE + 90 2 60 A Note Pass
N+PE - 90 2 60 A Note Pass
N+PE + 180 2 60 A Note Pass
N+PE - 180 2 60 A Note Pass
N+PE + 270 2 60 A Note Pass
N+PE - 270 2 60 A Note Pass
NOTE: There was no change compared with initial operation during the test.

Report No: 09BS046-RF-CE-P01V01
Page: 127 of 165
Test Mode Mode 4: Standby
Test Site SR-2 Date of Test 2009.09.03
Temperature 26°C Humidity 49%RH Barometric Pressure 101kPa Test Engineer Allen
Inject Line
Polarity Angle
(degree) Test Level
(kV) Test Interval
(second) Complied to Criteria
Observation Result
L+N + 0 1 60 A Note Pass
L+N - 0 1 60 A Note Pass
L+N + 90 1 60 A Note Pass
L+N - 90 1 60 A Note Pass
L+N + 180 1 60 A Note Pass
L+N - 180 1 60 A Note Pass
L+N + 270 1 60 A Note Pass
L+N - 270 1 60 A Note Pass
L+PE + 0 2 60 A Note Pass
L+PE - 0 2 60 A Note Pass
L+PE + 90 2 60 A Note Pass
L+PE - 90 2 60 A Note Pass
L+PE + 180 2 60 A Note Pass
L+PE - 180 2 60 A Note Pass
L+PE + 270 2 60 A Note Pass
L+PE - 270 2 60 A Note Pass
N+PE + 0 2 60 A Note Pass
N+PE - 0 2 60 A Note Pass
N+PE + 90 2 60 A Note Pass
N+PE - 90 2 60 A Note Pass
N+PE + 180 2 60 A Note Pass
N+PE - 180 2 60 A Note Pass
N+PE + 270 2 60 A Note Pass
N+PE - 270 2 60 A Note Pass
Telecom (Line to Ground)
+ N/A 1 60 A Note Pass
Telecom (Line to Ground)
- N/A 1 60 A Note Pass
NOTE: There was no change compared with initial operation during the test.

Report No: 09BS046-RF-CE-P01V01
Page: 128 of 165
10.7. Test Photograph Test Mode: Mode 1: Transmission Data by WLAN1 and Bluetooth
Description: Surges Test Setup (AC mains power input ports)
Test Mode: Mode 2: Standby
Description: Surges Test Setup (AC mains power input ports)

Report No: 09BS046-RF-CE-P01V01
Page: 129 of 165
Test Mode: Mode 3: Transmission Data by WLAN2 and Bluetooth
Description: Surges Test Setup (AC mains power input ports)
Test Mode: Mode 4: Standby
Description: Surges Test Setup (AC mains power input ports)

Report No: 09BS046-RF-CE-P01V01
Page: 130 of 165
11. Radio frequency common mode
11.1. Test Specification
According to EMC Standard: EN 61000-4-6
11.2. Test Setup CDN Test Setup
EM Clamp Test Setup

Report No: 09BS046-RF-CE-P01V01
Page: 131 of 165
11.3. Limit
Environmental phenomenon
Test specification Units Performance criterion
AC mains power ports (See Note 1 and 2)
Radio frequency common mode
0.15 - 80 3 80
MHz V (unmodulated, r.m.s) % AM (1kHz)
A
DC power ports (See Note 1, 2 and 3)
Radio frequency common mode
0.15 - 80 3 80
MHz V (unmodulated, r.m.s) % AM (1kHz)
A
Singal ports, telecommunication ports, and control ports (See Note 1, 2 and 3)
Radio frequency common mode
0.15 - 80 3 80
MHz V (unmodulated, r.m.s) % AM (1kHz)
A
NOTE 1: If the wanted signal is modulated at 1000Hz, then an audio signal of 400Hz shall be used. NOTE 2: The test shall be performed over the frequency range 150kHz to 80MHz with the exception of the exclusion band for transmitters, and for receivers and duplex transceivers [see clause 4 of EN 301 489-1 V1.8.1 (2008-04)]. NOTE 3: This test shall be additionally performed on signal ports, telecommunication ports, control ports, and DC power ports, of radio equipment and associated ancillary equipment, if the cables may be longer than 3m.
11.4. Test Procedure
The EUT is placed on a table that is 0.8 meter height, and a ground reference plane on the table, EUT is placed upon table and use a 0.1m insulation between the EUT and ground reference plane. For AC mains power ports and DC power ports: The EUT is connected to the power mains through a coupling and decoupling networks for power supply lines. And directly couples the disturbances signal into EUT.
Used CDN-M2 for two wires or CDN-M3 for three wires. For signal ports, telecommunication ports, and control ports: The disturbance signal is through a coupling and decoupling networks (CDN) or EM-clamp device couples to the signal and telecommunication lines of the EUT.

Report No: 09BS046-RF-CE-P01V01
Page: 132 of 165
Condition of Test Remarks
1. Field Strength 3V
2. Radiated Signal AM 80% Modulated with 1kHz
3. Scanning Frequency 0.15 - 80MHz
4 Dwell Time 3 Seconds
5. Frequency Step Size Δ f 1%
6. The Rate of Sweep of Frequency 1.5 x 10⁻³ decades/s
11.5. Deviation from Test Standard
No deviation.

Report No: 09BS046-RF-CE-P01V01
Page: 133 of 165
11.6. Test Result Test Mode Mode 1: Transmission Data by WLAN1 and Bluetooth
Test Site SR-2 Date of Test 2009.11.22
Temperature 25°C Humidity 48%RH Barometric Pressure 101kPa Test Engineer Seven
Frequency
(MHz) Inject Voltage
(V/m) Inject Ports
Inject Method
Complied to Criteria
Observation
Result
0.15-80 3 AC Mains CDN A Note Pass
0.15-80 3 LAN CDN A Note Pass
NOTE: There was no change compared with initial operation during the test.

Report No: 09BS046-RF-CE-P01V01
Page: 134 of 165
Test Mode Mode 2: Standby
Test Site SR-2 Date of Test 2009.11.22
Temperature 25°C Humidity 48%RH Barometric Pressure 101kPa Test Engineer Seven
Frequency
(MHz) Inject Voltage
(V/m) Inject Ports
Inject Method
Complied to Criteria
Observation
Result
0.15-80 3 AC Mains CDN A Note Pass
0.15-80 3 LAN CDN A Note Pass
NOTE: There was no change compared with initial operation during the test.

Report No: 09BS046-RF-CE-P01V01
Page: 135 of 165
Test Mode Mode 3: Transmission Data by WLAN2 and Bluetooth
Test Site SR-2 Date of Test 2009.11.22
Temperature 25°C Humidity 48%RH Barometric Pressure 101kPa Test Engineer Seven
Frequency
(MHz) Inject Voltage
(V/m) Inject Ports
Inject Method
Complied to Criteria
Observation
Result
0.15-80 3 AC Mains CDN A Note Pass
0.15-80 3 LAN CDN A Note Pass
NOTE: There was no change compared with initial operation during the test.
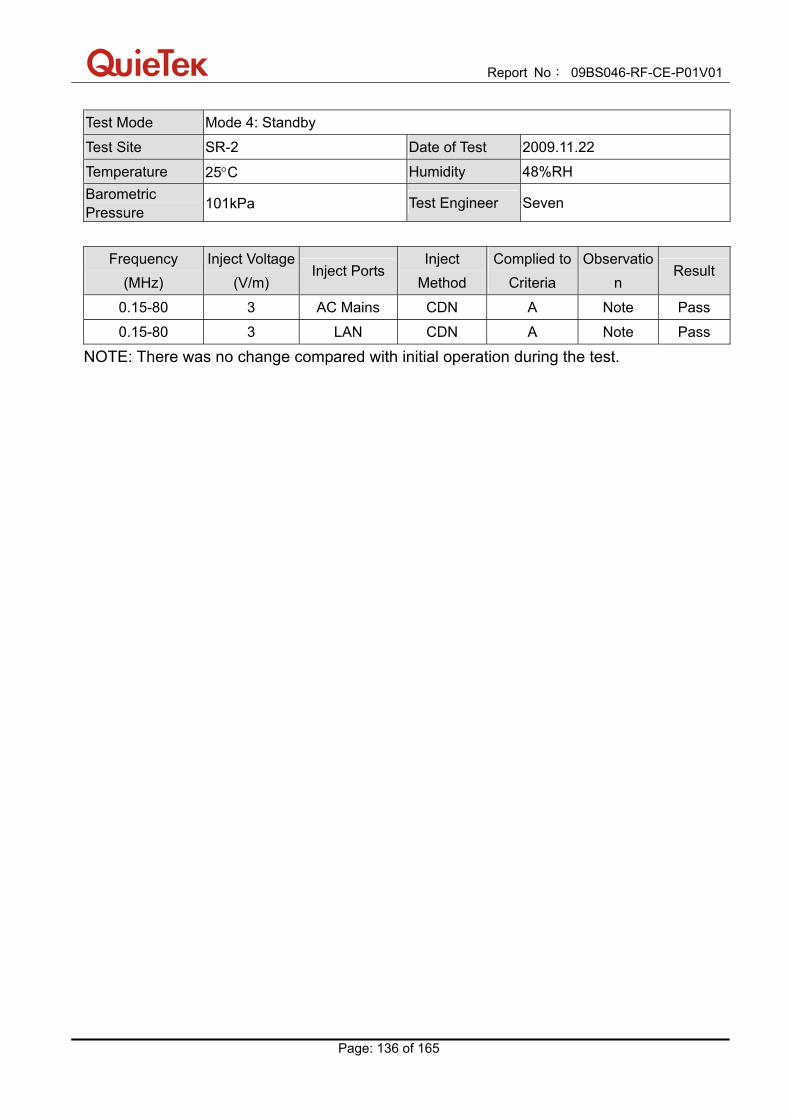
Report No: 09BS046-RF-CE-P01V01
Page: 136 of 165
Test Mode Mode 4: Standby
Test Site SR-2 Date of Test 2009.11.22
Temperature 25°C Humidity 48%RH Barometric Pressure 101kPa Test Engineer Seven
Frequency
(MHz) Inject Voltage
(V/m) Inject Ports
Inject Method
Complied to Criteria
Observation
Result
0.15-80 3 AC Mains CDN A Note Pass
0.15-80 3 LAN CDN A Note Pass
NOTE: There was no change compared with initial operation during the test.

Report No: 09BS046-RF-CE-P01V01
Page: 137 of 165
11.7. Test Photograph Test Mode: Mode 1: Transmission Data by WLAN1 and Bluetooth Description: Radio frequency common mode Test Setup (AC mains power ports)
Test Mode: Mode 1: Transmission Data by WLAN1 and Bluetooth Description: Radio frequency common mode Test Setup (LAN)

Report No: 09BS046-RF-CE-P01V01
Page: 138 of 165
Test Mode: Mode 2: Standby Description: Radio frequency common mode Test Setup (AC mains power ports)
Test Mode: Mode 2: Standby Description: Radio frequency common mode Test Setup (LAN)

Report No: 09BS046-RF-CE-P01V01
Page: 139 of 165
Test Mode: Mode 3: Transmission Data by WLAN2 and Bluetooth Description: Radio frequency common mode Test Setup (AC mains power ports)
Test Mode: Mode 3: Transmission Data by WLAN2 and Bluetooth Description: Radio frequency common mode Test Setup (LAN)

Report No: 09BS046-RF-CE-P01V01
Page: 140 of 165
Test Mode: Mode 4: Standby Description: Radio frequency common mode Test Setup (AC mains power ports)
Test Mode: Mode 4: Standby Description: Radio frequency common mode Test Setup (LAN)
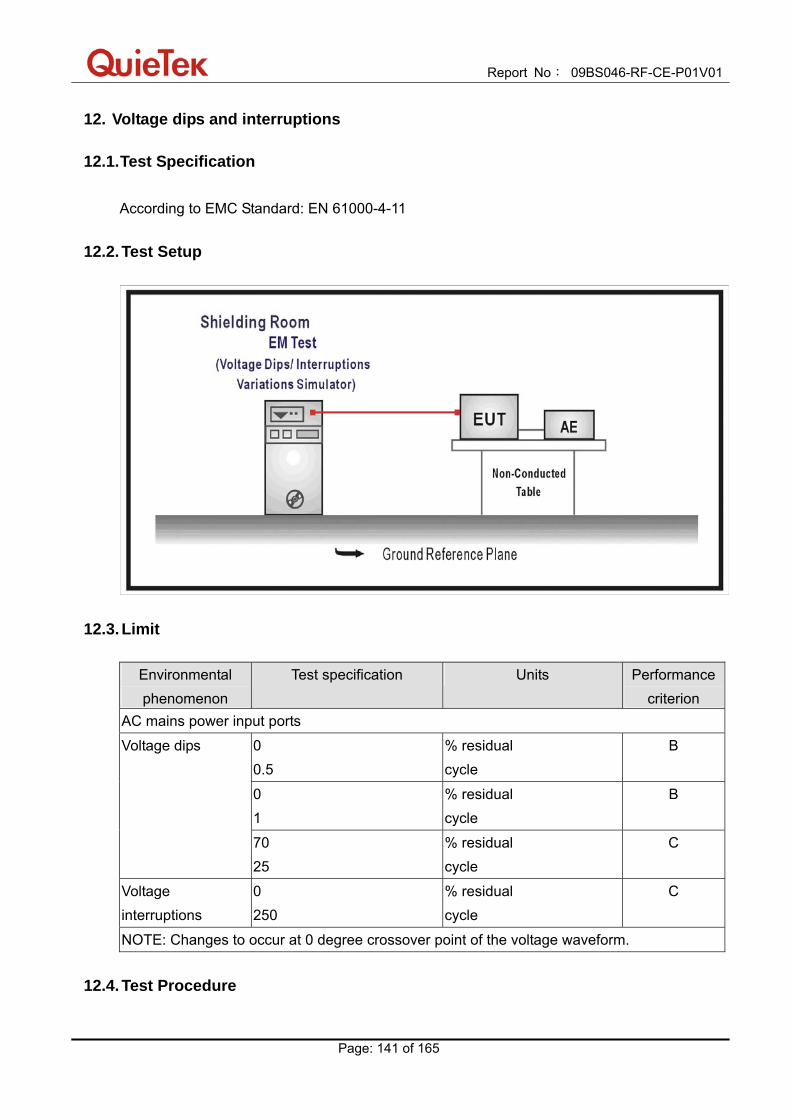
Report No: 09BS046-RF-CE-P01V01
Page: 141 of 165
12. Voltage dips and interruptions
12.1. Test Specification
According to EMC Standard: EN 61000-4-11
12.2. Test Setup
12.3. Limit
Environmental phenomenon
Test specification Units Performance criterion
AC mains power input ports
0 0.5
% residual cycle
B
0 1
% residual cycle
B
Voltage dips
70 25
% residual cycle
C
Voltage interruptions
0 250
% residual cycle
C
NOTE: Changes to occur at 0 degree crossover point of the voltage waveform.
12.4. Test Procedure

Report No: 09BS046-RF-CE-P01V01
Page: 142 of 165
The EUT is placed on a table which is 0.8 meter above a metal ground plane measured 1m*1m minimum, and 0.65mm thick minimum, and projected beyond the EUT by at least 0.1m on all sides. The power cord shall be used the shortest power cord as specified by the manufacturer. For voltage dips and interruptions test: The selection of test voltage is based on the rated power range. If the operation range is large than 20% of lower power range, both end of specified voltage shall be tested. Otherwise, the typical voltage specification is selected as test voltage. The EUT is connected to the power mains through a coupling device that directly couples to the voltage dips and interruption generator.
12.5. Deviation from Test Standard No deviation.

Report No: 09BS046-RF-CE-P01V01
Page: 143 of 165
12.6. Test Result Test Mode Mode 1: Transmission Data by WLAN1 and Bluetooth
Test Site SR-2 Date of Test 2009.11.22
Temperature 25°C Humidity 48%RH Barometric Pressure 101kPa Test Engineer Seven
Voltage
% Residual Test Duration
(ms) Complied to
Criteria Observation Result
0 10 A Note 1 Pass
0 20 A Note 1 Pass
70 500 A Note 1 Pass
0 5000 B Note 2 Pass
NOTE 1: There was no change compared with initial operation during the test. NOET 2: The power consumption of EUT has changed from adapter to battery during the test, but self-recoverable after the test.

Report No: 09BS046-RF-CE-P01V01
Page: 144 of 165
Test Mode Mode 2: Standby
Test Site SR-2 Date of Test 2009.11.22
Temperature 25°C Humidity 48%RH Barometric Pressure 101kPa Test Engineer Seven
Voltage
% Residual Test Duration
(ms) Complied to
Criteria Observation Result
0 10 A Note 1 Pass
0 20 A Note 1 Pass
70 500 A Note 1 Pass
0 5000 B Note 2 Pass
NOTE 1: There was no change compared with initial operation during the test. NOET 2: The power consumption of EUT has changed from adapter to battery during the test, but self-recoverable after the test.

Report No: 09BS046-RF-CE-P01V01
Page: 145 of 165
Test Mode Mode 3: Transmission Data by WLAN2 and Bluetooth
Test Site SR-2 Date of Test 2009.11.22
Temperature 25°C Humidity 48%RH Barometric Pressure 101kPa Test Engineer Seven
Voltage
% Residual Test Duration
(ms) Complied to
Criteria Observation Result
0 10 A Note 1 Pass
0 20 A Note 1 Pass
70 500 B Note 1 Pass
0 5000 B Note 2 Pass
NOTE 1: There was no change compared with initial operation during the test. NOET 2: The power consumption of EUT has changed from adapter to battery during the test, but self-recoverable after the test.
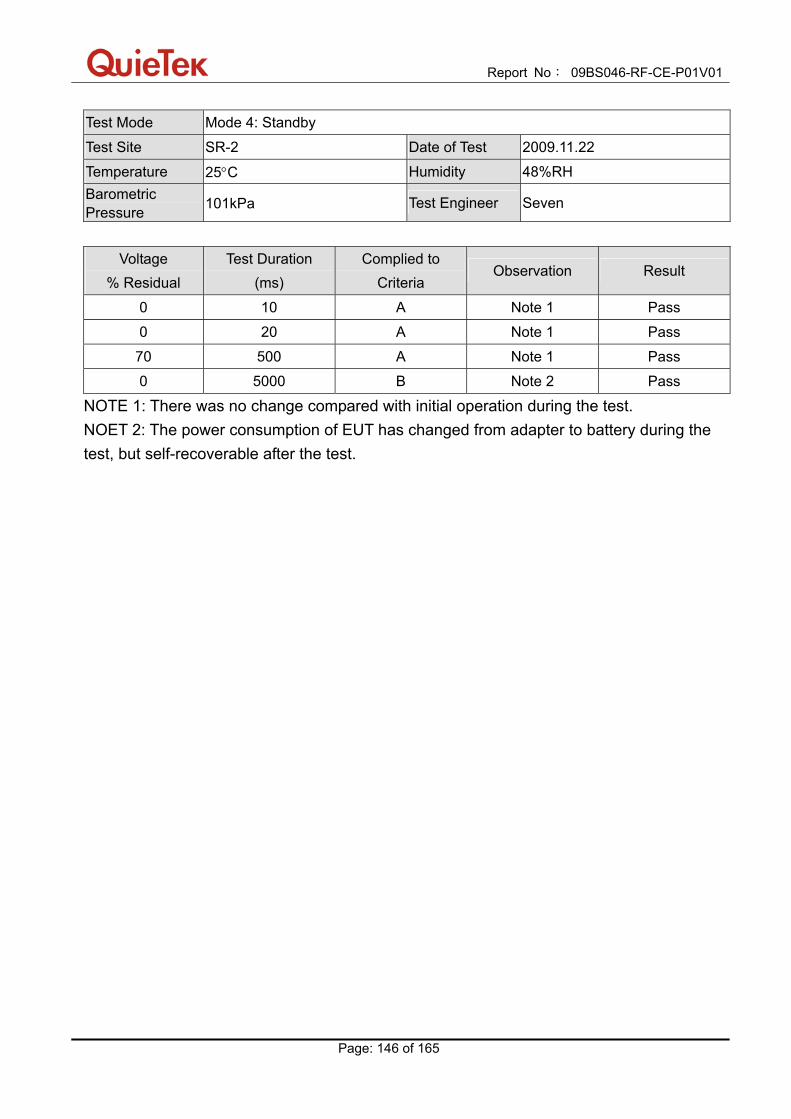
Report No: 09BS046-RF-CE-P01V01
Page: 146 of 165
Test Mode Mode 4: Standby
Test Site SR-2 Date of Test 2009.11.22
Temperature 25°C Humidity 48%RH Barometric Pressure 101kPa Test Engineer Seven
Voltage
% Residual Test Duration
(ms) Complied to
Criteria Observation Result
0 10 A Note 1 Pass
0 20 A Note 1 Pass
70 500 A Note 1 Pass
0 5000 B Note 2 Pass
NOTE 1: There was no change compared with initial operation during the test. NOET 2: The power consumption of EUT has changed from adapter to battery during the test, but self-recoverable after the test.

Report No: 09BS046-RF-CE-P01V01
Page: 147 of 165
12.7. Test Photograph Test Mode: Mode 1: Transmission Data by WLAN1 and Bluetooth Description: Voltage dips and interruptions Test Setup
Test Mode: Mode 2: Standby Description: Voltage dips and interruptions Test Setup

Report No: 09BS046-RF-CE-P01V01
Page: 148 of 165
Test Mode: Mode 3: Transmission Data by WLAN2 and Bluetooth Description: Voltage dips and interruptions Test Setup
Test Mode: Mode 4: Standby Description: Voltage dips and interruptions Test Setup

Report No: 09BS046-RF-CE-P01V01
Page: 149 of 165
13. Transients and surges
13.1. Test Specification
According to EMC Standard: ISO 7637-2
13.2. Test Setup
13.3. Limit EUT applying pulses 1, 2a, 2b, 3a, 3b, and 4, using immunity test level Ⅲ. For the purpose of EMC testing it is sufficient to apply pulses 1, 2a and 4, 10 times each, and apply the test pulses 3a and 3b for 20 minutes each.
13.4. Test Procedure
Test requirements for 12V DC powered equipment: Where the manufacturer in his installation documentation requires the radio equipment to have a direct connection to the 12V main vehicle battery the requirements in a) shall apply. Where the manufacturer does not require the radio equipment to have a direct connection to the 12V main vehicle battery the requirements in a) and b) shall apply: Pulse 3a and 3b, level II, with the test time reduced to 5 min for each; Pulse 4, level II, 5 pulses, with the characteristics as follows: Vs = -5V; Va = -2.5V; t6 = 25ms; t7 = 50ms; t8 = 5s; tf = 5ms; pulse cycle time: 60s Pulse, level II: t1 = 2.5s; 10 pulses;
Report No: 09BS046-RF-CE-P01V01
Page: 150 of 165
Pulse 2, level II: t1 = 2.5s; 10 pulses; Pulse 7, 5 pulses. Where the manufacturer declares that the radio equipment requires a direct connection to the main vehicle battery, and therefore the tests in accordance with the requirements b) are not carried out, this shall be stated in the test report. Test requirements for 24V DC powered equipment: Where the manufacturer in his installation documentation requires the radio equipment to have a direct connection to the 24 V main vehicle battery the requirements in (1) shall apply. Where the manufacturer does not require the radio equipment to have a direct connection to the 24 V main vehicle battery the requirements in (1) and (2) shall apply: (1) Pulse 3a and 3b, level II, with the test time reduced to 5 min for each; Pulse 4, level II, 5 pulses, with the characteristics as follows: Vs = -10V; Va = -5V; t6 = 25ms; t7 = 50ms; t8 = 5s; tf = 10ms; pulse cycle time: 60s (2) Pulse 1a, level II: t1 = 2.5s; Ri = 25Ω; 10 pulses; Pulse 2b, level II: t1 = 2.5s; Ri = 100Ω; 10 pulses; Pulse 2, 10 pulses. Where the manufacturer declares that the radio equipment requires a direct connection to the main vehicle battery, and therefore the tests in accordance with the requirements d) are not carried out, this shall be stated in the test report. Radio and ancillary equipment designed to operate at both DC power voltages shall be tested in both configurations.
13.5. Deviation from Test Standard No deviation.
13.6. Test Result The EUT is not used in the vehicular environment, so it need not to perform this test item.

Report No: 09BS046-RF-CE-P01V01
Page: 151 of 165
14. Attachment
EUT Photograph (1) EUT Photo
(2) EUT Photo

Report No: 09BS046-RF-CE-P01V01
Page: 152 of 165
(3) EUT Photo
(4) EUT Photo

Report No: 09BS046-RF-CE-P01V01
Page: 153 of 165
(5) EUT Photo
(6) EUT Photo

Report No: 09BS046-RF-CE-P01V01
Page: 154 of 165
(7) EUT Photo
(8) EUT Photo

Report No: 09BS046-RF-CE-P01V01
Page: 155 of 165
(9) EUT Photo
(10) EUT Photo

Report No: 09BS046-RF-CE-P01V01
Page: 156 of 165
(11) EUT Photo
(12) EUT Photo

Report No: 09BS046-RF-CE-P01V01
Page: 157 of 165
(13) EUT Photo
(14) EUT Photo

Report No: 09BS046-RF-CE-P01V01
Page: 158 of 165
(15) EUT Photo
(16) EUT Photo

Report No: 09BS046-RF-CE-P01V01
Page: 159 of 165
(17) EUT Photo
(18) EUT Photo

Report No: 09BS046-RF-CE-P01V01
Page: 160 of 165
(19) EUT Photo
(20) EUT Photo

Report No: 09BS046-RF-CE-P01V01
Page: 161 of 165
(21) EUT Photo
(22) EUT Photo

Report No: 09BS046-RF-CE-P01V01
Page: 162 of 165
(23) EUT Photo
(24) EUT Photo

Report No: 09BS046-RF-CE-P01V01
Page: 163 of 165
(25) EUT Photo
(26) EUT Photo
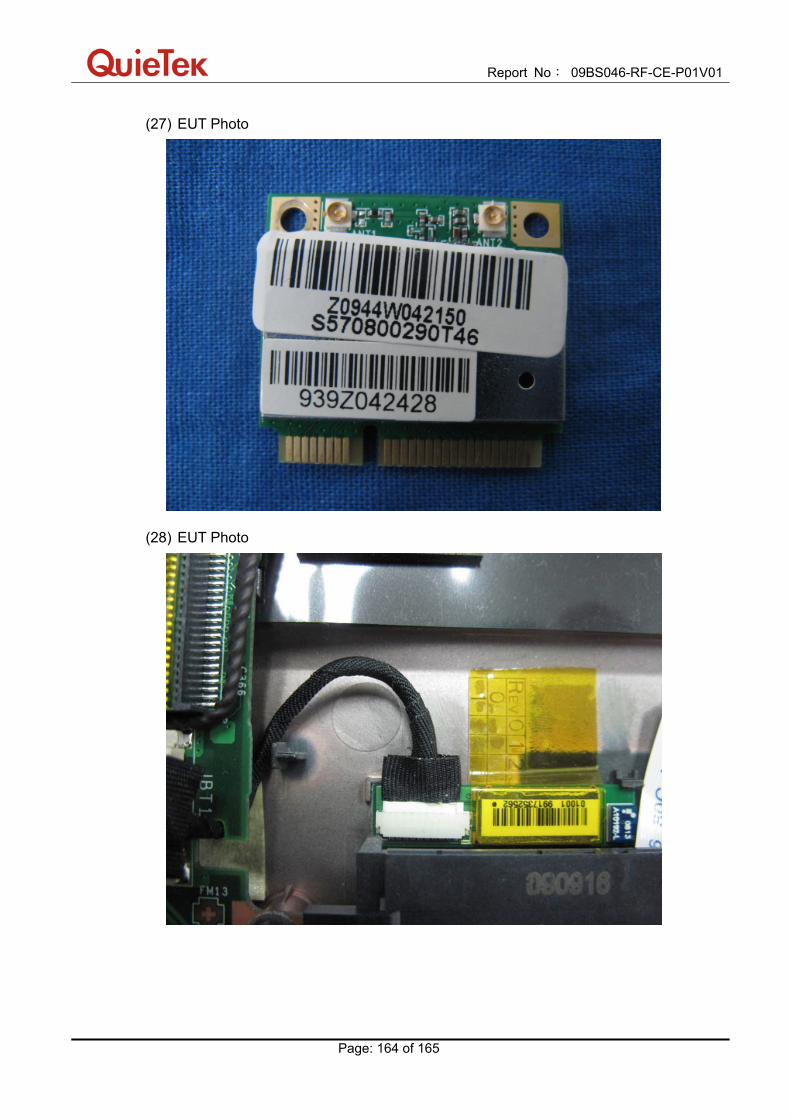
Report No: 09BS046-RF-CE-P01V01
Page: 164 of 165
(27) EUT Photo
(28) EUT Photo

Report No: 09BS046-RF-CE-P01V01
Page: 165 of 165
(29) EUT Photo
(30) EUT Photo