Embed Size (px)
Citation preview
Test Report
Product Name : Notebook PC
Model No. : MS-1726, MS-1727
Marking Name : GX740, GT740
Applicant : Micro-Star Int’L Co., Ltd.
Address : No. 69, Li-De St., Chung-Ho City, Taipei Hsien, Taiwan
Date of Receipt : 2009.08.20
Issued Date : 2009.09.07
Report No. : 098S082-IT-CE-P01V01
Report Version : V1.1
The test results relate only to the samples tested.The test results shown in the test report are traceable to the national/international standard through the calibration of the equipment and evaluated measurement uncertainty herein. This report must not be used to claim product endorsement by TAF, NVLAP or any agency of the Government. The test report shall not be reproduced except in full without the written approval of QuieTek Corporation.

Report No: 098S082-IT-CE-P01V01
Page: 2 of 116
Test Report Cert i f icat ion Issued Date : 2009.09.07 Report No. : 098S082-IT-CE-P01V01
Product Name : Notebook PC
Applicant : Micro-Star Int’L Co., Ltd.
Address : No. 69, Li-De St., Chung-Ho City, Taipei Hsien, Taiwan
Manufacturer : MSI ELECTRONICS(KUNSHANG) CO., LTD.
Address : No. 88 East Qianjin Road, Kunshan City
Model No. : MS-1726, MS-1727
Marking Name : GX740, GT740
Brand Name : msi
EUT Voltage : AC 100-240 V / 50-60 Hz
Applicable Standard : EN 55022: 2006+A1: 2007
EN 61000-3-2: 2006
EN 61000-3-3: 1995+A1: 2001+A2: 2005
EN 55024: 1998+A1: 2001+A2: 2003
Test Result : Complied
Performed Location : Suzhou EMC Laboratory
No.99 Hongye Rd., Suzhou Industrial Park Loufeng
Hi-Tech Development Zone., Suzhou, China
TEL: +86-512-62515088 / FAX: +86-512-62515098
Documented By :
( Engineering ADM: Kery Zha )
Reviewed By :
( Engineering Supervisor: Coffon Ye )
Approved By :
( Engineering Manager: Dream Cao )
Report No: 098S082-IT-CE-P01V01
Page: 3 of 116
Laboratory Information
We, QuieTek Corporation, are an independent EMC and safety consultancy that was established the whole facility in our laboratories. The test facility has been accredited/accepted(audited or listed) by the following related bodies in compliance with ISO 17025, EN 45001 and specified testing scope:
The related certificate for our laboratories about the test site and management system can be downloaded from QuieTek Corporation’s Web Site : http://www.quietek.com/tw/emc/accreditations/accreditations.htm The address and introduction of QuieTek Corporation’s laboratories can be founded in our Web site : http://www.quietek.com/ If you have any comments, Please don’t hesitate to contact us. Our contact information is as below: HsinChu Testing Laboratory :
No.75-2, 3rd Lin, Wangye Keng, Yonghxing Tsuen, Qionglin Shiang, Hsinchu County 307, Taiwan, R.O.C. TEL:+886-3-592-8858 / FAX:+886-3-592-8859 E-Mail : [email protected]
LinKou Testing Laboratory :
No. 5, Ruei-Shu Valley, Ruei-Ping Tsuen, Lin-Kou Shiang, Taipei, Taiwan, R.O.C. TEL : +886-2-8601-3788 / FAX : 886-2-8601-3789 E-Mail : [email protected]
Suzhou Testing Laboratory : No.99 Hongye Rd., Suzhou Industrial Park Loufeng Hi-Tech Development Zone., SuZhou, China
TEL : +86-512-6251-5088 / FAX : 86-512-6251-5098 E-Mail : [email protected]
Taiwan R.O.C. : BSMI, NCC, TAF
Germany : TUV Rheinland
Norway : Nemko, DNV
USA : FCC, NVLAP
Japan : VCCI
Report No: 098S082-IT-CE-P01V01
Page: 4 of 116
TABLE OF CONTENTS Description Page 1. General Information......................................................................................................7
1.1. EUT Description ..............................................................................................7
1.2. Mode of Operation......................................................................................... 11
1.3. Tested System Details ...................................................................................17
1.4. Configuration of Tested System.....................................................................18
1.5. EUT Exercise Software..................................................................................19
2. Technical Test .............................................................................................................20
2.1. Summary of Test Result.................................................................................20
2.2. List of Test Equipment ...................................................................................21
2.3. Measurement Uncertainty..............................................................................24
2.4. Performance Criteria .....................................................................................25
3. Conducted disturbance at mains terminals and telecommunication ports ..................26
3.1. Test Specification...........................................................................................26
3.2. Test Setup .....................................................................................................26
3.3. Limit...............................................................................................................26
3.4. Test Procedure ..............................................................................................27
3.5. Deviation from Test Standard.........................................................................28
3.6. Test Result.....................................................................................................29
3.7. Test Photograph ............................................................................................47
4. Radiated disturbance..................................................................................................50
4.1. Test Specification...........................................................................................50
4.2. Test Setup .....................................................................................................50
4.3. Limit...............................................................................................................51
4.4. Test Procedure ..............................................................................................52
4.5. Deviation from Test Standard.........................................................................52
4.6. Test Result.....................................................................................................53
4.7. Test Photograph ............................................................................................59
5. Harmonic current emissions .......................................................................................61
5.1. Test Specification...........................................................................................61
5.2. Test Setup .....................................................................................................61
5.3. Limit...............................................................................................................61
5.4. Test Procedure ..............................................................................................63
5.5. Deviation from Test Standard.........................................................................63
5.6. Test Result.....................................................................................................64
5.7. Test Photograph ............................................................................................66
6. Voltage fluctuations and flicker ...................................................................................67
6.1. Test Specification...........................................................................................67

Report No: 098S082-IT-CE-P01V01
Page: 5 of 116
6.2. Test Setup .....................................................................................................67
6.3. Limit...............................................................................................................67
6.4. Test Procedure ..............................................................................................68
6.5. Deviation from Test Standard.........................................................................68
6.6. Test Result.....................................................................................................69
6.7. Test Photograph ............................................................................................69
7. Electrostatic discharge................................................................................................71
7.1. Test Specification...........................................................................................71
7.2. Test Setup .....................................................................................................71
7.3. Limit...............................................................................................................71
7.4. Test Procedure ..............................................................................................71
7.5. Deviation from Test Standard.........................................................................72
7.6. Test Result.....................................................................................................73
7.7. Test Photograph ............................................................................................77
8. Radio-frequency electromagnetic field........................................................................81
8.1. Test Specification...........................................................................................81
8.2. Test Setup .....................................................................................................81
8.3. Limit...............................................................................................................81
8.4. Test Procedure ..............................................................................................81
8.5. Deviation from Test Standard.........................................................................82
8.6. Test Result.....................................................................................................83
8.7. Test Photograph ............................................................................................84
9. Fast transients ............................................................................................................85
9.1. Test Specification...........................................................................................85
9.2. Test Setup .....................................................................................................85
9.3. Limit...............................................................................................................85
9.4. Test Procedure ..............................................................................................86
9.5. Deviation from Test Standard.........................................................................86
9.6. Test Result.....................................................................................................87
9.7. Test Photograph ............................................................................................88
10. Surges ......................................................................................................................90
10.1. Test Specification...........................................................................................90
10.2. Test Setup .....................................................................................................90
10.3. Limit...............................................................................................................90
10.4. Test Procedure ..............................................................................................91
10.5. Deviation from Test Standard.........................................................................91
10.6. Test Result.....................................................................................................92
10.7. Test Photograph ............................................................................................93
Report No: 098S082-IT-CE-P01V01
Page: 6 of 116
11. Radio-frequency continuous conducted....................................................................94
11.1. Test Specification...........................................................................................94
11.2. Test Setup .....................................................................................................94
11.3. Limit...............................................................................................................95
11.4. Test Procedure ..............................................................................................95
11.5. Deviation from Test Standard.........................................................................96
11.6. Test Result.....................................................................................................97
11.7. Test Photograph ............................................................................................98
12. Power-frequency magnetic field .............................................................................100
12.1. Test Specification.........................................................................................100
12.2. Test Setup ...................................................................................................100
12.3. Limit.............................................................................................................100
12.4. Test Procedure ............................................................................................100
12.5. Deviation from Test Standard.......................................................................101
12.6. Test Result...................................................................................................102
12.7. Test Photograph ..........................................................................................103
13. Voltage dips and interruptions.................................................................................104
13.1. Test Specification.........................................................................................104
13.2. Test Setup ...................................................................................................104
13.3. Limit.............................................................................................................104
13.4. Test Procedure ............................................................................................104
13.5. Deviation from Test Standard.......................................................................105
13.6. Test Result...................................................................................................106
13.7. Test Photograph ..........................................................................................107
14. Attachment .............................................................................................................108
EUT Photograph..........................................................................................108
Report No: 098S082-IT-CE-P01V01
Page: 7 of 116
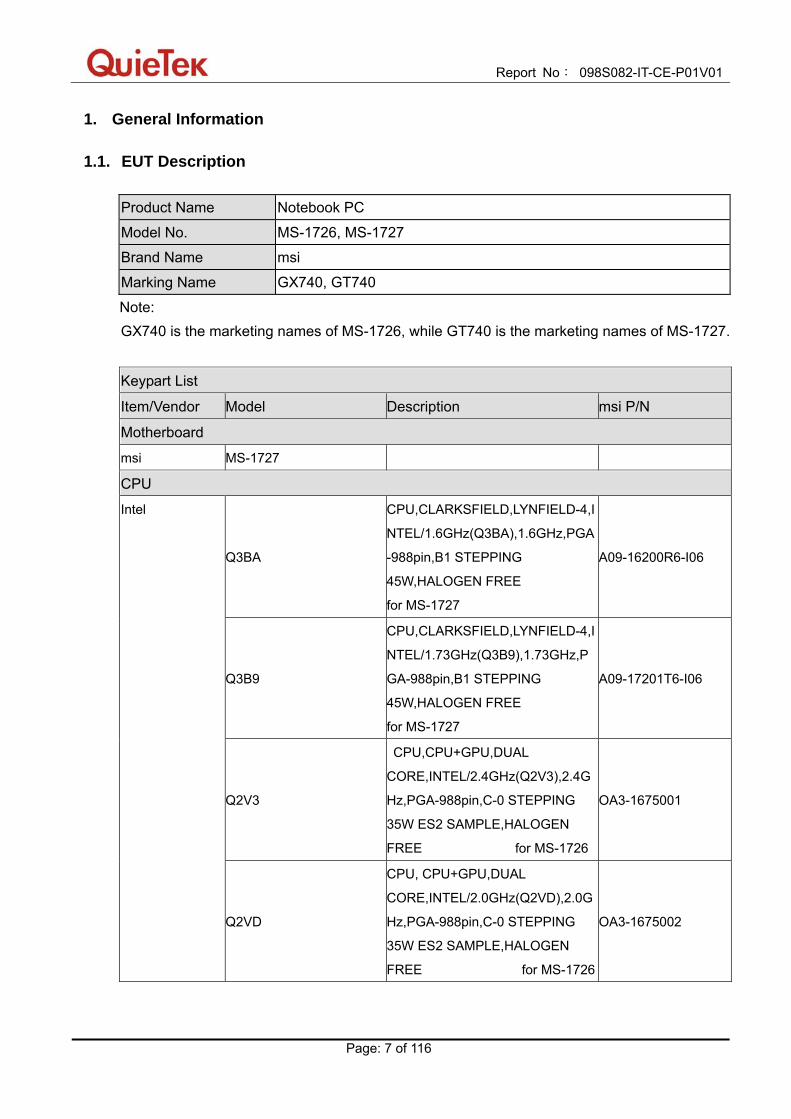
1. General Information 1.1. EUT Description
Product Name Notebook PC
Model No. MS-1726, MS-1727
Brand Name msi
Marking Name GX740, GT740
Note: GX740 is the marketing names of MS-1726, while GT740 is the marketing names of MS-1727.
Keypart List
Item/Vendor Model Description msi P/N
Motherboard
msi MS-1727
CPU
Q3BA
CPU,CLARKSFIELD,LYNFIELD-4,I
NTEL/1.6GHz(Q3BA),1.6GHz,PGA
-988pin,B1 STEPPING
45W,HALOGEN FREE
for MS-1727
A09-16200R6-I06
Q3B9
CPU,CLARKSFIELD,LYNFIELD-4,I
NTEL/1.73GHz(Q3B9),1.73GHz,P
GA-988pin,B1 STEPPING
45W,HALOGEN FREE
for MS-1727
A09-17201T6-I06
Q2V3
CPU,CPU+GPU,DUAL
CORE,INTEL/2.4GHz(Q2V3),2.4G
Hz,PGA-988pin,C-0 STEPPING
35W ES2 SAMPLE,HALOGEN
FREE for MS-1726
OA3-1675001
Intel
Q2VD
CPU, CPU+GPU,DUAL
CORE,INTEL/2.0GHz(Q2VD),2.0G
Hz,PGA-988pin,C-0 STEPPING
35W ES2 SAMPLE,HALOGEN
FREE for MS-1726
OA3-1675002
Report No: 098S082-IT-CE-P01V01
Page: 8 of 116
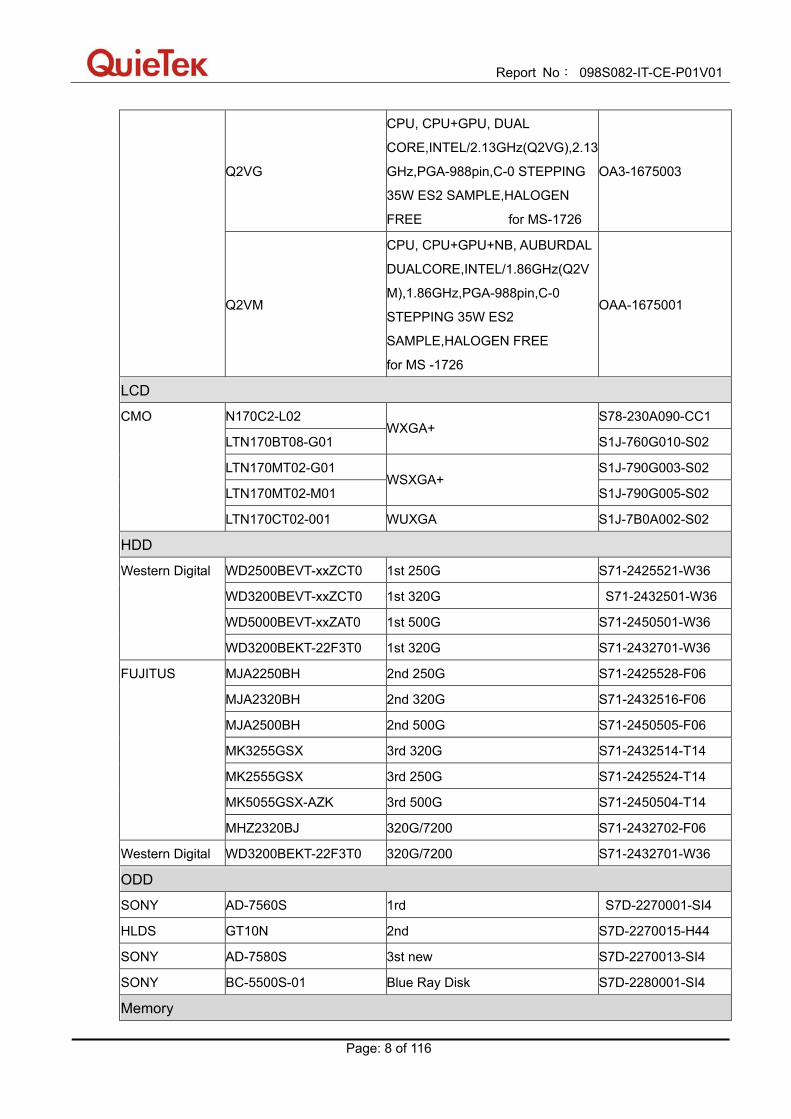
Q2VG
CPU, CPU+GPU, DUAL
CORE,INTEL/2.13GHz(Q2VG),2.13
GHz,PGA-988pin,C-0 STEPPING
35W ES2 SAMPLE,HALOGEN
FREE for MS-1726
OA3-1675003
Q2VM
CPU, CPU+GPU+NB, AUBURDAL
DUALCORE,INTEL/1.86GHz(Q2V
M),1.86GHz,PGA-988pin,C-0
STEPPING 35W ES2
SAMPLE,HALOGEN FREE
for MS -1726
OAA-1675001
LCD
N170C2-L02 S78-230A090-CC1
LTN170BT08-G01 WXGA+
S1J-760G010-S02
LTN170MT02-G01 S1J-790G003-S02
LTN170MT02-M01 WSXGA+
S1J-790G005-S02
CMO
LTN170CT02-001 WUXGA S1J-7B0A002-S02
HDD
WD2500BEVT-xxZCT0 1st 250G S71-2425521-W36
WD3200BEVT-xxZCT0 1st 320G S71-2432501-W36
WD5000BEVT-xxZAT0 1st 500G S71-2450501-W36
Western Digital
WD3200BEKT-22F3T0 1st 320G S71-2432701-W36
MJA2250BH 2nd 250G S71-2425528-F06
MJA2320BH 2nd 320G S71-2432516-F06
MJA2500BH 2nd 500G S71-2450505-F06
MK3255GSX 3rd 320G S71-2432514-T14
MK2555GSX 3rd 250G S71-2425524-T14
MK5055GSX-AZK 3rd 500G S71-2450504-T14
FUJITUS
MHZ2320BJ 320G/7200 S71-2432702-F06
Western Digital WD3200BEKT-22F3T0 320G/7200 S71-2432701-W36
ODD
SONY AD-7560S 1rd S7D-2270001-SI4
HLDS GT10N 2nd S7D-2270015-H44
SONY AD-7580S 3st new S7D-2270013-SI4
SONY BC-5500S-01 Blue Ray Disk S7D-2280001-SI4
Memory

Report No: 098S082-IT-CE-P01V01
Page: 9 of 116
Transcend
(Samsung) TS128MSK64V1U-S DDR3/1GB 1066 S7C-S448801-T10
Hynix HMT112S6BFR6C-G7N0 DDR3/1GB 1066 S7C-S448201-H23
Transcend
(Samsung) TS128MSK64V3U DDR3/1GB 1333 S7C-S449801-T10
UNIFOSA GU672203EP0300 DDR3/1GB 1333 S7C-S449101-U37
TRANSCEND TS256MSK64V1U-S DDR3/2GB 1066 S7C-S458801-T10
HYNIX HMT125S6AFR8C-G7N0 DDR3/2GB 1066 S7C-S458201-H23
Transcend
(Samsung) TS256MSK64V3U DDR3/2GB 1333 S7C-S459801-T10
UNIFOSA
(Elpida) GU612303EP0300
DDR3/2GB 1333 S7C-S459101-U37
WLAN
Intel 512AN_HMW S57-0800183-I06
MSI RT3090 ms-6891 605-6891-010
TWINHAN AW-NE785H S57-0800290-T46
MDC
MDC ML3054 K.21 CastleNet S52-2801210-C59
Bluetooth
MSI MS-3801 605-3801-01S
Keyboard
CHICONY MP-08C23US-3 S1N-3UUS1C1-C54
LITE-ON SG-29511-XUA US
S1N-3UUS2E1-L05
Touchpad
Synaptics TM-00300-000 1st S78-3700360-SD2
Sentelic TPA2D2IC99RA1 2nd S78-3700360-SK9
inverter
YIVNMS0028D11 1st S78-3300500-SG3 SAMPO
YIVNMS0016D11 2nd S78-3300290-SG3
Power Cord
Isheng V50VS334B12180MS K33-3001020-I45
Battery
MITAC BP-LC2400/32-C2 S 6 cell 2400 S9N-1564221-M47
SMP 925C2560F/925T2560F 9cell S9N-1194210-SB3
SMP 925C2630F/925T2630F 9cell S9N-1196200-SB3
Adapter
Report No: 098S082-IT-CE-P01V01
Page: 10 of 116
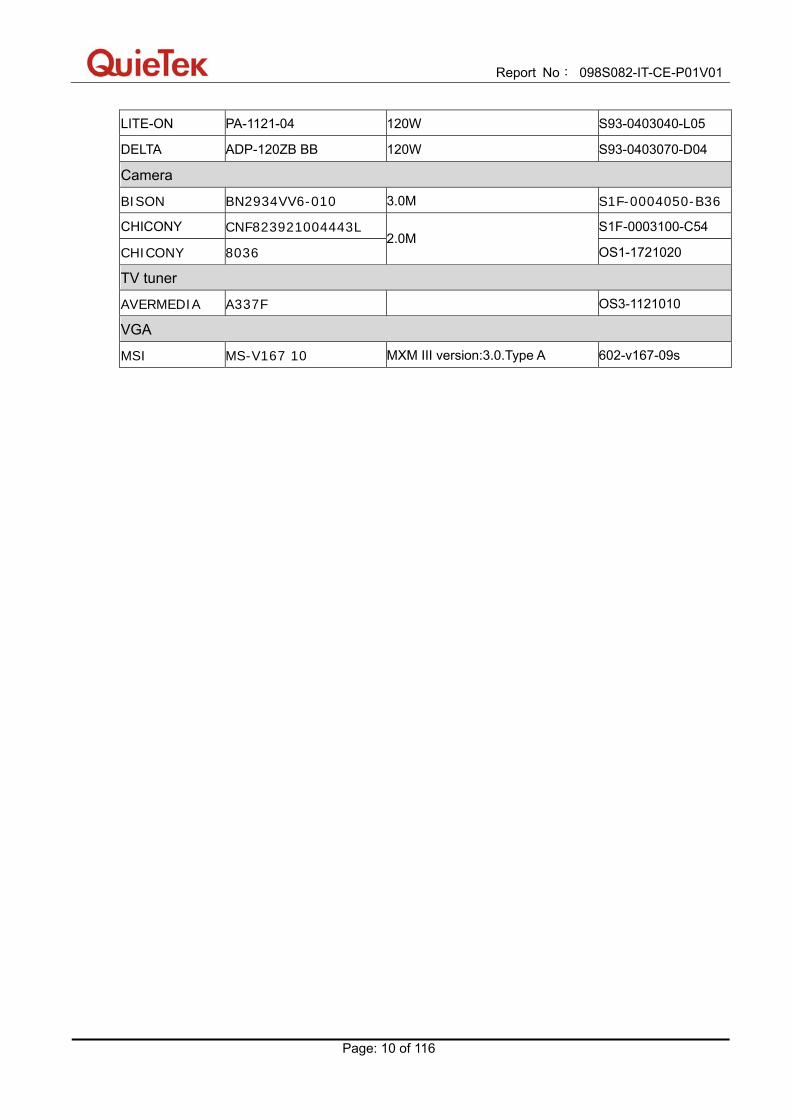
LITE-ON PA-1121-04 120W S93-0403040-L05
DELTA ADP-120ZB BB 120W S93-0403070-D04
Camera
BISON BN2934VV6-010 3.0M S1F-0004050-B36
CHICONY CNF823921004443L S1F-0003100-C54
CHICONY 8036 2.0M
OS1-1721020
TV tuner
AVERMEDIA A337F OS3-1121010
VGA
MSI MS-V167 10 MXM III version:3.0.Type A 602-v167-09s
Report No: 098S082-IT-CE-P01V01
Page: 11 of 116
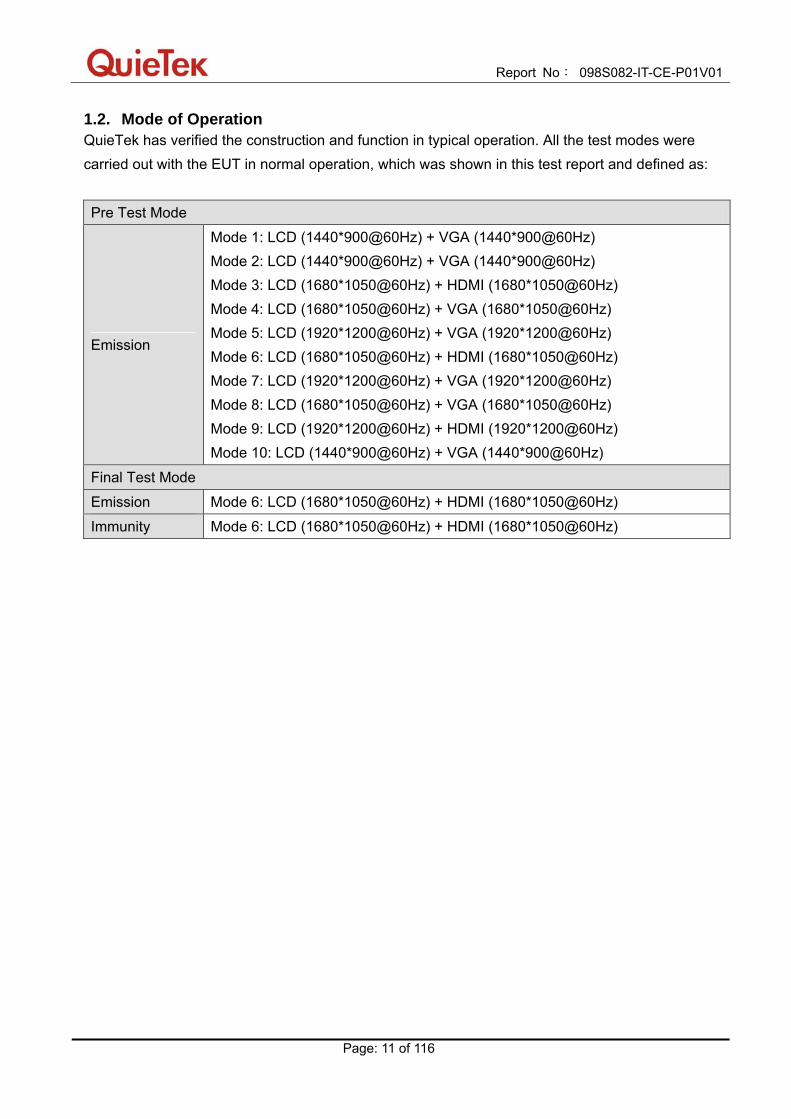
1.2. Mode of Operation QuieTek has verified the construction and function in typical operation. All the test modes were carried out with the EUT in normal operation, which was shown in this test report and defined as: Pre Test Mode
Emission
Mode 1: LCD (1440*900@60Hz) + VGA (1440*900@60Hz) Mode 2: LCD (1440*900@60Hz) + VGA (1440*900@60Hz) Mode 3: LCD (1680*1050@60Hz) + HDMI (1680*1050@60Hz) Mode 4: LCD (1680*1050@60Hz) + VGA (1680*1050@60Hz) Mode 5: LCD (1920*1200@60Hz) + VGA (1920*1200@60Hz) Mode 6: LCD (1680*1050@60Hz) + HDMI (1680*1050@60Hz) Mode 7: LCD (1920*1200@60Hz) + VGA (1920*1200@60Hz) Mode 8: LCD (1680*1050@60Hz) + VGA (1680*1050@60Hz) Mode 9: LCD (1920*1200@60Hz) + HDMI (1920*1200@60Hz) Mode 10: LCD (1440*900@60Hz) + VGA (1440*900@60Hz)
Final Test Mode
Emission Mode 6: LCD (1680*1050@60Hz) + HDMI (1680*1050@60Hz) Immunity Mode 6: LCD (1680*1050@60Hz) + HDMI (1680*1050@60Hz)

Report No: 098S082-IT-CE-P01V01
Page: 12 of 116
Mode1 Mode2 M/B MS-1727 MS-1727
CPU INTEL/1.6GHz(Q3BA) INTEL/1.73GHz(Q3B9)
LCD CMO/N170C2-L02 SAMSUNG/LTN170BT08-G01
HDD WD/WD2500BEVT-xxZCT0 WD/WD3200BEVT-xxZCT0
ODD SONY/AD-7560S HLDS/GT10N
RAM Transcend (Samsung)/TS128MSK64V1U-S
Transcend (Samsung)/TS128MSK64V3U
WL INTEL/512AN_HMW TWINHAN/AW-NE785H
MDC CastleNet/ML3054 K.21 CastleNet/ML3054 K.21
Bluetooth MSI/MS-3801 MSI/MS-3801
Keyboard CHICONY/MP-08C23US-3 LITE-ON/SG-29511-XUA
Touchpad Synaptics/TM-00300-000 Sentelic/TPA2D2IC99RA1
Power Cord Isheng/V50VS334B12180MS Isheng/V50VS334B12180MS
inverter SAMPO/YIVNMS0028D11 SAMPO/YIVNMS0016D11
Battery MITAC/BP-LC2400/32-C2 S SMP/925C2560F/925T2560F
Adapter LITE-ON/PA-1121-04MI DELTA/ADP-120ZB BBGD
camera BISON /BN2934VV6-010 CHICONY/CNF823921004443L
TV tuner AVERMEDIA/A337F AVERMEDIA/A337F
VGA MSI/MS-V167 10 MSI/MS-V167 10
Report No: 098S082-IT-CE-P01V01
Page: 13 of 116
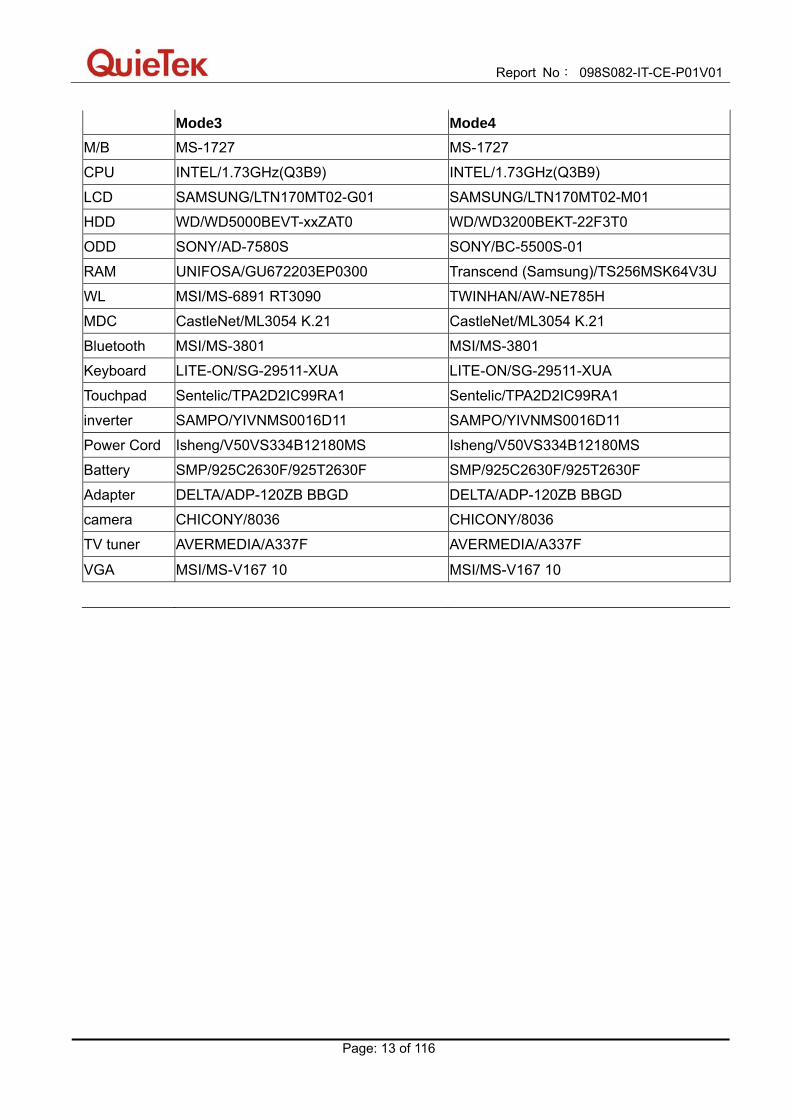
Mode3 Mode4 M/B MS-1727 MS-1727
CPU INTEL/1.73GHz(Q3B9) INTEL/1.73GHz(Q3B9)
LCD SAMSUNG/LTN170MT02-G01 SAMSUNG/LTN170MT02-M01
HDD WD/WD5000BEVT-xxZAT0 WD/WD3200BEKT-22F3T0
ODD SONY/AD-7580S SONY/BC-5500S-01
RAM UNIFOSA/GU672203EP0300 Transcend (Samsung)/TS256MSK64V3U
WL MSI/MS-6891 RT3090 TWINHAN/AW-NE785H
MDC CastleNet/ML3054 K.21 CastleNet/ML3054 K.21
Bluetooth MSI/MS-3801 MSI/MS-3801
Keyboard LITE-ON/SG-29511-XUA LITE-ON/SG-29511-XUA
Touchpad Sentelic/TPA2D2IC99RA1 Sentelic/TPA2D2IC99RA1
inverter SAMPO/YIVNMS0016D11 SAMPO/YIVNMS0016D11
Power Cord Isheng/V50VS334B12180MS Isheng/V50VS334B12180MS
Battery SMP/925C2630F/925T2630F SMP/925C2630F/925T2630F
Adapter DELTA/ADP-120ZB BBGD DELTA/ADP-120ZB BBGD
camera CHICONY/8036 CHICONY/8036
TV tuner AVERMEDIA/A337F AVERMEDIA/A337F
VGA MSI/MS-V167 10 MSI/MS-V167 10

Report No: 098S082-IT-CE-P01V01
Page: 14 of 116
Mode5 Mode6 M/B MS-1727 MS-1727
CPU INTEL/1.73GHz(Q3B9) INTEL/1.73GHz(Q3B9)
LCD SAMSUNG/LTN170CT02-001 SAMSUNG/LTN170CT02-001
HDD FUJITSU/MJA2250BH FUJITSU/MJA2250BH
ODD SONY/BC-5500S-01 SONY/BC-5500S-01
RAM UNIFOSA (Elpida)/GU612303EP0300 UNIFOSA (Elpida)/GU612303EP0300
WL TWINHAN/AW-NE785H TWINHAN/AW-NE785H
MDC CastleNet/ML3054 K.21 CastleNet/ML3054 K.21
Bluetooth MSI/MS-3801 MSI/MS-3801
Keyboard LITE-ON/SG-29511-XUA LITE-ON/SG-29511-XUA
Touchpad Sentelic/TPA2D2IC99RA1 Sentelic/TPA2D2IC99RA1
inverter SAMPO/YIVNMS0016D11 SAMPO/YIVNMS0016D11
Power Cord Isheng/V50VS334B12180MS Isheng/V50VS334B12180MS
Battery SMP/925C2630F/925T2630F SMP/925C2630F/925T2630F
Adapter DELTA/ADP-120ZB BBGD DELTA/ADP-120ZB BBGD
camera CHICONY/8036 CHICONY/8036
TV tuner AVERMEDIA/A337F AVERMEDIA/A337F
VGA MSI/MS-V167 10 MSI/MS-V167 10
Report No: 098S082-IT-CE-P01V01
Page: 15 of 116
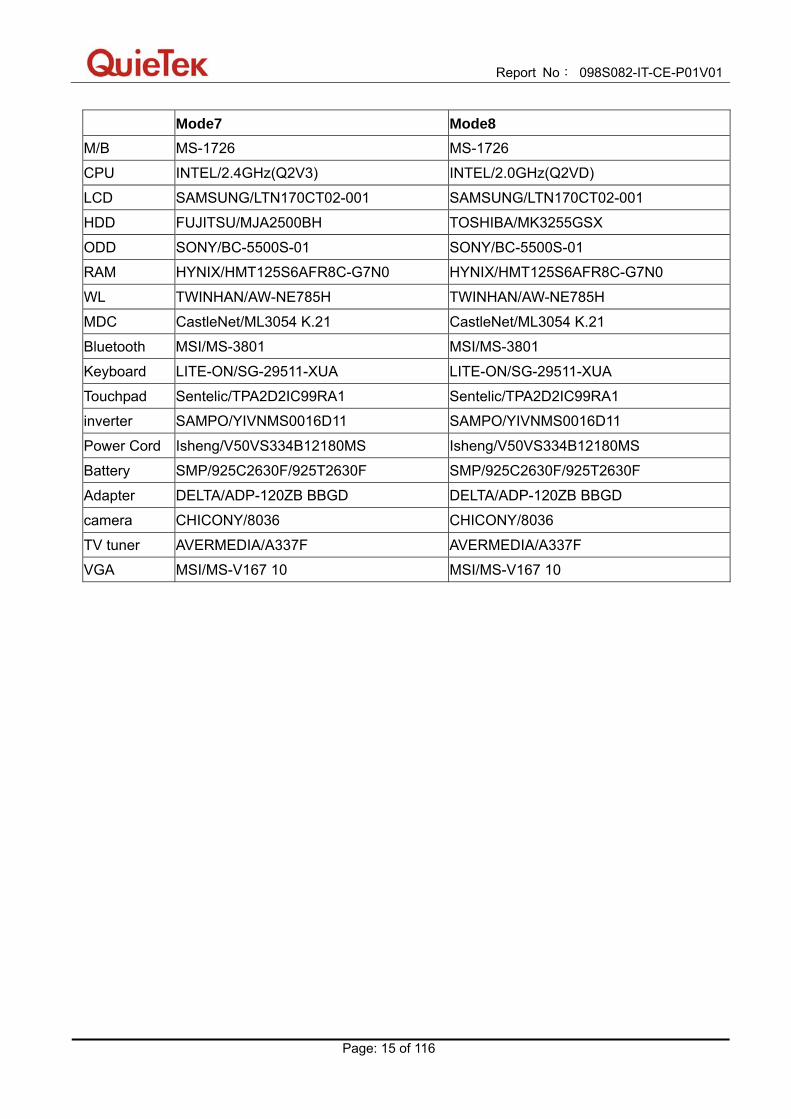
Mode7 Mode8 M/B MS-1726 MS-1726
CPU INTEL/2.4GHz(Q2V3) INTEL/2.0GHz(Q2VD)
LCD SAMSUNG/LTN170CT02-001 SAMSUNG/LTN170CT02-001
HDD FUJITSU/MJA2500BH TOSHIBA/MK3255GSX
ODD SONY/BC-5500S-01 SONY/BC-5500S-01
RAM HYNIX/HMT125S6AFR8C-G7N0 HYNIX/HMT125S6AFR8C-G7N0
WL TWINHAN/AW-NE785H TWINHAN/AW-NE785H
MDC CastleNet/ML3054 K.21 CastleNet/ML3054 K.21
Bluetooth MSI/MS-3801 MSI/MS-3801
Keyboard LITE-ON/SG-29511-XUA LITE-ON/SG-29511-XUA
Touchpad Sentelic/TPA2D2IC99RA1 Sentelic/TPA2D2IC99RA1
inverter SAMPO/YIVNMS0016D11 SAMPO/YIVNMS0016D11
Power Cord Isheng/V50VS334B12180MS Isheng/V50VS334B12180MS
Battery SMP/925C2630F/925T2630F SMP/925C2630F/925T2630F
Adapter DELTA/ADP-120ZB BBGD DELTA/ADP-120ZB BBGD
camera CHICONY/8036 CHICONY/8036
TV tuner AVERMEDIA/A337F AVERMEDIA/A337F
VGA MSI/MS-V167 10 MSI/MS-V167 10

Report No: 098S082-IT-CE-P01V01
Page: 16 of 116
Mode9 Mode10 M/B MS-1726 MS-1726
CPU INTEL/2.13GHz(Q2VG) INTEL/1.86GHz(Q2VM)
LCD SAMSUNG/LTN170CT02-001 SAMSUNG/LTN170CT02-001
HDD TOSHIBA/MK2555GSX TOSHIBA/MK5055GSX-AZK
ODD SONY/BC-5500S-01 SONY/BC-5500S-01
RAM TRANSCEND/TS256MSK64V1U-S TRANSCEND/TS256MSK64V1U-S
WL TWINHAN/AW-NE785H TWINHAN/AW-NE785H
MDC CastleNet/ML3054 K.21 CastleNet/ML3054 K.21
Bluetooth MSI/MS-3801 MSI/MS-3801
Keyboard LITE-ON/SG-29511-XUA LITE-ON/SG-29511-XUA
Touchpad Sentelic/TPA2D2IC99RA1 Sentelic/TPA2D2IC99RA1
inverter SAMPO/YIVNMS0016D11 SAMPO/YIVNMS0016D11
Power Cord Isheng/V50VS334B12180MS Isheng/V50VS334B12180MS
Battery SMP/925C2630F/925T2630F SMP/925C2630F/925T2630F
Adapter DELTA/ADP-120ZB BBGD DELTA/ADP-120ZB BBGD
camera CHICONY/8036 CHICONY/8036
TV tuner AVERMEDIA/A337F AVERMEDIA/A337F
VGA MSI/MS-V167 10 MSI/MS-V167 10

Report No: 098S082-IT-CE-P01V01
Page: 17 of 116
1.3. Tested System Details The types for all equipments, plus descriptions of all cables used in the tested system (including inserted cards) are:
Product Manufacturer Model No. Serial No. Power Cord
1 LCD Monitor DELL 3008WFP 7735432490P08B Non-Shielded, 1.8m
2 CRT ‘’21 IBM 6652-U3N 3 Non-Shielded, 1.8m
3 Microphone & Earphone SALAR N/A 5 N/A
4 Microphone & Earphone SOMIC CD-2688M.V N/A N/A
5 Walkman GLXIN QL-7006 N/A Battery
6 USB Mouse DELL MO56UOA GOQ02414 Power by PC
7 SATA HDD&1394 HDD Seagate 9NL6M6-500 6QG05BN1 Power by adapter
8 SATA HDD&1394 HDD Seagate 9NL6M6-500 6QG0463B Power by adapter
9 Program Control
Telephone Exchange Xinlitong 104B LC138104B200400014 Non-Shielded, 1.5m
10 MacBook Apple MB061CH W8732B4TZ5V Power by adapter
11 SD Card Kingston 1GB N/A N/A
12 Express Card APIOTEK 24in1 1 N/A
13 Antenna MSI N/A N/A N/A
14 iPod Apple A1199 6U715YT3VQ5 Power by PC
15 Remote Control MSI RC115V N/A N/A
16 USB Receiver MSI IR603 N/A N/A
17 PC DELL DCMF 11DMF2X Non-Shielded, 1.8m
Report No: 098S082-IT-CE-P01V01
Page: 18 of 116
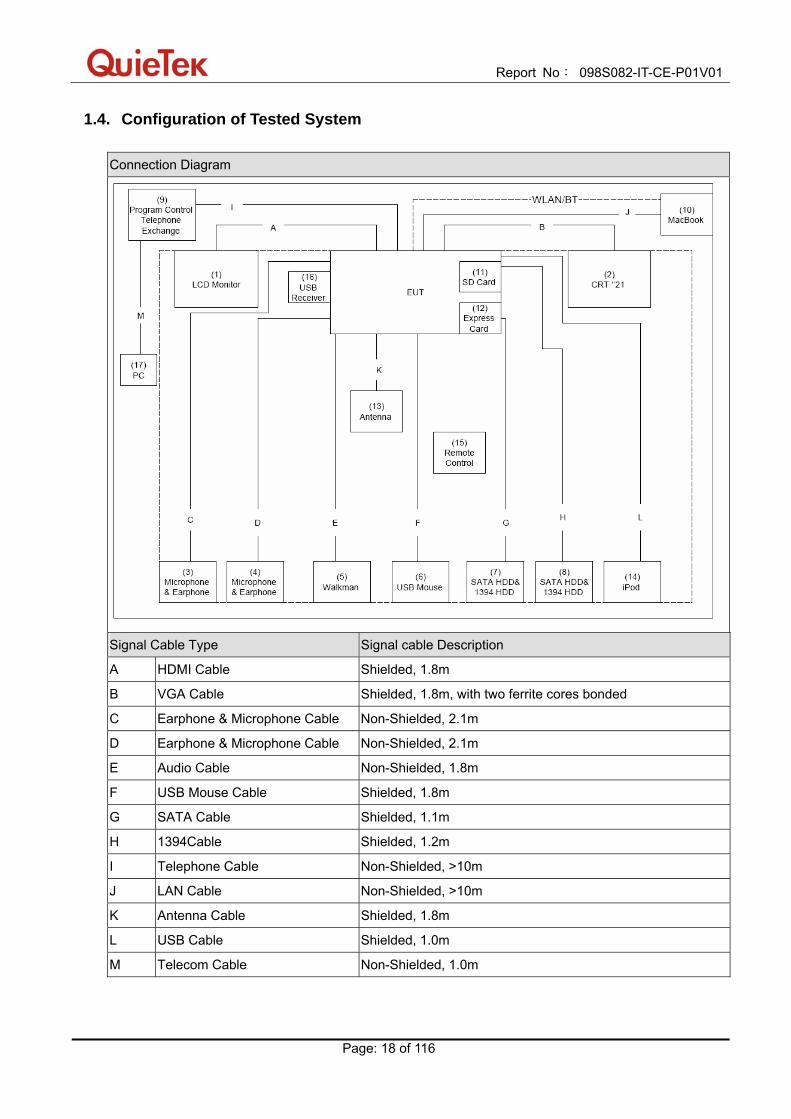
1.4. Configuration of Tested System
Connection Diagram
Signal Cable Type Signal cable Description
A HDMI Cable Shielded, 1.8m
B VGA Cable Shielded, 1.8m, with two ferrite cores bonded
C Earphone & Microphone Cable Non-Shielded, 2.1m
D Earphone & Microphone Cable Non-Shielded, 2.1m
E Audio Cable Non-Shielded, 1.8m
F USB Mouse Cable Shielded, 1.8m
G SATA Cable Shielded, 1.1m
H 1394Cable Shielded, 1.2m
I Telephone Cable Non-Shielded, >10m
J LAN Cable Non-Shielded, >10m
K Antenna Cable Shielded, 1.8m
L USB Cable Shielded, 1.0m
M Telecom Cable Non-Shielded, 1.0m

Report No: 098S082-IT-CE-P01V01
Page: 19 of 116
1.5. EUT Exercise Software
1 Setup the EUT and simulators as shown on above.
2 Turn on the power of all equipment.
3 Execute the HDD running program using WINTHRAX (Ver:3.09.02) software.
4 Notebook will send and receive data through LAN using “Ping” function.
5 Notebook will send and receive data through Telecom using Hyper terminal program.
6 Communicate with another Notebook by WLAN and Bluetooth.
7 Execute the EMC test program of BurnIn Test 5.0 and “H” pattern will be showed on screen.
8 Open to the operation of camera and play music using player program.
Report No: 098S082-IT-CE-P01V01
Page: 20 of 116
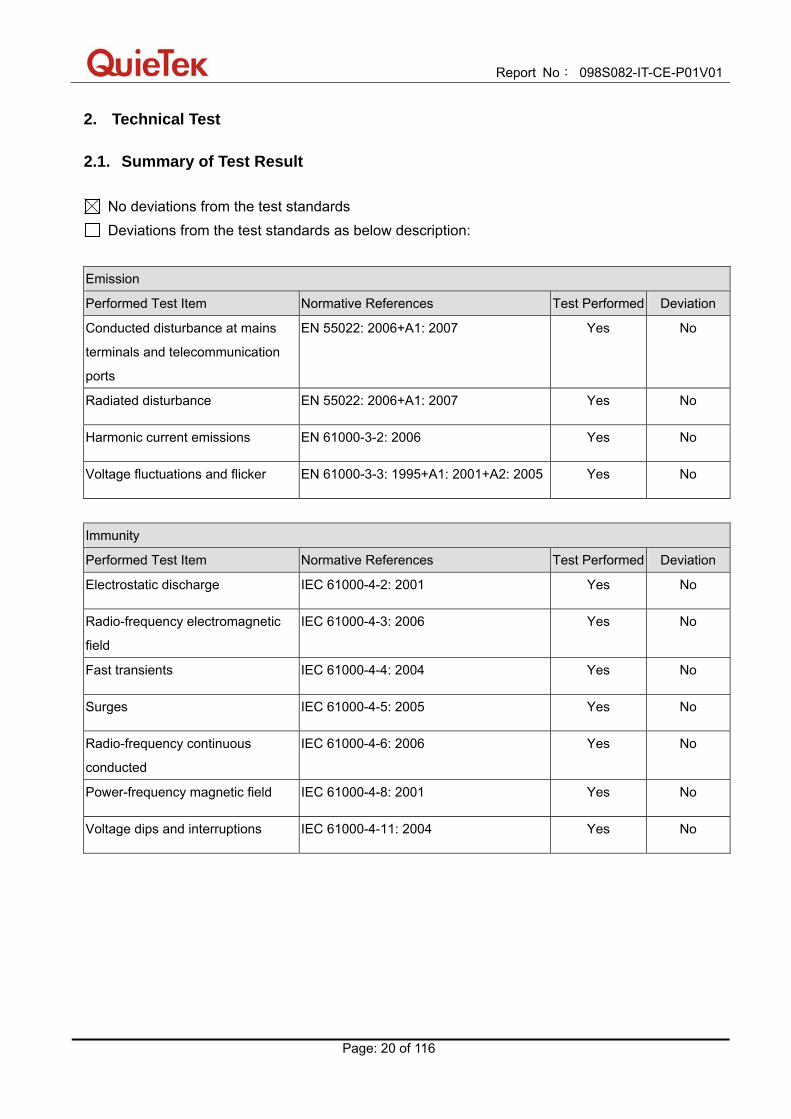
2. Technical Test 2.1. Summary of Test Result
No deviations from the test standards Deviations from the test standards as below description:
Emission
Performed Test Item Normative References Test Performed Deviation
Conducted disturbance at mains
terminals and telecommunication
ports
EN 55022: 2006+A1: 2007
Yes No
Radiated disturbance EN 55022: 2006+A1: 2007 Yes No
Harmonic current emissions EN 61000-3-2: 2006 Yes No
Voltage fluctuations and flicker EN 61000-3-3: 1995+A1: 2001+A2: 2005 Yes No
Immunity
Performed Test Item Normative References Test Performed Deviation
Electrostatic discharge IEC 61000-4-2: 2001 Yes No
Radio-frequency electromagnetic
field
IEC 61000-4-3: 2006 Yes No
Fast transients IEC 61000-4-4: 2004 Yes No
Surges IEC 61000-4-5: 2005 Yes No
Radio-frequency continuous
conducted
IEC 61000-4-6: 2006 Yes No
Power-frequency magnetic field IEC 61000-4-8: 2001 Yes No
Voltage dips and interruptions IEC 61000-4-11: 2004 Yes No

Report No: 098S082-IT-CE-P01V01
Page: 21 of 116
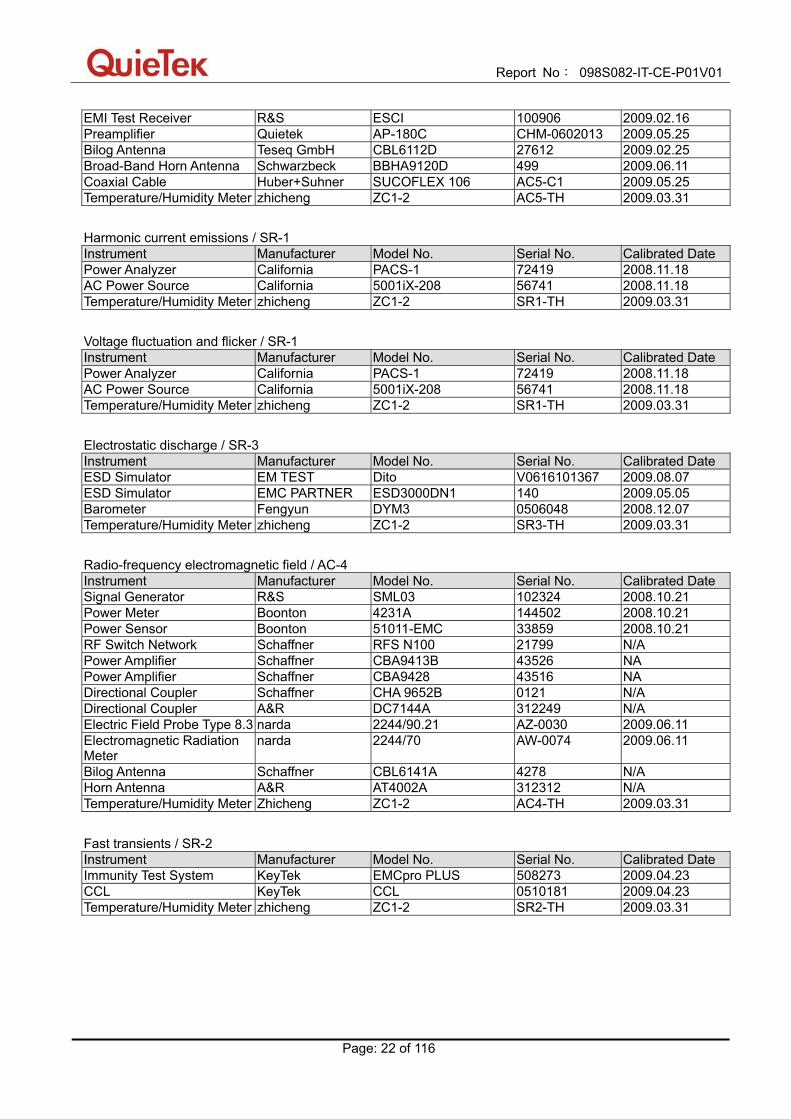
2.2. List of Test Equipment Conducted disturbance at mains terminals and telecommunication ports / SR-1 Instrument Manufacturer Model No. Serial No. Calibrated Date EMI Test Receiver R&S ESCI 100726 2009.04.23 Two-Line V-Network R&S ENV216 100013 2009.06.11 Two-Line V-Network R&S ENV216 100014 2009.04.23 Balanced Telecom ISN Fischer FCC-TLISN-T2-02 20352 2009.02.03 Balanced Telecom ISN Fischer FCC-TLISN-T4-02 20353 2009.02.03 Balanced Telecom ISN Fischer FCC-TLISN-T8-02 20354 2009.02.03 Current Probe R&S EZ-17 100255 2009.04.18 50ohm Termination SHX TF2 07081401 2008.09.28 50ohm Termination SHX TF2 07081402 2008.09.28 50ohm Termination SHX TF2 07081403 2008.09.28 50ohm Coaxial Switch Anritsu MP59B 6200464462 2008.11.24 Coaxial Cable Suhner RG 223 SR1-C1 2009.05.25 Temperature/Humidity Meter zhicheng ZC1-2 SR1-TH 2009.03.31 Radiated disturbance / AC-1 Instrument Manufacturer Model No. Serial No. Calibrated Date Spectrum Analyzer Agilent E4403B MY45102715 N/A Spectrum Analyzer Agilent E4403B MY45102798 N/A Spectrum Analyzer Agilent N9010A MY48030494 2009.04.23 EMI Test Receiver R&S ESCI 100175 2008.11.15 Preamplifier Quietek AP-025C CHM-0511006 2009.05.25 Preamplifier Quietek AP-025C CHM-0609028 2009.05.25 Preamplifier Quietek AP-180C CHM-0602013 2009.05.25 Bilog Antenna Schaffner CBL6112B 2933 2008.11.21 Bilog Antenna Schaffner CBL6112B 2931 2008.11.21 Broad-Band Horn Antenna Schwarzbeck BBHA9120D 499 2009.06.11 50ohm Coaxial Switch Anritsu MP59B 6200447303 2008.11.24 50ohm Coaxial Switch Anritsu MP59B 6200464461 2008.11.24 50ohm Coaxial Switch Anritsu MP59B 6200447305 2008.11.24 Coaxial Cable Huber+Suhner SUCOFLEX 106 AC1-L 2009.05.25 Coaxial Cable Huber+Suhner SUCOFLEX 106 AC1-R 2009.05.25 Coaxial Cable Huber+Suhner SUCOFLEX 106 AC1-C 2009.05.25 Temperature/Humidity Meter zhicheng ZC1-2 AC1-TH 2009.03.31 Radiated disturbance / AC-2 Instrument Manufacturer Model No. Serial No. Calibrated Date EMI Test Receiver R&S ESCI 100573 2009.04.23 Bilog Antenna Teseq GmbH CBL6112D 27611 2009.02.25 Coaxial Cable Huber+Suhner SUCOFLEX 106 AC2-C 2009.05.25 Temperature/Humidity Meter zhicheng ZC1-2 AC2-TH 2009.03.31 Radiated disturbance / AC-3 Instrument Manufacturer Model No. Serial No. Calibrated Date EMI Test Receiver R&S ESCI 100176 2008.11.15 Bilog Antenna Teseq GmbH CBL6112D 27613 2009.02.25 Coaxial Cable Huber+Suhner SUCOFLEX 106 AC3-C 2009.05.25 Temperature/Humidity Meter zhicheng ZC1-2 AC3-TH 2009.03.31 Radiated disturbance / AC-5 Instrument Manufacturer Model No. Serial No. Calibrated Date Spectrum Analyzer Agilent N9010A MY48030494 2009.04.23
Report No: 098S082-IT-CE-P01V01
Page: 22 of 116
EMI Test Receiver R&S ESCI 100906 2009.02.16 Preamplifier Quietek AP-180C CHM-0602013 2009.05.25 Bilog Antenna Teseq GmbH CBL6112D 27612 2009.02.25 Broad-Band Horn Antenna Schwarzbeck BBHA9120D 499 2009.06.11 Coaxial Cable Huber+Suhner SUCOFLEX 106 AC5-C1 2009.05.25 Temperature/Humidity Meter zhicheng ZC1-2 AC5-TH 2009.03.31 Harmonic current emissions / SR-1 Instrument Manufacturer Model No. Serial No. Calibrated Date Power Analyzer California PACS-1 72419 2008.11.18 AC Power Source California 5001iX-208 56741 2008.11.18 Temperature/Humidity Meter zhicheng ZC1-2 SR1-TH 2009.03.31 Voltage fluctuation and flicker / SR-1 Instrument Manufacturer Model No. Serial No. Calibrated Date Power Analyzer California PACS-1 72419 2008.11.18 AC Power Source California 5001iX-208 56741 2008.11.18 Temperature/Humidity Meter zhicheng ZC1-2 SR1-TH 2009.03.31 Electrostatic discharge / SR-3 Instrument Manufacturer Model No. Serial No. Calibrated Date ESD Simulator EM TEST Dito V0616101367 2009.08.07 ESD Simulator EMC PARTNER ESD3000DN1 140 2009.05.05 Barometer Fengyun DYM3 0506048 2008.12.07 Temperature/Humidity Meter zhicheng ZC1-2 SR3-TH 2009.03.31 Radio-frequency electromagnetic field / AC-4 Instrument Manufacturer Model No. Serial No. Calibrated Date Signal Generator R&S SML03 102324 2008.10.21 Power Meter Boonton 4231A 144502 2008.10.21 Power Sensor Boonton 51011-EMC 33859 2008.10.21 RF Switch Network Schaffner RFS N100 21799 N/A Power Amplifier Schaffner CBA9413B 43526 NA Power Amplifier Schaffner CBA9428 43516 NA Directional Coupler Schaffner CHA 9652B 0121 N/A Directional Coupler A&R DC7144A 312249 N/A Electric Field Probe Type 8.3 narda 2244/90.21 AZ-0030 2009.06.11 Electromagnetic Radiation Meter
narda 2244/70 AW-0074 2009.06.11
Bilog Antenna Schaffner CBL6141A 4278 N/A Horn Antenna A&R AT4002A 312312 N/A Temperature/Humidity Meter Zhicheng ZC1-2 AC4-TH 2009.03.31 Fast transients / SR-2 Instrument Manufacturer Model No. Serial No. Calibrated Date Immunity Test System KeyTek EMCpro PLUS 508273 2009.04.23 CCL KeyTek CCL 0510181 2009.04.23 Temperature/Humidity Meter zhicheng ZC1-2 SR2-TH 2009.03.31
Report No: 098S082-IT-CE-P01V01
Page: 23 of 116
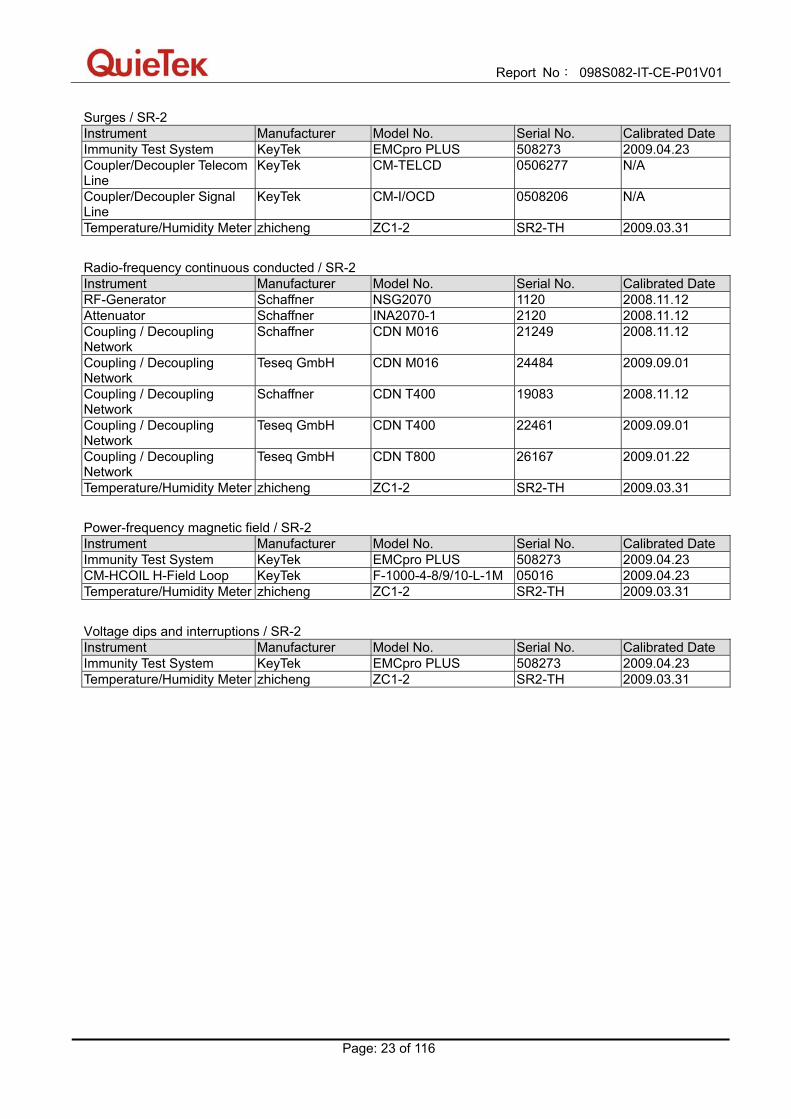
Surges / SR-2 Instrument Manufacturer Model No. Serial No. Calibrated Date Immunity Test System KeyTek EMCpro PLUS 508273 2009.04.23 Coupler/Decoupler Telecom Line
KeyTek CM-TELCD 0506277 N/A
Coupler/Decoupler Signal Line
KeyTek CM-I/OCD 0508206 N/A
Temperature/Humidity Meter zhicheng ZC1-2 SR2-TH 2009.03.31 Radio-frequency continuous conducted / SR-2 Instrument Manufacturer Model No. Serial No. Calibrated Date RF-Generator Schaffner NSG2070 1120 2008.11.12 Attenuator Schaffner INA2070-1 2120 2008.11.12 Coupling / Decoupling Network
Schaffner CDN M016 21249 2008.11.12
Coupling / Decoupling Network
Teseq GmbH CDN M016 24484 2009.09.01
Coupling / Decoupling Network
Schaffner CDN T400 19083 2008.11.12
Coupling / Decoupling Network
Teseq GmbH CDN T400 22461 2009.09.01
Coupling / Decoupling Network
Teseq GmbH CDN T800 26167 2009.01.22
Temperature/Humidity Meter zhicheng ZC1-2 SR2-TH 2009.03.31 Power-frequency magnetic field / SR-2 Instrument Manufacturer Model No. Serial No. Calibrated Date Immunity Test System KeyTek EMCpro PLUS 508273 2009.04.23 CM-HCOIL H-Field Loop KeyTek F-1000-4-8/9/10-L-1M 05016 2009.04.23 Temperature/Humidity Meter zhicheng ZC1-2 SR2-TH 2009.03.31 Voltage dips and interruptions / SR-2 Instrument Manufacturer Model No. Serial No. Calibrated Date Immunity Test System KeyTek EMCpro PLUS 508273 2009.04.23 Temperature/Humidity Meter zhicheng ZC1-2 SR2-TH 2009.03.31
Report No: 098S082-IT-CE-P01V01
Page: 24 of 116
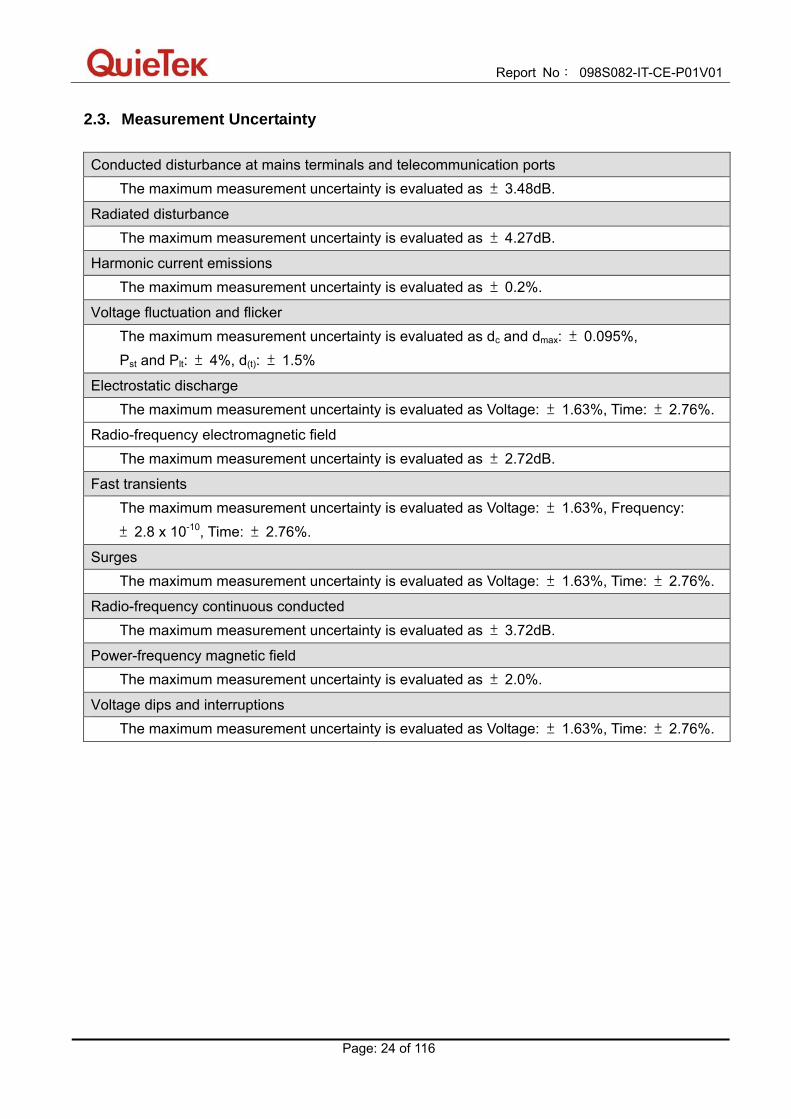
2.3. Measurement Uncertainty
Conducted disturbance at mains terminals and telecommunication ports
The maximum measurement uncertainty is evaluated as ± 3.48dB.
Radiated disturbance
The maximum measurement uncertainty is evaluated as ± 4.27dB.
Harmonic current emissions The maximum measurement uncertainty is evaluated as ± 0.2%.
Voltage fluctuation and flicker The maximum measurement uncertainty is evaluated as dc and dmax: ± 0.095%, Pst and Plt: ± 4%, d(t): ± 1.5%
Electrostatic discharge The maximum measurement uncertainty is evaluated as Voltage: ± 1.63%, Time: ± 2.76%.
Radio-frequency electromagnetic field The maximum measurement uncertainty is evaluated as ± 2.72dB.
Fast transients The maximum measurement uncertainty is evaluated as Voltage: ± 1.63%, Frequency: ± 2.8 x 10⁻¹⁰, Time: ± 2.76%.
Surges The maximum measurement uncertainty is evaluated as Voltage: ± 1.63%, Time: ± 2.76%.
Radio-frequency continuous conducted The maximum measurement uncertainty is evaluated as ± 3.72dB.
Power-frequency magnetic field The maximum measurement uncertainty is evaluated as ± 2.0%.
Voltage dips and interruptions The maximum measurement uncertainty is evaluated as Voltage: ± 1.63%, Time: ± 2.76%.

Report No: 098S082-IT-CE-P01V01
Page: 25 of 116
2.4. Performance Criteria Performance Criterion A The equipment shall continue to operate as intended without operator intervention. No degradation of performance or loss of function is allowed below a performance level specified by the anufacturer when the equipment is used as intended. The performance level may be replaced by a permissible loss of performance. If the minimum performance level or the permissible performance loss is not specified by the manufacturer, then either of these may be derived from the product description and documentation, and by what the user may reasonably expect from the equipment if used as ntended. Performance Criterion B After the test, the equipment shall continue to operate as intended without operator intervention. No degradation of performance or loss of function is allowed, after the application of the phenomena below a performance level specified by the manufacturer, when the equipment is used as intended. The performance level may be replaced by a permissible loss of performance. During the test, degradation of performance is allowed. However, no change of operating state or stored data is allowed to persist after the test. If the minimum performance level (or the permissible performance loss) is not specified by the manufacturer, then either of these may be derived from the product description and documentation, and by what the user may reasonably expect from the equipment if used as intended. Performance Criterion C Loss of function is allowed, provided the function is self-recoverable, or can be restored by the operation of the controls by the user in accordance with the manufacturer’s instructions. Functions, and/or information stored in non-volatile memory, or protected by a battery backup, shall not be lost.
Report No: 098S082-IT-CE-P01V01
Page: 26 of 116
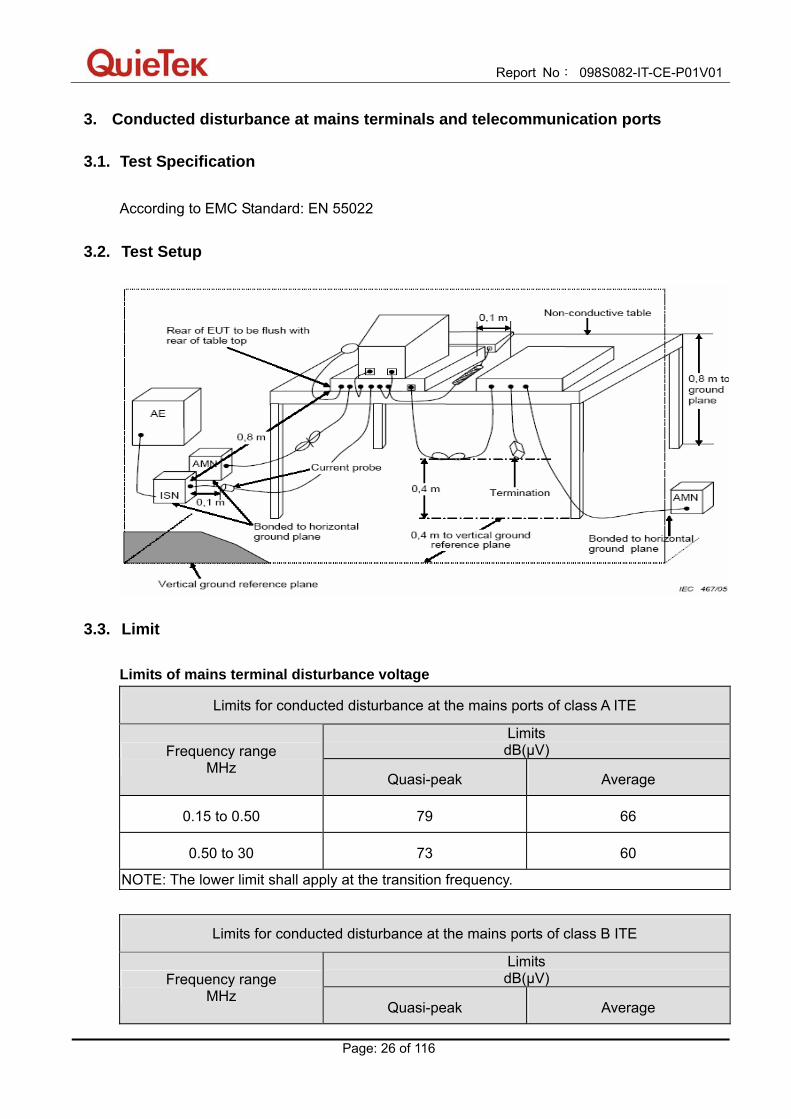
3. Conducted disturbance at mains terminals and telecommunication ports
3.1. Test Specification
According to EMC Standard: EN 55022
3.2. Test Setup
3.3. Limit Limits of mains terminal disturbance voltage
Limits for conducted disturbance at the mains ports of class A ITE
Limits dB(µV) Frequency range
MHz Quasi-peak Average
0.15 to 0.50 79 66
0.50 to 30 73 60
NOTE: The lower limit shall apply at the transition frequency.
Limits for conducted disturbance at the mains ports of class B ITE
Limits dB(µV) Frequency range
MHz Quasi-peak Average
Report No: 098S082-IT-CE-P01V01
Page: 27 of 116
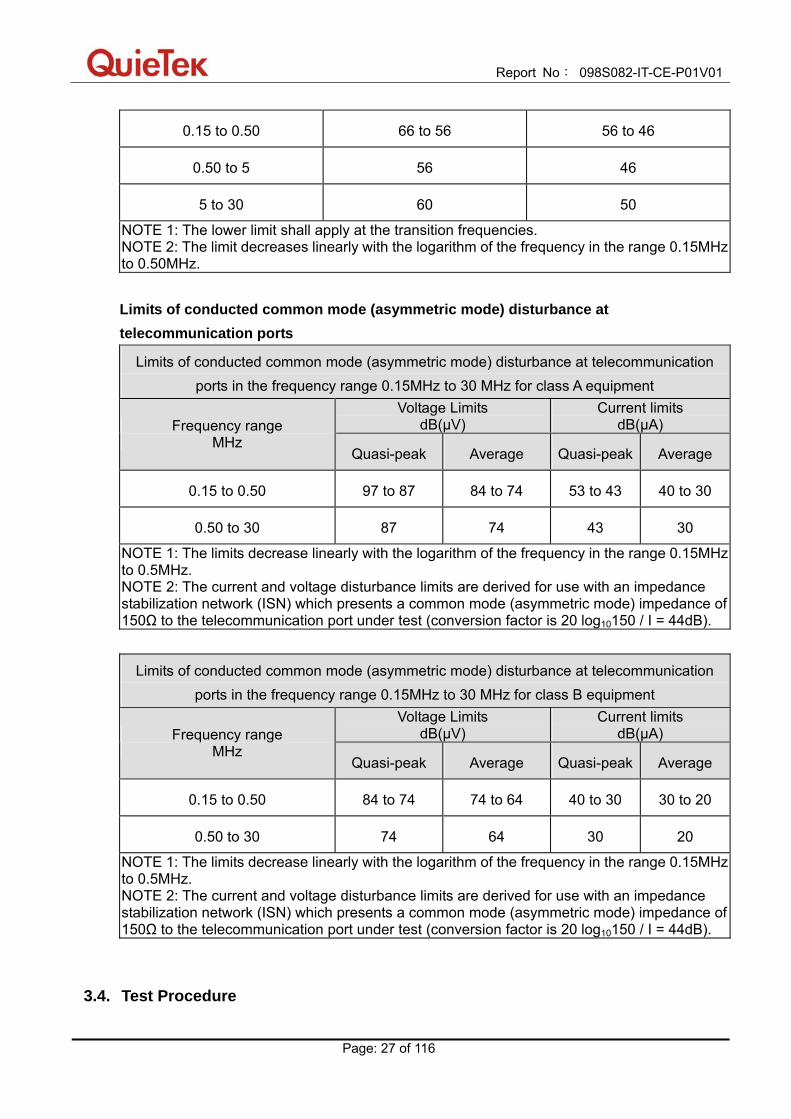
0.15 to 0.50 66 to 56 56 to 46
0.50 to 5 56 46
5 to 30 60 50
NOTE 1: The lower limit shall apply at the transition frequencies. NOTE 2: The limit decreases linearly with the logarithm of the frequency in the range 0.15MHz to 0.50MHz. Limits of conducted common mode (asymmetric mode) disturbance at telecommunication ports
Limits of conducted common mode (asymmetric mode) disturbance at telecommunication ports in the frequency range 0.15MHz to 30 MHz for class A equipment
Voltage Limits dB(µV)
Current limits dB(µA) Frequency range
MHz Quasi-peak Average Quasi-peak Average
0.15 to 0.50 97 to 87 84 to 74 53 to 43 40 to 30
0.50 to 30 87 74 43 30
NOTE 1: The limits decrease linearly with the logarithm of the frequency in the range 0.15MHz to 0.5MHz. NOTE 2: The current and voltage disturbance limits are derived for use with an impedance stabilization network (ISN) which presents a common mode (asymmetric mode) impedance of 150Ω to the telecommunication port under test (conversion factor is 20 log10150 / I = 44dB).
Limits of conducted common mode (asymmetric mode) disturbance at telecommunication ports in the frequency range 0.15MHz to 30 MHz for class B equipment
Voltage Limits dB(µV)
Current limits dB(µA) Frequency range
MHz Quasi-peak Average Quasi-peak Average
0.15 to 0.50 84 to 74 74 to 64 40 to 30 30 to 20
0.50 to 30 74 64 30 20
NOTE 1: The limits decrease linearly with the logarithm of the frequency in the range 0.15MHz to 0.5MHz. NOTE 2: The current and voltage disturbance limits are derived for use with an impedance stabilization network (ISN) which presents a common mode (asymmetric mode) impedance of 150Ω to the telecommunication port under test (conversion factor is 20 log10150 / I = 44dB).
3.4. Test Procedure
Report No: 098S082-IT-CE-P01V01
Page: 28 of 116
For Main Ports: The EUT and simulators are connected to the main power through a line impedance stabilization network (L.I.S.N.). This provides a 50Ω / 50µH or 50Ω / 50µH + 5Ω coupling impedance for the measuring equipment. The peripheral devices are also connected to the main power through a LISN that provides a 50Ω / 50µH or 50Ω / 50µH + 5Ω coupling mpedance with 50Ω termination. Both sides of A.C. line are checked for maximum conducted interference. Conducted emissions were invested over the frequency range from 0.15MHz to 30MHz using a receiver bandwidth of 9kHz. For Telecommunication Ports:
The mains voltage shall be supplied to the EUT via the LISN when the measurement of telecommunication port is performed. The common mode disturbances at the telecommunication port shall be connected to the ISN, which is 150Ω impedance. Both alternative cables are tested related to the LCL requested. Conducted emissions were invested over the frequency range from 0.15MHz to 30MHz using a receiver bandwidth of 9kHz.
3.5. Deviation from Test Standard No deviation.
Report No: 098S082-IT-CE-P01V01
Page: 29 of 116
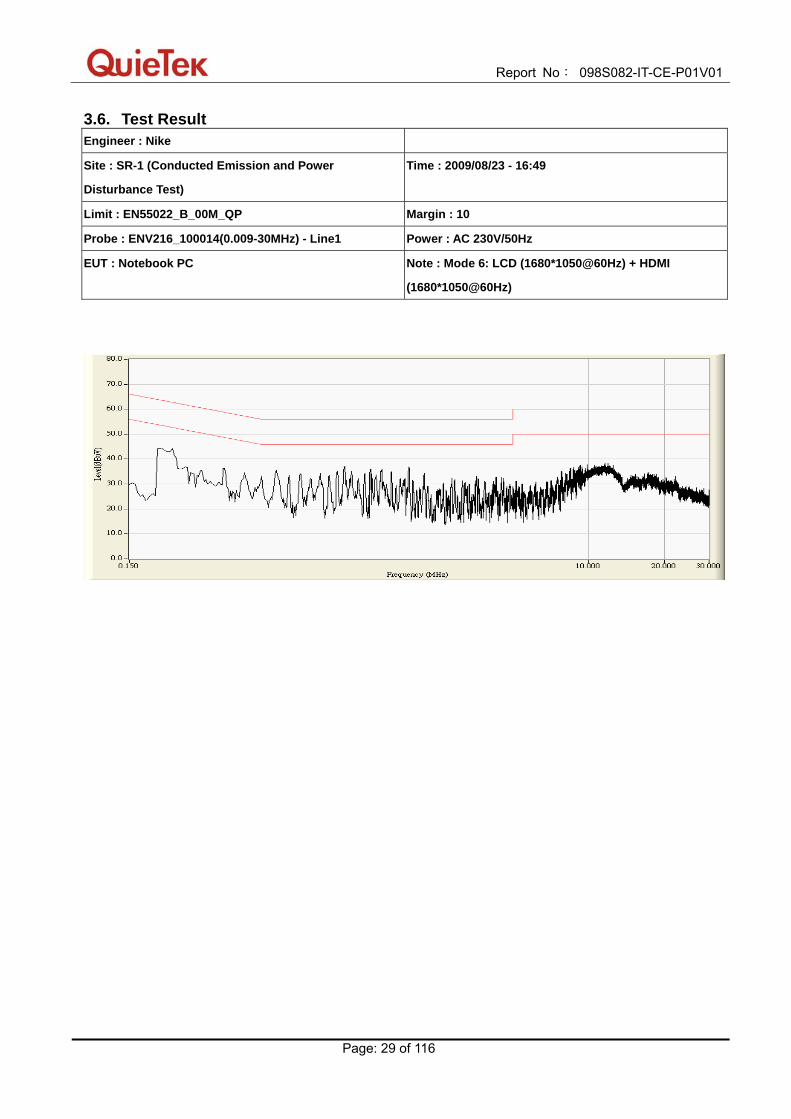
3.6. Test Result Engineer : Nike
Site : SR-1 (Conducted Emission and Power
Disturbance Test)
Time : 2009/08/23 - 16:49
Limit : EN55022_B_00M_QP Margin : 10
Probe : ENV216_100014(0.009-30MHz) - Line1 Power : AC 230V/50Hz
EUT : Notebook PC Note : Mode 6: LCD (1680*1050@60Hz) + HDMI
(1680*1050@60Hz)
Report No: 098S082-IT-CE-P01V01
Page: 30 of 116
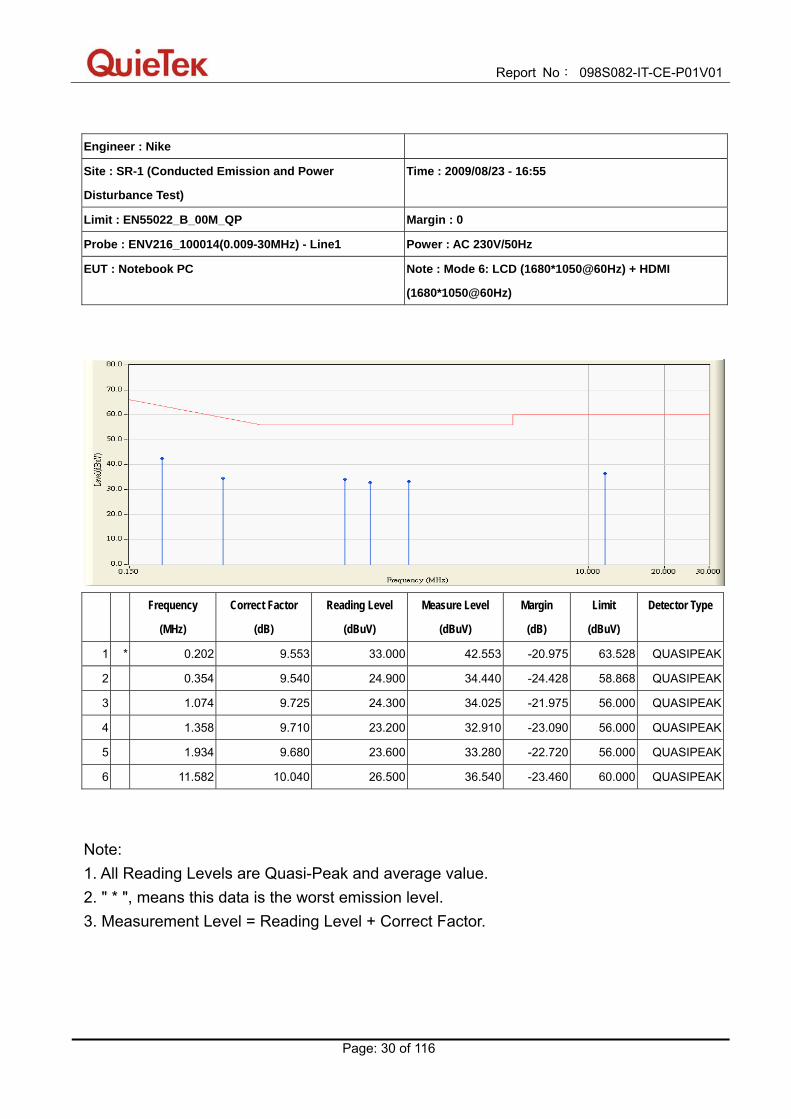
Engineer : Nike
Site : SR-1 (Conducted Emission and Power
Disturbance Test)
Time : 2009/08/23 - 16:55
Limit : EN55022_B_00M_QP Margin : 0
Probe : ENV216_100014(0.009-30MHz) - Line1 Power : AC 230V/50Hz
EUT : Notebook PC Note : Mode 6: LCD (1680*1050@60Hz) + HDMI
(1680*1050@60Hz)
Frequency
(MHz)
Correct Factor
(dB)
Reading Level
(dBuV)
Measure Level
(dBuV)
Margin
(dB)
Limit
(dBuV)
Detector Type
1 * 0.202 9.553 33.000 42.553 -20.975 63.528 QUASIPEAK
2 0.354 9.540 24.900 34.440 -24.428 58.868 QUASIPEAK
3 1.074 9.725 24.300 34.025 -21.975 56.000 QUASIPEAK
4 1.358 9.710 23.200 32.910 -23.090 56.000 QUASIPEAK
5 1.934 9.680 23.600 33.280 -22.720 56.000 QUASIPEAK
6 11.582 10.040 26.500 36.540 -23.460 60.000 QUASIPEAK
Note: 1. All Reading Levels are Quasi-Peak and average value. 2. " * ", means this data is the worst emission level. 3. Measurement Level = Reading Level + Correct Factor.

Report No: 098S082-IT-CE-P01V01
Page: 31 of 116
Engineer : Nike
Site : SR-1 (Conducted Emission and Power
Disturbance Test)
Time : 2009/08/23 - 16:55
Limit : EN55022_B_00M_AV Margin : 0
Probe : ENV216_100014(0.009-30MHz) - Line1 Power : AC 230V/50Hz
EUT : Notebook PC Note : Mode 6: LCD (1680*1050@60Hz) + HDMI
(1680*1050@60Hz)
Frequency
(MHz)
Correct Factor
(dB)
Reading Level
(dBuV)
Measure Level
(dBuV)
Margin
(dB)
Limit
(dBuV)
Detector Type
1 0.202 9.553 26.100 35.653 -17.875 53.528 AVERAGE
2 0.354 9.540 21.800 31.340 -17.528 48.868 AVERAGE
3 1.074 9.725 18.400 28.125 -17.875 46.000 AVERAGE
4 1.358 9.710 19.400 29.110 -16.890 46.000 AVERAGE
5 * 1.934 9.680 21.200 30.880 -15.120 46.000 AVERAGE
6 11.582 10.040 19.300 29.340 -20.660 50.000 AVERAGE
Note: 1. All Reading Levels are Quasi-Peak and average value. 2. " * ", means this data is the worst emission level. 3. Measurement Level = Reading Level + Correct Factor.
Report No: 098S082-IT-CE-P01V01
Page: 32 of 116
Engineer : Nike
Site : SR-1 (Conducted Emission and Power
Disturbance Test)
Time : 2009/08/23 - 16:59
Limit : EN55022_B_00M_QP Margin : 10
Probe : ENV216_100014(0.009-30MHz) - Line2 Power : AC 230V/50Hz
EUT : Notebook PC Note : Mode 6: LCD (1680*1050@60Hz) + HDMI
(1680*1050@60Hz)

Report No: 098S082-IT-CE-P01V01
Page: 33 of 116
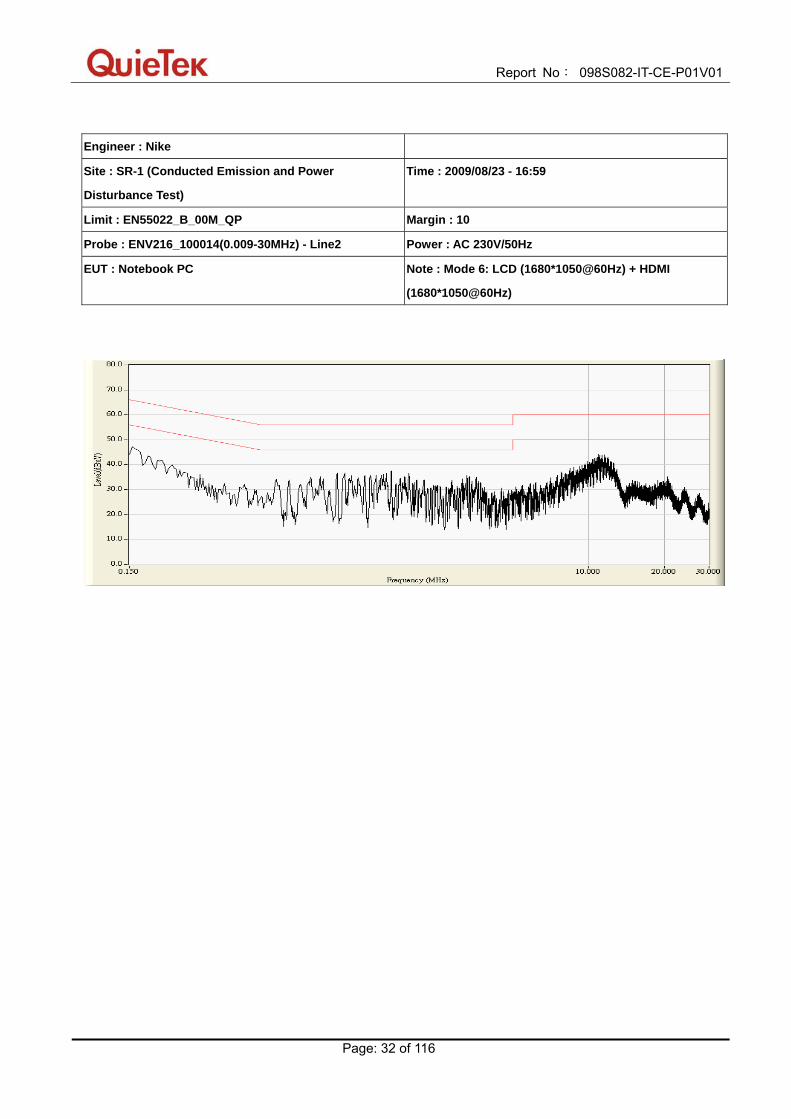
Engineer : Nike
Site : SR-1 (Conducted Emission and Power
Disturbance Test)
Time : 2009/08/23 - 17:02
Limit : EN55022_B_00M_QP Margin : 0
Probe : ENV216_100014(0.009-30MHz) - Line2 Power : AC 230V/50Hz
EUT : Notebook PC Note : Mode 6: LCD (1680*1050@60Hz) + HDMI
(1680*1050@60Hz)
Frequency
(MHz)
Correct Factor
(dB)
Reading Level
(dBuV)
Measure Level
(dBuV)
Margin
(dB)
Limit
(dBuV)
Detector Type
1 0.154 10.017 28.600 38.617 -27.164 65.781 QUASIPEAK
2 0.286 9.596 15.900 25.496 -35.144 60.640 QUASIPEAK
3 1.074 9.770 25.900 35.670 -20.330 56.000 QUASIPEAK
4 1.646 9.704 26.200 35.904 -20.096 56.000 QUASIPEAK
5 3.278 9.690 21.400 31.090 -24.910 56.000 QUASIPEAK
6 * 10.878 9.910 31.500 41.410 -18.590 60.000 QUASIPEAK
Note: 1. All Reading Levels are Quasi-Peak and average value. 2. " * ", means this data is the worst emission level. 3. Measurement Level = Reading Level + Correct Factor.
Report No: 098S082-IT-CE-P01V01
Page: 34 of 116
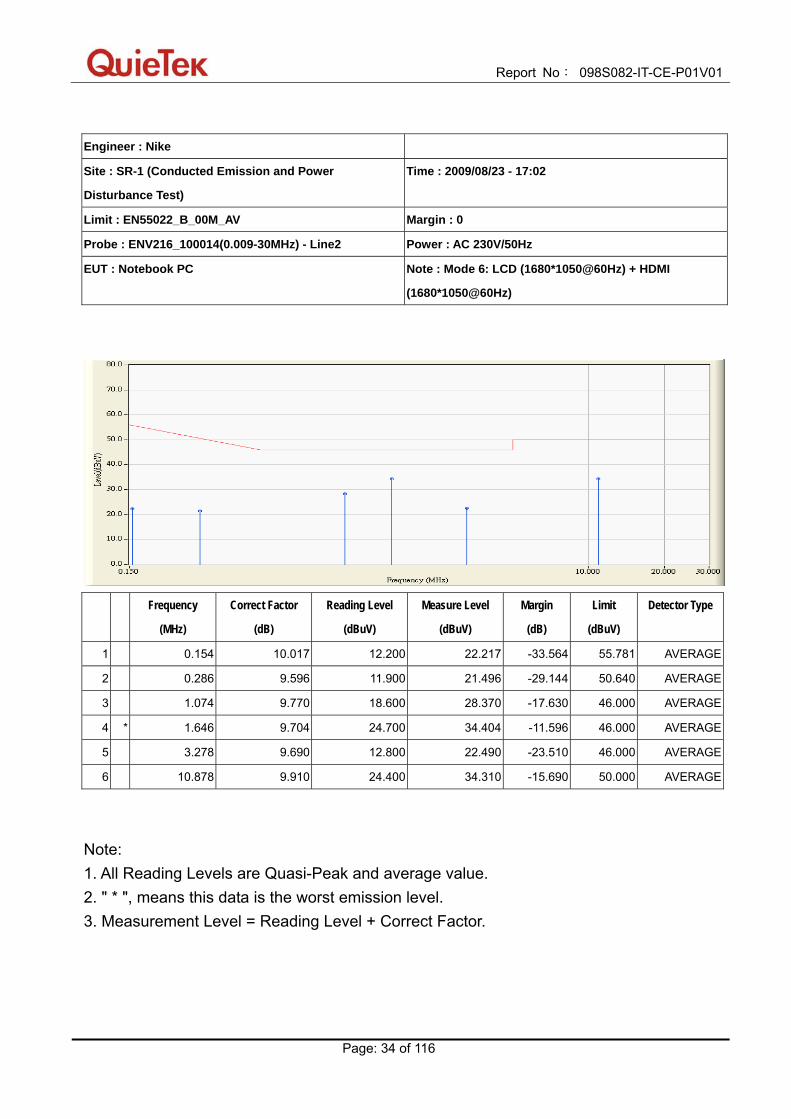
Engineer : Nike
Site : SR-1 (Conducted Emission and Power
Disturbance Test)
Time : 2009/08/23 - 17:02
Limit : EN55022_B_00M_AV Margin : 0
Probe : ENV216_100014(0.009-30MHz) - Line2 Power : AC 230V/50Hz
EUT : Notebook PC Note : Mode 6: LCD (1680*1050@60Hz) + HDMI
(1680*1050@60Hz)
Frequency
(MHz)
Correct Factor
(dB)
Reading Level
(dBuV)
Measure Level
(dBuV)
Margin
(dB)
Limit
(dBuV)
Detector Type
1 0.154 10.017 12.200 22.217 -33.564 55.781 AVERAGE
2 0.286 9.596 11.900 21.496 -29.144 50.640 AVERAGE
3 1.074 9.770 18.600 28.370 -17.630 46.000 AVERAGE
4 * 1.646 9.704 24.700 34.404 -11.596 46.000 AVERAGE
5 3.278 9.690 12.800 22.490 -23.510 46.000 AVERAGE
6 10.878 9.910 24.400 34.310 -15.690 50.000 AVERAGE
Note: 1. All Reading Levels are Quasi-Peak and average value. 2. " * ", means this data is the worst emission level. 3. Measurement Level = Reading Level + Correct Factor.

Report No: 098S082-IT-CE-P01V01
Page: 35 of 116
Engineer : Rove
Site : SR-1 (Conducted Emission and Power
Disturbance Test)
Time : 2009/09/04 - 03:00
Limit : ISN_Voltage_B_00M_QP Margin : 10
Probe : FCC-TLISN-T4_20353(0.15-30MHz) - Line1 Power : AC 230V/50Hz
EUT : Notebook PC Note : Mode 6: LCD (1680*1050@60Hz) + HDMI
(1680*1050@60Hz) - 10Mbps
Report No: 098S082-IT-CE-P01V01
Page: 36 of 116
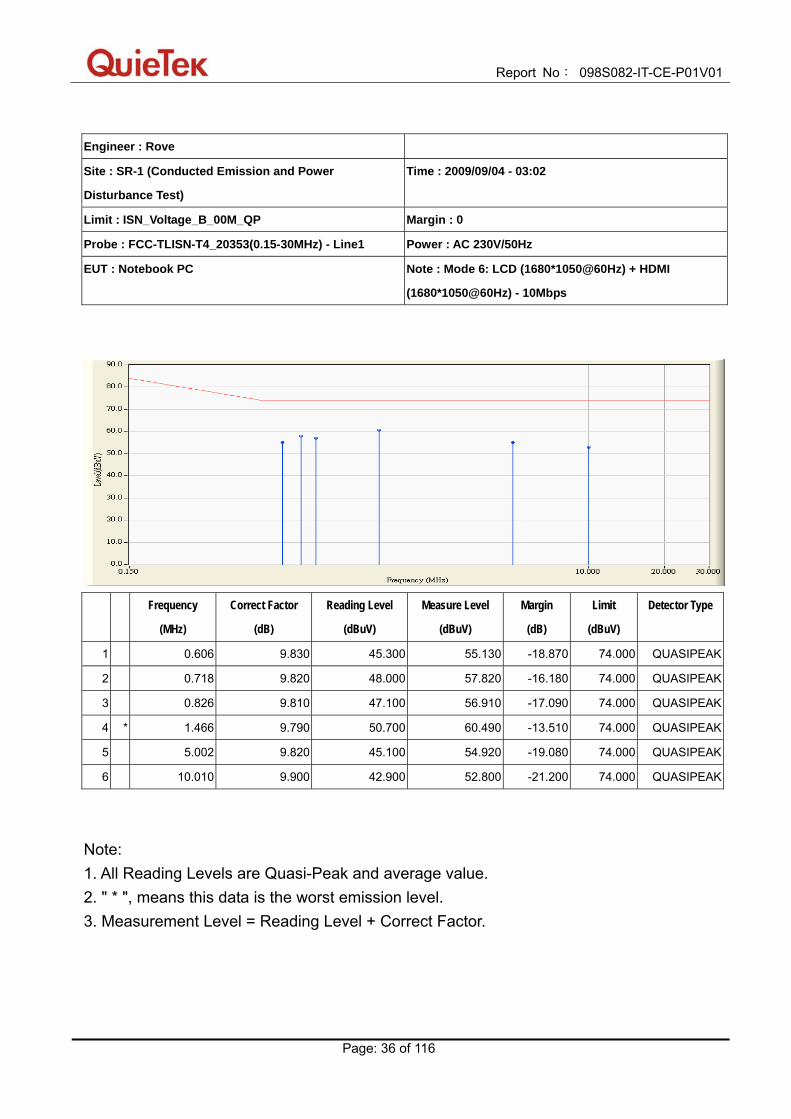
Engineer : Rove
Site : SR-1 (Conducted Emission and Power
Disturbance Test)
Time : 2009/09/04 - 03:02
Limit : ISN_Voltage_B_00M_QP Margin : 0
Probe : FCC-TLISN-T4_20353(0.15-30MHz) - Line1 Power : AC 230V/50Hz
EUT : Notebook PC Note : Mode 6: LCD (1680*1050@60Hz) + HDMI
(1680*1050@60Hz) - 10Mbps
Frequency
(MHz)
Correct Factor
(dB)
Reading Level
(dBuV)
Measure Level
(dBuV)
Margin
(dB)
Limit
(dBuV)
Detector Type
1 0.606 9.830 45.300 55.130 -18.870 74.000 QUASIPEAK
2 0.718 9.820 48.000 57.820 -16.180 74.000 QUASIPEAK
3 0.826 9.810 47.100 56.910 -17.090 74.000 QUASIPEAK
4 * 1.466 9.790 50.700 60.490 -13.510 74.000 QUASIPEAK
5 5.002 9.820 45.100 54.920 -19.080 74.000 QUASIPEAK
6 10.010 9.900 42.900 52.800 -21.200 74.000 QUASIPEAK
Note: 1. All Reading Levels are Quasi-Peak and average value. 2. " * ", means this data is the worst emission level. 3. Measurement Level = Reading Level + Correct Factor.

Report No: 098S082-IT-CE-P01V01
Page: 37 of 116
Engineer : Rove
Site : SR-1 (Conducted Emission and Power
Disturbance Test)
Time : 2009/09/04 - 03:02
Limit : ISN_Voltage_B_00M_AV Margin : 0
Probe : FCC-TLISN-T4_20353(0.15-30MHz) - Line1 Power : AC 230V/50Hz
EUT : Notebook PC Note : Mode 6: LCD (1680*1050@60Hz) + HDMI
(1680*1050@60Hz) - 10Mbps
Frequency
(MHz)
Correct Factor
(dB)
Reading Level
(dBuV)
Measure Level
(dBuV)
Margin
(dB)
Limit
(dBuV)
Detector Type
1 0.606 9.830 43.500 53.330 -10.670 64.000 AVERAGE
2 0.718 9.820 45.300 55.120 -8.880 64.000 AVERAGE
3 0.826 9.810 44.200 54.010 -9.990 64.000 AVERAGE
4 * 1.466 9.790 50.100 59.890 -4.110 64.000 AVERAGE
5 5.002 9.820 33.800 43.620 -20.380 64.000 AVERAGE
6 10.010 9.900 31.600 41.500 -22.500 64.000 AVERAGE
Note: 1. All Reading Levels are Quasi-Peak and average value. 2. " * ", means this data is the worst emission level. 3. Measurement Level = Reading Level + Correct Factor.

Report No: 098S082-IT-CE-P01V01
Page: 38 of 116
Engineer : Rove
Site : SR-1 (Conducted Emission and Power
Disturbance Test)
Time : 2009/09/04 - 02:45
Limit : ISN_Voltage_B_00M_QP Margin : 10
Probe : FCC-TLISN-T4_20353(0.15-30MHz) - Line1 Power : AC 230V/50Hz
EUT : Notebook PC Note : Mode 6: LCD (1680*1050@60Hz) + HDMI
(1680*1050@60Hz) - 100Mbps
Report No: 098S082-IT-CE-P01V01
Page: 39 of 116
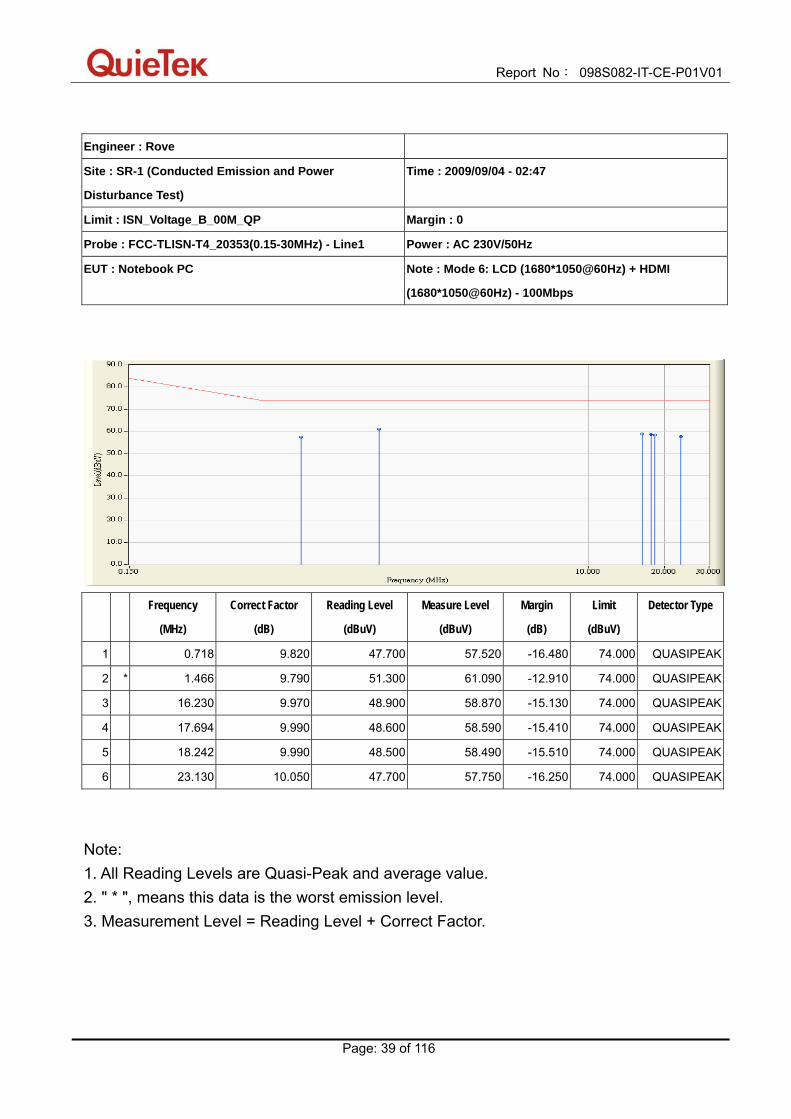
Engineer : Rove
Site : SR-1 (Conducted Emission and Power
Disturbance Test)
Time : 2009/09/04 - 02:47
Limit : ISN_Voltage_B_00M_QP Margin : 0
Probe : FCC-TLISN-T4_20353(0.15-30MHz) - Line1 Power : AC 230V/50Hz
EUT : Notebook PC Note : Mode 6: LCD (1680*1050@60Hz) + HDMI
(1680*1050@60Hz) - 100Mbps
Frequency
(MHz)
Correct Factor
(dB)
Reading Level
(dBuV)
Measure Level
(dBuV)
Margin
(dB)
Limit
(dBuV)
Detector Type
1 0.718 9.820 47.700 57.520 -16.480 74.000 QUASIPEAK
2 * 1.466 9.790 51.300 61.090 -12.910 74.000 QUASIPEAK
3 16.230 9.970 48.900 58.870 -15.130 74.000 QUASIPEAK
4 17.694 9.990 48.600 58.590 -15.410 74.000 QUASIPEAK
5 18.242 9.990 48.500 58.490 -15.510 74.000 QUASIPEAK
6 23.130 10.050 47.700 57.750 -16.250 74.000 QUASIPEAK
Note: 1. All Reading Levels are Quasi-Peak and average value. 2. " * ", means this data is the worst emission level. 3. Measurement Level = Reading Level + Correct Factor.

Report No: 098S082-IT-CE-P01V01
Page: 40 of 116
Engineer : Rove
Site : SR-1 (Conducted Emission and Power
Disturbance Test)
Time : 2009/09/04 - 02:47
Limit : ISN_Voltage_B_00M_AV Margin : 0
Probe : FCC-TLISN-T4_20353(0.15-30MHz) - Line1 Power : AC 230V/50Hz
EUT : Notebook PC Note : Mode 6: LCD (1680*1050@60Hz) + HDMI
(1680*1050@60Hz) - 100Mbps
Frequency
(MHz)
Correct Factor
(dB)
Reading Level
(dBuV)
Measure Level
(dBuV)
Margin
(dB)
Limit
(dBuV)
Detector Type
1 0.718 9.820 45.600 55.420 -8.580 64.000 AVERAGE
2 * 1.466 9.790 50.300 60.090 -3.910 64.000 AVERAGE
3 16.230 9.970 47.800 57.770 -6.230 64.000 AVERAGE
4 17.694 9.990 47.500 57.490 -6.510 64.000 AVERAGE
5 18.242 9.990 47.300 57.290 -6.710 64.000 AVERAGE
6 23.130 10.050 46.500 56.550 -7.450 64.000 AVERAGE
Note: 1. All Reading Levels are Quasi-Peak and average value. 2. " * ", means this data is the worst emission level. 3. Measurement Level = Reading Level + Correct Factor.

Report No: 098S082-IT-CE-P01V01
Page: 41 of 116
Engineer : Rove
Site : SR-1 (Conducted Emission and Power
Disturbance Test)
Time : 2009/09/04 - 02:39
Limit : ISN_Voltage_B_00M_QP Margin : 10
Probe : FCC-TLISN-T8_20354(0.15-30MHz) - Line1 Power : AC 230V/50Hz
EUT : Notebook PC Note : Mode 6: LCD (1680*1050@60Hz) + HDMI
(1680*1050@60Hz) - 1000Mbps

Report No: 098S082-IT-CE-P01V01
Page: 42 of 116
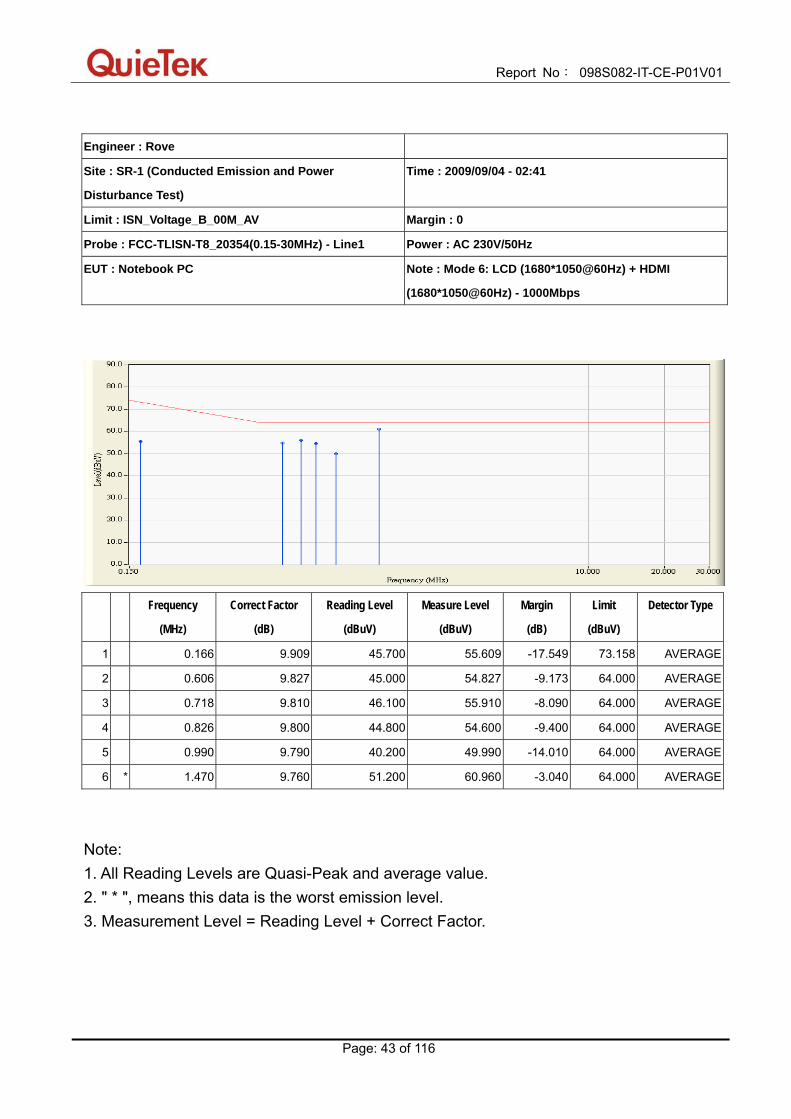
Engineer : Rove
Site : SR-1 (Conducted Emission and Power
Disturbance Test)
Time : 2009/09/04 - 02:41
Limit : ISN_Voltage_B_00M_QP Margin : 0
Probe : FCC-TLISN-T8_20354(0.15-30MHz) - Line1 Power : AC 230V/50Hz
EUT : Notebook PC Note : Mode 6: LCD (1680*1050@60Hz) + HDMI
(1680*1050@60Hz) - 1000Mbps
Frequency
(MHz)
Correct Factor
(dB)
Reading Level
(dBuV)
Measure Level
(dBuV)
Margin
(dB)
Limit
(dBuV)
Detector Type
1 0.166 9.909 45.800 55.709 -27.449 83.158 QUASIPEAK
2 0.606 9.827 46.000 55.827 -18.173 74.000 QUASIPEAK
3 0.718 9.810 48.400 58.210 -15.790 74.000 QUASIPEAK
4 0.826 9.800 46.300 56.100 -17.900 74.000 QUASIPEAK
5 0.990 9.790 44.200 53.990 -20.010 74.000 QUASIPEAK
6 * 1.470 9.760 52.500 62.260 -11.740 74.000 QUASIPEAK
Note: 1. All Reading Levels are Quasi-Peak and average value. 2. " * ", means this data is the worst emission level. 3. Measurement Level = Reading Level + Correct Factor.
Report No: 098S082-IT-CE-P01V01
Page: 43 of 116
Engineer : Rove
Site : SR-1 (Conducted Emission and Power
Disturbance Test)
Time : 2009/09/04 - 02:41
Limit : ISN_Voltage_B_00M_AV Margin : 0
Probe : FCC-TLISN-T8_20354(0.15-30MHz) - Line1 Power : AC 230V/50Hz
EUT : Notebook PC Note : Mode 6: LCD (1680*1050@60Hz) + HDMI
(1680*1050@60Hz) - 1000Mbps
Frequency
(MHz)
Correct Factor
(dB)
Reading Level
(dBuV)
Measure Level
(dBuV)
Margin
(dB)
Limit
(dBuV)
Detector Type
1 0.166 9.909 45.700 55.609 -17.549 73.158 AVERAGE
2 0.606 9.827 45.000 54.827 -9.173 64.000 AVERAGE
3 0.718 9.810 46.100 55.910 -8.090 64.000 AVERAGE
4 0.826 9.800 44.800 54.600 -9.400 64.000 AVERAGE
5 0.990 9.790 40.200 49.990 -14.010 64.000 AVERAGE
6 * 1.470 9.760 51.200 60.960 -3.040 64.000 AVERAGE
Note: 1. All Reading Levels are Quasi-Peak and average value. 2. " * ", means this data is the worst emission level. 3. Measurement Level = Reading Level + Correct Factor.
Report No: 098S082-IT-CE-P01V01
Page: 44 of 116
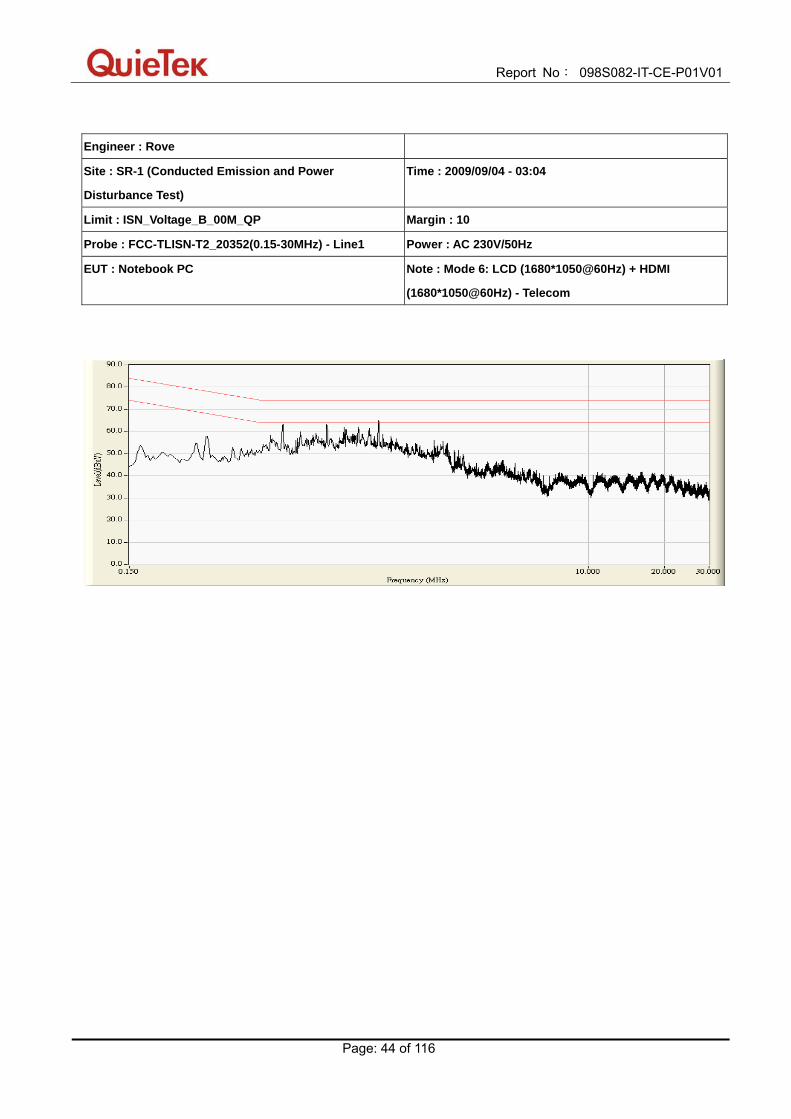
Engineer : Rove
Site : SR-1 (Conducted Emission and Power
Disturbance Test)
Time : 2009/09/04 - 03:04
Limit : ISN_Voltage_B_00M_QP Margin : 10
Probe : FCC-TLISN-T2_20352(0.15-30MHz) - Line1 Power : AC 230V/50Hz
EUT : Notebook PC Note : Mode 6: LCD (1680*1050@60Hz) + HDMI
(1680*1050@60Hz) - Telecom

Report No: 098S082-IT-CE-P01V01
Page: 45 of 116
Engineer : Rove
Site : SR-1 (Conducted Emission and Power
Disturbance Test)
Time : 2009/09/04 - 03:06
Limit : ISN_Voltage_B_00M_QP Margin : 0
Probe : FCC-TLISN-T2_20352(0.15-30MHz) - Line1 Power : AC 230V/50Hz
EUT : Notebook PC Note : Mode 6: LCD (1680*1050@60Hz) + HDMI
(1680*1050@60Hz) - Telecom
Frequency
(MHz)
Correct Factor
(dB)
Reading Level
(dBuV)
Measure Level
(dBuV)
Margin
(dB)
Limit
(dBuV)
Detector Type
1 0.610 9.820 52.000 61.820 -12.180 74.000 QUASIPEAK
2 0.910 9.800 50.900 60.700 -13.300 74.000 QUASIPEAK
3 1.070 9.790 43.700 53.490 -20.510 74.000 QUASIPEAK
4 1.218 9.780 50.800 60.580 -13.420 74.000 QUASIPEAK
5 1.342 9.770 43.200 52.970 -21.030 74.000 QUASIPEAK
6 * 1.462 9.780 53.300 63.080 -10.920 74.000 QUASIPEAK
Note: 1. All Reading Levels are Quasi-Peak and average value. 2. " * ", means this data is the worst emission level. 3. Measurement Level = Reading Level + Correct Factor.
Report No: 098S082-IT-CE-P01V01
Page: 46 of 116
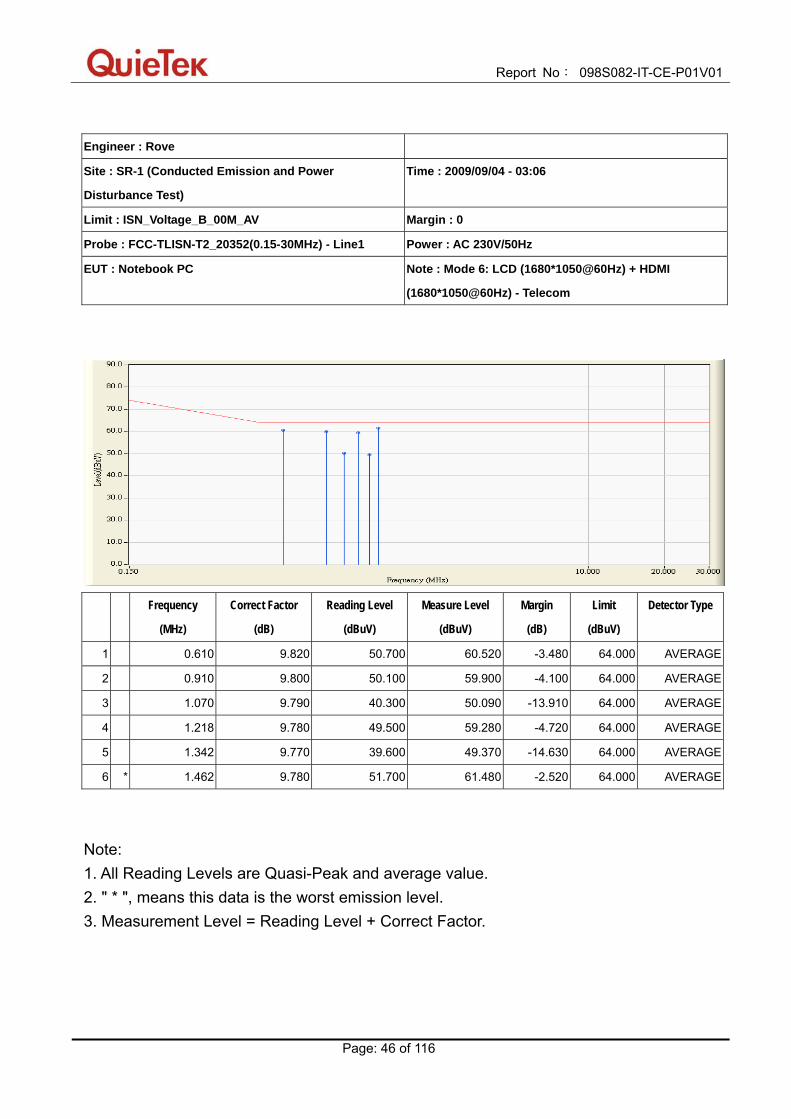
Engineer : Rove
Site : SR-1 (Conducted Emission and Power
Disturbance Test)
Time : 2009/09/04 - 03:06
Limit : ISN_Voltage_B_00M_AV Margin : 0
Probe : FCC-TLISN-T2_20352(0.15-30MHz) - Line1 Power : AC 230V/50Hz
EUT : Notebook PC Note : Mode 6: LCD (1680*1050@60Hz) + HDMI
(1680*1050@60Hz) - Telecom
Frequency
(MHz)
Correct Factor
(dB)
Reading Level
(dBuV)
Measure Level
(dBuV)
Margin
(dB)
Limit
(dBuV)
Detector Type
1 0.610 9.820 50.700 60.520 -3.480 64.000 AVERAGE
2 0.910 9.800 50.100 59.900 -4.100 64.000 AVERAGE
3 1.070 9.790 40.300 50.090 -13.910 64.000 AVERAGE
4 1.218 9.780 49.500 59.280 -4.720 64.000 AVERAGE
5 1.342 9.770 39.600 49.370 -14.630 64.000 AVERAGE
6 * 1.462 9.780 51.700 61.480 -2.520 64.000 AVERAGE
Note: 1. All Reading Levels are Quasi-Peak and average value. 2. " * ", means this data is the worst emission level. 3. Measurement Level = Reading Level + Correct Factor.

Report No: 098S082-IT-CE-P01V01
Page: 47 of 116
3.7. Test Photograph Test Mode: Mode 6: LCD (1680*1050@60Hz) + HDMI (1680*1050@60Hz) Description: Front View of Conducted disturbance at mains terminals Test Setup
Test Mode: Mode 6: LCD (1680*1050@60Hz) + HDMI (1680*1050@60Hz) Description: Side View of Conducted disturbance at mains terminals Test Setup

Report No: 098S082-IT-CE-P01V01
Page: 48 of 116
Test Mode: Mode 6: LCD (1680*1050@60Hz) + HDMI (1680*1050@60Hz) Description: Front View of Conducted disturbance at telecommunication ports Test Setup (LAN)
Test Mode: Mode 6: LCD (1680*1050@60Hz) + HDMI (1680*1050@60Hz) Description: Side View of Conducted disturbance at telecommunication ports Test Setup (LAN)
Report No: 098S082-IT-CE-P01V01
Page: 49 of 116
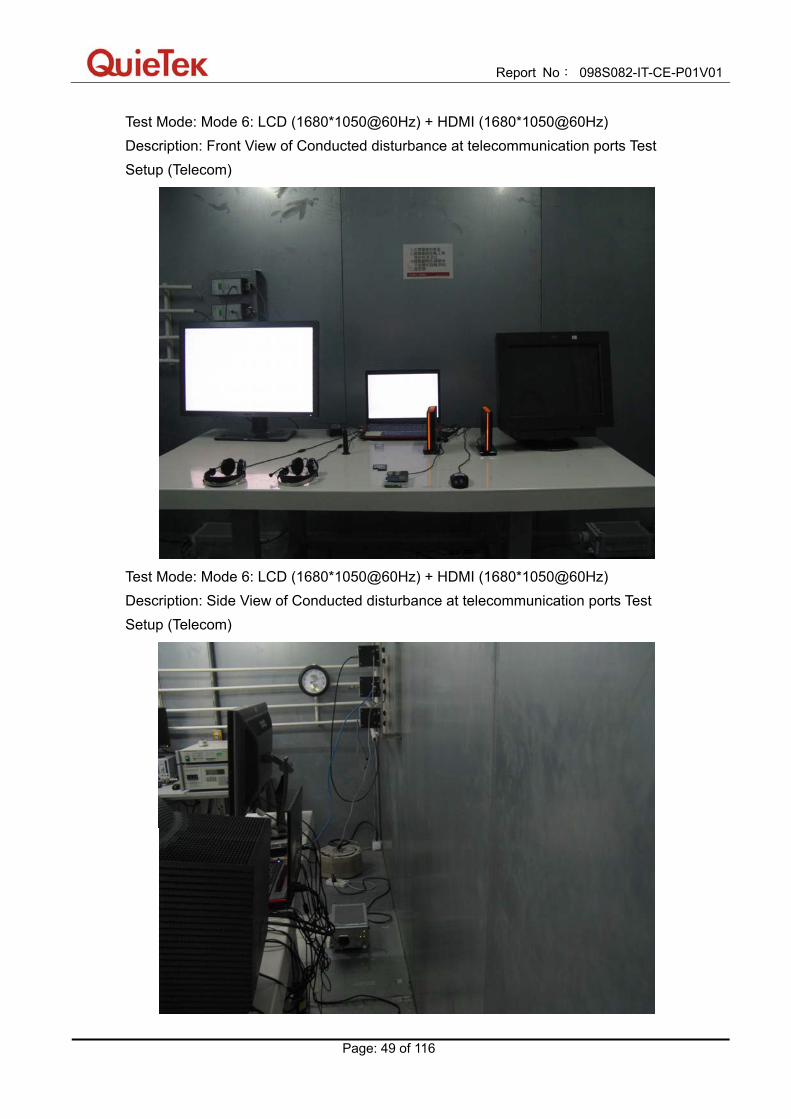
Test Mode: Mode 6: LCD (1680*1050@60Hz) + HDMI (1680*1050@60Hz) Description: Front View of Conducted disturbance at telecommunication ports Test Setup (Telecom)
Test Mode: Mode 6: LCD (1680*1050@60Hz) + HDMI (1680*1050@60Hz) Description: Side View of Conducted disturbance at telecommunication ports Test Setup (Telecom)
Report No: 098S082-IT-CE-P01V01
Page: 50 of 116
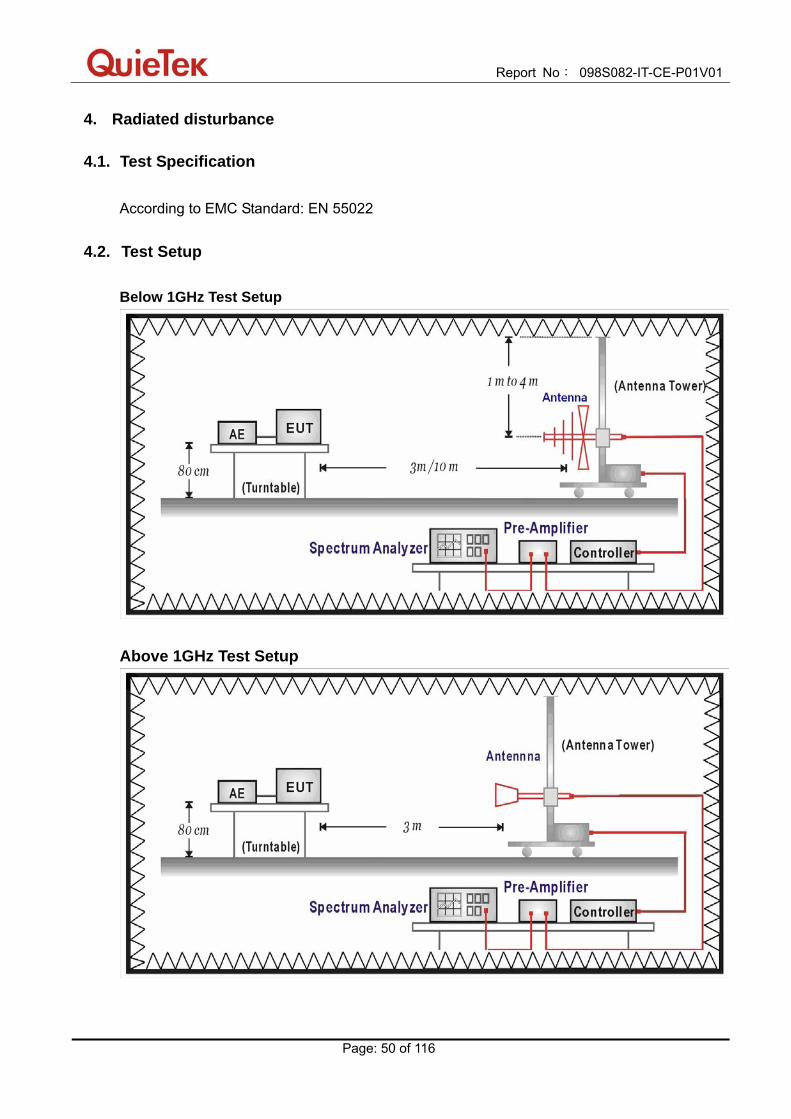
4. Radiated disturbance
4.1. Test Specification
According to EMC Standard: EN 55022
4.2. Test Setup Below 1GHz Test Setup
Above 1GHz Test Setup

Report No: 098S082-IT-CE-P01V01
Page: 51 of 116
4.3. Limit Limits below 1GHz
Limits for radiated disturbance of class A ITE at a measuring distance of 10m
Frequency range MHz
Quasi-peak limis dB(µV/m)
30 to 230 40
230 to 1000 47
NOTE 1: The lower limit shall apply at the transition frequency. NOTE 2: Additional provisions may be required for cases where interference occurs.
Limits for radiated disturbance of class B ITE at a measuring distance of 10m
Frequency range MHz
Quasi-peak limis dB(µV/m)
30 to 230 30
230 to 1000 37
NOTE 1: The lower limit shall apply at the transition frequency. NOTE 2: Additional provisions may be required for cases where interference occurs. Limits above 1GHz
Limits for radiated disturbance of class A ITE at a measuring distance of 3m
Frequency range GHz
Average limit dB(µV/m)
Peak-peak dB(µV/m)
1 to 3 56 76
3 to 6 60 80
NOTE: The lower limit applies at transition frequency.
Limits for radiated disturbance of class B ITE at a measuring distance of 3m
Frequency range GHz
Average limit dB(µV/m)
Peak-peak dB(µV/m)
1 to 3 50 70
3 to 6 54 74
NOTE: The lower limit applies at transition frequency.
Report No: 098S082-IT-CE-P01V01
Page: 52 of 116
4.4. Test Procedure The EUT and its simulators are placed on a turntable which is 0.8 meter above ground. The turntable can rotate 360 degrees to determine the position of the maximum emission level. The EUT was positioned such that the distance from antenna to the EUT was 10 meters for below 1GHz and 3 meters for above 1GHz. The antenna can move up and down between 1 meter and 4 meters to find out the maximum emission level. Both horizontal and vertical polarization of the antenna are set on measurement. In order to find the maximum emission, all of the interface cables must be changed during radiated measurement.
The bandwidth below 1GHz setting on the reveiver is 120kHz and above 1GHz is 1MHz. Conditional testing procedure: The highest internal source of an EUT is defined as the highest frequency generated or used within the EUT or on which the EUT operates or tunes. If the highest frequency of the internal sources of the EUT is less than 108 MHz, the measurement shall only be made up to 1 GHz. If the highest frequency of the internal sources of the EUT is between 108 MHz and 500 MHz, the measurement shall only be made up to 2 GHz. If the highest frequency of the internal sources of the EUT is between 500 MHz and 1 GHz, the measurement shall only be made up to 5 GHz. If the highest frequency of the internal sources of the EUT is above 1 GHz, the measurement shall be made up to 5 times the highest frequency or 6 GHz, whichever is less.
4.5. Deviation from Test Standard No deviation.

Report No: 098S082-IT-CE-P01V01
Page: 53 of 116
4.6. Test Result Engineer : Nike
Site : AC-1 (10m Semi-Anechoic Chamber) Time : 2009/08/24 - 09:23
Limit : EN55022_B_10M_QP Margin : 6
EUT : Notebook PC Probe : CBL6112B_2931(30-1000MHz) - HORIZONTAL
Power : AC 230V/50Hz Note : Mode 6: LCD (1680*1050@60Hz) + HDMI
(1680*1050@60Hz)
Frequency
(MHz)
Correct Factor
(dB)
Reading Level
(dBuV)
Measure Level
(dBuV/m)
Margin
(dB)
Limit
(dBuV/m)
Detector Type Ant Pos
(cm)
Table Pos
(deg)
1 * 134.200 -20.293 43.200 22.907 -7.093 30.000 QUASIPEAK 258.100 360.000
2 409.500 -13.017 38.200 25.184 -11.816 37.000 QUASIPEAK 286.200 156.700
3 478.200 -11.777 37.600 25.822 -11.178 37.000 QUASIPEAK 400.000 162.400
4 585.100 -9.737 35.500 25.763 -11.237 37.000 QUASIPEAK 400.000 168.300
5 729.200 -7.771 33.500 25.729 -11.271 37.000 QUASIPEAK 400.000 298.100
6 878.200 -5.966 33.500 27.534 -9.466 37.000 QUASIPEAK 354.300 360.000
Note: 1. All Readings below 1GHz are Quasi-Peak, above are performed with peak and/or average measurements as necessary. 2. " * ", means this data is the worst emission level. 3. Measurement Level = Reading Level + Correct Factor

Report No: 098S082-IT-CE-P01V01
Page: 54 of 116
Engineer : Nike
Site : AC-1 (10m Semi-Anechoic Chamber) Time : 2009/08/24 - 09:28
Limit : EN55022_B_10M_QP Margin : 6
EUT : Notebook PC Probe : CBL6112B_2933(30-1000MHz) - VERTICAL
Power : AC 230V/50Hz Note : Mode 6: LCD (1680*1050@60Hz) + HDMI
(1680*1050@60Hz)
Frequency
(MHz)
Correct Factor
(dB)
Reading Level
(dBuV)
Measure Level
(dBuV/m)
Margin
(dB)
Limit
(dBuV/m)
Detector Type Ant Pos
(cm)
Table Pos
(deg)
1 * 30.505 -14.001 36.500 22.498 -7.502 30.000 QUASIPEAK 100.000 360.000
2 84.200 -24.401 41.300 16.899 -13.101 30.000 QUASIPEAK 100.000 262.300
3 242.500 -19.014 43.600 24.586 -12.414 37.000 QUASIPEAK 100.000 158.200
4 409.300 -12.767 36.200 23.432 -13.568 37.000 QUASIPEAK 100.000 262.500
5 586.200 -9.414 37.000 27.586 -9.414 37.000 QUASIPEAK 100.000 189.200
6 729.300 -7.322 35.900 28.578 -8.422 37.000 QUASIPEAK 100.000 360.000
Note: 1. All Readings below 1GHz are Quasi-Peak, above are performed with peak and/or average measurements as necessary. 2. " * ", means this data is the worst emission level. 3. Measurement Level = Reading Level + Correct Factor
Report No: 098S082-IT-CE-P01V01
Page: 55 of 116
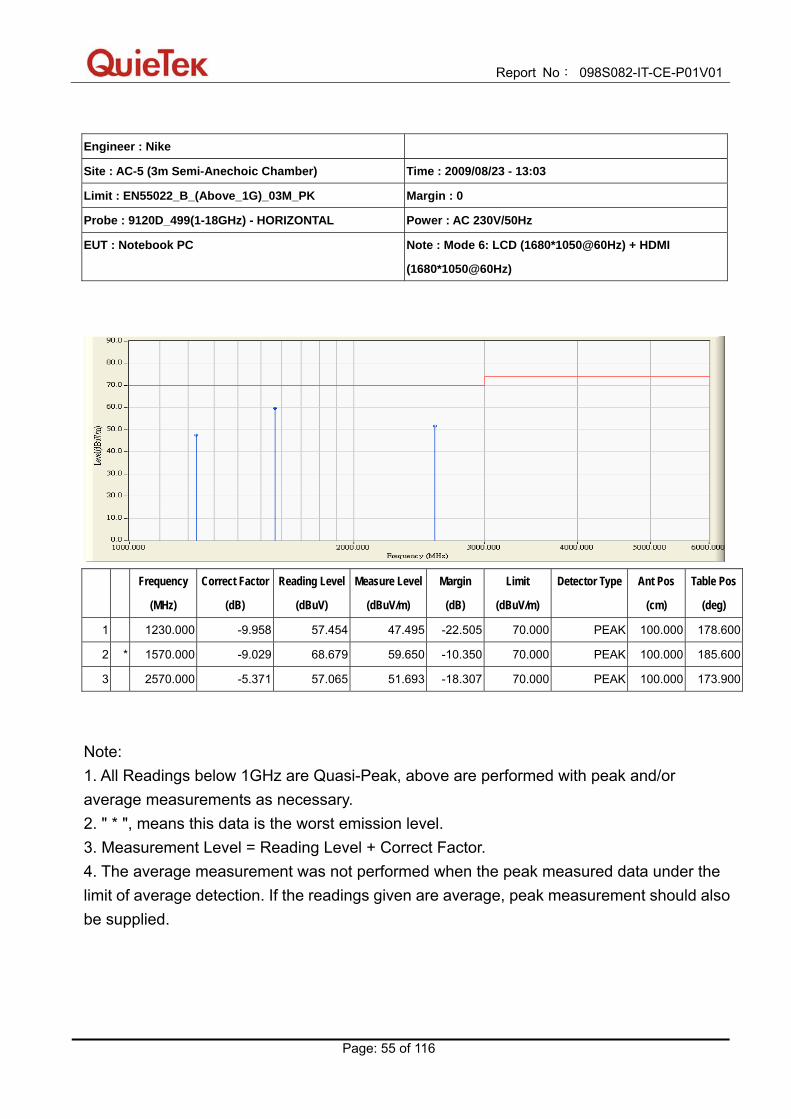
Engineer : Nike
Site : AC-5 (3m Semi-Anechoic Chamber) Time : 2009/08/23 - 13:03
Limit : EN55022_B_(Above_1G)_03M_PK Margin : 0
Probe : 9120D_499(1-18GHz) - HORIZONTAL Power : AC 230V/50Hz
EUT : Notebook PC Note : Mode 6: LCD (1680*1050@60Hz) + HDMI
(1680*1050@60Hz)
Frequency
(MHz)
Correct Factor
(dB)
Reading Level
(dBuV)
Measure Level
(dBuV/m)
Margin
(dB)
Limit
(dBuV/m)
Detector Type Ant Pos
(cm)
Table Pos
(deg)
1 1230.000 -9.958 57.454 47.495 -22.505 70.000 PEAK 100.000 178.600
2 * 1570.000 -9.029 68.679 59.650 -10.350 70.000 PEAK 100.000 185.600
3 2570.000 -5.371 57.065 51.693 -18.307 70.000 PEAK 100.000 173.900
Note: 1. All Readings below 1GHz are Quasi-Peak, above are performed with peak and/or average measurements as necessary. 2. " * ", means this data is the worst emission level. 3. Measurement Level = Reading Level + Correct Factor. 4. The average measurement was not performed when the peak measured data under the limit of average detection. If the readings given are average, peak measurement should also be supplied.

Report No: 098S082-IT-CE-P01V01
Page: 56 of 116
Engineer : Nike
Site : AC-5 (3m Semi-Anechoic Chamber) Time : 2009/08/23 - 13:01
Limit : EN55022_B_(Above_1G)_03M_AV Margin : 0
Probe : 9120D_499(1-18GHz) - HORIZONTAL Power : AC 230V/50Hz
EUT : Notebook PC Note : Mode 6: LCD (1680*1050@60Hz) + HDMI
(1680*1050@60Hz)
Frequency
(MHz)
Correct Factor
(dB)
Reading Level
(dBuV)
Measure Level
(dBuV/m)
Margin
(dB)
Limit
(dBuV/m)
Detector Type Ant Pos
(cm)
Table Pos
(deg)
1 1229.640 -9.961 35.577 25.615 -24.385 50.000 AVERAGE 100.000 178.600
2 * 1566.800 -9.032 39.503 30.470 -19.530 50.000 AVERAGE 100.000 185.600
3 2558.500 -5.371 35.741 30.370 -19.630 50.000 AVERAGE 100.000 173.900
Note: 1. All Readings below 1GHz are Quasi-Peak, above are performed with peak and/or average measurements as necessary. 2. " * ", means this data is the worst emission level. 3. Measurement Level = Reading Level + Correct Factor. 4. The average measurement was not performed when the peak measured data under the limit of average detection. If the readings given are average, peak measurement should also be supplied.
Report No: 098S082-IT-CE-P01V01
Page: 57 of 116
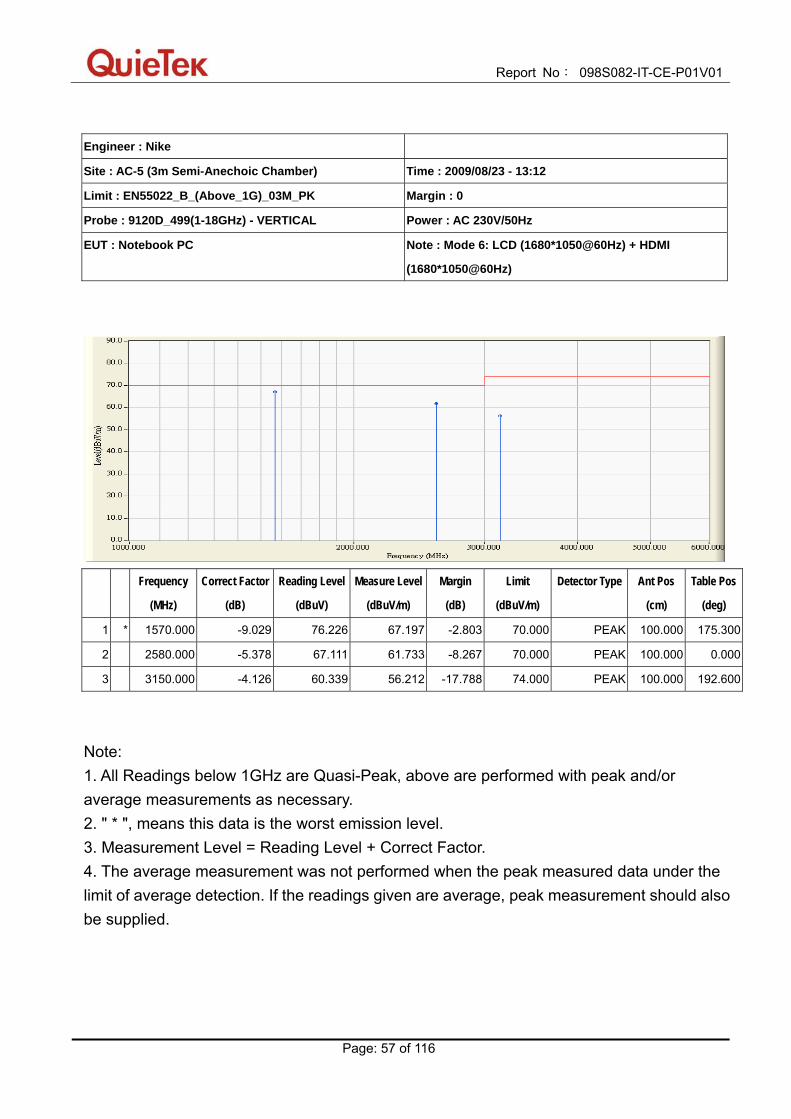
Engineer : Nike
Site : AC-5 (3m Semi-Anechoic Chamber) Time : 2009/08/23 - 13:12
Limit : EN55022_B_(Above_1G)_03M_PK Margin : 0
Probe : 9120D_499(1-18GHz) - VERTICAL Power : AC 230V/50Hz
EUT : Notebook PC Note : Mode 6: LCD (1680*1050@60Hz) + HDMI
(1680*1050@60Hz)
Frequency
(MHz)
Correct Factor
(dB)
Reading Level
(dBuV)
Measure Level
(dBuV/m)
Margin
(dB)
Limit
(dBuV/m)
Detector Type Ant Pos
(cm)
Table Pos
(deg)
1 * 1570.000 -9.029 76.226 67.197 -2.803 70.000 PEAK 100.000 175.300
2 2580.000 -5.378 67.111 61.733 -8.267 70.000 PEAK 100.000 0.000
3 3150.000 -4.126 60.339 56.212 -17.788 74.000 PEAK 100.000 192.600
Note: 1. All Readings below 1GHz are Quasi-Peak, above are performed with peak and/or average measurements as necessary. 2. " * ", means this data is the worst emission level. 3. Measurement Level = Reading Level + Correct Factor. 4. The average measurement was not performed when the peak measured data under the limit of average detection. If the readings given are average, peak measurement should also be supplied.

Report No: 098S082-IT-CE-P01V01
Page: 58 of 116
Engineer : Nike
Site : AC-5 (3m Semi-Anechoic Chamber) Time : 2009/08/23 - 13:12
Limit : EN55022_B_(Above_1G)_03M_AV Margin : 0
Probe : 9120D_499(1-18GHz) - VERTICAL Power : AC 230V/50Hz
EUT : Notebook PC Note : Mode 6: LCD (1680*1050@60Hz) + HDMI
(1680*1050@60Hz)
Frequency
(MHz)
Correct Factor
(dB)
Reading Level
(dBuV)
Measure Level
(dBuV/m)
Margin
(dB)
Limit
(dBuV/m)
Detector Type Ant Pos
(cm)
Table Pos
(deg)
1 1566.150 -9.033 42.920 33.887 -16.113 50.000 AVERAGE 100.000 175.300
2 * 2567.200 -5.369 43.129 37.759 -12.241 50.000 AVERAGE 100.000 0.000
3 3136.200 -4.087 35.401 31.314 -22.686 54.000 AVERAGE 100.000 192.600
Note: 1. All Readings below 1GHz are Quasi-Peak, above are performed with peak and/or average measurements as necessary. 2. " * ", means this data is the worst emission level. 3. Measurement Level = Reading Level + Correct Factor. 4. The average measurement was not performed when the peak measured data under the limit of average detection. If the readings given are average, peak measurement should also be supplied.

Report No: 098S082-IT-CE-P01V01
Page: 59 of 116
4.7. Test Photograph Test Mode: Mode 6: LCD (1680*1050@60Hz) + HDMI (1680*1050@60Hz) Description: Front View of Radiated disturbance Test Setup (Below 1GHz)
Test Mode: Mode 6: LCD (1680*1050@60Hz) + HDMI (1680*1050@60Hz) Description: Rear View of Radiated disturbance Test Setup (Below 1GHz)
Report No: 098S082-IT-CE-P01V01
Page: 60 of 116
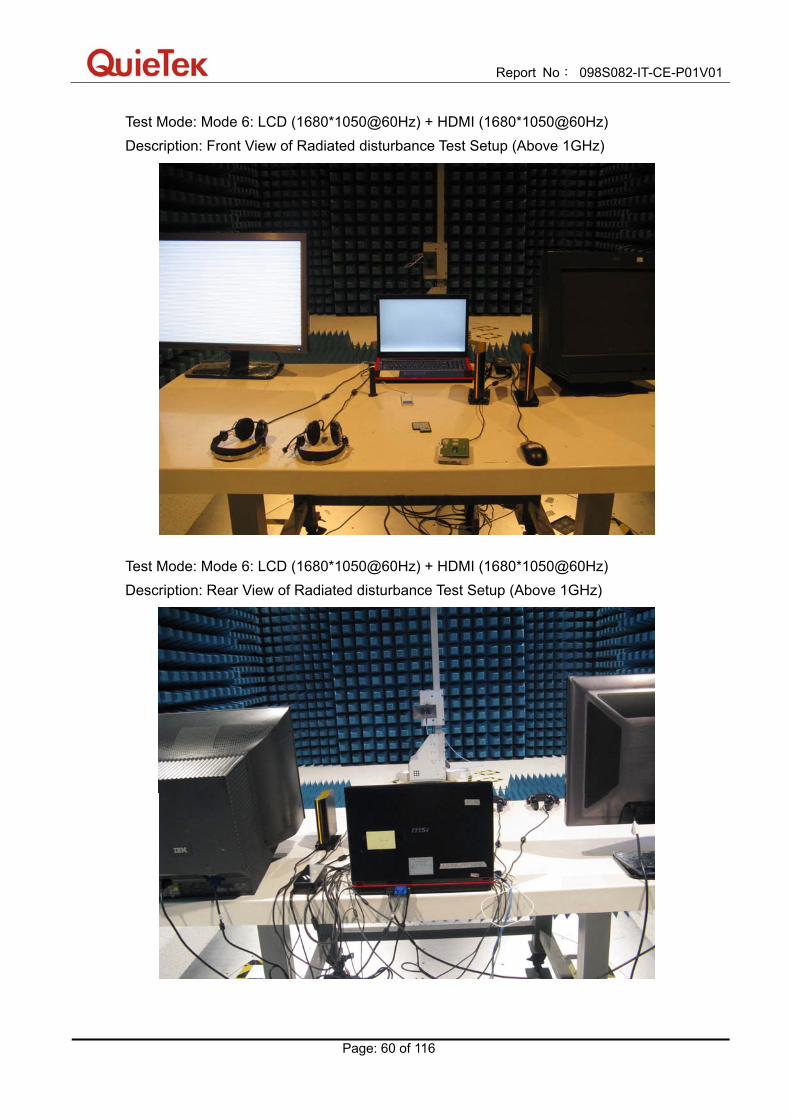
Test Mode: Mode 6: LCD (1680*1050@60Hz) + HDMI (1680*1050@60Hz) Description: Front View of Radiated disturbance Test Setup (Above 1GHz)
Test Mode: Mode 6: LCD (1680*1050@60Hz) + HDMI (1680*1050@60Hz) Description: Rear View of Radiated disturbance Test Setup (Above 1GHz)

Report No: 098S082-IT-CE-P01V01
Page: 61 of 116
5. Harmonic current emissions
5.1. Test Specification
According to EMC Standard: EN 61000-3-2
5.2. Test Setup
5.3. Limit (a) Limits of Class A Harmonics Currents
Harmonics Order
n
Maximum Permissible harmonic current
A
Harmonics Order
n
Maximum Permissible harmonic current
A
Odd harmonics Even harmonics
3 2.30 2 1.08
5 1.14 4 0.43
7 0.77 6 0.30
9 0.40 8 ≤ n ≤ 40 0.23 * 8/n
11 0.33
13 0.21
15 ≤ n ≤ 39 0.15 * 15/n
Report No: 098S082-IT-CE-P01V01
Page: 62 of 116
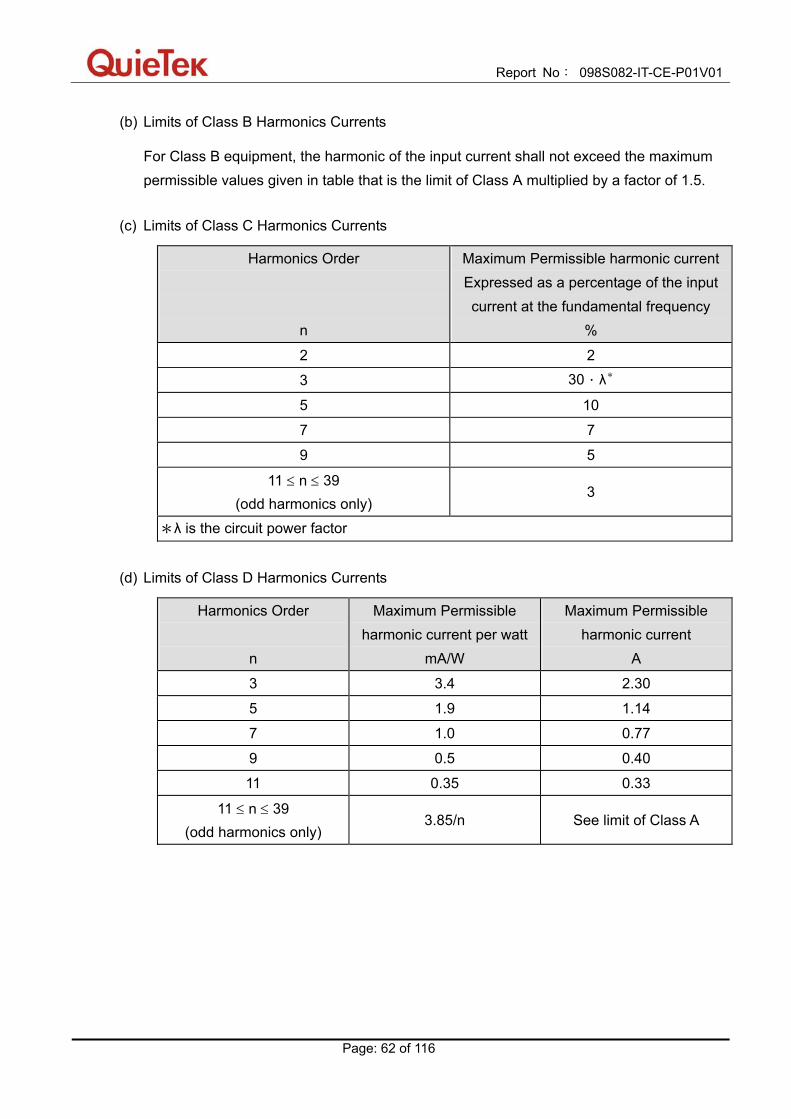
(b) Limits of Class B Harmonics Currents
For Class B equipment, the harmonic of the input current shall not exceed the maximum permissible values given in table that is the limit of Class A multiplied by a factor of 1.5.
(c) Limits of Class C Harmonics Currents
Harmonics Order
n
Maximum Permissible harmonic current Expressed as a percentage of the input current at the fundamental frequency
%
2 2
3 30.λ*
5 10
7 7
9 5
11 ≤ n ≤ 39 (odd harmonics only)
3
*λ is the circuit power factor
(d) Limits of Class D Harmonics Currents
Harmonics Order
n
Maximum Permissible harmonic current per watt
mA/W
Maximum Permissible harmonic current
A
3 3.4 2.30
5 1.9 1.14
7 1.0 0.77
9 0.5 0.40
11 0.35 0.33
11 ≤ n ≤ 39 (odd harmonics only)
3.85/n See limit of Class A

Report No: 098S082-IT-CE-P01V01
Page: 63 of 116
5.4. Test Procedure
The EUT is supplied in series with power analyzer from a power source having the same normal voltage and frequency as the rated supply voltage and the equipment under test. And the rated voltage at the supply voltage of EUT of 0.94 times and 1.06 times shall be performed.
5.5. Deviation from Test Standard No deviation.
Report No: 098S082-IT-CE-P01V01
Page: 64 of 116
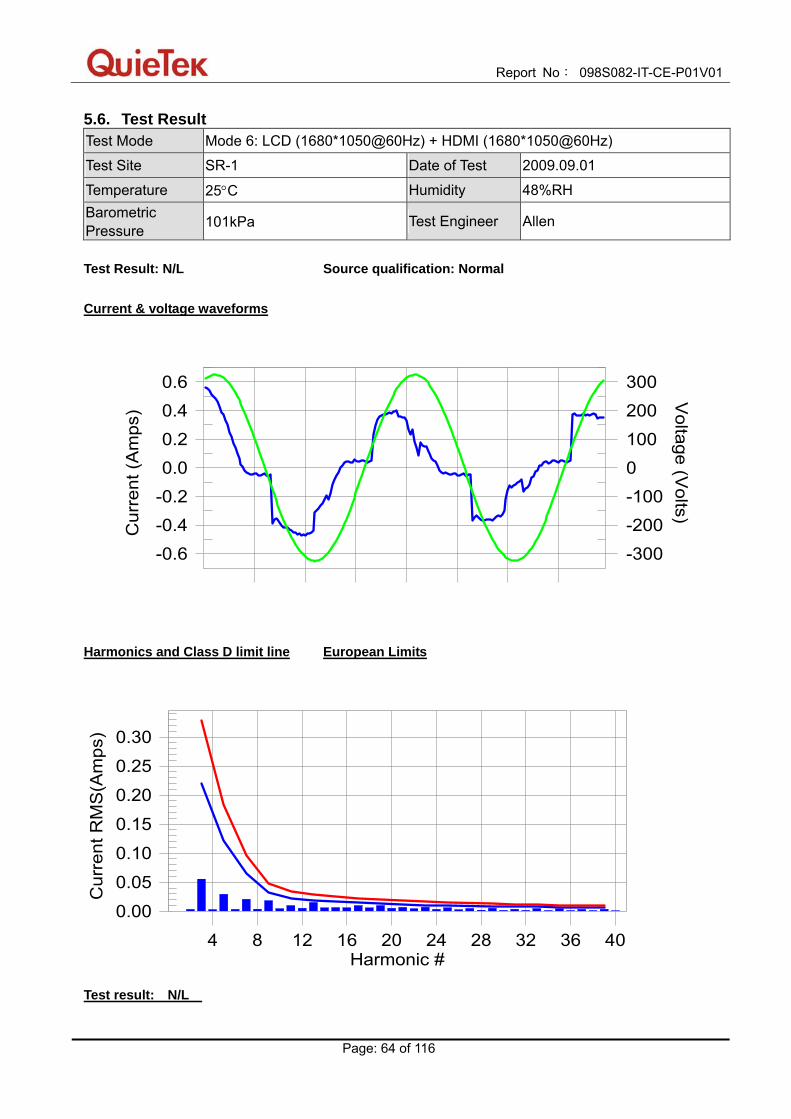
5.6. Test Result Test Mode Mode 6: LCD (1680*1050@60Hz) + HDMI (1680*1050@60Hz)
Test Site SR-1 Date of Test 2009.09.01
Temperature 25°C Humidity 48%RH Barometric Pressure 101kPa Test Engineer Allen
Test Result: N/L Source qualification: Normal
Current & voltage waveforms
-0.6-0.4-0.20.00.20.40.6
-300-200-1000100200300
Cur
rent
(Am
ps)
Voltage (V
olts)
Harmonics and Class D limit line European Limits
0.00
0.05
0.10
0.15
0.20
0.25
0.30
Cur
rent
RM
S(A
mps
)
Harmonic #4 8 12 16 20 24 28 32 36 40
Test result: N/L

Report No: 098S082-IT-CE-P01V01
Page: 65 of 116
Test Result: N/L Source qualification: Normal THC(A): 0.00 I-THD(%): 0.00 POHC(A): 0.000 POHC Limit(A): 0.000 Highest parameter values during test:
V_RMS (Volts): 230.00 Frequency(Hz): 50.00 I_Peak (Amps): 0.564 I_RMS (Amps): 0.323 I_Fund (Amps): 0.279 Crest Factor: 2.394 Power (Watts): 64.5 Power Factor: 0.867
Harm# Harms(avg) 100%Limit %of Limit Harms(max) 150%Limit %of Limit Status 2 0.003 3 0.058 0.219 0.0 0.055 0.329 0.00 N/L 4 0.003 5 0.029 0.122 0.0 0.029 0.184 0.00 N/L 6 0.003 7 0.019 0.064 0.0 0.021 0.097 0.00 N/L 8 0.004 9 0.017 0.032 0.0 0.018 0.048 0.00 N/L 10 0.004 11 0.010 0.023 0.0 0.010 0.034 0.00 N/L 12 0.005 13 0.013 0.019 0.0 0.015 0.029 0.00 N/L 14 0.006 15 0.007 0.017 0.0 0.006 0.025 0.00 N/L 16 0.006 17 0.009 0.015 0.0 0.010 0.022 0.00 N/L 18 0.006 19 0.008 0.013 0.0 0.010 0.020 0.00 N/L 20 0.005 21 0.006 0.012 0.0 0.007 0.018 0.00 N/L 22 0.004 23 0.007 0.011 0.0 0.007 0.016 0.00 N/L 24 0.003 25 0.005 0.010 0.0 0.006 0.015 0.00 N/L 26 0.002 27 0.005 0.009 0.0 0.005 0.014 0.00 N/L 28 0.002 29 0.005 0.009 0.0 0.005 0.013 0.00 N/L 30 0.001 31 0.004 0.008 0.0 0.003 0.012 0.00 N/L 32 0.001 33 0.004 0.007 0.0 0.005 0.011 0.00 N/L 34 0.001 35 0.004 0.007 0.0 0.004 0.011 0.00 N/L 36 0.001 37 0.003 0.007 0.0 0.003 0.010 0.00 N/L 38 0.001 39 0.003 0.006 0.0 0.003 0.010 0.00 N/L 40 0.001 Note: The EUT power level is below 75.0 Watts and therefore has no defined limits
Report No: 098S082-IT-CE-P01V01
Page: 66 of 116
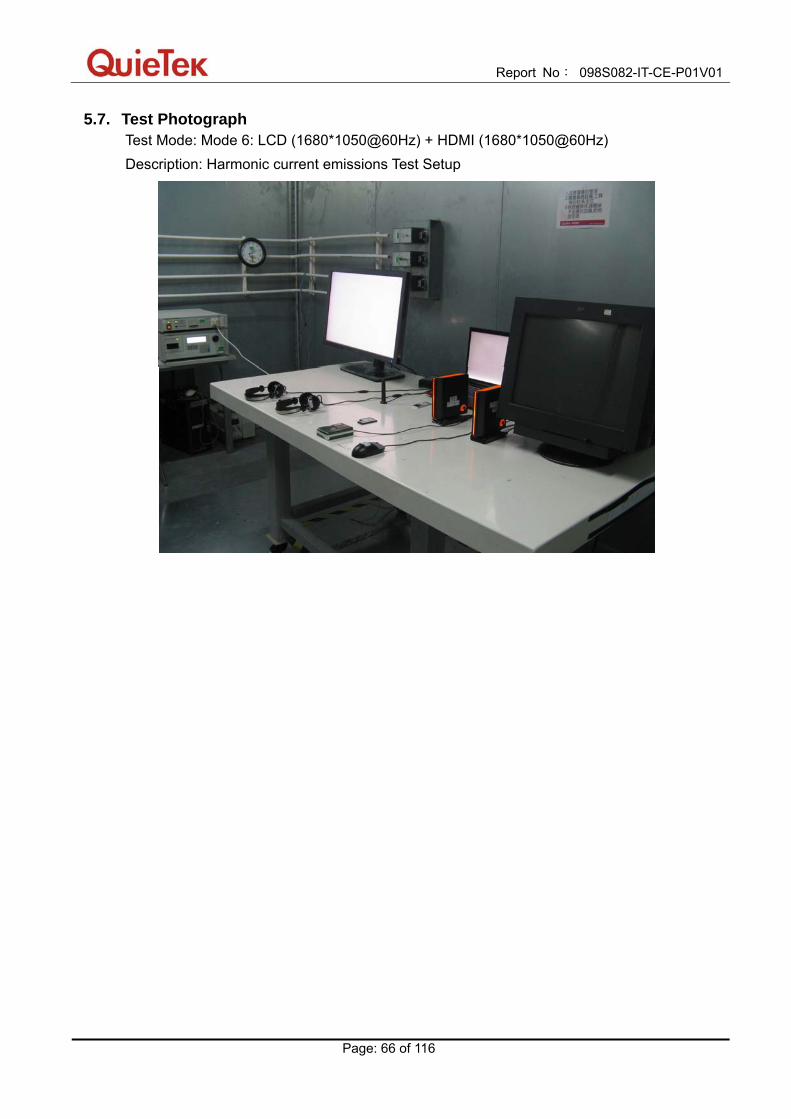
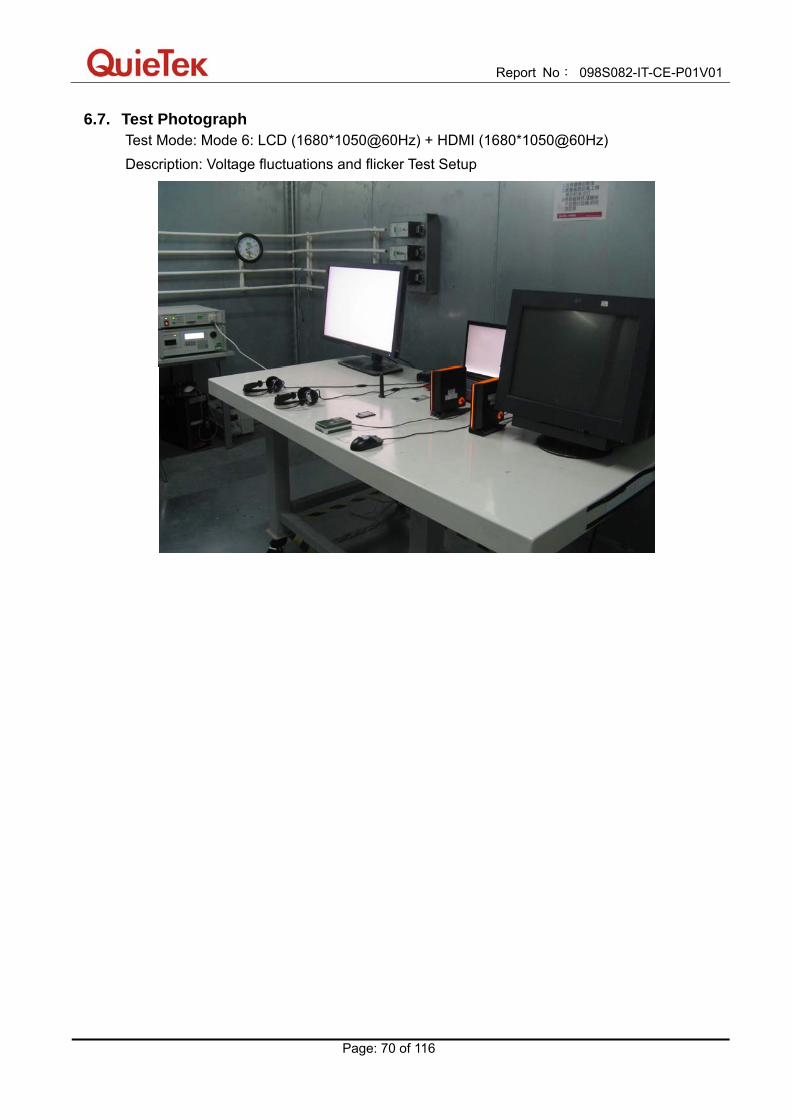
5.7. Test Photograph Test Mode: Mode 6: LCD (1680*1050@60Hz) + HDMI (1680*1050@60Hz) Description: Harmonic current emissions Test Setup
Report No: 098S082-IT-CE-P01V01
Page: 67 of 116
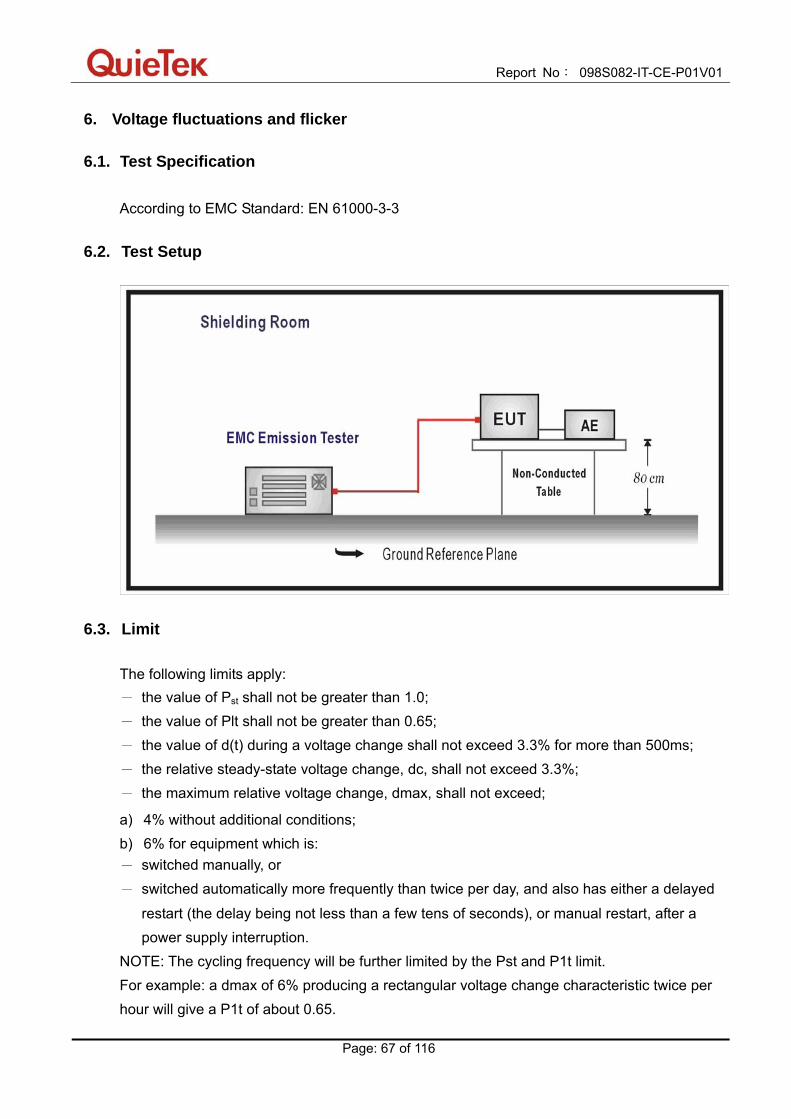
6. Voltage fluctuations and flicker
6.1. Test Specification
According to EMC Standard: EN 61000-3-3
6.2. Test Setup
6.3. Limit The following limits apply: - the value of Pst shall not be greater than 1.0; - the value of Plt shall not be greater than 0.65; - the value of d(t) during a voltage change shall not exceed 3.3% for more than 500ms; - the relative steady-state voltage change, dc, shall not exceed 3.3%; - the maximum relative voltage change, dmax, shall not exceed;
a) 4% without additional conditions; b) 6% for equipment which is: - switched manually, or - switched automatically more frequently than twice per day, and also has either a delayed
restart (the delay being not less than a few tens of seconds), or manual restart, after a power supply interruption.
NOTE: The cycling frequency will be further limited by the Pst and P1t limit. For example: a dmax of 6% producing a rectangular voltage change characteristic twice per hour will give a P1t of about 0.65.

Report No: 098S082-IT-CE-P01V01
Page: 68 of 116
c) 7% for equipment which is: - attended whilst in use (for example: hair dryers, vacuum cleaners, kitchen equipment such
as mixers, garden equipment such as lawn mowers, portable tools such as electric drills), or - switched on automatically, or is intended to be switched on manually, no more than twice
per day, and also has either a delayed restart (the delay being not less than a few tens of seconds) or manual restart, after a power supply interruption.
Pst and P1t requirements shall not be applied to voltage changes caused by manual switching.
6.4. Test Procedure The EUT is supplied in series with power analyzer from a power source having the same normal voltage and frequency as the rated supply voltage and the equipment under test. And the rated voltage at the supply voltage of EUT of 0.94 times and 1.06 times shall be performed.
6.5. Deviation from Test Standard No deviation.

Report No: 098S082-IT-CE-P01V01
Page: 69 of 116
6.6. Test Result Test Mode Mode 6: LCD (1680*1050@60Hz) + HDMI (1680*1050@60Hz)
Test Site SR-1 Date of Test 2009.09.01
Temperature 25°C Humidity 48%RH Barometric Pressure 101kPa Test Engineer Allen
Test Result: Pass Status: Test Completed
Psti and limit line European Limits
0.25
0.50
0.75
1.00
Pst
6:32:04
Plt and limit line
0.00.10.20.30.40.50.6
Plt
6:3
2:0
4
Vrms at the end of test (Volt): 229.97 Highest dt (%): -0.17 Test limit (%): 3.30 Pass Time(mS) > dt: 0.0 Test limit (mS): 0.0 Pass Highest dc (%): 0.00 Test limit (%): 3.30 Pass Highest dmax (%): -0.20 Test limit (%): 4.00 Pass Highest Pst (10 min. period): 0.064 Test limit: 1.000 Pass Highest Plt (2 hr. period): 0.028 Test limit: 0.650 Pass
Report No: 098S082-IT-CE-P01V01
Page: 70 of 116
6.7. Test Photograph Test Mode: Mode 6: LCD (1680*1050@60Hz) + HDMI (1680*1050@60Hz) Description: Voltage fluctuations and flicker Test Setup
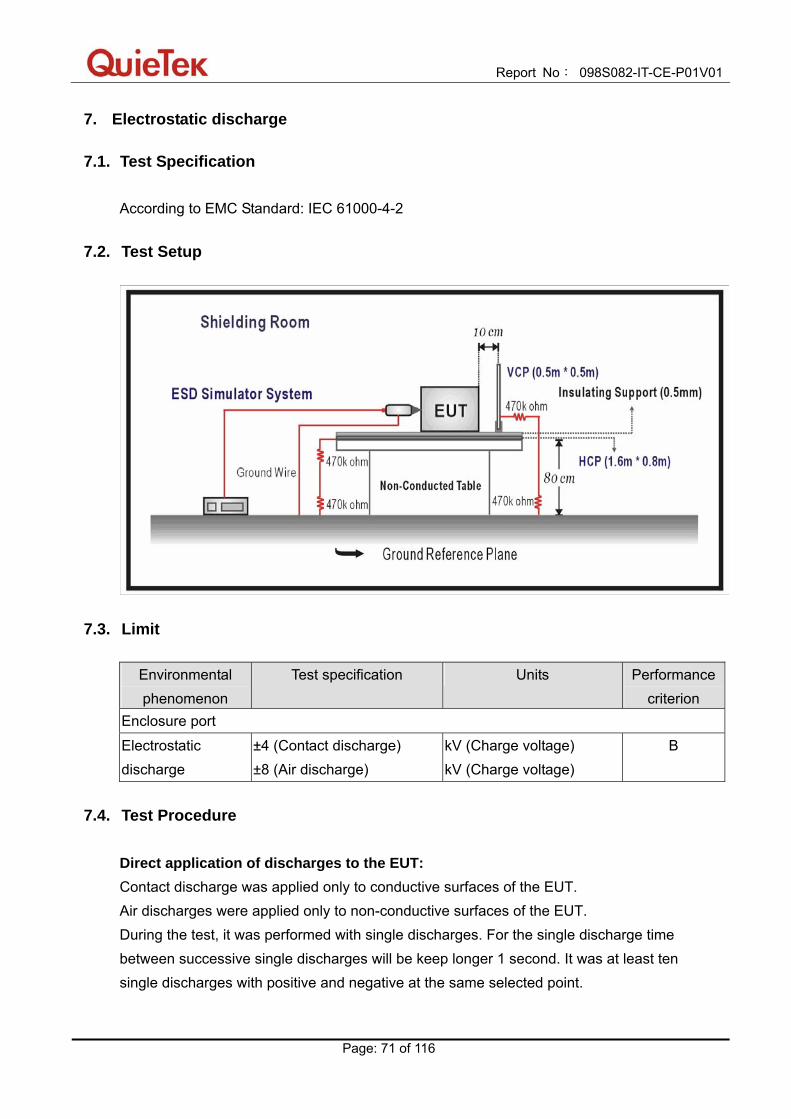
Report No: 098S082-IT-CE-P01V01
Page: 71 of 116
7. Electrostatic discharge
7.1. Test Specification
According to EMC Standard: IEC 61000-4-2
7.2. Test Setup
7.3. Limit
Environmental phenomenon
Test specification Units Performance criterion
Enclosure port
Electrostatic discharge
±4 (Contact discharge) ±8 (Air discharge)
kV (Charge voltage) kV (Charge voltage)
B
7.4. Test Procedure
Direct application of discharges to the EUT: Contact discharge was applied only to conductive surfaces of the EUT. Air discharges were applied only to non-conductive surfaces of the EUT. During the test, it was performed with single discharges. For the single discharge time between successive single discharges will be keep longer 1 second. It was at least ten single discharges with positive and negative at the same selected point.
Report No: 098S082-IT-CE-P01V01
Page: 72 of 116
The selected point, which was performed with electrostatic discharge, was marked on the red label of the EUT. Indirect application of discharges to the EUT: Vertical Coupling Plane (VCP): The coupling plane, of dimensions 0.5m x 0.5m, is placed parallel to, and positioned at a distance 0.1m from, the EUT, with the Discharge Electrode touching the coupling plane. The four faces of the EUT will be performed with electrostatic discharge. It was at least ten single discharges with positive and negative at the same selected point. Horizontal Coupling Plane (HCP): The coupling plane is placed under to the EUT. The generator shall be positioned vertically at a distance of 0.1m from the EUT, with the Discharge Electrode touching the coupling plane. The four faces of the EUT will be performed with electrostatic discharge. It was at least ten single discharges with positive and negative at the same selected point.
7.5. Deviation from Test Standard No deviation.
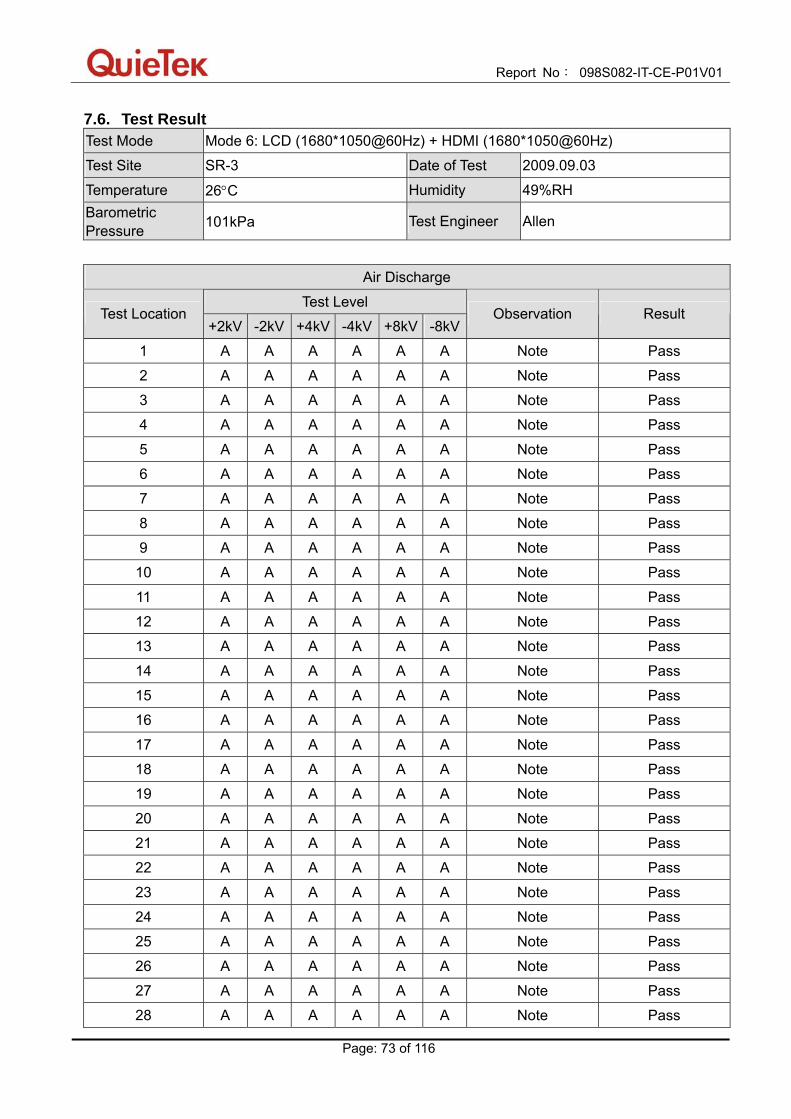
Report No: 098S082-IT-CE-P01V01
Page: 73 of 116
7.6. Test Result Test Mode Mode 6: LCD (1680*1050@60Hz) + HDMI (1680*1050@60Hz)
Test Site SR-3 Date of Test 2009.09.03
Temperature 26°C Humidity 49%RH Barometric Pressure 101kPa Test Engineer Allen
Air Discharge
Test Level Test Location
+2kV -2kV +4kV -4kV +8kV -8kVObservation Result
1 A A A A A A Note Pass
2 A A A A A A Note Pass
3 A A A A A A Note Pass
4 A A A A A A Note Pass
5 A A A A A A Note Pass
6 A A A A A A Note Pass
7 A A A A A A Note Pass
8 A A A A A A Note Pass
9 A A A A A A Note Pass
10 A A A A A A Note Pass
11 A A A A A A Note Pass
12 A A A A A A Note Pass
13 A A A A A A Note Pass
14 A A A A A A Note Pass
15 A A A A A A Note Pass
16 A A A A A A Note Pass
17 A A A A A A Note Pass
18 A A A A A A Note Pass
19 A A A A A A Note Pass
20 A A A A A A Note Pass
21 A A A A A A Note Pass
22 A A A A A A Note Pass
23 A A A A A A Note Pass
24 A A A A A A Note Pass
25 A A A A A A Note Pass
26 A A A A A A Note Pass
27 A A A A A A Note Pass
28 A A A A A A Note Pass
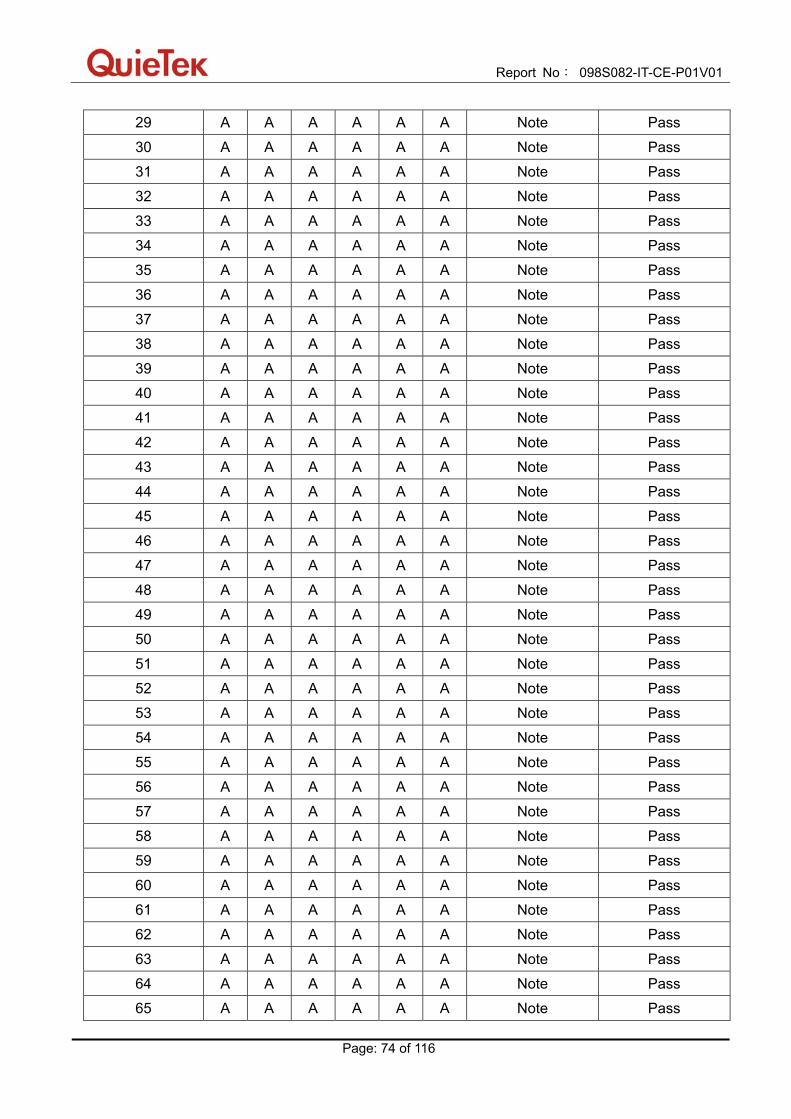
Report No: 098S082-IT-CE-P01V01
Page: 74 of 116
29 A A A A A A Note Pass
30 A A A A A A Note Pass
31 A A A A A A Note Pass
32 A A A A A A Note Pass
33 A A A A A A Note Pass
34 A A A A A A Note Pass
35 A A A A A A Note Pass
36 A A A A A A Note Pass
37 A A A A A A Note Pass
38 A A A A A A Note Pass
39 A A A A A A Note Pass
40 A A A A A A Note Pass
41 A A A A A A Note Pass
42 A A A A A A Note Pass
43 A A A A A A Note Pass
44 A A A A A A Note Pass
45 A A A A A A Note Pass
46 A A A A A A Note Pass
47 A A A A A A Note Pass
48 A A A A A A Note Pass
49 A A A A A A Note Pass
50 A A A A A A Note Pass
51 A A A A A A Note Pass
52 A A A A A A Note Pass
53 A A A A A A Note Pass
54 A A A A A A Note Pass
55 A A A A A A Note Pass
56 A A A A A A Note Pass
57 A A A A A A Note Pass
58 A A A A A A Note Pass
59 A A A A A A Note Pass
60 A A A A A A Note Pass
61 A A A A A A Note Pass
62 A A A A A A Note Pass
63 A A A A A A Note Pass
64 A A A A A A Note Pass
65 A A A A A A Note Pass
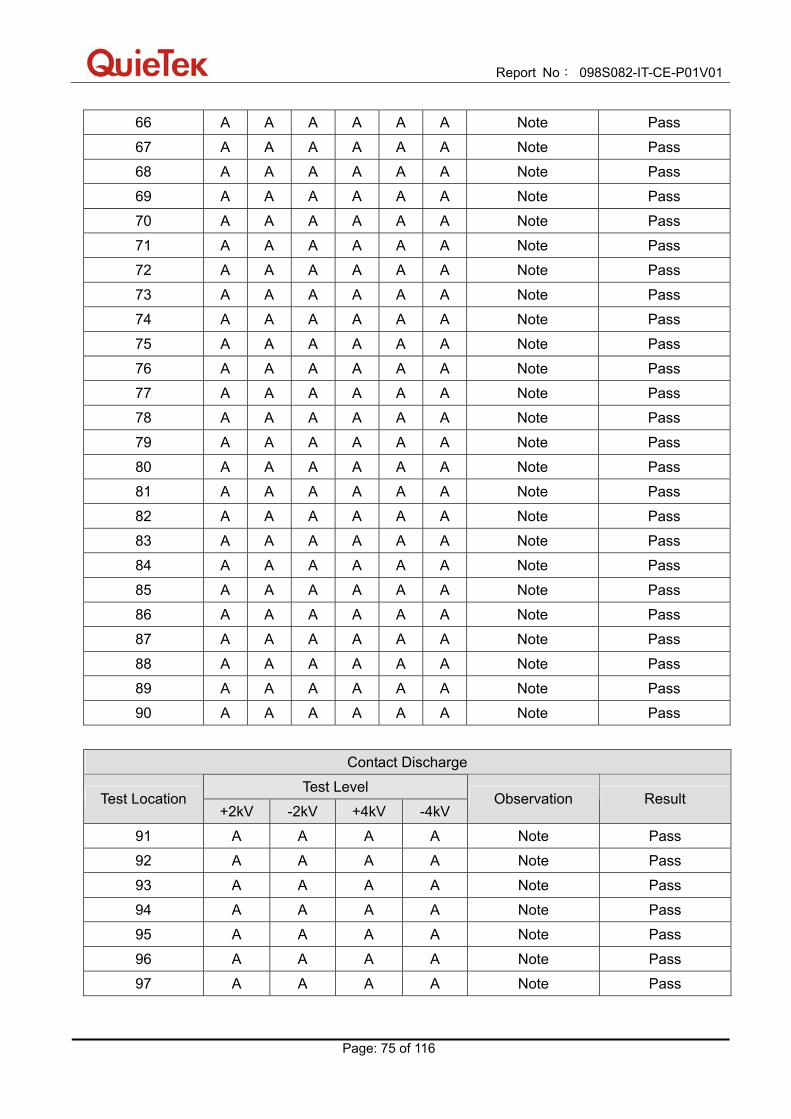
Report No: 098S082-IT-CE-P01V01
Page: 75 of 116
66 A A A A A A Note Pass
67 A A A A A A Note Pass
68 A A A A A A Note Pass
69 A A A A A A Note Pass
70 A A A A A A Note Pass
71 A A A A A A Note Pass
72 A A A A A A Note Pass
73 A A A A A A Note Pass
74 A A A A A A Note Pass
75 A A A A A A Note Pass
76 A A A A A A Note Pass
77 A A A A A A Note Pass
78 A A A A A A Note Pass
79 A A A A A A Note Pass
80 A A A A A A Note Pass
81 A A A A A A Note Pass
82 A A A A A A Note Pass
83 A A A A A A Note Pass
84 A A A A A A Note Pass
85 A A A A A A Note Pass
86 A A A A A A Note Pass
87 A A A A A A Note Pass
88 A A A A A A Note Pass
89 A A A A A A Note Pass
90 A A A A A A Note Pass
Contact Discharge
Test Level Test Location
+2kV -2kV +4kV -4kV Observation Result
91 A A A A Note Pass
92 A A A A Note Pass
93 A A A A Note Pass
94 A A A A Note Pass
95 A A A A Note Pass
96 A A A A Note Pass
97 A A A A Note Pass
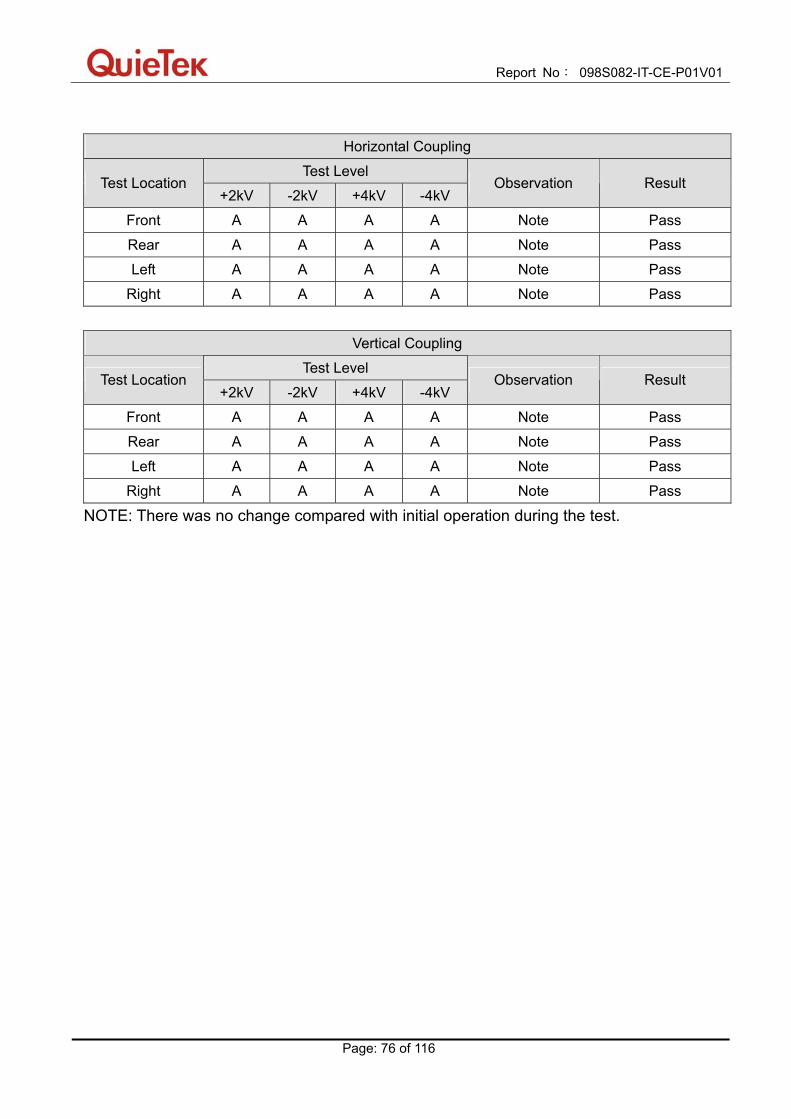
Report No: 098S082-IT-CE-P01V01
Page: 76 of 116
Horizontal Coupling
Test Level Test Location
+2kV -2kV +4kV -4kV Observation Result
Front A A A A Note Pass
Rear A A A A Note Pass
Left A A A A Note Pass
Right A A A A Note Pass
Vertical Coupling
Test Level Test Location
+2kV -2kV +4kV -4kV Observation Result
Front A A A A Note Pass
Rear A A A A Note Pass
Left A A A A Note Pass
Right A A A A Note Pass
NOTE: There was no change compared with initial operation during the test.
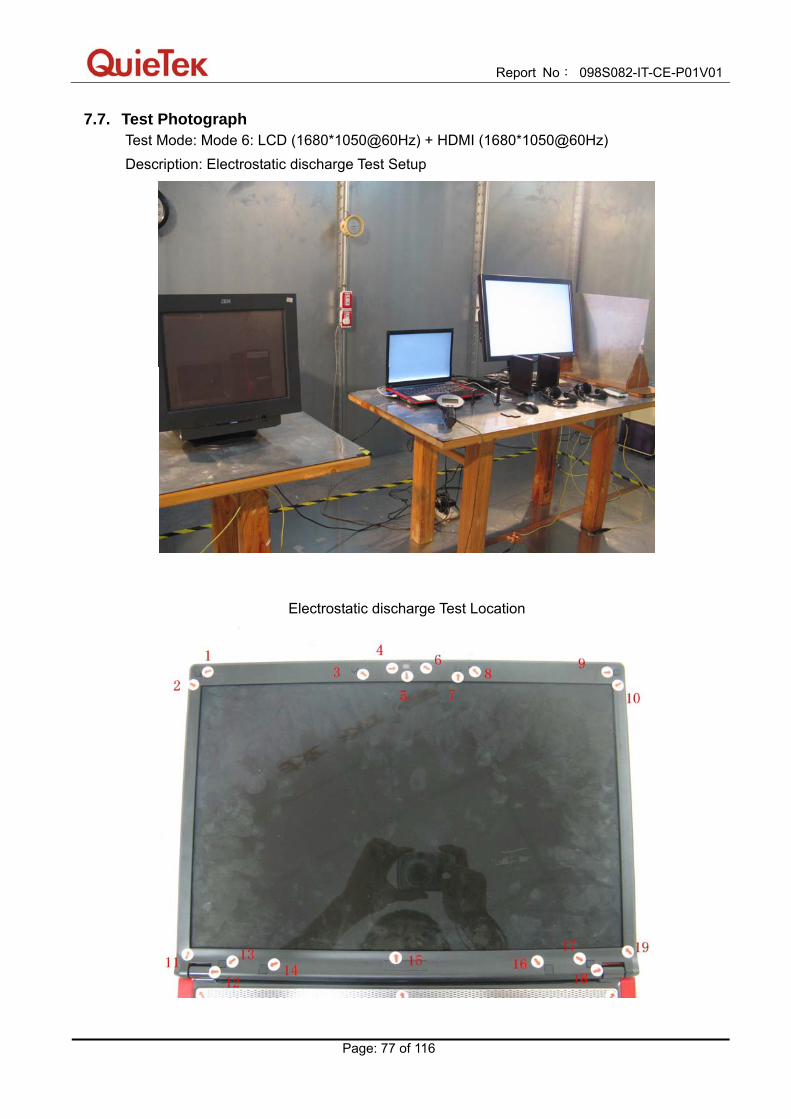
Report No: 098S082-IT-CE-P01V01
Page: 77 of 116
7.7. Test Photograph Test Mode: Mode 6: LCD (1680*1050@60Hz) + HDMI (1680*1050@60Hz) Description: Electrostatic discharge Test Setup
Electrostatic discharge Test Location
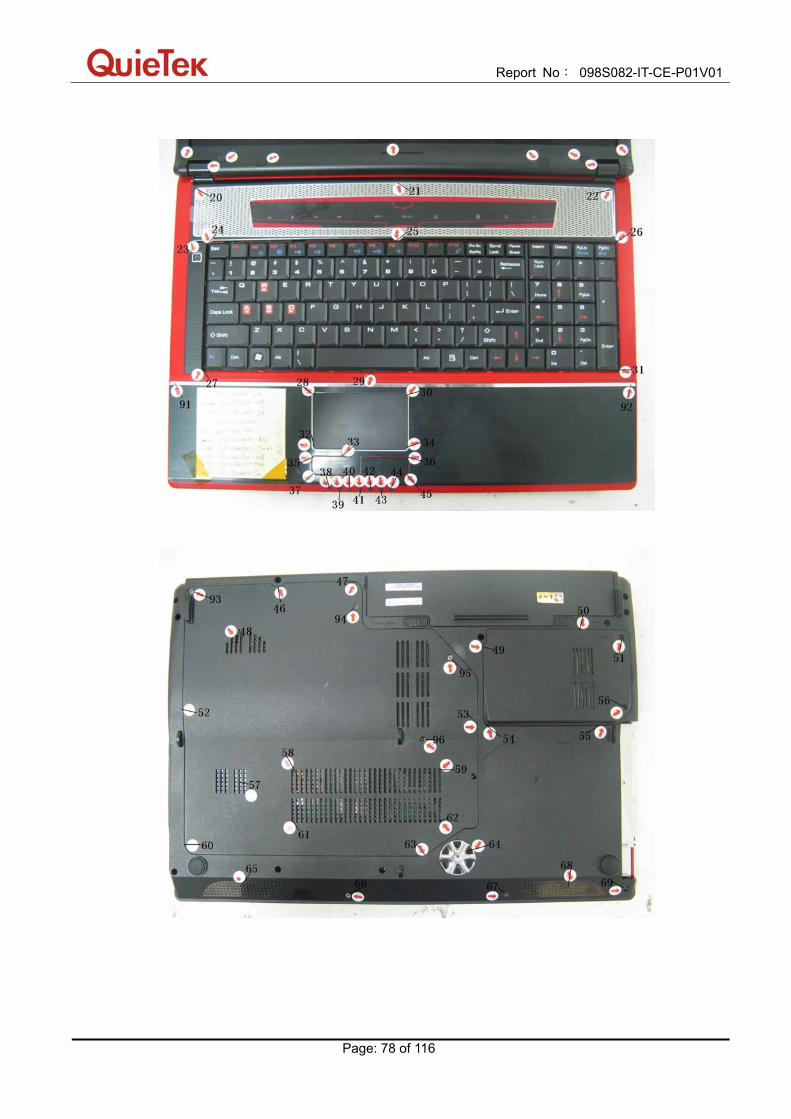
Report No: 098S082-IT-CE-P01V01
Page: 78 of 116
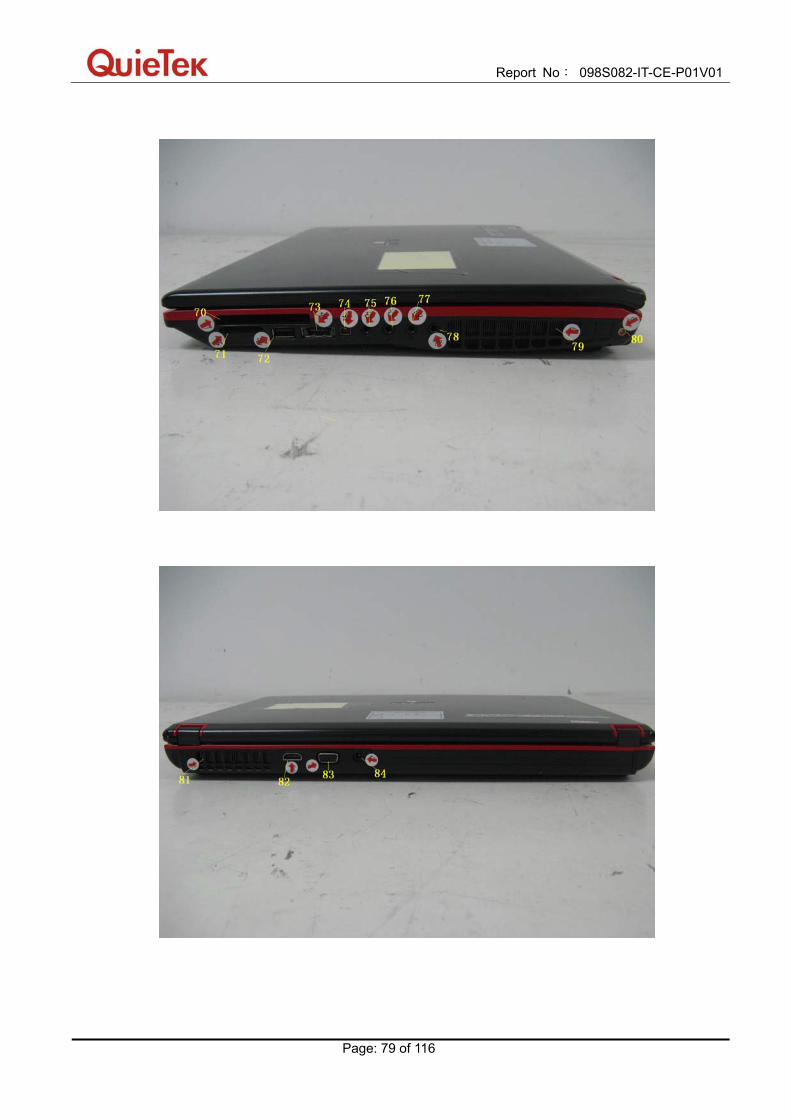
Report No: 098S082-IT-CE-P01V01
Page: 79 of 116
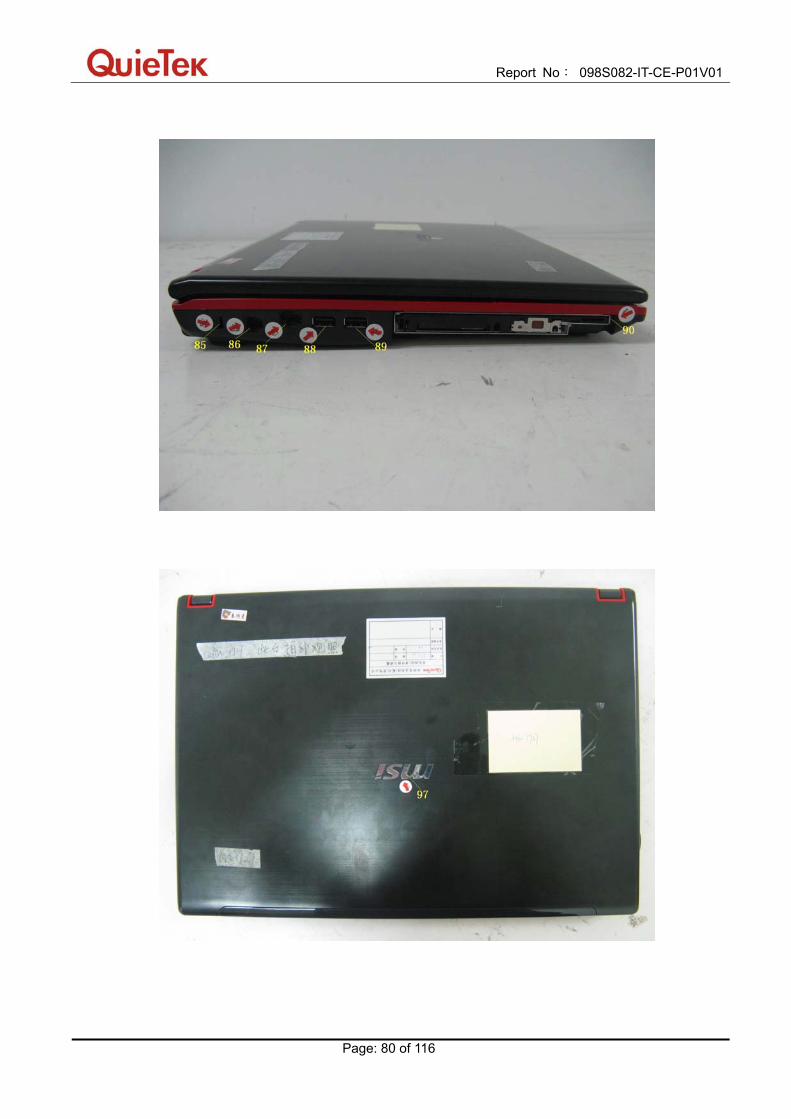
Report No: 098S082-IT-CE-P01V01
Page: 80 of 116
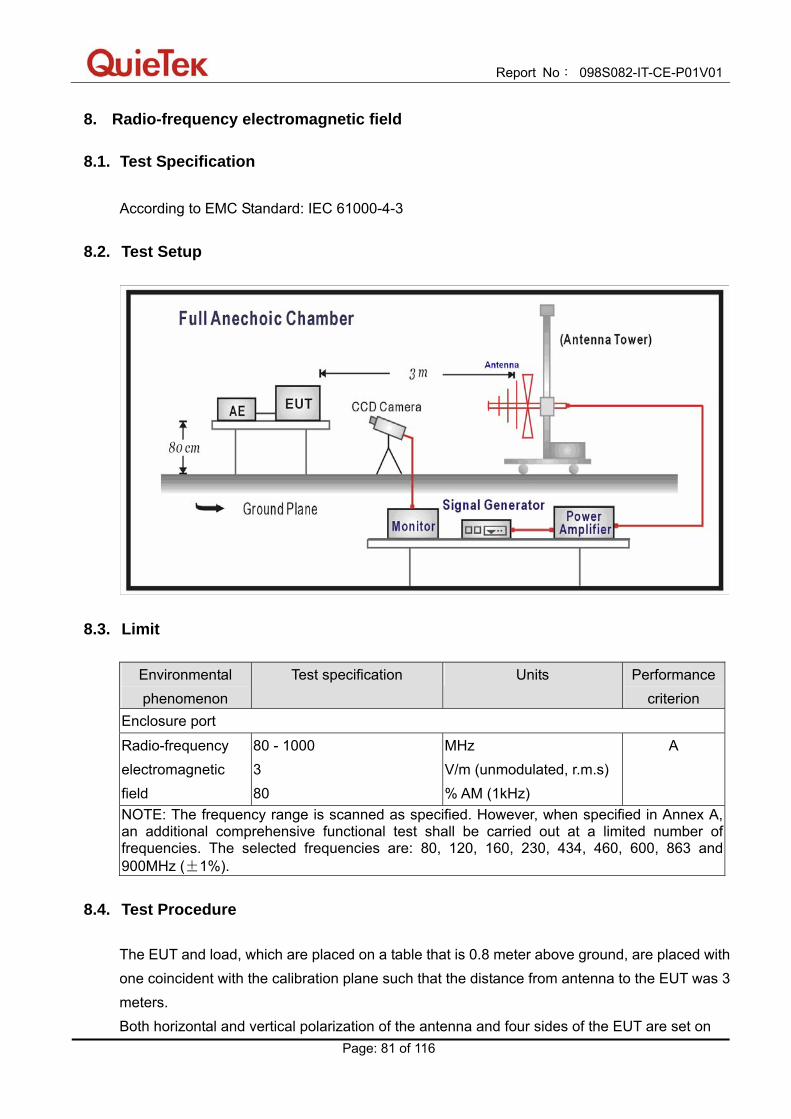
Report No: 098S082-IT-CE-P01V01
Page: 81 of 116
8. Radio-frequency electromagnetic field
8.1. Test Specification
According to EMC Standard: IEC 61000-4-3
8.2. Test Setup
8.3. Limit
Environmental phenomenon
Test specification Units Performance criterion
Enclosure port
Radio-frequency electromagnetic field
80 - 1000 3 80
MHz V/m (unmodulated, r.m.s) % AM (1kHz)
A
NOTE: The frequency range is scanned as specified. However, when specified in Annex A, an additional comprehensive functional test shall be carried out at a limited number of frequencies. The selected frequencies are: 80, 120, 160, 230, 434, 460, 600, 863 and 900MHz (±1%).
8.4. Test Procedure The EUT and load, which are placed on a table that is 0.8 meter above ground, are placed with one coincident with the calibration plane such that the distance from antenna to the EUT was 3 meters. Both horizontal and vertical polarization of the antenna and four sides of the EUT are set on
Report No: 098S082-IT-CE-P01V01
Page: 82 of 116
measurement. In order to judge the EUT performance, a CCD camera is used to monitor EUT screen. All the scanning conditions are as follows:
Condition of Test Remarks
1. Field Strength 3V/m
2. Radiated Signal AM 80% Modulated with 1kHz
3. Scanning Frequency 80 - 1000MHz
4 Dwell Time 3 Seconds
5. Frequency Step Size ∆ f 1%
6. The Rate of Sweep of Frequency 1.5 x 10⁻³ decades/s
8.5. Deviation from Test Standard
No deviation.
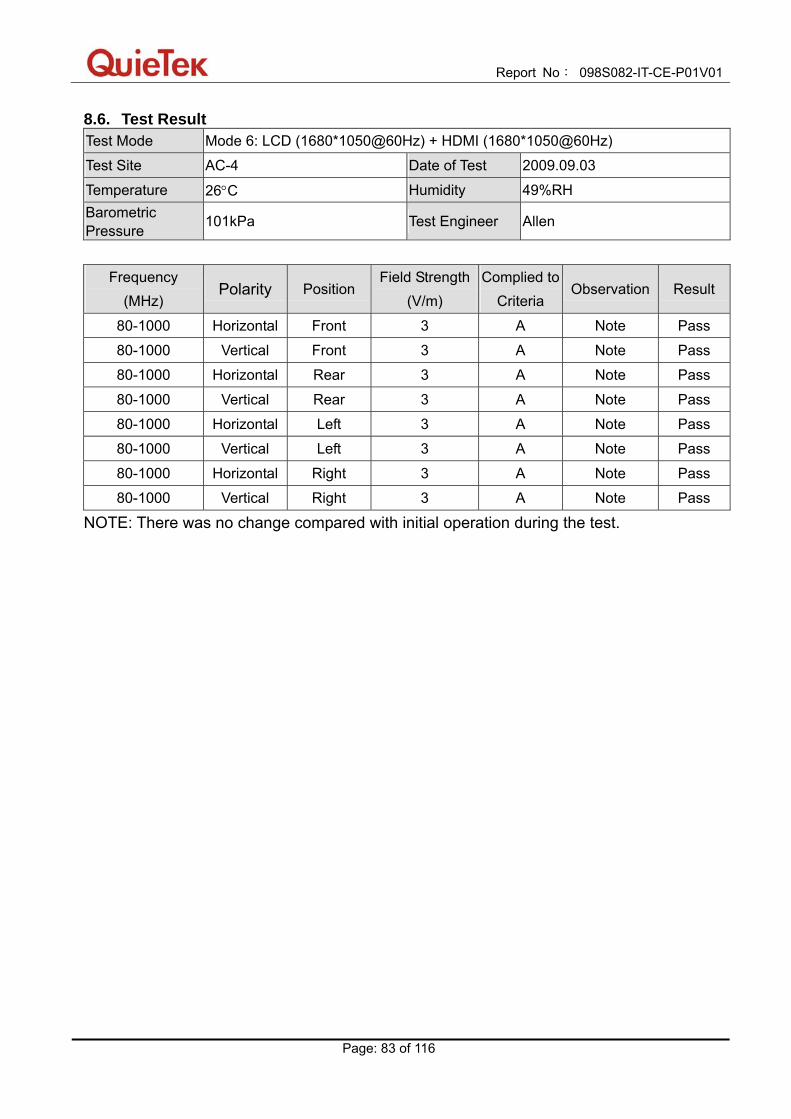
Report No: 098S082-IT-CE-P01V01
Page: 83 of 116
8.6. Test Result Test Mode Mode 6: LCD (1680*1050@60Hz) + HDMI (1680*1050@60Hz)
Test Site AC-4 Date of Test 2009.09.03
Temperature 26°C Humidity 49%RH Barometric Pressure
101kPa Test Engineer Allen
Frequency
(MHz) Polarity Position
Field Strength(V/m)
Complied to Criteria
Observation Result
80-1000 Horizontal Front 3 A Note Pass
80-1000 Vertical Front 3 A Note Pass
80-1000 Horizontal Rear 3 A Note Pass
80-1000 Vertical Rear 3 A Note Pass
80-1000 Horizontal Left 3 A Note Pass
80-1000 Vertical Left 3 A Note Pass
80-1000 Horizontal Right 3 A Note Pass
80-1000 Vertical Right 3 A Note Pass
NOTE: There was no change compared with initial operation during the test.
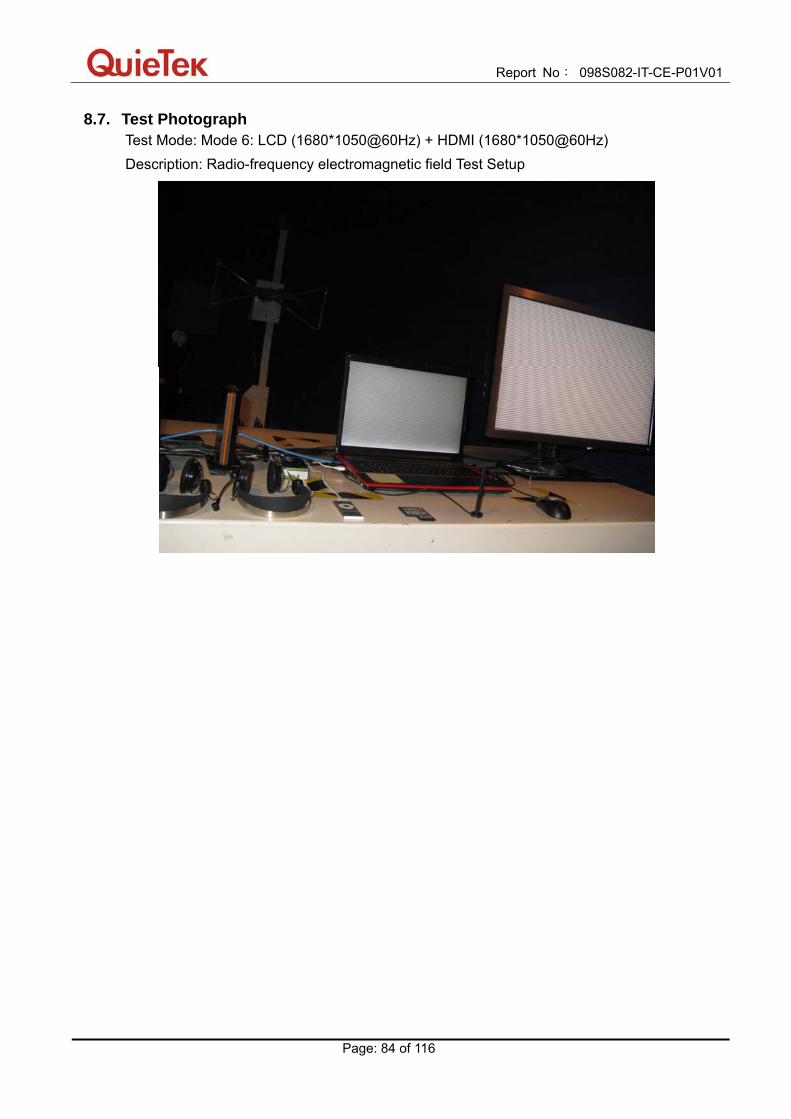
Report No: 098S082-IT-CE-P01V01
Page: 84 of 116
8.7. Test Photograph Test Mode: Mode 6: LCD (1680*1050@60Hz) + HDMI (1680*1050@60Hz) Description: Radio-frequency electromagnetic field Test Setup
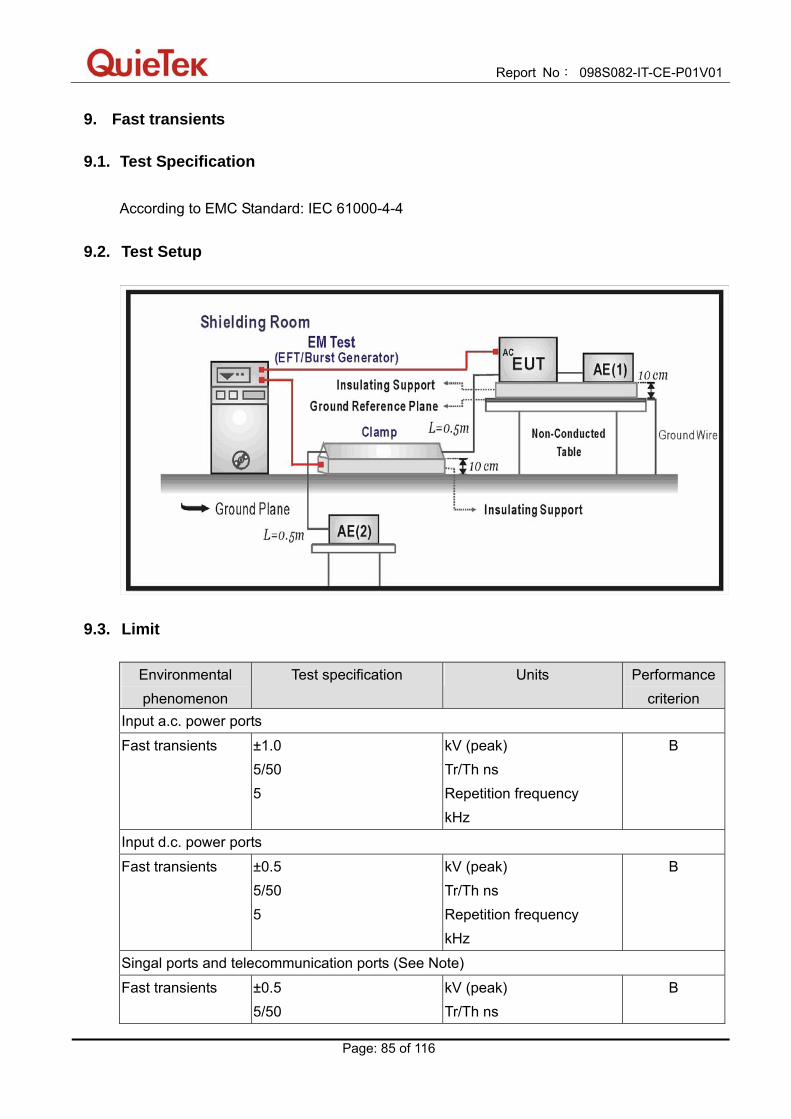
Report No: 098S082-IT-CE-P01V01
Page: 85 of 116
9. Fast transients
9.1. Test Specification
According to EMC Standard: IEC 61000-4-4
9.2. Test Setup
9.3. Limit
Environmental phenomenon
Test specification Units Performance criterion
Input a.c. power ports
Fast transients ±1.0 5/50 5
kV (peak) Tr/Th ns Repetition frequency kHz
B
Input d.c. power ports
Fast transients ±0.5 5/50 5
kV (peak) Tr/Th ns Repetition frequency kHz
B
Singal ports and telecommunication ports (See Note)
Fast transients ±0.5 5/50
kV (peak) Tr/Th ns
B

Report No: 098S082-IT-CE-P01V01
Page: 86 of 116
5 Repetition frequency kHz
NOTE: Applicable only to cables which according to the manufacturer’s specification supports communication on cable lengths greater than 3m.
9.4. Test Procedure The EUT is placed on a table that is 0.8 meter height. A ground reference plane is placed on the table, and uses a 0.1m insulation between the EUT and ground reference plane.
The minimum area of the ground reference plane is 1m*1m, and 0.65mm thick min, and projected beyond the EUT by at least 0.1m on all sides. For input a.c. and d.c. power ports: The EUT is connected to the power mains through a coupling device that directly couples the EFT/B interference signal. Each of the line conductors is impressed with burst noise for 1 minute. The length of the power lines between the coupling device and the EUT is 0.5m. For signal and telecommunication ports: The EFT interference signal is through a coupling clamp device couples to the signal of the EUT with burst noise for 1 minute. The length of the signal lines between the coupling device and the EUT is 0.5m.
9.5. Deviation from Test Standard No deviation.
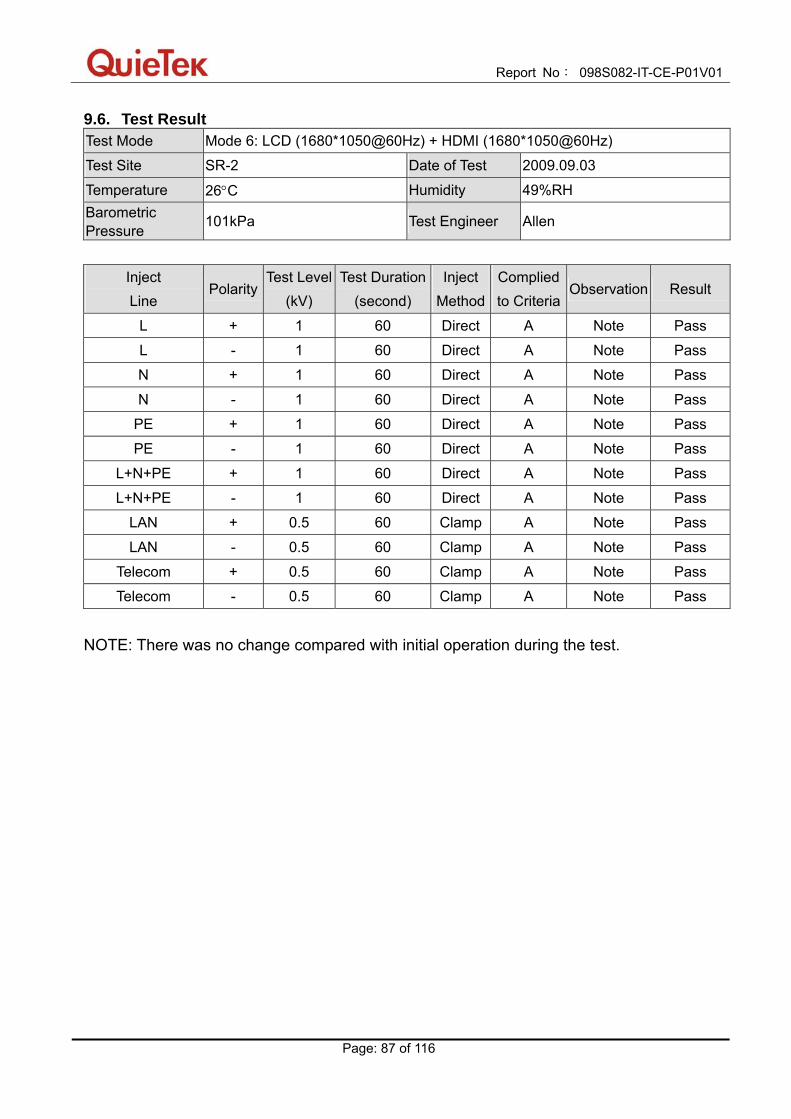
Report No: 098S082-IT-CE-P01V01
Page: 87 of 116
9.6. Test Result Test Mode Mode 6: LCD (1680*1050@60Hz) + HDMI (1680*1050@60Hz)
Test Site SR-2 Date of Test 2009.09.03
Temperature 26°C Humidity 49%RH Barometric Pressure
101kPa Test Engineer Allen
Inject Line
Polarity Test Level
(kV) Test Duration
(second) Inject
MethodComplied to Criteria
Observation Result
L + 1 60 Direct A Note Pass
L - 1 60 Direct A Note Pass
N + 1 60 Direct A Note Pass
N - 1 60 Direct A Note Pass
PE + 1 60 Direct A Note Pass
PE - 1 60 Direct A Note Pass
L+N+PE + 1 60 Direct A Note Pass
L+N+PE - 1 60 Direct A Note Pass
LAN + 0.5 60 Clamp A Note Pass
LAN - 0.5 60 Clamp A Note Pass
Telecom + 0.5 60 Clamp A Note Pass
Telecom - 0.5 60 Clamp A Note Pass
NOTE: There was no change compared with initial operation during the test.

Report No: 098S082-IT-CE-P01V01
Page: 88 of 116
9.7. Test Photograph Test Mode: Mode 6: LCD (1680*1050@60Hz) + HDMI (1680*1050@60Hz) Description: Fast transients Test Setup (Input a.c. power ports)
Test Mode: Mode 6: LCD (1680*1050@60Hz) + HDMI (1680*1050@60Hz) Description: Fast transients Test Setup (LAN)
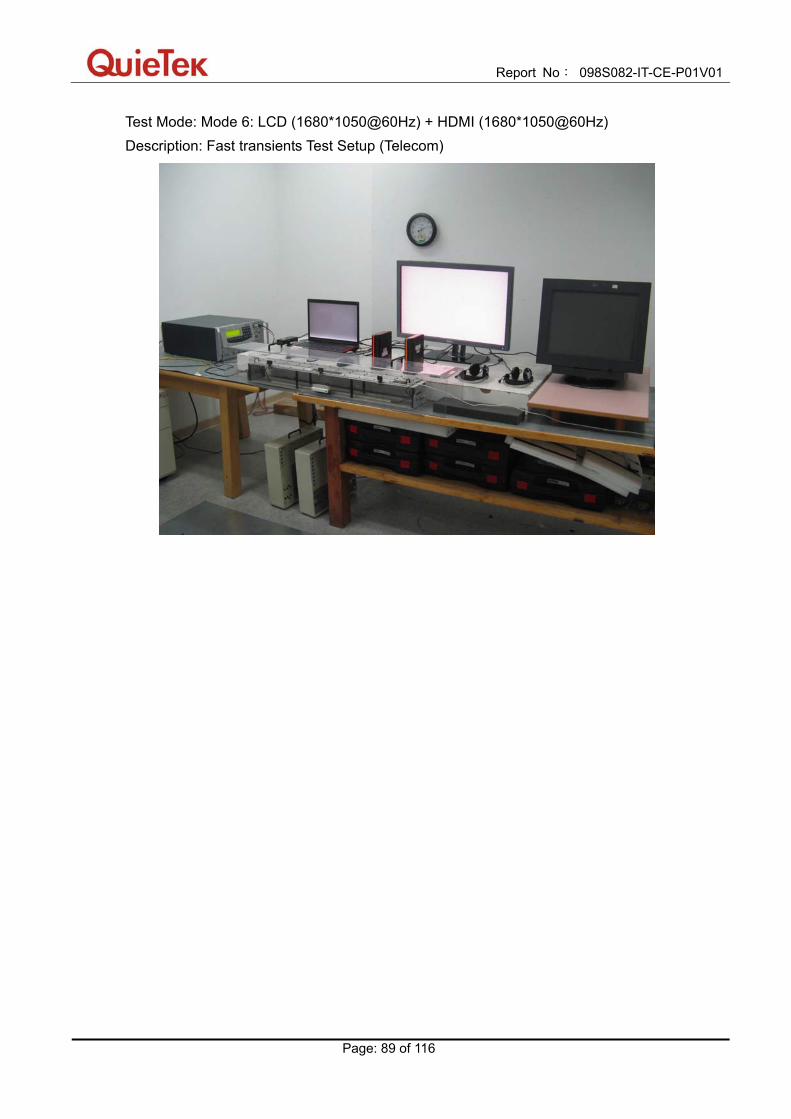
Report No: 098S082-IT-CE-P01V01
Page: 89 of 116
Test Mode: Mode 6: LCD (1680*1050@60Hz) + HDMI (1680*1050@60Hz) Description: Fast transients Test Setup (Telecom)
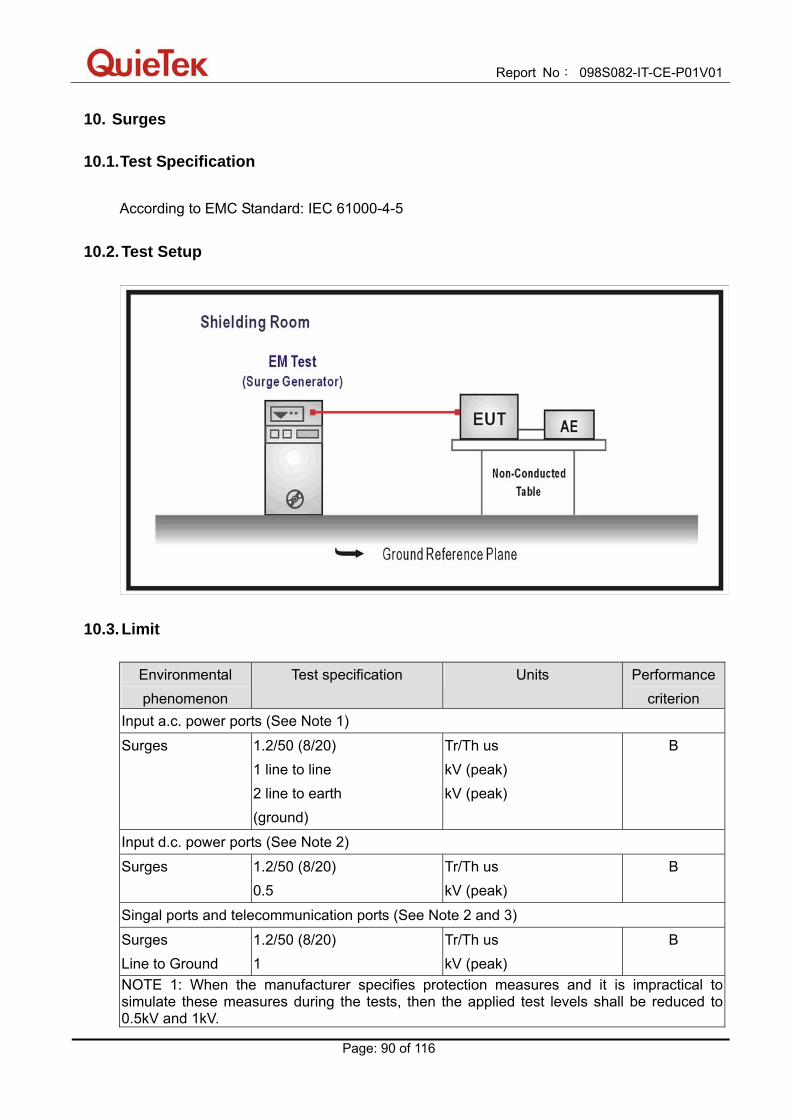
Report No: 098S082-IT-CE-P01V01
Page: 90 of 116
10. Surges
10.1. Test Specification
According to EMC Standard: IEC 61000-4-5
10.2. Test Setup
10.3. Limit
Environmental phenomenon
Test specification Units Performance criterion
Input a.c. power ports (See Note 1)
Surges 1.2/50 (8/20) 1 line to line 2 line to earth (ground)
Tr/Th us kV (peak) kV (peak)
B
Input d.c. power ports (See Note 2)
Surges 1.2/50 (8/20) 0.5
Tr/Th us kV (peak)
B
Singal ports and telecommunication ports (See Note 2 and 3)
Surges Line to Ground
1.2/50 (8/20) 1
Tr/Th us kV (peak)
B
NOTE 1: When the manufacturer specifies protection measures and it is impractical to simulate these measures during the tests, then the applied test levels shall be reduced to 0.5kV and 1kV.

Report No: 098S082-IT-CE-P01V01
Page: 91 of 116
NOTE 2: Applicable only to ports which according to the manufacturer’s specification mayconnect directly to outdoor cables. NOTE 3: Where normal functioning cannot be achieved because of the impact of the CDN on the EUT, no test shall be required.
10.4. Test Procedure
The EUT is placed on a table that is 0.8 meter above a metal ground plane measured 1m*1m minimum and 0.65mm thick minimum and projected beyond the EUT by at least 0.1m on all sides. The length of power cord between the coupling device and the EUT shall be 2m or less. For input a.c. and d.c. power ports: The EUT is connected to the power mains through a coupling device that directly couples the surge interference signal. The surge noise shall be applied synchronized to the voltage phase at 00, 900, 1800, 2700 and the peak value of the a.c. voltage wave. (Positive and negative) Each of Line to Earth and Line to Line is impressed with a sequence of five surge voltages with interval of 1 minute. For signal and telecommunication ports: The signal line of EUT is connected to coupling and decoupling network that directly couples the surge interference signal. Only Line to ground is impressed with a sequence of five surge voltages with interval of 1
minute.
10.5. Deviation from Test Standard No deviation.
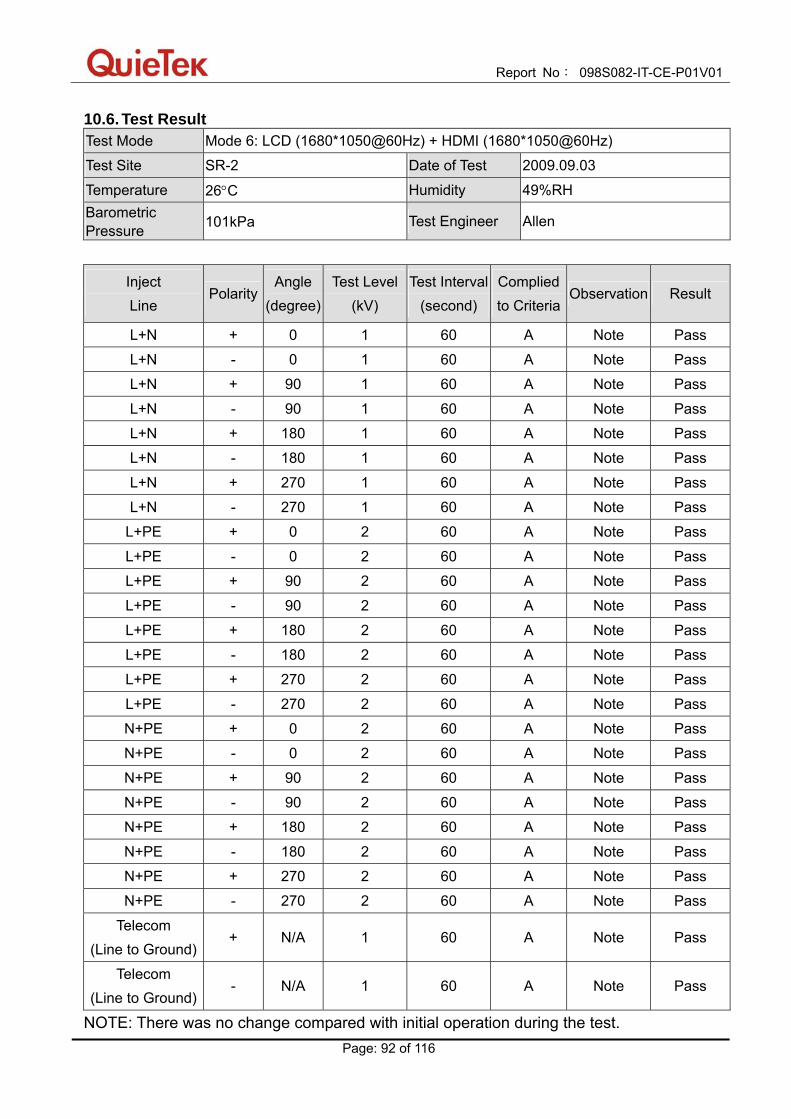
Report No: 098S082-IT-CE-P01V01
Page: 92 of 116
10.6. Test Result Test Mode Mode 6: LCD (1680*1050@60Hz) + HDMI (1680*1050@60Hz)
Test Site SR-2 Date of Test 2009.09.03
Temperature 26°C Humidity 49%RH Barometric Pressure 101kPa Test Engineer Allen
Inject Line
Polarity Angle
(degree) Test Level
(kV) Test Interval
(second) Complied to Criteria
Observation Result
L+N + 0 1 60 A Note Pass
L+N - 0 1 60 A Note Pass
L+N + 90 1 60 A Note Pass
L+N - 90 1 60 A Note Pass
L+N + 180 1 60 A Note Pass
L+N - 180 1 60 A Note Pass
L+N + 270 1 60 A Note Pass
L+N - 270 1 60 A Note Pass
L+PE + 0 2 60 A Note Pass
L+PE - 0 2 60 A Note Pass
L+PE + 90 2 60 A Note Pass
L+PE - 90 2 60 A Note Pass
L+PE + 180 2 60 A Note Pass
L+PE - 180 2 60 A Note Pass
L+PE + 270 2 60 A Note Pass
L+PE - 270 2 60 A Note Pass
N+PE + 0 2 60 A Note Pass
N+PE - 0 2 60 A Note Pass
N+PE + 90 2 60 A Note Pass
N+PE - 90 2 60 A Note Pass
N+PE + 180 2 60 A Note Pass
N+PE - 180 2 60 A Note Pass
N+PE + 270 2 60 A Note Pass
N+PE - 270 2 60 A Note Pass
Telecom (Line to Ground)
+ N/A 1 60 A Note Pass
Telecom (Line to Ground)
- N/A 1 60 A Note Pass
NOTE: There was no change compared with initial operation during the test.

Report No: 098S082-IT-CE-P01V01
Page: 93 of 116
10.7. Test Photograph Test Mode: Mode 6: LCD (1680*1050@60Hz) + HDMI (1680*1050@60Hz)
Description: Surges Test Setup (Input a.c. power ports)
Test Mode: Mode 6: LCD (1680*1050@60Hz) + HDMI (1680*1050@60Hz)
Description: Surges Test Setup (Telecom)
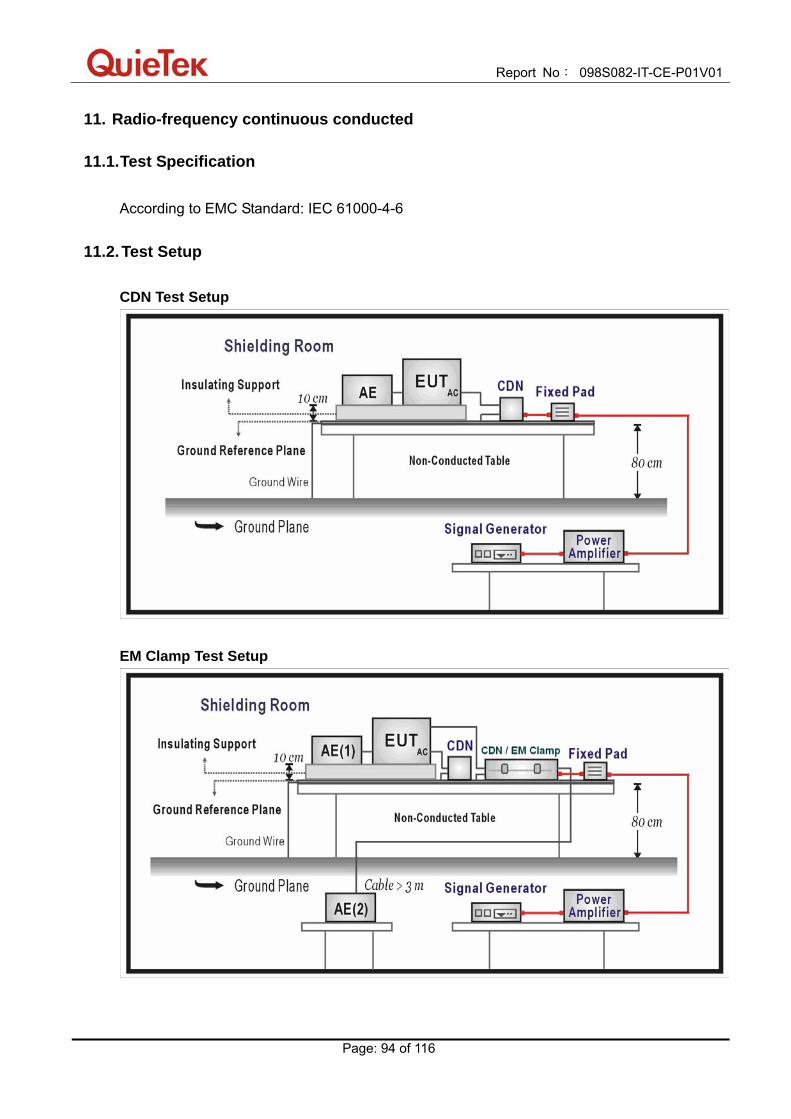
Report No: 098S082-IT-CE-P01V01
Page: 94 of 116
11. Radio-frequency continuous conducted
11.1. Test Specification
According to EMC Standard: IEC 61000-4-6
11.2. Test Setup CDN Test Setup
EM Clamp Test Setup

Report No: 098S082-IT-CE-P01V01
Page: 95 of 116
11.3. Limit
Environmental phenomenon
Test specification Units Performance criterion
Input a.c. power ports (See Note 1)
Radio-frequency continuous conducted
0.15 - 80 3 80
MHz V (unmodulated, r.m.s) % AM (1kHz)
A
Input d.c. power ports (See Note 1)
Radio-frequency continuous conducted
0.15 - 80 3 80
MHz V (unmodulated, r.m.s) % AM (1kHz)
A
Singal ports and telecommunication ports (See Note 1 and 3)
Radio-frequency continuous conducted
0.15 - 80 3 80
MHz V (unmodulated, r.m.s) % AM (1kHz)
A
NOTE 1: The frequency range is scanned as specified. However, when specified in Annex A, an additional comprehensive functional test shall be carried out at a limited number of frequencies. The selected frequencies for conducted test are: 0.2; 1; 7.1; 13.56; 21; 27.12 and 40.68MHz (±1%). NOTE 2: Applicable only to cables which according to the manufacturer’s specification supports communication on cable lengths greater than 3m.
11.4. Test Procedure
The EUT is placed on a table that is 0.8 meter height, and a ground reference plane on the table, EUT is placed upon table and use a 0.1m insulation between the EUT and ground reference plane. For input a.c. and d.c. power ports: The EUT is connected to the power mains through a coupling and decoupling networks for power supply lines. And directly couples the disturbances signal into EUT.
Used CDN-M2 for two wires or CDN-M3 for three wires. For signal and telecommunication ports: The disturbance signal is through a coupling and decoupling networks (CDN) or EM-clamp device couples to the signal and telecommunication lines of the EUT.
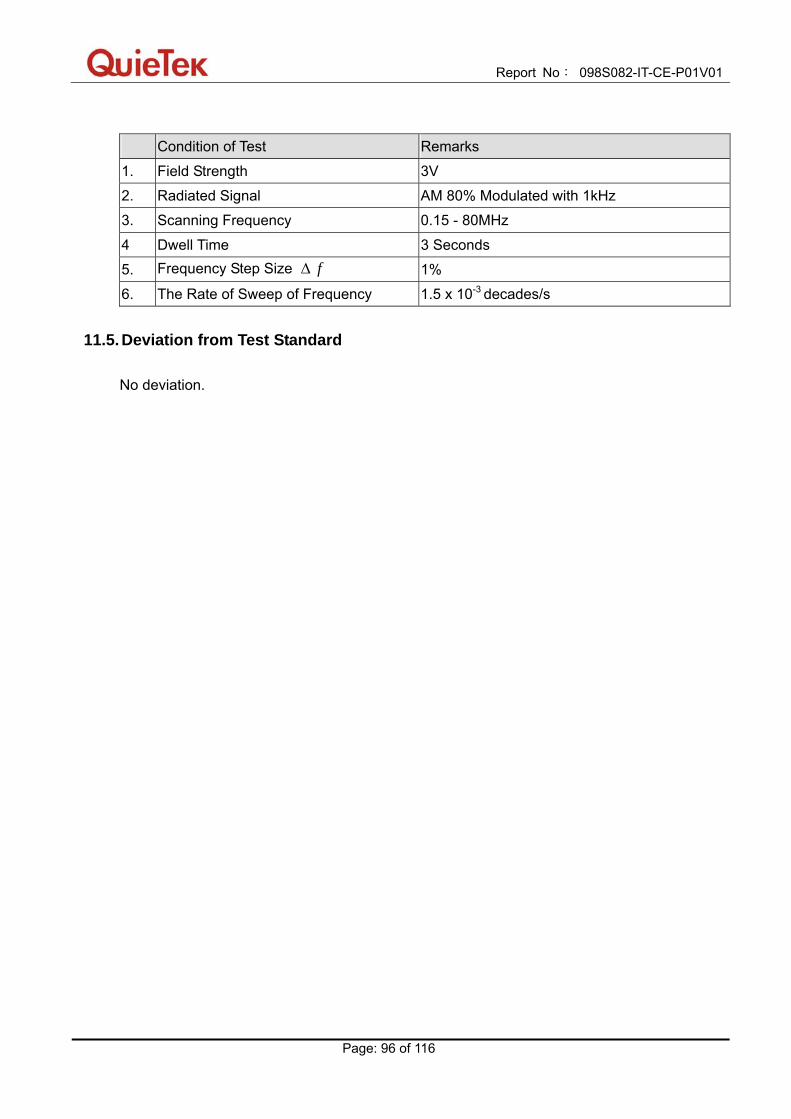
Report No: 098S082-IT-CE-P01V01
Page: 96 of 116
Condition of Test Remarks
1. Field Strength 3V
2. Radiated Signal AM 80% Modulated with 1kHz
3. Scanning Frequency 0.15 - 80MHz
4 Dwell Time 3 Seconds
5. Frequency Step Size ∆ f 1%
6. The Rate of Sweep of Frequency 1.5 x 10⁻³ decades/s
11.5. Deviation from Test Standard
No deviation.

Report No: 098S082-IT-CE-P01V01
Page: 97 of 116
11.6. Test Result Test Mode Mode 6: LCD (1680*1050@60Hz) + HDMI (1680*1050@60Hz)
Test Site SR-2 Date of Test 2009.09.03 Temperature 26°C Humidity 49%RH Barometric Pressure 101kPa Test Engineer Allen
Frequency
(MHz) Inject Voltage
(V/m) Inject Ports
Inject Method
Complied to Criteria
Observation Result
0.15-80 3 AC Mains CDN A Note Pass
0.15-80 3 LAN
(10/100Mbps)CDN A Note Pass
0.15-80 3 LAN
(1000Mbps)CDN A Note Pass
0.15-80 3 Telecom CDN A Note Pass
NOTE : There was no change compared with initial operation during the test.
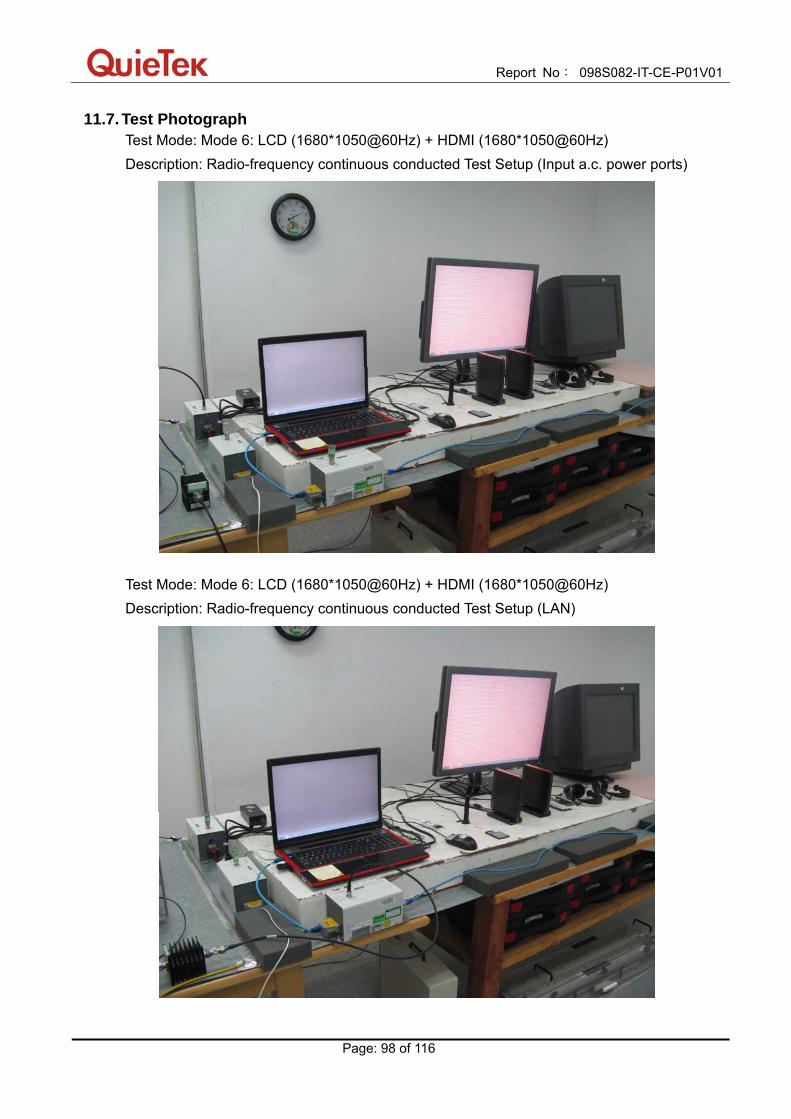
Report No: 098S082-IT-CE-P01V01
Page: 98 of 116
11.7. Test Photograph Test Mode: Mode 6: LCD (1680*1050@60Hz) + HDMI (1680*1050@60Hz) Description: Radio-frequency continuous conducted Test Setup (Input a.c. power ports)
Test Mode: Mode 6: LCD (1680*1050@60Hz) + HDMI (1680*1050@60Hz) Description: Radio-frequency continuous conducted Test Setup (LAN)

Report No: 098S082-IT-CE-P01V01
Page: 99 of 116
Test Mode: Mode 6: LCD (1680*1050@60Hz) + HDMI (1680*1050@60Hz) Description: Radio-frequency continuous conducted Test Setup (Telecom)
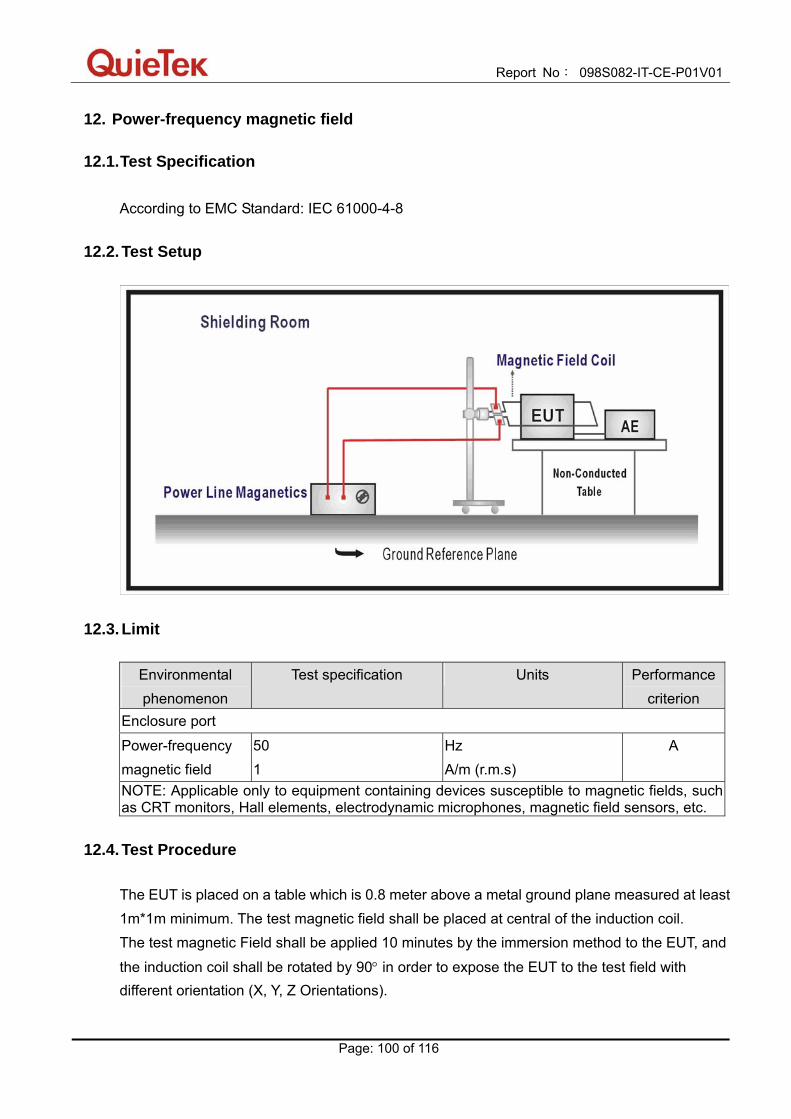
Report No: 098S082-IT-CE-P01V01
Page: 100 of 116
12. Power-frequency magnetic field
12.1. Test Specification
According to EMC Standard: IEC 61000-4-8
12.2. Test Setup
12.3. Limit
Environmental phenomenon
Test specification Units Performance criterion
Enclosure port
Power-frequency magnetic field
50 1
Hz A/m (r.m.s)
A
NOTE: Applicable only to equipment containing devices susceptible to magnetic fields, such as CRT monitors, Hall elements, electrodynamic microphones, magnetic field sensors, etc.
12.4. Test Procedure The EUT is placed on a table which is 0.8 meter above a metal ground plane measured at least 1m*1m minimum. The test magnetic field shall be placed at central of the induction coil. The test magnetic Field shall be applied 10 minutes by the immersion method to the EUT, and
the induction coil shall be rotated by 90° in order to expose the EUT to the test field with different orientation (X, Y, Z Orientations).
Report No: 098S082-IT-CE-P01V01
Page: 101 of 116
12.5. Deviation from Test Standard
No deviation.
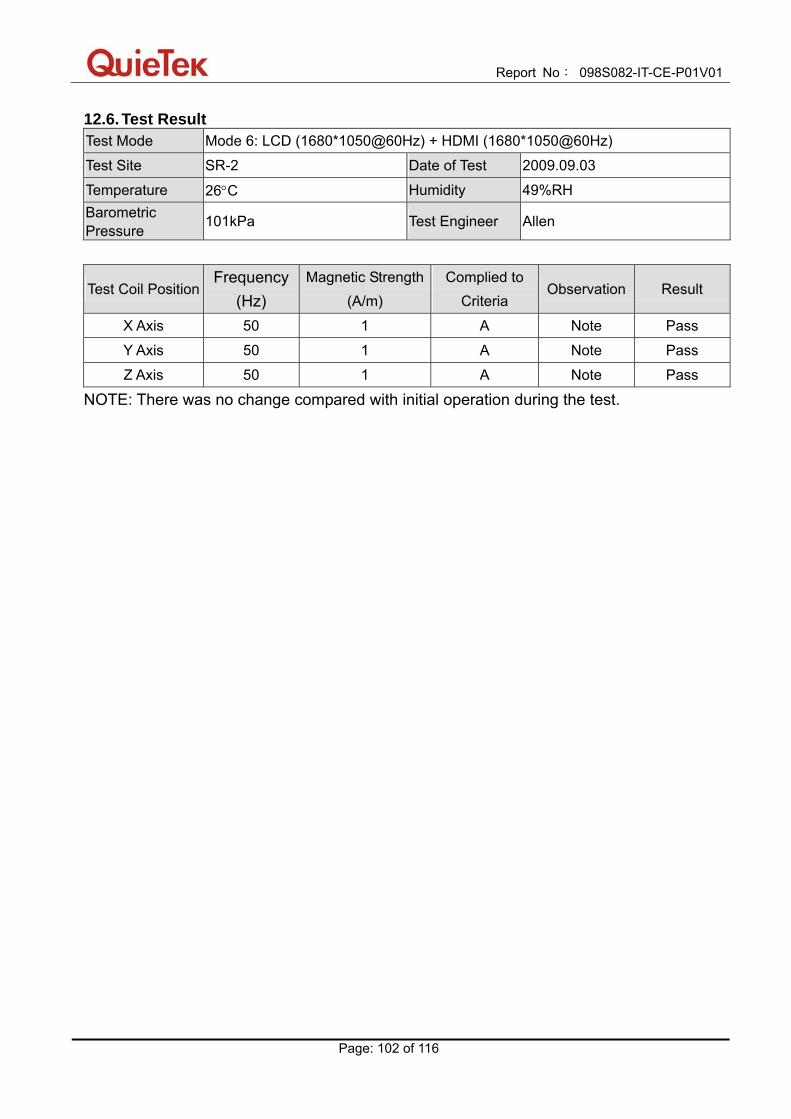
Report No: 098S082-IT-CE-P01V01
Page: 102 of 116
12.6. Test Result Test Mode Mode 6: LCD (1680*1050@60Hz) + HDMI (1680*1050@60Hz)
Test Site SR-2 Date of Test 2009.09.03
Temperature 26°C Humidity 49%RH Barometric Pressure
101kPa Test Engineer Allen
Test Coil Position Frequency
(Hz) Magnetic Strength
(A/m) Complied to
Criteria Observation Result
X Axis 50 1 A Note Pass
Y Axis 50 1 A Note Pass
Z Axis 50 1 A Note Pass
NOTE: There was no change compared with initial operation during the test.
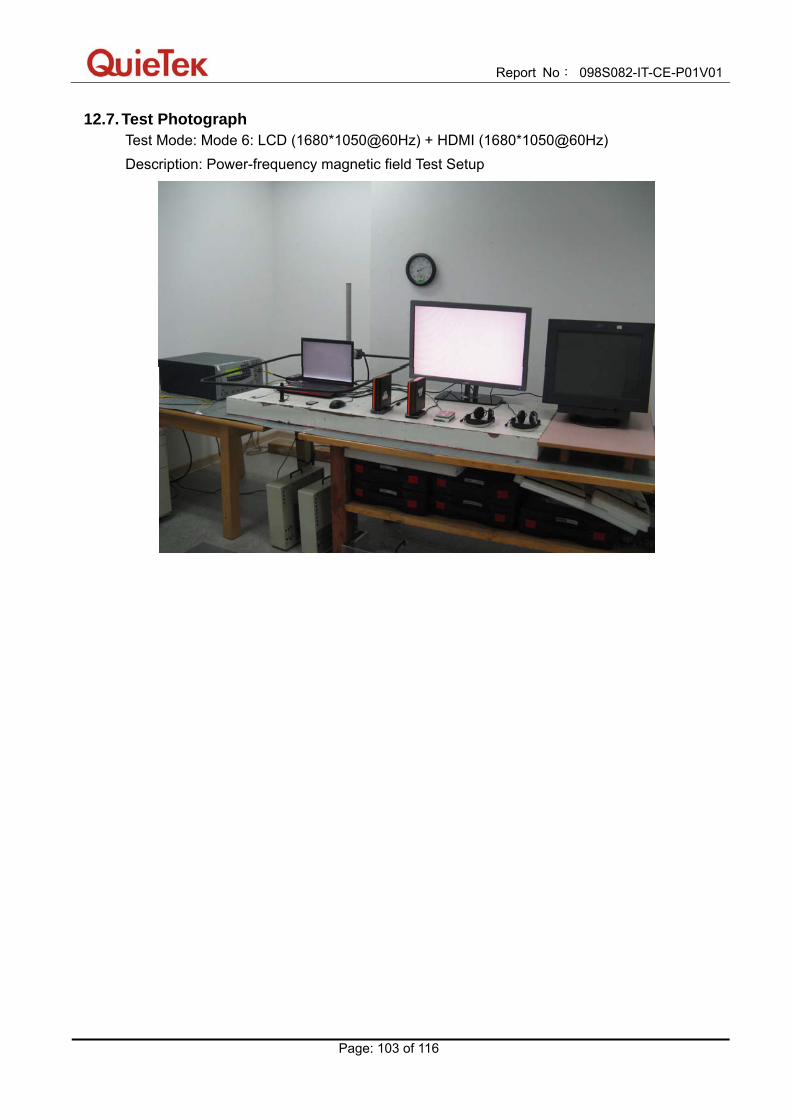
Report No: 098S082-IT-CE-P01V01
Page: 103 of 116
12.7. Test Photograph Test Mode: Mode 6: LCD (1680*1050@60Hz) + HDMI (1680*1050@60Hz) Description: Power-frequency magnetic field Test Setup

Report No: 098S082-IT-CE-P01V01
Page: 104 of 116
13. Voltage dips and interruptions
13.1. Test Specification
According to EMC Standard: IEC 61000-4-11
13.2. Test Setup
13.3. Limit
Environmental phenomenon
Test specification Units Performance criterion
Input a.c. power ports
>95 0.5
% reduction period
B Voltage dips
30 25
% reduction periods
C
Voltage interruptions
>95 250
% reduction periods
C
NOTE: Changes to occur at 0 degree crossover point of the voltage waveform.
13.4. Test Procedure
The EUT is placed on a table which is 0.8 meter above a metal ground plane measured 1m*1m minimum, and 0.65mm thick minimum, and projected beyond the EUT by at least 0.1m on all

Report No: 098S082-IT-CE-P01V01
Page: 105 of 116
sides. The power cord shall be used the shortest power cord as specified by the manufacturer. For Voltage dips and interruptions test: The selection of test voltage is based on the rated power range. If the operation range is large than 20% of lower power range, both end of specified voltage shall be tested. Otherwise, the typical voltage specification is selected as test voltage. The EUT is connected to the power mains through a coupling device that directly couples to the voltage dips and interruption generator.
13.5. Deviation from Test Standard No deviation.
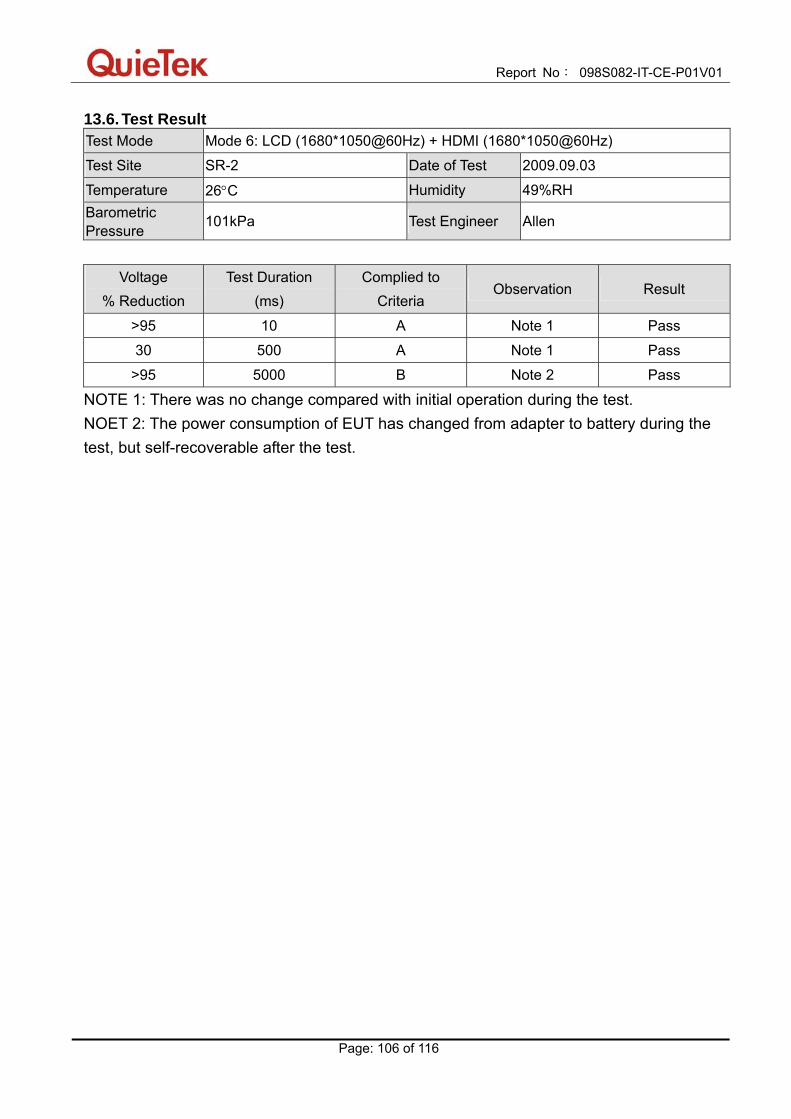
Report No: 098S082-IT-CE-P01V01
Page: 106 of 116
13.6. Test Result Test Mode Mode 6: LCD (1680*1050@60Hz) + HDMI (1680*1050@60Hz)
Test Site SR-2 Date of Test 2009.09.03
Temperature 26°C Humidity 49%RH Barometric Pressure
101kPa Test Engineer Allen
Voltage
% Reduction Test Duration
(ms) Complied to
Criteria Observation Result
>95 10 A Note 1 Pass
30 500 A Note 1 Pass
>95 5000 B Note 2 Pass
NOTE 1: There was no change compared with initial operation during the test. NOET 2: The power consumption of EUT has changed from adapter to battery during the test, but self-recoverable after the test.
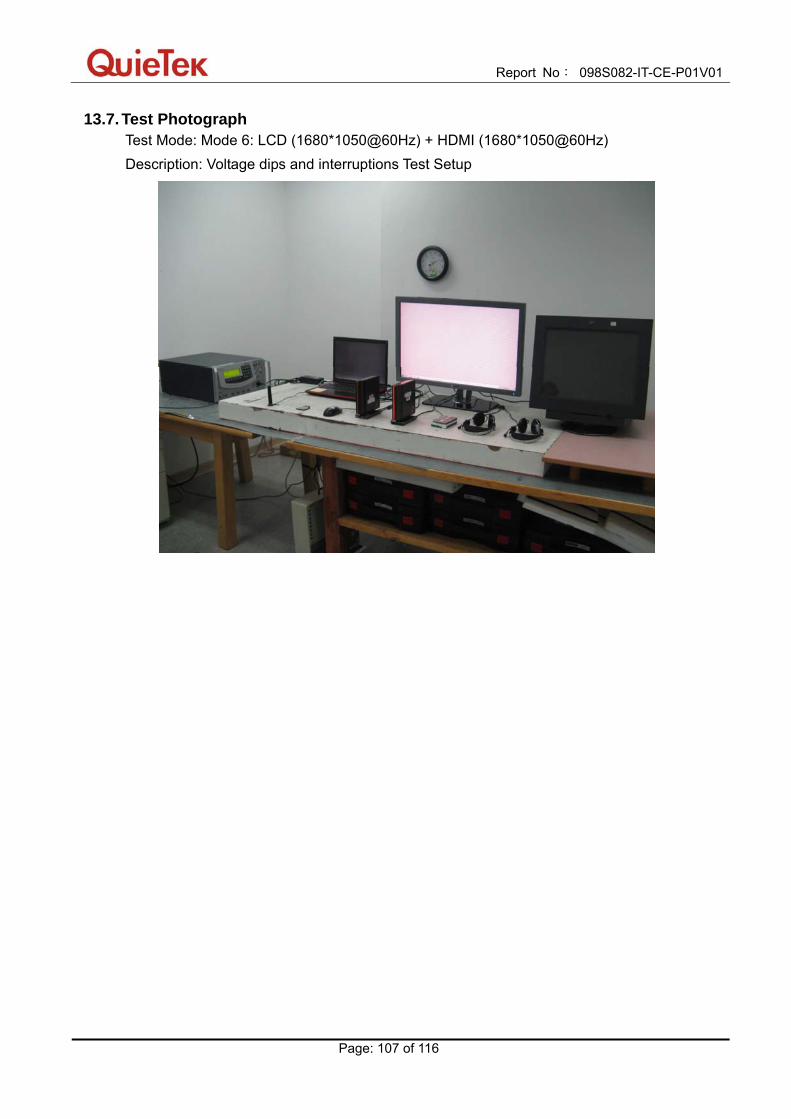
Report No: 098S082-IT-CE-P01V01
Page: 107 of 116
13.7. Test Photograph Test Mode: Mode 6: LCD (1680*1050@60Hz) + HDMI (1680*1050@60Hz) Description: Voltage dips and interruptions Test Setup
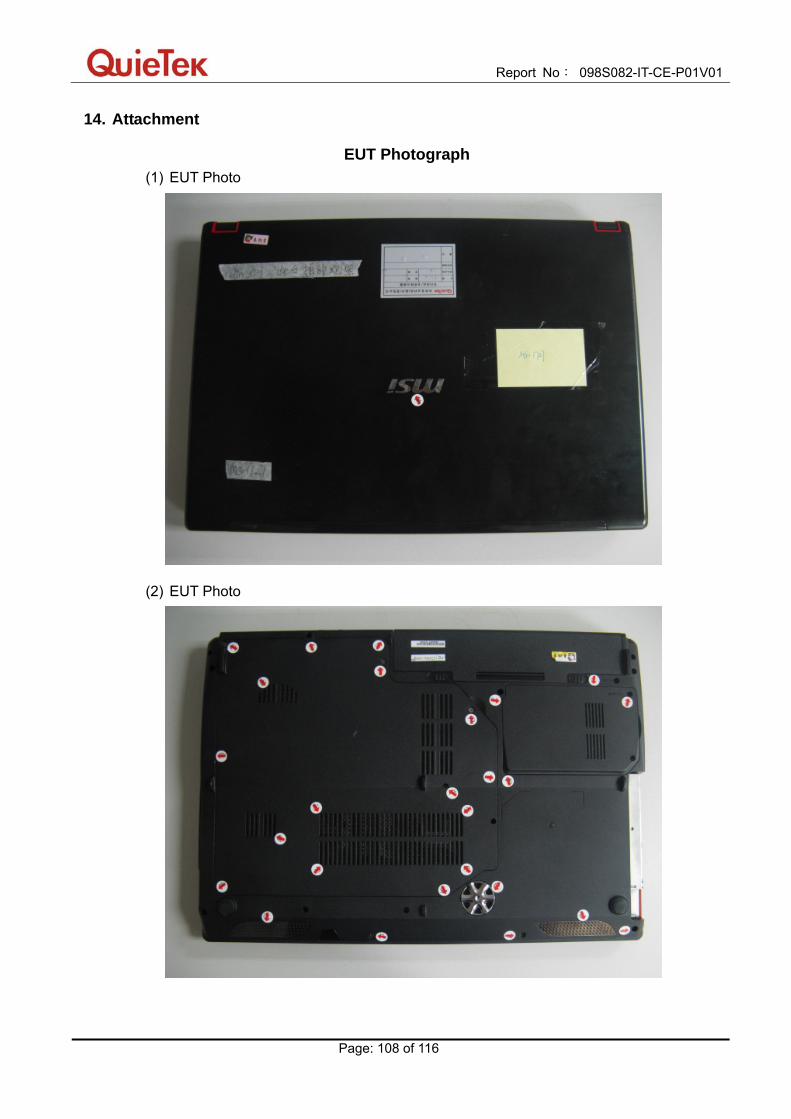
Report No: 098S082-IT-CE-P01V01
Page: 108 of 116
14. Attachment
EUT Photograph (1) EUT Photo
(2) EUT Photo
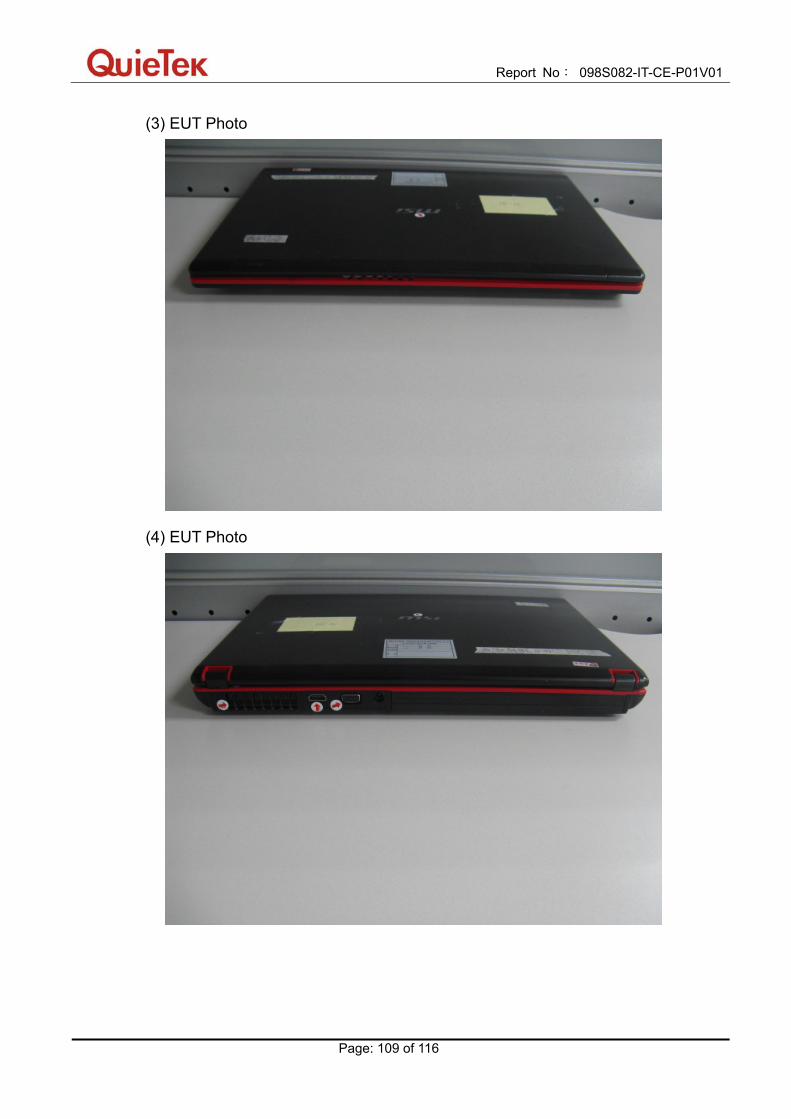
Report No: 098S082-IT-CE-P01V01
Page: 109 of 116
(3) EUT Photo
(4) EUT Photo
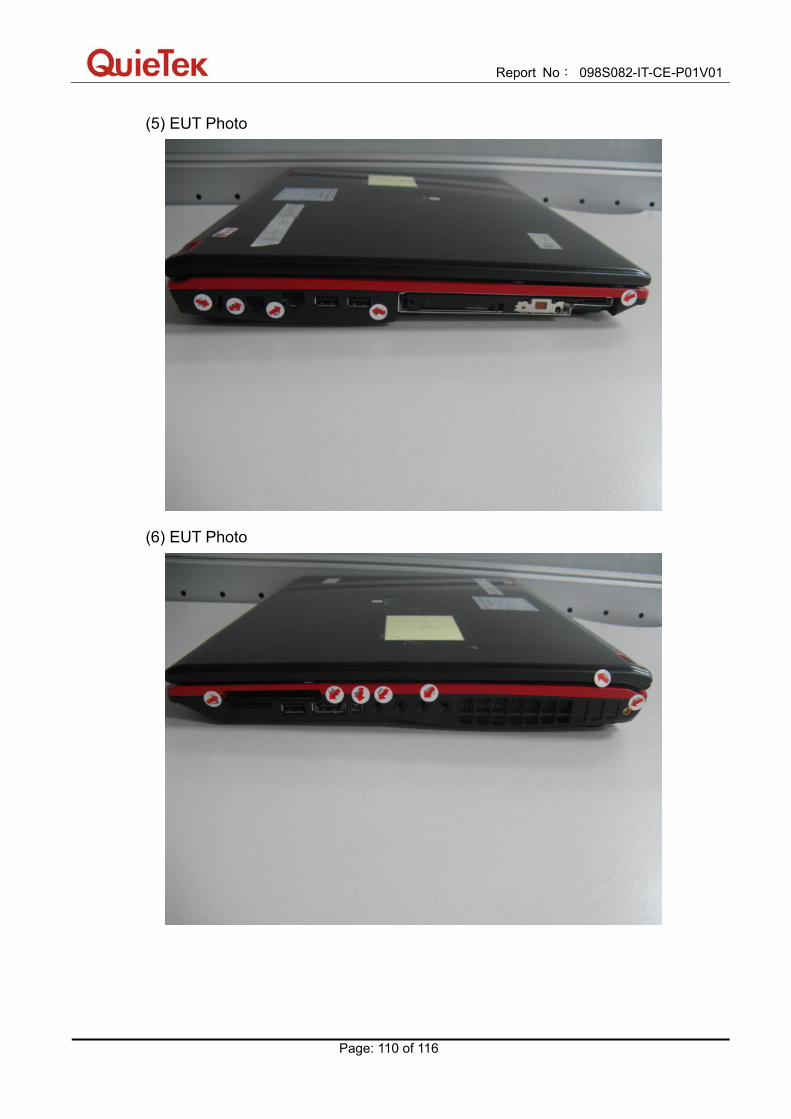
Report No: 098S082-IT-CE-P01V01
Page: 110 of 116
(5) EUT Photo
(6) EUT Photo
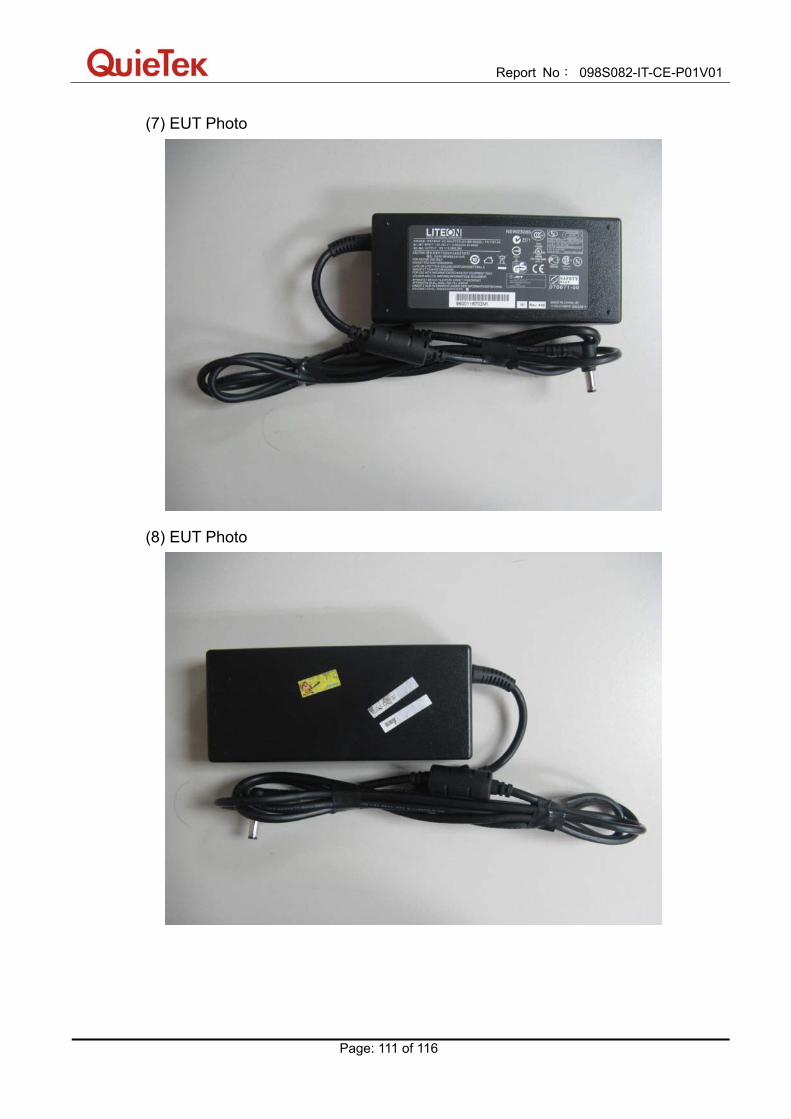
Report No: 098S082-IT-CE-P01V01
Page: 111 of 116
(7) EUT Photo
(8) EUT Photo
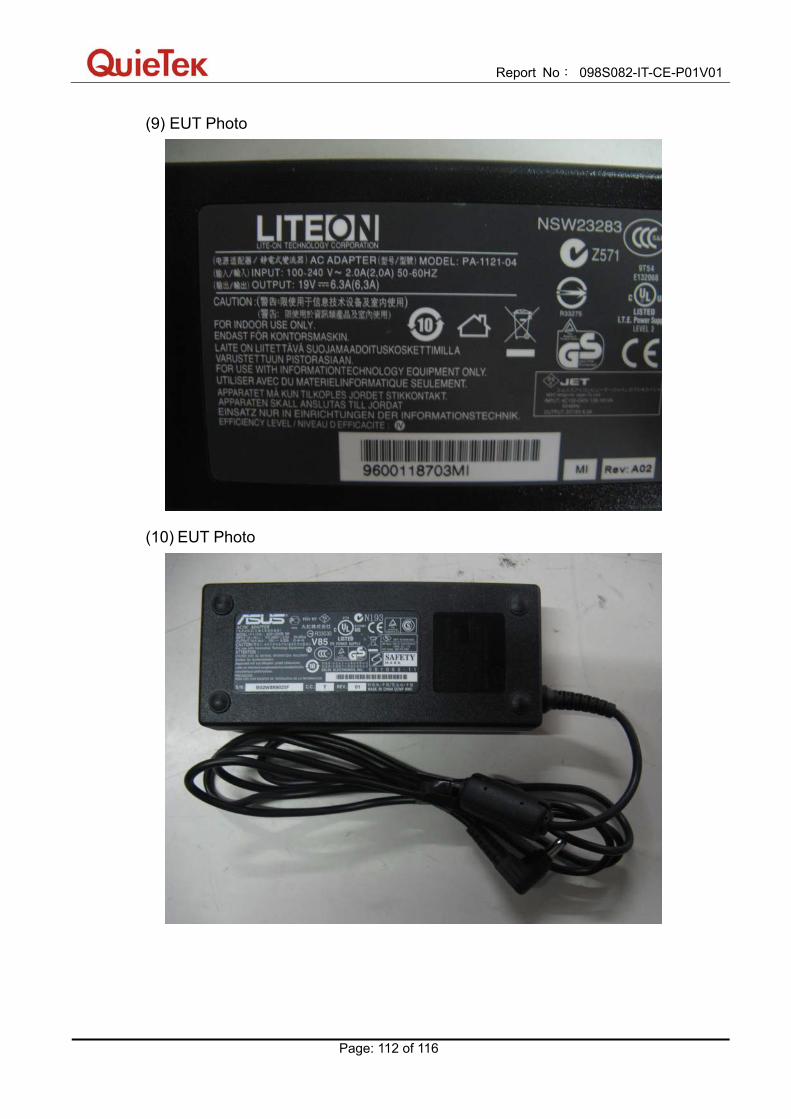
Report No: 098S082-IT-CE-P01V01
Page: 112 of 116
(9) EUT Photo
(10) EUT Photo
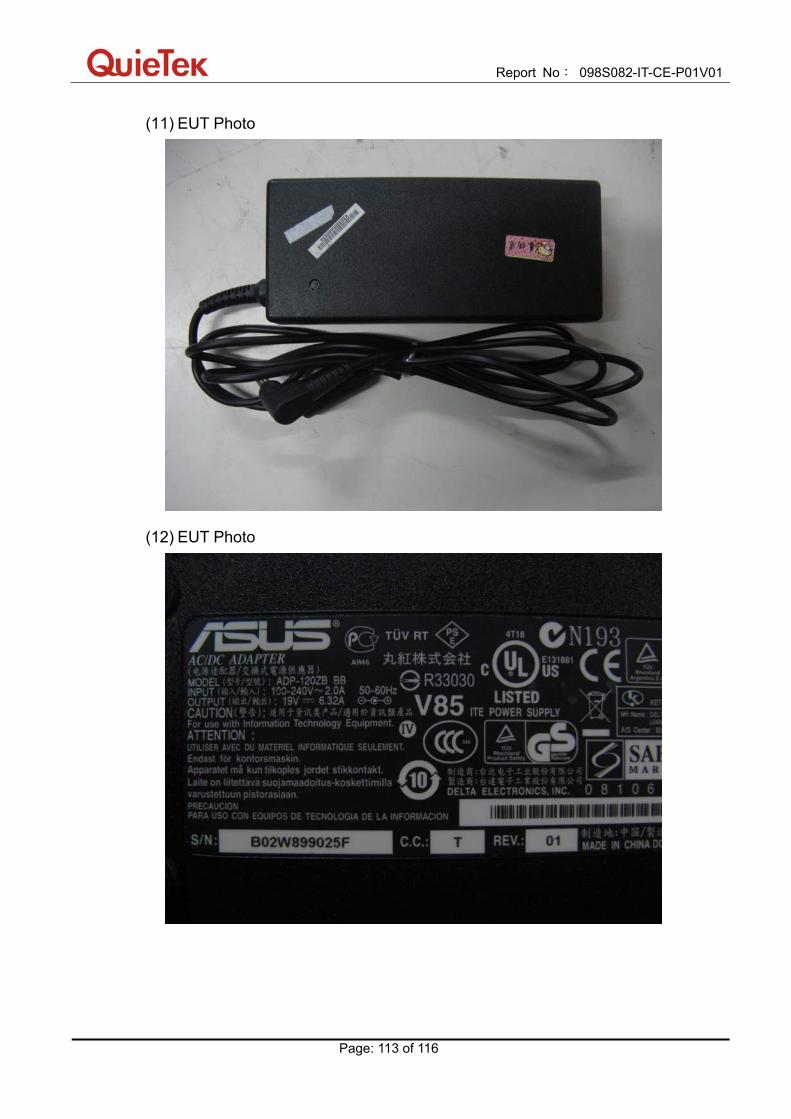
Report No: 098S082-IT-CE-P01V01
Page: 113 of 116
(11) EUT Photo
(12) EUT Photo

Report No: 098S082-IT-CE-P01V01
Page: 114 of 116
(13) EUT Photo
(14) EUT Photo
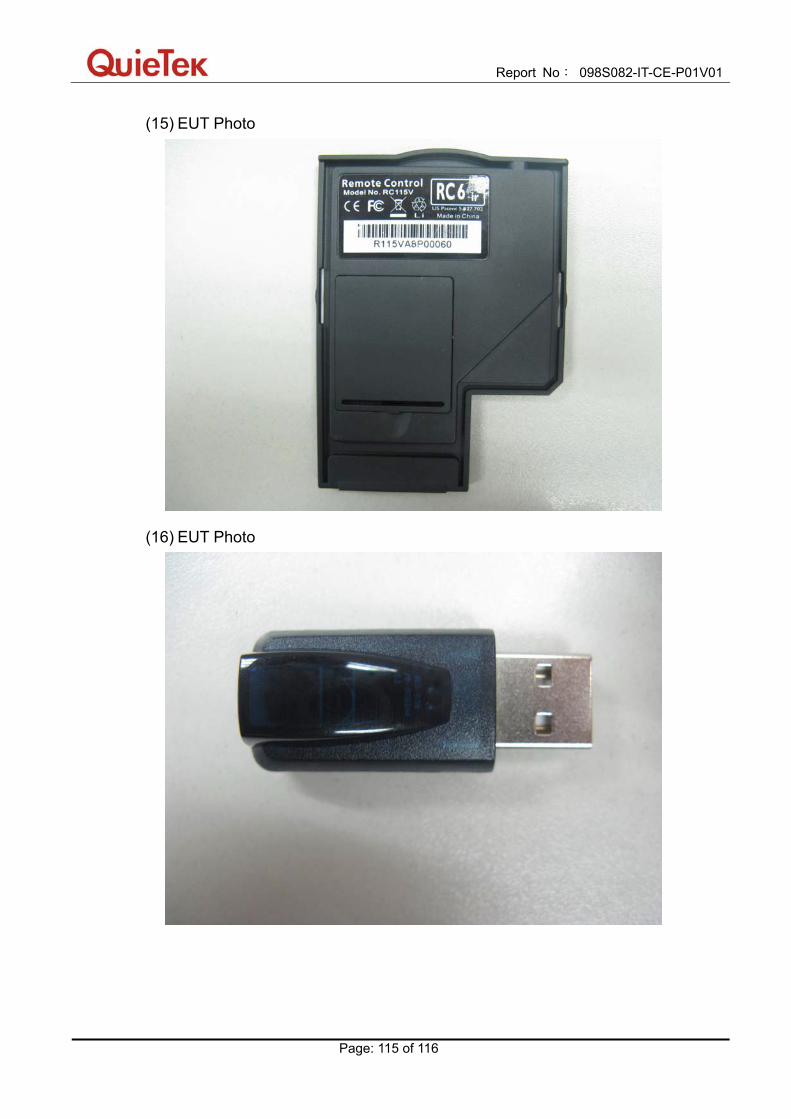
Report No: 098S082-IT-CE-P01V01
Page: 115 of 116
(15) EUT Photo
(16) EUT Photo

Report No: 098S082-IT-CE-P01V01
Page: 116 of 116
(17) EUT Photo