Embed Size (px)
Citation preview

78: 8–4 (2016) 9–18 | www.jurnalteknologi.utm.my | eISSN 2180–3722 |
Jurnal
Teknologi
Full Paper
IMPROVEMENT OF THERMAL COMFORT INSIDE
A MOSQUE BUILDING
Fawaz Ghaleb Noman, Nazri Kamsah, Haslinda Mohamed
Kamar*
Faculty of Mechanical Engineering, Universiti Teknologi
Malaysia, 81310 UTM Johor Bahru, Johor, Malaysia
Article history
Received
1 January 2016
Received in revised form
18 May 2016
Accepted
15 June 2016
*Corresponding author
Graphical abstract
(a)
(c)
Main prayer hall
(MPH)
Qib
la d
irecti
on
Minaret
Dome and roof
WindowsDoors
(d)
Stand fans
Wall fans
H=12m
l=35mW=30m
(b)
(e)
Abstract
A combined natural ventilation and mechanical fans are commonly used to cool
the interior space inside the mosques in Malaysia. This article presents a study on
thermal comfort in the Al-Jawahir Mosque, located in Johor Bahru, Malaysia. The
objective is to assess the thermal comfort inside the mosque under the present
ventilation system by determining the Predicted Mean Vote (PMV) and the
Predicted Percentage of Dissatisfied (PPD). These values were then compared to
the limits stated in the ASHRAE Standard-55. It was found that the PMV varies from
1.68 to 2.26 while the PPD varies from 61% to 87%. These show that the condition
inside the mosque is quite warm. Computational fluid dynamics (CFD) method was
used to carry out flow simulations, to identify a suitable strategy to improve the
thermal comfort inside the mosque. Results of CFD simulations show that installing
four exhaust fans above the windows on the west-side wall of the mosque is the
most effective strategy to improve the thermal comfort inside the mosque. Both
the PMV and PPD values can potentially be reduced by more than 60%.
Keywords: Mosque building; mechanical fan; space cooling; thermal comfort; hot
and humid environment
Abstrak
Kombinasi di antara pengudaraan nutral dan kipas mekanikal lazimnya
digunakan untuk menyejukkan ruang dalaman bagi masjid di Malaysia. Artikel ini
mengemukakan satu kajian ke atas keselesaan terma dalam Masjid Al-Jawahir
yang terletak di Johor Bahru, Malaysia. Objektif kajian adalah untuk menilai
keselesaan terma di dalam masjid tersebut di bawah sistem pengudaraan sedia
ada dengan menentukan indeks Predicted Mean Vote (PMV) dan Predicted
Percentage Dissatisfied (PPD). Nilai-nilai ini dibandingkan dengan limit yang
dinyatakan di dalam ASHRAE Standard-55. Didapati bahawa nilai PMV berada
dalam julat 1.68 hingga 2.26 manakala nilai PPD adalah dalam julat 61% hingga
87%. Ini menunjukkan bahawa keadaan di dalam masjid tersebut adalah agak
panas. Kaedah Computational Fluid Dynamics (CFD) telah digunakan untuk
melakukan simulasi aliran, untuk mengenal pasti strategi yang sesuai untuk
meningkatkan keselesaan terma di dalam masjid tersebut. Keputusan simulasi CFD
menunjukkan bahawa memasang empat kipas ekzos pada bahagian atas
tingkap di atas dinding sebelah barat bagi masjid adalah strategi paling berkesan
untuk meningkatkan keselesaan terma di dalam masjid tersebut. Nilai bagi kedua-
dua PMV dan PPD berpotensi untuk dikurangkan sebanyak lebih dari 60%.
Kata kunci: Bangunan masjid; kipas mekanikal; penyejukan ruang; keselesaan
terma; sekitaran lembab dan panas
© 2016 Penerbit UTM Press. All rights reserved
10 Fawaz Ghaleb, Nazri Kamsah & Haslinda Mohamed / Jurnal Teknologi (Sciences & Engineering) 78: 8–4 (2016) 9–18
1.0 INTRODUCTION
The high span spaces were constructed in many
places for various purposes. These spaces are also
known as enclosed ventilated air spaces and they
usually contain various air contaminants [1]. Large
space constructions such as mosques, sports halls and
open stadiums are distinguished from other high span
space constructions in terms of energy consumption.
These spaces possess issues that are related to indoor
air quality and thermal comfort [1-5]. A mosque is
considered as a special type of large space
construction, used by Muslims to perform their
congregational prayers and other communal religious
activities. Thermal comfort inside the mosque is,
therefore, an important requirement to ensure
adequate comfort to the occupants when performing
their activities. Unfortunately, this issue together with
aspect of indoor air quality inside mosque buildings
have not been comprehensively studied [2, 6-8].
In general, thermal comfort can affect
productivity, health and thermal satisfaction of the
occupants. According to the ASHRAE Standard-55 [9]
and Fanger [10], thermal comfort can be defined as
“that condition of mind which expresses satisfaction
with the thermal environment”. Based on Fanger [10]
thermal comfort is determined by evaluating six
governing parameters. Four of these parameters are
related to the environment while the other two are
related to the human occupants. The environmental
parameters are relative humidity (RH), air
temperature, (Ta), air flow velocity (Va) and mean
radiant temperature (Tmrt). The human parameters are
their clothing and activity levels.
Various indices have been developed to evaluate
the thermal comfort inside occupied spaces in
buildings. These are the Effective Temperature Index,
Equatorial Comfort index, Predicted Mean Vote
(PMV), Predicted Percentage Dissatisfied (PPD), and
Corrected Effective Temperature (CET) index [11].
However, most of these indices have limitations in their
applications under different climatic conditions. The
only exception is the Predicted Mean Vote (PMV) and
the Predicted Percentage Dissatisfied (PPD). They are
widely used to represent the thermal comfort in many
types of occupied spaces [2, 3, 12, 13]. The PMV is
defined as “an index that predicts the mean value of
the votes of a large group of a persons on the seven-
point thermal sensation scale” [14, 15].
Several thermal comfort studies carried out in
Malaysia, Singapore, Pakistan and Thailand showed
that to achieve good thermal comfort, the air
temperature has to be from 23.8°C to 28.6°C, the
airflow velocity from 0.3 m/s to 1.0 m/s and relative
humidity from 30% to 70%. Ibrahim [8] found that the
most suitable airflow velocity is in the range of 0.5 to
1.0 m/s, the relative humidity from 35% to 70% and air
temperature from 25°C to 28°C.
Previous thermal comfort studies in different types
of building at several places in Malaysia showed that
the use of new insulation materials that has very low
thermal conductivity for the roof construction can
significantly improve the thermal comfort inside the
mosque buildings [8]. Installing a solar chimney in the
terrace residential houses would also help improve the
thermal comfort [18]. Also, a good thermal comfort in
residential houses can be achieved with the air
temperature ranging from 25.5°C and 28.5°C [19].
This article presents findings of thermal comfort
study conducted on the Al-Jawahir mosque in Johor
Bahru, Malaysia. The goal is to evaluate the PMV and
PPD values under the presently used ventilation
system. Air temperature, airflow velocity, mean
radiant temperature, and air relative humidity were
measured in the months of October 2014 (warmest
month) and March 2015 (coldest month), from 11 AM
to 3 PM. Computational fluid dynamics (CFD) method
was then employed to predict the distributions of
airflow velocity and air temperature inside the
mosque. A parametric study was carried out to
identify the most effective modification to the
ventilation system that would improve the thermal
comfort inside the mosque.
2.0 METHODOLOGY
2.1 Description of the Mosque Building
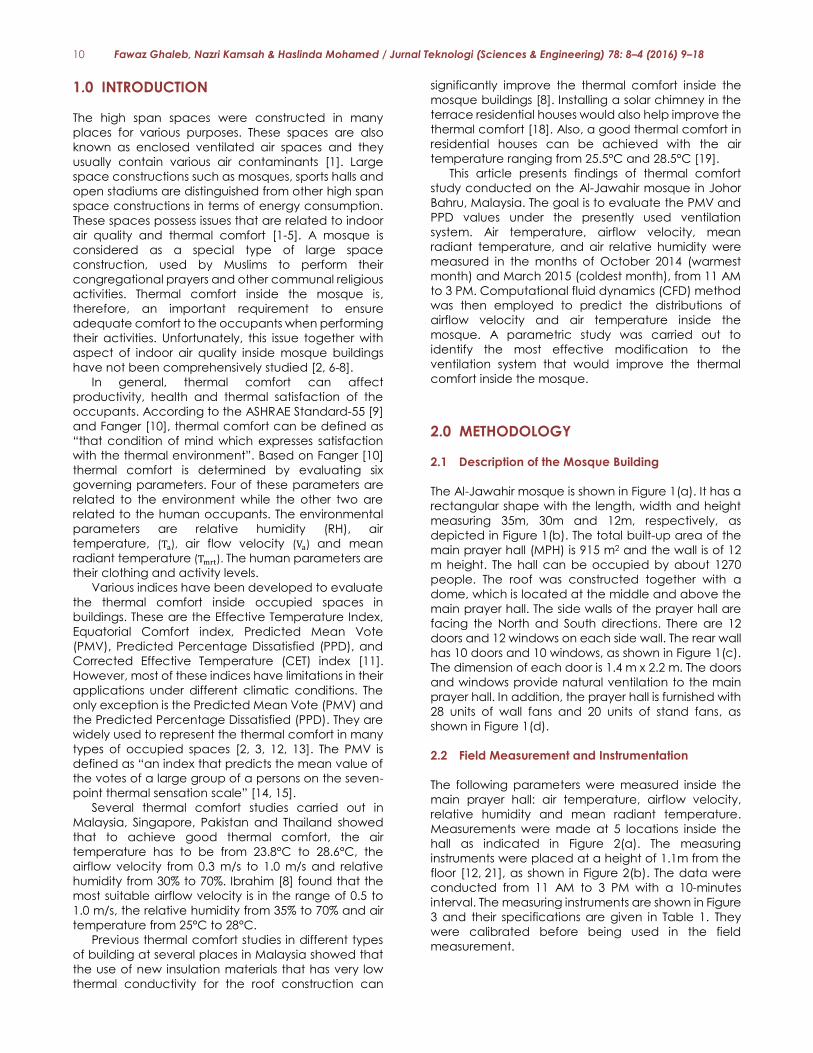
The Al-Jawahir mosque is shown in Figure 1(a). It has a
rectangular shape with the length, width and height
measuring 35m, 30m and 12m, respectively, as
depicted in Figure 1(b). The total built-up area of the
main prayer hall (MPH) is 915 m2 and the wall is of 12
m height. The hall can be occupied by about 1270
people. The roof was constructed together with a
dome, which is located at the middle and above the
main prayer hall. The side walls of the prayer hall are
facing the North and South directions. There are 12
doors and 12 windows on each side wall. The rear wall
has 10 doors and 10 windows, as shown in Figure 1(c).
The dimension of each door is 1.4 m x 2.2 m. The doors
and windows provide natural ventilation to the main
prayer hall. In addition, the prayer hall is furnished with
28 units of wall fans and 20 units of stand fans, as
shown in Figure 1(d).
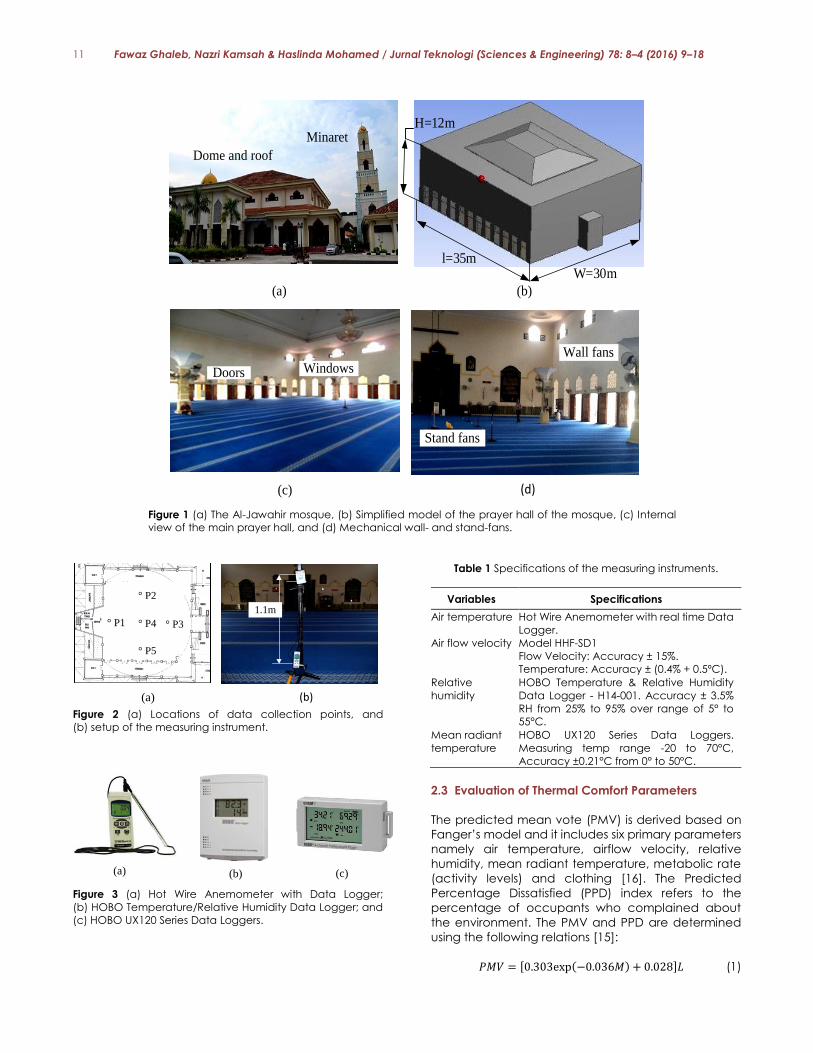
2.2 Field Measurement and Instrumentation
The following parameters were measured inside the
main prayer hall: air temperature, airflow velocity,
relative humidity and mean radiant temperature.
Measurements were made at 5 locations inside the
hall as indicated in Figure 2(a). The measuring
instruments were placed at a height of 1.1m from the
floor [12, 21], as shown in Figure 2(b). The data were
conducted from 11 AM to 3 PM with a 10-minutes
interval. The measuring instruments are shown in Figure
3 and their specifications are given in Table 1. They
were calibrated before being used in the field
measurement.
11 Fawaz Ghaleb, Nazri Kamsah & Haslinda Mohamed / Jurnal Teknologi (Sciences & Engineering) 78: 8–4 (2016) 9–18
(a)
(c)
Main prayer hall
(MPH)
Qib
la d
irecti
on
Minaret
Dome and roof
WindowsDoors
(d)
Stand fans
Wall fans
H=12m
l=35mW=30m
(b)
(e)
Figure 1 (a) The Al-Jawahir mosque, (b) Simplified model of the prayer hall of the mosque, (c) Internal
view of the main prayer hall, and (d) Mechanical wall- and stand-fans.
1.1m
° P1
° P2
° P3° P4
° P5
(b)(a)
Figure 2 (a) Locations of data collection points, and
(b) setup of the measuring instrument.
(a) (b) (c)
Figure 3 (a) Hot Wire Anemometer with Data Logger;
(b) HOBO Temperature/Relative Humidity Data Logger; and
(c) HOBO UX120 Series Data Loggers.
Table 1 Specifications of the measuring instruments.
Variables Specifications
Air temperature
Air flow velocity
Hot Wire Anemometer with real time Data
Logger.
Model HHF-SD1
Flow Velocity: Accuracy ± 15%.
Temperature: Accuracy ± (0.4% + 0.5ºC).
Relative
humidity
HOBO Temperature & Relative Humidity
Data Logger - H14-001. Accuracy ± 3.5%
RH from 25% to 95% over range of 5° to
55°C.
Mean radiant
temperature
HOBO UX120 Series Data Loggers.
Measuring temp range -20 to 70°C,
Accuracy ±0.21°C from 0° to 50°C.
2.3 Evaluation of Thermal Comfort Parameters
The predicted mean vote (PMV) is derived based on
Fanger’s model and it includes six primary parameters
namely air temperature, airflow velocity, relative
humidity, mean radiant temperature, metabolic rate
(activity levels) and clothing [16]. The Predicted
Percentage Dissatisfied (PPD) index refers to the
percentage of occupants who complained about
the environment. The PMV and PPD are determined
using the following relations [15]:
𝑃𝑀𝑉 = [0.303exp(−0.036𝑀) + 0.028]𝐿 (1)
12 Fawaz Ghaleb, Nazri Kamsah & Haslinda Mohamed / Jurnal Teknologi (Sciences & Engineering) 78: 8–4 (2016) 9–18
where 𝑀 is the metabolic rate (𝑊/𝑚2) and 𝐿 is the
thermal load on the body expressed as
𝐿= internal heat production – heat loss to the actual
environment
𝐿 = 𝑀 − 𝑊 − {3.96 × 10⁻⁸𝑓𝑐𝑙[(𝑇𝑐𝑙 + 273) × 4] + 𝑓𝑐𝑙ℎ𝑐(𝑇𝑐𝑙 − 𝑇) + [5733 − 6.99(𝑀 − 𝑊) − 𝑃𝑉] + 0.42(𝑀 −𝑊 − 58.15) + 1.7 × 10⁻⁵𝑀(5867 − 𝑃𝑉) + 0.0014𝑀(34 −𝑇)}
(2)
where 𝑊 stands for active work (𝑊/𝑚2) and 𝑓𝑐𝑙 is the
garment insulation factor (1𝑐𝑙𝑜= 0.155 𝑊/𝑚2)
expressed as
𝑓𝑐𝑙 = {1.05 + 0.645𝐼𝑐𝑙 for 𝐼𝑐𝑙 > 0.078 and
1 + 1.291𝐼𝑐𝑙 < 0.078} (3)
where 𝐼𝑐𝑙 clothing insulation (𝑚2𝐾/𝑤). The 𝑇𝑐𝑙 (°C)
refers to the cloth temperature given by
𝑇𝑐𝑙 = 35.7 − 0.028(𝑀 − 𝑊) − 𝐼𝑐𝑙 (4)
In Eqs. (2) and (4), 𝑇𝑟(°C) is the mean radiant
temperature, 𝑇(°C) is the local air temperature and ℎ𝑐
is the heat transfer coefficient between the clothing
and the surrounding air (𝑊/𝑚2𝐾). The heat-transfer
coefficient given by
ℎ𝑐 = 12.1𝑢0.5 for 2.38(𝑇𝑐𝑙 − 𝑇)0.25 < 12.1 (5)
where 𝑢 is the local air flow velocity (m/s).
The predicted percentage of dissatisfied index
(PPD) represents the percentage of the people who
felt more than slightly warm or slightly cold [17]. It is
used to assess the thermal comfort satisfaction of the
occupants. The value of PPD should be less than 10%
[9]. It is calculated using Eqn. (6) as follows [15]
𝑃𝑃𝐷 = 100 − exp[−0.03353𝑃𝑀𝑉4 + 0.271𝑃𝑀𝑉2] (6)
2.4 Computational Fluid Dynamic Simulation
A computational fluid dynamic (CFD) method was
employed to carry out flow simulations to predict the
airflow velocity and air temperature distribution inside
the main prayer hall of the mosque. The method was
also used to carry out a parametric study to identify a
suitable strategy for improving the thermal comfort
inside the main prayer hall. FLUENT software was used
to develop a simplified three-dimensional model of
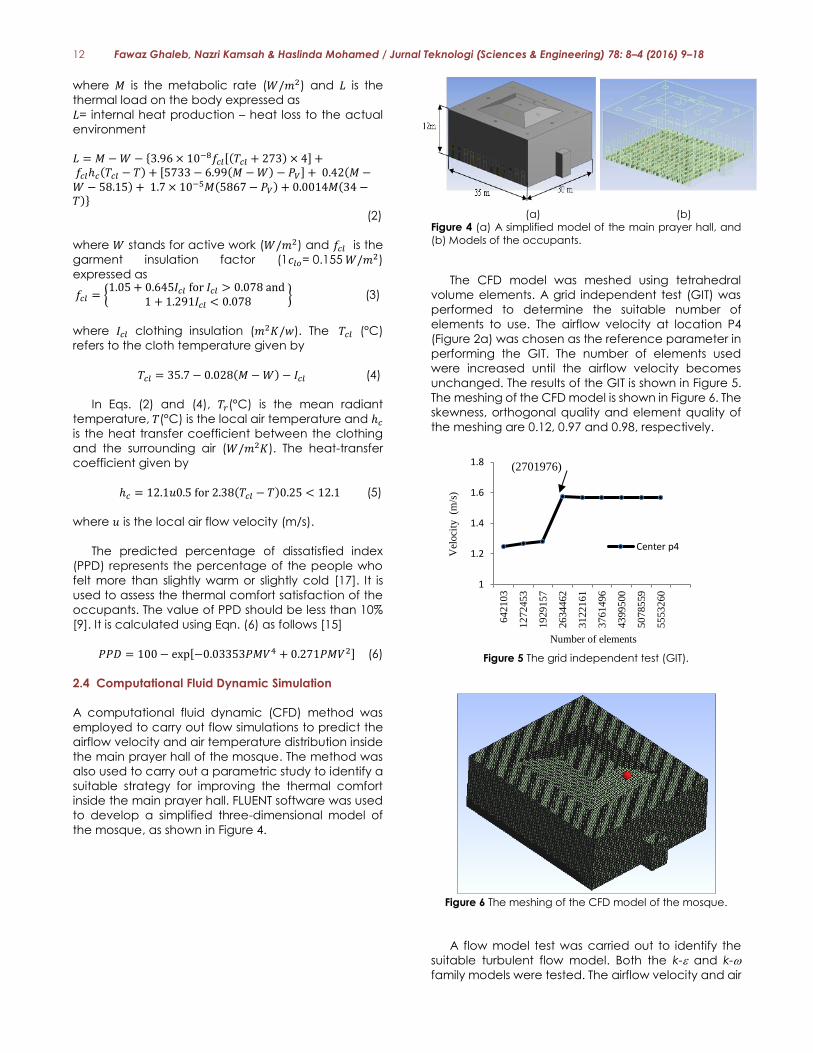
the mosque, as shown in Figure 4.
(a) (b)
Figure 4 (a) A simplified model of the main prayer hall, and
(b) Models of the occupants.
The CFD model was meshed using tetrahedral
volume elements. A grid independent test (GIT) was
performed to determine the suitable number of
elements to use. The airflow velocity at location P4
(Figure 2a) was chosen as the reference parameter in
performing the GIT. The number of elements used
were increased until the airflow velocity becomes
unchanged. The results of the GIT is shown in Figure 5.
The meshing of the CFD model is shown in Figure 6. The
skewness, orthogonal quality and element quality of
the meshing are 0.12, 0.97 and 0.98, respectively.
Figure 5 The grid independent test (GIT).
Figure 6 The meshing of the CFD model of the mosque.
A flow model test was carried out to identify the
suitable turbulent flow model. Both the k- and k-
family models were tested. The airflow velocity and air
1
1.2
1.4
1.6
1.8
64
210
3
12
724
53
19
291
57
26
344
62
31
221
61
37
614
96
43
995
00
50
785
59
55
532
60
Vel
oci
ty
(m/s
)
Number of elements
(2701976)
Center p4

13 Fawaz Ghaleb, Nazri Kamsah & Haslinda Mohamed / Jurnal Teknologi (Sciences & Engineering) 78: 8–4 (2016) 9–18
temperature at point P4 (Figure 2a) were chosen as
the reference parameters. The results of the flow
simulations using the Standard k-, RNG k-, Realizable
k- and Standard k- are compared with the
measured parameters at the same point. The
comparison is shown in Figure 7. It was found that the
standard k-ω flow model produces the smallest
differences in both the airflow velocity and air
temperature. Hence this model was chosen for the
proceeding flow simulations.
Figure 7 Comparison of (a) Airflow velocity, and (b) air
temperature for various turbulent flow models with the
corresponding measured values.
The properties of the air and solid boundaries for
the CFD model are given in Table 2. The air was
assumed to behave as an ideal gas and its properties
remain unchanged with temperature.
Table 2 Properties of the medium for CFD analysis.
Properties Air Concrete Human
body
Density, (m3/kg) 1.16 2400 985
Specific heat
(J/kg K) 1007.30 0.75 3500
Thermal
conductivity
(W/m K)
0.0265 0.9 0.8
Viscosity (kg/m s) 1.88 x 10⁻⁵ - -
Boundary conditions were prescribed on the CFD
model for the airflow simulations. Inlet airflow velocity
and temperature were prescribed at the doors at the
back and right side of the prayer hall. Mean radiant
temperatures were specified at all the walls of the hall.
Body temperature, metabolic rate and heat flux were
specified on the models of the human body. Finally,
airflow velocity was prescribed at all the exhaust fans.
Details of the boundary conditions are given in Table
3. The magnitudes of the airflow velocity, air
temperature, and mean radiant temperatures of the
walls were obtained from the field measurement. The
values of parameters for the human body were based
on the ASHRAE Standard-55 [14, 21]. The relative
humidity of the air was taken as constant at 75%.
Table 3 Boundary conditions for the CFD simulations.
Section Boundary
condition Parameters
Right door Inlet airflow
velocity &
temperature
Va = 0.5 m/s
Ta = 31.2ºC
Back door Va = 0.3 m/s
Ta = 31.2ºC
Walls
Dome
Temperature
Td = 34.4ºC
Ceiling Tc = 31.8ºC
Front Tw, front =
28.8ºC
Rear Tw, rear =
29.5ºC
Right Tw,R = 29ºC
Left Tw,L = 29.2ºC
Mehrab Tw,M = 29.4ºC
Floor TF = 28ºC
Human body
Temperature Tbody = 31.2ºC
Metabolic rate M = 150 W
Heat flux 60 W/m2
Exhaust fan Airflow velocity Vfan = 28 m/s
Flow simulations were performed in steady-state
condition using a pressure-based segregated solver, a
semi-implicit method, and with a second order
upwind discretization scheme. The convergence
criterion used for all equations was 10-4 except for the
energy equation, in which the convergence criterion
was taken as 10-6, based on Hussin [12].
The validation of the CFD model was carried out
by comparing the values of air temperature and
airflow velocity obtained from the field measurement
at all the measuring points (Figure 2a), with the
respective values obtained from the flow simulation.
The comparison is shown in Table 4 and Table 5,
respectively. It was found that percentage
differences of predicted data of airflow velocity are
below 20% while those for the air temperature are
below 5%. Based on the ASHRAE Standard-55 [14, 21],
a 20% difference between predicted and measured
data is considered acceptable for flow analysis
involving a complex geometry.
6 Fawaz Ghaleb, Nazri Kamsah, Haslinda Mohamed Kamar and Adeb Qaid Ahmed/Jurnal Teknologi (Sciences & Engineering)
Figure 6 The meshing of the CFD model of the mosque.
A flow model test was carried out to identify the
most suitable turbulent flow model to use to simulate
the airflow inside the main prayer hall. Both the k-e and
k-w turbulent flow family models were tested. The
airflow velocity at and air temperature at point P4
(Figure 2a) were chosen as the reference parameters.
The results of CFD simulations using the Standard k-e,
RNG k-e, Realizable k-e and Standard k-w are then
compared with the measured values of airflow
velocity and air temperature, at the same point. The
comparison is shown in Figure 7. It was found that the
standard k-ω flow model produces the smallest
differences in both the airflow velocity and air
temperature. Hence this model was chosen for the
proceeding flow simulations.
(a)
(b)
Figure 7 Comparison of (a) Airflow velocity, and (b) air
temperature for various turbulent flow models with the
corresponding measured values.
The properties of the air and solid boundaries for
the CFD model are given in Table 3. The air was
assumed to behave as an ideal gas and its properties
remain unchanged with temperature.
Table 3 Properties of the medium for CFD analysis.
Boundary conditions were prescribed on the CFD
model of the mosque for the airflow simulations. Inlet
airflow velocity and temperature were prescribed at
the doors at the back and right side of the prayer hall.
Mean radiant temperatures were specified at all the
walls of the hall. Body temperature, metabolic rate
and heat flux were specified on the models of the
human body. Finally, for the parametric analysis,
airflow velocity was prescribed at all the exhaust fans.
The details of these boundary conditions are given in
Table 4. The magnitudes of the airflow velocity, air
temperature, and mean radiant temperatures of the
walls were obtained from the field measurement. The
values of parameters for the human body were based
on the ASHRAE Standard-55 [14, 21]. Outside air enters
the main prayer hall through the windows and doors
on the right-side and leaves through the windows and
doors on the left-side wall. The relative humidity of the
air was taken as constant at 75%.
Table 4 Boundary conditions for the CFD simulations.
§ Predicted
§ Measured
§ Measured
§ Predicted

14 Fawaz Ghaleb, Nazri Kamsah & Haslinda Mohamed / Jurnal Teknologi (Sciences & Engineering) 78: 8–4 (2016) 9–18
Table 4 Comparison of predicted and measured airflow
velocity
Location Predicted Measured % Difference
P1 0.69 0.84 17
P3 0.83 0.71 16
P4 0.14 0.13 6
P5 1.49 1.37 8
Table 5 Comparison of predicted and measured air
temperature
Location Predicted Measured % Difference
P1 31.1 31.0 3
P3 30.9 31.0 1
P4 31.3 31.4 3
P5 31.2 31.2 0
Thermal comfort inside a confined space can be
improved by improving the ventilation system [24]. An
effective ventilation system is one which produces an
even distribution and suitable airflow velocity
magnitude inside the space. This will in turn lower the
air temperature and improves its distribution inside the
space. One method to improve the ventilation system
is by installing ventilation fans on the walls. This
approach was chosen in this study as it is easy to
implement and does not consume high electrical
energy. Three cases of exhaust fans installation were
considered. These are illustrated in Figure 8.
Figure 8 Cases of exhaust fans installation for improving
thermal comfort: (a) four exhaust fans installed on the west-
side wall, (b) five exhaust fans installed at the roof, and (c)
five exhaust fans installed at the ceiling.
The airflow velocity at the exhaust fans was
determined based on the air change per hour (ACH)
for the main prayer hall. This represents the number of
times the air inside the prayer hall is to be replaced
with the fresh outside air, in one-hour. The volume of
the main prayer hall is 12600 m3. For a space of this
size, the ASHRAE Standard-55 [14, 21] specifies an ACH
value in the range of 8-12 per hour. To be
conservative, the ACH value of 8 was chosen in this
study. Based on this value, the volume flow rate of the
air (m3/s) to be exhausted from the main prayer hall
can be obtained using Eqn. (7) as follows:
𝑉 =ACH
3600× 𝑉 =
8
3600× 12600 = 28
m3
s (7)
The exhaust fans available in the market have
many sizes (diameters). In this study, the exhaust fans
with a diameter, D of 56 cm was chosen because
these fans will fit well into the wall and roof sections of
the prayer hall envelope, as shown in Figure 8. The
cross-sectional area for each fan is described in Eqn.
(8):
Ac,fan =𝜋
4× D2 =
𝜋
4× 0.562 = 0.25m2 (8)
For case 1, with four exhaust fans, the total area for the
airflow path is 1.0 m2 while for cases 2 and 3, the total
is 1.25 m2. The airflow velocity at each exhaust fan for
case 1 would then be as in Eqn. (9)
Vairflow=V
Ac,fan=
28
1
m
s (9)
When five fans are used, the corresponding value of
the airflow velocity is 22.4 m/s.
Flow simulations were carried out on the CFD
models for the three cases of ventilation modification
shown in Figure 8. The goal was to obtain the
distributions of airflow velocity and air temperature
inside the main prayer hall, for all the cases, and
compare them with the corresponding distributions for
the base case. The average values of airflow velocities
and air temperatures obtained from the flow
simulations were used to compute the new values of
PMV and PPD. These values were then compared to
the corresponding values for the base case, to
evaluate the effectiveness of the proposed ventilation
modifications.
3.0 RESULTS AND DISCUSSION
The PMV values corresponding to the present
ventilation system (base case) were determined
based on the average values of the air temperature,
airflow velocity, mean radiant temperature, relative
humidity, metabolic rate of the occupants and
clothing thermal resistance, using Eqs. (1) - (4). Values
of the metabolic rate and clothing thermal resistance
were taken from the ASHRAE Standard-55 [14, 21] as
1.2 W/m2 0.55 m2K/W, respectively. The values of PMV
and PPD in the middle-, west-, east-, north- and south-
region of the main prayer hall under the present
ventilation system (i.e. the base case) are tabulated
in Table 6.

15 Fawaz Ghaleb, Nazri Kamsah & Haslinda Mohamed / Jurnal Teknologi (Sciences & Engineering) 78: 8–4 (2016) 9–18
Table 6 The values of PMV and PPD in regions of the main
prayer hall under the present ventilation (base case).
Indices Regions of the prayer hall
Middle West East North South
PMV 2.26 1.68 2.04 2.16 1.95
PPD (%) 87 61 79 83 75
It can be seen from the table that the PMV values in
the middle-, east- and north-region of the main prayer
hall are higher than 2.0, while for the west- and south-
region, the PMV values are 1.68 and 1.95, respectively.
These are well above the comfort range specified by
the ASHRAE Standard-55 [14, 21], which is between +1
(warm) and -1 (cool). These finding indicates that the
thermal comfort inside the main prayer hall is very
warm and uncomfortable for the occupants.
Figure 9 shows the comparative plots of average
airflow velocity in the east-, middle- and west-zone on
a vertical symmetrical plane that runs (east-to-west)
across the main prayer hall, obtained from the flow
simulations. The average airflow velocities for all the
proposed ventilation modifications are compared
with the corresponding values for the base case. It
can be seen that the highest increments in the
average airflow velocity in all the three zones are
obtained when four exhaust fans are installed on the
west-side wall of the main prayer hall. The average
airflow velocity increases by about 0.78 m/s, 0.54 m/s
and 1.03 m/s in the east-, middle- and west-zone
respectively, compared to the corresponding values
for the base case.
Figure 9 Plots of average airflow velocity in the east-, middle-
and west-zone on a vertical (east-to-west) symmetrical
plane.
Figure 10 Plots of average air temperature in the east-,
middle- and west-zone on a vertical (east-to-west)
symmetrical plane.
The comparative plots for the average air
temperature in the three zones on the same plane are
illustrated in Figure 10. It can be observed from this
figure that the average air temperature in the east-,
middle- and west-zone of the plane drops by about
3°C, 4°C and 3°C, respectively when compared to the
corresponding values for the base case. These findings
can be considered as significant as reduction in both
the airflow velocity and the air temperature would
lead to the improvement in thermal comfort inside the
main prayer hall.
Figure 11 shows the comparative plots of average
airflow velocity in the north-, middle- and south-zone
on a vertical symmetrical plane that runs (north-to-
south) across the main prayer hall, obtained from the
flow simulations. The average airflow velocities for all
the proposed ventilation modifications are compared
with the corresponding values for the base case.
Figure 11 Plots of average airflow velocity in the north-,
middle- and south-zone on a vertical (north-to-south)
symmetrical plane.

16 Fawaz Ghaleb, Nazri Kamsah & Haslinda Mohamed / Jurnal Teknologi (Sciences & Engineering) 78: 8–4 (2016) 9–18
Figure 12 Plots of average air temperature in the north-,
middle- and south-zone on a vertical (north-to-south)
symmetrical plane.
It can be observed Figure 11 that the highest
increments in the average airflow velocity in the three
zones occur with the proposed ventilation
modification of case 1, i.e. when four exhaust fans are
installed on the west-side wall of the prayer hall. The
average airflow velocity increases by about 0.63 m/s,
0.55 m/s and 0.51 m/s in the north-, middle- and south-
zone, respectively, compared to the corresponding
values for the base case. The comparative plots for
the average air temperature in the three zones on the
same plane are illustrated in Figure 12. It can be seen
that the average air temperature in the north-,
middle- and south-zone drops by about 3°C, 4°C and
3°C, respectively when compared to the
corresponding values for the base case.
A comparison of the PMV values in the middle-,
west-, east-, north- and south-region of the main
prayer hall of the mosque, between the base case
and all cases of the proposed ventilation modification
is given in Table 7. It can clearly be seen from the table
that the proposed modification of case 1, i.e. installing
four exhaust fans on the west-side wall of the prayer
hall, results in the greatest reductions in the PMV
values in all the regions, compared with the other two
proposed modification cases. It is observed that the
PMV values are reduced by 67.7%, 63.7%, 69.1%, 67.6%
and 59.5% in the middle-, west-, east-, north- and
south-region of the prayer hall, respectively. The
corresponding comparative plots of the PMV values
are shown in Figure 13.
Table 7 Comparison of PMV values for all cases of ventilation
modification with the base case values.
Case* PMV
Middle West East North South
Base 2.26 1.68 2.04 2.16 1.95
Case 1 0.73 0.61 0.63 0.70 0.79
Case 2 1.27 0.92 0.77 1.27 1.29
Case 3 1.24 0.90 0.91 1.43 1.31
*Case 1: Four exhaust fans installed on the west-side wall; Case 2: Five
exhaust fans on the dome; Case 3: Five exhaust fans at the ceiling.
Table 8 Comparison of PPD values for all cases of ventilation
modification with the base case values.
Case* PPD (%)
Middle West East North South
Base 87 61 79 83 75
Case 1 16 13 13 15 14
Case 2 39 23 17 39 40
Case 3 37 22 22 47 41
*Case 1: Four exhaust fans installed on the west-side wall; Case 2: Five
exhaust fans on the dome; Case 3: Five exhaust fans at the ceiling.
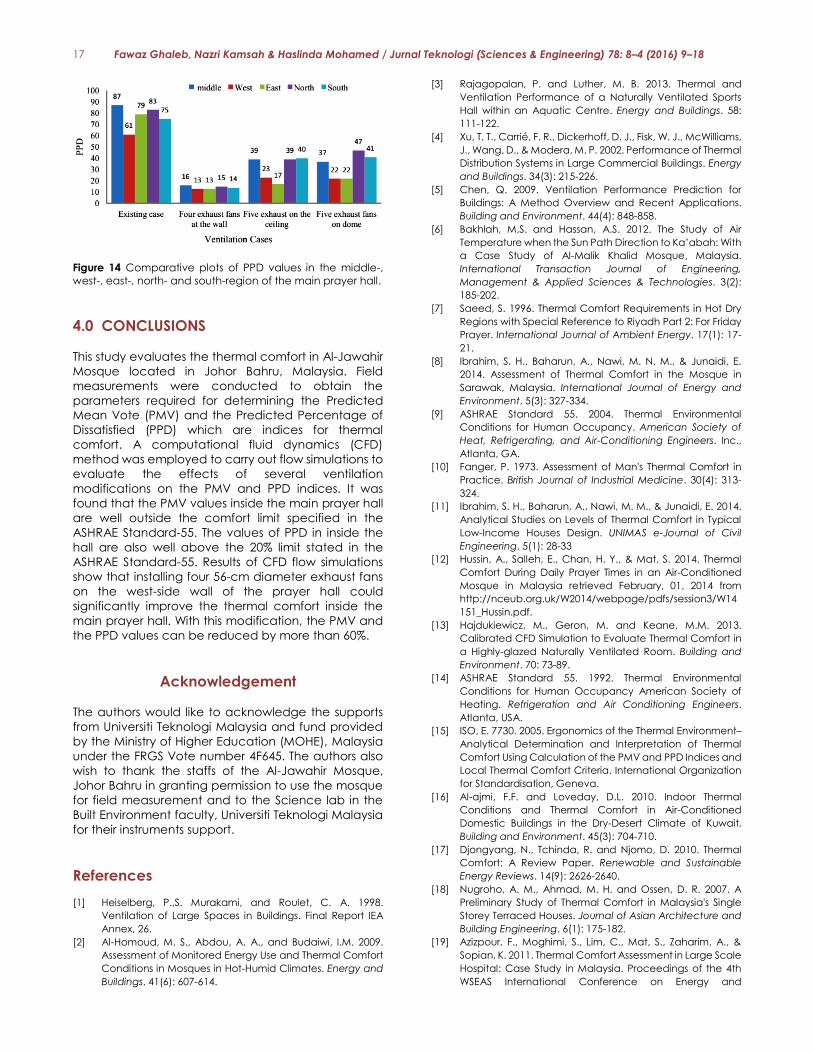
A comparison of the PPD values in the middle-,
west-, east-, north- and south-region of the main
prayer hall of the mosque, between the base case
and all cases of the proposed ventilation modification
is given in Table 8. The PPD values for the middle-, west-
, east-, north-, and south-region of the hall are 87%,
61%, 79%, 83% and 75%, respectively. With the
proposed ventilation modification of case 1, the PPD
values are reduced by 71%, 48%, 66%, 68% and 61% in
the middle-, west-, east-, north- and south-region of
the hall, respectively. The PPD is related to the PMV as
given in Eq. (5). The ASHRAE Standard-55 [14, 21]
specifies that for a good thermal comfort, the PPD
value should be less than 20%. With proposed
modification case 1, the PPD value in all the regions
are reduced to well below the 20%. Therefore, the
above finding is considered as a very significant
improvement in the thermal comfort inside the main
prayer hall. The corresponding comparative plots of
the PPD values are shown in Figure 14.
Figure 13 Comparative plots of PMV values in the middle-,
west-, east-, north- and south-region of the main prayer hall.
17 Fawaz Ghaleb, Nazri Kamsah & Haslinda Mohamed / Jurnal Teknologi (Sciences & Engineering) 78: 8–4 (2016) 9–18
Figure 14 Comparative plots of PPD values in the middle-,
west-, east-, north- and south-region of the main prayer hall.
4.0 CONCLUSIONS
This study evaluates the thermal comfort in Al-Jawahir
Mosque located in Johor Bahru, Malaysia. Field
measurements were conducted to obtain the
parameters required for determining the Predicted
Mean Vote (PMV) and the Predicted Percentage of
Dissatisfied (PPD) which are indices for thermal
comfort. A computational fluid dynamics (CFD)
method was employed to carry out flow simulations to
evaluate the effects of several ventilation
modifications on the PMV and PPD indices. It was
found that the PMV values inside the main prayer hall
are well outside the comfort limit specified in the
ASHRAE Standard-55. The values of PPD in inside the
hall are also well above the 20% limit stated in the
ASHRAE Standard-55. Results of CFD flow simulations
show that installing four 56-cm diameter exhaust fans
on the west-side wall of the prayer hall could
significantly improve the thermal comfort inside the
main prayer hall. With this modification, the PMV and
the PPD values can be reduced by more than 60%.
Acknowledgement
The authors would like to acknowledge the supports
from Universiti Teknologi Malaysia and fund provided
by the Ministry of Higher Education (MOHE), Malaysia
under the FRGS Vote number 4F645. The authors also
wish to thank the staffs of the Al-Jawahir Mosque,
Johor Bahru in granting permission to use the mosque
for field measurement and to the Science lab in the
Built Environment faculty, Universiti Teknologi Malaysia
for their instruments support.
References
[1] Heiselberg, P.,S. Murakami, and Roulet, C. A. 1998.
Ventilation of Large Spaces in Buildings. Final Report IEA
Annex, 26.
[2] Al-Homoud, M. S., Abdou, A. A., and Budaiwi, I.M. 2009.
Assessment of Monitored Energy Use and Thermal Comfort
Conditions in Mosques in Hot-Humid Climates. Energy and
Buildings. 41(6): 607-614.
[3] Rajagopalan, P. and Luther, M. B. 2013. Thermal and
Ventilation Performance of a Naturally Ventilated Sports
Hall within an Aquatic Centre. Energy and Buildings. 58:
111-122.
[4] Xu, T. T., Carrié, F. R., Dickerhoff, D. J., Fisk, W. J., McWilliams,
J., Wang, D., & Modera, M. P. 2002. Performance of Thermal
Distribution Systems in Large Commercial Buildings. Energy
and Buildings. 34(3): 215-226.
[5] Chen, Q. 2009. Ventilation Performance Prediction for
Buildings: A Method Overview and Recent Applications.
Building and Environment. 44(4): 848-858.
[6] Bakhlah, M.S. and Hassan, A.S. 2012. The Study of Air
Temperature when the Sun Path Direction to Ka’abah: With
a Case Study of Al-Malik Khalid Mosque, Malaysia.
International Transaction Journal of Engineering,
Management & Applied Sciences & Technologies. 3(2):
185-202.
[7] Saeed, S. 1996. Thermal Comfort Requirements in Hot Dry
Regions with Special Reference to Riyadh Part 2: For Friday
Prayer. International Journal of Ambient Energy. 17(1): 17-
21.
[8] Ibrahim, S. H., Baharun, A., Nawi, M. N. M., & Junaidi, E.
2014. Assessment of Thermal Comfort in the Mosque in
Sarawak, Malaysia. International Journal of Energy and
Environment. 5(3): 327-334.
[9] ASHRAE Standard 55. 2004. Thermal Environmental
Conditions for Human Occupancy. American Society of
Heat, Refrigerating, and Air-Conditioning Engineers. Inc.,
Atlanta, GA.
[10] Fanger, P. 1973. Assessment of Man's Thermal Comfort in
Practice. British Journal of Industrial Medicine. 30(4): 313-
324.
[11] Ibrahim, S. H., Baharun, A., Nawi, M. M., & Junaidi, E. 2014.
Analytical Studies on Levels of Thermal Comfort in Typical
Low-Income Houses Design. UNIMAS e-Journal of Civil
Engineering. 5(1): 28-33
[12] Hussin, A., Salleh, E., Chan, H. Y., & Mat, S. 2014. Thermal
Comfort During Daily Prayer Times in an Air-Conditioned
Mosque in Malaysia retrieved February, 01, 2014 from
http://nceub.org.uk/W2014/webpage/pdfs/session3/W14
151_Hussin.pdf.
[13] Hajdukiewicz, M., Geron, M. and Keane, M.M. 2013.
Calibrated CFD Simulation to Evaluate Thermal Comfort in
a Highly-glazed Naturally Ventilated Room. Building and
Environment. 70: 73-89.
[14] ASHRAE Standard 55. 1992. Thermal Environmental
Conditions for Human Occupancy American Society of
Heating. Refrigeration and Air Conditioning Engineers.
Atlanta, USA.
[15] ISO, E. 7730. 2005. Ergonomics of the Thermal Environment–
Analytical Determination and Interpretation of Thermal
Comfort Using Calculation of the PMV and PPD Indices and
Local Thermal Comfort Criteria. International Organization
for Standardisation, Geneva.
[16] Al-ajmi, F.F. and Loveday, D.L. 2010. Indoor Thermal
Conditions and Thermal Comfort in Air-Conditioned
Domestic Buildings in the Dry-Desert Climate of Kuwait.
Building and Environment. 45(3): 704-710.
[17] Djongyang, N., Tchinda, R. and Njomo, D. 2010. Thermal
Comfort: A Review Paper. Renewable and Sustainable
Energy Reviews. 14(9): 2626-2640.
[18] Nugroho, A. M., Ahmad, M. H. and Ossen, D. R. 2007. A
Preliminary Study of Thermal Comfort in Malaysia's Single
Storey Terraced Houses. Journal of Asian Architecture and
Building Engineering. 6(1): 175-182.
[19] Azizpour, F., Moghimi, S., Lim, C., Mat, S., Zaharim, A., &
Sopian, K. 2011. Thermal Comfort Assessment in Large Scale
Hospital: Case Study in Malaysia. Proceedings of the 4th
WSEAS International Conference on Energy and

18 Fawaz Ghaleb, Nazri Kamsah & Haslinda Mohamed / Jurnal Teknologi (Sciences & Engineering) 78: 8–4 (2016) 9–18
Development-Environment-Biomedicine. World Scientific
and Engineering Academy and Society (WSEAS), 2011,
July.
[20] Rahman, A.M.A. 1995. Housing Design in Relation to
Environmental Comfort: A Comparison of the Traditional
Malay House and Modern Housing Including Work in the
Tripartite Programme between Universiti Sains Malaysia,
The Welsh School of Architecture and the UK Building
Research Establishment. Building Research and
Information. 23(1): 49-54.
[21] ASHRAE Standard, 55. 2013. Thermal Environmental
Conditions for Human Occupancy. ASHRAE. Atlanta, USA.
[22] Szokolay, S. 1990. Design and Research Issues: Passive
Control in The Tropic. Proceedings First World Renewable
Energy Congress.
[23] Handbook, A. F. 2009. American Society of Heating,
Refrigerating and Air-conditioning Engineers. Inc.: Atlanta,
GA, USA.
[24] Zomorodian, Z. S., Tahsildoost, M., and Hafezi, M. 2016.
Thermal Comfort in Educational Buildings: A Review
Article. Renewable and Sustainable Energy
Reviews. 59: 895-906.