Embed Size (px)
Citation preview
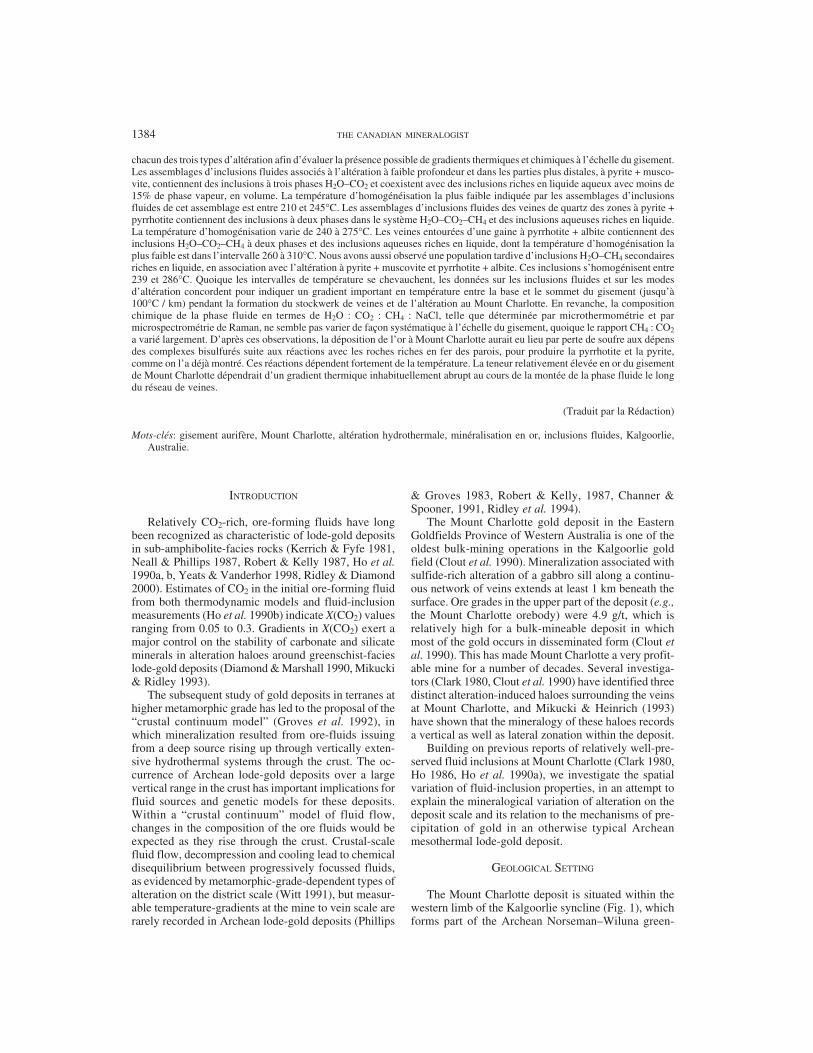
1383
The Canadian MineralogistVol. 42, pp. 1383-1403 (2004)
TEMPERATURE GRADIENTS RECORDED BY FLUID INCLUSIONSAND HYDROTHERMAL ALTERATION AT THE MOUNT CHARLOTTE GOLD DEPOSIT,
KALGOORLIE, AUSTRALIA
TERRENCE P. MERNAGH§
Geoscience Australia, GPO Box 378, Canberra, ACT 2601, Australia
CHRISTOPH A. HEINRICH
Swiss Federal Institute of Technology, ETH Zürich, Isotope Geology and Mineral Resources,ETH Zentrum, NO CH-8092 Zürich, Switzerland
EDWARD J. MIKUCKI
2285 Coolgardie Street, Mundaring, WA 6073, Australia
ABSTRACT
The Mount Charlotte gold deposit, Kalgoorlie, Australia, comprises a series of steeply plunging orebodies in which a networkof conjugate quartz veins are surrounded by sulfide-rich alteration haloes that host most of the gold. There are three mineralogicallydistinct types of alteration halo, which are systematically distributed on the orebody scale, with pyrite-rich haloes at the top andin the periphery of the deposit, and pyrrhotite-rich alteration at depth and in the center of the fluid-upflow zones. Fluid inclusionsin the main-stage quartz from veins within each of the three alteration assemblages have been analyzed to determine possiblethermal and chemical trends on the scale of the deposit. Fluid-inclusion assemblages associated with the shallow and more distalpyrite–muscovite alteration contain three-phase H2O–CO2 inclusions and coexisting liquid-rich, aqueous inclusions with lessthan 15 vol.% vapor. The lowest-temperature Fluid Inclusion Assemblages (FIAs) from this alteration assemblage homogenizebetween 210 and 245°C. FIAs in quartz veins in pyrite–pyrrhotite alteration contain two-phase H2O–CO2–CH4 inclusions andliquid-rich, aqueous inclusions. The lowest-temperature FIAs in this assemblage homogenize between 240 and 275°C. Veins inpyrrhotite–albite alteration contain two-phase H2O–CO2–CH4 inclusions and liquid-rich, aqueous inclusions, with the lowest-temperature FIAs homogenizing from 260 to 310°C. A late, secondary population of liquid-rich H2O–CH4 inclusions was alsoobserved in veins associated with pyrite–muscovite and pyrrhotite–albite alteration. These inclusions homogenize between 239and 286°C. Although the temperature ranges overlap, the fluid-inclusion data and alteration data consistently indicate a signifi-cant gradient in temperature between the base and the top of the deposit (up to 100°C / km) during vein stockwork formation andalteration at Mount Charlotte. In contrast, the chemical composition of the fluids in terms of H2O : CO2 : CH4 : NaCl, as deter-mined by microthermometry and Raman-microprobe analyses, do not vary in a systematic manner on the deposit scale, althoughthe CH4 : CO2 ratio varied across a large range. These observations indicate that gold deposition at Mount Charlotte occurred bydesulfidation of bisulfide complexes due to reaction with Fe-rich wallrocks to form pyrrhotite and pyrite, as previously suggested.These reactions are strongly temperature-dependent. The relatively high grade of gold in the Mount Charlotte orebody can beexplained by the unusually steep temperature-gradient along the fluid-flow path through the vein network.
Keywords: gold deposit, Mount Charlotte, hydrothermal alteration, gold mineralization, fluid inclusions, Kalgoorlie, Australia.
SOMMAIRE
Le gisement aurifère de Mount Charlotte, à Kalgoorlie, en Australie, est fait d’une série de zones minéralisées à fort pendage,dans lesquelles des veines de quartz conjuguées sont entourées d’une auréole à sulfures qui contient la plupart de l’or. Nousdistinguons trois types d’altération, dont la distribution est systématique à l’échelle du gisement, avec une auréole riche en pyritevers le haut et près de la périphérie du gisement, et une auréole à pyrrhotite en profondeur et au centre des zones de montée de laphase fluide. Nous avons analysé les inclusions fluides piégées dans le quartz du stade principal de minéralisation des veines de
§ E-mail address: [email protected]
1384 THE CANADIAN MINERALOGIST
chacun des trois types d’altération afin d’évaluer la présence possible de gradients thermiques et chimiques à l’échelle du gisement.Les assemblages d’inclusions fluides associés à l’altération à faible profondeur et dans les parties plus distales, à pyrite + musco-vite, contiennent des inclusions à trois phases H2O–CO2 et coexistent avec des inclusions riches en liquide aqueux avec moins de15% de phase vapeur, en volume. La température d’homogénéisation la plus faible indiquée par les assemblages d’inclusionsfluides de cet assemblage est entre 210 et 245°C. Les assemblages d’inclusions fluides des veines de quartz des zones à pyrite +pyrrhotite contiennent des inclusions à deux phases dans le système H2O–CO2–CH4 et des inclusions aqueuses riches en liquide.La température d’homogénisation varie de 240 à 275°C. Les veines entourées d’une gaine à pyrrhotite + albite contiennent desinclusions H2O–CO2–CH4 à deux phases et des inclusions aqueuses riches en liquide, dont la température d’homogénisation laplus faible est dans l’intervalle 260 à 310°C. Nous avons aussi observé une population tardive d’inclusions H2O–CH4 secondairesriches en liquide, en association avec l’altération à pyrite + muscovite et pyrrhotite + albite. Ces inclusions s’homogénisent entre239 et 286°C. Quoique les intervalles de température se chevauchent, les données sur les inclusions fluides et sur les modesd’altération concordent pour indiquer un gradient important en température entre la base et le sommet du gisement (jusqu’à100°C / km) pendant la formation du stockwerk de veines et de l’altération au Mount Charlotte. En revanche, la compositionchimique de la phase fluide en termes de H2O : CO2 : CH4 : NaCl, telle que déterminée par microthermométrie et parmicrospectrométrie de Raman, ne semble pas varier de façon systématique à l’échelle du gisement, quoique le rapport CH4 : CO2a varié largement. D’après ces observations, la déposition de l’or à Mount Charlotte aurait eu lieu par perte de soufre aux dépensdes complexes bisulfurés suite aux réactions avec les roches riches en fer des parois, pour produire la pyrrhotite et la pyrite,comme on l’a déjà montré. Ces réactions dépendent fortement de la température. La teneur relativement élevée en or du gisementde Mount Charlotte dépendrait d’un gradient thermique inhabituellement abrupt au cours de la montée de la phase fluide le longdu réseau de veines.
(Traduit par la Rédaction)
Mots-clés: gisement aurifère, Mount Charlotte, altération hydrothermale, minéralisation en or, inclusions fluides, Kalgoorlie,Australie.
& Groves 1983, Robert & Kelly, 1987, Channer &Spooner, 1991, Ridley et al. 1994).
The Mount Charlotte gold deposit in the EasternGoldfields Province of Western Australia is one of theoldest bulk-mining operations in the Kalgoorlie goldfield (Clout et al. 1990). Mineralization associated withsulfide-rich alteration of a gabbro sill along a continu-ous network of veins extends at least 1 km beneath thesurface. Ore grades in the upper part of the deposit (e.g.,the Mount Charlotte orebody) were 4.9 g/t, which isrelatively high for a bulk-mineable deposit in whichmost of the gold occurs in disseminated form (Clout etal. 1990). This has made Mount Charlotte a very profit-able mine for a number of decades. Several investiga-tors (Clark 1980, Clout et al. 1990) have identified threedistinct alteration-induced haloes surrounding the veinsat Mount Charlotte, and Mikucki & Heinrich (1993)have shown that the mineralogy of these haloes recordsa vertical as well as lateral zonation within the deposit.
Building on previous reports of relatively well-pre-served fluid inclusions at Mount Charlotte (Clark 1980,Ho 1986, Ho et al. 1990a), we investigate the spatialvariation of fluid-inclusion properties, in an attempt toexplain the mineralogical variation of alteration on thedeposit scale and its relation to the mechanisms of pre-cipitation of gold in an otherwise typical Archeanmesothermal lode-gold deposit.
GEOLOGICAL SETTING
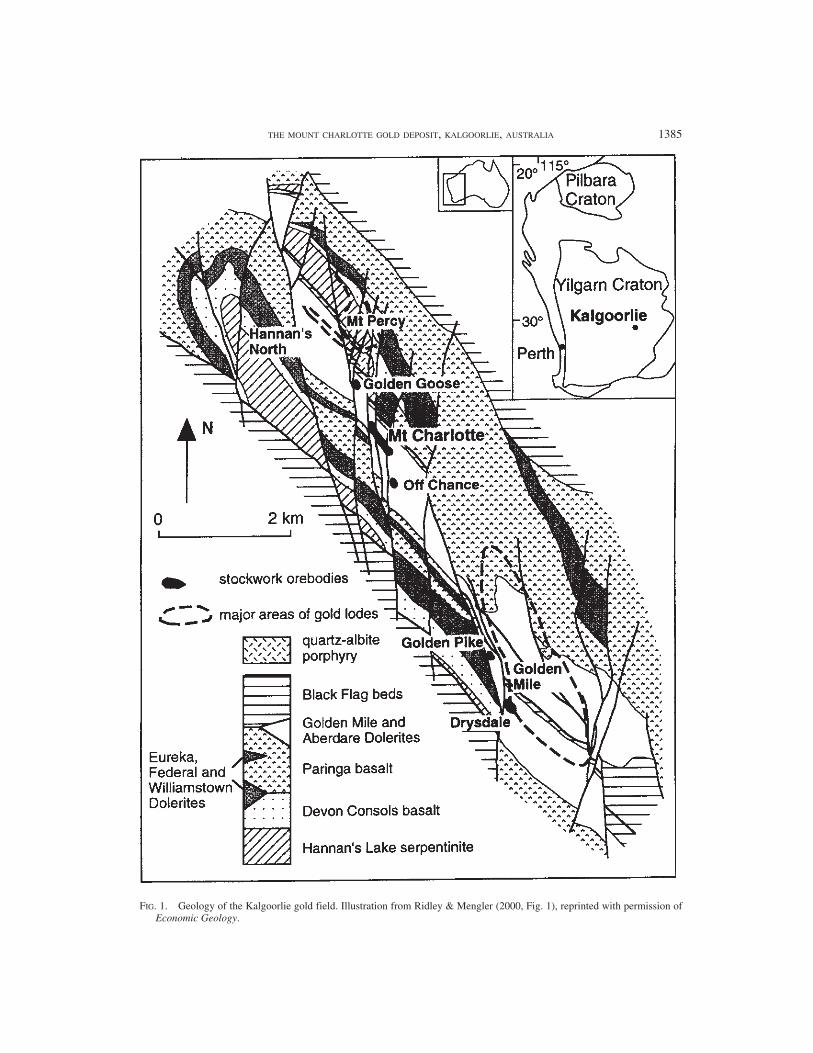
The Mount Charlotte deposit is situated within thewestern limb of the Kalgoorlie syncline (Fig. 1), whichforms part of the Archean Norseman–Wiluna green-
INTRODUCTION
Relatively CO2-rich, ore-forming fluids have longbeen recognized as characteristic of lode-gold depositsin sub-amphibolite-facies rocks (Kerrich & Fyfe 1981,Neall & Phillips 1987, Robert & Kelly 1987, Ho et al.1990a, b, Yeats & Vanderhor 1998, Ridley & Diamond2000). Estimates of CO2 in the initial ore-forming fluidfrom both thermodynamic models and fluid-inclusionmeasurements (Ho et al. 1990b) indicate X(CO2) valuesranging from 0.05 to 0.3. Gradients in X(CO2) exert amajor control on the stability of carbonate and silicateminerals in alteration haloes around greenschist-facieslode-gold deposits (Diamond & Marshall 1990, Mikucki& Ridley 1993).
The subsequent study of gold deposits in terranes athigher metamorphic grade has led to the proposal of the“crustal continuum model” (Groves et al. 1992), inwhich mineralization resulted from ore-fluids issuingfrom a deep source rising up through vertically exten-sive hydrothermal systems through the crust. The oc-currence of Archean lode-gold deposits over a largevertical range in the crust has important implications forfluid sources and genetic models for these deposits.Within a “crustal continuum” model of fluid flow,changes in the composition of the ore fluids would beexpected as they rise through the crust. Crustal-scalefluid flow, decompression and cooling lead to chemicaldisequilibrium between progressively focussed fluids,as evidenced by metamorphic-grade-dependent types ofalteration on the district scale (Witt 1991), but measur-able temperature-gradients at the mine to vein scale arerarely recorded in Archean lode-gold deposits (Phillips
THE MOUNT CHARLOTTE GOLD DEPOSIT, KALGOORLIE, AUSTRALIA 1385
FIG. 1. Geology of the Kalgoorlie gold field. Illustration from Ridley & Mengler (2000, Fig. 1), reprinted with permission ofEconomic Geology.
1386 THE CANADIAN MINERALOGIST
stone belt. The lower units of the sequence consistmainly of ultramafic to mafic volcanic rocks. These areoverlain by the Black Flag beds, a thick sequence ofvolcanic rocks and volcaniclastic sediments (Woodall1965, Swager et al. 1990). The sequence, and especiallythe ultramafic–mafic units, have been intruded by sill-like gabbroic bodies that are in general strikingly con-cordant. They have previously been interpreted to formpart of the stratigraphy (Keats 1987).
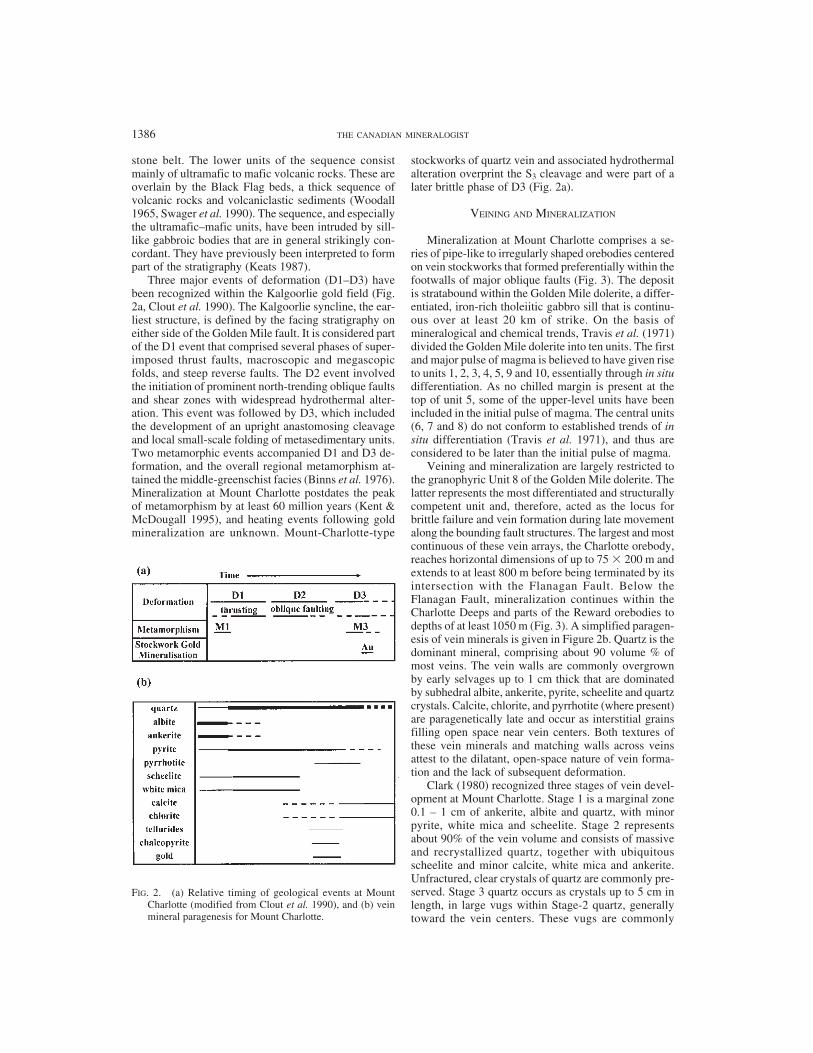
Three major events of deformation (D1–D3) havebeen recognized within the Kalgoorlie gold field (Fig.2a, Clout et al. 1990). The Kalgoorlie syncline, the ear-liest structure, is defined by the facing stratigraphy oneither side of the Golden Mile fault. It is considered partof the D1 event that comprised several phases of super-imposed thrust faults, macroscopic and megascopicfolds, and steep reverse faults. The D2 event involvedthe initiation of prominent north-trending oblique faultsand shear zones with widespread hydrothermal alter-ation. This event was followed by D3, which includedthe development of an upright anastomosing cleavageand local small-scale folding of metasedimentary units.Two metamorphic events accompanied D1 and D3 de-formation, and the overall regional metamorphism at-tained the middle-greenschist facies (Binns et al. 1976).Mineralization at Mount Charlotte postdates the peakof metamorphism by at least 60 million years (Kent &McDougall 1995), and heating events following goldmineralization are unknown. Mount-Charlotte-type
stockworks of quartz vein and associated hydrothermalalteration overprint the S3 cleavage and were part of alater brittle phase of D3 (Fig. 2a).
VEINING AND MINERALIZATION
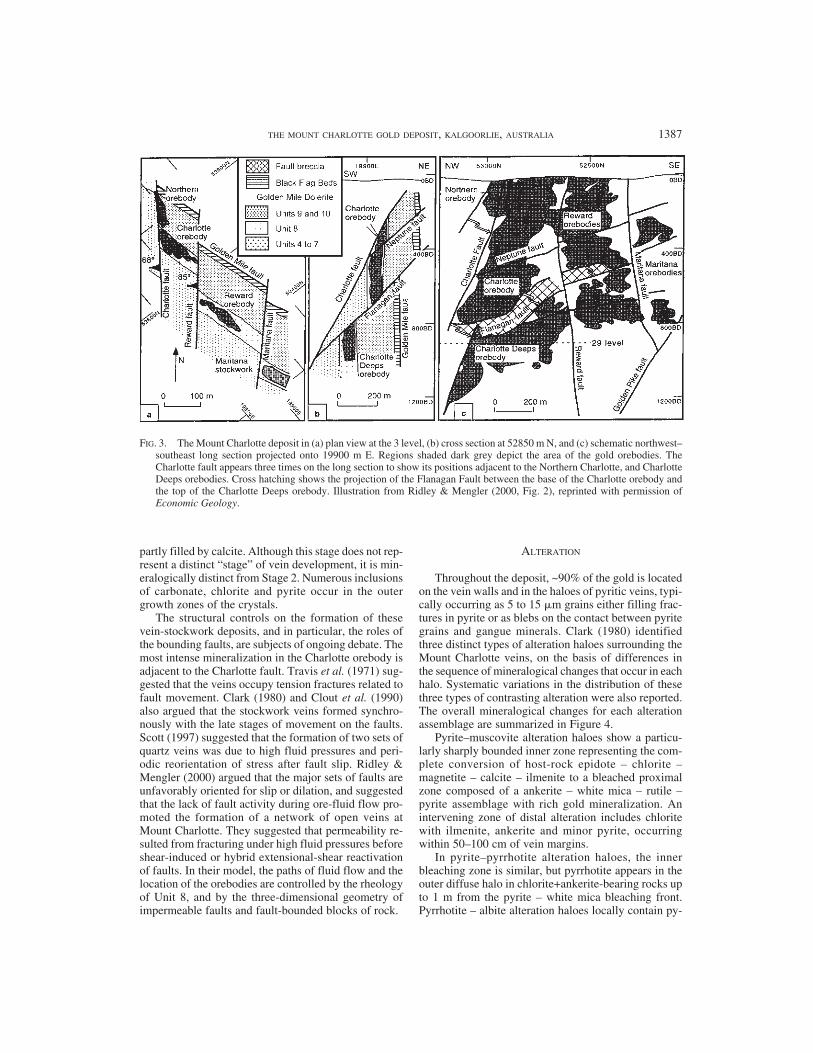
Mineralization at Mount Charlotte comprises a se-ries of pipe-like to irregularly shaped orebodies centeredon vein stockworks that formed preferentially within thefootwalls of major oblique faults (Fig. 3). The depositis stratabound within the Golden Mile dolerite, a differ-entiated, iron-rich tholeiitic gabbro sill that is continu-ous over at least 20 km of strike. On the basis ofmineralogical and chemical trends, Travis et al. (1971)divided the Golden Mile dolerite into ten units. The firstand major pulse of magma is believed to have given riseto units 1, 2, 3, 4, 5, 9 and 10, essentially through in situdifferentiation. As no chilled margin is present at thetop of unit 5, some of the upper-level units have beenincluded in the initial pulse of magma. The central units(6, 7 and 8) do not conform to established trends of insitu differentiation (Travis et al. 1971), and thus areconsidered to be later than the initial pulse of magma.
Veining and mineralization are largely restricted tothe granophyric Unit 8 of the Golden Mile dolerite. Thelatter represents the most differentiated and structurallycompetent unit and, therefore, acted as the locus forbrittle failure and vein formation during late movementalong the bounding fault structures. The largest and mostcontinuous of these vein arrays, the Charlotte orebody,reaches horizontal dimensions of up to 75 � 200 m andextends to at least 800 m before being terminated by itsintersection with the Flanagan Fault. Below theFlanagan Fault, mineralization continues within theCharlotte Deeps and parts of the Reward orebodies todepths of at least 1050 m (Fig. 3). A simplified paragen-esis of vein minerals is given in Figure 2b. Quartz is thedominant mineral, comprising about 90 volume % ofmost veins. The vein walls are commonly overgrownby early selvages up to 1 cm thick that are dominatedby subhedral albite, ankerite, pyrite, scheelite and quartzcrystals. Calcite, chlorite, and pyrrhotite (where present)are paragenetically late and occur as interstitial grainsfilling open space near vein centers. Both textures ofthese vein minerals and matching walls across veinsattest to the dilatant, open-space nature of vein forma-tion and the lack of subsequent deformation.
Clark (1980) recognized three stages of vein devel-opment at Mount Charlotte. Stage 1 is a marginal zone0.1 – 1 cm of ankerite, albite and quartz, with minorpyrite, white mica and scheelite. Stage 2 representsabout 90% of the vein volume and consists of massiveand recrystallized quartz, together with ubiquitousscheelite and minor calcite, white mica and ankerite.Unfractured, clear crystals of quartz are commonly pre-served. Stage 3 quartz occurs as crystals up to 5 cm inlength, in large vugs within Stage-2 quartz, generallytoward the vein centers. These vugs are commonly
FIG. 2. (a) Relative timing of geological events at MountCharlotte (modified from Clout et al. 1990), and (b) veinmineral paragenesis for Mount Charlotte.
THE MOUNT CHARLOTTE GOLD DEPOSIT, KALGOORLIE, AUSTRALIA 1387
partly filled by calcite. Although this stage does not rep-resent a distinct “stage” of vein development, it is min-eralogically distinct from Stage 2. Numerous inclusionsof carbonate, chlorite and pyrite occur in the outergrowth zones of the crystals.
The structural controls on the formation of thesevein-stockwork deposits, and in particular, the roles ofthe bounding faults, are subjects of ongoing debate. Themost intense mineralization in the Charlotte orebody isadjacent to the Charlotte fault. Travis et al. (1971) sug-gested that the veins occupy tension fractures related tofault movement. Clark (1980) and Clout et al. (1990)also argued that the stockwork veins formed synchro-nously with the late stages of movement on the faults.Scott (1997) suggested that the formation of two sets ofquartz veins was due to high fluid pressures and peri-odic reorientation of stress after fault slip. Ridley &Mengler (2000) argued that the major sets of faults areunfavorably oriented for slip or dilation, and suggestedthat the lack of fault activity during ore-fluid flow pro-moted the formation of a network of open veins atMount Charlotte. They suggested that permeability re-sulted from fracturing under high fluid pressures beforeshear-induced or hybrid extensional-shear reactivationof faults. In their model, the paths of fluid flow and thelocation of the orebodies are controlled by the rheologyof Unit 8, and by the three-dimensional geometry ofimpermeable faults and fault-bounded blocks of rock.
ALTERATION
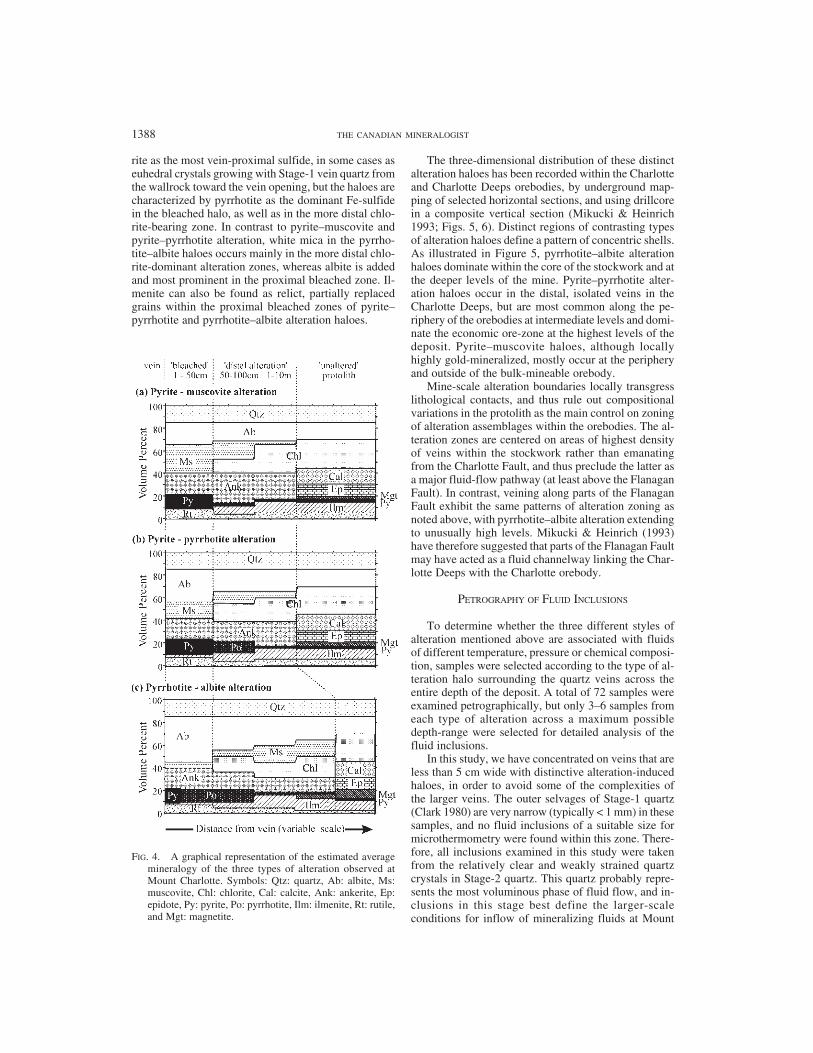
Throughout the deposit, ~90% of the gold is locatedon the vein walls and in the haloes of pyritic veins, typi-cally occurring as 5 to 15 �m grains either filling frac-tures in pyrite or as blebs on the contact between pyritegrains and gangue minerals. Clark (1980) identifiedthree distinct types of alteration haloes surrounding theMount Charlotte veins, on the basis of differences inthe sequence of mineralogical changes that occur in eachhalo. Systematic variations in the distribution of thesethree types of contrasting alteration were also reported.The overall mineralogical changes for each alterationassemblage are summarized in Figure 4.
Pyrite–muscovite alteration haloes show a particu-larly sharply bounded inner zone representing the com-plete conversion of host-rock epidote – chlorite –magnetite – calcite – ilmenite to a bleached proximalzone composed of a ankerite – white mica – rutile –pyrite assemblage with rich gold mineralization. Anintervening zone of distal alteration includes chloritewith ilmenite, ankerite and minor pyrite, occurringwithin 50–100 cm of vein margins.
In pyrite–pyrrhotite alteration haloes, the innerbleaching zone is similar, but pyrrhotite appears in theouter diffuse halo in chlorite+ankerite-bearing rocks upto 1 m from the pyrite – white mica bleaching front.Pyrrhotite – albite alteration haloes locally contain py-
FIG. 3. The Mount Charlotte deposit in (a) plan view at the 3 level, (b) cross section at 52850 m N, and (c) schematic northwest–southeast long section projected onto 19900 m E. Regions shaded dark grey depict the area of the gold orebodies. TheCharlotte fault appears three times on the long section to show its positions adjacent to the Northern Charlotte, and CharlotteDeeps orebodies. Cross hatching shows the projection of the Flanagan Fault between the base of the Charlotte orebody andthe top of the Charlotte Deeps orebody. Illustration from Ridley & Mengler (2000, Fig. 2), reprinted with permission ofEconomic Geology.
1388 THE CANADIAN MINERALOGIST
rite as the most vein-proximal sulfide, in some cases aseuhedral crystals growing with Stage-1 vein quartz fromthe wallrock toward the vein opening, but the haloes arecharacterized by pyrrhotite as the dominant Fe-sulfidein the bleached halo, as well as in the more distal chlo-rite-bearing zone. In contrast to pyrite–muscovite andpyrite–pyrrhotite alteration, white mica in the pyrrho-tite–albite haloes occurs mainly in the more distal chlo-rite-dominant alteration zones, whereas albite is addedand most prominent in the proximal bleached zone. Il-menite can also be found as relict, partially replacedgrains within the proximal bleached zones of pyrite–pyrrhotite and pyrrhotite–albite alteration haloes.
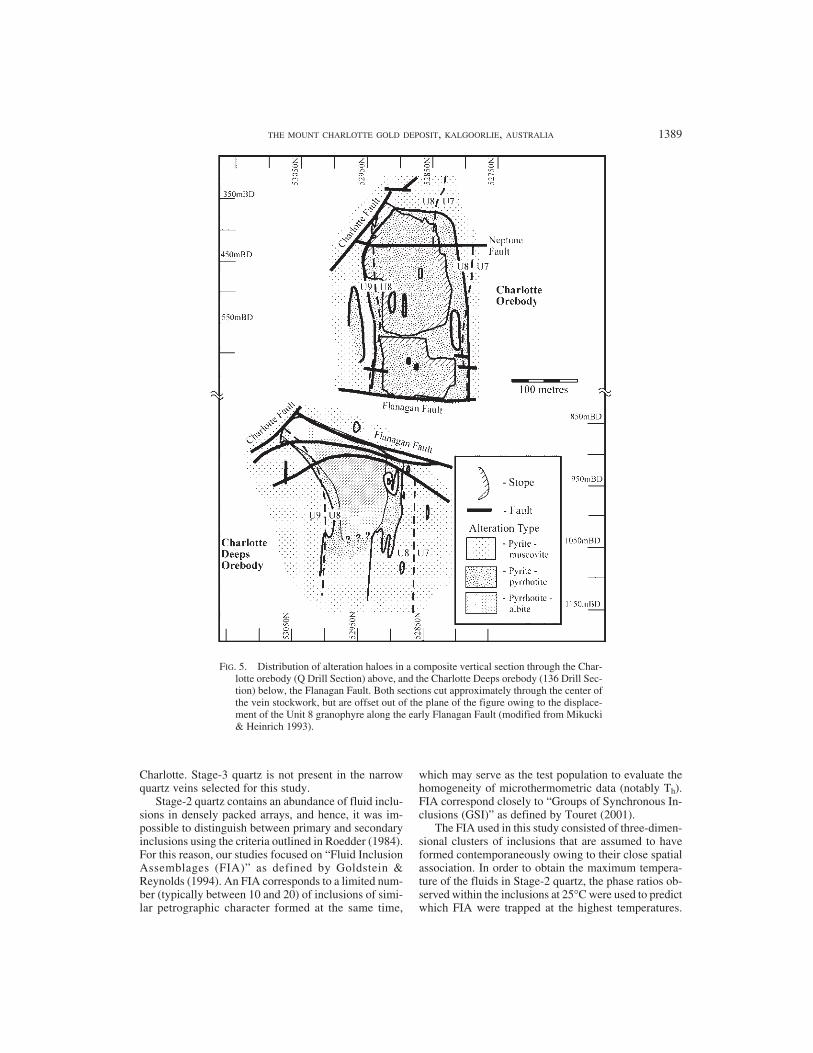
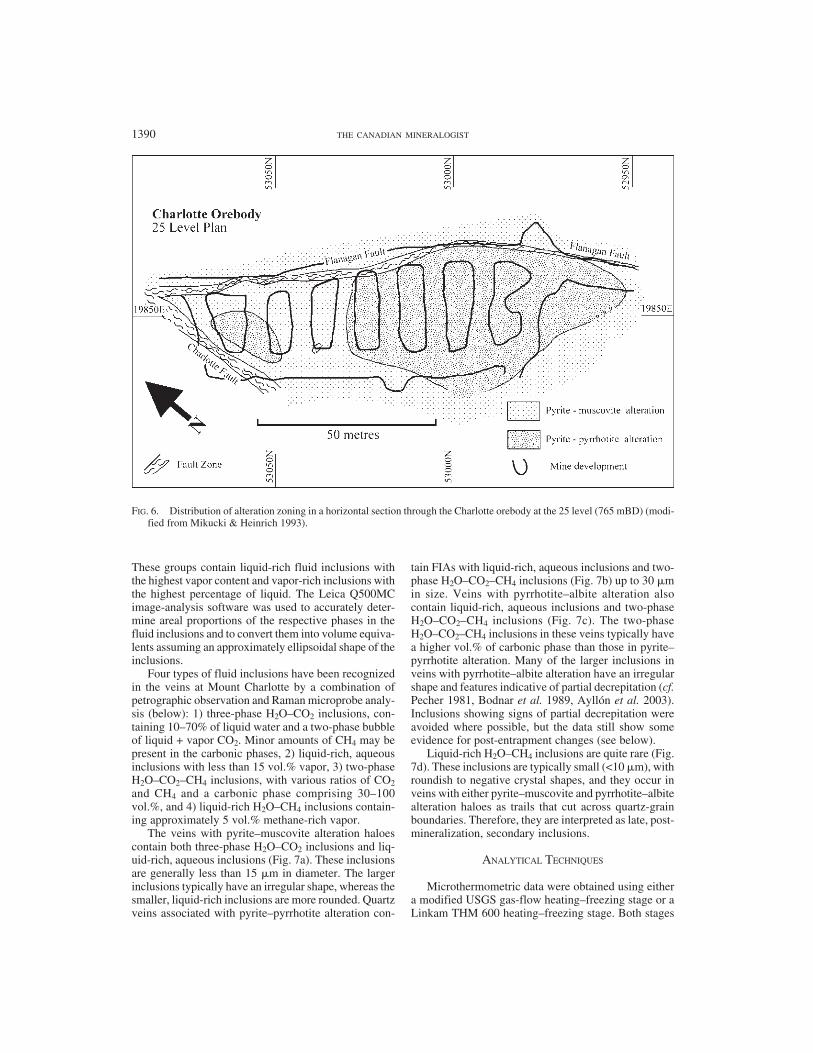
The three-dimensional distribution of these distinctalteration haloes has been recorded within the Charlotteand Charlotte Deeps orebodies, by underground map-ping of selected horizontal sections, and using drillcorein a composite vertical section (Mikucki & Heinrich1993; Figs. 5, 6). Distinct regions of contrasting typesof alteration haloes define a pattern of concentric shells.As illustrated in Figure 5, pyrrhotite–albite alterationhaloes dominate within the core of the stockwork and atthe deeper levels of the mine. Pyrite–pyrrhotite alter-ation haloes occur in the distal, isolated veins in theCharlotte Deeps, but are most common along the pe-riphery of the orebodies at intermediate levels and domi-nate the economic ore-zone at the highest levels of thedeposit. Pyrite–muscovite haloes, although locallyhighly gold-mineralized, mostly occur at the peripheryand outside of the bulk-mineable orebody.
Mine-scale alteration boundaries locally transgresslithological contacts, and thus rule out compositionalvariations in the protolith as the main control on zoningof alteration assemblages within the orebodies. The al-teration zones are centered on areas of highest densityof veins within the stockwork rather than emanatingfrom the Charlotte Fault, and thus preclude the latter asa major fluid-flow pathway (at least above the FlanaganFault). In contrast, veining along parts of the FlanaganFault exhibit the same patterns of alteration zoning asnoted above, with pyrrhotite–albite alteration extendingto unusually high levels. Mikucki & Heinrich (1993)have therefore suggested that parts of the Flanagan Faultmay have acted as a fluid channelway linking the Char-lotte Deeps with the Charlotte orebody.
PETROGRAPHY OF FLUID INCLUSIONS
To determine whether the three different styles ofalteration mentioned above are associated with fluidsof different temperature, pressure or chemical composi-tion, samples were selected according to the type of al-teration halo surrounding the quartz veins across theentire depth of the deposit. A total of 72 samples wereexamined petrographically, but only 3–6 samples fromeach type of alteration across a maximum possibledepth-range were selected for detailed analysis of thefluid inclusions.
In this study, we have concentrated on veins that areless than 5 cm wide with distinctive alteration-inducedhaloes, in order to avoid some of the complexities ofthe larger veins. The outer selvages of Stage-1 quartz(Clark 1980) are very narrow (typically < 1 mm) in thesesamples, and no fluid inclusions of a suitable size formicrothermometry were found within this zone. There-fore, all inclusions examined in this study were takenfrom the relatively clear and weakly strained quartzcrystals in Stage-2 quartz. This quartz probably repre-sents the most voluminous phase of fluid flow, and in-clusions in this stage best define the larger-scaleconditions for inflow of mineralizing fluids at Mount
FIG. 4. A graphical representation of the estimated averagemineralogy of the three types of alteration observed atMount Charlotte. Symbols: Qtz: quartz, Ab: albite, Ms:muscovite, Chl: chlorite, Cal: calcite, Ank: ankerite, Ep:epidote, Py: pyrite, Po: pyrrhotite, Ilm: ilmenite, Rt: rutile,and Mgt: magnetite.
THE MOUNT CHARLOTTE GOLD DEPOSIT, KALGOORLIE, AUSTRALIA 1389
Charlotte. Stage-3 quartz is not present in the narrowquartz veins selected for this study.
Stage-2 quartz contains an abundance of fluid inclu-sions in densely packed arrays, and hence, it was im-possible to distinguish between primary and secondaryinclusions using the criteria outlined in Roedder (1984).For this reason, our studies focused on “Fluid InclusionAssemblages (FIA)” as defined by Goldstein &Reynolds (1994). An FIA corresponds to a limited num-ber (typically between 10 and 20) of inclusions of simi-lar petrographic character formed at the same time,
which may serve as the test population to evaluate thehomogeneity of microthermometric data (notably Th).FIA correspond closely to “Groups of Synchronous In-clusions (GSI)” as defined by Touret (2001).
The FIA used in this study consisted of three-dimen-sional clusters of inclusions that are assumed to haveformed contemporaneously owing to their close spatialassociation. In order to obtain the maximum tempera-ture of the fluids in Stage-2 quartz, the phase ratios ob-served within the inclusions at 25°C were used to predictwhich FIA were trapped at the highest temperatures.
FIG. 5. Distribution of alteration haloes in a composite vertical section through the Char-lotte orebody (Q Drill Section) above, and the Charlotte Deeps orebody (136 Drill Sec-tion) below, the Flanagan Fault. Both sections cut approximately through the center ofthe vein stockwork, but are offset out of the plane of the figure owing to the displace-ment of the Unit 8 granophyre along the early Flanagan Fault (modified from Mikucki& Heinrich 1993).
1390 THE CANADIAN MINERALOGIST
These groups contain liquid-rich fluid inclusions withthe highest vapor content and vapor-rich inclusions withthe highest percentage of liquid. The Leica Q500MCimage-analysis software was used to accurately deter-mine areal proportions of the respective phases in thefluid inclusions and to convert them into volume equiva-lents assuming an approximately ellipsoidal shape of theinclusions.
Four types of fluid inclusions have been recognizedin the veins at Mount Charlotte by a combination ofpetrographic observation and Raman microprobe analy-sis (below): 1) three-phase H2O–CO2 inclusions, con-taining 10–70% of liquid water and a two-phase bubbleof liquid + vapor CO2. Minor amounts of CH4 may bepresent in the carbonic phases, 2) liquid-rich, aqueousinclusions with less than 15 vol.% vapor, 3) two-phaseH2O–CO2–CH4 inclusions, with various ratios of CO2and CH4 and a carbonic phase comprising 30–100vol.%, and 4) liquid-rich H2O–CH4 inclusions contain-ing approximately 5 vol.% methane-rich vapor.
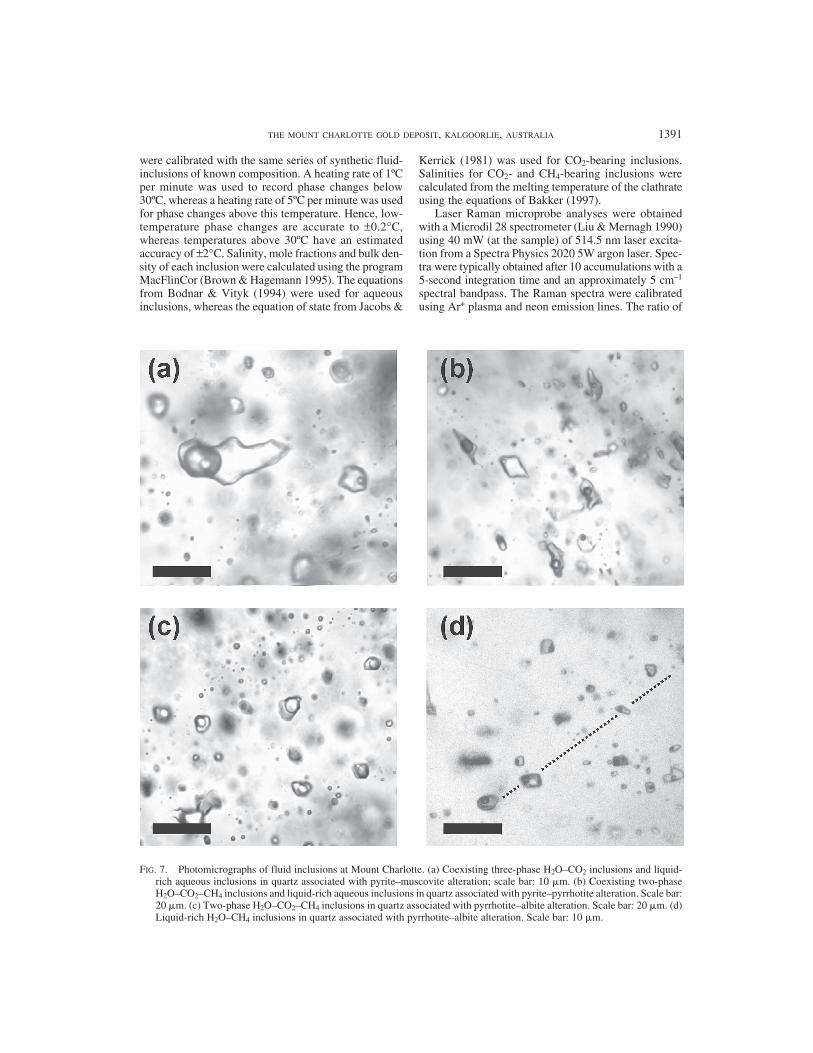
The veins with pyrite–muscovite alteration haloescontain both three-phase H2O–CO2 inclusions and liq-uid-rich, aqueous inclusions (Fig. 7a). These inclusionsare generally less than 15 �m in diameter. The largerinclusions typically have an irregular shape, whereas thesmaller, liquid-rich inclusions are more rounded. Quartzveins associated with pyrite–pyrrhotite alteration con-
tain FIAs with liquid-rich, aqueous inclusions and two-phase H2O–CO2–CH4 inclusions (Fig. 7b) up to 30 �min size. Veins with pyrrhotite–albite alteration alsocontain liquid-rich, aqueous inclusions and two-phaseH2O–CO2–CH4 inclusions (Fig. 7c). The two-phaseH2O–CO2–CH4 inclusions in these veins typically havea higher vol.% of carbonic phase than those in pyrite–pyrrhotite alteration. Many of the larger inclusions inveins with pyrrhotite–albite alteration have an irregularshape and features indicative of partial decrepitation (cf.Pecher 1981, Bodnar et al. 1989, Ayllón et al. 2003).Inclusions showing signs of partial decrepitation wereavoided where possible, but the data still show someevidence for post-entrapment changes (see below).
Liquid-rich H2O–CH4 inclusions are quite rare (Fig.7d). These inclusions are typically small (<10 �m), withroundish to negative crystal shapes, and they occur inveins with either pyrite–muscovite and pyrrhotite–albitealteration haloes as trails that cut across quartz-grainboundaries. Therefore, they are interpreted as late, post-mineralization, secondary inclusions.
ANALYTICAL TECHNIQUES
Microthermometric data were obtained using eithera modified USGS gas-flow heating–freezing stage or aLinkam THM 600 heating–freezing stage. Both stages
FIG. 6. Distribution of alteration zoning in a horizontal section through the Charlotte orebody at the 25 level (765 mBD) (modi-fied from Mikucki & Heinrich 1993).
THE MOUNT CHARLOTTE GOLD DEPOSIT, KALGOORLIE, AUSTRALIA 1391
were calibrated with the same series of synthetic fluid-inclusions of known composition. A heating rate of 1ºCper minute was used to record phase changes below30ºC, whereas a heating rate of 5ºC per minute was usedfor phase changes above this temperature. Hence, low-temperature phase changes are accurate to ±0.2°C,whereas temperatures above 30ºC have an estimatedaccuracy of ±2°C. Salinity, mole fractions and bulk den-sity of each inclusion were calculated using the programMacFlinCor (Brown & Hagemann 1995). The equationsfrom Bodnar & Vityk (1994) were used for aqueousinclusions, whereas the equation of state from Jacobs &
Kerrick (1981) was used for CO2-bearing inclusions.Salinities for CO2- and CH4-bearing inclusions werecalculated from the melting temperature of the clathrateusing the equations of Bakker (1997).
Laser Raman microprobe analyses were obtainedwith a Microdil 28 spectrometer (Liu & Mernagh 1990)using 40 mW (at the sample) of 514.5 nm laser excita-tion from a Spectra Physics 2020 5W argon laser. Spec-tra were typically obtained after 10 accumulations with a5-second integration time and an approximately 5 cm–1
spectral bandpass. The Raman spectra were calibratedusing Ar+ plasma and neon emission lines. The ratio of
FIG. 7. Photomicrographs of fluid inclusions at Mount Charlotte. (a) Coexisting three-phase H2O–CO2 inclusions and liquid-rich aqueous inclusions in quartz associated with pyrite–muscovite alteration; scale bar: 10 �m. (b) Coexisting two-phaseH2O–CO2–CH4 inclusions and liquid-rich aqueous inclusions in quartz associated with pyrite–pyrrhotite alteration. Scale bar:20 �m. (c) Two-phase H2O–CO2–CH4 inclusions in quartz associated with pyrrhotite–albite alteration. Scale bar: 20 �m. (d)Liquid-rich H2O–CH4 inclusions in quartz associated with pyrrhotite–albite alteration. Scale bar: 10 �m.
1392 THE CANADIAN MINERALOGIST
gaseous species in the vapor phase was calculated usingthe method described by Dubessy et al. (1989), and thefollowing “quantification factors” were calculated asoutlined in Pasteris et al. (1988): CO2 = 1.3 and CH4 =7.6. Raman detection limits are dependent on instrumen-tal sensitivity and the partial pressure of each gas, butare estimated to be about 0.15 MPa for CO2 and 0.03MPa for CH4 under the conditions of this study.
RESULTS
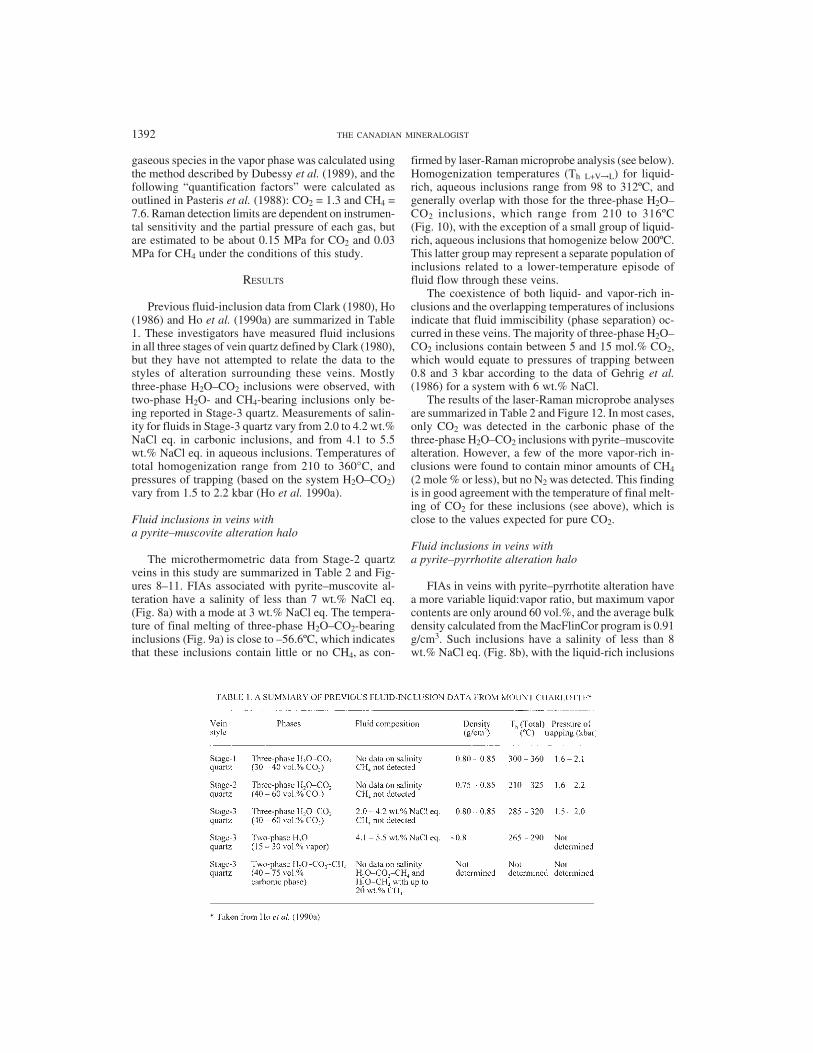
Previous fluid-inclusion data from Clark (1980), Ho(1986) and Ho et al. (1990a) are summarized in Table1. These investigators have measured fluid inclusionsin all three stages of vein quartz defined by Clark (1980),but they have not attempted to relate the data to thestyles of alteration surrounding these veins. Mostlythree-phase H2O–CO2 inclusions were observed, withtwo-phase H2O- and CH4-bearing inclusions only be-ing reported in Stage-3 quartz. Measurements of salin-ity for fluids in Stage-3 quartz vary from 2.0 to 4.2 wt.%NaCl eq. in carbonic inclusions, and from 4.1 to 5.5wt.% NaCl eq. in aqueous inclusions. Temperatures oftotal homogenization range from 210 to 360°C, andpressures of trapping (based on the system H2O–CO2)vary from 1.5 to 2.2 kbar (Ho et al. 1990a).
Fluid inclusions in veins witha pyrite–muscovite alteration halo
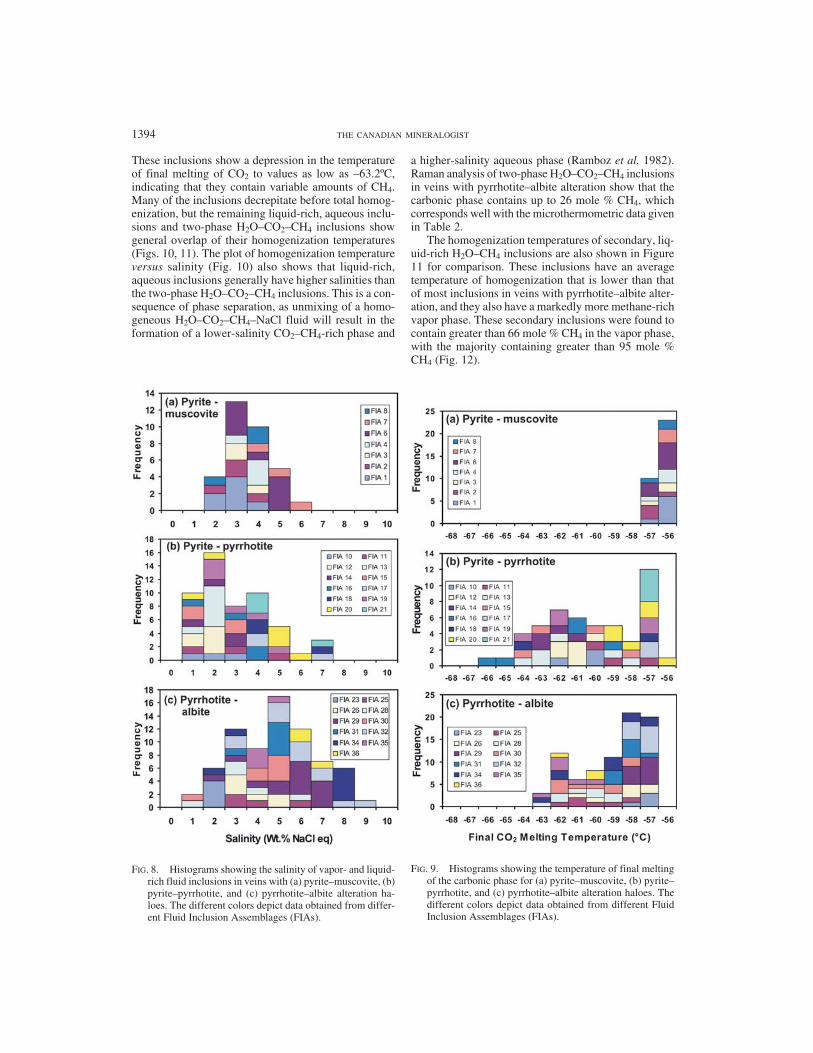
The microthermometric data from Stage-2 quartzveins in this study are summarized in Table 2 and Fig-ures 8–11. FIAs associated with pyrite–muscovite al-teration have a salinity of less than 7 wt.% NaCl eq.(Fig. 8a) with a mode at 3 wt.% NaCl eq. The tempera-ture of final melting of three-phase H2O–CO2-bearinginclusions (Fig. 9a) is close to –56.6ºC, which indicatesthat these inclusions contain little or no CH4, as con-
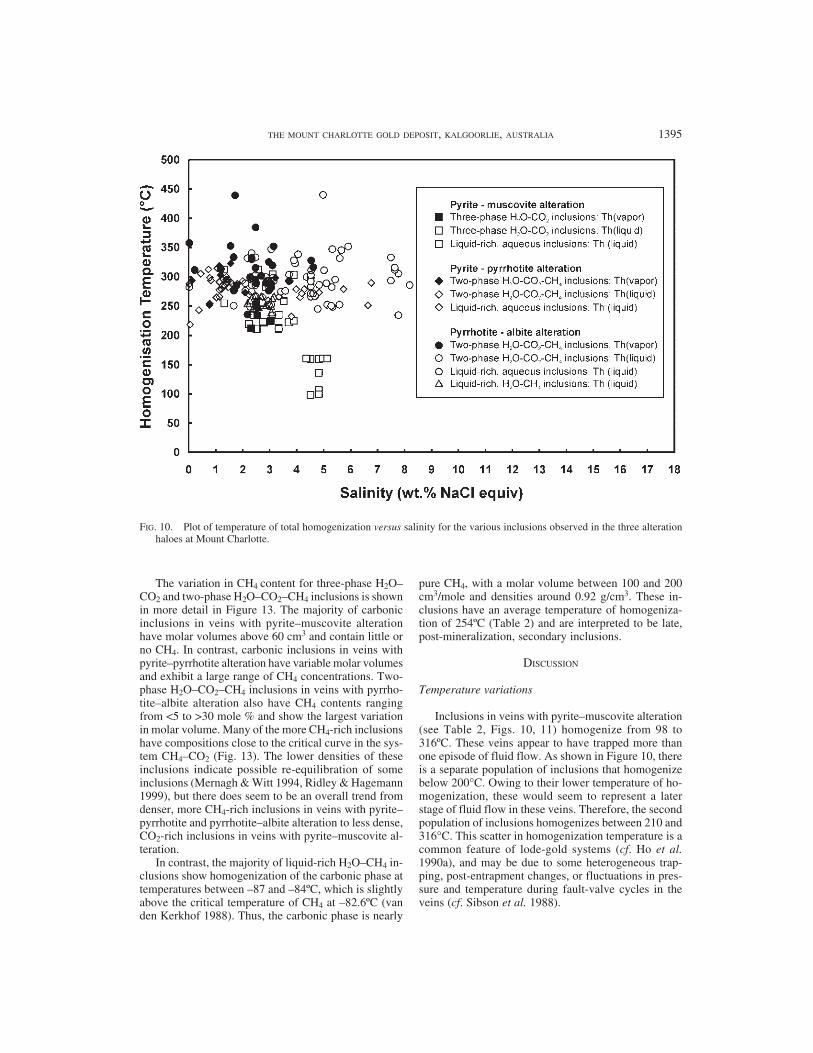
firmed by laser-Raman microprobe analysis (see below).Homogenization temperatures (Th L+V→L) for liquid-rich, aqueous inclusions range from 98 to 312ºC, andgenerally overlap with those for the three-phase H2O–CO2 inclusions, which range from 210 to 316ºC(Fig. 10), with the exception of a small group of liquid-rich, aqueous inclusions that homogenize below 200ºC.This latter group may represent a separate population ofinclusions related to a lower-temperature episode offluid flow through these veins.
The coexistence of both liquid- and vapor-rich in-clusions and the overlapping temperatures of inclusionsindicate that fluid immiscibility (phase separation) oc-curred in these veins. The majority of three-phase H2O–CO2 inclusions contain between 5 and 15 mol.% CO2,which would equate to pressures of trapping between0.8 and 3 kbar according to the data of Gehrig et al.(1986) for a system with 6 wt.% NaCl.
The results of the laser-Raman microprobe analysesare summarized in Table 2 and Figure 12. In most cases,only CO2 was detected in the carbonic phase of thethree-phase H2O–CO2 inclusions with pyrite–muscovitealteration. However, a few of the more vapor-rich in-clusions were found to contain minor amounts of CH4(2 mole % or less), but no N2 was detected. This findingis in good agreement with the temperature of final melt-ing of CO2 for these inclusions (see above), which isclose to the values expected for pure CO2.
Fluid inclusions in veins witha pyrite–pyrrhotite alteration halo
FIAs in veins with pyrite–pyrrhotite alteration havea more variable liquid:vapor ratio, but maximum vaporcontents are only around 60 vol.%, and the average bulkdensity calculated from the MacFlinCor program is 0.91g/cm3. Such inclusions have a salinity of less than 8wt.% NaCl eq. (Fig. 8b), with the liquid-rich inclusions
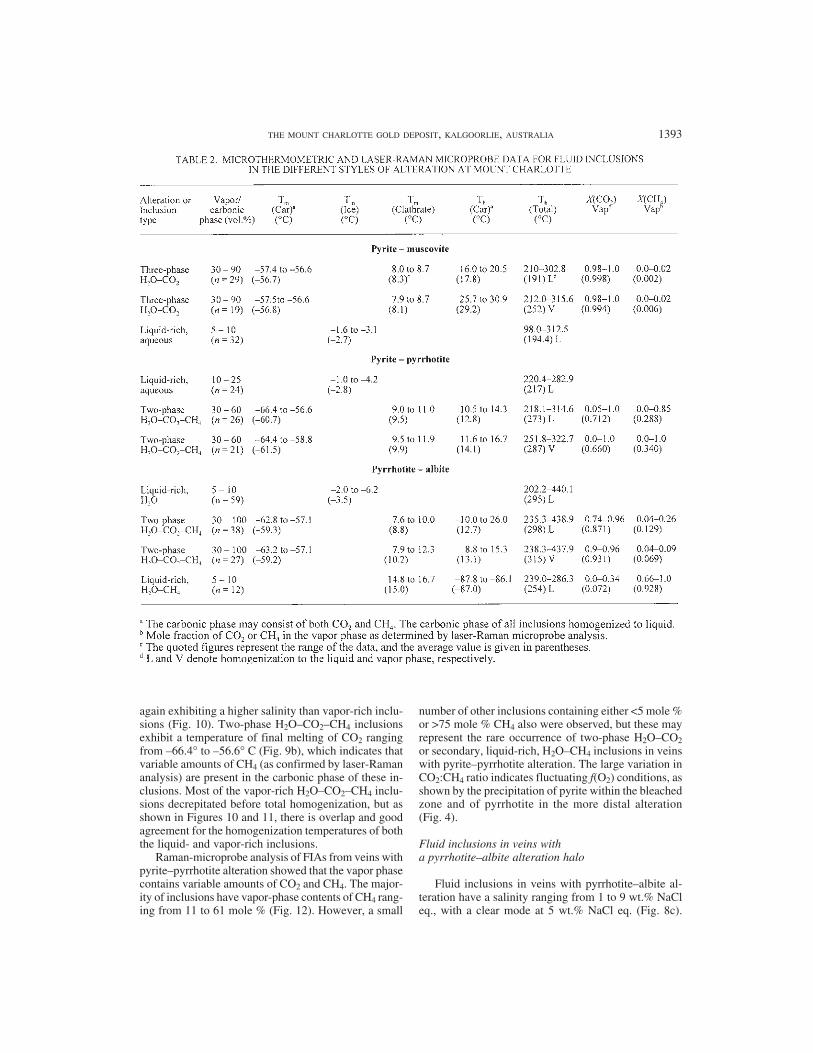
THE MOUNT CHARLOTTE GOLD DEPOSIT, KALGOORLIE, AUSTRALIA 1393
again exhibiting a higher salinity than vapor-rich inclu-sions (Fig. 10). Two-phase H2O–CO2–CH4 inclusionsexhibit a temperature of final melting of CO2 rangingfrom –66.4° to –56.6° C (Fig. 9b), which indicates thatvariable amounts of CH4 (as confirmed by laser-Ramananalysis) are present in the carbonic phase of these in-clusions. Most of the vapor-rich H2O–CO2–CH4 inclu-sions decrepitated before total homogenization, but asshown in Figures 10 and 11, there is overlap and goodagreement for the homogenization temperatures of boththe liquid- and vapor-rich inclusions.
Raman-microprobe analysis of FIAs from veins withpyrite–pyrrhotite alteration showed that the vapor phasecontains variable amounts of CO2 and CH4. The major-ity of inclusions have vapor-phase contents of CH4 rang-ing from 11 to 61 mole % (Fig. 12). However, a small
number of other inclusions containing either <5 mole %or >75 mole % CH4 also were observed, but these mayrepresent the rare occurrence of two-phase H2O–CO2or secondary, liquid-rich, H2O–CH4 inclusions in veinswith pyrite–pyrrhotite alteration. The large variation inCO2:CH4 ratio indicates fluctuating f(O2) conditions, asshown by the precipitation of pyrite within the bleachedzone and of pyrrhotite in the more distal alteration(Fig. 4).
Fluid inclusions in veins witha pyrrhotite–albite alteration halo
Fluid inclusions in veins with pyrrhotite–albite al-teration have a salinity ranging from 1 to 9 wt.% NaCleq., with a clear mode at 5 wt.% NaCl eq. (Fig. 8c).
1394 THE CANADIAN MINERALOGIST
These inclusions show a depression in the temperatureof final melting of CO2 to values as low as –63.2ºC,indicating that they contain variable amounts of CH4.Many of the inclusions decrepitate before total homog-enization, but the remaining liquid-rich, aqueous inclu-sions and two-phase H2O–CO2–CH4 inclusions showgeneral overlap of their homogenization temperatures(Figs. 10, 11). The plot of homogenization temperatureversus salinity (Fig. 10) also shows that liquid-rich,aqueous inclusions generally have higher salinities thanthe two-phase H2O–CO2–CH4 inclusions. This is a con-sequence of phase separation, as unmixing of a homo-geneous H2O–CO2–CH4–NaCl fluid will result in theformation of a lower-salinity CO2–CH4-rich phase and
a higher-salinity aqueous phase (Ramboz et al. 1982).Raman analysis of two-phase H2O–CO2–CH4 inclusionsin veins with pyrrhotite–albite alteration show that thecarbonic phase contains up to 26 mole % CH4, whichcorresponds well with the microthermometric data givenin Table 2.
The homogenization temperatures of secondary, liq-uid-rich H2O–CH4 inclusions are also shown in Figure11 for comparison. These inclusions have an averagetemperature of homogenization that is lower than thatof most inclusions in veins with pyrrhotite–albite alter-ation, and they also have a markedly more methane-richvapor phase. These secondary inclusions were found tocontain greater than 66 mole % CH4 in the vapor phase,with the majority containing greater than 95 mole %CH4 (Fig. 12).
FIG. 8. Histograms showing the salinity of vapor- and liquid-rich fluid inclusions in veins with (a) pyrite–muscovite, (b)pyrite–pyrrhotite, and (c) pyrrhotite–albite alteration ha-loes. The different colors depict data obtained from differ-ent Fluid Inclusion Assemblages (FIAs).
FIG. 9. Histograms showing the temperature of final meltingof the carbonic phase for (a) pyrite–muscovite, (b) pyrite–pyrrhotite, and (c) pyrrhotite–albite alteration haloes. Thedifferent colors depict data obtained from different FluidInclusion Assemblages (FIAs).
THE MOUNT CHARLOTTE GOLD DEPOSIT, KALGOORLIE, AUSTRALIA 1395
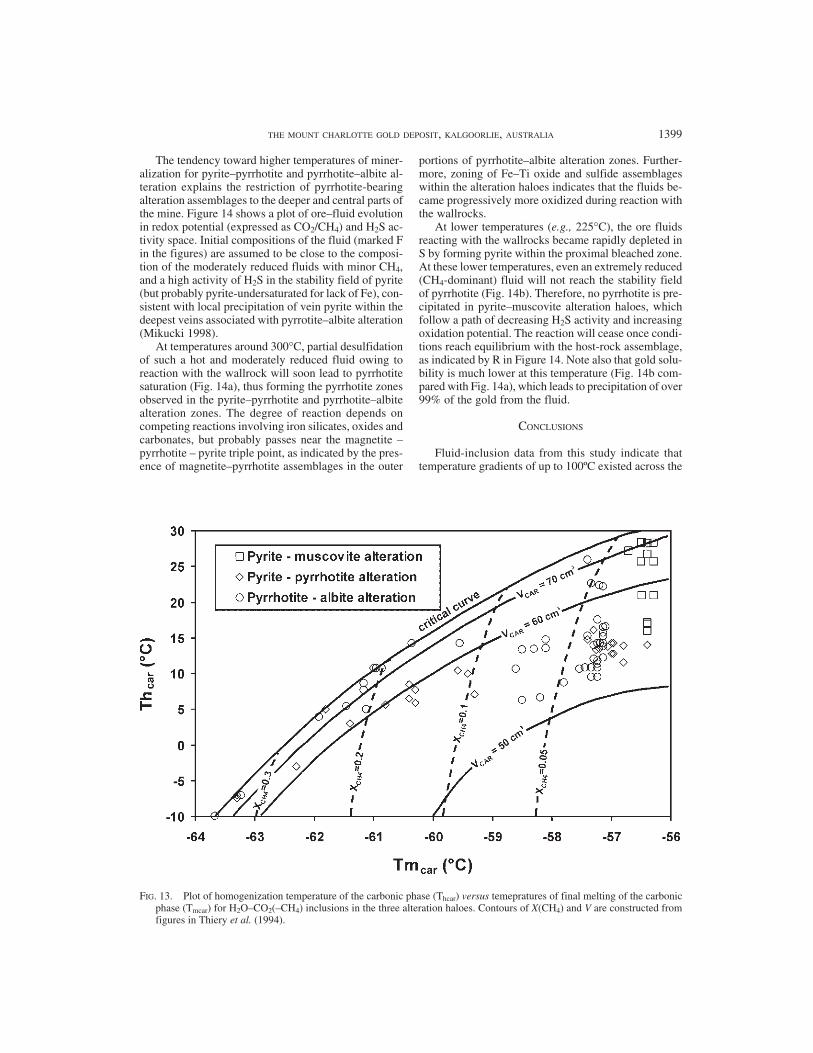
The variation in CH4 content for three-phase H2O–CO2 and two-phase H2O–CO2–CH4 inclusions is shownin more detail in Figure 13. The majority of carbonicinclusions in veins with pyrite–muscovite alterationhave molar volumes above 60 cm3 and contain little orno CH4. In contrast, carbonic inclusions in veins withpyrite–pyrrhotite alteration have variable molar volumesand exhibit a large range of CH4 concentrations. Two-phase H2O–CO2–CH4 inclusions in veins with pyrrho-tite–albite alteration also have CH4 contents rangingfrom <5 to >30 mole % and show the largest variationin molar volume. Many of the more CH4-rich inclusionshave compositions close to the critical curve in the sys-tem CH4–CO2 (Fig. 13). The lower densities of theseinclusions indicate possible re-equilibration of someinclusions (Mernagh & Witt 1994, Ridley & Hagemann1999), but there does seem to be an overall trend fromdenser, more CH4-rich inclusions in veins with pyrite–pyrrhotite and pyrrhotite–albite alteration to less dense,CO2-rich inclusions in veins with pyrite–muscovite al-teration.
In contrast, the majority of liquid-rich H2O–CH4 in-clusions show homogenization of the carbonic phase attemperatures between –87 and –84ºC, which is slightlyabove the critical temperature of CH4 at –82.6ºC (vanden Kerkhof 1988). Thus, the carbonic phase is nearly
pure CH4, with a molar volume between 100 and 200cm3/mole and densities around 0.92 g/cm3. These in-clusions have an average temperature of homogeniza-tion of 254ºC (Table 2) and are interpreted to be late,post-mineralization, secondary inclusions.
DISCUSSION
Temperature variations
Inclusions in veins with pyrite–muscovite alteration(see Table 2, Figs. 10, 11) homogenize from 98 to316ºC. These veins appear to have trapped more thanone episode of fluid flow. As shown in Figure 10, thereis a separate population of inclusions that homogenizebelow 200°C. Owing to their lower temperature of ho-mogenization, these would seem to represent a laterstage of fluid flow in these veins. Therefore, the secondpopulation of inclusions homogenizes between 210 and316°C. This scatter in homogenization temperature is acommon feature of lode-gold systems (cf. Ho et al.1990a), and may be due to some heterogeneous trap-ping, post-entrapment changes, or fluctuations in pres-sure and temperature during fault-valve cycles in theveins (cf. Sibson et al. 1988).
FIG. 10. Plot of temperature of total homogenization versus salinity for the various inclusions observed in the three alterationhaloes at Mount Charlotte.
1396 THE CANADIAN MINERALOGIST
The fluid inclusions from veins associated with py-rite–pyrrhotite alteration homogenize from 218 to 323ºC(Table 2, Figs. 10, 11) and correspond well with therange of homogenization temperatures reported by Ho(1986) and Ho et al. (1990a). Fluid inclusions in veinsassociated with pyrrhotite–albite alteration homogenizefrom 202 to 440ºC (Table 2, Figs. 10, 11). The very hightemperatures of homogenization reported in this studyare due to heterogeneous trapping or post-entrapmentchanges. Many of the inclusions display sharp edges andre-entrants on the inclusion walls, which suggests dis-solution of the adjacent quartz. They closely resemblethe “scalloped” textures reported by Ayllón et al. (2003).
Temperature differences are also the simplest expla-nation for the contrasting alteration-induced haloes, withpyrrhotite at depth (pyrrhotite–albite haloes) and pyriteat the shallower levels (pyrite–muscovite haloes). Fig-ure 14 illustrates how an initially H2S-rich but sulfide-undersaturated fluid will be desulfidized by reaction
with the magnetite-rich wallrock, giving rise to the dis-tinct zonations in a pyrrhotite–albite halo (Fig. 14a,compare Fig. 4c) at higher temperature, and in a pyrite–muscovite halo (Fig. 14b, compare Fig. 4a) at lowertemperature.
A third line of evidence for temperature gradients,mainly in the lateral direction, comes from a re-inter-pretation of the �18O isotope data of Golding et al.(1990). They measured �18O in the whole rocks and thequartz veins adjacent to the Charlotte Fault, and showedthat the �18O contours closely follow a fault-related in-dentation on the southern side of the Charlotte orebodyand fault, suggesting that the strike and oblique faultswere channelways for the ore fluids. High-�18O whole-rock values are coincident with the zone of sodic (pyr-rhotite–albite) alteration. Golding et al. (1990) calcu-lated a minimum water:rock ratio of 4 for this zone.Quartz veins near the center of the orebody have �18Ovalues around 11‰, whereas veins around the edges of
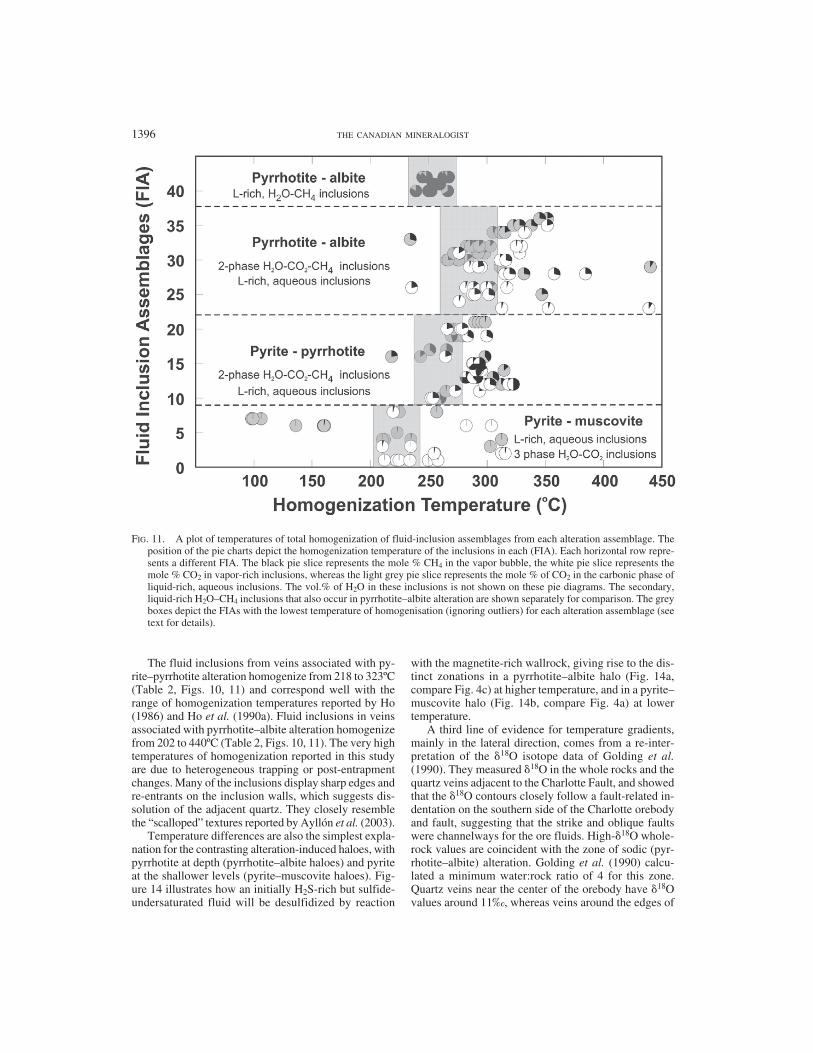
FIG. 11. A plot of temperatures of total homogenization of fluid-inclusion assemblages from each alteration assemblage. Theposition of the pie charts depict the homogenization temperature of the inclusions in each (FIA). Each horizontal row repre-sents a different FIA. The black pie slice represents the mole % CH4 in the vapor bubble, the white pie slice represents themole % CO2 in vapor-rich inclusions, whereas the light grey pie slice represents the mole % of CO2 in the carbonic phase ofliquid-rich, aqueous inclusions. The vol.% of H2O in these inclusions is not shown on these pie diagrams. The secondary,liquid-rich H2O–CH4 inclusions that also occur in pyrrhotite–albite alteration are shown separately for comparison. The greyboxes depict the FIAs with the lowest temperature of homogenisation (ignoring outliers) for each alteration assemblage (seetext for details).
THE MOUNT CHARLOTTE GOLD DEPOSIT, KALGOORLIE, AUSTRALIA 1397
the orebody exhibit values ranging up to 13‰. Thevariation in �18Oquartz is interpreted to be a result of agradient in fluid temperature (Mikucki & Heinrich1993) rather than fluid composition. Using the data onquartz–H2O fractionation of Kawabe (1979) and assum-ing that the �18O of the fluid remained constant, the 2‰range of �18O compositions in the vein quartz indicatesthat fluid temperatures varied over a range of 55°C. Thisis in general agreement with the results of the fluid-in-clusion study.
Fluid-phase separation and estimatesof temperature and pressure
Ramboz et al. (1982) have suggested three criteriafor the identification of trapping of immiscible fluids:(i) the inclusions should be closely related in time andspace, (ii) the inclusions should homogenize (or decrepi-tate) over the same range of temperature, and homog-enization should be to opposite modes, (i.e., to liquidand to vapor), and (iii) the relative concentration ofchemical components in the liquid and vapor should beappropriate to equilibrium fractionation at total homog-enization. The selection of a suitable FIA satisfies thefirst criterion. The coexisting liquid- and vapor-richfluid inclusions and the overlapping temperatures ofhomogenization for both sets of inclusions are clearlyshown in Figures 10 and 11, and the distribution of com-ponents between liquid- and vapor-rich inclusions is asexpected. Textural and microthermometric data thus areconsistent with trapping of immiscible fluids in the veinsthat generated all three types of alteration, consistentwith the conclusion of Ho (1986) and Harbi (1997).
Therefore, the measured temperatures of homogeni-zation approximate the temperatures of trapping with-out pressure correction, and the best estimate for the truetemperature of trapping is near the lower end of the tem-peratures of homogenization in any one assemblage.The grey boxes in Figure 11 depict the inclusions withthe lowest temperatures of homogenization (ignoringoutliers) in each alteration assemblage. The tempera-tures of trapping indicated vary from 210 to 245ºC forinclusions in veins with pyrite–muscovite alteration,from 240 to 275ºC for inclusions in veins with pyrite–pyrrhotite alteration, and from 260 to 310ºC for inclu-sions in veins with pyrrhotite–albite alteration.Figure 11 also indicates that the temperatures of trap-ping of inclusions increase as the alteration assemblagechanges from pyrite–muscovite to pyrrhotite–albite.This result is in accord with the concentric zoning ofthe alteration at Mount Charlotte. Pyrrhotite–albite al-teration occurs mainly within the core of the stockworkand at the deeper levels in the mine, whereas pyrite–muscovite alteration occurs in the periphery and upperlevels of the orebodies (Fig. 5). Figure 11 also indicatesthat temperature gradients varied by up to 100°C duringformation of the vein stockwork and alteration at MountCharlotte.
Pressures are, in principle, also defined by the wide-spread inferred phase-separation, but an actual estimateof pressure is difficult owing to the compositionallycomplex CH4–CO2–NaCl–H2O fluids at Mount Char-lotte. The assemblage of CH4-poor inclusions with thelowest temperature of homogenization (Th liquid ≈210°C) and clear textural evidence of trapping in thetwo-phase field is FIA number 4. This assemblage con-tains three-phase CO2–H2O inclusions with X(CO2):X(H2O) = 0.05 and a bulk density of 0.974 g/cm3, esti-mated from the CO2-homogenization temperature andphase-volume proportions at room temperature usingthe program MacFlinCor of Brown & Hagemann(1995). On the basis of experimental data for the CO2–H2O–NaCl solvus at 6 wt% NaCl and 4 mol.% CO2(Schmidt & Bodnar 2000), a fluid pressure of 600 ± 50bar can be estimated for this assemblage. From FIAs inother parts of the vein system, significantly higher esti-mates of pressure are obtained, but many of those aresubject to uncertainty owing to the presence of CH4.
Methane content
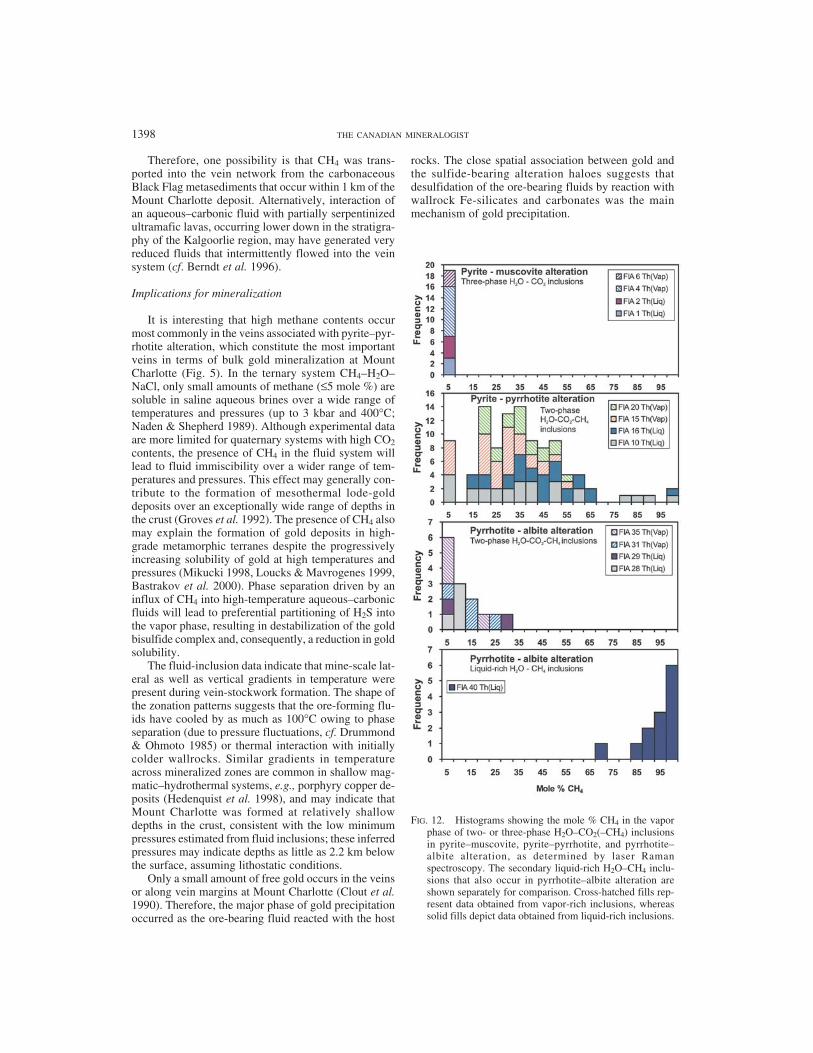
There are distinct variations in the methane contentof the fluids associated with each alteration assemblage.The liquid-rich H2O–CH4 inclusions have the mostmethane in the vapor phase, which contains from 66 to100 mol.%. However, as such inclusions only occur insecondary trails in quartz veins in pyrite–muscovite andpyrrhotite–albite alteration, they are unrelated to themain phase of alteration development and will not bediscussed further.
Figure 12 shows that the fluids most closely associ-ated with pyrite–muscovite alteration contain little orno methane (≤2 mole % CH4), whereas the fluids asso-ciated with pyrrhotite–albite alteration contain up to 26mole % CH4 in the vapor phase (Fig. 12), with bulkCO2:CH4 ratios ranging from ~1 to 30. Fluids associ-ated with pyrite–pyrrhotite alteration show even largervariations in methane content, with the mole fraction ofmethane in the carbonic phase ranging from 0 to 1, andwith the majority having values from 0.11 to 0.61(Fig. 12).
Highly variable CO2:CH4 ratios are quite commonin mesothermal gold-bearing fluids (Channer & Spooner1991, Harbi 1997, Ridley & Hagemann 1999, Fan et al.2000, Olivo & Williams-Jones 2002). Ridley &Hagemann (1999) attributed the variations in singleveins and even within FIAs to post-entrapment re-equili-bration of the inclusions. However, variation of theCO2:CH4 ratio due to post-entrapment changes seemsunlikely in this case, as it would be expected to affectinclusions in all alteration assemblages and not just inveins with pyrite–pyrrhotite alteration. Fan et al. (2000)attributed the observed CO2:CH4 variations to eitherheterogeneous trapping or mixing with a reduced fluidderived from nearby graphite-bearing lithologies.
1398 THE CANADIAN MINERALOGIST
Therefore, one possibility is that CH4 was trans-ported into the vein network from the carbonaceousBlack Flag metasediments that occur within 1 km of theMount Charlotte deposit. Alternatively, interaction ofan aqueous–carbonic fluid with partially serpentinizedultramafic lavas, occurring lower down in the stratigra-phy of the Kalgoorlie region, may have generated veryreduced fluids that intermittently flowed into the veinsystem (cf. Berndt et al. 1996).
Implications for mineralization
It is interesting that high methane contents occurmost commonly in the veins associated with pyrite–pyr-rhotite alteration, which constitute the most importantveins in terms of bulk gold mineralization at MountCharlotte (Fig. 5). In the ternary system CH4–H2O–NaCl, only small amounts of methane (≤5 mole %) aresoluble in saline aqueous brines over a wide range oftemperatures and pressures (up to 3 kbar and 400°C;Naden & Shepherd 1989). Although experimental dataare more limited for quaternary systems with high CO2contents, the presence of CH4 in the fluid system willlead to fluid immiscibility over a wider range of tem-peratures and pressures. This effect may generally con-tribute to the formation of mesothermal lode-golddeposits over an exceptionally wide range of depths inthe crust (Groves et al. 1992). The presence of CH4 alsomay explain the formation of gold deposits in high-grade metamorphic terranes despite the progressivelyincreasing solubility of gold at high temperatures andpressures (Mikucki 1998, Loucks & Mavrogenes 1999,Bastrakov et al. 2000). Phase separation driven by aninflux of CH4 into high-temperature aqueous–carbonicfluids will lead to preferential partitioning of H2S intothe vapor phase, resulting in destabilization of the goldbisulfide complex and, consequently, a reduction in goldsolubility.
The fluid-inclusion data indicate that mine-scale lat-eral as well as vertical gradients in temperature werepresent during vein-stockwork formation. The shape ofthe zonation patterns suggests that the ore-forming flu-ids have cooled by as much as 100°C owing to phaseseparation (due to pressure fluctuations, cf. Drummond& Ohmoto 1985) or thermal interaction with initiallycolder wallrocks. Similar gradients in temperatureacross mineralized zones are common in shallow mag-matic–hydrothermal systems, e.g., porphyry copper de-posits (Hedenquist et al. 1998), and may indicate thatMount Charlotte was formed at relatively shallowdepths in the crust, consistent with the low minimumpressures estimated from fluid inclusions; these inferredpressures may indicate depths as little as 2.2 km belowthe surface, assuming lithostatic conditions.
Only a small amount of free gold occurs in the veinsor along vein margins at Mount Charlotte (Clout et al.1990). Therefore, the major phase of gold precipitationoccurred as the ore-bearing fluid reacted with the host
rocks. The close spatial association between gold andthe sulfide-bearing alteration haloes suggests thatdesulfidation of the ore-bearing fluids by reaction withwallrock Fe-silicates and carbonates was the mainmechanism of gold precipitation.
FIG. 12. Histograms showing the mole % CH4 in the vaporphase of two- or three-phase H2O–CO2(–CH4) inclusionsin pyrite–muscovite, pyrite–pyrrhotite, and pyrrhotite–albite alteration, as determined by laser Ramanspectroscopy. The secondary liquid-rich H2O–CH4 inclu-sions that also occur in pyrrhotite–albite alteration areshown separately for comparison. Cross-hatched fills rep-resent data obtained from vapor-rich inclusions, whereassolid fills depict data obtained from liquid-rich inclusions.
THE MOUNT CHARLOTTE GOLD DEPOSIT, KALGOORLIE, AUSTRALIA 1399
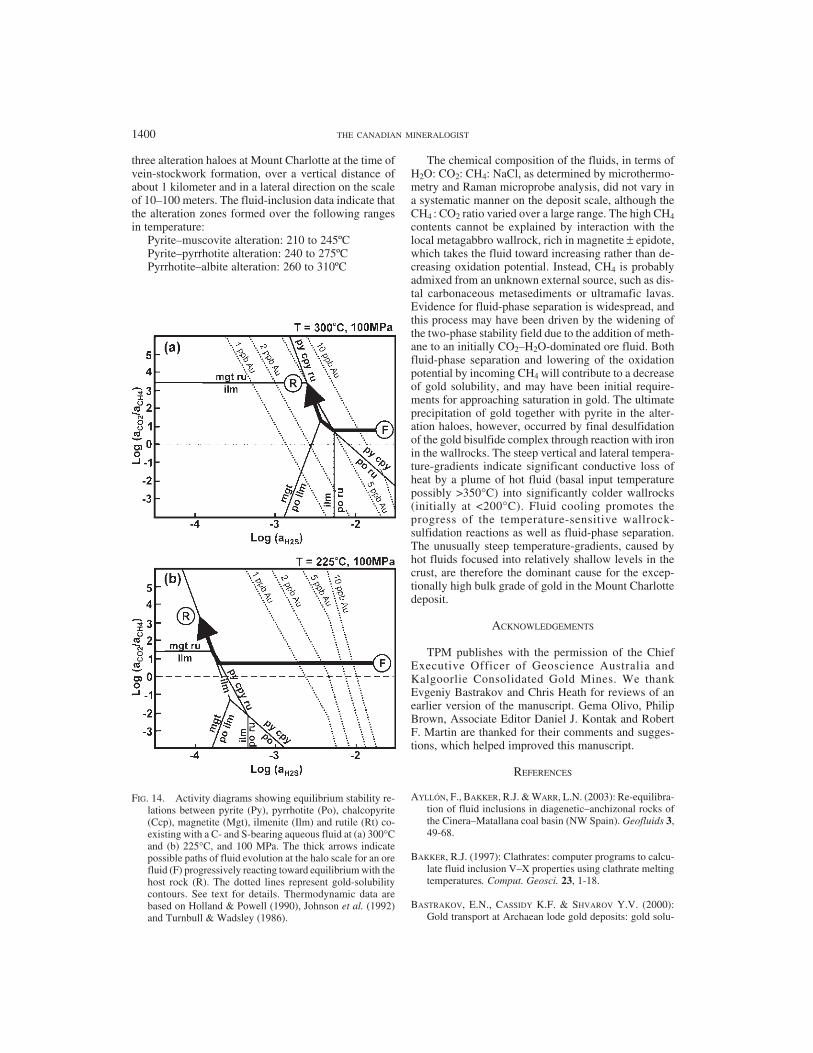
The tendency toward higher temperatures of miner-alization for pyrite–pyrrhotite and pyrrhotite–albite al-teration explains the restriction of pyrrhotite-bearingalteration assemblages to the deeper and central parts ofthe mine. Figure 14 shows a plot of ore–fluid evolutionin redox potential (expressed as CO2/CH4) and H2S ac-tivity space. Initial compositions of the fluid (marked Fin the figures) are assumed to be close to the composi-tion of the moderately reduced fluids with minor CH4,and a high activity of H2S in the stability field of pyrite(but probably pyrite-undersaturated for lack of Fe), con-sistent with local precipitation of vein pyrite within thedeepest veins associated with pyrrotite–albite alteration(Mikucki 1998).
At temperatures around 300°C, partial desulfidationof such a hot and moderately reduced fluid owing toreaction with the wallrock will soon lead to pyrrhotitesaturation (Fig. 14a), thus forming the pyrrhotite zonesobserved in the pyrite–pyrrhotite and pyrrhotite–albitealteration zones. The degree of reaction depends oncompeting reactions involving iron silicates, oxides andcarbonates, but probably passes near the magnetite –pyrrhotite – pyrite triple point, as indicated by the pres-ence of magnetite–pyrrhotite assemblages in the outer
portions of pyrrhotite–albite alteration zones. Further-more, zoning of Fe–Ti oxide and sulfide assemblageswithin the alteration haloes indicates that the fluids be-came progressively more oxidized during reaction withthe wallrocks.
At lower temperatures (e.g., 225°C), the ore fluidsreacting with the wallrocks became rapidly depleted inS by forming pyrite within the proximal bleached zone.At these lower temperatures, even an extremely reduced(CH4-dominant) fluid will not reach the stability fieldof pyrrhotite (Fig. 14b). Therefore, no pyrrhotite is pre-cipitated in pyrite–muscovite alteration haloes, whichfollow a path of decreasing H2S activity and increasingoxidation potential. The reaction will cease once condi-tions reach equilibrium with the host-rock assemblage,as indicated by R in Figure 14. Note also that gold solu-bility is much lower at this temperature (Fig. 14b com-pared with Fig. 14a), which leads to precipitation of over99% of the gold from the fluid.
CONCLUSIONS
Fluid-inclusion data from this study indicate thattemperature gradients of up to 100ºC existed across the
FIG. 13. Plot of homogenization temperature of the carbonic phase (Thcar) versus temepratures of final melting of the carbonicphase (Tmcar) for H2O–CO2(–CH4) inclusions in the three alteration haloes. Contours of X(CH4) and V are constructed fromfigures in Thiery et al. (1994).
1400 THE CANADIAN MINERALOGIST
three alteration haloes at Mount Charlotte at the time ofvein-stockwork formation, over a vertical distance ofabout 1 kilometer and in a lateral direction on the scaleof 10–100 meters. The fluid-inclusion data indicate thatthe alteration zones formed over the following rangesin temperature:
Pyrite–muscovite alteration: 210 to 245ºCPyrite–pyrrhotite alteration: 240 to 275ºCPyrrhotite–albite alteration: 260 to 310ºC
The chemical composition of the fluids, in terms ofH2O: CO2: CH4: NaCl, as determined by microthermo-metry and Raman microprobe analysis, did not vary ina systematic manner on the deposit scale, although theCH4 : CO2 ratio varied over a large range. The high CH4contents cannot be explained by interaction with thelocal metagabbro wallrock, rich in magnetite ± epidote,which takes the fluid toward increasing rather than de-creasing oxidation potential. Instead, CH4 is probablyadmixed from an unknown external source, such as dis-tal carbonaceous metasediments or ultramafic lavas.Evidence for fluid-phase separation is widespread, andthis process may have been driven by the widening ofthe two-phase stability field due to the addition of meth-ane to an initially CO2–H2O-dominated ore fluid. Bothfluid-phase separation and lowering of the oxidationpotential by incoming CH4 will contribute to a decreaseof gold solubility, and may have been initial require-ments for approaching saturation in gold. The ultimateprecipitation of gold together with pyrite in the alter-ation haloes, however, occurred by final desulfidationof the gold bisulfide complex through reaction with ironin the wallrocks. The steep vertical and lateral tempera-ture-gradients indicate significant conductive loss ofheat by a plume of hot fluid (basal input temperaturepossibly >350°C) into significantly colder wallrocks(initially at <200°C). Fluid cooling promotes theprogress of the temperature-sensitive wallrock-sulfidation reactions as well as fluid-phase separation.The unusually steep temperature-gradients, caused byhot fluids focused into relatively shallow levels in thecrust, are therefore the dominant cause for the excep-tionally high bulk grade of gold in the Mount Charlottedeposit.
ACKNOWLEDGEMENTS
TPM publishes with the permission of the ChiefExecutive Officer of Geoscience Australia andKalgoorlie Consolidated Gold Mines. We thankEvgeniy Bastrakov and Chris Heath for reviews of anearlier version of the manuscript. Gema Olivo, PhilipBrown, Associate Editor Daniel J. Kontak and RobertF. Martin are thanked for their comments and sugges-tions, which helped improved this manuscript.
REFERENCES
AYLLÓN, F., BAKKER, R.J. & WARR, L.N. (2003): Re-equilibra-tion of fluid inclusions in diagenetic–anchizonal rocks ofthe Cinera–Matallana coal basin (NW Spain). Geofluids 3,49-68.
BAKKER, R.J. (1997): Clathrates: computer programs to calcu-late fluid inclusion V–X properties using clathrate meltingtemperatures. Comput. Geosci. 23, 1-18.
BASTRAKOV, E.N., CASSIDY K.F. & SHVAROV Y.V. (2000):Gold transport at Archaean lode gold deposits: gold solu-
FIG. 14. Activity diagrams showing equilibrium stability re-lations between pyrite (Py), pyrrhotite (Po), chalcopyrite(Ccp), magnetite (Mgt), ilmenite (Ilm) and rutile (Rt) co-existing with a C- and S-bearing aqueous fluid at (a) 300°Cand (b) 225°C, and 100 MPa. The thick arrows indicatepossible paths of fluid evolution at the halo scale for an orefluid (F) progressively reacting toward equilibrium with thehost rock (R). The dotted lines represent gold-solubilitycontours. See text for details. Thermodynamic data arebased on Holland & Powell (1990), Johnson et al. (1992)and Turnbull & Wadsley (1986).
THE MOUNT CHARLOTTE GOLD DEPOSIT, KALGOORLIE, AUSTRALIA 1401
bility along the rock-buffered pathways. Geol. Soc. Aust.,Abstr. 59, 25.
BERNDT, M.E., ALLEN, D.E. & SEYFRIED, W.E., JR. (1996):Reduction of CO2 during serpentinization of olivine at300°C and 500 bar. Geology 24, 351-354.
BINNS, R.A., GUNTHORPE, R.J. & GROVES, D.I. (1976): Meta-morphic patterns and development of greenstone belts inthe eastern Yilgarn block, Western Australia. In The EarlyHistory Of The Earth (B.F. Windley, ed.). Wiley, London,U.K. (303-313).
BODNAR, R.J., BINNS, P.R. & HALL, D.L. (1989): Syntheticfluid inclusions. VI. Quantitative evaluation of the decrepi-tation behaviour of fluid inclusions in quartz at one atmos-phere confining pressure. J. Metamorph. Geol. 7, 229-242.
________ & VITYK, M.O. (1994): Interpretation of micro-thermometric data for H2O–NaCl fluid inclusions. In FluidInclusions in Minerals: Methods and Applications (B.DeVivo & M.L. Frezzotti, eds.). Virginia Polytechnic In-stitute and State University Press, Blacksburg, Virginia(117-130).
BROWN, P.E. & HAGEMANN, S.G. (1995): MacFlinCor and itsapplication to fluids in Archaean lode-gold deposits.Geochim. Cosmochim. Acta 59, 3943-3952.
CHANNER, D.M. D. & SPOONER, E.T.C. (1991): Multiple fluidinclusion generations in variably deformed quartz:Hollinger–McIntyre and Kerr Addison–ChestervilleArchean gold-bearing quartz vein systems. northern On-tario. Ontario Geol. Surv., Misc. Pap. 156, 47-64.
CLARK, M. E. (1980): Localization of Gold, Mt Charlotte,Kalgoorlie, Western Australia. Honours thesis, The Uni-versity of Western Australia, Perth, Australia.
CLOUT, J.M.F., CLEGHORN, J.H. & EATON, P.C. (1990): Geol-ogy of the Kalgoorlie gold field. In Geology of the MineralDeposits of Australia and Papua New Guinea (F.E. Hughes,ed.). The Australasian Institute of Mining and Metallurgy,Melbourne, Australia (411-431).
DIAMOND, L.W. & MARSHALL, D.D. (1990): Evaluation of thefluid-inclusion crushing-stage as an aid in exploration formesothermal gold–quartz deposits. J. Geochem. Expl. 38,285-297.
DRUMMOND, S.E. & OHMOTO, H. (1985): Chemical evolutionand mineral deposition in boiling hydrothermal systems.Econ. Geol. 80, 126-147.
DUBESSY, J., POTY, B. & RAMBOZ, C. (1989): Advances in C–O–H–N–S fluid geochemistry based on micro-Ramanspectrometric analysis of fluid inclusions. Eur. J. Mineral.1, 517-534.
FAN, HONGRUI, GROVES, D.I., MIKUCKI, E.J. & MCNAUGHTON,N.J. (2000): Contrasting fluid types at the Nevoria golddeposit in the Southern Cross greenstone belt, WesternAustralia: implications of auriferous fluids depositing ores
within an Archaean banded iron-formation. Econ. Geol. 95,1527-1536.
GEHRIG, M., LENTZ, H. & FRANCK, E.U. (1986): The systemwater – carbon dioxide – sodium chloride to 773 K and 300MPa. Ber. Bunsenges Phys. Chem. 90, 525-533.
GOLDING, S.D., CLARK, M.E., KEELE, R.A., WILSON, A.F. &KEAYS, R.R. (1990): Geochemistry of Archaean epigeneticgold deposits in the Eastern Goldfields province, WesternAustralia. In Stable Isotopes and Fluid Processes in Miner-alization (H.K. Herbert & S.E. Ho, eds.). Geology Depart-ment & University Extension, The University Of WesternAustralia, Perth, Australia, Publ. 23, 141-176.
GOLDSTEIN, R.H. & REYNOLDS, T.J. (1994): Systematics offluid inclusions in diagenetic minerals. SEPM (Society forSedimentary Geology), Short Course 31.
GROVES, D.I., BARLEY, M.E., BARNICOAT, A.C., CASSIDY, K.F.,FARE, R.J., HAGEMANN, S.G., HO, S.E., HRONSKY, J.M.A.,MIKUCKI, E.J., MUELLER, A.G., MCNAUGHTON, N.J.,PERRING, C.S., RIDLEY, J.R. & VEARNCOMBE, J.R. (1992):Sub-greenschist to granulite-hosted Archaean lode-golddeposits of the Yilgarn Craton: a depositional continuumfrom deep-sourced hydrothermal fluids in crustal-scaleplumbing systems. In The Archaean: Terrains, Processesand Metallogeny (J.E. Glover & S.E. Ho, eds.). GeologyDepartment (Key Centre) & University Extension, TheUniversity of Western Australia Publication, Perth, West-ern Australia, 325-337.
HARBI, H.M. (1997): Origin of the Stockwork Gold Minerali-zation at Kalgoorlie, Western Australia. Ph.D. thesis, theUniversity of Western Australia, Perth, Western Australia.
HEDENQUIST, J.W., ARRIBAS, A., JR. & REYNOLDS, T.J. (1998):Evolution of an intrusion-centered hydrothermal system:Far Southeast-Lepanto porphyry and epithermal Cu–Audeposits, Philippines. Econ. Geol. 93, 373-404.
HO, S. E. (1986): A Fluid Inclusion Study of Archaean GoldDeposits in the Yilgarn Block, Western Australia. Ph.D.thesis, the University of Western Australia, Perth, WesternAustralia.
________, BENNETT, J.M., CASSIDY, K.F., HRONSKY, J.M.A.,MIKUCKI, E.J. & SANG, J.H. (1990a): Nature of ore fluid,and transportational and depositional conditions in sub-amphibolite facies deposits. In Gold Deposits of theArchaean Yilgarn Block, Western Australia: Nature, Gen-esis and Exploration Guides (S.E. Ho, D.I. Groves & J.M.Bennett, eds.). Geology Department and University Exten-sion, The University Of Western Australia, Perth, WesternAustralia, Publ. 20, 198-211.
________, GROVES, D.I. & PHILLIPS, G.N. (1990b): Fluid in-clusions in quartz veins associated with Archaean goldmineralization: clues to ore fluids and ore depositional con-ditions and significance to exploration. In Stable Isotopesand Fluid Processes in Mineralization (H.K. Herbert & S.E.Ho, eds.). Geology Department and University Extension,the University of Western Australia, Perth, Western Aus-tralia, Publ. 23, 35-50.
1402 THE CANADIAN MINERALOGIST
HOLLAND, T.J.B. & POWELL, R. (1990): An enlarged and up-dated internally consistent thermodynamic dataset withuncertainties and correlations: the system K2O–Na2O–CaO–MgO–MnO–FeO–Fe2O3–Al2O3–TiO2–SiO2–C–H2–O2. J. Metamorph. Geol. 8, 89-124.
JACOBS, G.K. & KERRICK, D.M. (1981): Methane: an equationof state with application to the ternary system H2O–CO2–CH4. Geochim. Cosmochim. Acta 45, 607-614.
JOHNSON, J.W., OELKERS, E.H. & HELGESON, H.C. (1992):Supcrt92: a software package for calculating the standardmolal thermodynamic properties of minerals, gases, aque-ous species, and reactions from 1 to 5000 bars and 0° to1000°C. Comput. Geosci. 18, 899-947.
KAWABE, I. (1979): Lattice dynamical aspect of oxygen iso-tope partition function ratio for alpha quartz. Geochem. J.13, 57-67.
KEATS, W. (1987): Regional Geology of the Kalgoorlie–Boul-der gold-mining district. Geol. Surv. Western Aust., Perth,Western Australia.
KENT, A.J.R. & MCDOUGALL, I. (1995) 40Ar–39Ar and U–PbAge constraints on the timing of gold mineralization in theKalgoorlie gold field, Western Australia. Econ. Geol. 90,845-859.
KERRICH, R. & FYFE, W. S. (1981): The gold–carbonate asso-ciation: source of CO2, and CO2 fixation reactions inArchaean lode deposits. Chem. Geol. 33, 265-294.
LIU, LIN-GUN & MERNAGH, T.P. (1990): Phase transitions andRaman spectra of calcite at high pressures and room tem-perature. Am. Mineral. 75, 801-806.
LOUCKS, R.R. & MAVROGENES, J.A. (1999): Gold solubility insupercritical hydrothermal brines measured in syntheticfluid inclusions. Science 284, 2159-2163.
MERNAGH, T.P. & WITT, W.K. (1994): Early, methane-rich flu-ids and their role in Archaean gold mineralization at theSand King and Missouri deposits, Eastern Goldfields Prov-ince, Western Australia. AGSO J. Aust. Geol. Geophys. 15,297-312.
MIKUCKI, E.J. (1998): Hydrothermal transport and depositionalprocesses in Archaean lode-gold systems: a review. OreGeol. Rev. 13, 307-321.
________ & HEINRICH, C.A. (1993): Vein- and mine-scalewall-rock alteration and gold mineralization in theArchaean Mount Charlotte deposit, Kalgoorlie, WesternAustralia. In Kal ’93, Kalgoorlie, 1993. Aust. Geol. Surv.Organisation Record, 135-140.
________ & RIDLEY, J.R. (1993): The hydrothermal fluid ofArchaean lode-gold deposits at different metamorphicgrades: compositional constraints from ore and wallrockalteration assemblages. Mineral. Deposita 28, 469-481.
NADEN, J. & SHEPHERD, T.J. (1989): Role of methane and car-bon dioxide in gold deposition. Nature 342, 793-795.
NEALL, F.B. & PHILLIPS, G.N. (1987): Fluid–wallrock interac-tion in an Archaean hydrothermal gold deposit: a thermo-dynamic model for the Hunt mine, Kambalda. Econ. Geol.82, 1679-1694.
OLIVO, G.R. & WILLIAMS-JONES, A.E. (2002): Genesis of theauriferous C quartz–tourmaline vein of the Siscoe mine,Val d’Or District, Abitibi Subprovince, Canada: structural,mineralogical and fluid inclusion constraints. Econ. Geol.97, 929-947.
PASTERIS, J.D., WOPENKA, B. & SEITZ, J.C. (1988): Practicalaspects of quantitative laser Raman microprobe spectro-scopy for the study of fluid inclusions. Geochim.Cosmochim. Acta 52, 979-988.
PECHER, A. (1981): Experimental decrepitation and re-equili-bration of fluid inclusions in synthetic quartz.Tectonophysics 78, 567-583.
PHILLIPS, G.N. & GROVES, D.I. (1983): The nature of Archaeangold-bearing fluids as deduced from gold deposits of West-ern Australia. J. Geol. Soc. Aust. 30, 25-39.
RAMBOZ, C., PICHAVANT, M. & WEISBROD, A. (1982): Fluidimmiscibility in natural processes: use and misuse of fluidinclusion data. Chem. Geol. 37, 29-48.
RIDLEY, J.R. & DIAMOND, L.W. (2000): Fluid chemistry oforogenic lode gold deposits and implications for geneticmodels. Rev. Econ. Geol. 13, 141-162.
________, GROVES, D.I. & MIKUCKI, E.J. (1994): MajorArchaean lode-gold deposits: fluid focussing and chemicalevolution in vertically extensive hydrothermal systems.Geol. Soc. Aust., Abstr. 37, 374.
________ & HAGEMANN, S.G. (1999): Interpretation of post-entrapment fluid-inclusion re-equilibration at the ThreeMile Hill, Marvel Loch and Griffins Find high-tempera-ture lode-gold deposits, Yilgarn Craton, Western Australia.Chem. Geol. 154, 257-278.
________ & MENGLER, F. (2000): Lithological and structuralcontrols on the form and setting of vein stockworkorebodies at the Mount Charlotte gold deposit, Kalgoorlie.Econ. Geol. 95, 85-98.
ROBERT, F. & KELLY, W.C. (1987): Ore-forming fluids inArchean gold-bearing quartz veins at the Sigma mine,Abitibi greenstone belt, Quebec, Canada. Econ. Geol. 82,1464-1482.
ROEDDER, E. (1984): Fluid Inclusions. Rev. Mineral. 12.
SCHMIDT, C. & BODNAR, R.J. (2000): Synthetic fluid inclusions.XVI. PVTX properties in the system H2O–NaCl–CO2 atelevated temperatures, pressures, and salinities. Geochim.Cosmochim. Acta 64, 3853-3869.
SCOTT, R.J. (1997): Fault control on fluid flow and mineraliza-tion at Mount Charlotte and the Golden Mile. Aust. Geol.Surv. Organisation Rec. 1997/41, 145-150.
THE MOUNT CHARLOTTE GOLD DEPOSIT, KALGOORLIE, AUSTRALIA 1403
SIBSON, R.H., ROBERT, F. & POULSON, K.H. (1988): High-an-gle reverse faults, fluid pressure cycling and mesothermalgold–quartz deposits. Geology 16, 551-555.
SWAGER, C., GRIFFIN, T.J., WITT, W.K., WYCHE, S., AHMAT,A.L., HUNTER, W.M. & MCGOLDRICK, P.J. (1990): Geol-ogy of the Archaean Kalgoorlie terrain – an explanatorynote. Geol. Surv. Western Australia, Rec. 1990/12.
THIERY, R., VAN DEN KERKOF, A.M. & DUBESSY, J. (1994): Vxproperties of CH4–CO2 and CO2–N2 fluid inclusions: mod-elling for T < 31°C and P < 400 bars. Eur. J. Mineral. 6,753-771.
TRAVIS, G.A., WOODALL, R. & BARTRAM, G.D. (1971): Thegeology of the Kalgoorlie goldfield. Geol. Soc. Aust., Spec.Publ. 3, 175-190.
TOURET, J.L.R. (2001): Fluids in metamorphic rocks. Lithos55, 1-25.
TURNBULL, A.G. & WADSLEY, M.W. (1986): The CSIRO–SGTEThermodata System, Version V. CSIRO Division of MineralChemistry Communication, Melbourne, Australia 7.
VAN DEN KERKHOF, A.M. (1988): The System CO2–CH4–N2 inFluid Inclusions: Theoretical Modelling and GeologicalApplications. Ph.D. thesis, Vrije Universiteit, Amsterdam,The Netherlands.
WITT, W. K. (1991): Regional metamorphic controls on altera-tion associated with gold mineralization in the EasternGoldfields province, Western Australia: implications forthe timing and origin of Archean lode-gold deposits. Geol-ogy 19, 982-985
WOODALL, R.W. (1965): Structure of the Kalgoorlie goldfield.In Geology of Australian Ore Deposits (J. McAndrew, ed.).The Australasian Institute of Mining and Metallurgy, Mel-bourne, Australia (71-79).
YEATS, C.J. & VANDERHOR, F. (1998): Archaean lode-golddeposits. AGSO J. Aust. Geol. Geophys. 17, 253-258.
Received November 8, 2002, revised manuscript acceptedMay 13, 2003.