Embed Size (px)
Citation preview

TEMPERATURE DEPENDENCES OF MECHANISMS TEMPERATURE DEPENDENCES OF MECHANISMS RESPONCIBLE FOR THE WATER-VAPOR RESPONCIBLE FOR THE WATER-VAPOR
CONTINUUM CONTINUUM
Q. MaQ. MaNASA/Goddard Institute for Space Studies & NASA/Goddard Institute for Space Studies & Department of Applied Physics and Applied Department of Applied Physics and Applied
Mathematics, Columbia UniversityMathematics, Columbia University2880 Broadway, New York, NY 10025, USA2880 Broadway, New York, NY 10025, USA
R. H. TippingR. H. TippingDepartment of Physics and Astronomy,Department of Physics and Astronomy,
University of Alabama University of Alabama Tuscaloosa, AL 35487, USATuscaloosa, AL 35487, USA
C. LeforestierC. LeforestierInstitut Charles Gerhardt CNRS-5253, CC15.01, Institut Charles Gerhardt CNRS-5253, CC15.01,
Université Montpellier 2 Université Montpellier 2 34095, Montpellier, France34095, Montpellier, France

Water-Vapor Continuum and Possible Physical Water-Vapor Continuum and Possible Physical ExplanationsExplanations
The water-vapor continuum absorption plays an important role in The water-vapor continuum absorption plays an important role in determining the radiation in the Earth’s atmosphere. To find its determining the radiation in the Earth’s atmosphere. To find its physical explanations is still an open problem. physical explanations is still an open problem.
Basic features of the water-vapor continuum absorption:Basic features of the water-vapor continuum absorption: 1) depends on the pressures quadratically.1) depends on the pressures quadratically. 2) varies with the frequency smoothly.2) varies with the frequency smoothly. 3) in general, has a negative temperature dependence.3) in general, has a negative temperature dependence.
Three mechanisms have been suggested: the far-wings of allowed Three mechanisms have been suggested: the far-wings of allowed transition lines, collision-induced absorption, and water dimers.transition lines, collision-induced absorption, and water dimers.
Absorptions derived from three mechanisms have different Absorptions derived from three mechanisms have different
magnitudes and different T dependences. magnitudes and different T dependences.
In the present study, we mainly analyze their T dependences.In the present study, we mainly analyze their T dependences.

I. The Far-Wing Theory I. The Far-Wing Theory
Facts about the continuum of the far-wing theory:Facts about the continuum of the far-wing theory: (1) The total absorption consists of contributions from local H(1) The total absorption consists of contributions from local H22O O
lines and from remote lines. How to divide these two lines and from remote lines. How to divide these two components depends on people’s choices. components depends on people’s choices.
(2) Two components are inseparable. When one talks about the (2) Two components are inseparable. When one talks about the continuum, one must talk about the local line absorption also. continuum, one must talk about the local line absorption also.
(3) The second component exhibits similar characteristics of the (3) The second component exhibits similar characteristics of the water-vapor continuum and is referred as the continuum from water-vapor continuum and is referred as the continuum from allowed lines. allowed lines.
Within bands, the total absorptions mainly come from local lines. Within bands, the total absorptions mainly come from local lines. There are uncertainties in calculating local line absorptions that There are uncertainties in calculating local line absorptions that are mainly associated with line spectroscopic parameters and are mainly associated with line spectroscopic parameters and line shape models used. The uncertainties could overshadow the line shape models used. The uncertainties could overshadow the continuum. continuum.
In windows between the HIn windows between the H22O bands, there are few strong lines. O bands, there are few strong lines. The continuum becomes the dominant component. Thus, we can The continuum becomes the dominant component. Thus, we can talk about the continuum with certainty in the windows.talk about the continuum with certainty in the windows.

I-A. Continuum from the Far-Wing Theory I-A. Continuum from the Far-Wing Theory In terms of the band-averaged line shape function the In terms of the band-averaged line shape function the
continuum absorption is given bycontinuum absorption is given by
We introduce the coordinate representation by choosing orientations We introduce the coordinate representation by choosing orientations of two interacting molecules as the basis set of Hilbert space of two interacting molecules as the basis set of Hilbert space
where where ΩΩaaζζ and and ΩΩbbζζ represent orientations of the absorber and bath represent orientations of the absorber and bath molecules, respectively.molecules, respectively.
In the coordinate representation, interaction potentials V are In the coordinate representation, interaction potentials V are diagonal and can be treated as ordinary functionsdiagonal and can be treated as ordinary functions
where are values of V at the specified orientation where are values of V at the specified orientation ζζ..
ˆ( ),
2 20
sin ( / 2 ) 1 1 1ˆ ˆ( ) [ ( ) ( )],
sin ( / 2 ) ( ) ( )
ij
a ij ij ijij ij ij ij
h kTn S
h kT
| | ( ) | ( ) ,a a b b
( , , ) | ( , , ) | , a b a bV r V r
( , , ) a bV r

I-B. Far-Wing Line Shapes I-B. Far-Wing Line Shapes Far-wing line shapes depend on the molecular pair of interest and on Far-wing line shapes depend on the molecular pair of interest and on
the interaction potential between these two molecules.the interaction potential between these two molecules.
where Vwhere V1 1 is the anisotropic part of the potential, Vis the anisotropic part of the potential, V1,1,ζζ = < = <ζζ|V|V11||ζζ>, >, V΄V΄1,1,ζηζη(r) = (r) =
dVdV1,1,ζζ(r)/dr - dV(r)/dr - dV1,1,ηη(r)/dr, and r(r)/dr, and rc c is determined from the equation is determined from the equation
We adopt the five-site TIP5P potential model by assuming the We adopt the five-site TIP5P potential model by assuming the potential consists of the Coulomb site-site interactions and the potential consists of the Coulomb site-site interactions and the Lennard-Jones site-site interaction.Lennard-Jones site-site interaction.
With the Monte Carlo method, one can evaluate the 11-dimensional With the Monte Carlo method, one can evaluate the 11-dimensional integrations. In general, by using about 10integrations. In general, by using about 107 7 random selections of the random selections of the orientation variables one can derive converged line shapes within orientation variables one can derive converged line shapes within reasonable CPU times.reasonable CPU times.
1, 1,
2 2 2 20
2[ ( ) ( )]/ 2 ( ) /
'1,
ˆ( ) 4 | | | |
,| ( ) |
c c iso c
b a b
V r V r kT V r kTc
c
n d d
re
V r
1, 1,( ) ( ) . c cV r V r
12 60 00( , , ) 4 [( ) ( ) ].
i ja b
i a j b ij oo oo
qqV r
r r r

I-C. Factors Affecting T Dependence of the Continuum I-C. Factors Affecting T Dependence of the Continuum from Allowed Lines from Allowed Lines
Factors affecting the T dependence of the continuum:Factors affecting the T dependence of the continuum: (1) Number density n(1) Number density na a of the absorber molecule.of the absorber molecule. (2) Line intensities S(2) Line intensities Sij. (3) (3) The line shape functions. More explanations are given later.The line shape functions. More explanations are given later.
Effect from nEffect from naa: It depends on the units of the absorption coefficients. If : It depends on the units of the absorption coefficients. If
αα((ωω) is given in units of cm) is given in units of cm22/(molecule atm), /(molecule atm), nna a does not cause any T does not cause any T dependence.dependence.
Effect from SEffect from Sij : For an individual line, how its intensity : For an individual line, how its intensity varies with T is well known. However, we need to know how the line intensity distributions vary with T.
For ω < 250cm-1, line strengths at 290K are higher than those at 330K. For ω > 250cm-1, the trend is reversed.
For 900cm-1 < ω < 1300cm-1, line strengths at higher T are significant larger than those at lower T.

I-D. The T Dependence of the Line Shape I-D. The T Dependence of the Line Shape There are three players in determining the T dependence of the There are three players in determining the T dependence of the
line shape: the density matrix, the potential, and the number line shape: the density matrix, the potential, and the number density of the bath molecules. The first two are main ones, but density of the bath molecules. The first two are main ones, but the density matrix is more crucial. the density matrix is more crucial.
The density matrix is a product of two factorsThe density matrix is a product of two factors
For the HFor the H22O-HO-H22O pair, these two factors are the same.O pair, these two factors are the same.
is a three-dimensional distribution function with is a three-dimensional distribution function with three Euler angles three Euler angles ((ζηζη), ), ((ζηζη)), and , and ((ζηζη)), representing a rotation from , representing a rotation from the orientation the orientation ζζ to the orientation to the orientation ηη..
The distribution function satisfies the normalization condition
and sensitively depends on the temperature.
2 2 2| | | | | | | | | | | | .a b a a a b b b
2| | | | a a a
2 2
20 0 0
1( , , )sin .
8F d d d

The T dependence of the density matrixThe T dependence of the density matrix
Fig.1 The two-dimensional Fig.1 The two-dimensional distribution of Hdistribution of H22O over the O over the two sensitive variables β two sensitive variables β and u obtained at T = 290 and u obtained at T = 290 K. This distribution results K. This distribution results from the averaging G(β, u, from the averaging G(β, u, v) over the one insensitive v) over the one insensitive variable v.variable v.
Fig. 2 The same as Fig. 1, except T = 330 K.There two sensitive variables and u ≡ (+)/2 and one insensitive variable v ≡ (-)/2.
How does the density matrix play a crucial role to How does the density matrix play a crucial role to cause a negative T dependence of the line shapecause a negative T dependence of the line shape
The profile of the distribution exhibits three large peaks along the u The profile of the distribution exhibits three large peaks along the u axis. As T increases, these peaks become higher and their widths axis. As T increases, these peaks become higher and their widths become narrower.become narrower.
The distribution represents a quantitative measure of the probability The distribution represents a quantitative measure of the probability
with which the molecule moves from the initial orientations to the final with which the molecule moves from the initial orientations to the final ones after the transitions take place.ones after the transitions take place.
The δ-function-like peaks mean that the molecule is less likely to make The δ-function-like peaks mean that the molecule is less likely to make large reorientations. The higher the temperature, the less likely large large reorientations. The higher the temperature, the less likely large reorientations occur.reorientations occur.
Only large reorientations can make contributions to the far-wing line Only large reorientations can make contributions to the far-wing line shapes by providing enough energy to meet large frequency shapes by providing enough energy to meet large frequency detunings. It is the negative T dependence of the reorientations that detunings. It is the negative T dependence of the reorientations that causes the negative T dependence of the line-shape functions, and, causes the negative T dependence of the line-shape functions, and, consequently, of the continuum.consequently, of the continuum.

T dependence of the line shapesT dependence of the line shapes
Fig. 3 The self-Fig. 3 The self-broadened far-wing broadened far-wing line shapes of Hline shapes of H22O (in O (in units of cmunits of cm-1 -1 atmatm-1-1) as ) as a function of ω (in a function of ω (in units of cmunits of cm-1-1) for T = ) for T = 250, 260, 270, 280, 250, 260, 270, 280, 290, 300, 310, 320, 290, 300, 310, 320, 330, 340, 350, 360, 330, 340, 350, 360, and 370 K. These and 370 K. These results are results are represented by the represented by the solid lines from the solid lines from the top to bottom, top to bottom, respectively.respectively.
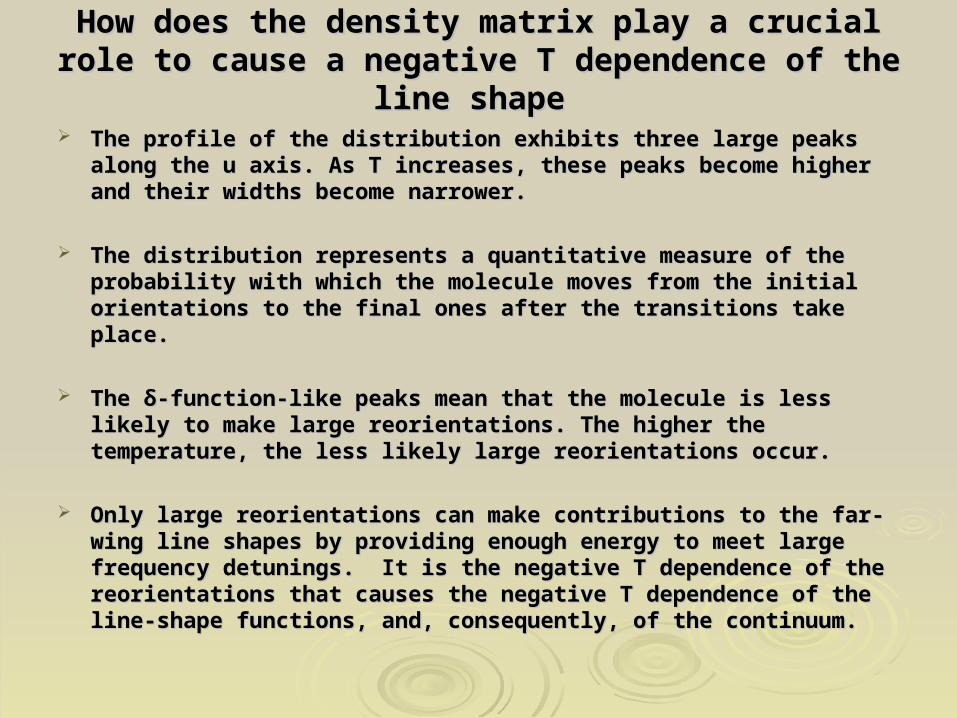
I-E. The calculated continuumI-E. The calculated continuum
Fig. 4 The calculated Fig. 4 The calculated continuum absorption continuum absorption coefficients (in cmcoefficients (in cm22/ / (molecule atm) at T = (molecule atm) at T = 296 K in the 300 – 1100 296 K in the 300 – 1100 cmcm-1 -1 spectral region are spectral region are denoted by ∆. The denoted by ∆. The experimental values of experimental values of Burch et al. are Burch et al. are denoted by +.denoted by +.
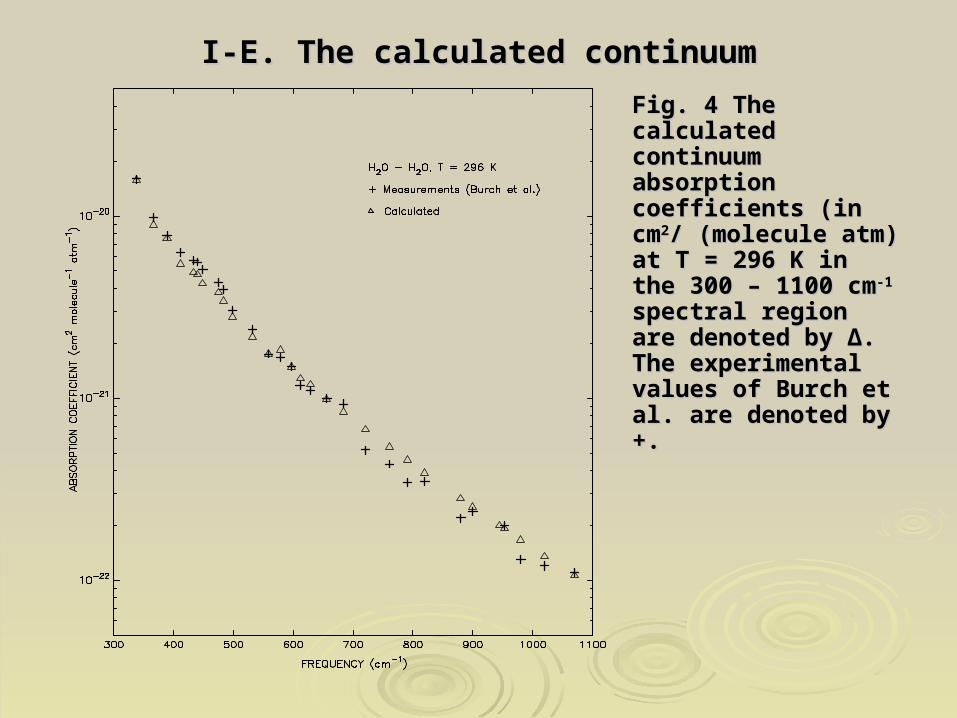
I-E. The calculated continuumI-E. The calculated continuum
Fig. 5 Measured Fig. 5 Measured αα((ωω)) by Baranov at 27 micro-windows within 800 – 1150 cm by Baranov at 27 micro-windows within 800 – 1150 cm-1 -1 for T for T = 310.8, 325.8, and 363.6 K. They are represented by +. Seven of Burch’s data at 296 = 310.8, 325.8, and 363.6 K. They are represented by +. Seven of Burch’s data at 296 K and two results of Cormier at 296 and 310 K are plotted by small symbols K and two results of Cormier at 296 and 310 K are plotted by small symbols and □, and □, respectively. From top to bottom, calculated respectively. From top to bottom, calculated αα((ωω)) at these micro-windows for T = at these micro-windows for T = 296, 310.8, 325.8, and 363.6 K are plotted by ∆. In addition, MT_CKD values for the 296, 310.8, 325.8, and 363.6 K are plotted by ∆. In addition, MT_CKD values for the four temperatures are plotted by dotted lines. four temperatures are plotted by dotted lines.

I-F. T dependence of the continuum from allowed lines I-F. T dependence of the continuum from allowed lines
Absorption coefficients Absorption coefficients αα((ωω) ) exhibit a strong negative T exhibit a strong negative T dependence. How strong the T dependence is varies with dependence. How strong the T dependence is varies with ωω..
Empirical formula used to describe the T dependence of Empirical formula used to describe the T dependence of αα((ωω))
where Twhere T00 (i.e., the characteristic temperature) is a parameter and it (i.e., the characteristic temperature) is a parameter and it could vary as could vary as ωω varies. varies.
Notice: Values of TNotice: Values of T00 depend on the units used for depend on the units used for αα((ωω). In ). In general, values of Tgeneral, values of T00 are derived from are derived from αα((ωω) given in the units of ) given in the units of cmcm22/(molecule atm)./(molecule atm).
This is a simple and effective way to describe the T This is a simple and effective way to describe the T dependence of dependence of αα((ωω). But, one can not use this formula to ). But, one can not use this formula to predict predict αα((ωω,T) for temperatures which are far away from those ,T) for temperatures which are far away from those used to fit the formula. used to fit the formula.
01 1
[( )]296
0( , ) ( ) ,T
TT e

I-F. T dependence of the continuum from allowed linesI-F. T dependence of the continuum from allowed lines
Fig. 6 The calculated continuum absorption (in units of cmFig. 6 The calculated continuum absorption (in units of cm2 2 /(molecule atm) at 944.195 cm/(molecule atm) at 944.195 cm-1-1 for for temperatures ranging from 250 – 350 K. Theoretical values are presented by the solid line. temperatures ranging from 250 – 350 K. Theoretical values are presented by the solid line. Measurements of Hinderling et al. are presented by ∆ and values of Loper et al. by Measurements of Hinderling et al. are presented by ∆ and values of Loper et al. by ◊◊. Results by Cormier . Results by Cormier et al. are given by et al. are given by □□..

I-F. T dependence of the continuum from allowed linesI-F. T dependence of the continuum from allowed lines
Fig. 7 Characteristic temperature TFig. 7 Characteristic temperature T0 0 derived from derived from αα((ωω) ) (in cm(in cm22/(molecule atm)). Values of T/(molecule atm)). Values of T00 derived from Baranov et al. and from Hinderling et al. data are given by + and derived from Baranov et al. and from Hinderling et al. data are given by + and ●●, , respectively. The one from Cormier et al. measurements is presented by respectively. The one from Cormier et al. measurements is presented by ◊◊. Our calculated T. Our calculated T00 are given by ∆ and those from MT_CKD are plotted with a solid line.are given by ∆ and those from MT_CKD are plotted with a solid line.

I-G. Conclusions on the T dependence of the I-G. Conclusions on the T dependence of the continuum from allowed lines continuum from allowed lines
In the infrared window region, the T dependence of the In the infrared window region, the T dependence of the continuum predicted by the far-wing theory is negative and continuum predicted by the far-wing theory is negative and moderately strong.moderately strong.
The T dependent pattern is not simple. It could vary The T dependent pattern is not simple. It could vary significantly as the frequency of interest varies.significantly as the frequency of interest varies.

II.The Dimer TheoryII.The Dimer Theory
The predicted dimer absorptions are proportional to the The predicted dimer absorptions are proportional to the square of the water-vapor pressure and exhibit very square of the water-vapor pressure and exhibit very strong negative T dependence. strong negative T dependence.
As a possible mechanism, the dimer theory was As a possible mechanism, the dimer theory was proposed several decades ago. However, reliable proposed several decades ago. However, reliable theoretical predictions are available only very recently.theoretical predictions are available only very recently.
How to estimate the number density of the dimer at the How to estimate the number density of the dimer at the temperature of interest is a crucial step in developing the temperature of interest is a crucial step in developing the dimer theory. Recently, progress on this subject has dimer theory. Recently, progress on this subject has been made. Thus, one is able to address the dimer been made. Thus, one is able to address the dimer absorptions and their T dependences quantitatively.absorptions and their T dependences quantitatively.

II-A. The Dimer AbsorptionII-A. The Dimer Absorption The dimer absorption coefficient α(ω) can be expressed asThe dimer absorption coefficient α(ω) can be expressed as
where nwhere nD D is the number density of the dimers, is the rotation-vibration is the number density of the dimers, is the rotation-vibration
partition function, Spartition function, Sn”n’ n”n’ are the dimer line strength factors and L is the line-shape are the dimer line strength factors and L is the line-shape function.function.
In terms of the equilibrium constant KIn terms of the equilibrium constant KPP(T) (in atm(T) (in atm-1-1))
the dimer number density nthe dimer number density nD D is defined byis defined by
where the subscripts and superscripts of D and M stand for the dimer and the where the subscripts and superscripts of D and M stand for the dimer and the
monomer of Hmonomer of H22O, respectively, represents the thermal de Broglie O, respectively, represents the thermal de Broglie wavelength, and Dwavelength, and D00 = 3.52 kcal/mol (i.e., 1771 K). = 3.52 kcal/mol (i.e., 1771 K).
KKPP(T) plays a crucial role for the T dependence of dimer absorptions.(T) plays a crucial role for the T dependence of dimer absorptions.
2/ /4
( ) ( ) ( , , ),3
n B n BE k T E k TnD nn n n nnD
n n n RV
gn e e S
c Q
L
DRVQ
2
( ) ( ), MD M M P P
B
Pn n P K T K T
k T
0 / 32
2 3
1( ) ( ) ,
BD D k T
RVD MP M
M B D RV
Q ePK T
P k T Q
/ 2X X Bh m k T

II-B. Factors Affecting the T Dependence of Dimer II-B. Factors Affecting the T Dependence of Dimer AbsorptionAbsorption
In order to analyze the T dependence, we divide In order to analyze the T dependence, we divide αα((ωω) into three ) into three factorsfactors
The first factor KThe first factor KPP(T)/Q(T)/QDDRVRV plays the dominant role in determining the plays the dominant role in determining the
T-dependence. More specifically, one can findT-dependence. More specifically, one can find
The second factor is H(The second factor is H(ωω,T) which contains all summations of ,T) which contains all summations of αα((ωω).). Approximately, one is able to express it T dependence asApproximately, one is able to express it T dependence as
The last factor is nThe last factor is nMMPPMM. Whether it causes an extra T dependence . Whether it causes an extra T dependence
depends on the units used for depends on the units used for αα((ωω). If the units is cm). If the units is cm22/(molecule /(molecule atm), atm), nnMMPPM M would not contribute the T dependence. would not contribute the T dependence.
0
0
3 /11/ 2 /
3/ 2 2
( ).
( ) ( )
B
B
D k TD k TP
D MRV B M B RV
K T h eT e
Q k T m k T Q
( )( ) ( , ) . P
M MDRV
K TH T n P
Q
3, sinh( ) .2 B
H T Tk T

II-C. T Dependence of Dimer AbsorptionII-C. T Dependence of Dimer Absorption The T dependence of The T dependence of αα((ωω) ) can be approximately expressed ascan be approximately expressed as
In cases of ħω/2kT <<1, the T dependence becomes uniform for In cases of ħω/2kT <<1, the T dependence becomes uniform for ω and can be expressedω and can be expressed
Conclusions on the T dependence of the dimer absorptionConclusions on the T dependence of the dimer absorption
(1) The dimer absorption has a very strong negative T (1) The dimer absorption has a very strong negative T dependence.dependence.
(2) The T dependence pattern is rather simpler, especially for (2) The T dependence pattern is rather simpler, especially for low frequency regions low frequency regions
05/ 2 /, sinh( ) .2 BD k T
M MB
T n P T ek T
07/ 2 /, . BD k TM MT n P T e
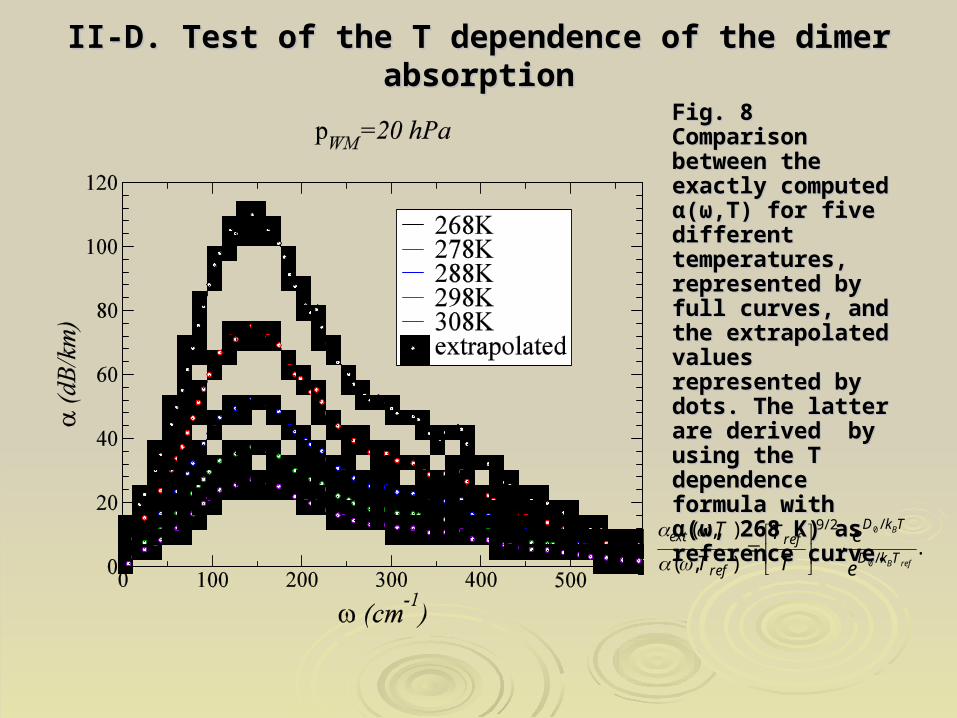
II-D. Test of the T dependence of the dimer absorptionII-D. Test of the T dependence of the dimer absorption
Fig. 8 Comparison Fig. 8 Comparison between the exactly between the exactly computed α(ω,T) computed α(ω,T) for five different for five different temperatures, temperatures, represented by full represented by full curves, and the curves, and the extrapolated values extrapolated values represented by represented by dots. The latter are dots. The latter are derived by using derived by using the T dependence the T dependence formula with α(ω, formula with α(ω, 268 K) as reference 268 K) as reference curve.curve.
0
0
/9/2
/
( , ).
( , )
B
B ref
D k Text ref
D k Tref
T T eT T e

III.The Collision Induced AbsorptionIII.The Collision Induced Absorption
During collisions of two interacting molecules, transient dipole During collisions of two interacting molecules, transient dipole moments occur. The latter can cause absorptions in the same way moments occur. The latter can cause absorptions in the same way as permanent dipole moments do. as permanent dipole moments do.
In general, integrated CIA are proportional to the product of In general, integrated CIA are proportional to the product of pressures associated with the colliding molecules.pressures associated with the colliding molecules.
Because the transient dipoles have a short lifetime, CIA exhibits Because the transient dipoles have a short lifetime, CIA exhibits diffuse line profiles. diffuse line profiles.
CIA line strengths are generally weak.CIA line strengths are generally weak.
The CIA theory was originally proposed to explain observed The CIA theory was originally proposed to explain observed absorptions for molecules without dipoles such as Nabsorptions for molecules without dipoles such as N22. It is expect . It is expect that CIA exists for other molecules with dipoles also.that CIA exists for other molecules with dipoles also.

III-A. Dipole-induced-dipole and its CIAIII-A. Dipole-induced-dipole and its CIA The permanent dipole of the molecule 1 induces a transient dipole The permanent dipole of the molecule 1 induces a transient dipole
of the molecular pair through the isotropic part of the polarizability of of the molecular pair through the isotropic part of the polarizability of the molecule 2. This is a main component of the induced dipole.the molecule 2. This is a main component of the induced dipole.
The corresponding CIA can be expressed asThe corresponding CIA can be expressed as
where where
The function G(The function G(ωω) is selected as the K) is selected as the K2 2 line shape model. line shape model.
where Gwhere G00 is the normalization constant and is the normalization constant and ηη is a parameter. is a parameter. By considering the first two moments of the spectral density, one is By considering the first two moments of the spectral density, one is
able to determine able to determine ηη and and the line shape completely.the line shape completely.
1 1
1
1 2
1 1 1 1 1 2 23
2 ( ) ( )4(121, ) ( ) ( ).
3
N N
m mm
r rC m m Y Y
R
0 1 1
1 1 2
22 5 /
0 ( )
4( ) (1 ) ( ) ( ),
3 Bk T
F L n i fi fi
n a e S T G
20 2/
1( ) ( ) ( ),
1
Bk TG G Ke
0 1
1( ) ( ) .
F d and F d
0 1 1
2 2 4 ( ) /( ) 2
0
( ) 2 00| ( ) | 00 ( ) ( ) | | , ( ) 4 .
iso BV R k Tn N i i fS T r I T P T and I T R e dR

III-B. The KIII-B. The K2 2 line shape functionsline shape functions
Fig. 9 Calculated Fig. 9 Calculated normalized Knormalized K2 2 line line shape function shape function G(ω,η) at T = 240, G(ω,η) at T = 240, 270, 300, and 330 270, 300, and 330 K. Half-widths K. Half-widths derived from their derived from their half-side are also half-side are also presented and their presented and their values are 31.286, values are 31.286, 33.014, 34.662, 33.014, 34.662, and 36.242 cmand 36.242 cm-1-1, , respectively. As T respectively. As T increases, the half-increases, the half-width increases width increases approximately as approximately as TT½ ½ increases. increases.
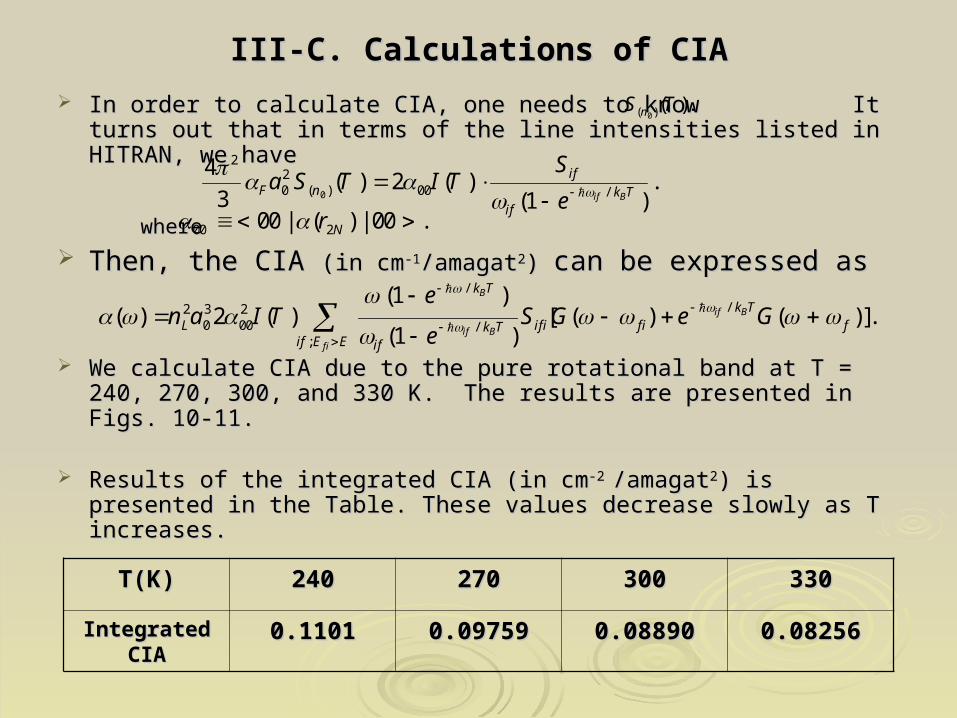
III-C. Calculations of CIAIII-C. Calculations of CIA
In order to calculate CIA, one needs to know It turns out that In order to calculate CIA, one needs to know It turns out that in terms of the line intensities listed in HITRAN, we havein terms of the line intensities listed in HITRAN, we have
where where
Then, the CIA Then, the CIA (in cm(in cm-1-1/amagat/amagat22) ) can be expressed ascan be expressed as
We calculate CIA due to the pure rotational band at T = 240, 270, We calculate CIA due to the pure rotational band at T = 240, 270, 300, and 330 K.300, and 330 K. The results are presented in Figs. 10-11. The results are presented in Figs. 10-11.
Results of the integrated CIA Results of the integrated CIA (in cm(in cm-2 -2 /amagat/amagat22) is presented in the ) is presented in the Table. These values decrease slowly as T increases.Table. These values decrease slowly as T increases.
T(K)T(K) 240240 270270 300300 330330
Integrated CIAIntegrated CIA 0.11010.1101 0.097590.09759 0.088900.08890 0.082560.08256
0
220 ( ) 00 /
4( ) 2 ( ) .
3 (1 )
if B
ifF n k T
if
Sa S T I T
e
//2 3 2
0 00 /;
(1 )( ) 2 ( ) [ ( ) ( )].
(1 )
B
if B
if B
fi
k Tk T
L ifi fi fk Tif E E if
en a I T S G e G
e
0( )( ).nS T
00 200| ( ) | 00 . Nr

III-C. Calculated CIA due to the pure rotational bandIII-C. Calculated CIA due to the pure rotational band
Fig. 10 Calculated CIA spectrum due to the pure rotational band of HFig. 10 Calculated CIA spectrum due to the pure rotational band of H22O at T = 240, 270, 300, O at T = 240, 270, 300, and 330 K. They are represented by black solid, red dashed, green dot-dashed and blue and 330 K. They are represented by black solid, red dashed, green dot-dashed and blue dotted lines. Within the band the CIA exhibits a negative T dependence. At the window the dotted lines. Within the band the CIA exhibits a negative T dependence. At the window the spectrum exhibits a positive T dependence.spectrum exhibits a positive T dependence.

III-D. Calculated CIA Spectrum from 0 – 5,000 cmIII-D. Calculated CIA Spectrum from 0 – 5,000 cm-1-1
Fig. 11 Calculated CIA spectrum at T = 240, 270, 300, and 330 K. They are represented Fig. 11 Calculated CIA spectrum at T = 240, 270, 300, and 330 K. They are represented by black, red, green and blue lines, respectively. For reference, the self-continuum by black, red, green and blue lines, respectively. For reference, the self-continuum from MT_CKD at these T are also plotted. Measurements by Burch at different T from MT_CKD at these T are also plotted. Measurements by Burch at different T raging from 296 K to 353 K are presented. raging from 296 K to 353 K are presented.
In order to make comparisons, the units for calculated CIA has been In order to make comparisons, the units for calculated CIA has been changed from cmchanged from cm-1-1/amagat /amagat 2 2 to cmto cm22/(molecule atm). /(molecule atm).
III-E. T Dependence of CIAIII-E. T Dependence of CIA The T dependence of CIA is mainly determined by I(T) whose The T dependence of CIA is mainly determined by I(T) whose
values decrease slowly as T increases.values decrease slowly as T increases.
In general, CIA exhibits a mild negative T dependence. In general, CIA exhibits a mild negative T dependence.
However, in windows between the HHowever, in windows between the H22O bands, CIA could have a O bands, CIA could have a slightly positive T dependence.slightly positive T dependence.
The integrated CIA exhibits a mile negative T dependence. If The integrated CIA exhibits a mile negative T dependence. If
CIA is given in cmCIA is given in cm-1-1/amagat/amagat22, the integrated CIA would varies as , the integrated CIA would varies as 1/T1/Tnn with the exponent n is in the range of 0.6 – 1.0. with the exponent n is in the range of 0.6 – 1.0.
The magnitudes of the CIA spectrum are, at least, 2 – 3 order The magnitudes of the CIA spectrum are, at least, 2 – 3 order
smaller than the measured continuum absorptions. Thus, one smaller than the measured continuum absorptions. Thus, one can rule it out from important candidates responsible for the can rule it out from important candidates responsible for the continuum. continuum.

IV. Conclusions on three mechanisms responsible for IV. Conclusions on three mechanisms responsible for the self-continuumthe self-continuum
The T dependences:The T dependences:
(1) The dimer absorption has the strongest negative dependence. The (1) The dimer absorption has the strongest negative dependence. The far-wing theory has a moderate negative dependence. The CIA has the far-wing theory has a moderate negative dependence. The CIA has the weakest one.weakest one.
(2) The dimer exhibits the simplest T dependence pattern. The far-wing (2) The dimer exhibits the simplest T dependence pattern. The far-wing theory’s T dependence varies significantly as theory’s T dependence varies significantly as ωω varies varies. The T . The T dependence of CIA is mildly negative. But it becomes slightly positive dependence of CIA is mildly negative. But it becomes slightly positive in windows between the Hin windows between the H22O bands. O bands.
How importance for each of the mechanisms:How importance for each of the mechanisms: (1) In the infrared window, the far-wing theory is the main source of the (1) In the infrared window, the far-wing theory is the main source of the
self-continuum. self-continuum.
(2) The dimer would account for small parts of the continuum in 30 – (2) The dimer would account for small parts of the continuum in 30 – 500 cm500 cm-1-1. Its contributions diminish beyond 500 cm. Its contributions diminish beyond 500 cm-1 -1 and become and become important below 30 cmimportant below 30 cm-1-1. .
(3) In general, contributions from CIA are negligible. (3) In general, contributions from CIA are negligible.