Embed Size (px)
Citation preview
Telecommunications Sector
Pravin Talreja
Agenda 1. Sector Overview 2. Business Analysis 3. Economic Analysis 4. Financial Analysis 5. Valuation Analysis 6. Recommendation
Agenda 1. Sector Overview 2. Business Analysis 3. Economic Analysis 4. Financial Analysis 5. Valuation Analysis 6. Recommendation
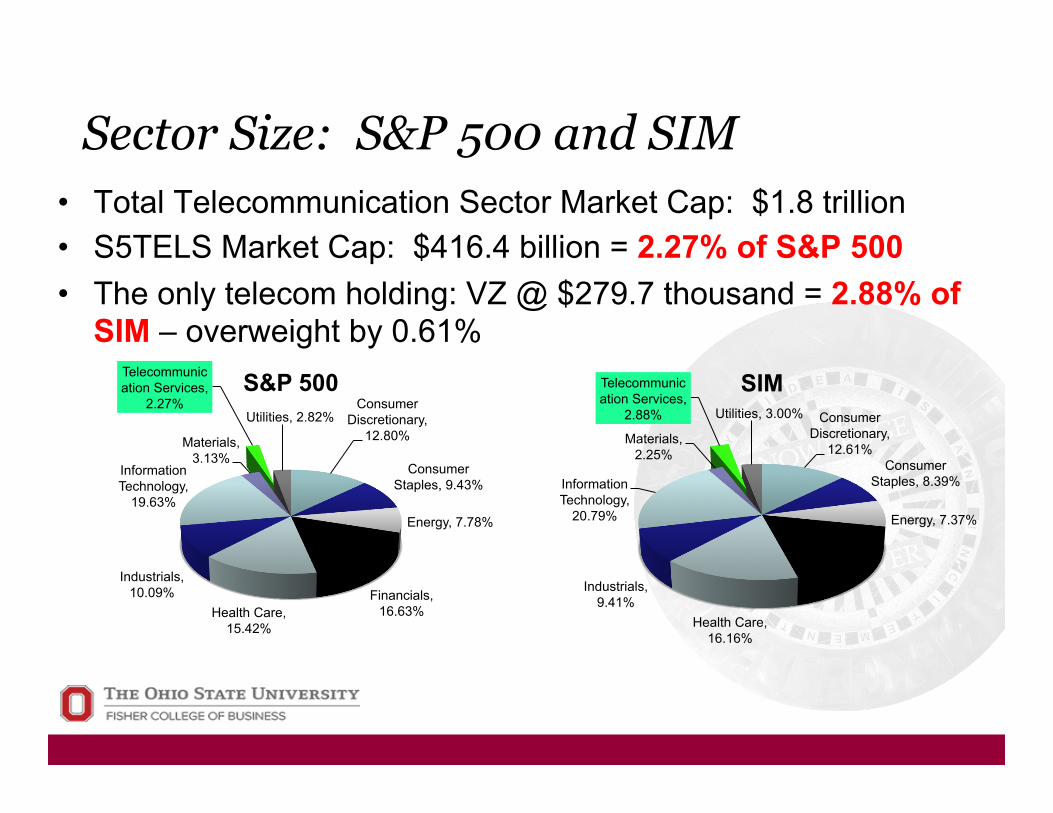
Sector Size: S&P 500 and SIM • Total Telecommunication Sector Market Cap: $1.8 trillion • S5TELS Market Cap: $416.4 billion = 2.27% of S&P 500 • The only telecom holding: VZ @ $279.7 thousand = 2.88% of
SIM – overweight by 0.61%
Consumer Discretionary,
12.80%
Consumer Staples, 9.43%
Energy, 7.78%
Financials, 16.63% Health Care,
15.42%
Industrials, 10.09%
Information Technology,
19.63%
Materials, 3.13%
Telecommunication Services,
2.27% Utilities, 2.82%
S&P 500 Consumer
Discretionary, 12.61%
Consumer Staples, 8.39%
Energy, 7.37% Financials,
17.76%
Health Care, 16.16%
Industrials, 9.41%
Information Technology,
20.79%
Materials, 2.25%
Telecommunication Services,
2.88% Utilities, 3.00%
SIM
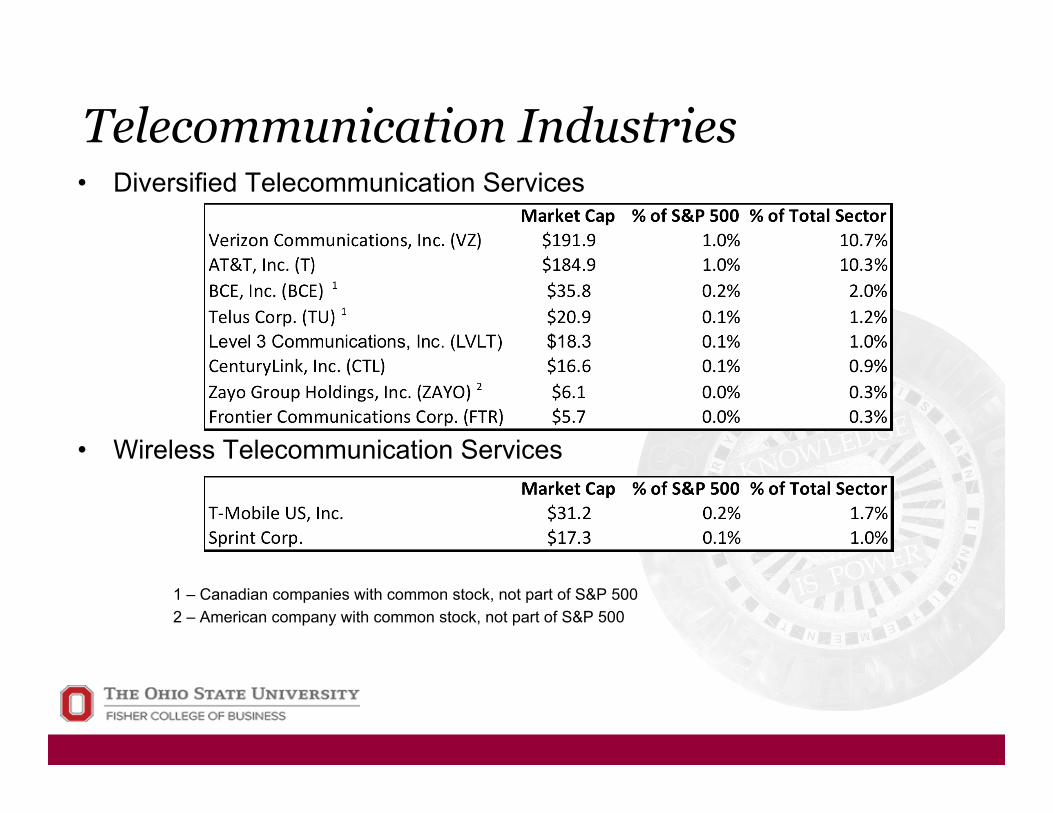
Telecommunication Industries • Diversified Telecommunication Services
• Wireless Telecommunication Services
1 – Canadian companies with common stock, not part of S&P 500 2 – American company with common stock, not part of S&P 500
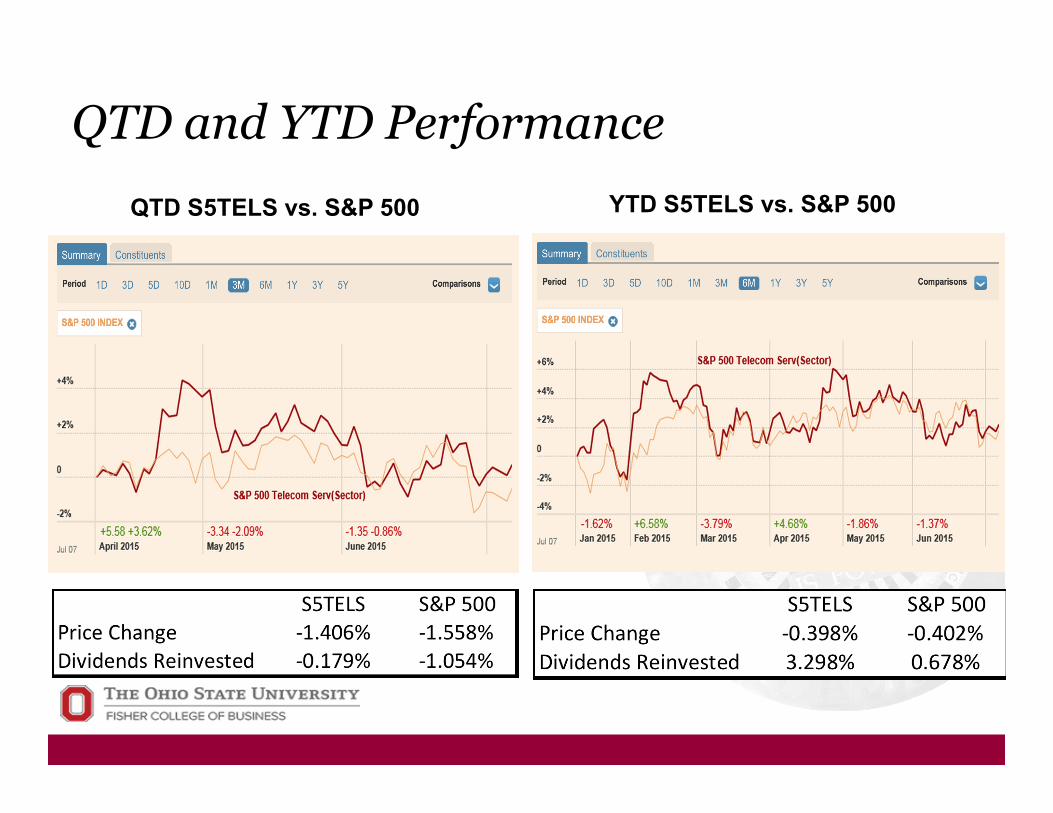
QTD and YTD Performance QTD S5TELS vs. S&P 500 YTD S5TELS vs. S&P 500
Agenda 1. Sector Overview 2. Business Analysis 3. Economic Analysis 4. Financial Analysis 5. Valuation Analysis 6. Recommendation
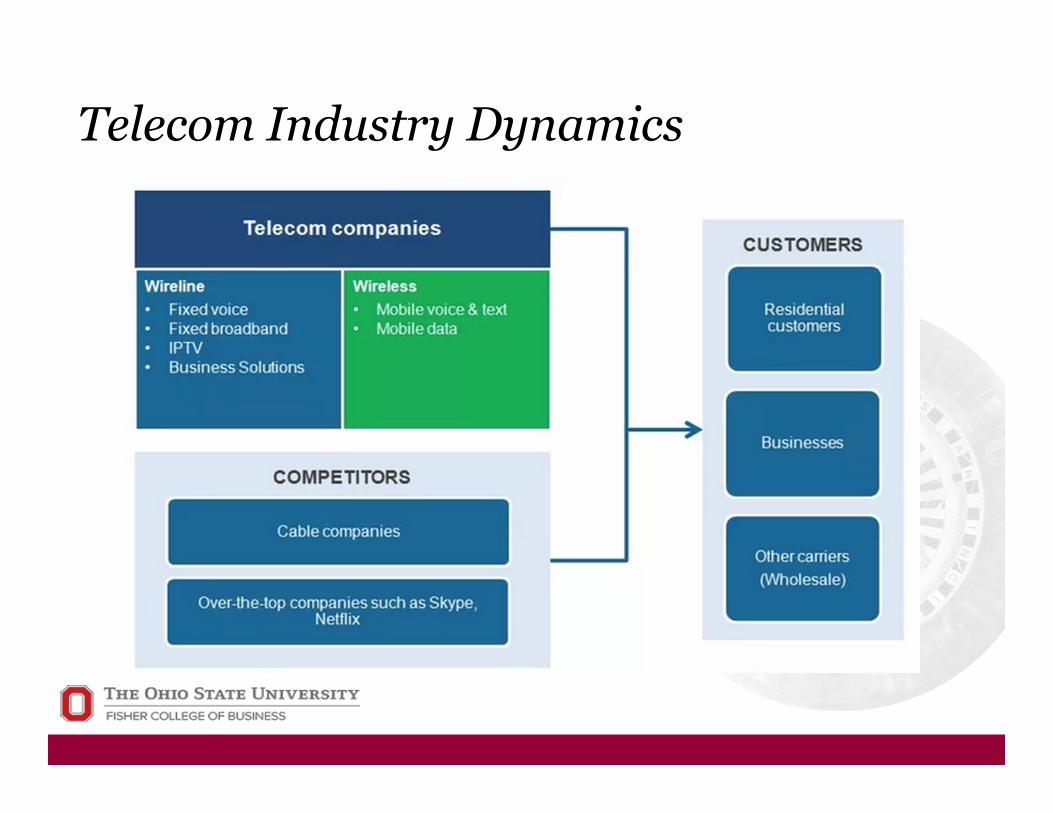
Telecom Industry Dynamics
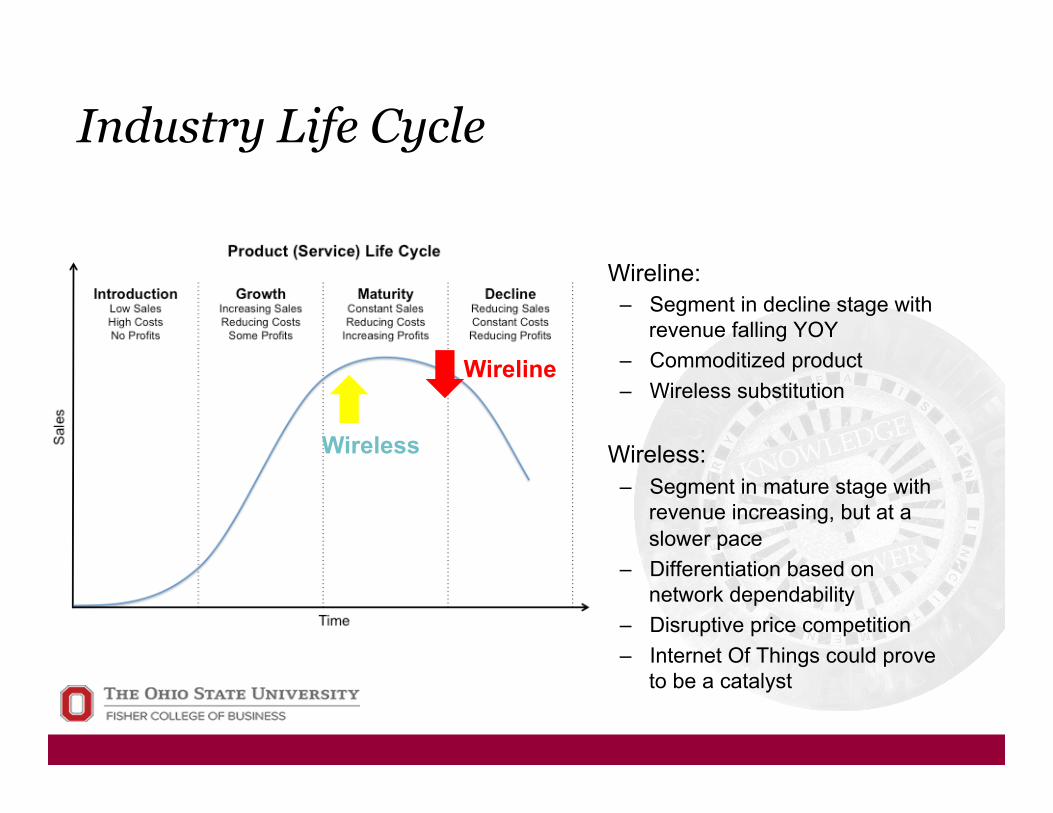
Industry Life Cycle
• Wireline: – Segment in decline stage with
revenue falling YOY – Commoditized product – Wireless substitution
• Wireless: – Segment in mature stage with
revenue increasing, but at a slower pace
– Differentiation based on network dependability
– Disruptive price competition – Internet Of Things could prove
to be a catalyst
Wireless
Wireline
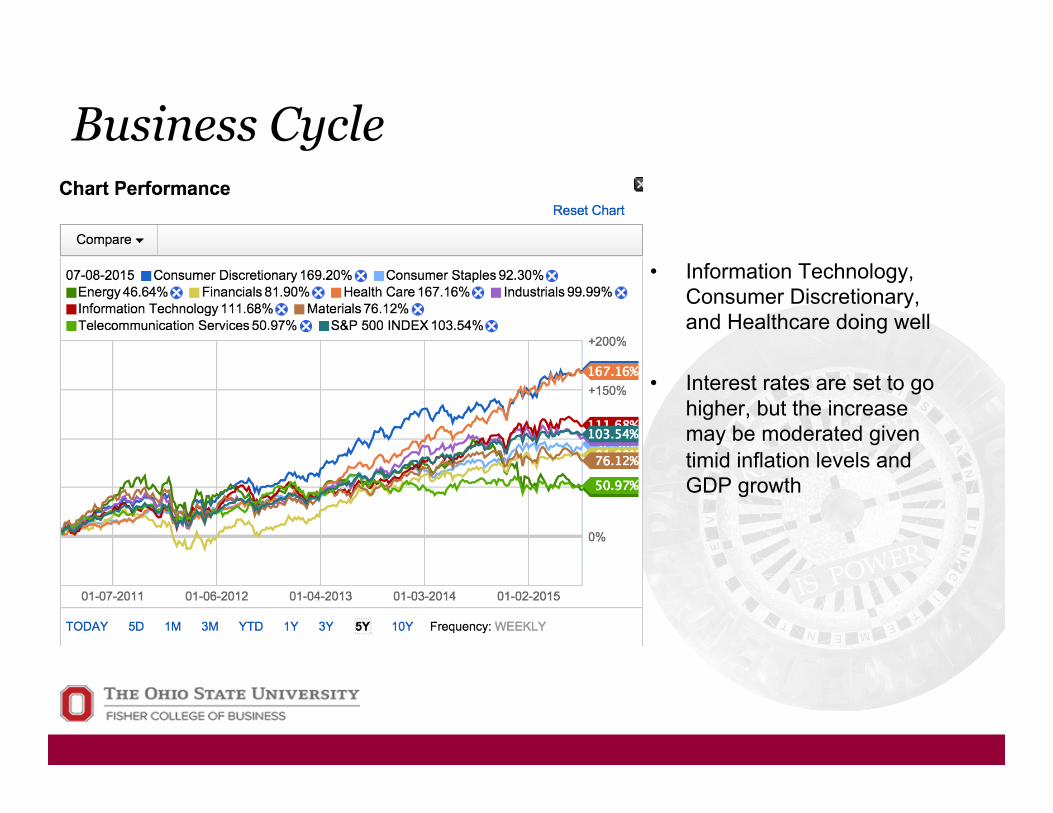
Business Cycle
• Information Technology, Consumer Discretionary, and Healthcare doing well
• Interest rates are set to go
higher, but the increase may be moderated given timid inflation levels and GDP growth
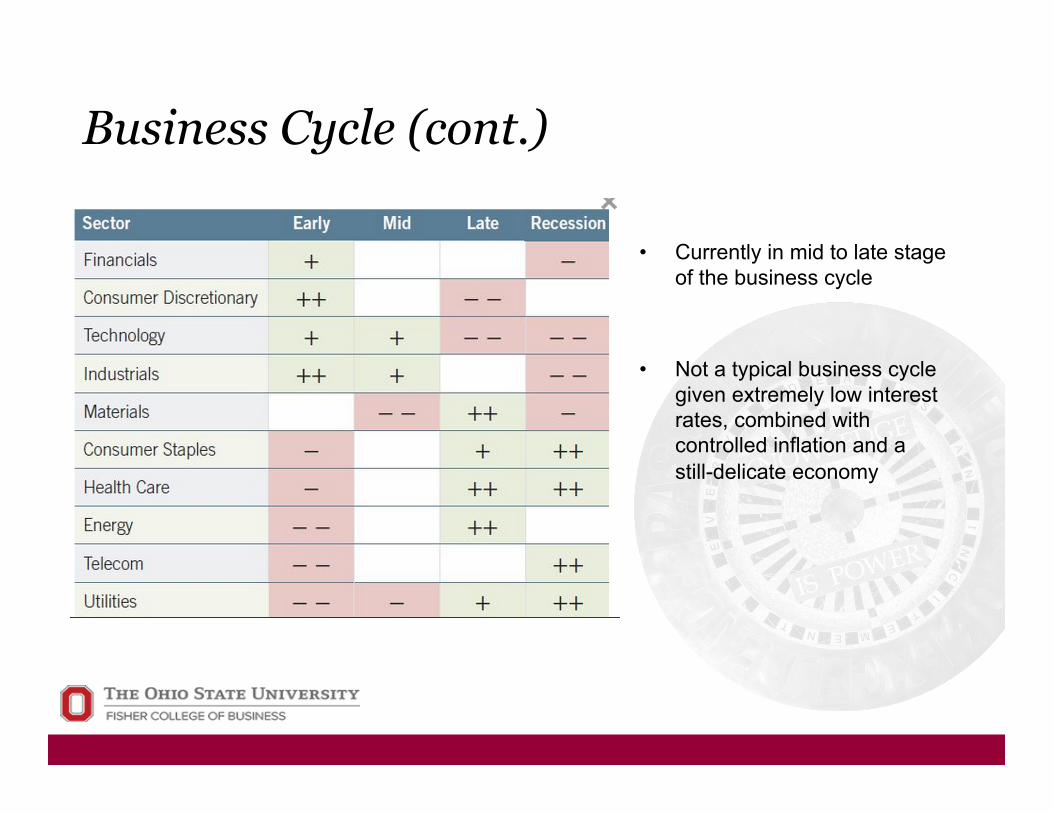
Business Cycle (cont.)
• Currently in mid to late stage
of the business cycle
• Not a typical business cycle given extremely low interest rates, combined with controlled inflation and a still-delicate economy
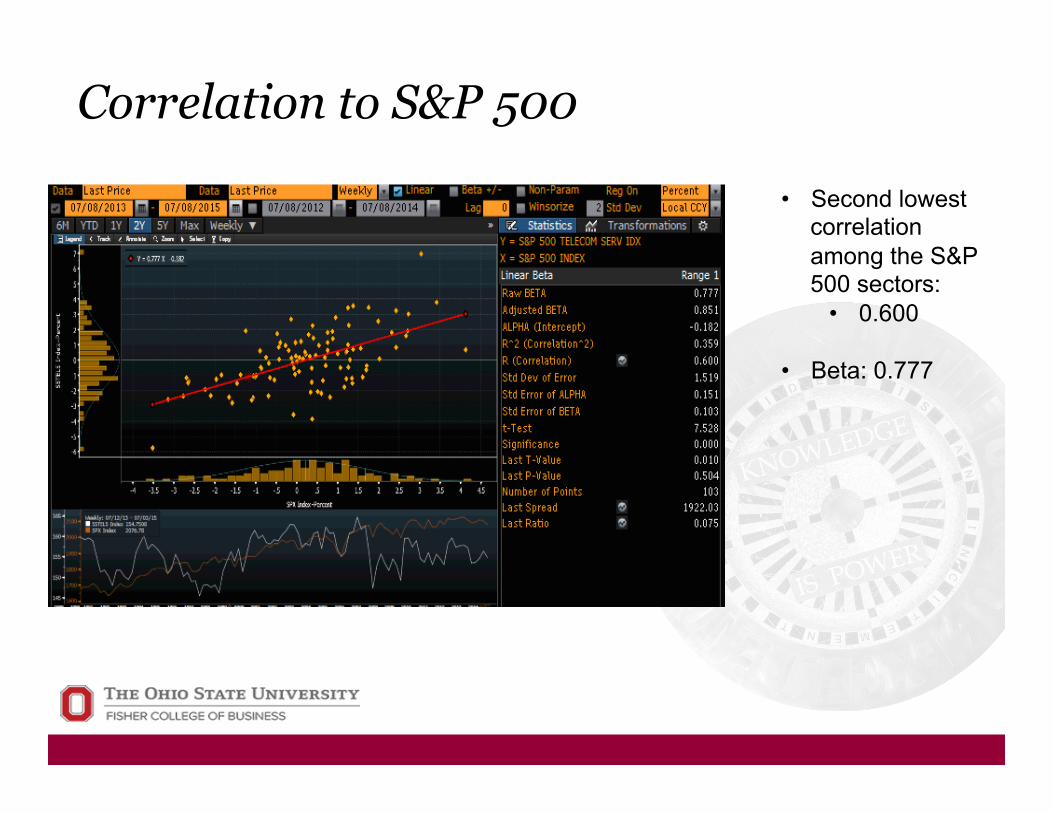
Correlation to S&P 500
• Second lowest correlation among the S&P 500 sectors:
• 0.600
• Beta: 0.777
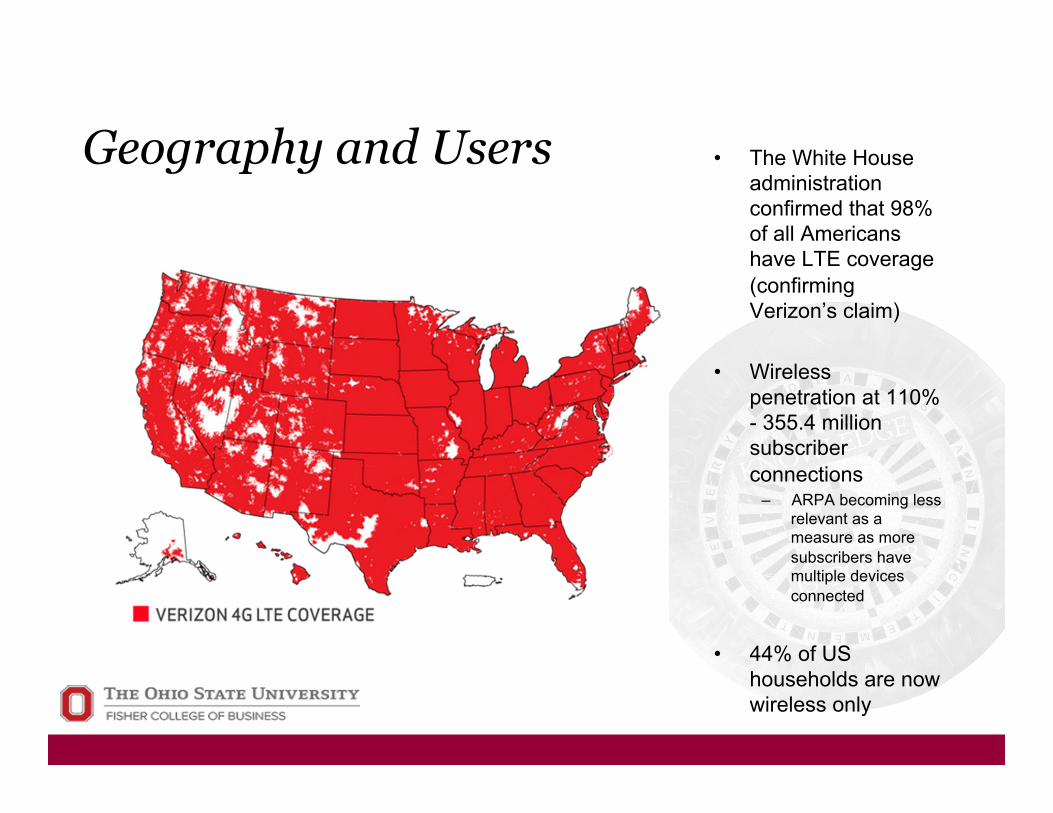
Geography and Users • The White House administration confirmed that 98% of all Americans have LTE coverage (confirming Verizon’s claim)
• Wireless penetration at 110% - 355.4 million subscriber connections
– ARPA becoming less relevant as a measure as more subscribers have multiple devices connected
• 44% of US households are now wireless only
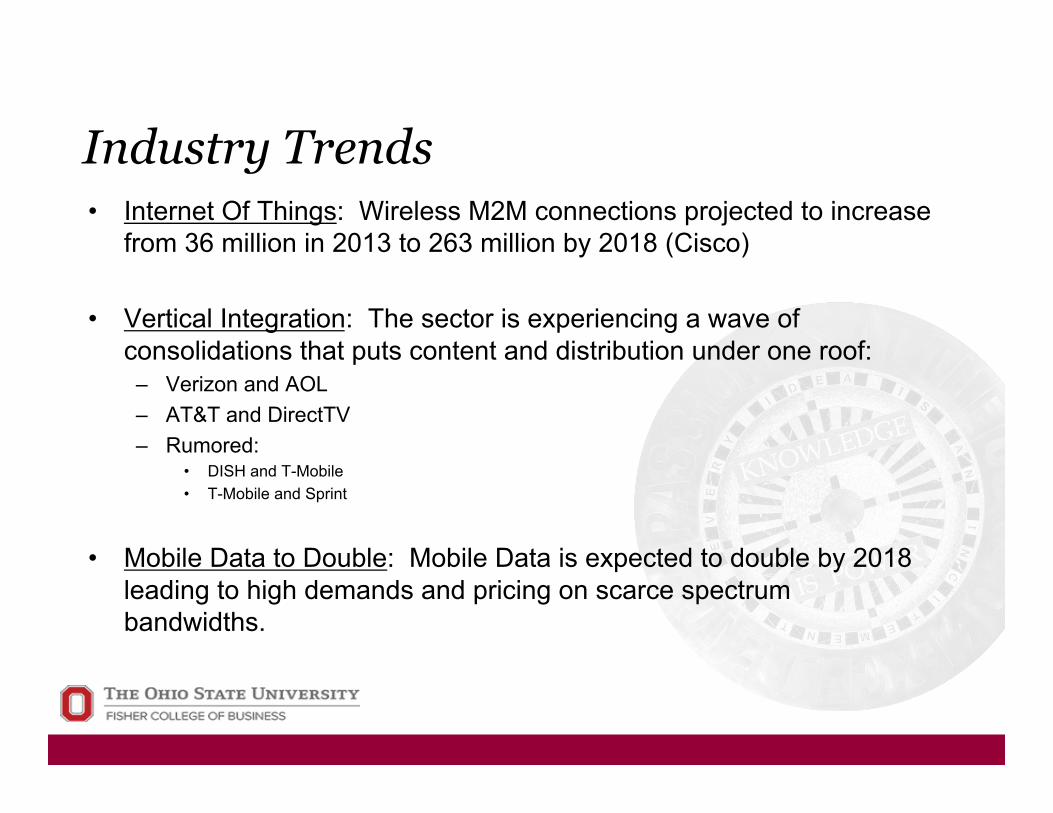
Industry Trends • Internet Of Things: Wireless M2M connections projected to increase
from 36 million in 2013 to 263 million by 2018 (Cisco)
• Vertical Integration: The sector is experiencing a wave of consolidations that puts content and distribution under one roof:
– Verizon and AOL – AT&T and DirectTV – Rumored:
• DISH and T-Mobile • T-Mobile and Sprint
• Mobile Data to Double: Mobile Data is expected to double by 2018 leading to high demands and pricing on scarce spectrum bandwidths.
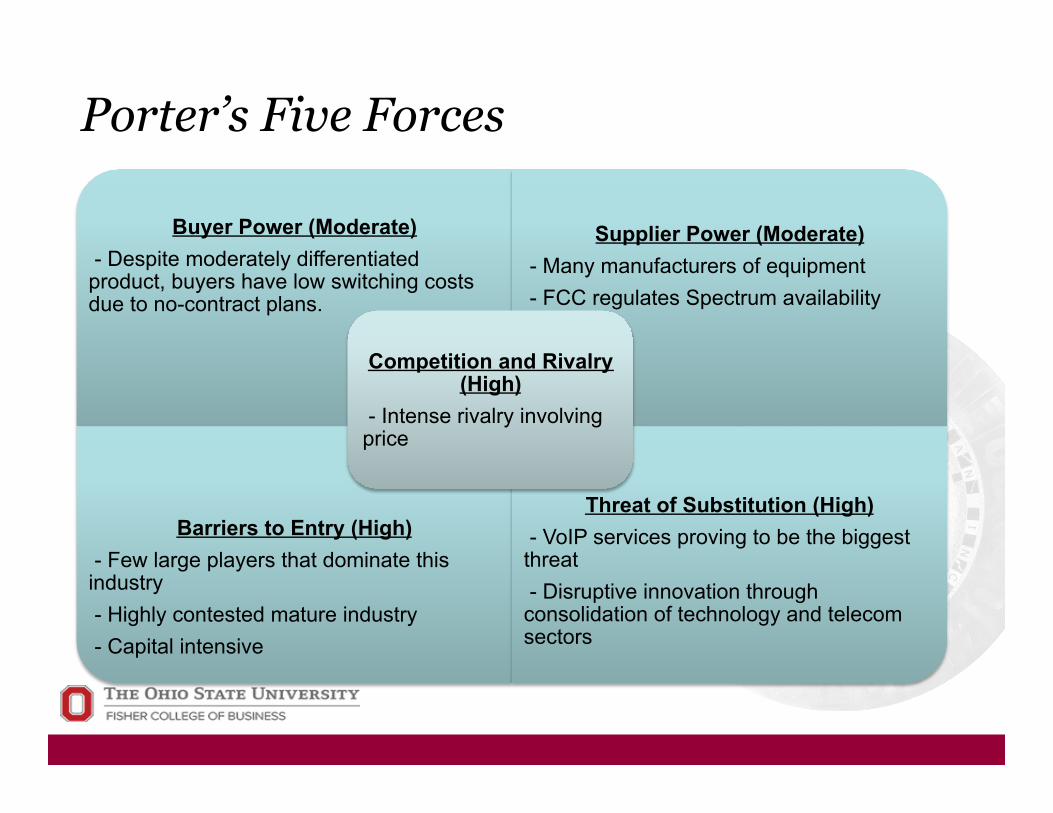
Porter’s Five Forces
Buyer Power (Moderate) - Despite moderately differentiated product, buyers have low switching costs due to no-contract plans.
Supplier Power (Moderate) - Many manufacturers of equipment - FCC regulates Spectrum availability
Barriers to Entry (High) - Few large players that dominate this industry - Highly contested mature industry - Capital intensive
Threat of Substitution (High) - VoIP services proving to be the biggest threat - Disruptive innovation through consolidation of technology and telecom sectors
Competition and Rivalry (High)
- Intense rivalry involving price
Agenda 1. Sector Overview 2. Business Analysis 3. Economic Analysis 4. Financial Analysis 5. Valuation Analysis 6. Recommendation
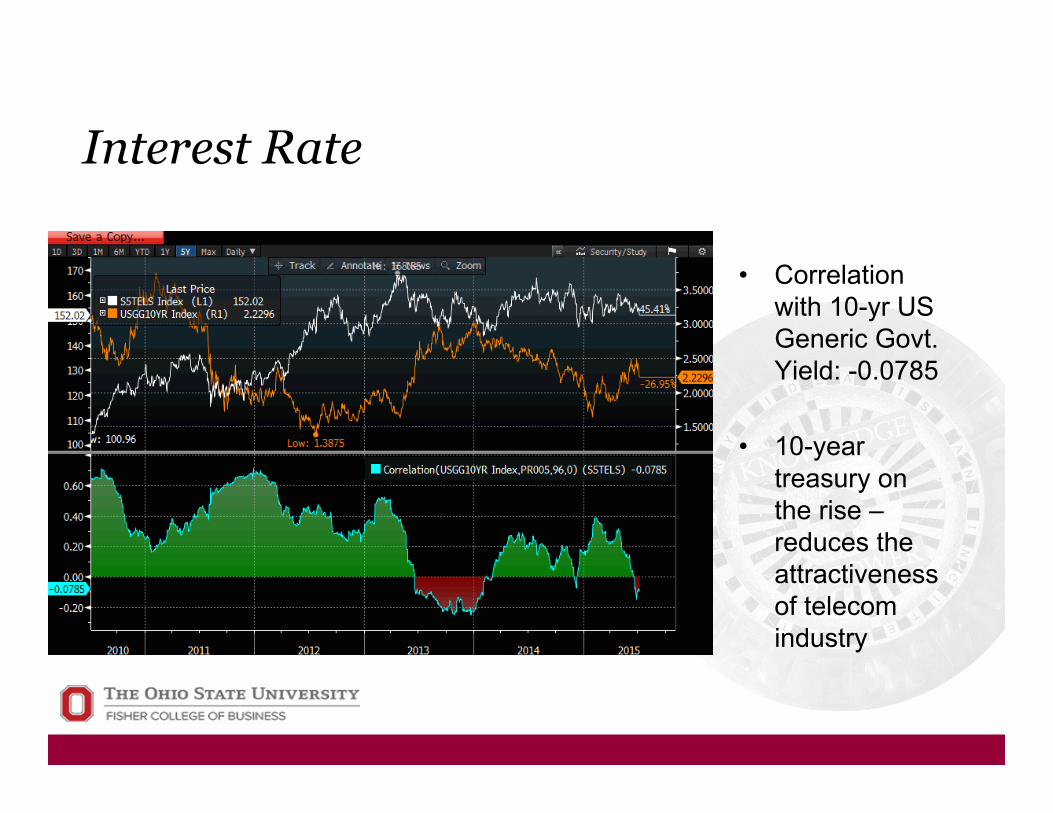
Interest Rate
• Correlation with 10-yr US Generic Govt. Yield: -0.0785
• 10-year treasury on the rise – reduces the attractiveness of telecom industry
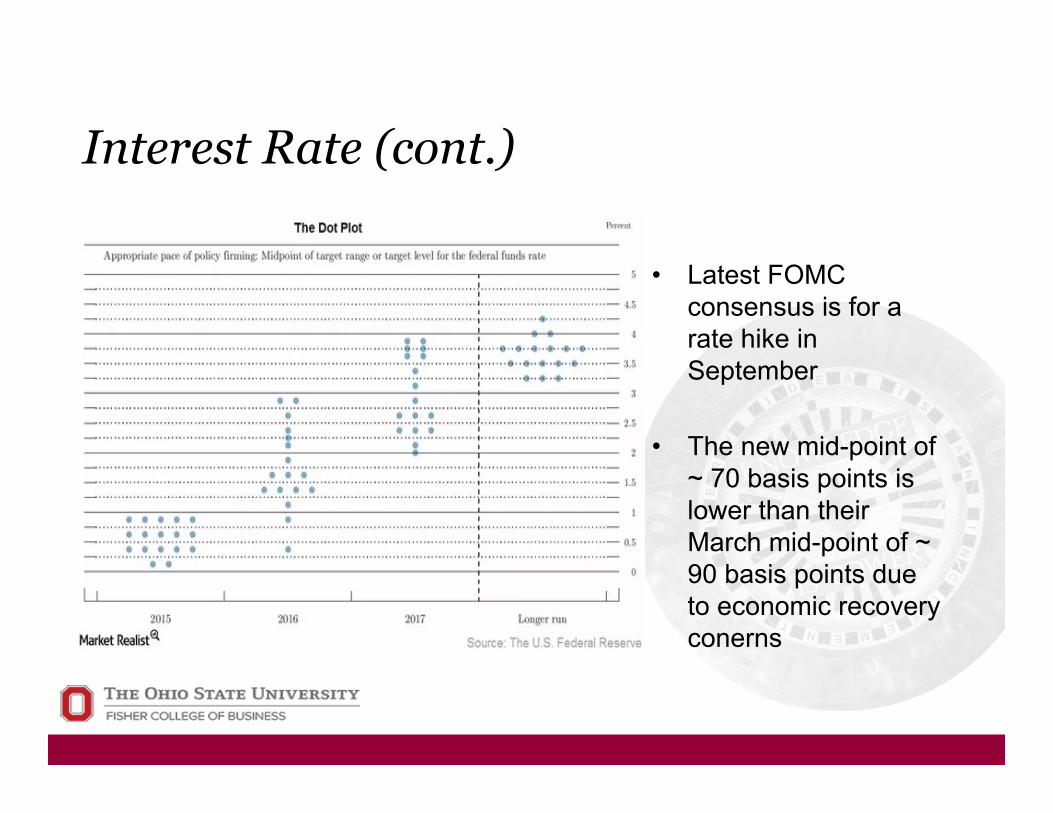
Interest Rate (cont.)
• Latest FOMC consensus is for a rate hike in September
• The new mid-point of ~ 70 basis points is lower than their March mid-point of ~ 90 basis points due to economic recovery conerns
Agenda 1. Sector Overview 2. Business Analysis 3. Economic Analysis 4. Financial Analysis 5. Valuation Analysis 6. Recommendation
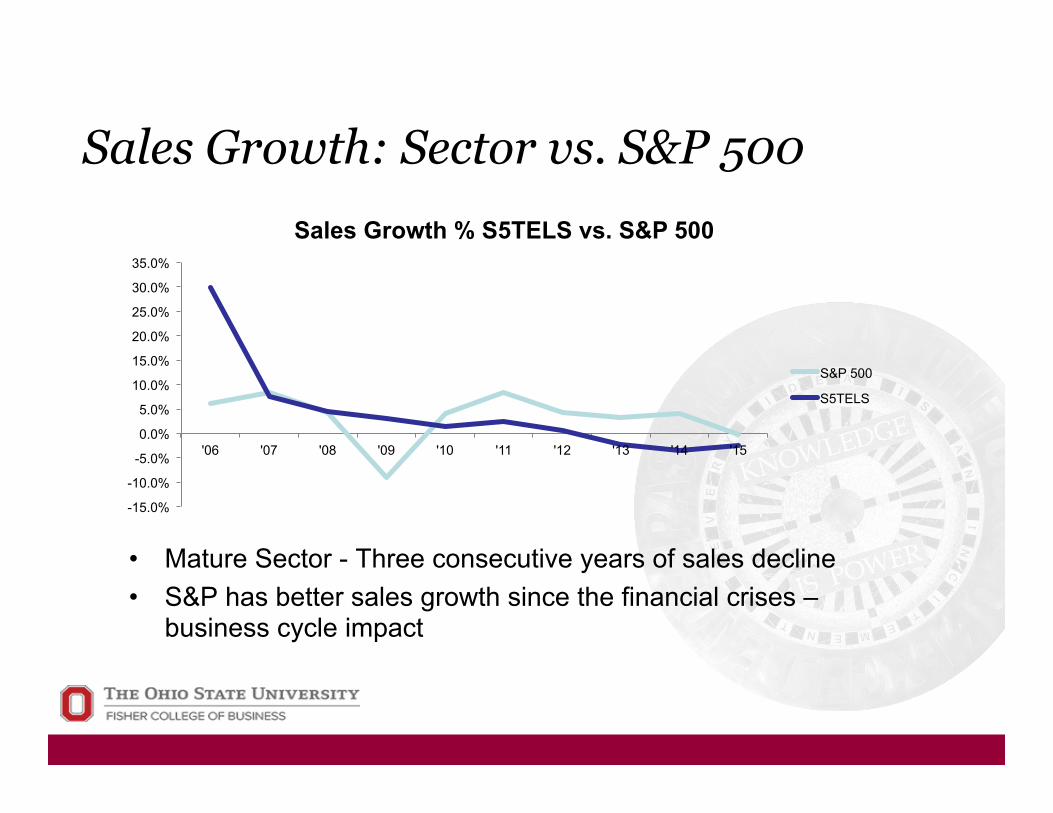
Sales Growth: Sector vs. S&P 500
-15.0%
-10.0%
-5.0%
0.0%
5.0%
10.0%
15.0%
20.0%
25.0%
30.0%
35.0%
'06 '07 '08 '09 '10 '11 '12 '13 '14 '15
Sales Growth % S5TELS vs. S&P 500
S&P 500
S5TELS
• Mature Sector - Three consecutive years of sales decline • S&P has better sales growth since the financial crises –
business cycle impact
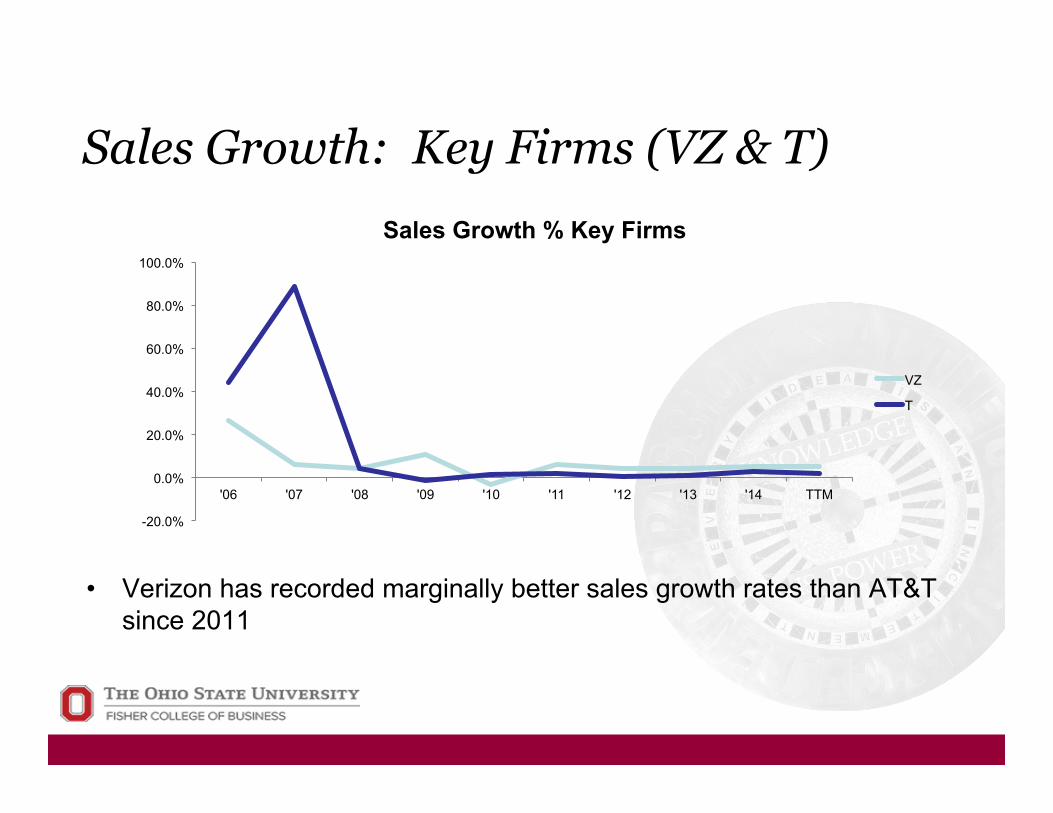
Sales Growth: Key Firms (VZ & T)
• Verizon has recorded marginally better sales growth rates than AT&T since 2011
-20.0%
0.0%
20.0%
40.0%
60.0%
80.0%
100.0%
'06 '07 '08 '09 '10 '11 '12 '13 '14 TTM
Sales Growth % Key Firms
VZ
T
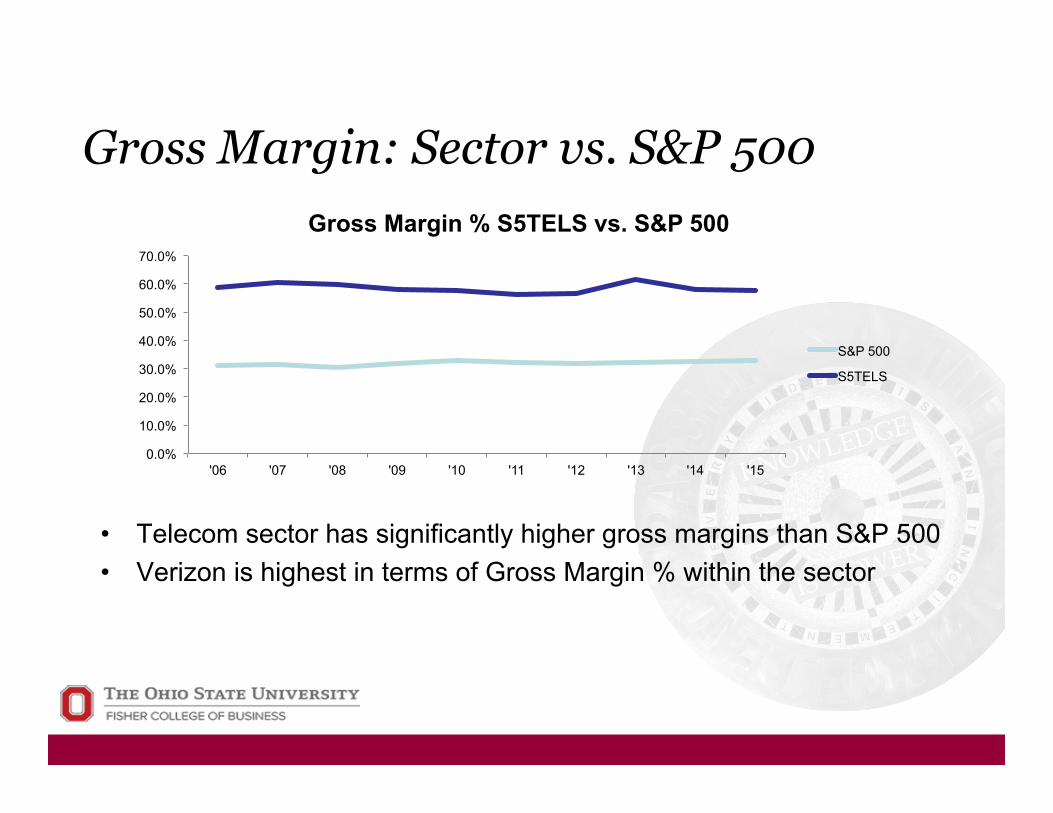
Gross Margin: Sector vs. S&P 500
• Telecom sector has significantly higher gross margins than S&P 500 • Verizon is highest in terms of Gross Margin % within the sector
0.0%
10.0%
20.0%
30.0%
40.0%
50.0%
60.0%
70.0%
'06 '07 '08 '09 '10 '11 '12 '13 '14 '15
Gross Margin % S5TELS vs. S&P 500
S&P 500
S5TELS
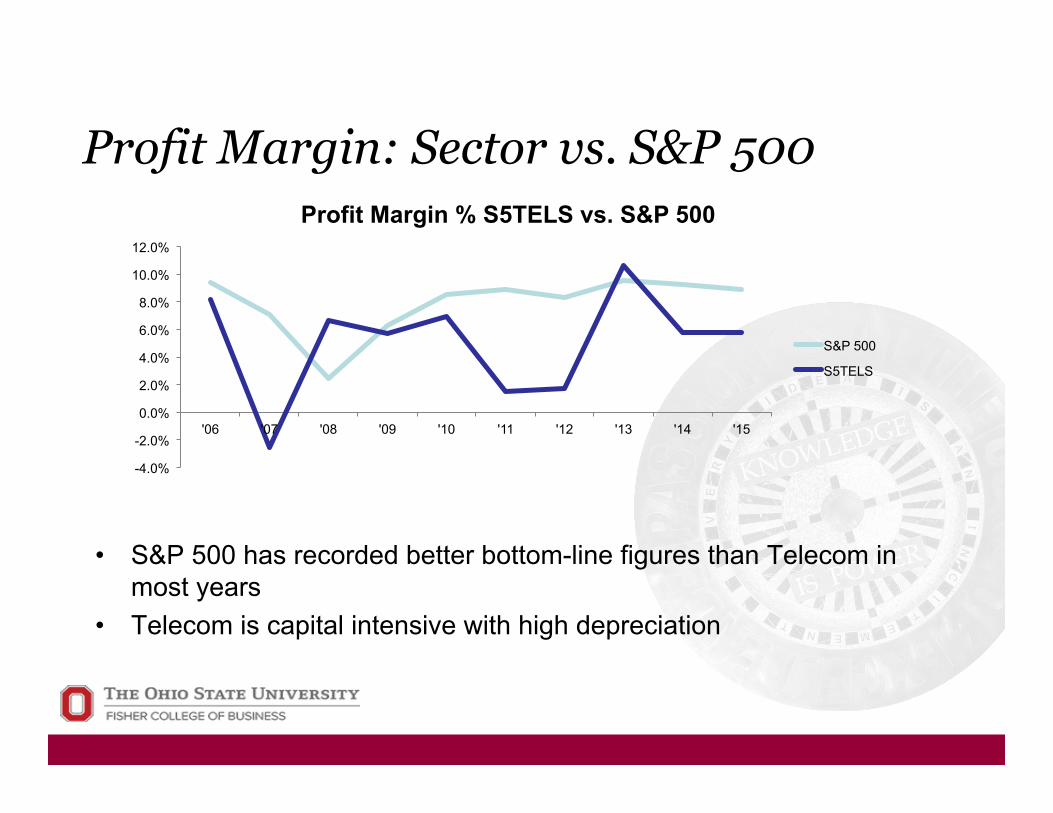
Profit Margin: Sector vs. S&P 500
• S&P 500 has recorded better bottom-line figures than Telecom in most years
• Telecom is capital intensive with high depreciation
-4.0%
-2.0%
0.0%
2.0%
4.0%
6.0%
8.0%
10.0%
12.0%
'06 '07 '08 '09 '10 '11 '12 '13 '14 '15
Profit Margin % S5TELS vs. S&P 500
S&P 500
S5TELS
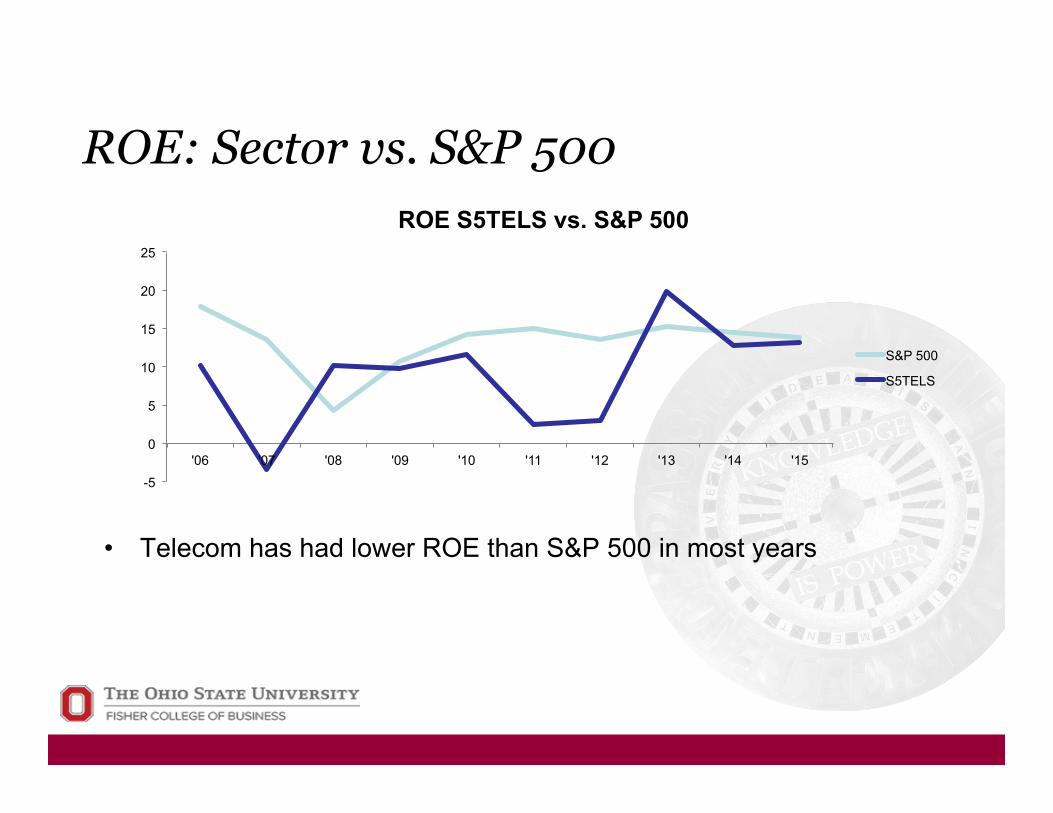
ROE: Sector vs. S&P 500
• Telecom has had lower ROE than S&P 500 in most years
-5
0
5
10
15
20
25
'06 '07 '08 '09 '10 '11 '12 '13 '14 '15
ROE S5TELS vs. S&P 500
S&P 500
S5TELS
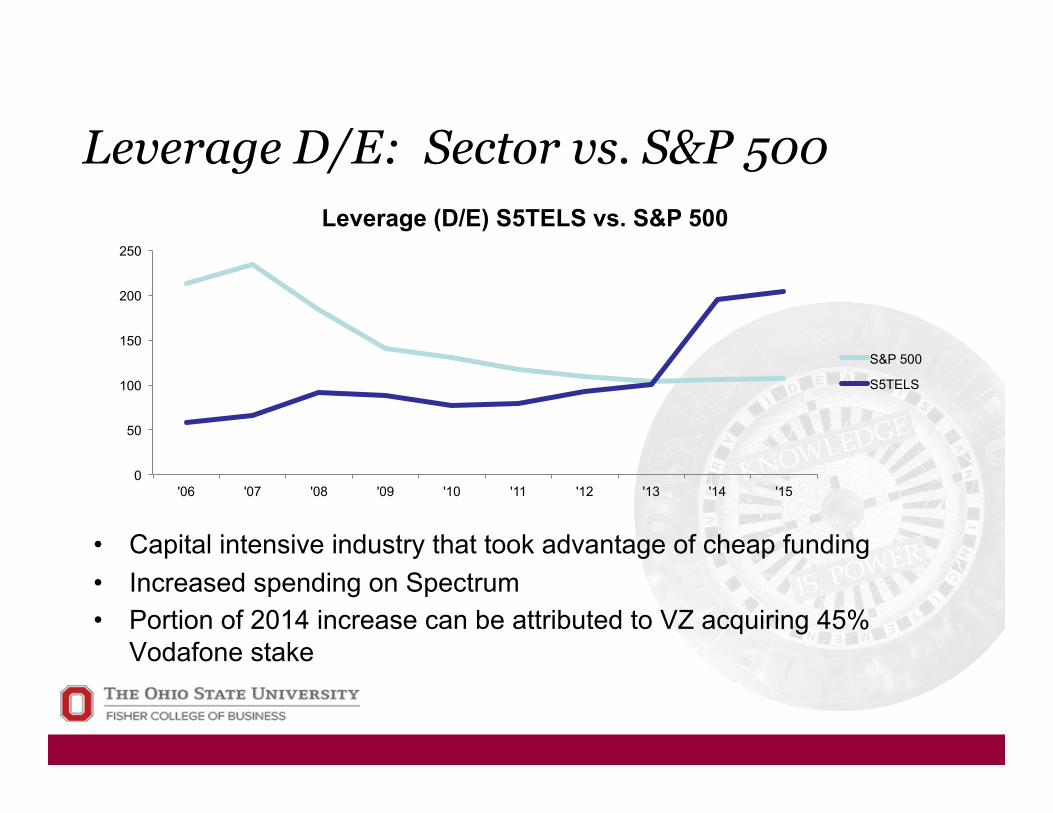
Leverage D/E: Sector vs. S&P 500
• Capital intensive industry that took advantage of cheap funding • Increased spending on Spectrum • Portion of 2014 increase can be attributed to VZ acquiring 45%
Vodafone stake
0
50
100
150
200
250
'06 '07 '08 '09 '10 '11 '12 '13 '14 '15
Leverage (D/E) S5TELS vs. S&P 500
S&P 500
S5TELS
Agenda 1. Sector Overview 2. Business Analysis 3. Economic Analysis 4. Financial Analysis 5. Valuation Analysis 6. Recommendation
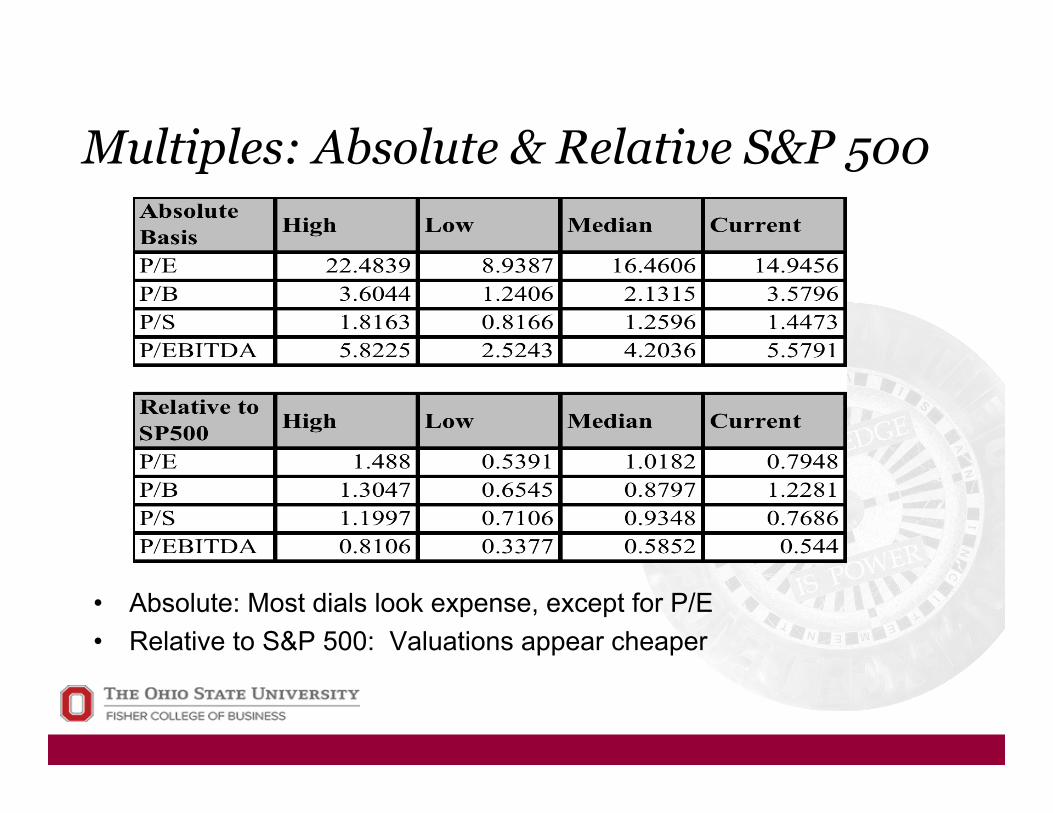
Multiples: Absolute & Relative S&P 500
• Absolute: Most dials look expense, except for P/E • Relative to S&P 500: Valuations appear cheaper
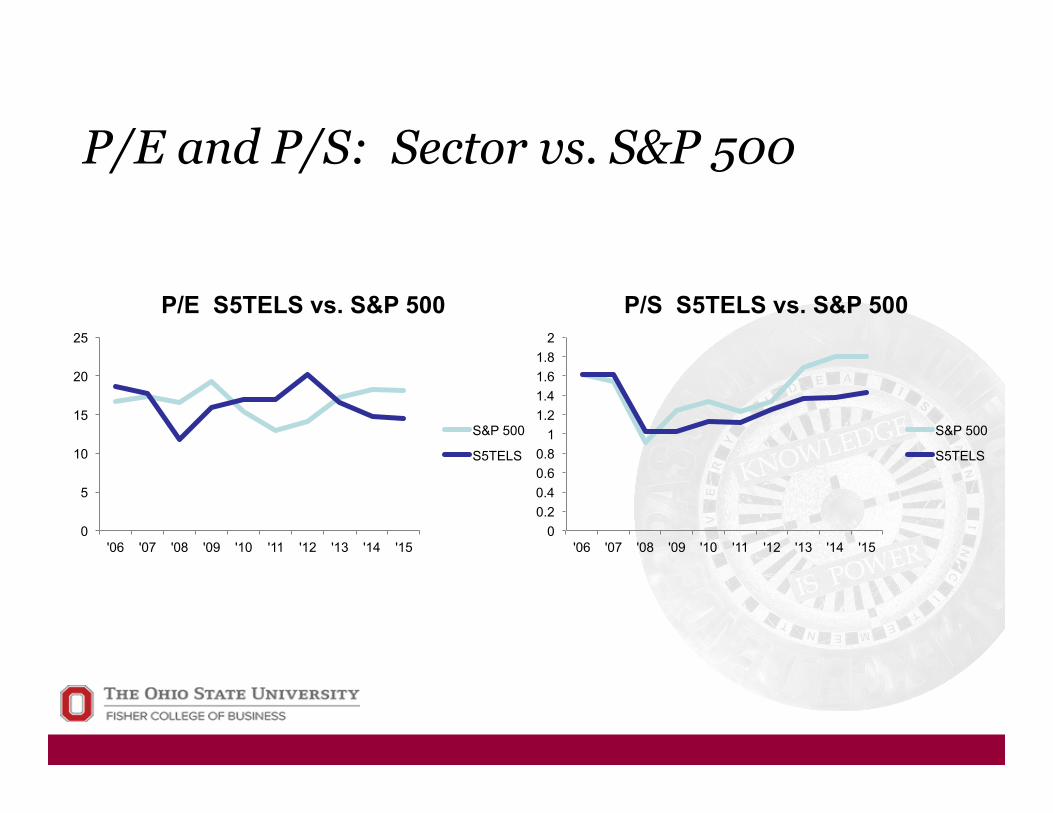
P/E and P/S: Sector vs. S&P 500
0
5
10
15
20
25
'06 '07 '08 '09 '10 '11 '12 '13 '14 '15
P/E S5TELS vs. S&P 500
S&P 500
S5TELS
0 0.2 0.4 0.6 0.8
1 1.2 1.4 1.6 1.8
2
'06 '07 '08 '09 '10 '11 '12 '13 '14 '15
P/S S5TELS vs. S&P 500
S&P 500
S5TELS
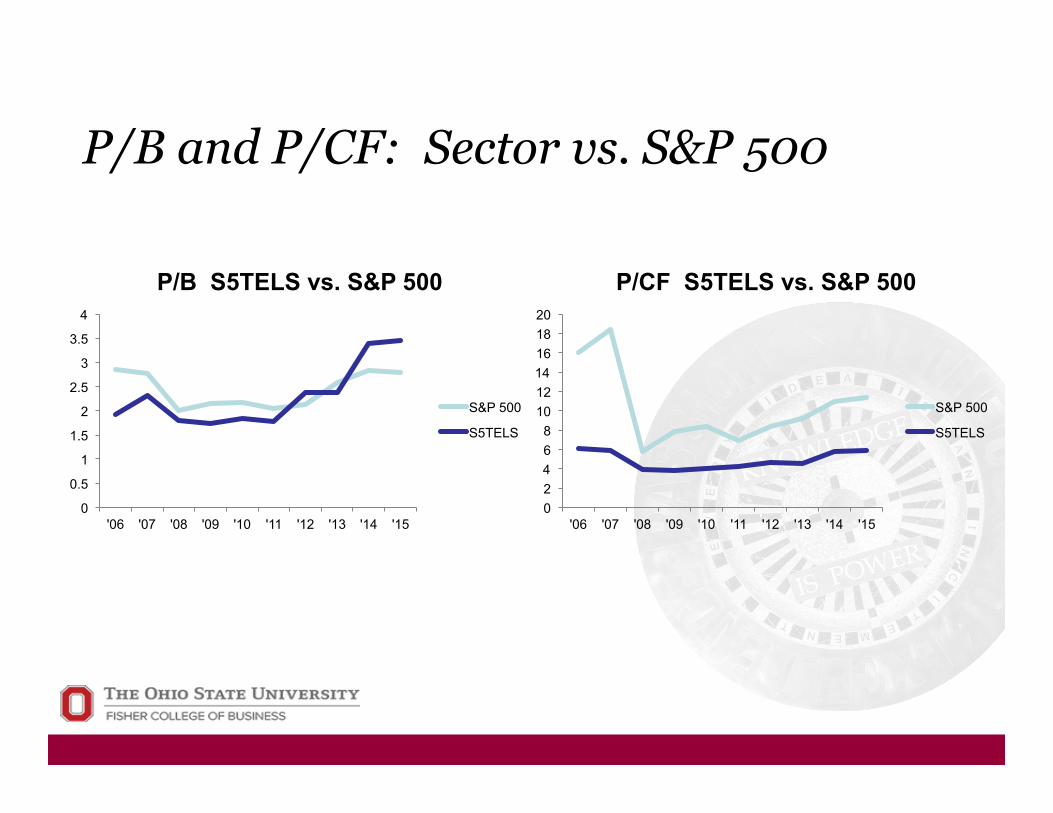
P/B and P/CF: Sector vs. S&P 500
0
0.5
1
1.5
2
2.5
3
3.5
4
'06 '07 '08 '09 '10 '11 '12 '13 '14 '15
P/B S5TELS vs. S&P 500
S&P 500
S5TELS
0 2 4 6 8
10 12 14 16 18 20
'06 '07 '08 '09 '10 '11 '12 '13 '14 '15
P/CF S5TELS vs. S&P 500
S&P 500
S5TELS
Agenda 1. Sector Overview 2. Business Analysis 3. Economic Analysis 4. Financial Analysis 5. Valuation Analysis 6. Recommendation
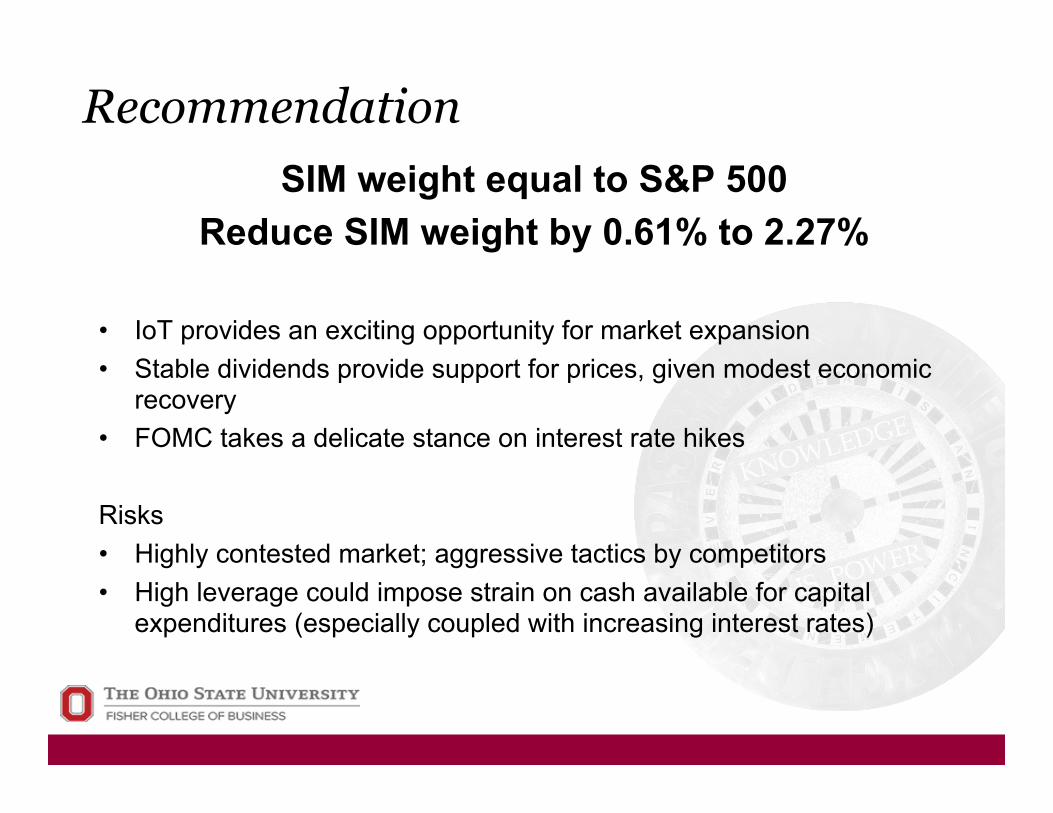
Recommendation SIM weight equal to S&P 500
Reduce SIM weight by 0.61% to 2.27%
• IoT provides an exciting opportunity for market expansion • Stable dividends provide support for prices, given modest economic
recovery • FOMC takes a delicate stance on interest rate hikes
Risks • Highly contested market; aggressive tactics by competitors • High leverage could impose strain on cash available for capital
expenditures (especially coupled with increasing interest rates)
Questions?