Embed Size (px)
Citation preview
Electronic copy available at: http://ssrn.com/abstract=1999827
1
Telecom Prices, Regulatory Reforms, Consumers’ Satisfaction:
Evidence for 15 EU Countries
Emanuele Bacchiocchi1
Department of Economics, Business and Statistics, University of Milan
Massimo Florio Department of Economics, Business and Statistics, University of Milan
Marco Gambaro Department of Economics, Business and Statistics, University of Milan
5 May 2008
Abstract: We study the impact on consumers of privatization and liberalization in
the telecommunication sector for 15 EU Countries. Policy reforms are
summarized by the OECD regulatory indicators (REGREF), that consider the
extent of privatization, vertical disintegration, and market entry. After controlling
for other country variables, we first test the impact of ownership and regulatory
changes on productivity and consumer prices. In a second step, we consider the
Eurobarometer data on consumers’ satisfaction about quality and prices of the
telecommunication service. The analysis confirms the importance of market
regulation in reducing prices and increasing productivity performances, but
minimize the role played by privatization per se. The latter and liberalization of
the telecommunication market play a role in explaining the consumers’
satisfaction about prices and quality of the service, but country features are more
important. Overall, our findings offer only mixed evidence, and somehow
contradict, the hypothesis of welfare dominance across the EU of a unique reform
paradigm in the telecom industry.
Keywords: telecom industry liberalization, privatization, impact on European consumers
JEL codes: L32,L33,L96
Acknowledgments. We are grateful to Carlo Fiorio to participants in the 2007 ITU Conference,
Istanbul, and to Professors Kretshmer and Picot, and participants in a seminar at the Insitute for
Communication Economics, LMU (Munich) for helpful comments. We are also grateful to Raffaele
Doronzo and Giancarlo Manzi for competent research assistance. The research project has been
financed by the 6th
Framework Programme of the European Union: “Understanding Privatization
Policy: Political Economy and Welfare Effects”, lead by FEEM.
1 Corresponding author: Dipartimento di Scienze Economiche Aziendali e Statistiche – Via Conservatorio 7 – 20122
Milano. Email: [email protected]
Electronic copy available at: http://ssrn.com/abstract=1999827
2
1. INTRODUCTION
The telecom sector is not just one among the network industries that experienced a policy paradigm
shift over the last twenty years: it has been its core laboratory world-wide, and the one where the
reforms started earlier. If one had to pick up a single year as the turning point, 1984 would be the
most convenient one, with the parallel divestiture of AT&T in the US and of British Telecom in the
UK. The meaning of divestiture was however quite different across the two sides of the Atlantic.
AT&T was a private regulated monopolist that was broken up in seven regional Bell operating
companies. British Telecom was a public corporation, that after privatization was under a regime of
regulated duopoly along with another privatized operator, Mercury. In both cases, institutional
change, away from regulated and integrated monopoly in the US, and from integrated public
monopoly in the UK, were officially motivated by a willingness to establish competition in the
industry. It has been widely acknowledged that to ensure an effective transition to a competitive
market, however, divestiture policies need to be accompanied by regulatory reforms. The simple
change of the ownership structures, from public to private, in fact, is not sufficient for the market to
become effectively opened, breaking up the monopolies, and guaranteeing better conditions for
private investors to enter the market. In most countries, governments surrendered their powers to
national regulatory authorities, with the aim of overseeing and regulating the interactions between
incumbents and entrant firms (see Edwards and Waverman, 2006), protecting the consumers, and
ensure adequate infrastructure investments. The courts were also involved in various ways in the
reforms.
At the same time, a dramatic process of technological change reshaped the industry. Regulators and
law-makers had to frequently adjust their views because of entirely new developments. The new
industry reform paradigm points to privatization and liberalization (Newbery, 2000).
In this paper we want to test whether the reform progress, as measured by regulatory indicators, is
correlated with benefits to the consumers. After all the final evaluation of the reforms should be
based on testing what it delivers to the users of the service. Ideally one would look to detailed case
histories, considering long time series. A complementary approach would be to consider cross-
country evidence. Under the latter perspective, the EU offers something near to a natural
experiment. On one side, there is one policy actor, the European Commission, who pushes towards
a well defined reform paradigm, as embodied in telecom directives; on the other side, there are the
Member States that, more or less in compliance with the EU legislation, show big differences in
reform design, sequencing, timing, market structures. Another attractive aspect of a cross-country
empirical study is that, differently from other network industries, such as electricity, countries are
not exogenously constrained in technology adoption by intrinsic geographic characteristics. This
allows us to focus on country differences in ownership, institutions, competition, and other industry
features, under a common technological trend.
In this paper we focus on prices and productivity trends in the EU-15 (i.e. before accession in 2004
and 2007 of mostly transition countries), and consumers satisfaction with prices and quality of fixed
telephone service. A similar study in this context has been conducted by Copenhagen Economics
(2005) for the European Commission. In our study, however, we use different data sources in order
to enlarge the dataset and increase the number of observations. Moreover, we also investigate the
impact on the other prices borne by consumers, such as monthly telephone subscription and
connection charges. Furthermore, differently from the Copenhagen Economics study, we use the
REGREF indicators for market regulation, as proposed by the OECD. For customers’ satisfaction
we use three waves of the Eurobarometer survey (2000-2002-2004), while for prices and other
industry features we use Eurostat and Itu data.
Our main findings do not support the welfare dominance of a unique telecom reform paradigm
across the EU Member States. Privatization, while it seems to be correlated with higher consumers’

Electronic copy available at: http://ssrn.com/abstract=1999827
3
satisfaction, is rejected as a determinant of the price they pay. Regulatory variables do not play any
role in consumers’ satisfaction with quality. Their impact on productivity is modest, while in turn
productivity change has a substantial impact on prices, along with entry conditions.
The structure of the paper is the following one. The next section presents our research motivation;
Section 3 offers an overview of telecom reforms in the EU; Section 4 presents our data sources and
some descriptive statistics; Section 5 is about modelling price and productive dynamics; Section 6
offers probit estimation of consumer satisfaction with prices and quality; the last section concludes
with suggestions for further research and policy implications.
2. RESEARCH MOTIVATION
According to Laffont and Tirole (2000), before the 1980s the telecom industry was almost
everywhere considered a natural monopoly because of large fixed costs. Consequently,
governments did not allow competition, that was considered wasteful. In most countries the
industry was either nationalized or, as in the US, a private monopoly under strict regulation. The
latter was in the form of cost-plus pricing rules, with wide scope for cross-subsidies. Basically, the
business users’ tariffs had a high mark up to allow for long-run marginal cost pricing rules applied
to residential users; tariffs of international and long-distance national calls paid for losses in the
local calls segment of the business; accession charges were low and uniform, to offer universal
access to rural users. These pricing rules distorted incentives for allocative and productive
efficiency. Consequently the level and structure of prices were ‘wrong’. The core reforms in the late
1980s and 1990s were divestiture of incumbents, new incentive regulation (usually meaning the use
of price caps instead of rate-of-return targets), and liberalization. At the same time, there was the
perception that new technologies, particularly the diffusion of microwave communication, could
weaken the traditional case for natural monopoly.
The new paradigm that emerged was in favour of breaking up the incumbent, privatizing it when a
public corporation, or otherwise force it to divest part of its capacity in favour of entrants and/or
force access to competitors to their networks, establish independent regulators to administer new
licenses and design price caps, enhance competition everywhere. In some more extreme views, after
a transition period under asymmetric regulation to protect entrants, full liberalization could be
applied, and sector regulators abolished, surrendering their residual powers to generic competition
offices.
Along this line of thinking, some international organizations, such as the World Bank, the OECD,
and the EC (with some variations among them), started to build something as a consensus telecom
reform package, and advised governments everywhere to apply it. The OECD and the EC started to
define regulatory indicators and reform milestones, and to evaluate governments as frontrunners or
laggards in implementing the policy changes (see Commission of the European Community, 2007,
and Gonenc et al, 2001). Minority views, often coming from within the industry, e.g. Harper (1997),
who had reservation about full privatization and liberalization, mainly because of technological
arguments of subadditive costs of the network, were dismissed without much consideration.
With the benefit of hindsight, twenty years on, we can see that the reform approach was often based
on strong assumptions and an over-simplification of a much complex story. The newly established
regulators, the courts, governments, and managers, had to learn a lot from real world evolution, and
there were a number of unexpected technological changes.
There are three issues that we want to emphasize here to motivate our research interest in testing the
reform paradigm: technology, ownership, and regulatory issues.

4
The traditional technology of the industry was based on first, switching, second, transmission
capacity, and third network software.
Switching shifted from analogical codes to digital ones before reform, in the 1970s and early 1980s,
and the change in general was successfully managed by state-owned companies in Europe
(Millward, 2005), who were able to self finance the necessary investment and often more efficient
that their US counterparts. The continuous digital technological progress world-wide was such that
productivity increase was fast almost everywhere. The number of lines per employee, or per unit of
invested capital, increased dramatically under public monopoly. For example, Telecom Italia, a
listed public corporation with the Italian Treasury as the majority stakeholder, at divestiture was the
best in Europe as for switched lines per employee; for British Telecom, productivity trends were
higher in the two decades before divestiture than after it (Florio, 2003). This performance was
linked to high growth of demand and high in-house research. While the integration between
incumbent operating companies and their technology suppliers (for instance between AT&T and
Bell Laboratories) was widely criticized as anti-competitive, the internalization of R&D was in fact
high under monopoly, for a well known Schumpeterian argument (Sterlacchini, 2006 observes that
the privatized telecoms are now investing in research much less than they used to do2).
Moreover, while it is not self-evident that divestiture was needed to foster the adoption of the digital
technology opportunities, the case for the decline of natural monopoly in transmission was probably
even more exaggerated. The expectation in the mid 1980s was that microwaves would imply much
less sunk cost than wires, i.e. the traditional twisted pair of copper wires. In fact, cellular telephony
boomed, and offered the welcome opportunity of mobility to users. However, it was soon realized
that the key issue here was the interconnection of wireless and wired transmission, with the former
shifting to new systems of data compression, such as asymmetric digital subscriber lines, or of
transmission hardware, as optical fibre. To the surprise of many (including the US regulators), the
fixed line transmission under the new technologies was much more effective in carrying advanced
services, including data and images, so that the Internet revolution happened through the wired
transmission, and only to a limited extent, until quite recently, through the wireless. This evolution
re-established a natural monopoly element in the industry. The third factor, the evolution of
advanced software to optimize signalling, combined with the new role of networks, in a sense
reinforces the case for decreasing average costs.
These technological trends pose a number of difficult problems to regulators. While the scope and
range of services increased, and the distinction between the telecoms, the media industry, and other
activities becomes blurred, there was a multiplication of networks. Providers of electricity, water,
gas, railways, highways, cable television are all possible network investors, but to invest they need
mutual access, and some stability of revenues. Moreover, the local loop, i.e. the final connection of
the fixed line with the user, is still the crucial bottleneck, because the possibility to offer competing
physical connections to the end user is out of question. Thus liberalization, i.e. allowing the entry of
a plurality of players, is far from decreasing the role of regulators, because they should try and find
solutions to complex two-ways access between networks. The trade-offs arising in this context are
significant. The entry in the local market can happen in different ways, through facility-based entry,
resale of services, unbundling. Each of the solutions has costs and benefits, and in some case
promoting competition, paradoxically, can be expensive, and it is not clear its final impact on
prices, because in a sense competition can be rather artificial, because it is supported by heavy-
handed regulation. Establishing access pricing in this context gives the regulators extremely wide
power. They literally can decide about long term profits and losses of specific companies. In some
cases one can think that we are full circle, to a sort of implicit rate of return regulation, when
network owners have to show their ‘costs’, under a number of possible accounting definitions.
2 According to Sterlacchini (2006) the drop in R&D between 2000 and 2005 was 57% for Deutsche Telekom, 18% for
Telefonica, 20% for BT, 12% for Telecom Italia, while France Telecom increased its R&D expenditure by 27%.
5
A rather premature announcement of the death of natural monopoly and of public regulatory
powers, sheds new light on the issue of ownership rights. Public or quasi public ownership of some
parts of the networks is no more as out of question as it used be. While the EU is neutral on this
point, it asks for ‘separation’ of the network for operations, and a regulation that offers access to
everybody. France and Germany have been reluctant to sell their control shares in the incumbents.
BT has been forced to establish a separate manager for the network (“Openreach”), with a special
(equality of access) board, and more than 200 binding regulatory undertakings. In Italy, the
government has recently given the regulator wide powers on the networks, and has considered a
form of re-nationalization of the main network. In fact, privatization, unbundling, and liberalization
show significant variability across EU countries (see next section).
It seems sensible to learn from experience and test empirically the welfare impact of reforms.
Ideally we would like to have for each country a set of counter-factual histories, where we compare
the ‘with’-‘without’-‘with a different one’ reform scenarios, and then test their impact on
productivity, prices, and social welfare. This is however a daunting task, mainly because of lack of
comparable data. We suggest here a shortcut approach, that can be easily replicated by telecom
regulators or independent researchers. We exploit country variability in Europe and test empirical
models where features of the reforms are among the explanatory variables. In the next section we
briefly review some of the reforms in the EU countries we consider, before moving to our
modelling approach.
3. THE PROCESS OF LIBERALIZATION: AN OVERVIEW
The change of the regulatory environment in which European telecommunication industries used to
operate has been a complex process, led by the EC. The process included several steps with
complementarity between sector specific regulation and competition policy, as well as interaction
between EU institutions and member states.
We can identify a common liberalization path in the EU, with the Commission that strongly pushed
to promote competition, while several member states resisted and often delayed the implementation
of regulatory measures. During the 1980s, a working group on telecommunications was created and
later transformed in DG XIII Information Society. In 1987 the EC Green Paper (EC COM(87)290)
advocated a legislative programme that included full liberalization of the equipment sector and
progressive opening of services, and harmonized European measures with respect to network
access, interoperability and interconnection. In 1990 the market for private networks and leased
lines was opened and few years later the same happened for mobile communication.
Other EC Green Papers, first on satellite communications in 1990 and then on mobile and personal
communications in 1994, extended the same regulatory principles in these two areas. In 1996 the
Full Competition Directive paved the way to the liberalization of fixed telephony from 1998
(Commission Directive 96/19/EC).
Spain, Portugal, Greece and Luxemburg obtained a delay to implement the Directive and adopted
new competition policy some years later, while few countries anticipated the Commission pressure
and began to open telecommunication market during the 1990s.
UK is the most obvious example of a reform frontrunner, but also Finland, Sweden and partly
Denmark adopted a similar approach. UK started its liberalization process ahead of all European
Countries. After the decision in 1980 to reform its telecommunication sector, the UK government
proceeded cautiously, only granting Mercury (part of Cable&Wireless group, privatized before
British Telecom) the right to compete first only in national calls and two years later also on
international basis, thus creating a duopoly. In 1984 BT was privatized, floating on the market 51%

6
of capital previously owned by the state. It was also appointed the sector regulatory authority, Oftel,
to be later transformed in Ofcom, with the broadening of the mandate to television. In parallel from
1983 onward cable TV operators were granted the right to use their television network to provide
telecommunication services in conjunction with BT or Mercury, and in 1985 two licences to
provide mobile services were granted to Racal and to the incumbent BT (OECD 2002). Despite the
focus on a more appealing market and the strong protection, Mercury’s market share grew slowly
and in 1995 it was just 10% of the total revenues.
The Duopoly policy was abolished in 1991 and since then UK implemented an increasing number
of EU telecommunication directives. Thus, although the UK’s telecommunications policy was
initially developed independently of other Governments and institutions, it has later been adapted to
meet external obligations. However with few exceptions UK has led, rather than followed, EU
liberalization measures. With its pioneering policy, UK opened the telecommunication market 18
years before the majority of European countries and the actors gained a valuable experience both in
competing and in regulating.
Removing the legal barriers to market entry and establishing pro-competitive regulation at
European level was a crucial step. This process was led by the Commission and was promoted by
organization such OECD. Moreover in the phase prior to 1998 policy and legal coordination across
countries with substantially different starting point in the liberalization process had been achieved
(Cawley, 2003). The establishment of EU legislation and translation into member state law was,
however, only the beginning of a long process.
At European level the Commission was engaged in follow-up work on checking and enforcing
implementation both on the regulatory side and on antitrust decisions.
The 1999 Telecommunication Regulatory Review aimed to bring all communication infrastructures
and services into a single framework and to improve co-operation between the Commission and
national authorities. The result was a proposal of a decision and five directives that were finally
adopted in 2003. Following the idea to move from heavy ex-ante regulation to lighter ex-post
antitrust decisions, the three core topics were: authorization, access and interconnection. The
framework directive deals with aspects common to all areas and the data protection directive
extended the coverage of data protection and privacy measures to the Internet.
The basis of the regulatory framework was established at a time when telecommunication was not
the mainstream of European policy (Cawley, 2003). However, the year 2000 saw the emergence of
European integration as a major item on the European political agenda and the growing competition
in telecommunication became part of a broader effort to sustain the diffusion of the Internet and
electronic commerce. The focus of EU legislation was shifted more on content related issue such as
security, intellectual property and privacy.
With the liberalization of fixed telephony many newcomers entered the voice market but in each
country only a handful of operators gained a significant position and the incumbents loose only very
slowly market shares. Eight years after full competition in fixed telecommunication incumbents
maintained in almost every European countries more than half of the total market.
Telecommunications are complex systems where different elements interact with each other and, on
the whole, exhibit significant network economies. Therefore there is not a single act or passage that
opens the market, but a set of measures and a continuous policy carried out both by governments
and national authorities that enable new operators to offer competitive services.
The organisation, span of control and independence from the political power of national authorities
are a major factor in implementing competition. In recent years the area of interconnection and local
loop unbundling have gained importance. And finally the lowering of switching cost, as in number
portability, can improve the competitive outcome.
The control of the client’s telephone number is a significant barrier to switch. Number portability
enables subscriber to retain their number when they move from one operator to another. Fixed
number portability has continued to play an important role in encouraging competition. In October
7
2006, 31 million mobile subscribers and 15 million fixed subscribers ported their number since the
introduction of this possibility. Dimension of number portability depends heavily on substantial
behaviour of dominant incumbent (12th
Implementation Report, 2006)
Unbundling the local loop refers to a series of regulatory measures aimed at providing access to the
incumbent’s local network, the less duplicable part of telecommunication infrastructure. Since
usually is too costly to build the peripheral part of the network, this is a source of significant market
power for established incumbent. A trade off can emerge. On the one side the availability of local
connection at a controlled price enables new competitors to offer telecommunication service
particularly broadband access with DSL technology; on the other side, unbundling could be
detrimental to competition by retarding the roll out of competing infrastructure inefficiently
(Beranes and Bourreau 2005)
In Europe it may appear that local loop unbundling has failed to give a strong push to competition
in market for fixed voice telephony. Competition in fixed voice is still mainly based on carrier
selection (that requires less investment) probably as a result of the low level of profitability in this
area.
Unbundling however has a large potential as a means to offer broadband access to end users for
entrants without local networks. Moreover as new technology like VoIP gains ground the intensity
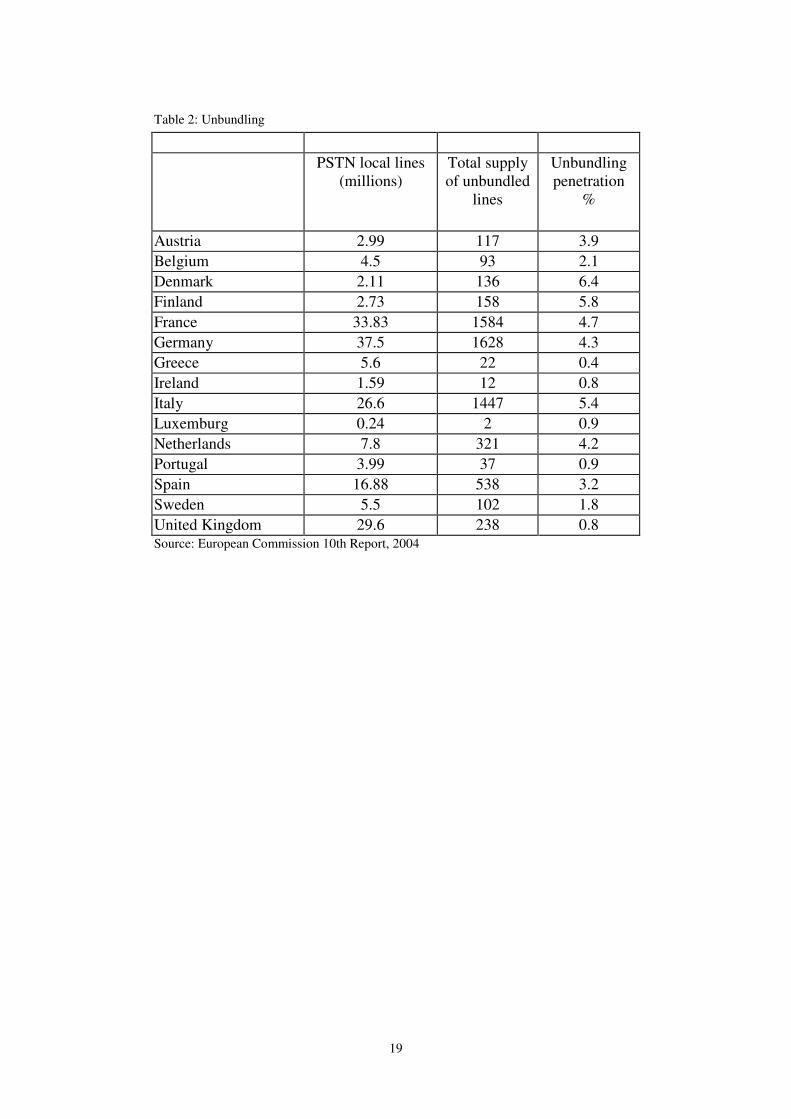
of competition in voice telephony can be expected to increase (De Bijl and Peiz, 2005). Tables 1
and 2 summarize some data on market structure and unbundling. To what extent did the European
consumer benefit from these complex changes in the regulatory and market environment?
Table 1 and Table 2 about here
4. DATA AND DESCRIPTIVE STATISTICS
To answer the question, our empirical analysis consists of two distinct parts. In the first one we
model prices and productivity of the telecommunication sector in order to verify the impact of
reform process. The investigation concerns the 15 EU Countries for the period 1975-2005,
although, due to missing values, the effective sample approximately reduces to the last 15 years.
Almost all the information concerning the telecommunication sector comes from the ITU World
Telecommunication Indicators (2006) dataset. The database contains time series data, mainly
collected from an annual questionnaire sent out by the Telecommunication Development Bureau
(BDT) of ITU, for the years 1960, 1965, 1970 and annually from 1975-2005 for around 100 sets of
telecommunication/ICT statistics covering telephone network size and dimension, mobile services,
quality of service, traffic, staff, tariffs, revenue and investment.
The indicator we use to describe the dynamics of prices is the price of a 3-minute fixed telephone
local call (peak rate). The choice of local call prices is rather questionable in that the great part of
variability in prices is shown in national and international prices. Our choice, however, is based on
the fact that, to our knowledge, no actually comparable long-time series for national and
international call prices are available for the most part of the EU15 Countries. We consider also
monthly telephone subscriptions and telephone connection charges. Short time series for all
telecom prices are however available from the Eurostat dataset, and we use them for the consumers’
satisfaction analysis. In Table 3, we report local, national and international call prices for 1997,
2001 and 2005, for all EU15 Countries.
Table 3 about here

8
9
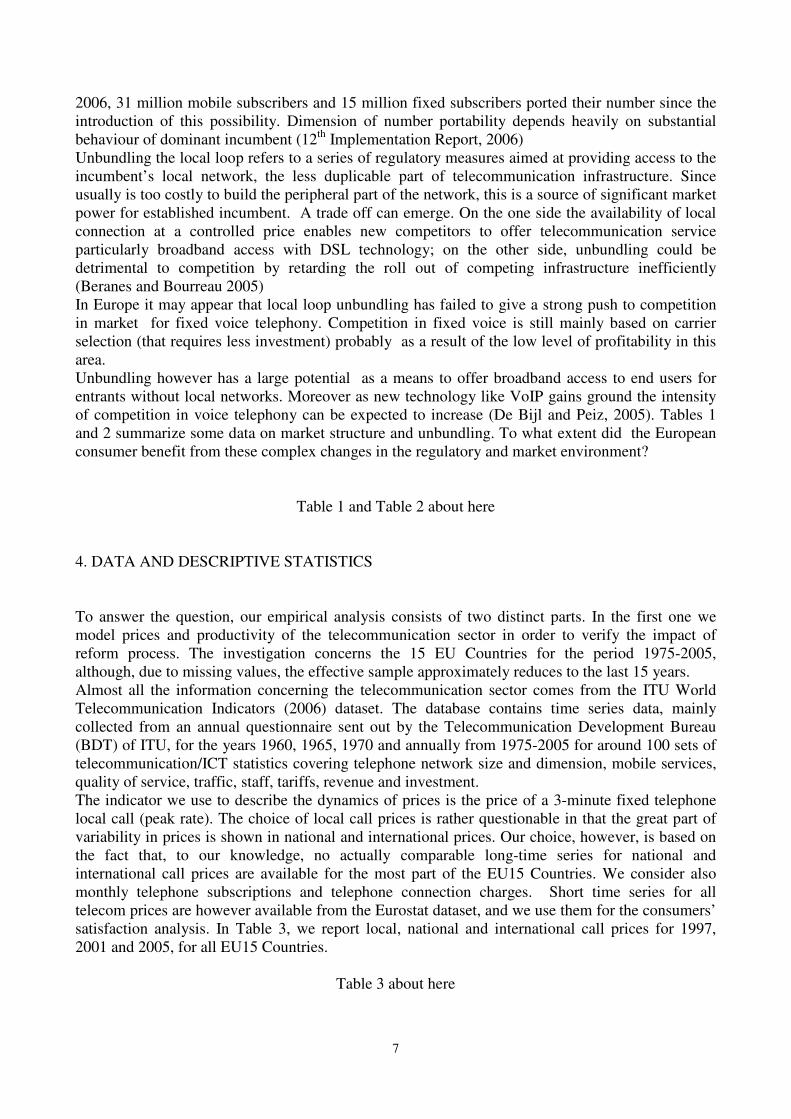
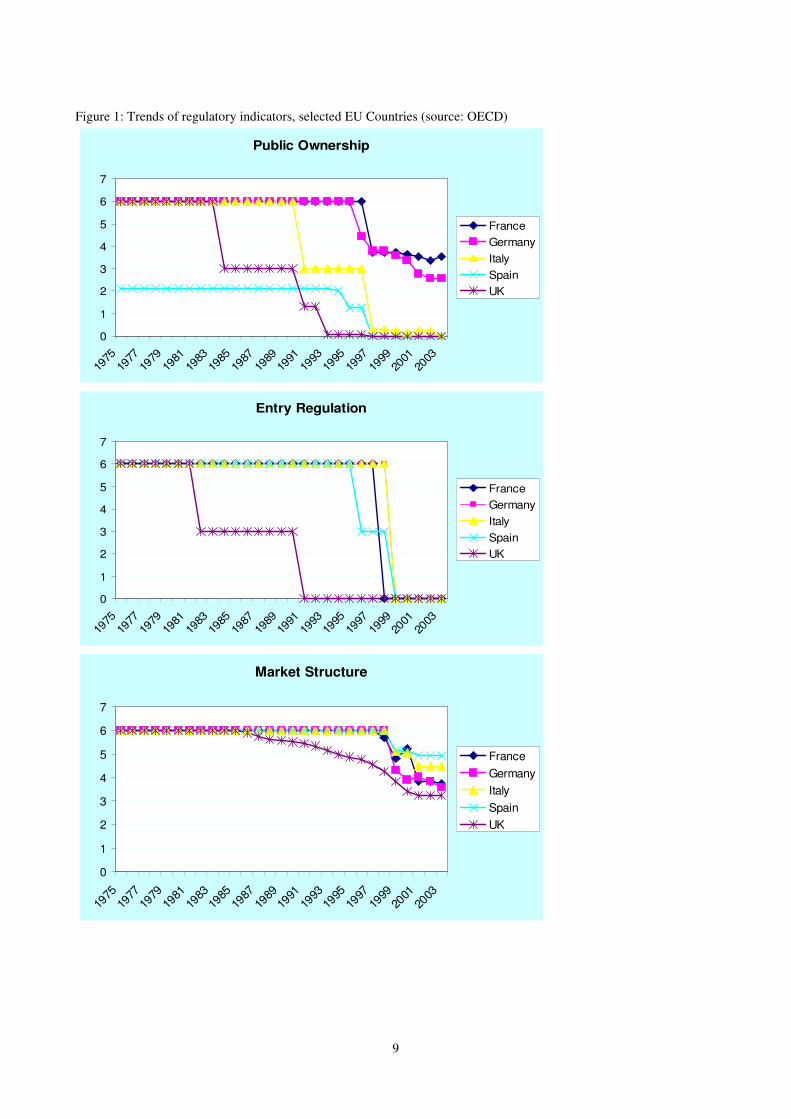
Figure 1: Trends of regulatory indicators, selected EU Countries (source: OECD)
Public Ownership
0
1
2
3
4
5
6
7
1975
1977
1979
1981
1983
1985
1987
1989
1991
1993
1995
1997
1999
2001
2003
France
Germany
Italy
Spain
UK
Entry Regulation
0
1
2
3
4
5
6
7
1975
1977
1979
1981
1983
1985
1987
1989
1991
1993
1995
1997
1999
2001
2003
France
Germany
Italy
Spain
UK
Market Structure
0
1
2
3
4
5
6
7
1975
1977
1979
1981
1983
1985
1987
1989
1991
1993
1995
1997
1999
2001
2003
France
Germany
Italy
Spain
UK
10
The policy indicators come from REGREF, an OECD regulatory database (Conway and Nicoletti,
2006) which collects some indicators of privatization, unbundling, liberalization of several services
of general interest across OECD countries. Focussing on the telecommunication market, we use the
variable public ownership, which measures the degree of public ownership and is coded from 0
(private ownership) to 6 (public ownership), the variable market structure, which is an indicator of
the market share of new entrants and is coded from 0 to 6 (6 being the smallest market share and 0
being the largest), and the variable entry regulation, which is a weighted average of legal conditions
of entry in a market and is coded from 0 (free entry) to 6 (franchised to one firm). Although in some
cases these variables only take discrete values, they are allowed to take any value in the 0-6 range.
The time series starts in 1975 and ends in 2003. All these indicators relate only to fixed telephony
sector.
In Figure 1 we report, for some EU countries, the dynamics of the three indicators we use for
investigating the impact of deregulation policies on the telecommunication market. From the figure,
it is clear that the trend has been, since the beginning of the 1990s, towards a marked reduction of
public ownership, a less integrated industry structure and a less regulated access to the market.
The second part of the empirical analysis, instead, concentrates on the relations between consumers’
subjective satisfaction, prices of the telecommunication services and reforms.
Consumers’ subjective satisfaction is measured in the Eurobarometer data set, which collects
information about approximately 1,000 people in each European country in 2000, 2002 and 2004
(for a thorough analysis of the Eurobarometer datasets concerning satisfaction with some services
of general interests, see Fiorio et. al., 2007). While the sample reduces to three years, we are able to
include in the information set more detailed measures for prices, such as prices for local calls, for
national calls and for international calls, together with connection charge and monthly subscription.
Such information concerning the price of different calls come from the already mentioned Eurostat
dataset, and are available for the period 1998-2005.
5. EXPLAINING TELECOMMUNICATION PRODUCTIVITY AND PRICE DYNAMICS
Our empirical analysis is based on the specification and estimation of equations for prices,
subscriptions, connection charges, and productivity. Each of these equations includes, among the
explanatory variables, aggregate or detailed measures of the level of privatization and market
opening of the sector.
The econometric model consists of four equations, each of which explains respectively the
dynamics of average prices of fixed telephone calls, monthly telephone subscriptions, telephone
connection charges and productivity. The analysis has been performed by using dynamic panel data
models, where the dynamics mainly concerns lagged dependent variables in order to explain the
strong persistence involving both productivity and prices measures.
Let it
p be a measure of telecommunication prices (or productivity) for country i at time t, it
R the
vector of regulatory variables for country i at time t, which includes entry regulation, public
ownership and market structure, and X a matrix of control variables, we estimate the model:
Pit = c + Rit’β + Xit’γ + εit (1)
where c, β, and γ are parameters to be estimated and ε the error term. As the models do include
lagged dependent variables, in order to avoid consistency problems, we use the Arellano-Bond

11
estimation procedure. Moreover, as some explanatory variables cannot be considered as exogenous,
they need to be instrumented in the estimation procedure. As an example, consider the case of the
price equation. One of the explanatory variable for the price dynamics is the investment in the
telecommunication sector3. Especially for the period preceding the denationalization policies, both
prices and investments were fixed by the same monopolistic enterprise, making clear the necessity
to treat the explanation variable as endogenous.
Prices, monthly subscriptions and connection charges
We estimate distinct equations for the three components of price for the final consumers. Our
choice is based on the fact that, in many cases, a decrease in the price of the service is followed by a
raise of other items (e.g. monthly subscription and connection charge). All the equations, however,
have the same structure.
In the first part of the analysis, we include an aggregate indicator of regulatory conditions while the
subsequent step is to investigate which, among each reform indicators, mainly contribute to explain
the dynamics of productivity, prices and the other items of the telephone bill. We thus repeat the
econometric analysis by substituting the aggregate sector indicator with the indicator for the entry
regulation, for the amount of the public ownership, and for the market structure, as described above.
In Table 4 we report the estimates for different specification of the price equation. As already
mentioned, the dependent variable is the price of a 3-minute fixed telephone local call (peak rate).
The set of explanatory variables, other than the REGREF measures of the regulatory reforms,
includes control variables such as costs, technological progress and macroeconomic indicators.
Table 4 about here
In the first two equations we simply consider an aggregate indicator of the market opening. Both
coefficients are positive but only when controlling for other variables, the relation between prices
and market opening becomes significant. In particular, the relation between prices and productivity
seems to be strong, extremely robust, and with the expected negative sign: higher productivity
contributes at reducing prices4. The variable density, which is the number of inhabitants per sq. km,
can reasonably be considered as a proxy for economies of scale in building and managing the fixed
telephone network. This variable enters with a negative sign and is significantly different from zero.
The other three equations, instead, investigate the effects of each single market condition indicators
on prices. Once controlled for costs, productivity and other control variables, the effects of
liberalization and privatization enter through entry regulation and market structure indicators. The
two coefficients have the expected positive signs and are significant, indicating thus that the
liberalization process significantly contributed at reducing prices. The change of the ownership
from public to private, however, seems to play a less relevant role, as shown by the marginal
significance of the coefficient. These results are rather robust and do not substantially change for
the different specifications5.
3 On the relationship between regulation and investment see Alesina et al. (2005).
4 As we intend to model the effects of market deregulation on productivity, we consider this variable as endogenous and
has been instrumented in the estimation procedure. 5 Very similar results have been obtained using different measures of prices. We repeated the analysis for local, national
and international call prices from the Eurostat dataset mentioned above but, our results, in some sense surprisingly,
show that only local prices substantially reduces due to the liberalization policies. In particular, entry regulation and

12
Table 5 about here
In Table 5 we report the estimation results for different specifications of the telephone connection
charge equation. The specifications are very similar to those for prices. The aggregate indicator of
the market opening is never significant and the same happens when including the disaggregated
REGREF indicators. Technological progress, as expected, enters with a negative sign, while, the
number of telephone lines variable enters significantly and with a positive sign. An interesting
result concerns the negative and significant relationship between connection charge and local call
prices pointing to a rebalancing effect. The third set of equations are related to the residential
monthly telephone subscriptions. All the estimates are presented in Table 6.
Table 6 about here
The aggregate indicator of the market opening is never significant, even when controlling for
productivity, costs and other effects, and moreover, neither the single indicators, significantly enter
the relation. The local call prices, although weakly, are positively related to the monthly
subscription charge.
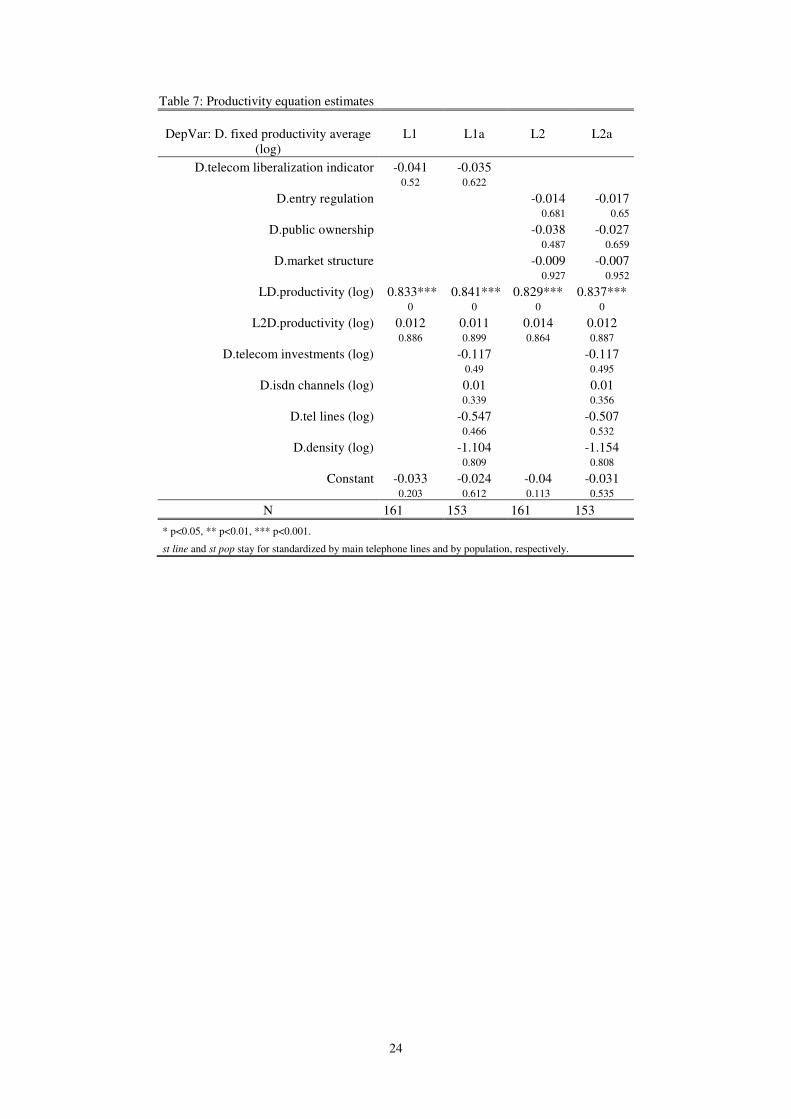
Productivity
In this part of the analysis, we specify and estimate the impact of privatization and market
liberalization on the productivity performances of the telecommunication sector6.
In Table 7 we report the estimated coefficients of four different specifications for the productivity
equation. None of the market opening indicators significantly contributes at explaining the
dependent variable. In other words, both privatization and market liberalization do not have any
impact on the productivity performances of the telecommunication sector, which in turn was the
main driver of price trend in the previous models.
Table 7 about here
6. CONSUMERS’ SATISFACTION WITH TELECOM PRICES
In the previous section we analyzed whether an objective measure of a key element of consumers’
welfare, such as the price they pay for telecommunication, is influenced by regulatory variables. In
this section we extend the analysis by investigating whether subjective measures of satisfaction with
telecommunication prices and quality are influenced by market reforms and prices. There are two
reasons for looking into subjective evidence: perceptions are important per se, because they can
influence government and regulators decisions; moreover, micro-information available to the
individual user can be more revealing than the aggregate statistics we have used in the previous
section, i.e. because of price discrimination across types of users.
market share mainly contribute at reducing local call prices. The analysis, however, reduces only to the period 1998-
2003. All the results are not reported in the paper but are available from the authors upon request. 6 The productivity indicator is calculated dividing the revenue of the fixed telecom industry by the number of workers.

13
As satisfaction to different services of general interest (SGI) is coded with ordinal variables,
analogously to Eurobarometer (2004), we dichotomize consumers’ satisfaction, i.e. answers to
questions about prices and quality of SGI are classified into “satisfied” and “not satisfied”. In
particular, the consumer price satisfaction variable S is recorded equal to 1 if the respondent states
that the price he pays for fixed telephone services is fair, and is recorded equal to 0 otherwise. The
consumer quality satisfaction variable is recorded equal to 1 if the respondent states that the quality
of the fixed telephone services used is very good, and is equal to 0 if the answer is fairly good,
fairly bad or very bad.7
The analysis has been conduced by using a probit model of the form
*Pr( 1| ) Pr( 0 | ) Pr( | ) 1 ( ) ( ) ( )S S e p= = > = > − = − Φ − = Φ ≡x x xβ x xβ xβ x (2)
where *S is the unknown exact level of individual satisfaction, x is a matrix of regressors, β is the
vector of related coefficients, e is a symmetric and continuously distributed variable independent of
x and Φ is the standard normal cumulative density function. The matrix x includes individual
characteristics (i.e. sex, occupation) accounting for individual observed heterogeneity, time-varying
country macroeconomic variables (i.e. GDP level and rate of growth) accounting for time-varying
heterogeneity, a time fixed-effects to capture any time trend and some time-invariant country-fixed
effects to capture any country-specific effects.
The partial effect of j
x on ( )p x depends on x through the standard normal density function,
( )φ xβ , as ( ) / ( )j j
p x φ β∂ ∂ =x xβ . The average partial effect (APE) for a continuous variable j
x is:
1
1 ni
j j
i
APEn
β φ=
= ( )∑ x β (3)
where n denotes the number of observations, and ix β the value of the linear combination of
parameters and variables for the i-th observation. The APE for a dummy variable is:
1
1[ | 1 | 0 ]
ni i i i
j j j
i
APEn =
= Φ( = ) − Φ( = )∑ x β x x β x
which avoids the problem of setting the dummy variable to means.
All estimates to follow present results in terms of APE. As controls, x , we used a set of individual
characteristics (including sex, age, marital status, age when finished education, occupation, political
views, contribution to household income, and household income, respondent’s cooperation as
assessed by interviewer), of country fixed-effects, year dummies, some country-level
macroeconomic variables (population density, GDP per capita, GDP growth rate, employment
growth rate, Gini index) and some regulatory indicators of entry regulation, public ownership, and
market structure and vertical integration.
As mentioned above, we include also telecommunication market prices among independent
variables of model (2) to verify whether subjective satisfaction depends on actual prices and
whether the relationship between subjective satisfaction and regulatory variables is at all driven by
the relationship between regulatory variables and market prices.
7 We include among the non-satisfied those who declared that quality of SGI is fairly good increase variability. In fact,
only about 5% of consumers across services rate quality of SGI as fairly or very bad.

14
In Table 8 and Table 9 marginal effects for price and quality satisfaction are reported. The results in
both tables come from the same specification of the model, where we simply change the dependent
variable. In columns (A) no market price and policy variable is included while in columns (B) and
(C) both first differences and levels of prices are included. In column (D), instead, the three
regulation variables are included in the specification of the models. In all specifications, individual
specific and macro indicators have been included, together with country and time fixed effects.
Concerning the consumers’ satisfaction about prices, the regulation variables appear to be less
important than price indicators in explaining the probability of being satisfied. In fact, only the
entry regulation variable enter significantly, but with a surprising positive sign. This result can be
explained by observing that over the three years, only Portugal and Greece for the two years 2000
and 2002 (i.e. only 1002 over the total amount of 47284 observations) present values different from
0, which indicates free entry in the trunk telephony market. The other two policy indicators, market
structure and public ownership, enter with a negative sign but are not statistically significant.
The effect of price indicators in the explanation of consumers’ satisfaction is significant and
negative, as expected, for national and international calls prices. The price of local calls have an
ambiguous impact: it enters significantly with a positive sign in specification B and with the
opposite and expected sign in specification C, when growth rate of prices are also included.
Concerning the growth rate of prices, the estimated coefficients, when significant are positive,
perhaps indicating expectation of an increase in the quality of the service. The country fixed effects
are extremely significant in almost all cases, pointing to national features not captured by the
regulatory variables and the other controls. Finally, as 2000 is the base year, It is difficult to find
evidence towards a significant increase of consumers’ satisfaction about the price of the telephony
service.
Table 8 about here
The same model structure has been used for investigating the satisfaction about the quality of the
service. Results are reported in Table 9. Differently from the previous case, the market structure and
entry regulation indicators enter significantly and with negative sign, indicating a higher perception
of the quality of the service as the market becomes more liberalized. Privatization, on the contrary,
do not offer a significant contribution in increasing the quality perception of the service.
The impact of the price variables, when both levels and growth rate are included, is not univocal.
Local and national calls prices enters negatively while the coefficient of international calls price is
positive. Growth rate of prices, when significant, have a positive contribution. As before, thus, an
increase of prices is interpreted by the customers as an increase in the quality of the service.
Country fixed effects, as for the satisfaction about prices, are always significant and extremely
robust with the different specifications.
Table 9 about here
7. CONCLUDING REMARKS
Our findings suggest that the available summary reform indicators, and the comparable statistical
information on the telecom industry, do not offer strong evidence for a cross-country policy

15
evaluation. While some of the estimation results confirm the positive role of competition, other
empirical findings contradict other mainstream prescriptions, particularly on privatization and
unbundling. We sum-up our results below.
We have tested the role played by the OECD regulatory indicators in explaining proxy telephony
consumers prices and satisfaction in the EU 15. Our findings can be summarized as follows:
- the main drivers of pushing downwards prices of local calls for fixed telephony are productivity,
population density, market shares of new entrants and entry regulation. GDP change tends to
increase prices, through a demand effect. The ownership of the telecom incumbent operator
does not play a statistically significant role.
- Connection charges are partially decreased by technological progress, while the number of main
telephone lines, perhaps surprisingly, increase them. There is also a negative relation between
prices and connection charges. Ownership, market shares of new entrants and entry regulation
are never significant.
- Regulatory variables and ownership do not influence subscription rates, that respond only to
local calls prices, with the expected negative sign.
- Productivity, in turn, is not influenced by any of the three OECD regulatory indicators, and it
seems influenced only by its past trend, pointing to technological factors.
- When we consider subjective data from Eurobarometer, the consumers’ satisfaction about prices
is negatively influenced, as expected, by national and international calls prices. Local calls
price, on the contrary enters with a positive sign. The price of local calls, instead, have an
ambiguous impact. The main result concerning the impact of the regulation indicators in
explaining the perception about the price of the service is that their contribution is negligible.
Country fixed effects dominate the other factors as explanatory variables.
- Entry regulation and market structure indicators play a positive role in explaining satisfaction
with telephone service quality, while the role of privatization has a marginal impact. As for the
satisfaction about prices, country fixed effects are extremely important with all Countries but
Belgium and the Netherlands more satisfied than the UK (our benchmark)
While our empirical analysis is severely constrained by data limitations, it is entirely new and as far
as we know it has a much wider scope than any other previous empirical work at EU level, either by
the European Commission, the OECD or by national regulatory bodies. The analysis is based on the
best evidence available to any researcher from official sources, such as Eurostat, Eurobarometer,
OECD, ITU. Our findings suggest that ownership change, from public to private, plays no role in
explaining prices of local calls, connection charges and subscription rates, productivity, and also
perceived price and quality of the service. Thus, one key item of the standard reform paradigm,
privatization of the telecom incumbent, is far from being supported by empirical analysis.
The market share of entrants seems to play a more positive role, as one would expect in a more
competitive environment, but the result is not very strong. The indicator for entry regulation has
very limited explanatory power.
Overall, it seems that technology and demand factors, combined with unidentified country features,
have much more explanatory power than other variables.
We do not interpret our results as an outright rejection of the standard reform paradigm. Perhaps the
dynamics of international and long distance calls may offer a picture more consistent with it, but
long term comparable series are not available to us (or to anybody else, as far as we know) and
testing with shorter time series does not change the message coming from the analysis of fixed
telephony prices. Perhaps the OECD regulatory indicators fail to capture the subtle details of the
reforms, but the Market Opening Milestones data used by Copenhagen Economics (2005a,b) in an
important study commissioned and frequently cited by the European Commission (Commission of
the European Community, 2007) do not seem to add much to the OECD indicators. Future research

16
should try to expand the empirical analysis by type of services, technology, demand variables, and
better regulatory variables.
Having said this, we conclude that up to now it would be less than prudent to state that in the EU 15
the reform experiment is supported by clear empirical evidence. It is probably too early to discern
policy implications from our findings, but we would suggest two of them for future investigation.
First, the role of privatization per se has probably been exaggerated. In some countries and under
some circumstances public ownership of at least some part of the industry cannot be dismissed.
There is some evidence that market shares of new entrants is welfare improving, but the positive
impact of competition does not seem to be affected by public ownership. This finding should be
considered in the recent debates in the EU about who should own the main telecom networks.
Should ownership separation of the network be implemented, public ownership is an option to be
reconsidered. Moreover, if the network is not going to be separated from the incumbent, a public
stake into the incumbent is an alternative option to be considered as well.
Second, technological factors are key drivers of productivity and prices, and cuts in the R&D
budget of privatized telecoms, probably because of short-time investment horizon, are bad news. It
seems that there is still wide scope for the EU governments to think about their active role in the
design of a telecommunication policy. The European Commission should perhaps pay more
attention to its strategic objectives, including protection of consumers from market power, and less
to dictating an industry architecture …... Our findings suggest that country institutional
characteristics do matter, and a unique reform approach in the EU is not warranted.
References
Alesina A., Ardagna S, Nicoletti G. and Schiantarelli F. (2005), Regulation and Investment, Journal
of the European Economic Association 3, 791-825.
Beranes E. and Bourreau M. (2005), An Economist’s Guide to Local Loop Unbundling,
Communication & Strategies 57 pp 13-32.
Cawley R. (2003), The European Union and world telecommunications market, in: G. Madden (ed)
World Telecommunication Markets, The International Handbook of Telecommunication Economics
3, Edwad Elgar Cheltenham (UK).
Commission of the European Communitiy, (1987), Green Paper on the Develpment of the Common
Market for Telecommunication Services and Equipment, Commission Green Paper COM(87)290,
Bruxelles
Commission of the European Community, (1996), Implementation of Full Competition in
Telecommunication Markets, Commission Directive 96/19/EC, Bruxelles
Commission of the European Community, (2007) European Electronic Communication Regulation
and Markets (12th
Report), COM(2007)155
Commission of the European Community (2007), Evaluation of the performance of Network
industries providing services of general economic interest, 2006 report, Commission staff working
paper, preliminary draft, Bruxelles.

17
Conway P. and Nicoletti G. (2006), Product market regulation in non-manufacturing sectors in
OECD countries: measurement and highlights, OECD Economics Department Working Paper,
forthcoming.
Copenhagen Economics (2005a), Market Opening in Network Industries: Final Report, DG Internal
Market, European Commission, mimeo, Brussels.
Copenhagen Economics (2005b), Market Opening in Network Industries: Sectoral Analyses, DG
Internal Market, European Commission, mimeo, Brussels.
De Bil P., Peitz M., 2005, Local Loop Unbundling in Europe: Experiences, Prospects and Policy
Challenges, Communication & Strategy 57, 33-58
Edwards G. and Waverman L. (2006), The Effects of Public Ownership and Regulatory
Independence on Regulatory Outcomes, Journal of Regulatory Economics 29, 23-67.
Eurobarometer (2004), The people of Europe and Services of general interest, Report N. 53.
Fiorio, C.V., M. Florio, S. Salini and P.A. Ferrari (2007), Consumers’ Attitudes on Services of
General Interest in the EU: Accessibility, Price and Quality 2000-2004, Nota di Lavoro FEEM, N.
2.
Florio M. (2003), Does Privatization Matter? The Long-Term Performance of British Telecom over
40 Years, Fiscal Studies 24, 197-234.
Gonenc, R., Maher M. and G. Nicoletti (2001), The implementation and the effects of regulatory
reform: past experience and current issues, OECD Economic Studies, N. 32/1, Paris.
Harper J. (1997), Monopoly and Competition in British Telecommunications. The Past, the Present
and the Future, Pinter, London.
Laffont J.J. and Tirole J. (2000), Competition in telecommunications, The MIT Press, Cambridge
(MA).
Millward R. (2005), Public and Private Enterprise in Europe: Energy, Telecommunications and
Transport 1830-1990, Cambridge, Cambridge University Press.
Newbery D. (2000) Privatization, Restructuring and Regulation of Network Utilities, MIT Press.
OECD (2002), Regulatory reform in UK, Review of Regulatory Reform, OECD, Paris.
Sterlacchini S. (2006) The R&D Drop in European Utilities. Should We Care About It?, DRUID
Working Paper No. 06-19, Copenhagen Business School.

18
APPENDIX A: TABLES
Table 1: Market structure
Number of mobile
operator (1999)
Operators
offering long
distance calls
(1999)
Incumbent
market share
(1999)
%
Incumbent
market share
(2006)
%
Austria 4 20 99 68
Belgium 3 10 NA
Denmark 4 11 97
Finland NA NA 93
France 3 31 98 98
Germay 4 47 65 57
Greece 3 NA 100 73
Ireland 2 6 99 63
Italy 4 12 95 71
Luxemburg 2 6 100 NA
Netherland 5 24 90 75
Portugal 3 NA 100 79
Spain 3 10 93 75
Sweeden 4 22 70
United Kingdom 4 26 72
Source: authors elaboration on European Electronic Communication Regulation and Market Report
19
Table 2: Unbundling
PSTN local lines
(millions)
Total supply
of unbundled
lines
Unbundling
penetration
%
Austria 2.99 117 3.9
Belgium 4.5 93 2.1
Denmark 2.11 136 6.4
Finland 2.73 158 5.8
France 33.83 1584 4.7
Germany 37.5 1628 4.3
Greece 5.6 22 0.4
Ireland 1.59 12 0.8
Italy 26.6 1447 5.4
Luxemburg 0.24 2 0.9
Netherlands 7.8 321 4.2
Portugal 3.99 37 0.9
Spain 16.88 538 3.2
Sweden 5.5 102 1.8
United Kingdom 29.6 238 0.8 Source: European Commission 10th Report, 2004

20
Table 3: Price indicators for international, national and local 10 minutes calls for the three years
1997, 2001 and 2005. All prices are in euro (source Eurostat).
Countries 1997 2001 2005
International calls to USA (10 minutes)
Austria 0.390 0.189 0.101
Belgium 0.326 0.100 0.110
Denmark 0.300 0.133 0.110
Finland 0.355 0.222 0.229
France 0.304 0.151 0.102
Germany 0.320 0.058 0.058
Greece 0.315 0.147 0.148
Ireland 0.209 0.105 0.105
Italy 0.310 0.138 0.092
Luxembourg 0.317 0.072 0.067
Netherlands 0.367 0.054 0.059
Portugal 0.351 0.145 0.133
Spain 0.262 0.184 0.078
Sweden 0.226 0.049 0.046
United Kingdom 0.160 0.160 0.089
Local calls (10 minutes)
Austria 0.034 0.048 0.034
Belgium 0.031 0.038 0.038
Denmark 0.031 0.028 0.026
Finland 0.015 0.016 0.017
France 0.031 0.027 0.023
Germany 0.030 0.030 0.027
Greece 0.011 0.025 0.022
Ireland 0.040 0.035 0.034
Italy 0.016 0.017 0.015
Luxembourg 0.026 0.022 0.022
Netherlands 0.024 0.022 0.023
Portugal 0.019 0.021 0.026
Spain 0.014 0.019 0.019
Sweden 0.019 0.020 0.020
United Kingdom 0.045 0.040 0.031
National calls (10 minutes)
Austria 0.185 0.053 0.041
Belgium 0.101 0.038 0.040
Denmark 0.068 0.028 0.026
Finland 0.058 0.061 0.065
France 0.094 0.067 0.058
Germany 0.144 0.058 0.034
Greece 0.176 0.068 0.051
Ireland 0.137 0.065 0.057
Italy 0.107 0.072 0.052
Luxembourg . . .
Netherlands 0.066 0.033 0.034
Portugal 0.141 0.051 0.045
Spain 0.141 0.083 0.058
Sweden 0.057 0.020 0.020
United Kingdom 0.074 0.053 0.031

21
Table 4: Price equation estimates
Dep.Var.: D.fixed local price (log)
P1 P1a P2 P2a P2b
D.telecom liberalization indicator 0.087 0.081*** 0.162 0.000
D.entry regulation 0.029 0.015** 0.014* 0.382 0.007 0.008
D.public ownership 0.042 0.020* 0.016 0.411 0.028 0.095
D.market structure 0.048 0.134*** 0.123*** 0.63 0 0
LD.fixed local price (log) 0.835*** 0.042** 0.826*** 0.038* 0.034* 0.000 0.009 0 0.02 0.045
L2D.fixed local price (log) 0.031 0.031* 0.034 0.017 0.023 0.684 0.012 0.662 0.166 0.07
D.productivity (log) -0.967*** -0.986*** -0.979*** 0.000 0 0
D.telecom investments (log) -0.028 -0.011 0.003 0.311 0.712 0.931
D.mobile subscribers (log) 0.036*** 0.034*** 0.000 0
D.isdn channels (log) 0.004* 0.002 0.003 0.016 0.358 0.089
D.tel lines (log) 0.410* 0.325 0.011 0.061
D.population density (log) -5.798*** -7.093*** -5.874*** 0.000 0 0
D.per capita gdp 0.816*** 1.236*** 0.703*** 0.000 0 0
Constant 0.044 0.002 0.047 0.019* 0.012 0.086 0.835 0.059 0.037 0.191
N 173 155 173 156 155
* p<0.05, ** p<0.01, *** p<0.001
St line and st pop stay for standardized by main telephone lines and by population, respectively

22
Table 5: Telephone connection charge equation estimates
DepVar: D.tel connection charge (log)
C1 C1a C2 C2a C2b
D.telecom liberalization indicator 0.005 0.011 0.738 0.499
D.entry regulation -0.01 -0.006 -0.006 0.196 0.446 0.397
D.public ownership 0.008 0.007 0.006 0.499 0.611 0.653
D.market structure 0.028 0.039 0.039 0.206 0.089 0.092
LD.tel connection charge (log) 1.165*** 0.907*** 1.147*** 0.900*** 0.892*** 0.000 0.000 0 0 0
L2D.tel connection charge (log) -0.254** -0.127 -0.246** -0.117 -0.11
0.001 0.115 0.001 0.15 0.177
D.fixed local price (log) -0.046*** -0.051*** -0.047*** 0.001 0 0.001
D.telecom investments (log) -0.037 -0.034 -0.033 0.393 0.426 0.447
D.mobile subscribers (log) -0.006 -0.007 0.567 0.5
D.isdn channels (log) -0.003 -0.003 -0.003 0.139 0.12 0.13
D.tel lines (log) 0.644** 0.565* 0.642** 0.005 0.017 0.009
D.density (log) 0.583 0.427 0.474 0.479 0.608 0.571
D.per capita gdp -0.175 -0.194 -0.213 0.368 0.305 0.28
Constant -0.005 -0.001 -0.003 0.001 0.002 0.589 0.926 0.504 0.91 0.839
N 185 167 185 168 167
* p<0.05, ** p<0.01, *** p<0.001.
st line and st pop stay for standardized by main telephone lines and by population, respectively.

23
Table 6: Telephone subscription equation estimates
DepVar: D. tel subscription (log)
S1 S1a S2 S2a S2b
D.telecom liberalization indicator -0.001 0.002 0.839 0.836
D.entry regulation 0.001 0.003 0.004 0.693 0.44 0.308
D.public ownership -0.005 -0.004 -0.005 0.425 0.571 0.443
D.market structure -0.001 -0.009 -0.01 0.916 0.426 0.382
LD.tel subscription (log) 0.809*** 0.698*** 0.799*** 0.756*** 0.691*** 0.000 0.000 0 0 0
L2D.tel subscription (log) 0.031 0.117 0.036 0.063 0.117 0.602 0.127 0.546 0.343 0.125
D.fixed local price (log) -0.010 0.013* 0.009 0.125 0.008 0.159
D.telecom investments (log) -0.001 -0.004 -0.006 0.970 0.838 0.767
D.mobile subscribers (log) 0.008 0.009 0.143 0.094
D.isdn channels (log) -0.001 -0.001 -0.001 0.611 0.548 0.574
D.tel lines (log) -0.003 0.044 -0.023 0.980 0.714 0.855
D.density (log) 0.812 0.835 0.927 0.129 0.134 0.087
D.per capita gdp -0.040 0 -0.017 0.711 0.999 0.879
Constant 0.007* 0.005 0.007* 0.003 0.002 0.035 0.373 0.041 0.577 0.731
N 177 155 177 164 163
* p<0.05, ** p<0.01, *** p<0.001.
st line and st pop stay for standardized by main telephone lines and by population, respectively.
24
Table 7: Productivity equation estimates
DepVar: D. fixed productivity average
(log)
L1 L1a L2 L2a
D.telecom liberalization indicator -0.041 -0.035 0.52 0.622
D.entry regulation -0.014 -0.017 0.681 0.65
D.public ownership -0.038 -0.027 0.487 0.659
D.market structure -0.009 -0.007 0.927 0.952
LD.productivity (log) 0.833*** 0.841*** 0.829*** 0.837*** 0 0 0 0
L2D.productivity (log) 0.012 0.011 0.014 0.012 0.886 0.899 0.864 0.887
D.telecom investments (log) -0.117 -0.117 0.49 0.495
D.isdn channels (log) 0.01 0.01 0.339 0.356
D.tel lines (log) -0.547 -0.507 0.466 0.532
D.density (log) -1.104 -1.154 0.809 0.808
Constant -0.033 -0.024 -0.04 -0.031 0.203 0.612 0.113 0.535
N 161 153 161 153
* p<0.05, ** p<0.01, *** p<0.001.
st line and st pop stay for standardized by main telephone lines and by population, respectively.

25
Table 8: Price satisfaction: main estimation results from the probit model.
Marginal effects: Price
A B C D
Price local calls 0.137** -0.273***
Price national calls -0.063** -0.119***
Price international calls -0.220*** -0.238***
Dprice local calls 0.635***
Dprice national calls -0.036
Dlprice international calls 0.105***
Entry regulation 0.020***
Public ownership -0.013
Market structure -0.015
Female -0.016** -0.016** -0.016** -0.016**
Age -0.009*** -0.009*** -0.009*** -0.009***
Age^2 0.000*** 0.000*** 0.000*** 0.000***
Civst==2 0.004 0.004 0.004 0.005
Civst==3 -0.052*** -0.053*** -0.053*** -0.052***
Age when finished education 0.010*** 0.010*** 0.010*** 0.010***
Age when finished education^2 -0.000*** -0.000*** -0.000*** -0.000***
occup8==2 -0.022 -0.022 -0.021 -0.021
occup8==3 -0.018 -0.017 -0.017 -0.018
occup8==4 -0.024 -0.023 -0.022 -0.024
occup8==5 -0.011 -0.009 -0.01 -0.011
occup8==6 -0.080*** -0.080*** -0.080*** -0.079***
occup8==7 -0.034* -0.035* -0.034* -0.034*
occup8==8 0.147*** 0.149*** 0.152*** 0.145***
PoliticsLR==2 0.025*** 0.024** 0.024** 0.024**
PoliticsLR==3 -0.002 -0.003 -0.003 -0.002
PoliticsLR==4 -0.016 -0.016 -0.015 -0.015
RespCoop2==2 -0.029** -0.029** -0.030** -0.029**
Population Density -0.001 0.013*** 0.016*** -0.001
Real GDP growth Rate -0.016** 0.014* 0.042*** -0.023**
Inflation Rate 0.031*** 0.029*** 0.033*** 0.037***
CPI 0.007 0.008 0.009 0.008
GDP per capita -0.002 -0.002 0.005* 0
Yearly employment growth 0.014*** -0.006 -0.028*** 0.018***
GINI -0.012** -0.017*** -0.001 -0.012**
year=2002 -0.046** -0.038 0.050* -0.079***
year=2004 0.191*** 0.093*** 0.086*** 0.175***
Austria -0.44 0.437*** 0.452*** -0.469*
Belgium -0.317 -0.626*** -0.629*** -0.21
Denmark -0.36 0.425*** 0.430*** -0.426*
Finland -0.495 0.443*** 0.449*** -0.539**
France -0.525* 0.643*** 0.717*** -0.549**
Germany -0.278*** -0.204** -0.056 -0.242***
Greece -0.562*** 0.455*** 0.469*** -0.577***
Ireland -0.376 0.426*** 0.430*** -0.435
Italy -0.633*** 0.006 0.002 -0.643***
Luxemburg -0.204 -0.393
Netherlands -0.221 -0.746*** -0.774*** -0.078
Portugal -0.544*** 0.433*** 0.441*** -0.557***
Spain -0.605*** 0.584*** 0.637*** -0.626***
Sweden -0.455 0.466*** 0.481*** -0.49
Constant 2.906 -6.104** -15.672*** 2.987
Observations 38910 38479 39292 38847
Pseudo-R2 0.118 0.121 0.051 0.052
Log-Likelihood -23313.9 -22987.6 -9374.37 -9261.28
Robust p values in brackets - * significant at 10%; ** significant at 5%; *** significant at 1%

26
Table 9: Quality satisfaction: main estimation results from the probit model.
Marginal effects: Quality
A B C D
lprice local 0.034 -0.059**
lprice national 0.022 -0.034*
lprice international 0.009 0.039*
Dlprice local 0.122***
Dlprice national 0.027*
Dlprice international -0.018
Entry regulation -0.003**
Public ownership -0.004
Market structure -0.015**
Female 0.007* 0.007* 0.007* 0.007*
Age 0 0 0 0
age squared 0 0 0 0
Civst==2 -0.011** -0.011* -0.011* -0.011**
Civst==3 -0.018*** -0.018*** -0.018*** -0.018***
age when finished education 0 0 0 0
(age when finished education) squared 0 0 0 0
occup8==2 0.001 0.002 0.002 0.001
occup8==3 0.007 0.007 0.007 0.007
occup8==4 0.009 0.009 0.009 0.009
occup8==5 0.003 0.003 0.003 0.004
occup8==6 -0.011 -0.011 -0.011 -0.011
occup8==7 0.002 0.002 0.002 0.002
occup8==8 0.019 0.019 0.018 0.019
PoliticsLR==2 0.011** 0.011** 0.011** 0.011**
PoliticsLR==3 0.010** 0.010** 0.010** 0.010**
PoliticsLR==4 -0.002 -0.002 -0.002 -0.002
RespCoop2==2 0.005 0.005 0.005 0.005
Population Density 0.003** 0.002 0.003 0.003*
Real GDP growth Rate 0.002 0.002 0.011** -0.001
Inflation Rate 0.005 0.005 0.008* 0.008
CPI -0.014*** -0.014*** -0.014*** -0.014***
GDP per capita 0 0.001 0.002** 0.001
Yearly employment growth 0 0.003 -0.002 0.002
GINI -0.002 -0.001 0.005* -0.002
Year=2002 -0.011 -0.004 0.015 -0.034**
Year=2004 -0.011 0.005 0.007 -0.032***
Austria 0.070*** 0.066*** 0.070*** 0.069***
Belgium -0.709* -0.302 -0.317 -0.461
Denmark 0.066*** 0.065*** 0.066*** 0.066***
Finland 0.071*** 0.067*** 0.069*** 0.069***
France 0.181** 0.126* 0.172** 0.168**
Germany 0.012 0.01 0.077*** 0.021
Greece 0.079*** 0.073*** 0.077*** 0.079***
Ireland 0.066*** 0.064*** 0.064*** 0.066***
Italy 0.091*** 0.080** 0.091*** 0.090***
Luxemburg 0.060*** 0.060***
Netherlands -0.968*** -0.942*** -0.961*** -0.965***
Portugal 0.071*** 0.068*** 0.070*** 0.071***
Spain 0.145*** 0.109** 0.135** 0.136***
Sweden 0.083*** 0.076*** 0.079*** 0.081***
Constant -4.699 -0.724 -9.499** -3.326
Observations 38910 38479 39292 38847
Pseudo-R2 0.118 0.121 0.051 0.052
Log-Likelihood -23313.9 -22987.6 -9374.37 -9261.28
Robust p values in brackets - * significant at 10%; ** significant at 5%; *** significant at 1%
View publication statsView publication stats