Embed Size (px)
Citation preview
o
SPRU Electronic Working Paper Series
Paper No. 118
Technology Spillovers from Foreign Direct Investment (FDI): an Exploration of the Active Role f MNC Subsidiaries in the Case of Argentina in the
1990s
Anabel Marin* and Martin Bell** (*SPRU and Universidad Nacional de General Sarmiento, **SPRU)
October 2004
The Freeman Centre, University of Sussex,
Falmer, Brighton BN1 9QE, UK Tel: +44 (0) 1273 877066
E-mail: [email protected] http://www.sussex.ac.uk/spru/
Technology spillovers from foreign direct investment (FDI): An
exploration of the active role of MNC subsidiaries in the case of
Argentina in the 1990s
Anabel Marin1 and Martin Bell2
October 2004
Abstract
The usual perspective on technology spillovers from FDI sees the MNC subsidiary as a passive actor. It presumes that the technological superiority that spreads from subsidiaries to other firms in the host economy is initially created outside it by MNC parent companies, and is delivered to subsidiaries via international technology transfer. The role of subsidiaries is little more than to act as a ‘leaky’ container lying between the technology transfer pipeline and the absorption of spillovers by domestic firms. This paper suggests a different model in which a substantial part of the potential for spillover is created within local subsidiaries as a result of their own knowledge-creating and accumulating activities in the host economy. We explore empirically the effects of these activities on technology spillovers from FDI using data for industrial firms in Argentina over the period 1992-1996. The analysis suggests that significant results can be obtained incorporating subsidiaries’ own technological activities as an explanatory variable of the spillover process.
Key words: FDI, technology spillovers, absorptive capabilities, multinational enterprises, subsidiaries’ technology behaviour
Acknowledgements. We are grateful for comments received from participants at the Summer DRUID Conference 2003, and the Workshop: Understanding FDI-Assisted Economic Development, TIK Centre, University of Oslo, Norway 22 – 25 May 2003. We also appreciate helpful comments from Valeria Arza. 1 Anabel Marin, SPRU – Science and Technology Policy Research, University of Sussex and Universidad Nacional de
General Sarmiento (UNGS), Campus Universitario, Los Polvorines, Pcia. De Buenos Aires, Argentina. Tel: +54 11 44697577 E-mail: [email protected]
2 Martin Bell, SPRU - Science and Technology Policy Research, Freeman Centre, University of Sussex. Brighton BN1
9QE. Tel: +44 (0) 1273 877066, +44 (0) 1273 686758, Fax: +44 (0) 1273 685865. E-mail: [email protected]
1
1-The Purpose of the Paper
Analyses of the technological spillover impact of FDI on host economies have typically assumed the
impact to be the outcome of two linked steps. The first involves multinational corporation (MNC)
parent-to-subsidiary international transfer of technology that is superior to the prevailing technology
in the host economy. The second involves the subsequent spread of this technology to domestic firms
– a technological spillover effect. The latter has been addressed in a growing number of spillover
studies in various host economies (Lipsey, 2004; Gorg and Strobl, 2001).
This paper suggests it is important to consider a different model of the process. In this alternative a
substantial part of the technological potential for spillover is generated within the local subsidiary by
its own knowledge-creating activities, rather than being delivered to it from the parent company. To
some degree, therefore, variability in the significance of spillovers would reflect heterogeneity in the
intensity of subsidiaries’ innovation and other knowledge-creating activities in the host economy.
Using data for industrial firms in Argentina over the period 1992-1996 we explore empirically the
possible significance of this alternative model.
The structure of the paper is as follows. Section 2 reviews previous approaches to the analysis of
FDI-related spillovers and elaborates on the alternative approach used in this paper. Section 3
describes the methods and data used in this study and the empirical results are presented in Section 4.
2. Alternative Perspectives on FDI-related Technology Spillovers in Host Economies 1
2.1 The centrally driven supply-side origins of spillovers
(a) The original ‘pipeline’ model
There is now a long history of empirical analysis of FDI-related technological spillovers, running
from the early work of Caves and Globerman in the 1970s to the rapidly growing number of such
studies in the last ten years – e.g. Aitken and Harrison (1999), Kokko (1994), Blomstrom and
Sjoholm (1999) , and Haskel et al. (2002). Since the work of Stephen Hymer in the 1960s (published
1976), a core element in the theoretical framework underlying this work has concerned MNC
possession and exploitation of technological assets – an ownership advantage seen as the main
reason for the MNC’s existence. A second, usually implicit, element is the assumption that the MNC
is a tightly integrated organisation, with the behaviour of subsidiaries closely shaped by central
strategies and decisions. The combination of centrally accumulated technological assets and tightly
1 A more extended discussion of these alternative perspectives on the FDI-related spillover process is provided in Bell
and Marin (2004)
2
integrated organisational behaviour sets the basis for the two-step ‘pipeline’ that delivers spillovers
of superior technology from MNC parents to domestic firms without any significantly active role on
the part of the local MNC subsidiaries.2 They are simply leaky containers at the end of the transfer
stage of the process.3
Empirical studies have not however indicated the widespread and significant spillover effects one
might expect on the basis of this model (Gorg and Greenaway 2004). Instead, much of the evidence
is contradictory (Lipsey, 2004; Gorg and Strobl, 2001). Early studies using industry level and cross-
sectional designs (e.g. Caves, 1974 or Globerman, 1979) found positive results but were unable to
identify the relevant causality.4 More recent studies have exclusively used firm level designs,
typically combined with panel data analysis. Although such studies have found evidence of
spillovers in some cases (e.g. Haskel et al., 2002; Keller and Yeaple, 2003), the generally positive
results in the earlier research have not been replicated in a wide range of countries.5
(b) Mediating variables: limited absorptive capability - a possible demand side constraint
Research attention has shifted to explore whether the limited capabilities of locally owned firms act
as a constraint on their ability to absorb the potentially available spillovers from MNCs – a suggested
constraint on the demand side of the spillover process. There are, however, two problems with this
approach. First, it does not question the centrally-driven supply side model. It merely bolts on the
end a postulated demand-side explanation for the inconclusive and negative results from the simpler
‘pipeline’ models. Second, the evidence from these approaches is still mixed. For instance, Kokko
(1994) in the case of Mexico, and Konings (2001) for Poland and Bulgaria have found such
2 Such spillovers are usually seen as productivity gains for domestic firms arising in two ways. First, the knowledge
initially transferred from the parent diffuses from the subsidiary via various channels and is captured as an externality by domestic firms. Second, the subsidiary’s superior performance brings greater competitive pressure to bear on domestic firms, which are induced to respond by generating their own technological change. These, however, are very different mechanisms. The first is about non-market mediated knowledge diffusion from MNE subsidiaries. The second is about domestic firms incurring the costs of generating knowledge by their own efforts or by acquiring it through market channels that have nothing to do with the FDI presence. To some unknown extent, therefore, the second type of productivity gain constitutes a ‘pseudo’ spillover.
3 This perspective has been summarised recently by two of the most prolific contributors to the empirical analysis of FDI-related spillovers.
“It is well known that multinational corporations … produce … most of the world’s advanced technology. When a MNC sets up a foreign affiliate, the affiliate receives some amount of the proprietary technology that constitutes the parent’s firm-specific advantage …. . This leads to a geographical diffusion of technology, but not necessarily to any formal transfer of technology beyond the boundaries of the MNC. … However, MNC technology may still leak to the surrounding economy through external effects or spillovers that raise the level of human capital in the host country and increase productivity in local firms.” (Blomstrom and Kokko, 2003, p. 3)
4 This is because positive results from this type of research design may result from MNCs locating in what are already relatively high-productivity sectors in the host economy (Aitken and Harrison, 1999).
5 E.g. In Sweden (Braconier et al., 2001) or the USA (Chung, 2001), as well as in transition or industrialising economies such as Morocco (Haddad and Harrison, 1993), the Czech Republic (Djankov and Hoekman, 2000), Venezuela (Aitken
3
‘demand-side’ effects to be significant. But other studies have not found the same results: for
example Haskel et al. (2002), Damijan et al. (2003), Patibandla and Sanyal (2005), and Sjoholm
(1999).6
(c) Mediating variables: industry differences and corporate strategy - supply side constraints
Looking at the other side of the process several recent studies have questioned the assumed
homogeneity of MNC behaviour that has underpinned most empirical analyses to date. In particular,
two kinds of MNC diversity have been seen as possibly influencing, often in combination, the types
of technology that MNCs transfer to subsidiaries, and hence the scale and significance of the
knowledge resources in subsidiaries that may subsequently leak to domestic firms.
The first is diversity in the characteristics of the industries in which MNCs operate. ‘Advanced’
industries such as electronics, are thought to possess greater potential than more ‘traditional’
industries for generating spillovers because they use more recent vintages of technology, employ
greater numbers of skilled workers and undertake more R&D. Also, within a particular type of
industry, the intensity of the value-adding activities might provide, it is argued, differing
opportunities for technology spillovers (Narula and Dunning, 2000). The structure of world markets
in particular industries may also be a source of variability in the content of technology transferred
through FDI, and hence in the potential for subsequent spillovers. For example, Dunning and
Cantwell (1986) have argued that if a global industry is concentrated amongst only a few MNCs,
there will be lower incentives to decentralise more knowledge-intensive activities, and therefore the
potential for spillovers will be more limited.
The second type of heterogeneity is about differences in the centrally driven strategies of MNCs.
Wang and Blomstrom (1992), for instance, developed a model in which international technology
transfer emerges from parent company decisions in the light of expected strategic interaction
between their foreign subsidiaries and the technological characteristics of host country firms: the
higher the host country firms’ investment in learning, the more advanced the technology transferred
in order to ensure profitability in the face of more technologically capable competition.7 Reflecting a
more recent direction of work on MNC strategies, Chung (2001) introduced a distinction between
and Harrison, 1999) or Poland, Bulgaria and Romania (Konings, 2001).
6 Particularly interesting among these are studies (e.g. Haskel et al., 2002) finding inverse relationships between spill-overs and domestic firms’ capabilities. This returns to Findlay’s earlier (1978) proposition: the wider the technological disparity between foreign and domestic firms the greater the opportunities for domestic firms to improve efficiency.
7 Thus, as with the absorptive capability model, the technological abilities of local firms are seen as an important influence on spillovers – but in this case via their effect on the international transfer step.
4
capability-exploiting and augmenting strategies as possible influences on technological spillovers in
the USA.
These views about heterogeneity on the supply side have not, for the most part, been empirically
evaluated.8 In addition, they leave intact the centrally driven model of spillover generation via the
technology transfer process: variability is seen as arising from MNC decisions about the international
transfer step in the process. Subsidiaries continue to be seen as playing a passive role and, if they
occur at all, their R&D and other knowledge-creating activities are assumed to be merely reflections
of parent company decisions. As emphasised by Frost (2001), we still have a very limited
understanding of the processes of technological change in foreign subsidiaries, and consequently
even less about whether and how those may contribute to the spillover effects of FDI.
2.2 Subsidiaries’ technological activities: Locally Driven Sources of Spillovers?
A body of recent research has addressed issues about FDI from the ‘bottom-up’ – focusing primarily
on the development of subsidiaries as unique and differentiated organisational entities. This research
has shown that variation in innovative capabilities across subsidiaries, and over time, depends on
much more than the centralised decisions of the parent company – including (a) the decisions and
strategies of subsidiaries themselves and (b) aspects of the local environment that create constraints
and opportunities for subsidiaries. As emphasised by Birkinshaw and Hood (1998):
“… the subsidiary’s capabilities are, to some extent, distinct from the capabilities of
headquarters operation and its sister subsidiaries. … the particular geographical setting
and history of the subsidiary are responsible for defining a development path that is
absolutely unique to that subsidiary, which, in turn, results in a profile of capabilities that
is unique.” (p. 781)
One implication is that subsidiaries may themselves affect the potential for generating spillovers into
the domestic economy. We are aware of only two studies that have begun to explore this possibility.
Braconier et al. (2001) used MNC subsidiaries’ R&D expenditure as a better measure of FDI
activities in Sweden than the more commonly used measures of total FDI financial flows, though
they found no evidence of spillovers using that indicator. Todo and Miyamoto (2002) used two
indicators of technological activities in MNC subsidiaries to estimate spillovers in Indonesia: the
commonly used R&D-based indicator (R&D expenditures) and what they called a human resources
development indicator (measured by the subsidiaries’ expenditures on training). They found that
8 Chung (2001) is an exception.
5
only subsidiaries engaged in R&D and training had a positive impact on the productivity of domestic
firms.
In the rest of this paper we move further in this direction. We derive a number of indicators with
which to characterise the knowledge-creating and accumulating activities of MNC subsidiaries in
Argentina, and we examine empirically the importance of heterogeneity in those activities as a
source of differences in technology spillovers. In particular we test the following three hypotheses:
(1) The ‘Pipeline’ model: spillover effects arise from FDI independently of both the absorptive
capabilities of domestic firms and the knowledge-creating and accumulating activities of
subsidiaries in the host country.
(2) The ‘Absorptive Capability’ model: potential spillover effects arise from FDI, but are
captured only by domestic firms with high absorptive capabilities.
(3) The ‘Active Subsidiary’ model: spillover effects arise from FDI only when foreign affiliates
are technologically active in the host country.
3. Data and Methods
3.1 The Data Source: The Argentine Innovation Survey - 1992-1996
The empirical analysis reported here uses information provided by the Innovation Survey in
Argentina, 1992-1996. The sample used in the survey (1533 firms, 283 of which are MNC
subsidiaries)9 is representative of the total population of industrial firms in the country: it includes 50
per cent of all industrial firms, and these account for 53 per cent of total sales, 50 per cent of total
employment, and 61 per cent of total exports. The survey provides basic economic information at the
firm level for 1992 and 1996 (size, age, added value, exports, imports, sales, employment, etc), and
these permit the computation of various performance indicators (e.g. productivity levels and growth
rates). In addition, following the broad framework of the Oslo Manual it provides information about
a wide range of technological activities at the firm level and this allows the computation of several
measures of technological behaviour on the part of both MNC subsidiaries and domestic firms, as
explained in Section 3.2.
9 A company is defined in this study as a subsidiary in which the proportion of foreign ownership is higher than 10%.
6
Given macroeconomic changes10 in the 1990s and a financial crisis that began in 2000, Argentina
might seem an idiosyncratic case study. We note however that an important number of
industrialising countries introduced similar macroeconomic changes during the 1990s, following the
Washington Consensus, and consequently the Argentinean case is more the rule than the exception.11
Furthermore, the Argentinean financial crisis only started significantly to affect internal economic
activity from 2000. The period we analyse (1990-1996) was characterised by sustained growth: on
average 6% per annum. Argentina also provides a particularly appropriate and demanding context for
examining the possible merits of spillover models for at least two reasons. First, it has a relatively
FDI-intensive industrial economy, reflected for example in the fact that FDI via wholly owned MNC
subsidiaries accounted for 50% of the largest industrial firms in 2002 (Kulfas et al., 2002). Second, it
is a mature industrialising economy with substantial human resources and prior industrial experience,
constituting a substantial base of absorptive capacity to ‘capture’ potentially available spillovers.
3.2 Measuring the Innovation Activity of MNC subsidiaries and the Absorptive Capacities of
domestic firms
The Innovation Survey data was used to compute a number of different indicators of the
technological activities of MNC subsidiaries and domestic firms.12 Ten such indicators are used in
this analysis, grouped below in three broad categories.13
(a) Investment in disembodied knowledge and skills
In principle, investment in disembodied knowledge and skills is potentially the most important
source of locally-driven knowledge spillovers from subsidiaries to domestic firms since it covers the
kinds of knowledge that are potentially most mobile and most likely to ‘leak’ from subsidiaries. Four
indicators are used:
• R&D intensity:
- reported expenditure on R&D*
• Skill training intensity:
10 These changes include: trade liberalisation (e.g. all capital goods’ tariffs were reduced to zero during 1995-96), capital
liberalisation (e.g. no capital controls, no minimum terms, no sectoral restrictions to FDI, no requirements for FDI), privatisation (large role played by MNC), country risk reduction due to debt renegotiation (Brady Plan, finished in 1992)
11 In addition, as we will see later, we have introduced several measures to control for changes in the levels of competition across industries, and the use of industry dummies should control for the possibility that macroeconomic changes have affected different industries dissimilarly.
12 Annex 1 describes the dataset and provides further information about the derivation of these indicators, together with descriptive statistics.
7
- reported expenditure on training*
• Skill intensity of employment:
- the number of engineers, other professionals and technicians employed in production (not in
management) as a proportion of total employment
• Investment in licensed technology: 14
- reported payments for licensed designs, know-how, etc.*
(b) Investment in capital-embodied technology
Investment in capital-embodied technology is likely to be a very important source of productivity
growth in the investing firms but it appears less likely to be a significant driver of ‘genuine’
spillovers to other firms. Although information about the introduction of capital embodied assets in
one firm may leak to another, the knowledge actually embodied in those assets is probably much
more ‘sticky’. Three indicators are used:
• Investment in information technologies:
- reported expenditure specifically on IT facilities and systems*
• Investment in equipment for innovation:
- reported expenditure on equipment required to introduce new products and processes*
• Investment in imported capital goods:
- reported expenditure on imports of capital goods.*
(c) The innovation strategy of the enterprise
The Innovation Survey asked firms about the importance they attached to broad aspects of their
innovative activity. Responses to these questions were used to compute three indicators as follows.
• The importance of ‘significant’ product innovation:
- Firms were classified into two groups: those attaching ‘Hi’ and ‘Lo’ importance to significant
product innovation, valued 1 and 0 respectively.
• The importance of ‘significant’ process innovation:
- Firms were classified into two groups: those attaching ‘Hi’ and ‘Lo’ importance to significant
process innovation, valued 1 and 0 respectively.
• The importance of innovation in firm strategy:
13 When used as firm-level indicators, all the measures identified with an asterisk are normalised by the firm’s total sales. 14 Only a small number of firms reported any licensing payments. This measure is therefore excluded from the estimates
for the individual variables, but is included in the factor analysis to compute a composite index of technological activity.
8
- Firms were classified into two groups (‘Hi’ and ‘Lo’), distinguishing between those that
considered selected innovative activities had been (a) “decisive” or only (b) “significant” or
“non-significant” for their business strategy.
In the analysis, the above ten indicators are employed in two ways. First, they are combined in a
composite index of absorptive capability and technological behaviour. The index was calculated
using factor analysis, and the weights of the different variables are therefore endogenously
determined rather than imposed exogenously by ourselves.15 However, the joint variation of these
indicators is limited.16 Consequently, in a second approach we use the ten indicators separately,
reflecting particular kinds of innovative activity undertaken by the firms.
Both the composite and the separate indicators are first computed for domestic firms and used as
indicators of their absorptive capabilities when we assess the significance of this factor in explaining
spillover effects (see Section 4.1.2). Second, they are computed for local subsidiaries and used to
indicate the heterogeneity of their technological behaviour, and also to assess whether that
heterogeneity is simply a matter of inter-industry differences or something more specific to
individual firms (see Section 4.2).17
3.3 Estimating the spillover effects of subsidiaries’ technological activities
Two steps are taken.
First, we characterise each of the 157 five-digit industries in the data set according to the
technological behaviour of MNC subsidiaries in that industry. 18 We then distinguish between two
types of industry: (a) industries characterised by a relatively high intensity of technological activities
on the part of subsidiaries and, (b) industries characterised by a relatively low intensity. The
distinction is made first using the composite index of technological behaviour and second using each
individual indicator separately. Median values of the index and of each indicator are used to
15 See Annex II for an explanation of the methodology and the values of the composite indices. 16 Using only one factor, for instance, the total variance explained for this factor is 26% and 24% respectively for
absorptive capabilities and technology behaviour of subsidiaries - see Annex II. 17 In both these applications, all the measures are computed in ‘levels’ – either as an average across the four-year period,
or by a measure at the end of the period in 1996. The measures are computed as firm-specific indicators and normalised where appropriate.
18 Industries at the five-digit level are taken as the sphere of knowledge-centred interaction between subsidiaries and domestic firms, and hence as the economic ‘spaces’ within which spillovers might arise. We therefore estimate only intra-industry spillovers recognising that this will only partially capture ‘vertical spillovers, so probably under-estimating positive spillover effects.
9
distinguish between ‘high’ and ‘low’ intensity of technological activity.
Second, spillovers from FDI to domestic firms are then estimated for two different groups of
domestic firms: (a) those located in five-digit industries characterised by a relatively high intensity
of technological activity on the part of subsidiaries, and (b) those located in five-digit industries
characterised by a relatively low intensity.19
When spillovers are significant for a particular group of domestic firms, we claim that the particular
subsidiaries’ technological behaviour (used to distinguish industries and firms) is the supply-side
source of this effect.
We model FDI spillovers within the familiar production function framework. Change in FDI
participation in industries is treated as an additional ‘input’ explaining the productivity growth of
domestic firms, and its coefficient is taken as evidence of spillover effects from FDI.20 Variations of
the following basic equation21 were used to investigate spillover effects:
jijjid
ijd
jjid
ijd IGZFDIpartInputY εηδλ ++++∆+∆=∆ lnln (1)
In (1), d denotes domestic firms, subscripts i and j denote plant and industry, ∆ represents changes in
the variables between 1992 and 1996 (t-4), and λ, δ, and η are parameters to be estimated. Yd denotes
added value of domestic plants, Input, their use of normal inputs, FDIpart is a measure of the scale
of the FDI presence in each industry. Z is a set of plant and industry level control variables. G and I
are dummies for corporate groups and industries respectively.
For Input, we use total employment (L) and the ratio of investment to added value (I/Y).
19 Annex III shows the distribution of domestic firms relative to the various indicators of subsidiaries’ technological
behaviour. 20 We are aware that the use of production functions and the available techniques to estimate spillovers involves a
number of well-known problems. We nevertheless use this method for two reasons. First, because we want to be able to compare our results with the bulk of previous work in this area, especially with respect to the estimation of spillovers in industrialising countries for which patent analysis is not relevant. Second, despite all the problems of production function analysis, we concur with the view of Griliches and Mairesse (1998) that “it is hard even to pose the question without embedding it in such a framework”.
21 The derivation of this equation is provided in Annex IV.
10
FDIpart is the share of total employment in the 5-digit industry j that is accounted for by all
employment in foreign owned firms in the industry.22 We use an indicator based on employment
rather than capital because labour turnover is likely to be a particularly important channel for
spillover effects.
G is a categorical dummy variable that distinguishes independent domestic firms from those that
are part of a domestic conglomerate.
I is a dummy variable distinguishing the 22 two-digit industries.
Z includes a set of additional variables that may affect TFP growth in domestic firms:
(a) ∆ KCd = change in knowledge capital, as reflected in R&D expenditures plus changes
in the expenditure on new equipment specifically concerned with product or
process innovation23
(b) ∆ Skillsd = change in the professional/non professional ratio (professionals include
engineers and other professionals in production, administration and R&D)
(c) ∆ Compd = change in competition.
We expect that the increases in KC and Skills will positively affect changes in total factor
productivity of domestic firms through their effects on their knowledge capital (Griliches, 1992).
Their inclusion therefore reduces the possibility of bias due to non-included variables that change
across domestic firms and over time.
Variables reflecting changes in competition are also introduced: changes in industry concentration
and in import penetration. These are intended to account for what we described earlier (endnote 2) as
‘pseudo’ spillovers – technological changes generated by domestic firms in response to increased
competition from FDI. In addition, these variables should also capture changes in other unobservable
variables that affect competition and that might have disciplined the domestic industry to become
22 This indicator was constructed on the basis of the information provided by the 50% sample survey because data about
FDI penetration at the 5-digit level for the whole economy do not exist. However, the Survey sample included all of the 500 largest industrial firms in Argentina. Since MNC subsidiaries in manufacturing industries in Argentina are typically large, almost all of them are probably included in the sample of 283 subsidiaries.
23 R&D expenditure is not a good indicator of the technological efforts of firms in developing countries in augmenting their knowledge capital, since such efforts are generally not formalised as explicit R&D activities. We therefore include expenditures on equipment for product or process innovation as an additional indicator of these efforts.
11
more efficient.24
The expanded equation is as follows:
ijd
ij
jiiji
ii
di
d
IGpen
ConcenKCSkillsFDIpartYILY
εα
αααααα
+++∆+
∆+∆+∆+∆++∆=∆
Im
lnln
7
654321 (1’)
Where:
∆ ln Y i = The log change in value added
∆ ln Li = The log change in total employment
I/Li = The ratio of total investment to total output 1992
∆FDIpartj = The change in FDI participation by industry
∆Skillsi = The change in the ratio professional/non-professional workers
∆KCi = The log change in R&D expenditures plus the log change in the expenditures in
new equipment for product and process innovation
∆Concenj = The change in Herfindahl index (industry level)
∆Impenj = The change in import penetration (industry level)
εi = ∆ui.
Several aspects of the estimation methods merit brief further comment.
First, by using a plant level specification and modelling in first differences - with a time period of 4
years - we control for fixed differences in productivity levels across firms and industries, which
might affect the level of foreign investment. In this way, we address the identification problem
highlighted by Aitken and Harrison (1999), as noted earlier.25
Second, this specification and the inclusion of group and industry dummies (G and I) also corrects
for the omission of other unobservable variables that might undermine the relationship between FDI
and productivity growth of domestic firms. In particular:
• by observing changes over time, we remove plant-specific, industry and regional fixed effects
such as heterogeneous long-term strategies of the firms, and differences in the regional
infrastructure and/or technological opportunity of the industries26
24 As noted earlier, this is important in Argentina between 1992 and 1996, because important pro-market reforms were
introduced and intensified during those years. 25 Nevertheless we cannot completely rule out the possibility of spurious correlation if there are industry characteristics
that change over time and affect the pattern of FDI. 26 This also removes other factors that even when they are not fixed over time might be roughly constant over a 4-year
period, such as the level of education, or regional policies.
12
• the use of dummy variables removes fixed characteristics of domestic firms that belong to an
economic group or that operate within particular sectors.
These controls are important in this analysis because, as discussed earlier, industry effects are often
considered likely to affect spillovers from FDI.
Third, there could still be a bias in the estimators if there are important unobserved variables
excluded from the model that change across firms and over time (such as the managerial abilities of
domestic firms). By introducing the control variables under Z - that change across firms and over
time - and by modelling in first differences we expect to minimise this possibility.27
Fourth, it has been suggested also that, to estimate the coefficients in a production function, capital
and labour inputs should be treated as endogenous (Griliches and Mairesse, 1998). Here the focus,
nevertheless, is not on estimating the coefficients on capital and labour, but on estimating δ (the
coefficient for FDI). Endogeneity of capital and labour therefore is an issue only if it results in biased
estimates of δ. Also, a plant-level specification in a first differences model should correct for this
possible bias if the endogeneity is caused by an omitted variable and the variable does not change
over time (Griliches and Mairesse, 1998).
Fifth, in principle there might be a problem about representativeness since FDIpart is calculated
from the sample data. In practice, however, because it is very likely that all MNC subsidiaries are
included in our survey (see note 22), it is also very likely that the distribution of foreign affiliates
across industries for the sample and the population are very similar.28
Finally, a need for caution arises from an element of selection bias because our data do not represent
the full population of plants, only the surviving plants present in both 1992 and 1996. Our estimators
of the impact of FDI should therefore be interpreted only with respect to surviving firms.29
27 We will not, therefore, introduce other methods to address this issue (such as those proposed by Olley and Pakes,
1996) because they usually require very restrictive assumptions about, for instance, markets and, therefore, as pointed by Griliches and Mairesse (1998), they may introduce additional bias in the estimations.
28 We may still be overestimating FDIpart because all MNC subsidiaries are probably included in the sample but not all domestic firms. However this is likely to be of limited importance because we are interested in the changes rather than the levels of FDI participation (our estimations are in first differences).
29 In principle, a correction should be introduced using information about the domestic firms that exited the industry. However, we do not have information about these firms. Also, because of unpredictable competition effects, it is difficult to anticipate the direction of the possible bias arising from the absence of data about these non-surviving firms.
13
4. Empirical Results: The Magnitude and Determinants of FDI-related Spillovers:
This section estimates the spillover effects in manufacturing in Argentina using a number of different
specifications. It is divided into two parts. In the first (Section 4.1), we follow the historical sequence
of methodological approaches used in previous research, testing the first two hypotheses indicated
earlier. In Section 4.2 we test the third hypothesis, using a range of estimations incorporating
variables reflecting different aspects of locally driven knowledge-creation and accumulation in MNC
subsidiaries. We demonstrate the heterogeneity of that technological behaviour in Section 4.2.1, and
estimate its significance in generating spillover effects in Section 4.2.2.
4.1 Results with Previous Methodological Approaches
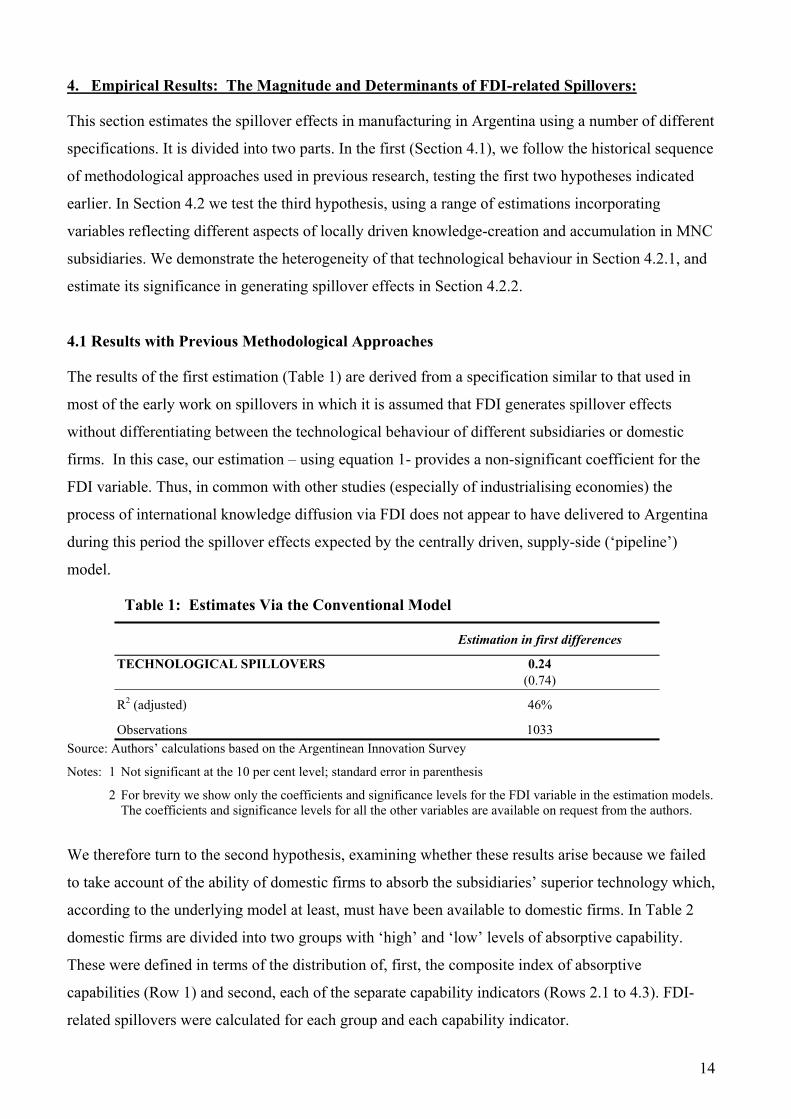
The results of the first estimation (Table 1) are derived from a specification similar to that used in
most of the early work on spillovers in which it is assumed that FDI generates spillover effects
without differentiating between the technological behaviour of different subsidiaries or domestic
firms. In this case, our estimation – using equation 1- provides a non-significant coefficient for the
FDI variable. Thus, in common with other studies (especially of industrialising economies) the
process of international knowledge diffusion via FDI does not appear to have delivered to Argentina
during this period the spillover effects expected by the centrally driven, supply-side (‘pipeline’)
model.
Table 1: Estimates Via the Conventional Model Estimation in first differences
TECHNOLOGICAL SPILLOVERS 0.24 (0.74)
R2 (adjusted) 46%
Observations 1033 Source: Authors’ calculations based on the Argentinean Innovation Survey
Notes: 1 Not significant at the 10 per cent level; standard error in parenthesis
2 For brevity we show only the coefficients and significance levels for the FDI variable in the estimation models. The coefficients and significance levels for all the other variables are available on request from the authors.
We therefore turn to the second hypothesis, examining whether these results arise because we failed
to take account of the ability of domestic firms to absorb the subsidiaries’ superior technology which,
according to the underlying model at least, must have been available to domestic firms. In Table 2
domestic firms are divided into two groups with ‘high’ and ‘low’ levels of absorptive capability.
These were defined in terms of the distribution of, first, the composite index of absorptive
capabilities (Row 1) and second, each of the separate capability indicators (Rows 2.1 to 4.3). FDI-
related spillovers were calculated for each group and each capability indicator.
14
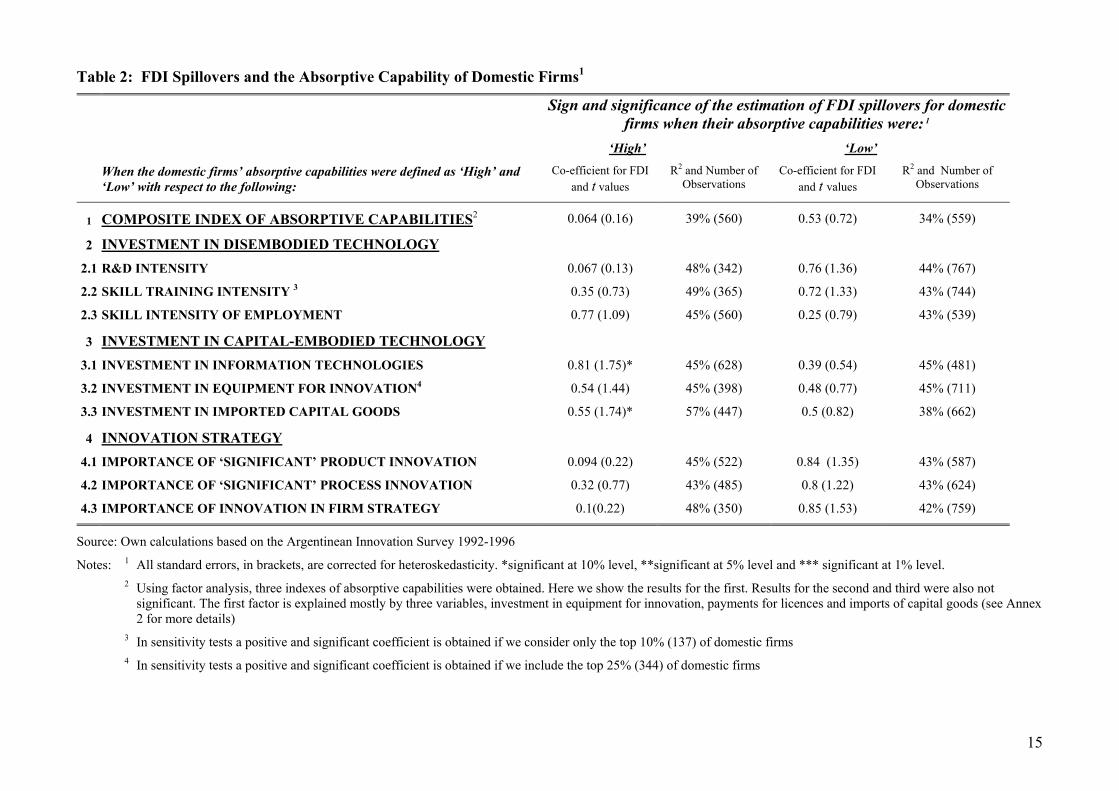
Table 2: FDI Spillovers and the Absorptive Capability of Domestic Firms1
Sign and significance of the estimation of FDI spillovers for domestic firms when their absorptive capabilities were: 1
‘High’ ‘Low’
When the domestic firms’ absorptive capabilities were defined as ‘High’ and ‘Low’ with respect to the following:
Co-efficient for FDI and t values
R2 and Number of Observations
Co-efficient for FDI and t values
R2 and Number of Observations
1 COMPOSITE INDEX OF ABSORPTIVE CAPABILITIES2 0.064 (0.16) 39% (560) 0.53 (0.72) 34% (559)
2 INVESTMENT IN DISEMBODIED TECHNOLOGY
2.1 R&D INTENSITY 0.067 (0.13) 48% (342) 0.76 (1.36) 44% (767)
2.2 SKILL TRAINING INTENSITY 3 0.35 (0.73) 49% (365) 0.72 (1.33) 43% (744)
2.3 SKILL INTENSITY OF EMPLOYMENT 0.77 (1.09) 45% (560) 0.25 (0.79) 43% (539)
3 INVESTMENT IN CAPITAL-EMBODIED TECHNOLOGY
3.1 INVESTMENT IN INFORMATION TECHNOLOGIES 0.81 (1.75)* 45% (628) 0.39 (0.54) 45% (481)
3.2 INVESTMENT IN EQUIPMENT FOR INNOVATION4 0.54 (1.44) 45% (398) 0.48 (0.77) 45% (711)
3.3 INVESTMENT IN IMPORTED CAPITAL GOODS 0.55 (1.74)* 57% (447) 0.5 (0.82) 38% (662)
4 INNOVATION STRATEGY
4.1 IMPORTANCE OF ‘SIGNIFICANT’ PRODUCT INNOVATION 0.094 (0.22) 45% (522) 0.84 (1.35) 43% (587)
4.2 IMPORTANCE OF ‘SIGNIFICANT’ PROCESS INNOVATION 0.32 (0.77) 43% (485) 0.8 (1.22) 43% (624)
4.3 IMPORTANCE OF INNOVATION IN FIRM STRATEGY 0.1(0.22) 48% (350) 0.85 (1.53) 42% (759)
Source: Own calculations based on the Argentinean Innovation Survey 1992-1996
Notes: 1 All standard errors, in brackets, are corrected for heteroskedasticity. *significant at 10% level, **significant at 5% level and *** significant at 1% level. 2 Using factor analysis, three indexes of absorptive capabilities were obtained. Here we show the results for the first. Results for the second and third were also not
significant. The first factor is explained mostly by three variables, investment in equipment for innovation, payments for licences and imports of capital goods (see Annex 2 for more details)
3 In sensitivity tests a positive and significant coefficient is obtained if we consider only the top 10% (137) of domestic firms
4 In sensitivity tests a positive and significant coefficient is obtained if we include the top 25% (344) of domestic firms
15
In this way, the only significant associations between the productivity growth of domestic firms and
the growth of FDI arise when domestic firms invest relatively heavily in capital-embodied
technology. It is difficult therefore to glean from these results a picture that the diffusion of superior
knowledge from MNC subsidiaries in Argentina made a significant contribution to productivity
growth in domestic firms when the latter had absorptive capabilities to capture potentially available
spillovers. Consequently we now abandon the core assumptions of the centrally driven supply-side
model. We will no longer presume that MNC subsidiaries are homogeneous in offering to domestic
firms in host economies flows of potentially absorbable, superior technology originally transferred
from their parent companies. Instead, we turn to the third hypothesis, examining whether
subsidiaries’ own knowledge-creating and knowledge-accumulating activities played any role in
generating spillover effects.
4.2 A Locally Driven Supply-Side Model
We first examine (Section 4.2.1) subsidiaries’ technological activities on their own, demonstrating
that they vary significantly between subsidiaries. We also show that this variation is not merely an
issue of inter-industry differences. We then estimate the significance of this heterogeneity in
explaining spillovers (Section 4.2.2).
4.2.1 The Technological Activities of MNC Subsidiaries
Table 3 shows how subsidiaries behaved with respect to investment in disembodied and capital-
embodied technologies. The wide heterogeneity of behaviour is striking. With respect to R&D
expenditure, for instance, one quartile of the subsidiaries spent the equivalent of 13.5 per cent of
their total sales on R&D but, at the other extreme, the first quartile did not invest anything at all in
R&D. Similarly, the top quartile increased their R&D expenditure by 0.55 per unit increase in total
sales, but the bottom quartile decreased their investment by a larger amount with similar growth in
sales. The same heterogeneity can also be observed with respect to the other investments in
disembodied technologies and the subsidiaries’ investment in different categories of capital
embodied technology.30
The wide diversity in subsidiaries’ technological behaviour suggests there is at least an issue here to
examine. It seems highly unlikely that the potential for generating spillover effects is similar across
all these different types of behaviour.
16
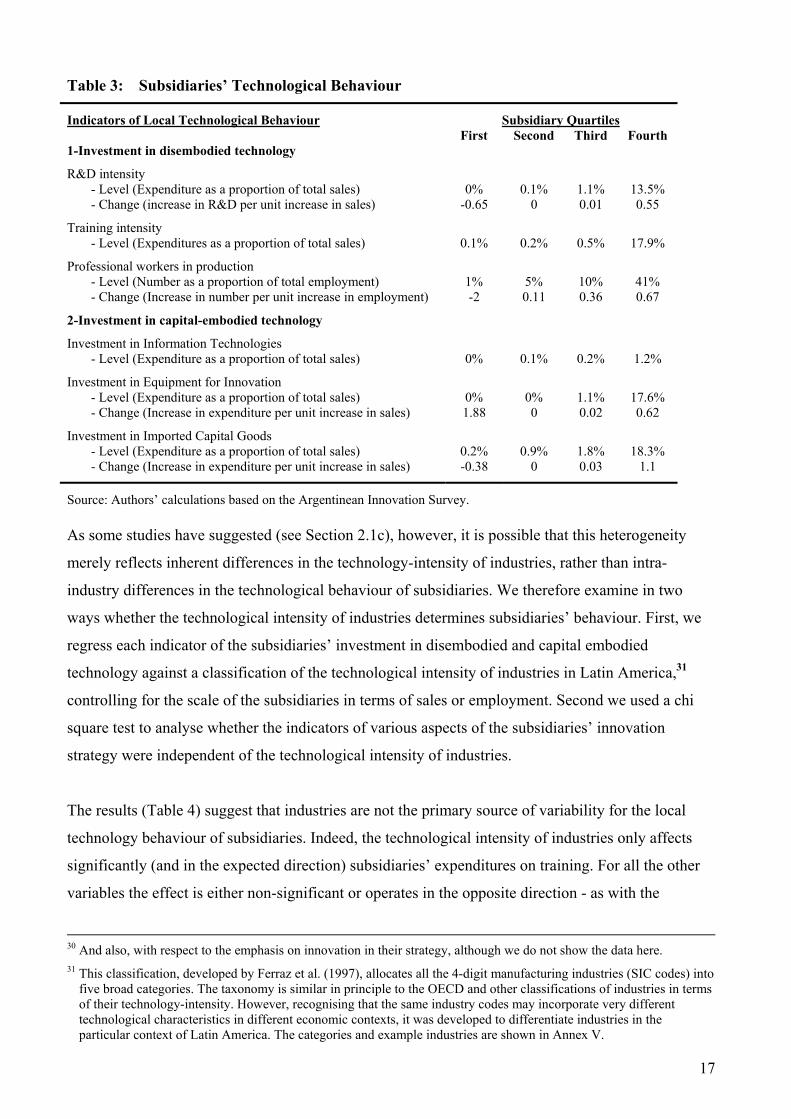
Table 3: Subsidiaries’ Technological Behaviour
Indicators of Local Technological Behaviour Subsidiary Quartiles First Second Third Fourth 1-Investment in disembodied technology
R&D intensity - Level (Expenditure as a proportion of total sales) 0% 0.1% 1.1% 13.5% - Change (increase in R&D per unit increase in sales) -0.65 0 0.01 0.55
Training intensity - Level (Expenditures as a proportion of total sales) 0.1% 0.2% 0.5% 17.9%
Professional workers in production - Level (Number as a proportion of total employment) 1% 5% 10% 41% - Change (Increase in number per unit increase in employment) -2 0.11 0.36 0.67
2-Investment in capital-embodied technology
Investment in Information Technologies - Level (Expenditure as a proportion of total sales) 0% 0.1% 0.2% 1.2%
Investment in Equipment for Innovation - Level (Expenditure as a proportion of total sales) 0% 0% 1.1% 17.6% - Change (Increase in expenditure per unit increase in sales) 1.88 0 0.02 0.62
Investment in Imported Capital Goods - Level (Expenditure as a proportion of total sales) 0.2% 0.9% 1.8% 18.3% - Change (Increase in expenditure per unit increase in sales) -0.38 0 0.03 1.1
Source: Authors’ calculations based on the Argentinean Innovation Survey. As some studies have suggested (see Section 2.1c), however, it is possible that this heterogeneity
merely reflects inherent differences in the technology-intensity of industries, rather than intra-
industry differences in the technological behaviour of subsidiaries. We therefore examine in two
ways whether the technological intensity of industries determines subsidiaries’ behaviour. First, we
regress each indicator of the subsidiaries’ investment in disembodied and capital embodied
technology against a classification of the technological intensity of industries in Latin America,31
controlling for the scale of the subsidiaries in terms of sales or employment. Second we used a chi
square test to analyse whether the indicators of various aspects of the subsidiaries’ innovation
strategy were independent of the technological intensity of industries.
The results (Table 4) suggest that industries are not the primary source of variability for the local
technology behaviour of subsidiaries. Indeed, the technological intensity of industries only affects
significantly (and in the expected direction) subsidiaries’ expenditures on training. For all the other
variables the effect is either non-significant or operates in the opposite direction - as with the
30 And also, with respect to the emphasis on innovation in their strategy, although we do not show the data here. 31 This classification, developed by Ferraz et al. (1997), allocates all the 4-digit manufacturing industries (SIC codes) into
five broad categories. The taxonomy is similar in principle to the OECD and other classifications of industries in terms of their technology-intensity. However, recognising that the same industry codes may incorporate very different technological characteristics in different economic contexts, it was developed to differentiate industries in the particular context of Latin America. The categories and example industries are shown in Annex V.
17
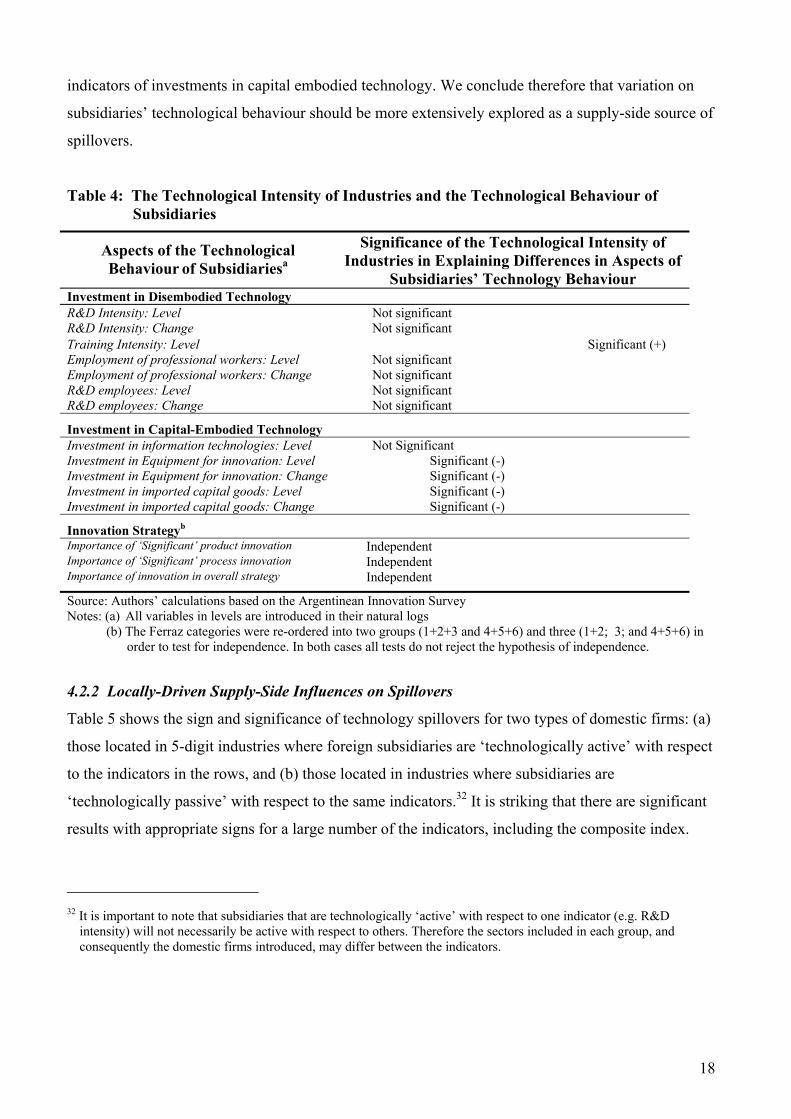
indicators of investments in capital embodied technology. We conclude therefore that variation on
subsidiaries’ technological behaviour should be more extensively explored as a supply-side source of
spillovers.
Table 4: The Technological Intensity of Industries and the Technological Behaviour of Subsidiaries
Aspects of the Technological Behaviour of Subsidiariesa
Significance of the Technological Intensity of Industries in Explaining Differences in Aspects of
Subsidiaries’ Technology Behaviour Investment in Disembodied Technology R&D Intensity: Level Not significant R&D Intensity: Change Not significant Training Intensity: Level Significant (+) Employment of professional workers: Level Not significant Employment of professional workers: Change Not significant R&D employees: Level Not significant R&D employees: Change Not significant
Investment in Capital-Embodied Technology Investment in information technologies: Level Not Significant Investment in Equipment for innovation: Level Significant (-) Investment in Equipment for innovation: Change Significant (-) Investment in imported capital goods: Level Significant (-) Investment in imported capital goods: Change Significant (-)
Innovation Strategyb
Importance of ‘Significant’ product innovation Independent Importance of ‘Significant’ process innovation Independent Importance of innovation in overall strategy Independent
Source: Authors’ calculations based on the Argentinean Innovation Survey Notes: (a) All variables in levels are introduced in their natural logs
(b) The Ferraz categories were re-ordered into two groups (1+2+3 and 4+5+6) and three (1+2; 3; and 4+5+6) in order to test for independence. In both cases all tests do not reject the hypothesis of independence.
4.2.2 Locally-Driven Supply-Side Influences on Spillovers
Table 5 shows the sign and significance of technology spillovers for two types of domestic firms: (a)
those located in 5-digit industries where foreign subsidiaries are ‘technologically active’ with respect
to the indicators in the rows, and (b) those located in industries where subsidiaries are
‘technologically passive’ with respect to the same indicators.32 It is striking that there are significant
results with appropriate signs for a large number of the indicators, including the composite index.
32 It is important to note that subsidiaries that are technologically ‘active’ with respect to one indicator (e.g. R&D
intensity) will not necessarily be active with respect to others. Therefore the sectors included in each group, and consequently the domestic firms introduced, may differ between the indicators.
18
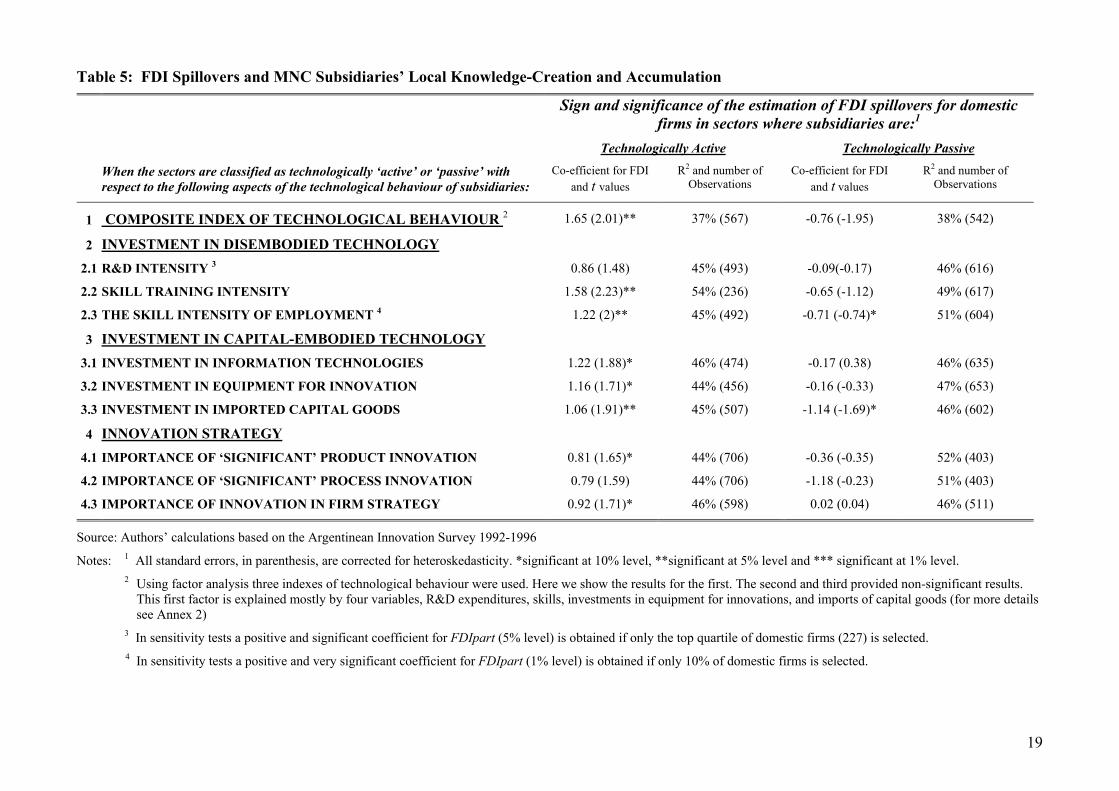
Table 5: FDI Spillovers and MNC Subsidiaries’ Local Knowledge-Creation and Accumulation
Sign and significance of the estimation of FDI spillovers for domestic firms in sectors where subsidiaries are:1
Technologically Active Technologically Passive
When the sectors are classified as technologically ‘active’ or ‘passive’ with respect to the following aspects of the technological behaviour of subsidiaries:
Co-efficient for FDI and t values
R2 and number of Observations
Co-efficient for FDI and t values
R2 and number of Observations
1 COMPOSITE INDEX OF TECHNOLOGICAL BEHAVIOUR 2 1.65 (2.01)** 37% (567) -0.76 (-1.95) 38% (542)
2 INVESTMENT IN DISEMBODIED TECHNOLOGY
2.1 R&D INTENSITY 3 0.86 (1.48) 45% (493) -0.09(-0.17) 46% (616)
2.2 SKILL TRAINING INTENSITY 1.58 (2.23)** 54% (236) -0.65 (-1.12) 49% (617)
2.3 THE SKILL INTENSITY OF EMPLOYMENT 4 1.22 (2)** 45% (492) -0.71 (-0.74)* 51% (604)
3 INVESTMENT IN CAPITAL-EMBODIED TECHNOLOGY
3.1 INVESTMENT IN INFORMATION TECHNOLOGIES 1.22 (1.88)* 46% (474) -0.17 (0.38) 46% (635)
3.2 INVESTMENT IN EQUIPMENT FOR INNOVATION 1.16 (1.71)* 44% (456) -0.16 (-0.33) 47% (653)
3.3 INVESTMENT IN IMPORTED CAPITAL GOODS 1.06 (1.91)** 45% (507) -1.14 (-1.69)* 46% (602)
4 INNOVATION STRATEGY
4.1 IMPORTANCE OF ‘SIGNIFICANT’ PRODUCT INNOVATION 0.81 (1.65)* 44% (706) -0.36 (-0.35) 52% (403)
4.2 IMPORTANCE OF ‘SIGNIFICANT’ PROCESS INNOVATION 0.79 (1.59) 44% (706) -1.18 (-0.23) 51% (403)
4.3 IMPORTANCE OF INNOVATION IN FIRM STRATEGY 0.92 (1.71)* 46% (598) 0.02 (0.04) 46% (511)
Source: Authors’ calculations based on the Argentinean Innovation Survey 1992-1996
Notes: 1 All standard errors, in parenthesis, are corrected for heteroskedasticity. *significant at 10% level, **significant at 5% level and *** significant at 1% level. 2 Using factor analysis three indexes of technological behaviour were used. Here we show the results for the first. The second and third provided non-significant results.
This first factor is explained mostly by four variables, R&D expenditures, skills, investments in equipment for innovations, and imports of capital goods (for more details see Annex 2)
3 In sensitivity tests a positive and significant coefficient for FDIpart (5% level) is obtained if only the top quartile of domestic firms (227) is selected.
4 In sensitivity tests a positive and very significant coefficient for FDIpart (1% level) is obtained if only 10% of domestic firms is selected.
19
For instance, training activities carried out by subsidiaries seem to be an important local driver for
technology spillovers. The 236 domestic firms located in industries where subsidiaries have
relatively high expenditure on training experienced positive and significant spillovers. In contrast,
the other group of domestic firms, located in industries where subsidiaries spent little on training,
experienced falling productivity (‘negative spillovers’),33 though this result is not significant. The
same relationships hold with respect to the skill-intensity of employment. When foreign firms
employ high proportions of professional and skilled workers, spillovers to domestic firms are
positive and significant; but when this proportion is low there is again a fall in domestic firms’
productivity, and the relationship is significant. It is of interest to note that, among the indicators of
investment in disembodied technology, it is only subsidiaries’ expenditure on R&D that seems to
have no influence on the transmission of spillovers – though a positive and significant effect is found
if only the top quartile of the distribution of domestic firms is selected.
With respect to all three indicators of investment in capital-embodied technology, high levels of
subsidiary investment are positively and significantly associated with spillovers to domestic firms. It
also seems clear that the strategic importance attached to innovation by subsidiaries influences the
extent to which spillovers are transmitted.
In summary, there is a sharp contrast between the two types of approach we have taken to the
estimation of spillovers. The methods we used in Section 4.1, based on underlying models of a
process that is centrally driven by the transfer of technology from parent firms yielded no evidence
of spillover effects – i.e. we did not confirm Hypothesis 1. This changed very little when that model
was augmented by consideration of the absorptive capability of domestic firms – i.e. we did not
confirm Hypothesis 2. On the other hand, when we tested in this section a battery of models
incorporating measures of localised knowledge-creation and knowledge accumulation by MNC
subsidiaries (Hypothesis 3) an array of strong, positive and significant results was generated.
5. Conclusions
One broad conclusion to be drawn from these results is about the role of absorptive capabilities.
Having failed to identify spillovers delivered automatically by FDI, we explored whether absorptive
capabilities were an important influence on the extent of spillovers. The analysis suggested that, on
their own, they were not, so adding to the body of similar results from other studies in industrialising
33 Since ‘real’ spillovers cannot be negative, this inverse relationship between FDI expansion and domestic firms’
productivity probably reflects some form of negative effect of increased competition from FDI.
20
countries. However, the detail is also interesting in suggesting differences between the apparent
absorption effects of different types of technological behaviour. Investment by domestic firms in
capital embodied technology and, to a lesser extent, in skill training were associated with spillover
effects.34 In contrast, investment in R&D appeared unimportant. This last finding raises questions
about the relevance of commonly used R&D-based measures of absorptive capability in the context
of industrialising countries.
A second broad conclusion is about the conventional ‘pipeline’ model of spillovers that is driven by
the knowledge-assets of multinational corporations. In the experience examined here, it was not
simply the existence of MNC subsidiaries, linked to the superior knowledge resources of the parent,
that generated spillovers. Instead, the subsidiaries’ own knowledge creation and accumulation seems
to have been a significant source of the spillover potential. This suggests that the knowledge asset
model, with its smoothly operating technology transfer ‘pipeline’ to subsidiaries, is not an
appropriate framework for analysing the significance of technology spillovers from FDI to domestic
firms. Instead, we argue that an alternative approach to analysis is likely to more useful. This still
takes account of the ‘supply side’, but focuses on the role of subsidiaries’ own technological
behaviour. However, it is important to recall the specific Argentine context of our case-study –
relative to many other industrialising countries, an economy with a long-established industrial base,
relatively mature MNC subsidiaries, and a substantial endowment of human capital. In other contexts
the emphasis we have given to the technologically active role of subsidiaries may be less appropriate.
Indeed, it might be productive if the field of spillover studies in general was to give much more
attention to the relevance of different models in different circumstances.
Our conclusions about the importance of technologically active subsidiaries leave open, however,
several important questions. One is about whether subsidiaries’ knowledge-creating activities are
simply reflections of inter-industry technological differences. Our conclusion is that this is not the
case in this study. More specifically, the technological intensity of industries did not provide a
significant explanation for the technology behaviour of subsidiaries, and hence for spillovers. This
contrasts with arguments in several recent studies noted in Section 2.1(c).
34 See note 3 under Table 2.
21
A more important question is about the explanation of the behaviour of the subsidiaries. Our study
throws little light on this, but the literature offers two perspectives. One, typically drawn on in
spillover studies, attaches most importance to centrally determined corporate strategies and motives
in the light of global and local competitive conditions. The other, while recognising the role of
centrally driven strategy, gives more emphasis to the autonomy and localised strategy of subsidiaries
within the overall corporate system. The former tends to see the subsidiary as playing a relatively
passive role in the process leading to spillover generation. The latter would ascribe a much more
active role to the subsidiary’s strategic discretion. Our results point in the direction of the second,
subsidiary-driven explanation. However, it is possible that the technologically active behaviour of
subsidiaries that seems to have generated spillovers in the case examined here might still have
reflected subsidiaries’ conformity to central corporate strategy much more than their own initiatives
in, and responses to, local contexts. Further work to clarify this issue would be important because of
its implications for host country policy with respect to FDI.
The generation of spillovers (and other externalities) provides the welfare justification for policy
intervention in connection with FDI. However, if as we suggest, the mere existence of MNC
subsidiaries in host economies is not a sufficient condition for such spillovers, policy measures that
simply seek to attract FDI along with its presumed inflow of superior technology would be
inefficient. Instead, the results of this study suggest that policy measures should focus on what MNC
affiliates actually do in the host country. More precisely it should focus on the two areas that seem to
be important in generating spillover effects: (a) the knowledge-creating and knowledge
accumulating activities of subsidiaries; (b) their embeddedness in linkages with the domestic
economy through which those knowledge assets might flow. But the effectiveness of such a focus,
and how it might best be developed, would depend on the extent of subsidiaries’ autonomy in
shaping their own technological behaviour within the structure and strategy of the corporation as a
whole.
References Aitken, B. and Harrison, A., 1999, Do domestic firms benefit from direct foreign investment? Evidence from Venezuela. American Economic Review, 89, 605-618. Bell, M. and Marin, A., 2004, Where do foreign direct investment-related technology spillovers come from in emerging economies? An exploration in Argentina in the 1990s. The European Journal of Development Research, 16, 645-677.
22
Birkinshaw, J. and Hood, N., 1998, Multinational subsidiary evolution: Capability and charter change in foreign-owned subsidiary companies. Academy of Management Review, 23, 773-795. Blomstrom, M. and Kokko, A., 2003, Human Capital and Inward FDI. Working Papers Series, No. 167, The European Institute of Japanese Studies, Stockholm School of Economics, Sweden. Blomstrom, M. and Sjoholm, F., 1999, Technology transfer and spillovers: Does local participation with multinationals matter? European Economic Review, 43, 915-923. Braconier, H., Ekholm, K. and Midelfart Knarvik, K. H., 2001, In search of FDI-transmitted R&D spillovers: A study based on Swedish data. Weltwirtschaftliches Archiv, 137, 644-665. Caves, R., 1974, Multinational firms, competition and productivity in host-country markets. Economica, 41, 176-93. Chung, W., 2001, Identifying technology transfer in foreign direct investment: Influence of industry conditions and investing motives. Journal of International Business Studies, 32, 211-229. Damijan, P. J., Knell, M., Majcen, B. and Rojec, M., 2003, The role of FDI, R&D accumulation and trade in transferring technology to transition countries: Evidence from firm panel data for eight transition countries. Economic Systems, 27, 189-204. Djankov, S. and Hoekman, B., 2000, Foreign investment and productivity growth in Czech enterprises. World Bank Economic Review, 14, 49-64. Dunning, J. and Cantwell, J. (1986), The changing role of multinational enterprise in the international creation, transfer and diffusion of technology. Proceedings of the Conference on Innovation Diffusion, March, Venice. Ferraz, J. C., Kupfer, D. and Haguenauer, L., 1997, Made in Brasil: Desafios Competitivos Para a Industria (Rio de Janeiro: Campus). Findlay, R., 1978, Relative backwardness, direct foreign investment, and the transfer of technology: A simple dynamic model, Quarterly Journal of Economics, 92, 1-16. Frost, T., 2001, The geographic sources of foreign subsidiaries’ innovations. Strategic Management Journal, 22, 101-124. Globerman, S., 1979, Foreign direct investment and ‘spillover’ efficiency benefits in Canadian manufacturing industries. Canadian Journal of Economics, XII, 42-56. Gorg, H. and Greenaway, D., 2004, Much ado about nothing? Do domestic firms really benefit from foreign direct investment? World Bank Research Observer, 19, 171-197. Gorg, H. and Strobl, E., 2001, Multinational companies and productivity spillovers: A meta-analysis. Economic Journal, 111, 723-739. Griliches, Z., 1992, The search for R&D spillovers. Scandinavian Journal of Economics, 94 (supplement), 29-47.
23
Griliches, Z. and Mairesse, J., 1998, Production functions: The search for identification, in: S. Strom (ed.) Econometrics and Economic Theory in the 20th Century, (Cambridge: Cambridge University Press) pp. 169-203. Haddad, M. and Harrison, A., 1993, Are there dynamic externalities from direct foreign investment? Evidence from panel data for Morocco. Journal of Development Economics, 42, 51-74. Haskel, J., Pereira, S. and Slaughter, M., 2002, Does Inward Foreign Direct Investment Boost the Productivity of Domestic Firms? Working Paper Series, No. 8724, National Bureau of Economic Research, Cambridge. Hymer, S., 1976, The International Operations of National Firms: A Study of Foreign Direct Investment, (Cambridge, Mass.: MIT Press). Keller, W and Yeaple, S.R., 2003, Multinational Enterprises, International Trade and Productivity Growth: Firm Level Evidence from the United States. Working Paper Series, No. 9504, National Bureau of Economic Research, Cambridge. Kokko, A., 1994, Technology, market characteristics, and spillovers. Journal of Development Economics, 43, 279-293. Konings, J., 2001, The effects of foreign direct investment on domestic firms: Evidence from firm level panel data in emerging economies. Economics of Transition, 9, 619-633. Kulfas, M., Porta, F. and Ramos A., 2002, Inversión Extranjera y Empresas Transnacionales en la Economia Argentina. Serie Estudios y Perspectivas 10: CEPAL, Buenos Aires, Argentina. Lipsey, R. 2004, Home and host country effects of FDI, in: R. E. Baldwin and L. A. Winters, (eds) Challenges to Globalization, (Chicago: University of Chicago Press) pp. 333-382. Narula, R. and Dunning, J., 2000, Industrial development, globalisation and multinational enterprises: New realities for developing countries. Oxford Development Studies, 28, 141-167. Olley, S. and Pakes, A., 1996, The dynamics of productivity in the telecommunications equipment industry. Econometrica, 64, 1263-1297. Patibandla, M. and Sanyal, A., 2005, Foreign investment and productivity: A study of post-reform Indian industry. Review of Applied Economics, 1 (forthcoming). Sjoholm, F., 1999, Technology gap, competition and spillovers from direct foreign investment: Evidence from establishment data. Journal of Development Studies, 36, 53-73. Todo, Y. and Miyamoto, K., 2002, Knowledge Diffusion from Multinational Enterprises: The Role of Domestic and Foreign Knowledge-Enhanced Activities. OECD Technical Paper 196, Paris: OECD Development Centre Wang, Y. and Blomstrom, M., 1992, Foreign investment and technology transfer: A simple model. European Economic Review, 36, 137-155.
24
ANNEXES
ANNEX 1: THE INNOVATION SURVEY IN ARGENTINA The Innovation Survey was carried out in 1996, but the firms provided four types of information:
1) For the single year 1996 (e.g. ‘participation of foreign capital’ refers to 1996),
2) For 5 points in time, annually from 1992 to 1996 (e.g. ‘R&D employees’ is provided for each of the 5 years),
3) For two points in time: 1992 and 1996 (e.g. sales, exports, and investments),
4) For the whole period (e.g. improvements in products and processes relate to the whole period) The rest of this annex has two parts.
Part 1 describes the types of information covered by the Innovation Survey, and comments on our construction of indicators based on this information
Part 2 describes the relative participation of MNC subsidiaries and domestic firms as shown by the Innovation Survey and provides background descriptive statistics based on the different indicators constructed. Part 1 The Information reported by the Survey and the indicators The information covered by the database may be classified into 4 main areas: firm-level indicators of performance and productivity, investments and efforts carried out in order to acquire external technologies, internal technological efforts and capabilities, and innovative output and strategy. Specifically, each area includes: 1. Performance, productivity (a) Total sales, (1992-1996).35 (b) Total exports and composition (goods, services, technology and technical assistance). (c) Total number of employees between 1992 and 1996 by activity and qualification. 2. Availability and acquisition of externally developed technologies (a) Composition of investments in fixed assets. (b) Characteristics of the main investments in fixed assets. (c) Automation and control, value of PCs in administrative, technical and other applications,
quantity and value of control systems and automation. (d) Acquisition of information technologies. (e) Total import values and composition. (f) Total imports of capital goods and composition. (g) Main reasons to import capital goods. (h) Payments to national and foreign private enterprises for licences and technology transfer. (i) Type of consulting hired. (j) Characteristics of the consulting about production, organisation of the productive system,
products, commercialisation, organisation and business management. (k) Type of agreements with other firms or institutions (1992/96). (l) Linkages and contacts with Argentinean Institutions of Science and Technology. 35 The added value by firm for 1996 was obtained from other sources
25
3. Internal technological efforts and capabilities (a) Number of employees between 1992 and 1996 by activity and level of qualification. (b) Organisational structure of the R&D activities. (c) Expenditures in personnel (staff) devoted temporarily or permanently to innovation activities and
main activities of the personnel: basic research, applied research, development of products or process adaptation of products or processes, technical assistance to production, engineering of projects, administrative reorganisation, general organisation, commercialisation of new products, total.
(d) Other expenditures in innovation activities (basic research, applied research, development of products or process, adaptation of products or processes, technical assistance to production, engineering of projects, administrative reorganisation, general organisation, commercialisation of new products).
(e) Sources of information for innovation (experimental own R&D, production, linked firms, headquarters or other subsidiaries, competence, reverse engineering, customers, enterprises of consulting, suppliers of equipment and materials, universities, public institutions of research, private institutions of research, licences and patents, conferences, seminars, fairs and expositions, journals, publications and other bibliography, centres of technological information and data bases).
(f) R&D joint ventures with other enterprises or institutions (with local or external enterprises from the same group, customers, suppliers, competitors, other enterprises, experts and consulting firms, private institutions of research, public institutions of research, universities).
(g) Activities of training during the period 1992-1996 (Modes, costs and total hours). (h) Motivations for training. (i) Productive, commercial and business agreements 1992/1996. (j) Implementation of organisational techniques. 3. Innovative output (a) Activities of technological innovation, 1992/1996 (innovation of product, innovation of process,
design, development, automation and control, renewal of machinery and equipment, work re-organisation, reorganisation of productive flows, execution of continuous improvements, costs rationalisation, training of human resources).
(b) Improvements in products between 1992 and 1996 (technological improvement of current products, new products due to advances in the technological and scientific base, new products due to new productive process, new products due to novel inputs, differentiation of products).
(c) Improvements obtained in processes between 1992 and 1996 (technological improvement of current processes for equal products, machinery and equipment linked to new processes, new processes for new products, new process based on advances in the scientific and technological base).
(d) Patents granted between 1992 and 1996 (quantity), (granted in Argentina, granted abroad). (e) Innovation’s objectives (total or partial replacement of current products, extend the range of
products, development of products that do not affect the environment, improve the quality of products, introduction of new materials, development of new equipment, Improve the flexibility of the processes, reduction of the costs of production, improvements in work conditions, adoption of less polluting productive process, development of innovations based on scientific innovations, adaptation of products to the national market, adaptation of products to the external markets).
(f) Main factors hindering innovation. The following 10 indicators were derived from this information:
A) Investment in disembodied technologies 1 R&D intensity 2 Skill training intensity 3 Skill intensity of employment
26
4 Investment in licensed technology
B) Investment in capital embodied technologies 5 Investment in information technologies 6 Investment in equipment for innovation 7 Investment in imported capital goods
C) Innovation strategy 8 Importance of significant product innovation 9 Importance of significant process innovation 10 Importance of innovation in firm strategy R&D intensity, skill training intensity and the three investments in embodied technologies are ratios between the absolute value for this indicator and total sales per firm. The skill intensity of employment is calculated as the ratio between professional workers and non-professional workers for each firm. Finally, the innovation strategy is calculated on the bases of the information provided by the questions a), b) and c), included in the item ‘innovative output’ above. The responses to these questions were used to compute the indicators as follows:
• The importance of ‘significant’ product innovation: - Firms were classified into two groups: those attaching ‘Hi’ and ‘Lo’ importance to significant
product innovation, valued 1 and 0 respectively. The former were defined as those that introduced new products: (a) as a result of improvements in the scientific and technological base, (b) in association with new production processes, and/or (c) in association with the employment of novel inputs. The second group was classified as attaching ‘Lo’ importance to significant product innovation when firms only introduced improvements to existing products, and/or when they differentiated existing products.
• The importance of ‘significant’ process innovation: - Firms were classified into two groups: those attaching ‘Hi’ and ‘Lo’ importance to significant
process innovation, valued 1 and 0 respectively. They were classified as the former when they: (a) introduced new processes because of improvements in the scientific/technological base, and/or (b) improved processes in association with the introduction of new machinery and equipment. The second group were classified as attaching ‘Lo’ importance to significant process innovation when they only improved processes for the same products, and/or introduced changes in processes only to implement product changes.
• The importance of innovation in firm strategy: - The survey asked firms whether they considered each of a range of activities “decisive”,
“significant” or “non-significant” for their business strategy. We classified firms as attaching ‘Hi’ importance to innovation in their strategy when they classified the following activities as decisive: (a) product/process innovation, (b) the incorporation of new equipment for innovations, (c) changes in work organisation, and (d) re-organisation of the production line/flow. Firms classified as attaching ‘Lo’ significance to innovation were those that described these activities as “significant” or “non-significant”.
Part 2 Firms and Ownership, and Descriptive Statistics
A. Firms and ownership The survey covered 283 MNC subsidiaries and 1250 domestic firms. A company is defined in this study as a subsidiary when the proportion of foreign ownership is higher than 10%. The Survey sample included all of the 500 largest industrial firms in Argentina.
27
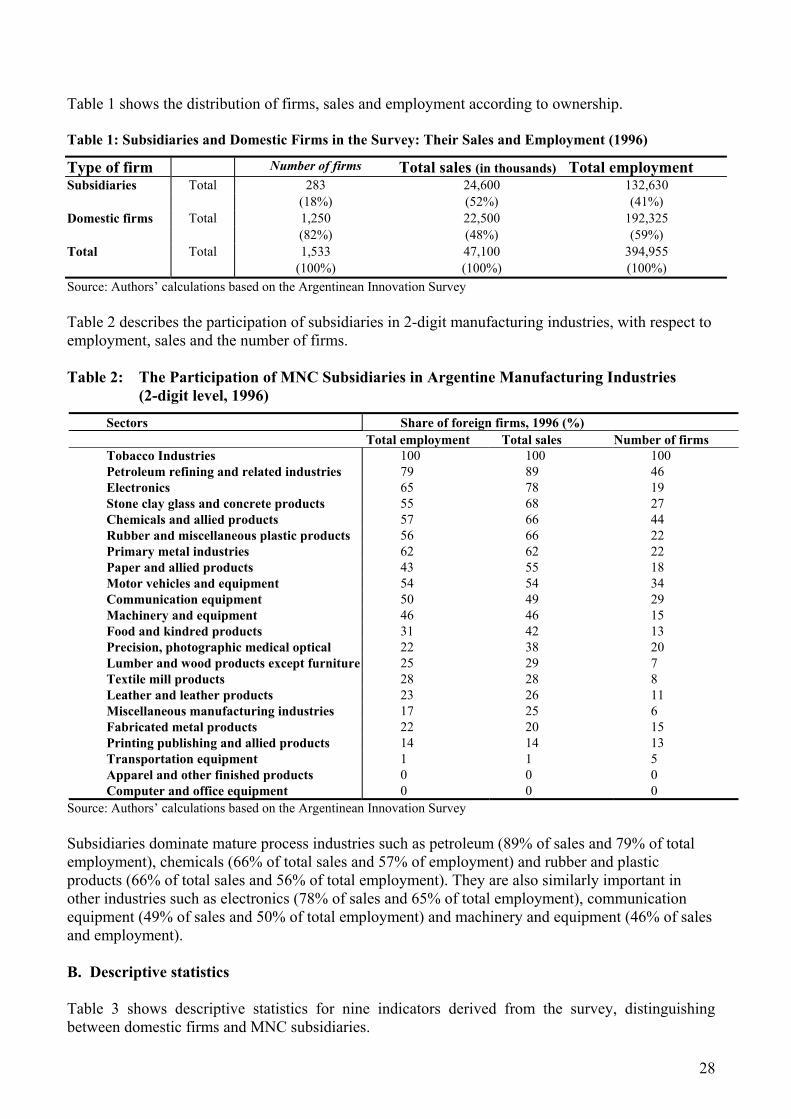
Table 1 shows the distribution of firms, sales and employment according to ownership. Table 1: Subsidiaries and Domestic Firms in the Survey: Their Sales and Employment (1996)
Type of firm Number of firms Total sales (in thousands) Total employment Subsidiaries Total 283 24,600 132,630
(18%) (52%) (41%) Domestic firms Total 1,250 22,500 192,325 (82%) (48%) (59%) Total Total 1,533 47,100 394,955 (100%) (100%) (100%) Source: Authors’ calculations based on the Argentinean Innovation Survey Table 2 describes the participation of subsidiaries in 2-digit manufacturing industries, with respect to employment, sales and the number of firms. Table 2: The Participation of MNC Subsidiaries in Argentine Manufacturing Industries (2-digit level, 1996)
Sectors Share of foreign firms, 1996 (%) Total employment Total sales Number of firms Tobacco Industries 100 100 100 Petroleum refining and related industries 79 89 46 Electronics 65 78 19 Stone clay glass and concrete products 55 68 27 Chemicals and allied products 57 66 44 Rubber and miscellaneous plastic products 56 66 22 Primary metal industries 62 62 22 Paper and allied products 43 55 18 Motor vehicles and equipment 54 54 34 Communication equipment 50 49 29 Machinery and equipment 46 46 15 Food and kindred products 31 42 13 Precision, photographic medical optical 22 38 20 Lumber and wood products except furniture 25 29 7 Textile mill products 28 28 8 Leather and leather products 23 26 11 Miscellaneous manufacturing industries 17 25 6 Fabricated metal products 22 20 15 Printing publishing and allied products 14 14 13 Transportation equipment 1 1 5 Apparel and other finished products 0 0 0 Computer and office equipment 0 0 0
Source: Authors’ calculations based on the Argentinean Innovation Survey Subsidiaries dominate mature process industries such as petroleum (89% of sales and 79% of total employment), chemicals (66% of total sales and 57% of employment) and rubber and plastic products (66% of total sales and 56% of total employment). They are also similarly important in other industries such as electronics (78% of sales and 65% of total employment), communication equipment (49% of sales and 50% of total employment) and machinery and equipment (46% of sales and employment). B. Descriptive statistics Table 3 shows descriptive statistics for nine indicators derived from the survey, distinguishing between domestic firms and MNC subsidiaries.
28
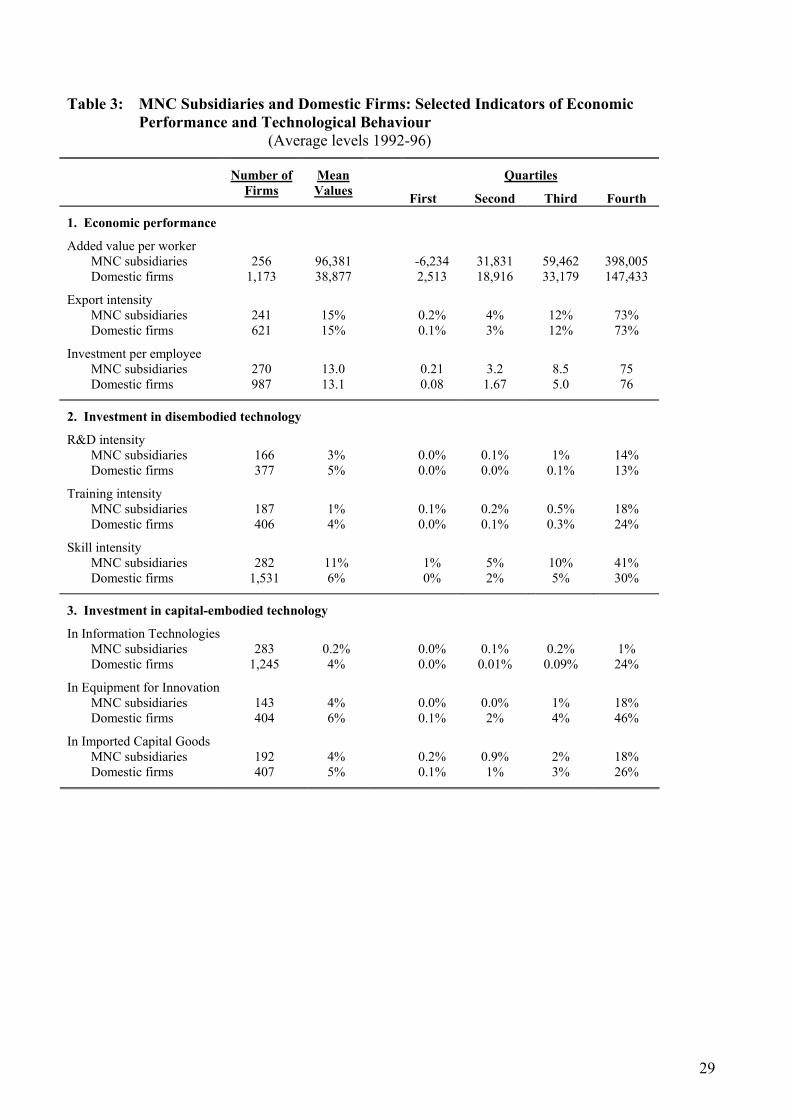
Table 3: MNC Subsidiaries and Domestic Firms: Selected Indicators of Economic
Performance and Technological Behaviour (Average levels 1992-96)
Quartiles Number of Firms
Mean Values First Second Third Fourth
1. Economic performance
Added value per worker MNC subsidiaries Domestic firms
256
1,173
96,381 38,877
-6,234 2,513
31,831 18,916
59,462 33,179
398,005 147,433
Export intensity MNC subsidiaries Domestic firms
241 621
15% 15%
0.2% 0.1%
4% 3%
12% 12%
73% 73%
Investment per employee MNC subsidiaries Domestic firms
270 987
13.0 13.1
0.21 0.08
3.2
1.67
8.5 5.0
75 76
2. Investment in disembodied technology
R&D intensity MNC subsidiaries Domestic firms
166 377
3% 5%
0.0% 0.0%
0.1% 0.0%
1% 0.1%
14% 13%
Training intensity MNC subsidiaries Domestic firms
187 406
1% 4%
0.1% 0.0%
0.2% 0.1%
0.5% 0.3%
18% 24%
Skill intensity MNC subsidiaries Domestic firms
282 1,531
11% 6%
1% 0%
5% 2%
10% 5%
41% 30%
3. Investment in capital-embodied technology
In Information Technologies MNC subsidiaries Domestic firms
283 1,245
0.2% 4%
0.0% 0.0%
0.1% 0.01%
0.2% 0.09%
1% 24%
In Equipment for Innovation MNC subsidiaries Domestic firms
143 404
4% 6%
0.0% 0.1%
0.0% 2%
1% 4%
18% 46%
In Imported Capital Goods MNC subsidiaries Domestic firms
192 407
4% 5%
0.2% 0.1%
0.9% 1%
2% 3%
18% 26%
29
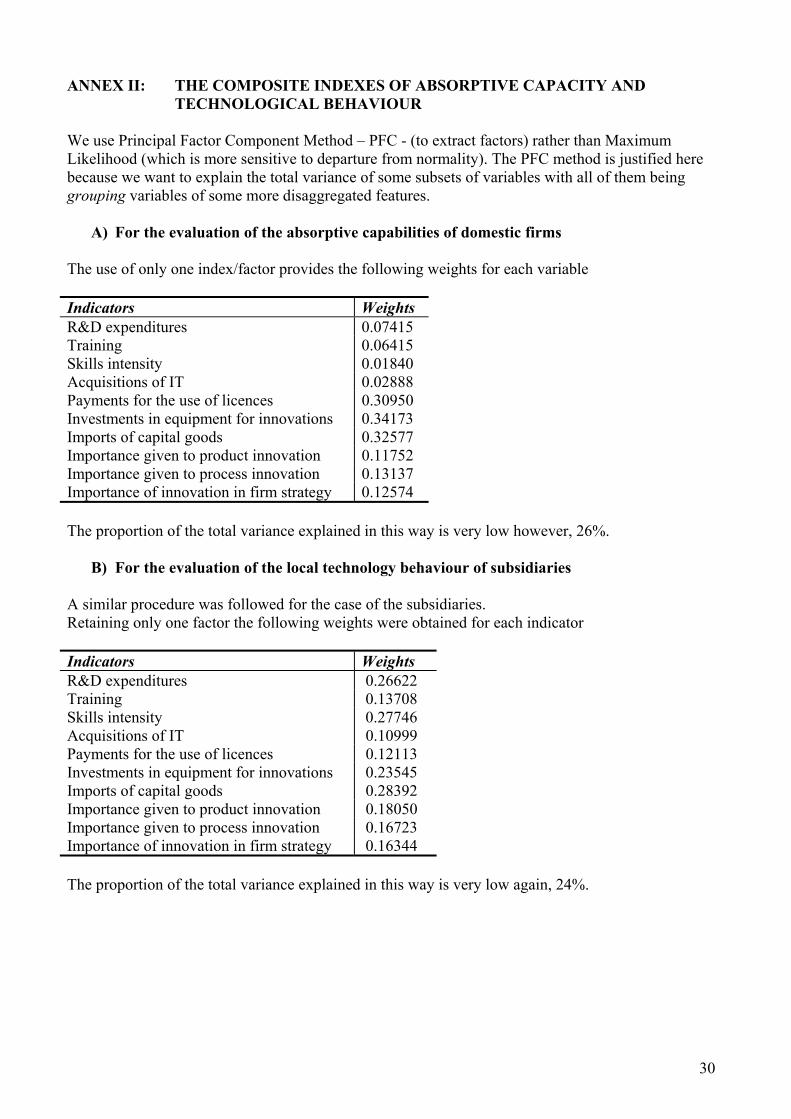
ANNEX II: THE COMPOSITE INDEXES OF ABSORPTIVE CAPACITY AND TECHNOLOGICAL BEHAVIOUR
We use Principal Factor Component Method – PFC - (to extract factors) rather than Maximum Likelihood (which is more sensitive to departure from normality). The PFC method is justified here because we want to explain the total variance of some subsets of variables with all of them being grouping variables of some more disaggregated features.
A) For the evaluation of the absorptive capabilities of domestic firms The use of only one index/factor provides the following weights for each variable Indicators Weights R&D expenditures 0.07415 Training 0.06415 Skills intensity 0.01840 Acquisitions of IT 0.02888 Payments for the use of licences 0.30950 Investments in equipment for innovations 0.34173 Imports of capital goods 0.32577 Importance given to product innovation 0.11752 Importance given to process innovation 0.13137 Importance of innovation in firm strategy 0.12574 The proportion of the total variance explained in this way is very low however, 26%.
B) For the evaluation of the local technology behaviour of subsidiaries A similar procedure was followed for the case of the subsidiaries. Retaining only one factor the following weights were obtained for each indicator Indicators Weights R&D expenditures 0.26622 Training 0.13708 Skills intensity 0.27746 Acquisitions of IT 0.10999 Payments for the use of licences 0.12113 Investments in equipment for innovations 0.23545 Imports of capital goods 0.28392 Importance given to product innovation 0.18050 Importance given to process innovation 0.16723 Importance of innovation in firm strategy 0.16344 The proportion of the total variance explained in this way is very low again, 24%.
30
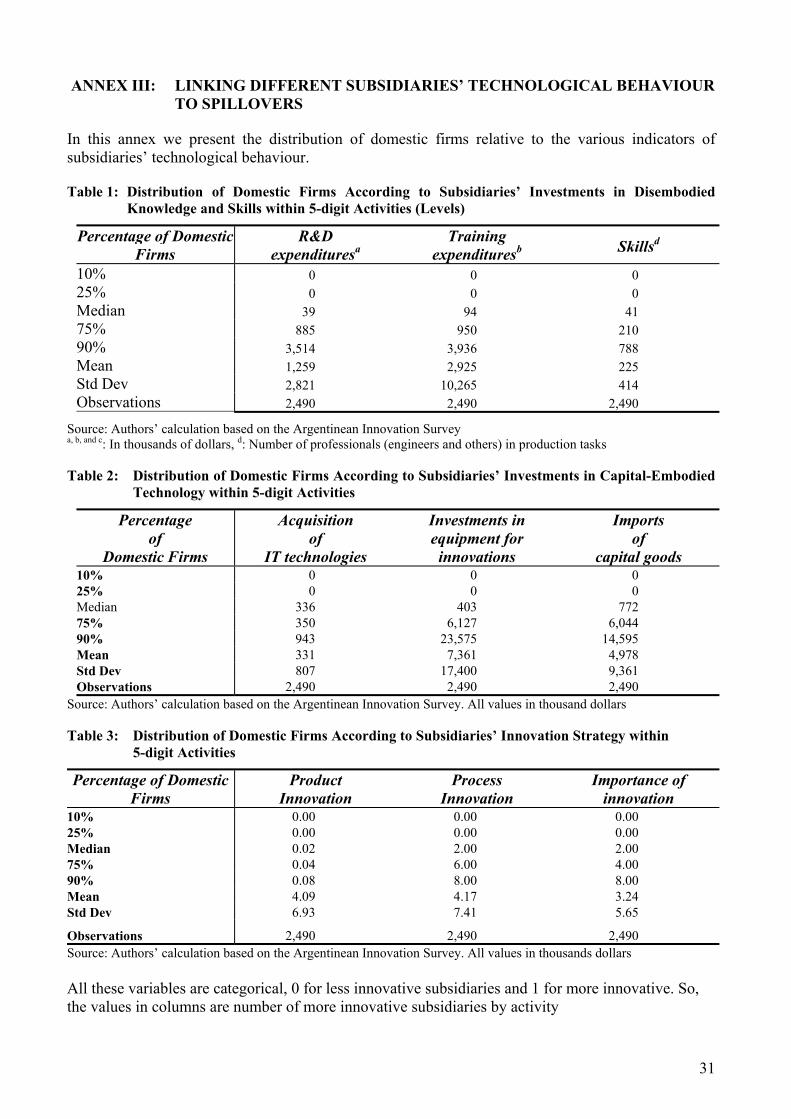
ANNEX III: LINKING DIFFERENT SUBSIDIARIES’ TECHNOLOGICAL BEHAVIOUR TO SPILLOVERS
In this annex we present the distribution of domestic firms relative to the various indicators of subsidiaries’ technological behaviour. Table 1: Distribution of Domestic Firms According to Subsidiaries’ Investments in Disembodied
Knowledge and Skills within 5-digit Activities (Levels)
Percentage of Domestic Firms
R&D expendituresa
Training expendituresb Skillsd
10% 0 0 0 25% 0 0 0 Median 39 94 41 75% 885 950 210 90% 3,514 3,936 788 Mean 1,259 2,925 225 Std Dev 2,821 10,265 414 Observations 2,490 2,490 2,490
Source: Authors’ calculation based on the Argentinean Innovation Survey a, b, and c: In thousands of dollars, d: Number of professionals (engineers and others) in production tasks Table 2: Distribution of Domestic Firms According to Subsidiaries’ Investments in Capital-Embodied
Technology within 5-digit Activities
Percentage of
Domestic Firms
Acquisition of
IT technologies
Investments in equipment for innovations
Imports of
capital goods 10% 0 0 0 25% 0 0 0 Median 336 403 772 75% 350 6,127 6,044 90% 943 23,575 14,595 Mean 331 7,361 4,978 Std Dev 807 17,400 9,361 Observations 2,490 2,490 2,490
Source: Authors’ calculation based on the Argentinean Innovation Survey. All values in thousand dollars Table 3: Distribution of Domestic Firms According to Subsidiaries’ Innovation Strategy within 5-digit Activities
Percentage of Domestic Firms
Product Innovation
Process Innovation
Importance of innovation
10% 0.00 0.00 0.00 25% 0.00 0.00 0.00 Median 0.02 2.00 2.00 75% 0.04 6.00 4.00 90% 0.08 8.00 8.00 Mean 4.09 4.17 3.24 Std Dev 6.93 7.41 5.65
Observations 2,490 2,490 2,490 Source: Authors’ calculation based on the Argentinean Innovation Survey. All values in thousands dollars All these variables are categorical, 0 for less innovative subsidiaries and 1 for more innovative. So, the values in columns are number of more innovative subsidiaries by activity
31

ANNEX IV: THE MODEL AND VARIABLES Estimation in first differences
jijjid
ijd
jjid
ijd IGZFDIpartInputY εηδλ ++++∆+∆=∆ lnln (1)
Equation (1) is derived from a Cob-Douglas production function of the form:
itititit KLAY βα= (2)
Where Y is added value, L labour, K capital, A, together with α and β (the elasticities of output with respect to each input) are fixed parameters and the sub indexes i t indicate variation across firms and time. This function is linear in the logarithms of the variables, so after taking logarithms, and adding two terms: a) a term bi that captures all unobserved time-constant factors that might affect Yi, b) a stochastic disturbance term uit to account for variations in the technical or productive capabilities of the ith firm at the time t, we can write this relationship for t =1996 and t-4 =1992 as follows:
)ln(lnlnln AaubLKaY itiitititit =++++= αβ (3)
44444 lnlnln −−−−− ++++= itiitititit ubLKaY αβ (4)
Then, differentiating (3-4) the change in added value for domestic firms between 1996 and 1992 can be expressed as follows:
iiiii uLKaY ∆+∆+∆+∆=∆ lnlnln αβ (5)
Where α and β are the participation of capital and labour in value-added, and the unobserved effect bi has been differenced away. We do not have capital stock, so instead of β we estimate the marginal product of capital by using I/Y
in 1996.
In effect iiii LKaY lnlnln ∆+∆+∆=∆ αβ (5) can be written also as:
iijij LKK
YK
KYaY lnln ∆+
∆∆∆
+∆=∆ α (5`), (5’)
where β=∆∆
YK
KY .
So, after cancelling K in equation (5`), and given that ρ=∆∆
KY and IK =∆ , equation 5` can be
32
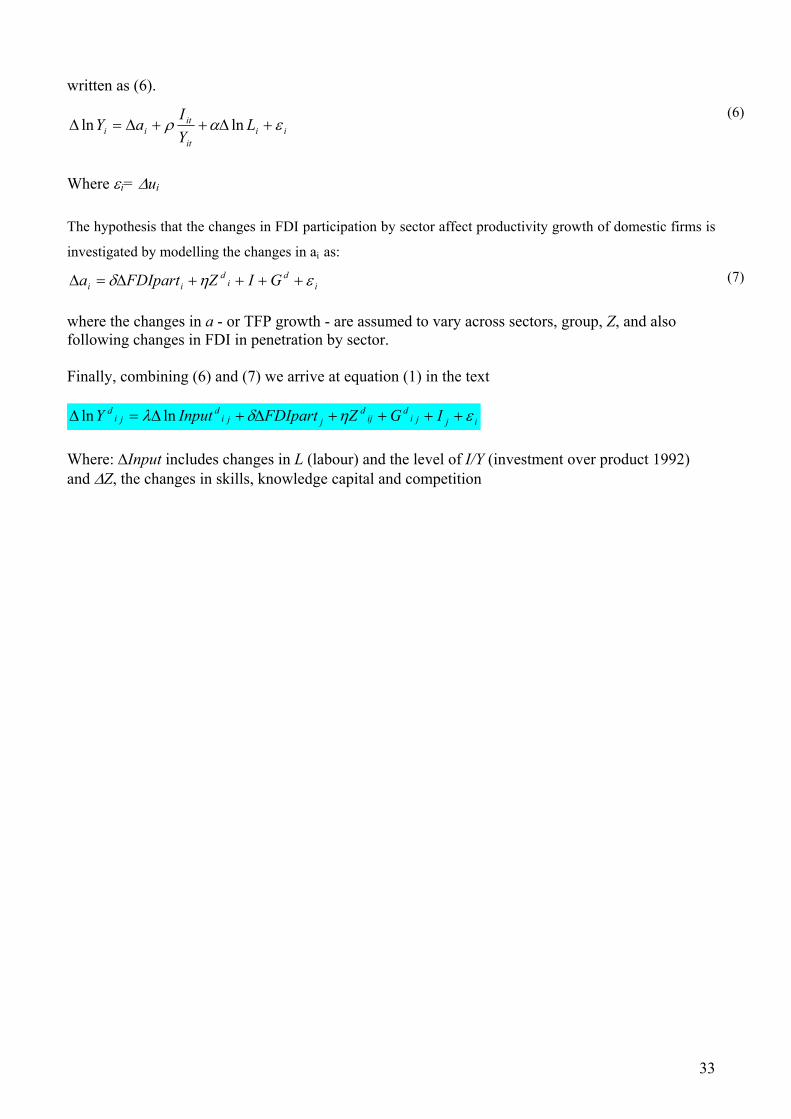
written as (6).
iiit
itii L
YI
aY εαρ +∆++∆=∆ lnln (6)
Where εi= ∆ui
The hypothesis that the changes in FDI participation by sector affect productivity growth of domestic firms is
investigated by modelling the changes in ai as:
id
id
ii GIZFDIparta εηδ ++++∆=∆ (7)
where the changes in a - or TFP growth - are assumed to vary across sectors, group, Z, and also following changes in FDI in penetration by sector. Finally, combining (6) and (7) we arrive at equation (1) in the text
ijjid
ijd
jjid
jid IGZFDIpartInputY εηδλ ++++∆+∆=∆ lnln
Where: ∆Input includes changes in L (labour) and the level of I/Y (investment over product 1992) and ∆Z, the changes in skills, knowledge capital and competition
33
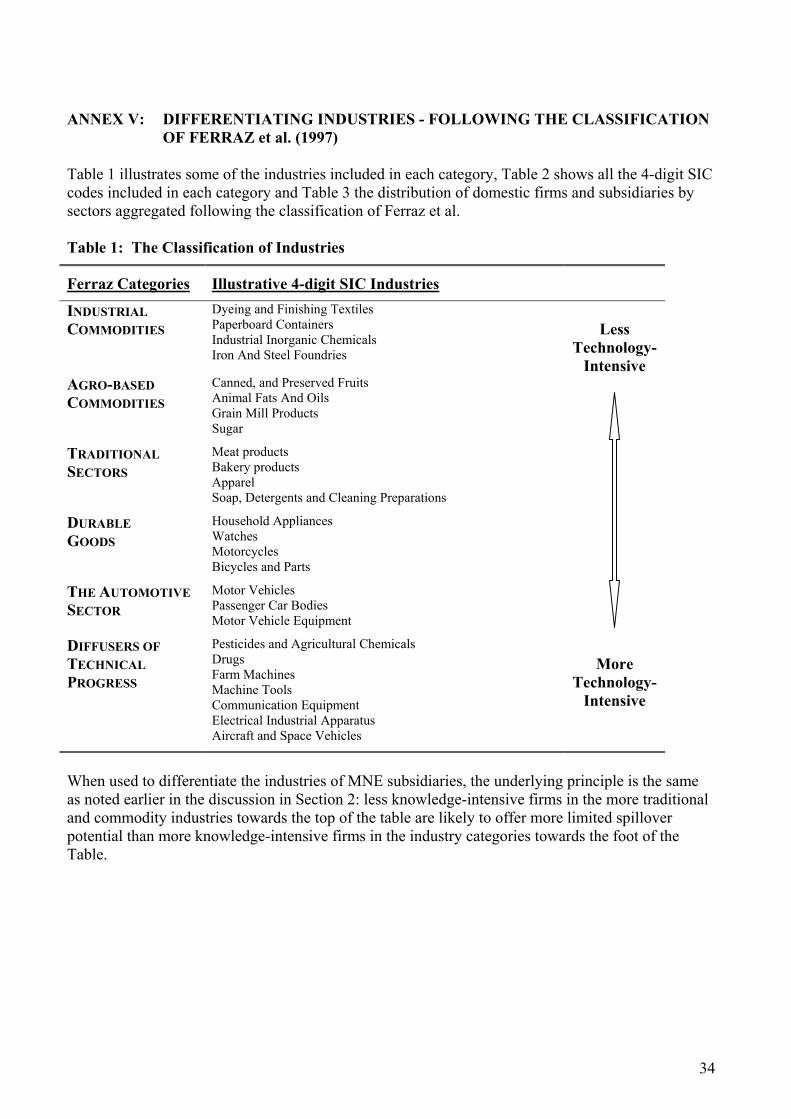
ANNEX V: DIFFERENTIATING INDUSTRIES - FOLLOWING THE CLASSIFICATION
OF FERRAZ et al. (1997) Table 1 illustrates some of the industries included in each category, Table 2 shows all the 4-digit SIC codes included in each category and Table 3 the distribution of domestic firms and subsidiaries by sectors aggregated following the classification of Ferraz et al. Table 1: The Classification of Industries
Ferraz Categories Illustrative 4-digit SIC Industries
INDUSTRIAL COMMODITIES
Dyeing and Finishing Textiles Paperboard Containers Industrial Inorganic Chemicals Iron And Steel Foundries
Less
Technology-Intensive
AGRO-BASED COMMODITIES
Canned, and Preserved Fruits Animal Fats And Oils Grain Mill Products Sugar
TRADITIONAL SECTORS
Meat products Bakery products Apparel Soap, Detergents and Cleaning Preparations
DURABLE GOODS
Household Appliances Watches Motorcycles Bicycles and Parts
THE AUTOMOTIVE SECTOR
Motor Vehicles Passenger Car Bodies Motor Vehicle Equipment
DIFFUSERS OF TECHNICAL PROGRESS
Pesticides and Agricultural Chemicals Drugs Farm Machines Machine Tools Communication Equipment Electrical Industrial Apparatus Aircraft and Space Vehicles
More
Technology-Intensive
When used to differentiate the industries of MNE subsidiaries, the underlying principle is the same as noted earlier in the discussion in Section 2: less knowledge-intensive firms in the more traditional and commodity industries towards the top of the table are likely to offer more limited spillover potential than more knowledge-intensive firms in the industry categories towards the foot of the Table.
34
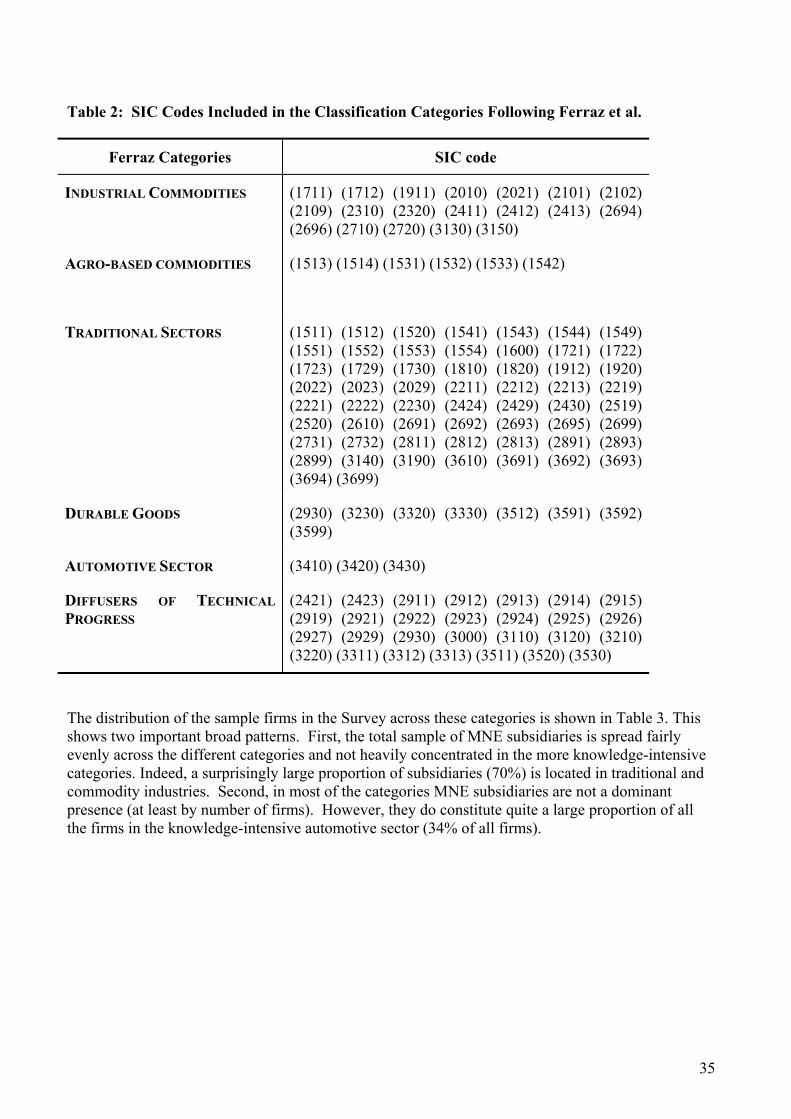
Table 2: SIC Codes Included in the Classification Categories Following Ferraz et al.
Ferraz Categories SIC code
INDUSTRIAL COMMODITIES (1711) (1712) (1911) (2010) (2021) (2101) (2102) (2109) (2310) (2320) (2411) (2412) (2413) (2694) (2696) (2710) (2720) (3130) (3150)
AGRO-BASED COMMODITIES (1513) (1514) (1531) (1532) (1533) (1542)
TRADITIONAL SECTORS (1511) (1512) (1520) (1541) (1543) (1544) (1549) (1551) (1552) (1553) (1554) (1600) (1721) (1722) (1723) (1729) (1730) (1810) (1820) (1912) (1920) (2022) (2023) (2029) (2211) (2212) (2213) (2219) (2221) (2222) (2230) (2424) (2429) (2430) (2519) (2520) (2610) (2691) (2692) (2693) (2695) (2699) (2731) (2732) (2811) (2812) (2813) (2891) (2893) (2899) (3140) (3190) (3610) (3691) (3692) (3693) (3694) (3699)
DURABLE GOODS (2930) (3230) (3320) (3330) (3512) (3591) (3592) (3599)
AUTOMOTIVE SECTOR (3410) (3420) (3430)
DIFFUSERS OF TECHNICAL PROGRESS
(2421) (2423) (2911) (2912) (2913) (2914) (2915) (2919) (2921) (2922) (2923) (2924) (2925) (2926) (2927) (2929) (2930) (3000) (3110) (3120) (3210) (3220) (3311) (3312) (3313) (3511) (3520) (3530)
The distribution of the sample firms in the Survey across these categories is shown in Table 3. This shows two important broad patterns. First, the total sample of MNE subsidiaries is spread fairly evenly across the different categories and not heavily concentrated in the more knowledge-intensive categories. Indeed, a surprisingly large proportion of subsidiaries (70%) is located in traditional and commodity industries. Second, in most of the categories MNE subsidiaries are not a dominant presence (at least by number of firms). However, they do constitute quite a large proportion of all the firms in the knowledge-intensive automotive sector (34% of all firms).
35
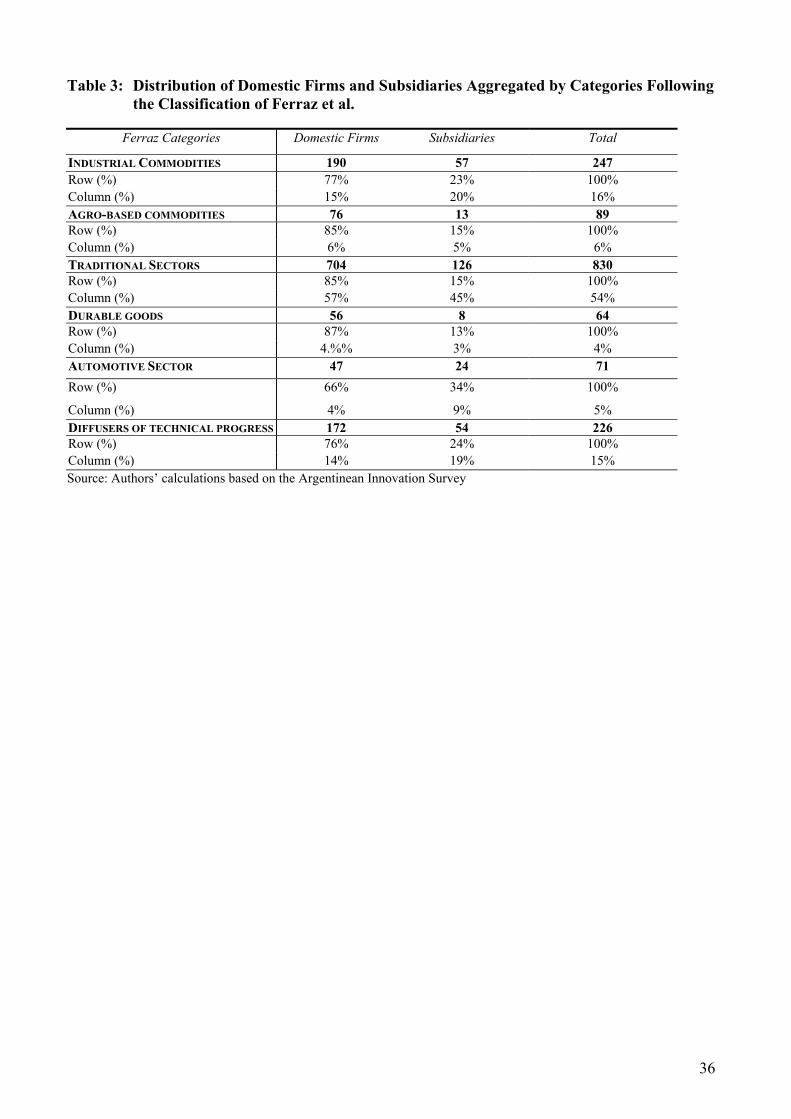
36
Table 3: Distribution of Domestic Firms and Subsidiaries Aggregated by Categories Following the Classification of Ferraz et al.
Ferraz Categories Domestic Firms Subsidiaries Total
INDUSTRIAL COMMODITIES 190 57 247 Row (%) 77% 23% 100% Column (%) 15% 20% 16% AGRO-BASED COMMODITIES 76 13 89 Row (%) 85% 15% 100% Column (%) 6% 5% 6% TRADITIONAL SECTORS 704 126 830 Row (%) 85% 15% 100% Column (%) 57% 45% 54% DURABLE GOODS 56 8 64 Row (%) 87% 13% 100% Column (%) 4.%% 3% 4% AUTOMOTIVE SECTOR 47 24 71 Row (%) 66% 34% 100%
Column (%) 4% 9% 5% DIFFUSERS OF TECHNICAL PROGRESS 172 54 226 Row (%) 76% 24% 100% Column (%) 14% 19% 15% Source: Authors’ calculations based on the Argentinean Innovation Survey