Embed Size (px)
Citation preview
1
MANAGERIAL SPILLOVERS: HOW FDI FACILITATES CHANGES IN
MANAGERIAL MINDSETS IN A TRANSITION ECONOMY
Tiemin Wang Peking University
Klaus E Meyer University of Bath
This version June 28, 2009
Abstract
Foreign investors upgrade the capabilities of their local labor force through training and
experience, which enhances both their abilities and their cognitive horizons. Such
trained employees moving to local firms and taking leadership roles provides an
important mechanism by which foreign investors facilitate the development of the local
industry. We explore the theoretical foundations of this effect, focusing on the
managerial orientation, and show empirical evidence for a sample of Chinese
pharmaceutical companies: foreign trained executives contribute to executives’ market
orientation, which in turn enhances its performance.
© The authors, 2009
Working paper, downloaded from www.klausmeyer.co.uk
Acknowledgements: We thank our colleagues and conference participants of AIB San Diego for helpful comments on earlier versions of this work.
2
INTRODUCTION
Local firms are believed to benefit from employees trained in foreign investment
enterprises (FIE) assume leadership positions. This movement of human capital thus
constitutes an important mechanism by which FIE facilitate the development of local
businesses and the local economy (Gerschenberg, 1987; Patibandla and Petersen, 2002;
Meyer, 2004; Görg and Strobl, 2005; Spencer, 2008). However, the theoretical
microfoundatons of this ‘managerial spillover’ are not well developed, and few studies have
empirically tested such an effect directly.
We explore theoretically and empirically why working for a FIE may equip managers to
make a major contribution to local firms they may subsequently lead. Especially in tranition
economies, corporate executives have pivotal influence on a firm’s adaptation in changing
environments (Child, 1972; 1997; Peng, 2003; Dixon, Meyer and Day, 2007). Executives that
have previously worked for a FIE will likely contribute broader mental horizons and an
international business mindset. In particular, they may upgrade their strategic orientation, and
their capabilities, that help local firms to improve their performance. Market orientation, a
crucial component of managers’ belief system in a market economy (Hambrick and Mason,
1984; Venkatraman, 1989; Eisenhardt and Bourgeois, 1988), thus is a crucial mediating
variable to understanding the channels of impact of foreign investment.
Gaps in managerial cognition are particular crucial in transition economies where
institutions are rebuild to develop a market economy. A pivotal challenge for local firms in
these contexts is to know how to act in a market economy (Swaan 1997, Allmendinger and
Hackman 1996, Peng, 2003; Meyer and Peng 2005). Local managers face substantive
3
cognitive obstacles when trying to lead change processes in a market-based context that is
essentially new to them (Newman, 2000). A market-oriented managerial belief system may
thus be a scarce capability for local firms in transition economies. To identify such cognitive
variations, we distinguish market-driven and internal management orientation of executives’
perception of strategic priories. The relative strength of this managerial orientation drives
firms’ strategic decisions and their ability to implement them, and thus corporate performance
[ADD REFERENCE]. A market-orientation and associated capabilities however can be built
through employment with a FIE. This set of capabilities enables these managers to make a
crucial contribution to local firms where they subsequently take on leadership roles.
We offer an empirical test based on a sample of executives in the pharmaceutical
industry in China, including both the domestic firms and those foreign invested firms. Our
statistical analysis based on 156 top executives of 89 Chinese pharmaceutical firms shows
that, as predicted, executives’ work experience with a FIE enhances a local firm’s market
orientation, which in turn enhances its performance.
The paper thus contributes by integrating two hitherto very separate lines of literature:
FDI spillovers and managerial strategic orientation. We provide a theoretical explanation of
an important effect through with FDI spillovers occur, and thus address the lack of solid
theoretical micro-foundations in this literature. We contribute to the strategic orientation
literature by showing the origins of strategic orientations in and their consequences for
organizational performance in a transition economy context.
The remainder of this paper is organized in the following way. We will start by briefly
reviewing extant research on spillovers of foreign investment, focusing specifically on the
4
micro-level effects reflected in managerial cognition of the top executives. We then develop a
set of hypotheses, and test them with survey data of top executives in a sample of the largest
Chinese pharmaceutical companies. Our regression results provide strong support for our
hypotheses. Finally, we conclude by discussing the findings and the implications of this study
to management theory and practice.
LITERATURE
Our theoretical arguments draw primarily on two streams of literature. The literature on
FDI spillovers contributes to our understanding of the micro-level effects by which foreign
and local firms interact, while the strategic orientations literature explains why mental models
may have a pivotal role in this process.
Micro Mechanisms of Spillovers of FDI
FIE are widely believed to create positive spillover effects that enhance local firms’
productivity, sales growth and exports. Some empirical studies support the existence of such
effects, yet others find contradictory effects. Thus reviews and meta-analyses suggest that
spillovers may have positive effects in some contexts, but this finding does not apply
universally (Görg and Strobl, 2001; Görg and Greenaway, 2004; Görg and Strobl, 2005;
Meyer and Sinani, 2009).
A major obstacle to advancing this line of work is the lack of solid micro-foundations,
including the social and cognitive processes by which local and foreign firms interact. This in
turn limits our ability to assess under which circumstances and in which contexts positive
5
spillover effects are likely to dominate over negative ones (Meyer, 2004; Driffield and Love,
2007). The most common arguments suggest that local firms may benefit from so-called
demonstration effects as they observe technologies in use by the foreign investors (Caves,
1972; Perez, 1997; Aitken and Harrison, 1999; Kosova, 2004), or they may benefit from
direct vertical linkages with the foreign investment firm (Lall, 1980; Belderbos, Capannelli,
and Fukao, 2001; Thompson, 2002; Javorcik, 2004).
Several authors have argued that a major benefit to local firms arises from employee
mobility because the capabilities that individuals acquire when working for an FIE add to the
capabilities of local firms for whom they work subsequently (Meyer, 2004, Spencer, 2008).
However, this claim is rarely supported by empirical evidence, apart from interview or survey
based studies (Patibandla and Petersen, 2001, Thompson, 2002). The only systematic study
we are aware of is Gerschenberg (1987), who provides evidence of employee movements in
Kenya. Other studies focus on the creation of new entrepreneurial firms by individuals trained
in the multinational. Markusen and Venebles (1999) offer a theoretical model the relationship
between the number of foreign-owned firms and the number of domestic firms arguing that,
under certain conditions, entry of foreign investors would trigger entry of new domestic firms
in vertically related industries. Görg and Strobl (2001) provide empirical evidence about this
effect.
The theoretical basis of these studies, moreover, assumes an increase in the local firms’
capabilities as a consequence hiring FIE-trained staff. Only few of the employees of FIE may
move on to work for local businesses. Yet, this small number of individuals may have a major
impact on the host economy if they proceed to lead major local enterprises (Meyer, 2004).
6
The literature does not delve into the micro-processes that lead to the increase in the
capabilities of local firms. Hence, we lack understanding of what exactly these executives
would contribute, and under which conditions these contributions benefit local firms.
Strategic Orientation
The benefits that local firms can attract from interaction with FIE depend on their own
motivation and capability to react to competitive threats and opportunities arising from the
presence of foreign investors (Meyer and Sinani, 2009). An important factor underlying this
motivation and capability is firm’s strategic orientation, that is its guiding principles that
influencing its behavior (ADD RERENCE). This strategic orientation often resides in top
executive’s mental models. The values and beliefs of the upper echelon often shape the
direction and outcomes of the whole organization (Hambrick and Mason, 1984). Early
research on strategic orientation attempts to develop a holistic construct of strategic
orientation, e.g., Venkatraman (1989) proposed a multi-dimensional construct, “Strategic
Orientation of Business Enterprises”, which he discusses in six dimensions: aggressiveness,
analysis, defensiveness, futurity, proactiveness, riskiness. Subsequent research focuses on
more specific types of strategic orientation, notably market orientation (Narver and Slater,
1990; Kohli and Jaworski, 1990; Kohli, Jaworski and Kumar, 1993) and entrepreneurship
orientation (Lumpkin and Dess, 1996).
Ample research has explored these aspects of strategic orientation, yet comparisons
between the different types of strategic orientation began only recently (Atuahene-Gima and
Ko, 2001; Noble, Sinha, and Kumar 2002; Zhou et al., 2005). The comparative approach
7
opens up an exciting and new research direction. It allows us to find answers to new research
questions, such as to what extent could the different strategic orientations coexist or do they
crowd each other out? If they coexist, what are the relative strength of one strategic
orientation versus another, given executives have limited cognitive capacity (Cyert and March,
1963; Ocasio, 1997)? Furthermore, would different strategic orientations have equal impact
on firms’ ability to benefit from interacting with foreign investors, and from employing
individuals trained in foreign investment firms? These questions require further research
investigations and are the focus of this study.
--------------------------------------------------------------
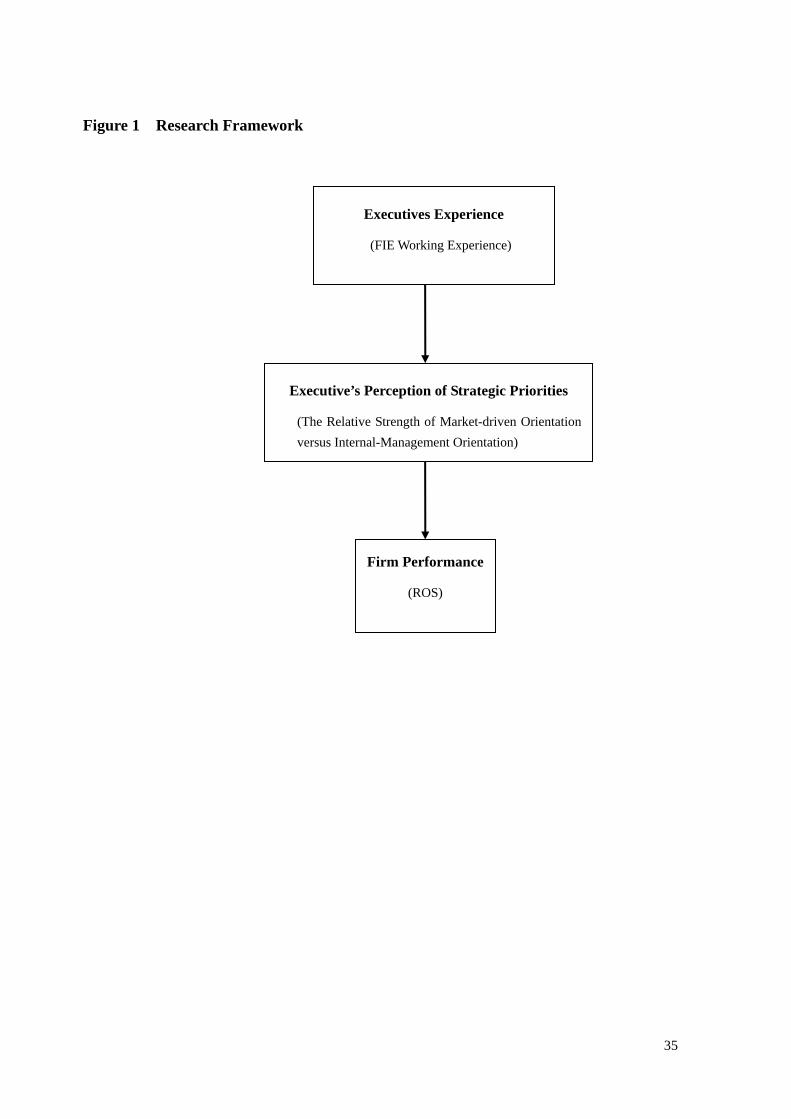
Please insert Figure 1 about here
--------------------------------------------------------------
HYPOTHESES DEVELOPMENT
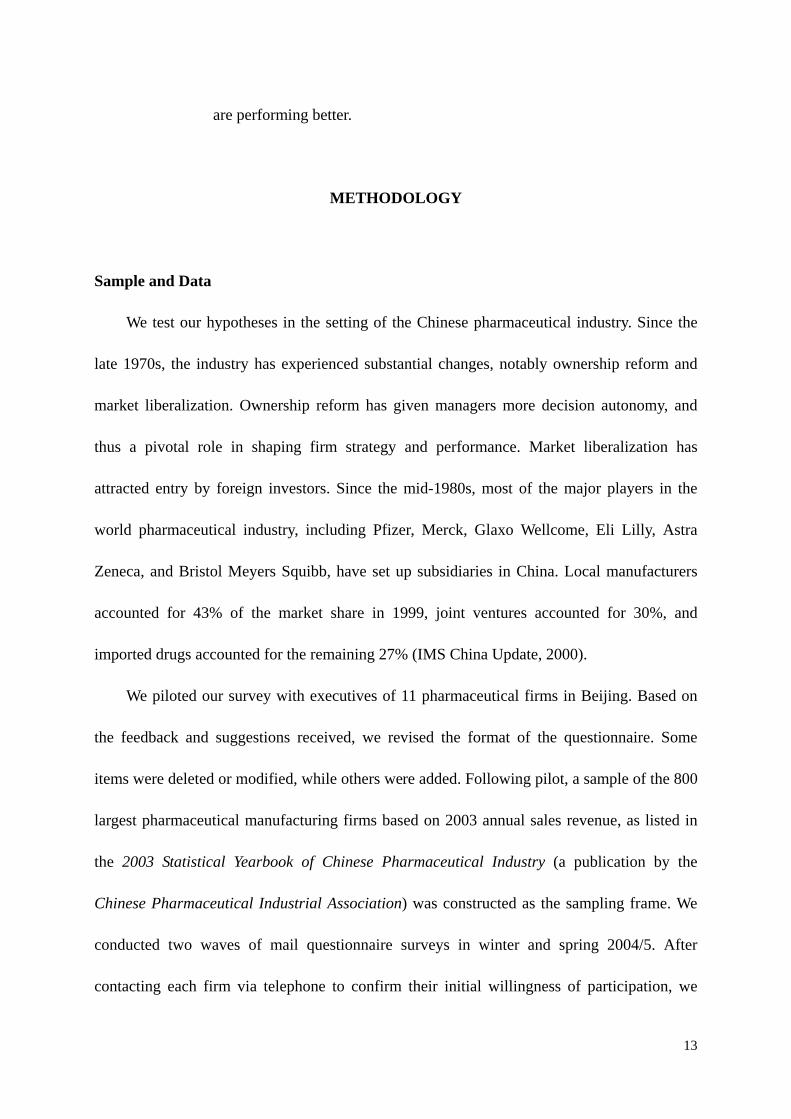
Figure 1 illustrates our analytical framework of this study, which consists of two parts.
The first part is to examine the link between executives’ work experience in foreign invested
companies and the strength of market-driven orientation at individual level. Second, we
examine the impact of the relative strength of top executive’s market-driven orientation on
firm performance. As emphasized in the management literature (Child, 1972; Hambrick and
Mason, 1984), firm’s strategic choices are made by the top executives who posses most of the
decision power, and whose cognition would have profound impact on the direction of firms’
strategic actions and organizational outcomes.
Executive Working Experience in Foreign Invested Enterprises
8
Knowledge is a fluid mix of framed experiences, values, contextual information, and
expert insights that provide a framework for evaluating and incorporating new experiences
and information (Davenport and Prusak, 1998). Within organizations, personal knowledge is
the main building block of more macro-level knowledge. Personal knowledge consists not
only of explicit knowledge but also of tacit knowledge (Polanyi, 1962). This tacit nature
arises from what Nonaka (1994) called “knowledge of experience”, i.e. knowledge that has
evolved with the specific individual’s education and experiences. Organizational knowledge
integrates such specific personal knowledge, and thus is also coevolving with the career
development paths of the individuals forming the organization.
We focus on executive work experience in foreign invested enterprises that may be
transferred via executive mobility. While previous studies mainly considered the role of
engineers and R&D staff (Kim and Marschke, 2005; Oettl and Agrawal, 2008), executives are
responsible for the overall strategy, behavior and performance of firms. When an executive
moves from one company to another, his/her knowledge accumulated from the previous
career experience affects his/her values and beliefs and thus his/her perception of the industry
(Spender, 1989), and the ways of doing business, including the perception of strategic
priorities for firms to achieve organizational objectives (Prahalad and Bettis, 1986).
Two types of strategic orientations are considered particularly relevant to executives’
perception of strategic priorities, namely those related with keeping pace with external market
and actively engaging in competition (e.g. brand building, product portfolio adjustment etc.),
and those related with internal administration (e.g. human resource management and inter-unit
coordination) (Bourgeois, 1980; Eisenhardt and Bourgeois, 1988; Bowman and Ambrosini,
9
1997). The two strategic orientations have been labeled “market-driven orientation”1 and
“internal-management orientation”. They are not two ends on one spectrum, but rather, two
dimensions in top executive’s perception of strategic priorities (Wright, Kroll, Pray and Lado,
1995). The two-dimensionality is reflected in the fact that a decrease in the strength of one
strategic orientation does not necessarily mean an increase in the strength of another.
Moreover, some managers could perceive both unimportant, relying instead on their existing
competencies, or simply “muddling through”, while others could perceive both as very
important, reflecting a dual focus (Wright et al., 1995). While both strategic dimensions
compete for top executive’s attentions, among other things, the relative importance of them as
revealed in top executive’s assessment of firm’s strategic priorities often indicates which
dimension would received more attention from the top executives. This is also likely to lead
to more favorable resource allocation and organization support on the preferred dimension.
Hence, our study does not investigate the market-driven orientation and internal management
orientation separately, but examines their relative strength.
The notion of “market-driven orientation” is particularly relevant as an indictor for
managerial spillover effect of inward FDI on firms in transition economies undergoing a
process of institutional change. For instance, local firms in China experienced market
liberalization processes since 1978, and thus have seen major changes in their institutional
environment. Foreign invested enterprises, including joint ventures or wholly owned
subsidiaries of the MNCs subsidiaries, not only created many job opportunities for local
1 We used the notion of “market-driven orientation” to avoid possible confusion with the measurement scale of market orientation (Narver and Slater, 1990; Kohli, Jaworski and Kumar, 1993). The difference is that the “market-driven orientation” includes both reactive actions to meet existing customers’ needs and proactive actions as long as they are related with firm’s efforts directed to the external market.
10
Chinese, but also introduced new business models. They usually position themselves in the
higher-end market segment, i.e. producing and selling products with higher technology
content developed by the foreign investors. Hence, the FIEs often do not have cost advantage,
but critically depends on marketing to compete with local firms offering cheap and often
reasonably effective products. Hence, executives with working experience in the FIEs usually
are more aware of the importance and the capabilities that are required to win in a competitive
market. This leads to our first hypothesis.
Hypothesis 1a. Executive’s working experience in FIEs is positive associated with the
relative strength of market-driven strategic orientation.
Among top executives, the CEO occupies a special position. He or she not only needs to
attend to internal management issues of the firm, but also assumes a unique role as the
representative of the firm. Thus, a CEO typically has to interact with important external
stakeholders, including government officials, executives of financial institutions and peer
companies, and leading customers, to secure the resources that are needed for firm survival
and growth.
For firms in transition economies, market liberalization means that they have to win in
market place. The increased level of firm’s external dependence directly creates pressure on
CEOs, who are accountable for their firm’s performance. Hence, we expect that the positive
impact of FIE work experience on market-driven orientation would be stronger for CEOs.
11
Hypothesis 1b. The positive relationship between their work experience in FIEs and the
relative strength of market-driven strategic orientation is stronger among
CEOs than among other executives.
The Relative Strength of Strategic Orientations and Firm Performance
Both market-related and internal aspects of management may be important for firms to
achieve better performance. Yet, top executives the constraint of limited time, energy and
cognitive capacity, which limits the attention they can give each strategic issue (Ocasio, 1997).
As a result, what matters is not only whether an issue is important or not, but also the relative
importance of the issue when compared with others. Hence, issues that are perceived to be
more important are likely to receive more organizational support and have more impact.
Which strategic orientation would most enhance performance often depends on the
specific context, including environmental conditions and the goals of the firm. In emerging
economies, attention to market-related aspects, including building strong brand and company
reputation, adjusting product portfolio, improving market share of key products, and
monitoring market growth opportunities, is particularly important to achieve profitability
(REFERENCE REQUIRED). This is for two reasons. First, technology and regulatory
policies have been changing rapidly. Keeping pace with the changing environment is pivotal
for firms to survive and to gain competitive advantages. With regard to technology, innovative
ideas often come from market demand and their success is often determined by market
acceptance (Von Hippel, 1988). With regard to regulation, business opportunities (e.g.
separation of OTC drugs from prescription drugs in the pharmaceutical industry) emerge with
12
regulatory change. Hence firms that monitor market trends closely are often better prepared to
seize opportunities.
Second, when there are a larger number of competitors, price margins become slimmer.
Firms that could adjust their product portfolio in response to market demand and competition
dynamics could often steer them away from the niches with excessive number of competitors
and slimmed margin (Dawar and Chattopadhay, 2002; Meyer and Tran, 2006). Moreover,
investment in brands and in sales and marketing may also allow firms to reach larger
customer bases and thus achieve economies of scale, which is critical for low-end competitors.
Such a market focus can thus be effective means to achieve better firm performance, yet only
if they are treated as strategic priorities by top executives, and receive substantial support
including monetary investment and personnel allocation.
Hypothesis 2a. Firms with executives that display a stronger market-driven strategic
orientation are performing better.
Although each top executive would have certain influence on the formation and
implementation of firm strategy, particularly in the functional area that they are in charge of,
CEOs usually have the final call and have more influential power. Hence we also expect that
those firms whose CEOs have stronger market-driven orientation would be related with better
performance.
Hypothesis 2b. Firms with CEO that displays a stronger market-driven strategic orientation
13
are performing better.
METHODOLOGY
Sample and Data
We test our hypotheses in the setting of the Chinese pharmaceutical industry. Since the
late 1970s, the industry has experienced substantial changes, notably ownership reform and
market liberalization. Ownership reform has given managers more decision autonomy, and
thus a pivotal role in shaping firm strategy and performance. Market liberalization has
attracted entry by foreign investors. Since the mid-1980s, most of the major players in the
world pharmaceutical industry, including Pfizer, Merck, Glaxo Wellcome, Eli Lilly, Astra
Zeneca, and Bristol Meyers Squibb, have set up subsidiaries in China. Local manufacturers
accounted for 43% of the market share in 1999, joint ventures accounted for 30%, and
imported drugs accounted for the remaining 27% (IMS China Update, 2000).
We piloted our survey with executives of 11 pharmaceutical firms in Beijing. Based on
the feedback and suggestions received, we revised the format of the questionnaire. Some
items were deleted or modified, while others were added. Following pilot, a sample of the 800
largest pharmaceutical manufacturing firms based on 2003 annual sales revenue, as listed in
the 2003 Statistical Yearbook of Chinese Pharmaceutical Industry (a publication by the
Chinese Pharmaceutical Industrial Association) was constructed as the sampling frame. We
conducted two waves of mail questionnaire surveys in winter and spring 2004/5. After
contacting each firm via telephone to confirm their initial willingness of participation, we
14
mailed out the questionnaire packages to 403 firms in the first wave survey, and adding
another 223 firms in the second wave. Hence the total number of firms to which we mailed
questionnaire packages was 626. Each package contained a cover letter, three questionnaires
and three self-addressed pre-paid envelopes. The cover letter was endorsed by the Chinese
Pharmaceutical Industrial Association and a very prestigious research university in China.
Each letter was addressed to the name of the CEO or President of the respective company.
The front page of each questionnaire explained the research objectives and provided a
definition of top management team (TMT) as “a group of top executives in the firm that
regularly participate in important decision-making, which would have substantial influences
on the firm”. The opening paragraph also stated the confidentiality of data provided by each
respondent and opportunity for the respondent to receive a feedback report after data were
collected and analyzed. After sending out the questionnaire packages, we followed up by
three reminders via telephone 7, 14 and 21 working days after, as suggested by Dillman
(2000). Firms that indicated that they had not yet received the package, received the
questionnaires by FAX. Moreover, we sent electronic version of the questionnaire to about 15
firms that asked for it. To reduce measurement error, we checked consistency among team
members on their responses to those fact-based items (e.g. firm age, year in which the current
CEO took position etc.), and also compared their reported 2003 sales revenue of the firm with
archival data immediately after we received returned questionnaires. In cases when further
correction or clarification is needed, we called the respondents to check the relevant part of
information. This procedure not only allowed us to correct some errors, but also gave us a
chance to directly interact with the executives and check if the mail survey was filled out by
15
himself or herself.
Altogether, we obtained 192 responses from 97 firms. Missing data or inadequate
qualification as TMT member reduced the final sample to 156 valid responses from 89 firms.
These responses included 50 respondents of 32 firms from the first wave and 106 respondents
of 57 firms from the second wave. The effective response rate was 14.2% (89/626), which is
similar to the typical response rate of 10% to 12% for mail surveys to senior executives as
reported in Hambrick, Geletkanycz and Fredrickson (1993: p.407). The 89 firms in the final
sample were located in 26 (out of the 31) administrative provinces/regions in mainland China.
Their average sales revenue was approximately 66.7 million US dollars. While a common
concern about research on TMTs is about using single respondent per firm, we managed to
collect multiple responses from about half of the firms. Of 89 firms in the final sample, 49
firms had single respondents, 13 had two respondents, and 27 had three respondents.
We tested for non-response bias and for significant differences between the respondents
in the two waves of the survey. The proportional breakdown of the 89 firms by province and
ownership type, were not significantly different from those of the initial 800 firms. We also
compared the means of three firm characteristics (firm age, number of employees in 2003 and
annual sales revenue in 2003) between the respondent firms from the two waves. Results of
the Wilcoxon rank sum W-test show that there are no significant differences on these
characteristics between the respondents of the two waves.
In addition to the questionnaire survey data, we collected archival data to measure firm
performance and registered ownership type. For firm performance, we collected monthly data
of sales and profits for the 89 firms during July 2004 to June 2005, and their annual sales and
16
profits data in 2003. The data was made available by TianShiMei Co., which is an information
service firm specialized in pharmaceutical industry, and is affiliated with the State Food and
Drug Administration Registered ownership type of each firm in 2003 was obtained from the
2003 Statistical Yearbook of Chinese Pharmaceutical Industry published by the former State
Economic and Trade Council.
Dependent Variable
Firm profitability. Firm performance was measured by the ROS of each firm during July
2004 to June 2005, i.e. the aggregated monthly profits divided by the aggregated monthly
sales of each firm over the 12 months period. It reflects the profitability of the firm. The ROS
measure is consistent with questionnaire respondents’ assessment of the perceived strategic
priorities of different strategic aspects as means to achieve firm profitability.
Explanatory Variables
The main explanatory variable of this study is the relative strength of executives’
market-driven orientation in their perception of the strategic priorities for their firms. It is
derived by comparing the absolute strength of executive’s market-driven orientation with that
of internal-management orientation. The two strategic orientations were identified based on
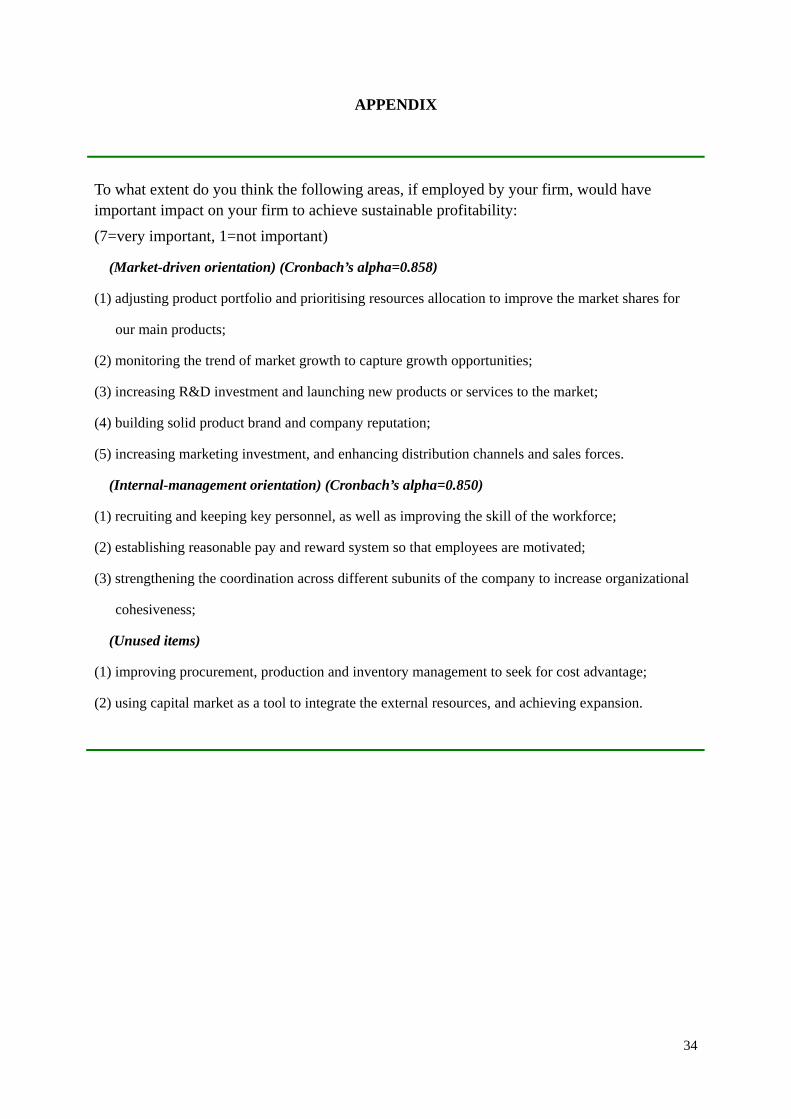
executive’s rating of the perceived strategic importance of ten areas for their firms to achieve
sustainable profitability. The ten areas (please refer to the appendix) were adapted from
previous studies (Bourgeois, 1980; Eisenhardt and Bourgeois, 1988) on the policy areas top
executives often engage in. Changes to the items were made to accommodate the feedback
from the top executives received during the pilot test. Of the ten policy items, five items
reflected executive’s market-driven orientation, three items reflected the internal-management
17
orientation, and two items were dropped from the analysis of the strategic orientations
because their ambiguous relationship with the above two factors.
Absolute strength of executive’s market-driven orientation. It was measured by the
average of the rating scores on the following 5 items, in terms of their perceived importance
to achieve sustainable firm profitability (7=very important, 1=not important): (1) adjust
product portfolio, and prioritise resources allocation to improve the market shares for main
products; (2) monitor the trend of market growth to capture growth opportunities; (3) increase
R&D investment and launch new products or services to the market; (4) build solid product
brand and company reputation; (5) increase marketing investment to enhance distribution
channels and sales forces. Cronbach’s alpha of the five items was 0.858.
Absolute strength of executive’s internal-management orientation. It was measured
by the average of the rating scores on the following 3 items, regarding their perceived
importance to achieve sustainable firm profitability (7=very important, 1=not important): (1)
recruit and keep key personnel, as well as improve the skill of the workforce; (2) establish
reasonable pay and reward system to keep employees motivated; (3) strengthen coordination
across different subunits of the company, and increase organizational cohesiveness.
Cronbach’s alpha of the three items was 0.850.
Relative strength of executive’s market-driven orientation. It was measured by the
arithmetic difference between the absolute strength of executive’s market-driven orientation
and the absolute strength of their internal-management orientation, i.e. the relative strength of
market-driven orientation equals the absolute strength of market-driven orientation minus the
absolute strength of internal-management orientation.
18
FIE working experience. It is a dummy variable, which was coded as 1 when the
respondent met either one of the following two conditions: (a) he/she currently works in a
foreign invested enterprise (FIE); (2) he/she reported prior working experience in a foreign
invested enterprise. Foreign invested enterprises include both international joint ventures and
wholly owned subsidiaries of foreign companies.
CEO dummy. It is coded as 1 when the executive holds the current CEO position by the
time of our survey, and 0 for other executives.
Control Variables
For testing the antecedents of the relative strength of executive’s market-driven
orientation, we first controlled for the absolute level of their internal-management orientation.
We also included those variables that are related with executive’s personal background, i.e.
age, gender (with 1=male, 0=female), number of years since he/she took the current executive
position, education level (coded based on the reported final degree of the executives, with
0=higher school graduate or equivalent; 1=college graduate; 2=university undergraduate
degree; and 3=master’s degree or above), industry tenure (measured by the working
experience of each executive in number of years in the pharmaceutical industry), and a
dummy variable for those executives whose primary functional background is in
marketing/sales (1= the executive reported longest working experience in the functional area
of marketing/sales among the ten listed functional areas, and 0=otherwise)
We included several firm level control variables, including (1) firm size, which was
measured by the reported employee number of the firm in 2003, (2) firm age, measured by the
number of years since the reported founding year of the firm to the end of 2004; (3) past firm
19
performance, which is the ROS of the firm in 2003; and (4) registered ownership type of the
firm in 2003, which has five broad categories based on the classification of the State
Administrative Bureau of Industry and Commerce, including state and collectively owned
enterprises, foreign invested companies, privately owned enterprises, share holding
companies and all else. Similar set of controls variables, including executive’s personal
characteristics and firm characteristics, are also used in testing the performance impact of
executive’s strategic orientation.
Analytical Procedure and Model Specification
We use Ordinary Least Squares (OLS) linear regression with heteroscedasticity robust
standard errors to test the hypotheses. To test the effect of executive’s knowledge background
on the relative strength of their market-driven strategic orientation, we first entered all the
control variables into the baseline model (model 1). We then entered the dummy variable for
FIE working experience in model 2 to test H1a. In model 3, we add CEO dummy and the
interaction term between FIE working experience and CEO dummy to test H1b.
To test the performance impact of executive’s strategic orientation, we used firm ROS
during July 2004 to June 2005 as the dependent variable. Models 4-9 use the full sample of
156 executives, of which 3 have missing values on performance, hence N=153. Model 4 is the
baseline model with control variables only. The absolute strength of internal-management
orientation was entered in model 5, the absolute strength of market-driven orientation entered
in model 6. And both were entered simultaneously entered in model 7. Hence, models 4-7 test
the separate effect of the two types of strategic orientation, i.e., market-driven orientation and
internal-management orientation, on firm performance. Model 8 controls for internal
20
management orientation, and tests for the effect of the relative strength of executive’s
market-driven orientation, as hypothesized in H2a. Model 9 further tests H2b by adding the
CEO dummy and its interaction term with the relative market-driven orientation.
Five variables that were entered into the regression models were transformed by the
natural logarithm of their corresponding raw form: executive’s age, their industry tenure,
tenure in current executive position, firm age, and firm size. The logarithmic transformation
was used to normalize these variables that might have skewed distribution (Wooldridge, 2003:
p.188). All regression models based on the full sample (i.e., models 1-6) use clustering on
executive’s firm affiliation to control for possible non-independence among executives
belonging to the same firm. Besides, the Variance Inflation Factors (VIFs) were computed for
each independent variable after running the regression models to detect if multicollinearity
was of concern. These VIF values were well below the common cut-off threshold of 10
(Cohen, Cohen, West and Aiken, 2003: p.425), the highest VIF value being 2.60.
RESULTS
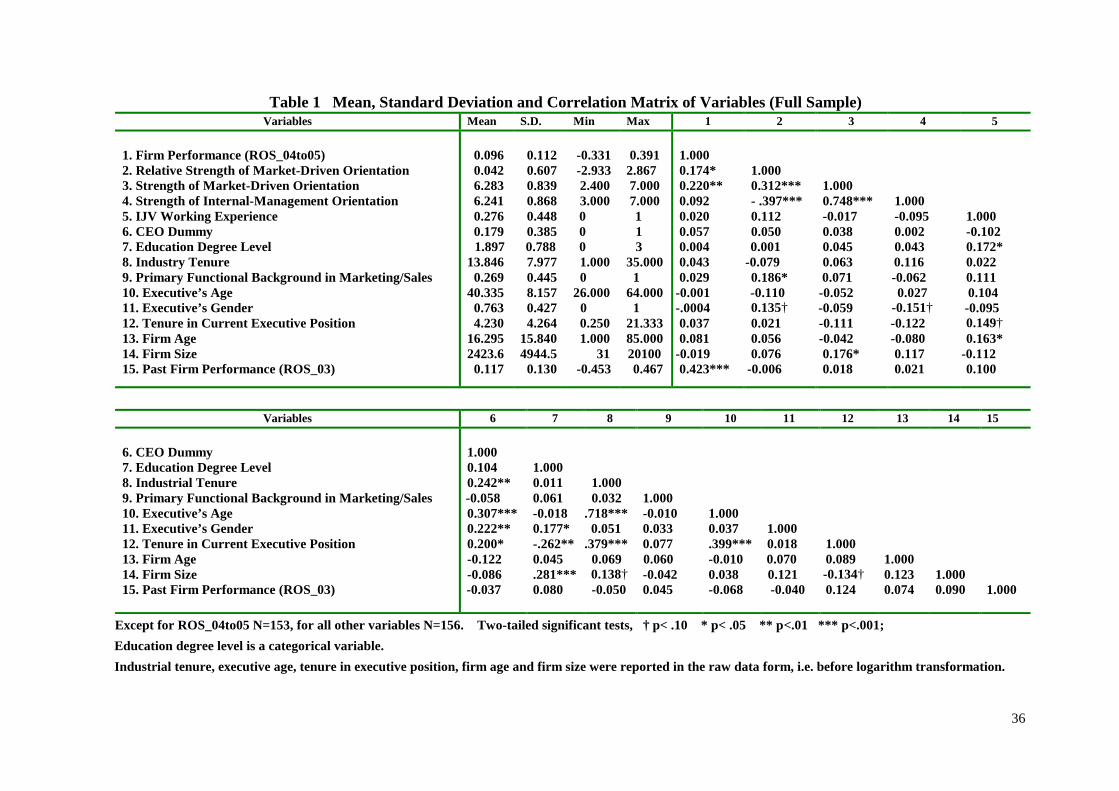
Table 1 reports the descriptive statistics of the variables, including means, standard
deviations, and correlation coefficients. Although the sample mean of the absolute strength of
market-driven and internal-management orientations are close, for each executive, the relative
strength of executive’s market-driven orientation ranges between -2.93 to + 2.87. Of the 156
top executives, fifty-five indicated stronger market-driven orientation, fifty-four indicated
stronger internal-management orientation, and the remaining forty-seven reported equally
strong on the two strategic orientations. The average age of the 156 executives was 40, and
21
about 76.3% of them are male. Moreover, 82 executives reported bachelor’s degree as their
final degrees, 33 executives each with postgraduate degrees (including MBA, other master’s
degree and doctoral degree) and college graduates, the remaining eight were higher school
graduates or equivalent. Hence, the mean education degree is close to university
undergraduate degree. On average, the top executives also reported about 14-year industry
tenure in the pharmaceutical industry. 27% (i.e. 42 out of the 156 executives) reported
primary functional background in marketing and/or sales. And 28% (i.e. 43 out of the 156
executives) were either currently working in a FIE or had worked in FIEs in the past. The
average profitability was 0.096, with a range form -0.331 to + 0.391. The correlation matrix
shows that the absolute strength of market-driven orientation and the absolute strength of the
internal-management orientation are positively correlated (r=0.748, p<0.001), suggesting that
when a respondent’s rating on one strategic orientation increases, his/her rating on the other is
also likely to increase. The positive and significant correlation coefficient also indicates that
those respondents who rated high on market-driven orientation also rated high on the
internal-management orientation. The consistency between the ratings of the two types of
strategic orientation further means that those rated lower on the absolute strength of
market-driven orientation did not necessarily have weaker relative strength of market-driven
orientation, because their ratings on the internal-management orientation was also likely to be
lower. Hence the relative strength between the two tells us additional information about
executive’s relative preference between the two strategic orientations. When the relative
strength is positive, executives exhibit stronger market-driven orientation versus the
internal-management orientation. And when it equals zero, the two types of strategic
22
orientation are equally strong.
--------------------------------------------------------------
Please insert Table 1 about here
--------------------------------------------------------------
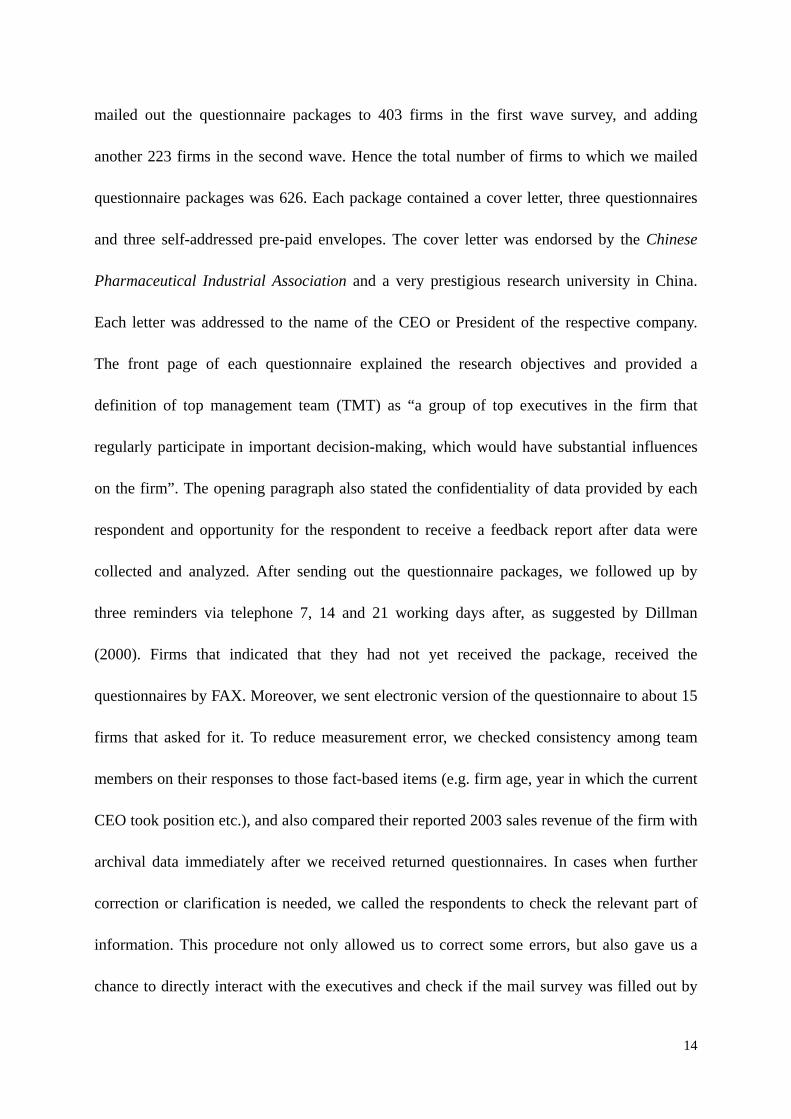
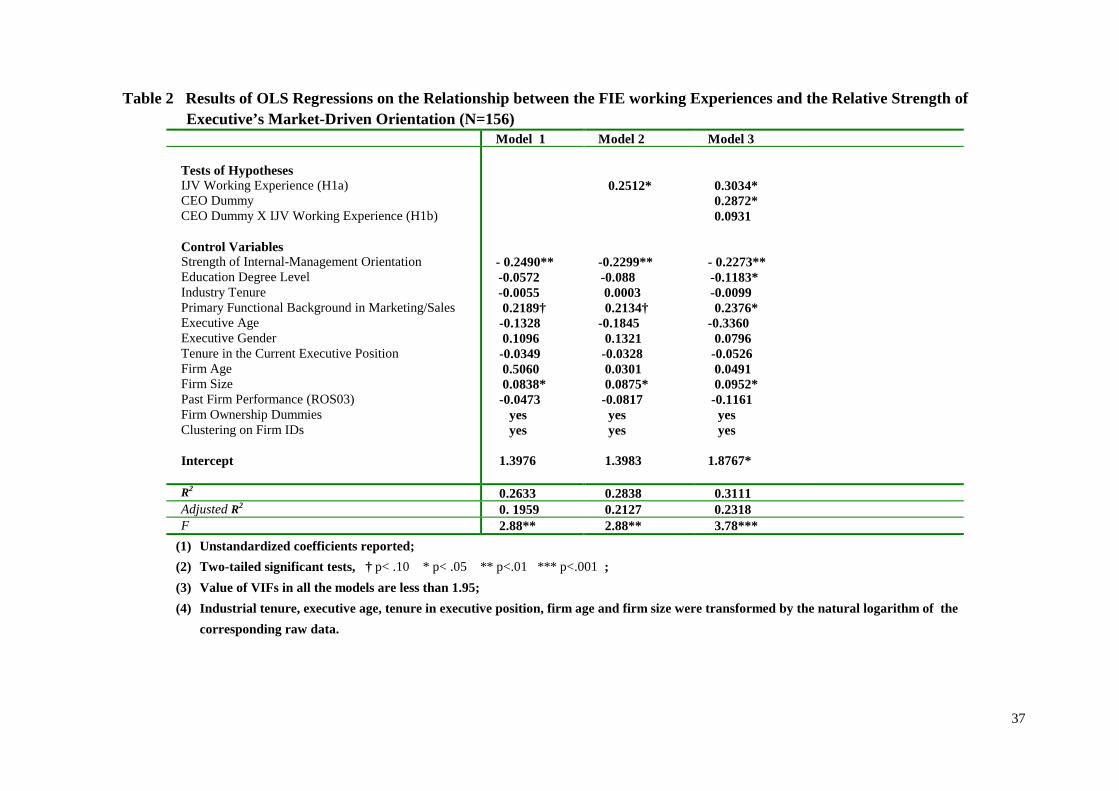
Table 2 presents the results of regression analysis for the effect of executives’ work
experience on the relative strength of their market-driven orientation. Model 1 is the baseline
model, model 2 tests hypothesis 1a, which states that executives with working experiences in
FIEs will display stronger market-driven orientation versus the internal-management
orientation. Model 3 tests H1b, which further predicts that the positive effect will be stronger
for CEOs. As shown in Table 2, the coefficient of the FIE working experience dummy are
positive and significant both in model 2 and model 3 (p<0.05). So H1a was strongly
supported. However, in model 3, we found that, while the coefficient for the main effect of the
CEO dummy is positive and significant (p<0.05), the coefficient for the interaction term
between the CEO dummy and FIE working experience was positive but not significant. Hence,
H1b was only partly supported.
--------------------------------------------------------------
Please insert Table 2 about here
--------------------------------------------------------------
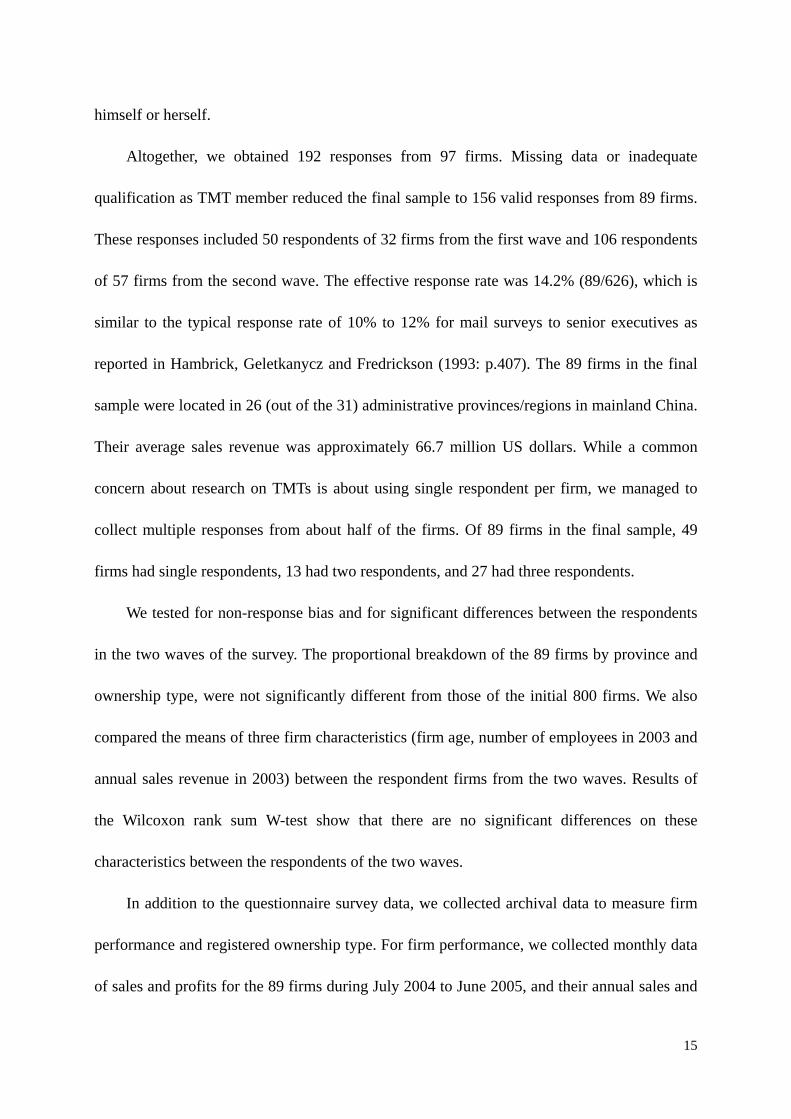
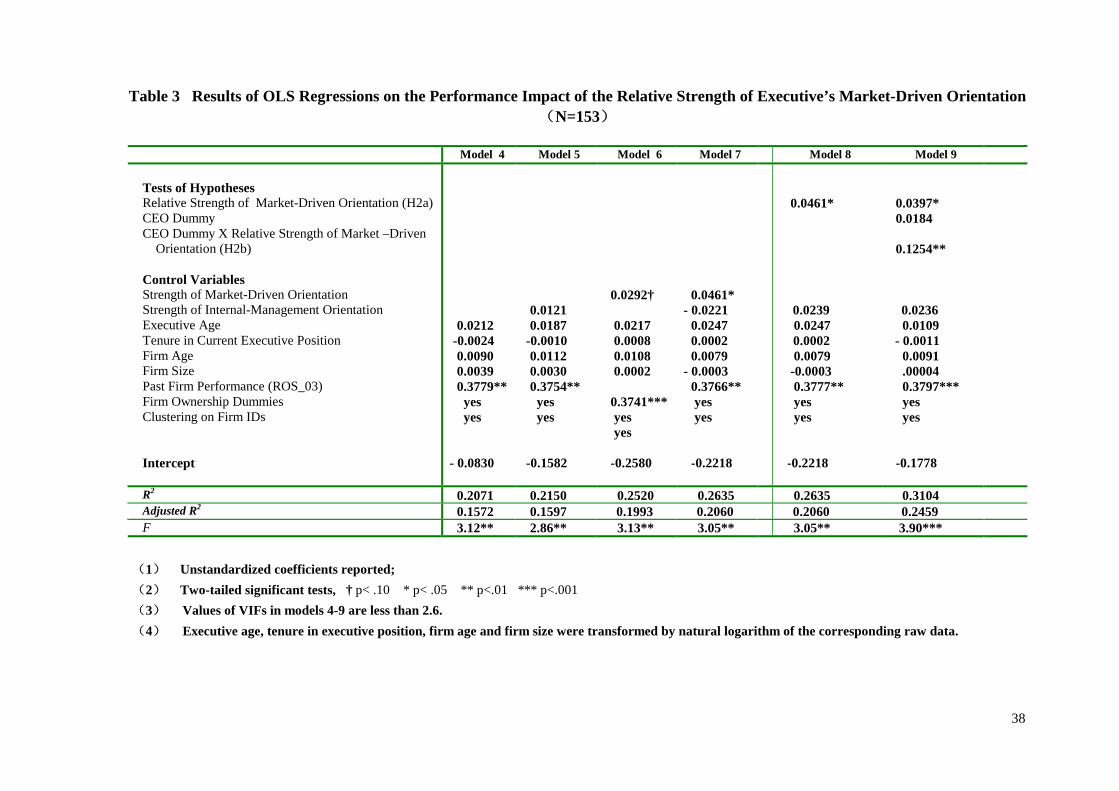
Table 3 reports the results of regression analysis for the effect of executive’s strategic
orientation on firm performance. Hypothesis 2a states that executives with stronger
market-driven orientation versus internal-management orientation are positively associated
with better firm performance. As shown in model 8 and 9, the coefficient of the relative
23
strength of executive’s market-driven orientation is positive and significant (p<0.05). Hence
H2a is supported. Acknowledging that CEOs usually have more influences on firm strategy
and performance than other executives, Hypothesis 2b states that for CEOs, the positive
impact of the relative strength of market-driven orientation on firm performance will be
stronger. As shown in model 9, the coefficient of the interaction term between the relative
strength of market-driven orientation and the CEO dummy is positive and highly significant
(p<0.01). Hence H2b is strongly supported.
Because the relative strength of market-driven orientation is based on the difference
between the absolute strength of market-driven orientation and internal-management
orientation, it is also of interest to analyze the effect of each of the two types of strategic
orientation on firm performance separately. As reported in Table3, models 5-7 further show
that while the absolute strength of executive’s market-driven orientation was positively and
significantly associated with firm performance (p< 0.05 in model 6 and p<0.10 in model 7),
the effect of the absolute strength of their internal-management orientation was not significant
(models 5 and 7).
--------------------------------------------------------------
Please insert Table 3 about here
--------------------------------------------------------------
Some earlier studies found that when facing different choices, firms with dual focus
(Wright etc. 1995) or ambidexterity (He and Wong, 2004) outperformed other types of firms.
Therefore, we also entered the absolute value of the difference between market-driven
orientation and internal-management orientation as the explanatory variable and tested for its
24
effect on firm profitability. If the ambidexterity hypothesis is to be supported, the coefficient
of the absolute difference between the two strategic orientations should be negative. Because
it would then support the expectation that when firms are balanced on the two strategic
orientations (correspondingly the difference should be zero), firm profitability would be
higher than the cases when the executives of the firms exhibited stronger strategic orientation
in any one of the two strategic orientations (which would correspond to the absolute value of
the difference larger than zero). However, the coefficient based on the analysis of our sample
was not significant2, hence the ambidexterity hypothesis was not supported in this sample.
DISCUSSION AND CONCLUSION
We have examined how experience working for an FIE shapes top executive’s strategic
orientation, and thus the performance of the local firms that they lead. Our main empirical
finding based on a questionnaire survey based on 156 top executives in 89 Chinese
pharmaceutical firms supports the propositions that FIE experience enhances
market-orientation, which in turn helps their firms to attain higher profitability (measured by
ROS). Adopting a knowledge-based view of firms (Kogut and Zander, 1992; Grant, 1996),
we further investigated the link between executive’s working experience and the relative
strength of their market-driven orientation. Results show that executive’s working experience
in FIEs has positive influence on the relative strength between the two types of strategic
orientation. That is, those executives with working experience in foreign invested enterprises
display stronger market-driven orientation than internal management orientation.
2 Detailed results are available from the authors upon request.
25
Implications to Theory and Public Policy
We proposed that a crucial channel for foreign investment to influence local firms is via
the migration of trained managerial staff from FIE to leadership positions in local firms. This
channel had variously been suggested in the literature (Gerschenberg, 1987; Meyer, 2004;
Spencer, 2008), yet its micro-foundations had not yet been analyzed theoretically or
empirically. We propose that a crucial aspect of this effect is influence of experience working
for an FIE on future executive’s cognition of their business environment, and thus the
strategic orientation they adopt in leadership roles in local firms. We have tested this argument
with two propositions linking respectively FIE work experience to market orientation, and
market orientation to firm performance. Both have been supported in our empirical analysis.
Beyond its contribution to theory, this finding has practical implications for policy
makers assessing the likely effect of inward foreign investments. More specifically, it
provides support to the positive impact of foreign investment in emerging markets. Previous
studies already found support for the positive effect especially in transition economies (Görg
and Strobl, 2001; Buckley, Clegg and Wang, 2002; Meyer, 2004). It is also widely accepted
that foreign direct investment brings capital and technology, both of which are bottlenecks for
economic growth in emerging markets. However, most studies adopted the approach of
productivity analysis, which directly examined the presence of FIE on local firms’
productivity (Kosova, 2004; Wei and Liu, 2006; Tian, 2007; Chang and Xu, 2008). This study
adds an important complementary effect by showing the positive impact of FIE via human
resource development, i.e. managers with working experience in FIEs developed stronger
market-driven orientation, which is associated with beneficial firm performance.
26
This study also yields new insights for the strategic management literature. The
comparative approach to strategic orientation reflects the logic of an attention-based view of
strategy (Ocasio, 1997), i.e. different strategic issues compete for top executive’s attention
and those perceived to be relatively more important are more likely to have more substantial
impact on firm behavioral and performance. Adopting a comparative approach in studying
manager’s strategic orientations in their perception of strategic priories, this study also allows
us to understand the cognitive basis of how strategic choices (Child, 1972; 1997; Peng, 2003)
are made in a radically changing environment.
Putting the strategic orientations into context, i.e. the empirical setting of this study -
Chinese pharmaceutical industry, which has been undergoing dramatic transition from central
planning economy to market economy, the market-driven strategic aspects are relatively new
to the executives in the field, hence, in a way, the relative strength of market-driven
orientation serves as an indicator of managerial leaning regarding how to compete in a market
economy mode. In extant strategic management literature, learning is often studied at firm
level and studied with a behavioral research approach. This study examines strategic
orientation based on top executive’s perception of strategic priorities. Hence it tries to shed
light on the cognitive mechanism of learning at individual level, which is an equally
important aspect of organizational learning (Argote, 1999).
Limitations and Extensions
This study also has limitations in several aspects. Future research in these aspects would
deepen our understanding of the formation and consequences of manger’s strategic
orientations. The first limitation is that the analysis is based on one industry in one country
27
only. Hence the generalizability of the finding is subject to tests in future studies. Our finding
that the relative strength of top executive’s market-driven orientation versus
internal-management orientation is positively related with firm profitability, might also be
specific to the transition context. In other words, it is possible that in other contexts (e.g. other
countries or the same country in other development stages), relatively stronger
internal-management over market-driven orientation might be more preferable, or
ambidexterity on both strategic orientations is found to be leading to success. Again, although
the finding might be sensitive to the context, the comparative approach of studying managers’
strategic orientation adopted in this study is applicable to studies in other settings.
In interpreting the results, caution is also needed that a positive relationship between the
relative strength of market-orientation and firm profitability does not mean market-driven
orientation is good and internal-management orientation is bad. As shown in models 5-7 in
Table 3, it only suggests that market-orientation was significantly and positively related with
firm profitability, whereas internal-management orientation was not. To further assess the
performance impact of the strategic orientations, future study could try to use different
measures of performance to test if top executive’s internal management orientation matters.
One possibility is to use lagged firm profitability over several years to see if it takes longer for
internal management orientation to take effect. Another is to use different performance
indicators, such as firm growth and employee satisfaction, to test the effect of the internal
management orientation.
Conceptually, our study focused on a specific type of managerial spillover, namely the
contribution of individuals trained in FIEs that subsequently assume leadership roles in role
28
firms. However, this effect is likely to be complemented by movements of rank-and-file
employees in critical functions such as marketing and finance, and by individuals leaving an
FIE to set up their own entrepreneurial businesses. Future research may explore these various
types of contributions individuals trained in FIEs make in the host economy. Moreover, if
such contributions are important, it would also be important to further investigate the
determinants of mobility of employees between foreign and locally owned firms.
Conclusions
To sum up, this study shows that in the setting of a transitional economy, i.e. the Chinese
pharmaceutical industry, when top executives, particularly CEOs, have experience in FIEs,
they develop stronger market-driven orientation (relative to internal-management orientation),
which in turn helps their firms to perform better. Hence, our study provides direct and
micro-level evidence on the managerial spillovers from FDI in emerging markets.
More generally, our study opens the black box of firms, which are the usual unit of
analysis for spillover studies. By focusing on managers in pivotal roles, we illustrate the
importance of individuals in the process of realizing spillovers from foreign investors.
29
REFERENCES
Allmendinger, J. and Hackman, J.R. 1996. Organizations in changing environments: The case of East German symphony orchestras, Administrative Science Quarterly 41: 337-369. Aitken, B.J. and Harrison, A.E. 1999. Do domestic firms benefit from direct foreign investment? Evidence from Venezuela, American Economic Review 89(3), 605-618. Argote, L. 1999. Organizational learning: creating, retaining and transferring knowledge. Boston: Kluwer. Atuahene-Gima, K. & Ko, A. 2001. An empirical investigation of the effect of market orientation and entrepreneurship orientation alignment on product innovation. Organization Science, 12(1): 54-74. Belderbos, R., Capannelli, G. and Fukao, K. 2001. Backward vertical linkages of foreign manufacturing affiliates: Evidence from Japanese multinationals, World Development 29: 189-208. Bourgeois, L.J. III 1980. Performance and consensus. Strategic Management Journal, 1: 227-248. Bowman, C. and Ambrosini, V. 1997. Perceptions of strategic priorities, consensus and firm performance. Journal of Management Studies, 34(2): 241-258. Buckley, P., Clegg, J. & Wang, C. 2002. The impact of inward FDI on the performance of Chinese manufacturing firms. Journal of International Business Studies, 33: 637-655. Caves, R.E. 1974. Multinational firms, competition and productivity in host-country markets. Economica, 41(162): 176-193. Chang, S. & Xu, D. 2008. Spillovers and competition among foreign and local firms in China. Strategic Management Journal, 29(5): 495-518. Child, J. 1972. Organizational structure, environment, and performance: the role of strategic choice. Sociology, 6: 1-22. Child, J. 1997. Strategic choice in the analysis of action, structure, organizations and environment: retrospect and prospect. Organization Studies, 18(1): 43-76. Cohen, J., Cohen, P., West, S. G., and Aiken, L. S. 2003. Applied multiple regression/correlation analysis for the behavioral sciences (3rd ed). Lawrence Erlbaum Associates, Publishers.
30
Cyert, R. M. and March, J. G. 1963. A behavioral theory of the firm. Englewood Cliffs, N.J.: Prentice-Hall. Davenport, T.H. and Prusak, L. 1998. Working knowledge. Cambridge, MA: Harvard University Press. Dawar, N. and Chattopadhay, A. 2002. Rethinking marketing programs for emerging markets, Long Range Planning 35, 457-474. Dillman, D. A. 2000. Mail and internet surveys: the tailored design method (2nd ed.). John Wiley and Sons. Eisenhardt, K. M. and Bourgeois, L.J. III 1988. Politics of strategic decision making in high-velocity environments: toward a midrange theory. Academy of Management Journal, 31(4): 737-770. Gerschenberg, I. 1987. The Training and Spread of Managerial Know-how, A Comparative Analysis of Multinationals and Other Firms in Kenya, World Development Vol. 15, 931-939. Görg, H. and Greenaway, D. 2004. Much ado about nothing? Do domestic firms really benefit from foreign direct investment? World Bank Research Observer, 19(2): 171-197. Görg, H. and Strobl, E. 2001. Multinational companies and indigenous development European Economic Review, 107(4): 693-709. Görg, H. and Strobl, E. 2005. Spillovers from foreign firms through worker mobility: an empirical investigation. Scandinavian Journal of Economics, 107(4): 693-709. Grant, R. M. 1996. Toward a knowledge-based theory of the firm. Strategic Management Journal, 17: 109-122. Hambrick, D. C., Geletkanycz, M.A. and Fredrickson, J.W. 1993. Top executive commitment to the status quo: some tests of its determinants. Strategic Management Journal, 14: 401-418. Hambrick, D. C. and Mason, P. 1984. Upper echelons: the organization as a reflection of its top managers. Academy of Management Review, 9: 193-206. He, Z. and Wong, P. 2004. Exploration vs. exploitation: an empirical test of the ambidexterity hypothesis. Organization Science, 15(4): 481-494. Hitt, M.A., Dacin, T., Tyler, B.B. and Park, D. 1997. Understanding the differences in Korean and U.S. executive’s strategic orientations. Strategic Management Journal, 18(2): 159-167.
31
IMS, IMS China Update, September 2000. Javorcik, B. 2004. Does foreign direct investment increase the productivity of domestic firms? In search of spillovers through backward linkages. American Economic Review, 94(3): 605-627. Kim, J. and Marschke, G. 2005. Labor mobility of scientists, technological diffusion, and the firm's patenting decision. RAND Journal of Economics, 36(2): 298-317. Kogut, B. & Zander, U. 1992. Knowledge of the Firm, Combinative Capabilities, and the Replication of Technology. Organization Science, 3: 383-397 Kohli, A. K. and Jaworski, B. J. 1990. Market orientation: the construct, research propositions, and managerial implications. Journal of Marketing, 54: 1-18. Kohli, A. K., Jaworski, B. J. and Kumar, A. 1993. MARKOR: a measure of market orientation. Journal of Marketing Research, 30 (Nov): 467-477. Kosova, R. 2004. Do foreign firms crowd out domestic firms? The evidence from the Czech Republic. Univ. Michigan Business School, Working Paper. Lall, S. 1980. The international automotive industry and the developing world, World Development, 8(10): 789-812. Lumpkin, G.T. and Dess, G.G. 1996. Clarifying the entrepreneurship orientation construct and linking it to performance. Academy of Management Review, 21(1): 135-172. Markusen, J.R. and Venebles, A.J. 1999. Foreign direct investment as a catalyst for industrial development. European Economic Review, 43: 335-356. Meyer, K.E. 2004. Perspectives on Multinational Enterprises in Emerging Economies, Journal of International Business Studies, 34(4): 259-277. Meyer, K.E. and Peng, M.W. 2005. Probing Theoretically into Central and Eastern Europe: Transactions, Resources and Institutions, Journal of International Business Studies 36 (6), 600-621. Meyer, K.E. and Sinani, E. 2009. When and where does FDI create positive spillovers? A Meta-analysis, Journal of International Business Studies, forthcoming. Meyer, K. E., & Tran, Y.T.T. 2006. Market penetration and acquisition strategies for emerging economies. Long Range Planning, 39(2), 177-197
32
Narver, J. C. and Slater, S. F. 1990. The effect of a market orientation on business profitability. Journal of Marketing, 54: 20-35. Newman, K. 2000. Organizational transformation during institutional upheaval, Academy of Management Review 25: 602-619. Noble, C. H., Sinha, R. K. and Kumar, A. 2002. Market orientation and alternative strategic orientations: a longitudinal assessment of performance implications. Journal of Marketing, 66(October): 25-39. Nonaka, I. 1994. A dynamic theory of organizational knowledge creation. Organization Science, 5: 14-37. Ocasio, W. 1997. Towards an attention-based view of the firm. Strategic Management Journal, 18(Summer Special Issue): 187-206. Oettl, A. & Agrawal, A. 2008. International labor mobility and knowledge flow externalities. Journal of International Business Studies, 39(8): 1242-1260. Patibandla, M. and Petersen, B. 2002. Role of transnational corporations in the evolution of a high-tech industry: The case of India’s software industry, World Development 30: 1561-1577. Peng, M, W. 2003. Institutional transitions and strategic choices. Academy of Management Review, 28(2): 275-296. Perez, T. 1997. Multinational enterprises and technological spillovers: an evolutionary model, Journal of Evolutionary Economics 7: 169 - 192. Polanyi, M. 1962. Personal knowledge. London: Routledge. Prahalad, C.K. and Bettis, R. 1986. The dominant logic: A new linkage between diversity and performance. Strategic Management Journal, 7: 485-501. Song, J., Almeida, P., & Wu, G. 2003. Learning-by-hiring: when is mobility more likely to facilitate inter-firm knowledge transfer? Management Science, 49(4): 351-365. Spencer, J. W. 2008. The Impact of Multinational Enterprise Strategy on Indigenous Enterprises: Horizontal Spillovers and Crowding Out in Developing Countries. Academy of Management Review, 33(2): 341-361. Spender, J.-C. 1989. Industry recipes. Oxford: Blackwell. Swaan, W. 1997. Knowledge, transaction costs and the creation of markets, in post-socialist economies, in: Hare, P.G.. and Davis, J. eds. Transition to the Market Economy, London:
33
Routledge, p. 53-76. Thompson, E.R. 2002. Clustering of foreign direct investment and enhanced technology transfer: Evidence from Hong Kong firms in China, World Development 30: 873-889. Tian, X. 2007. Accounting for sources of FDI technology spillovers: Evidence from China. Journal of International Business Studies, 38(1): 147-159. Venkatraman, N. 1989. Strategic orientation of business enterprises: the construct, dimensionality, and measurement. Management Science, 35(8): 942-962. Von Hippel, E. 1988. Sources of innovation. New York: Oxford University Press. Wei, Y. and Liu, X. 2006. Productivity spillovers from R&D, exports and FDI in China’s manufacturing sector. Journal of International Business Studies, 37(4): 544-557. Wooldridge, J.M. 2003. Introductory econometrics: a modern approach (2nd ed.), Thompson South-Western. Wright, P., Kroll, M., Pray, B. and Lado, A. 1995. Strategic orientations, competitive advantage, and business performance. Journal of Business Research, 33: 143-151. Zhou, K. Z., Gao, G..Y., Yang, Z. and Zhou, N. 2005. Developing strategic orientation in China: antecedents and consequences of market and innovation orientations. Journal of Business Research, 58: 1049-1058.
34
APPENDIX
To what extent do you think the following areas, if employed by your firm, would have important impact on your firm to achieve sustainable profitability: (7=very important, 1=not important)
(Market-driven orientation) (Cronbach’s alpha=0.858)
(1) adjusting product portfolio and prioritising resources allocation to improve the market shares for
our main products;
(2) monitoring the trend of market growth to capture growth opportunities;
(3) increasing R&D investment and launching new products or services to the market;
(4) building solid product brand and company reputation;
(5) increasing marketing investment, and enhancing distribution channels and sales forces.
(Internal-management orientation) (Cronbach’s alpha=0.850)
(1) recruiting and keeping key personnel, as well as improving the skill of the workforce;
(2) establishing reasonable pay and reward system so that employees are motivated;
(3) strengthening the coordination across different subunits of the company to increase organizational
cohesiveness;
(Unused items)
(1) improving procurement, production and inventory management to seek for cost advantage;
(2) using capital market as a tool to integrate the external resources, and achieving expansion.
35
Figure 1 Research Framework
Executive’s Perception of Strategic Priorities
(The Relative Strength of Market-driven Orientation versus Internal-Management Orientation)
Firm Performance
(ROS)
Executives Experience
(FIE Working Experience)
36
Table 1 Mean, Standard Deviation and Correlation Matrix of Variables (Full Sample) Variables Mean S.D. Min Max 1 2 3 4 5
1. Firm Performance (ROS_04to05) 2. Relative Strength of Market-Driven Orientation 3. Strength of Market-Driven Orientation 4. Strength of Internal-Management Orientation 5. IJV Working Experience 6. CEO Dummy 7. Education Degree Level 8. Industry Tenure 9. Primary Functional Background in Marketing/Sales 10. Executive’s Age 11. Executive’s Gender 12. Tenure in Current Executive Position 13. Firm Age 14. Firm Size 15. Past Firm Performance (ROS_03)
0.096 0.042 6.283 6.241 0.276 0.179
1.89713.846 0.269 40.335 0.763 4.23016.2952423.6 0.117
0.112 0.607 0.839 0.868 0.448 0.3850.788
7.977 0.445 8.157 0.427 4.26415.8404944.5 0.130
-0.331 -2.933 2.400 3.0000 0 0
1.000 0 26.000 0
0.250 1.000 31 -0.453
0.3912.867 7.000 7.000 1
1 3
35.000 1 64.000 1 21.33385.000
20100 0.467
1.000 0.174* 0.220** 0.092 0.020 0.057 0.004 0.043 0.029
-0.001 -.0004 0.037 0.081
-0.019 0.423***
1.000 0.312*** - .397*** 0.112 0.050
0.001 -0.079 0.186* -0.110 0.135† 0.021 0.056 0.076
-0.006
1.000 0.748*** -0.017 0.038 0.045 0.063
0.071 -0.052 -0.059 -0.111 -0.042
0.176* 0.018
1.000 -0.095 0.002 0.043
0.116 -0.062
0.027 -0.151†
-0.122 -0.080
0.117 0.021
1.000 -0.102 0.172* 0.022 0.111
0.104 -0.095 0.149† 0.163*
-0.112 0.100
Variables 6 7 8 9 10 11 12 13 14 15
6. CEO Dummy 7. Education Degree Level 8. Industrial Tenure 9. Primary Functional Background in Marketing/Sales 10. Executive’s Age 11. Executive’s Gender 12. Tenure in Current Executive Position 13. Firm Age 14. Firm Size 15. Past Firm Performance (ROS_03)
1.000 0.104 0.242** -0.058 0.307***0.222** 0.200* -0.122 -0.086 -0.037
1.000 0.011 0.061 -0.018 0.177* -.262**0.045 .281***0.080
1.000 0.032
.718*** 0.051 .379***
0.069 0.138†
-0.050
1.000 -0.010 0.033 0.077
0.060 -0.042 0.045
1.000 0.037 .399***-0.010 0.038 -0.068
1.000 0.018
0.070 0.121 -0.040
1.000 0.089
-0.134† 0.124
1.000 0.123 0.074
1.000 0.090
1.000
Except for ROS_04to05 N=153, for all other variables N=156. Two-tailed significant tests, † p< .10 * p< .05 ** p<.01 *** p<.001; Education degree level is a categorical variable. Industrial tenure, executive age, tenure in executive position, firm age and firm size were reported in the raw data form, i.e. before logarithm transformation.
37
Table 2 Results of OLS Regressions on the Relationship between the FIE working Experiences and the Relative Strength of Executive’s Market-Driven Orientation (N=156)
Model 1 Model 2 Model 3 Tests of Hypotheses IJV Working Experience (H1a) CEO Dummy CEO Dummy X IJV Working Experience (H1b) Control Variables Strength of Internal-Management Orientation Education Degree Level Industry Tenure Primary Functional Background in Marketing/Sales Executive Age Executive Gender Tenure in the Current Executive Position Firm Age Firm Size Past Firm Performance (ROS03) Firm Ownership Dummies Clustering on Firm IDs Intercept
- 0.2490** -0.0572
-0.0055 0.2189† -0.1328 0.1096 -0.0349 0.5060 0.0838* -0.0473 yes yes 1.3976
0.2512* -0.2299** -0.088
0.0003 0.2134† -0.1845 0.1321 -0.0328 0.0301 0.0875* -0.0817 yes yes 1.3983
0.3034* 0.2872* 0.0931
- 0.2273** -0.1183*
-0.0099 0.2376* -0.3360 0.0796 -0.0526 0.0491 0.0952* -0.1161 yes yes 1.8767*
R2 0.2633 0.2838 0.3111 Adjusted R2 0. 1959 0.2127 0.2318 F 2.88** 2.88** 3.78***
(1) Unstandardized coefficients reported; (2) Two-tailed significant tests, † p< .10 * p< .05 ** p<.01 *** p<.001 ; (3) Value of VIFs in all the models are less than 1.95; (4) Industrial tenure, executive age, tenure in executive position, firm age and firm size were transformed by the natural logarithm of the
corresponding raw data.
38
Table 3 Results of OLS Regressions on the Performance Impact of the Relative Strength of Executive’s Market-Driven Orientation (N=153)
(1) Unstandardized coefficients reported; (2) Two-tailed significant tests, † p< .10 * p< .05 ** p<.01 *** p<.001 (3) Values of VIFs in models 4-9 are less than 2.6. (4) Executive age, tenure in executive position, firm age and firm size were transformed by natural logarithm of the corresponding raw data.
Model 4 Model 5 Model 6 Model 7 Model 8 Model 9
Tests of Hypotheses Relative Strength of Market-Driven Orientation (H2a)CEO Dummy CEO Dummy X Relative Strength of Market –Driven
Orientation (H2b) Control Variables Strength of Market-Driven Orientation Strength of Internal-Management Orientation Executive Age Tenure in Current Executive Position Firm Age Firm Size Past Firm Performance (ROS_03) Firm Ownership Dummies Clustering on Firm IDs Intercept
0.0212
-0.0024 0.0090 0.0039 0.3779** yes yes
- 0.0830
0.0121 0.0187
-0.0010 0.0112 0.0030 0.3754** yes yes
-0.1582
0.0292† 0.0217 0.0008 0.0108 0.0002 0.3741*** yes yes -0.2580
0.0461*
- 0.0221 0.0247 0.0002 0.0079
- 0.0003 0.3766** yes yes -0.2218
0.0461* 0.0239
0.0247 0.0002
0.0079 -0.0003 0.3777** yes yes -0.2218
0.0397* 0.0184 0.1254** 0.0236
0.0109 - 0.0011
0.0091 .00004 0.3797*** yes yes -0.1778
R2 0.2071 0.2150 0.2520 0.2635 0.2635 0.3104 Adjusted R2 0.1572 0.1597 0.1993 0.2060 0.2060 0.2459 F 3.12** 2.86** 3.13** 3.05** 3.05** 3.90***