Embed Size (px)
Citation preview

Technological Change in Cities and Regions
An Evolutionary Analysis of
Knowledge Spaces and Technology Trajectories
Dieter Franz Kogler
School of Geography, Planning & Env. Policy University College Dublin
MUNK School of Global Affairs - University of Toronto Innovation Policy Lab Speaker Series – Frontiers of Research in Global Innovation
Toronto, Canada, October 8th, 2014.

KNOWLEDGE [IN] SPACE
While a substantial literature, i.e. Regional Innovation Systems, Learning Regions, Local Knowledge Economies, promotes the idea that different knowledge economies/learning regions produce various subsets of knowledge, which in turn becomes the source of their competitive advantage, systematic evidence of the production of these different kinds of knowledge over space is lacking.
CITIES
KNOWLEDGE TIME
Little is known about how technological change evolves at specific places over time.
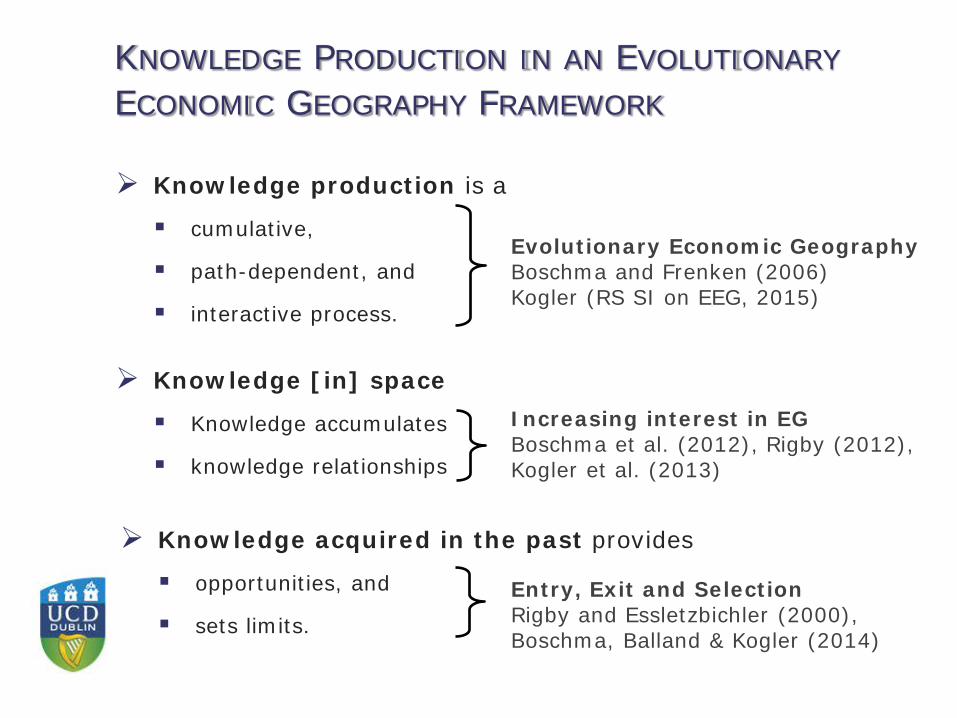
KNOWLEDGE PRODUCTION IN AN EVOLUTIONARY ECONOMIC GEOGRAPHY FRAMEWORK
Knowledge production is a
cumulative,
path-dependent, and
interactive process.
Knowledge acquired in the past provides
opportunities, and
sets limits.
Knowledge [in] space
Knowledge accumulates
knowledge relationships
Evolutionary Economic Geography Boschma and Frenken (2006) Kogler (RS SI on EEG, 2015)
Increasing interest in EG Boschma et al. (2012), Rigby (2012), Kogler et al. (2013)
Entry, Exit and Selection Rigby and Essletzbichler (2000), Boschma, Balland & Kogler (2014)
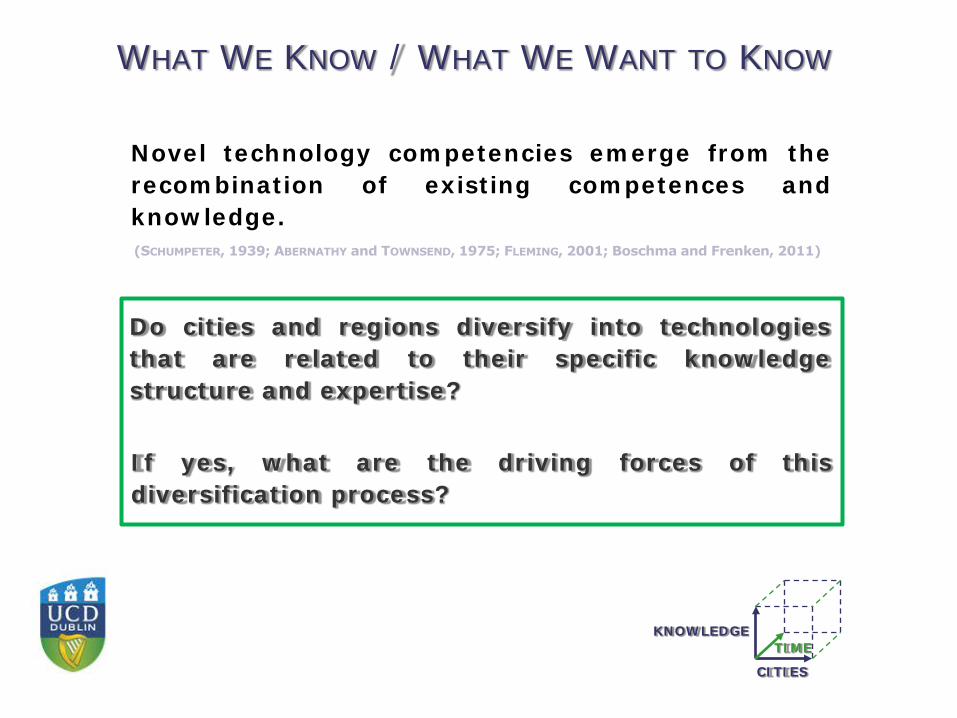
WHAT WE KNOW / WHAT WE WANT TO KNOW
Novel technology competencies emerge from the recombination of existing competences and knowledge.
Do cities and regions diversify into technologies that are related to their specific knowledge structure and expertise?
CITIES
KNOWLEDGE TIME
If yes, what are the driving forces of this diversification process?
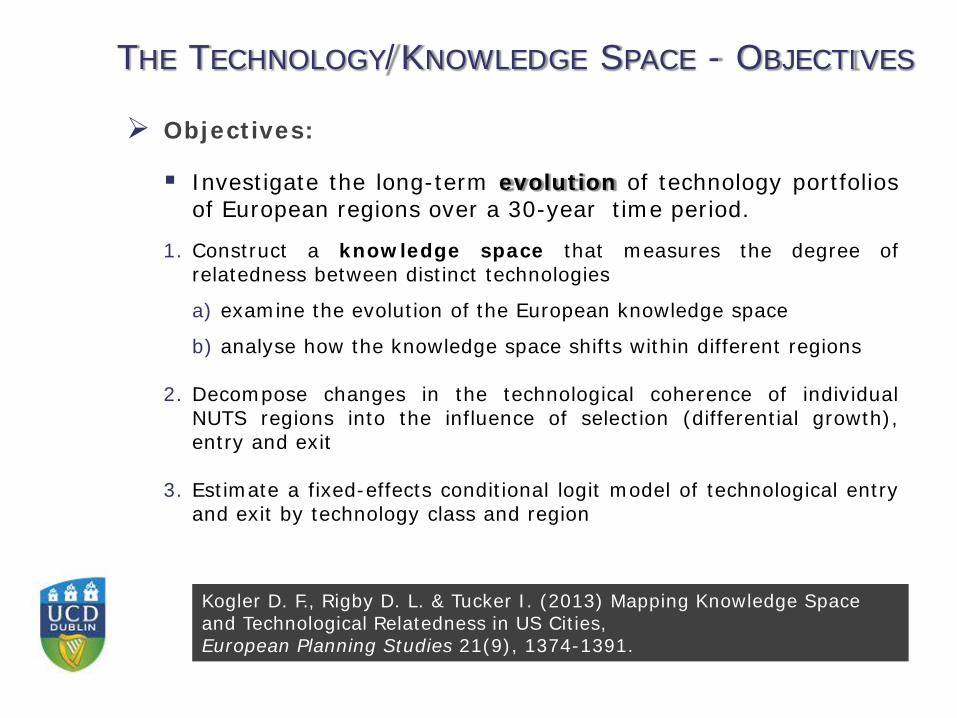
Objectives:
Investigate the long-term evolution of technology portfolios of European regions over a 30-year time period.
1. Construct a knowledge space that measures the degree of relatedness between distinct technologies
a) examine the evolution of the European knowledge space
b) analyse how the knowledge space shifts within different regions
2. Decompose changes in the technological coherence of individual NUTS regions into the influence of selection (differential growth), entry and exit
3. Estimate a fixed-effects conditional logit model of technological entry and exit by technology class and region
THE TECHNOLOGY/KNOWLEDGE SPACE - OBJECTIVES
Kogler D. F., Rigby D. L. & Tucker I. (2013) Mapping Knowledge Space and Technological Relatedness in US Cities, European Planning Studies 21(9), 1374-1391.
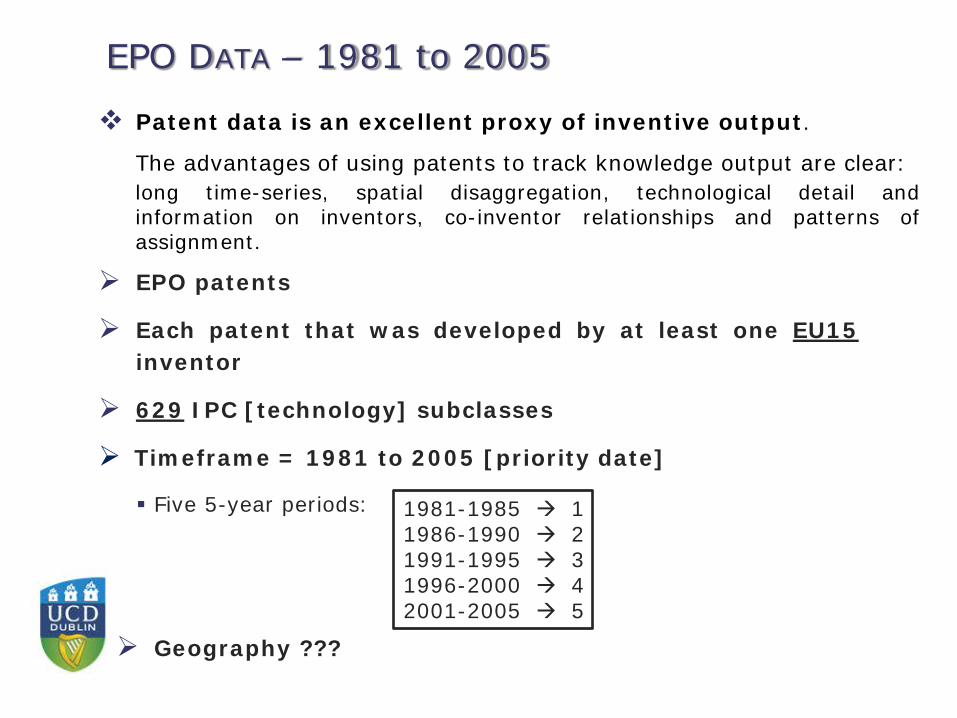
EPO patents
Each patent that was developed by at least one EU15 inventor
629 IPC [technology] subclasses
Timeframe = 1981 to 2005 [priority date]
Five 5-year periods:
EPO DATA – 1981 to 2005
Patent data is an excellent proxy of inventive output.
The advantages of using patents to track knowledge output are clear: long time-series, spatial disaggregation, technological detail and information on inventors, co-inventor relationships and patterns of assignment.
1981-1985 1 1986-1990 2 1991-1995 3 1996-2000 4 2001-2005 5
Geography ???
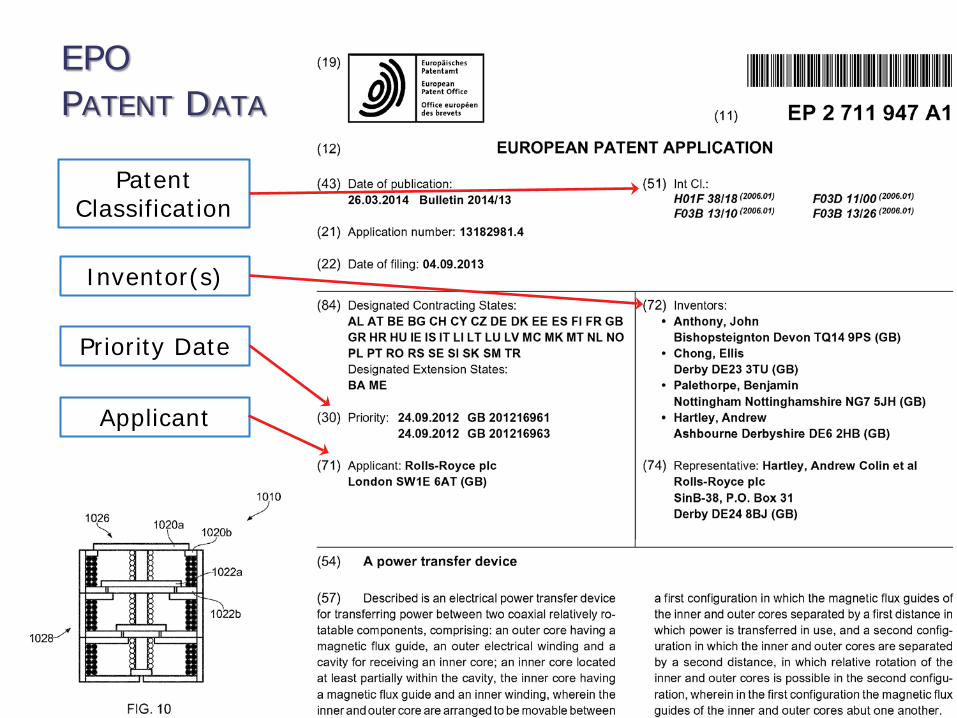
EPO PATENT DATA
Applicant
Inventor(s)
Patent Classification
Priority Date
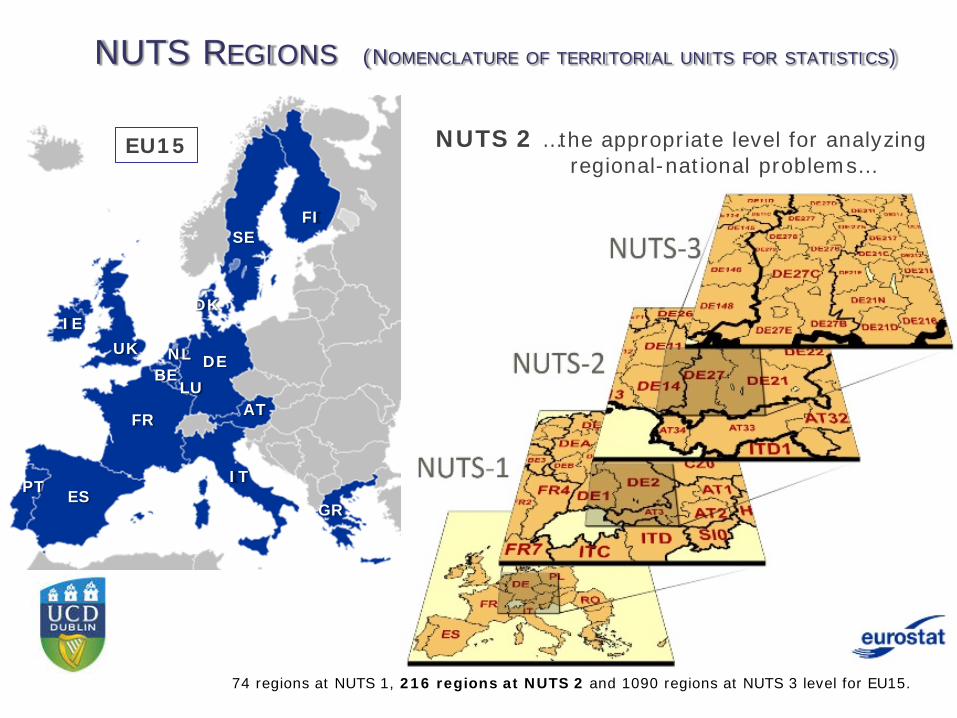
NUTS 2 …the appropriate level for analyzing regional-national problems…
NUTS REGIONS (NOMENCLATURE OF TERRITORIAL UNITS FOR STATISTICS)
74 regions at NUTS 1, 216 regions at NUTS 2 and 1090 regions at NUTS 3 level for EU15.
AT
GR
LU
DK
BE NL DE
FR
IT PT
IE UK
SE FI
ES
EU15
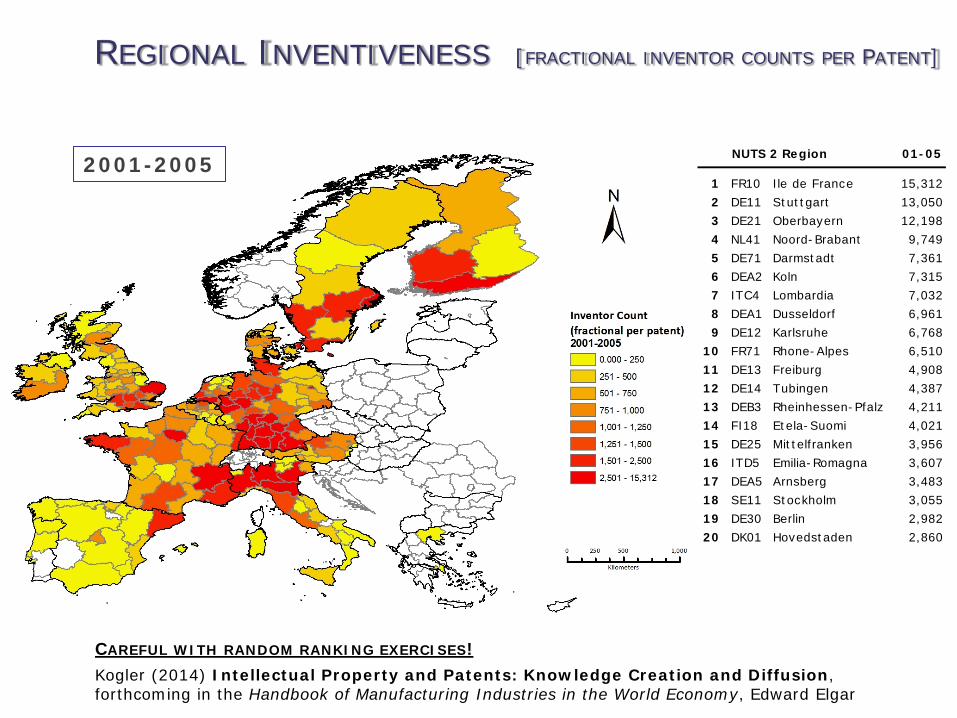
REGIONAL INVENTIVENESS [FRACTIONAL INVENTOR COUNTS PER PATENT]
2001-2005 NUTS 2 Region 01-05
1 FR10 Ile de France 15,3122 DE11 Stuttgart 13,0503 DE21 Oberbayern 12,1984 NL41 Noord-Brabant 9,7495 DE71 Darmstadt 7,3616 DEA2 Koln 7,3157 ITC4 Lombardia 7,0328 DEA1 Dusseldorf 6,9619 DE12 Karlsruhe 6,768
10 FR71 Rhone-Alpes 6,51011 DE13 Freiburg 4,90812 DE14 Tubingen 4,38713 DEB3 Rheinhessen-Pfalz 4,21114 FI18 Etela-Suomi 4,02115 DE25 Mittelfranken 3,95616 ITD5 Emilia-Romagna 3,60717 DEA5 Arnsberg 3,48318 SE11 Stockholm 3,05519 DE30 Berlin 2,98220 DK01 Hovedstaden 2,860
CAREFUL WITH RANDOM RANKING EXERCISES!
Kogler (2014) Intellectual Property and Patents: Knowledge Creation and Diffusion, forthcoming in the Handbook of Manufacturing Industries in the World Economy, Edward Elgar
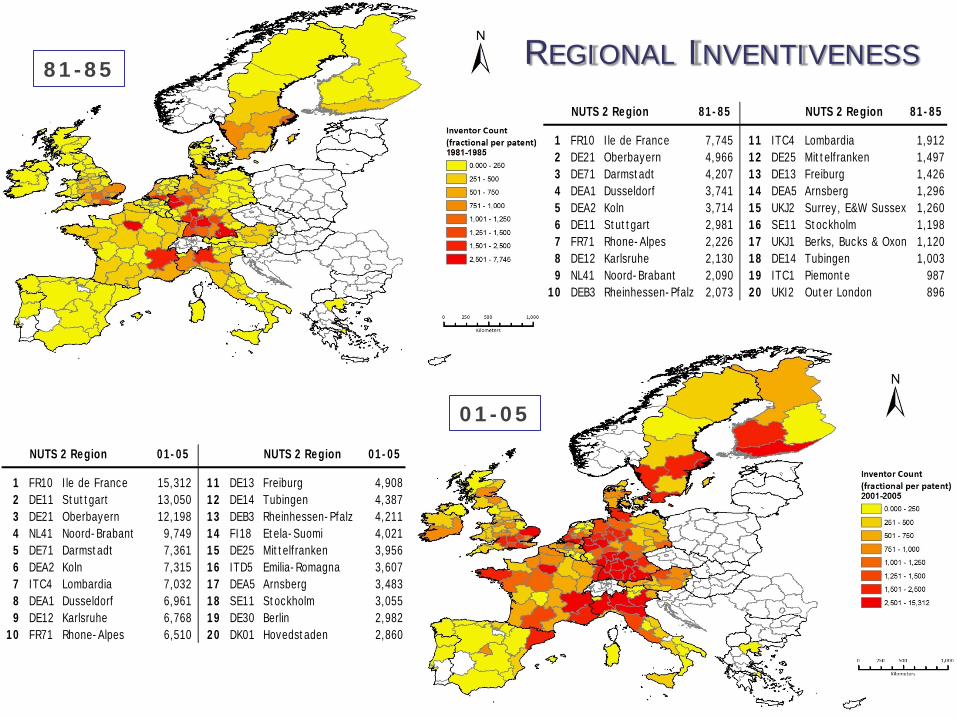
81-85
01-05
REGIONAL INVENTIVENESS NUTS 2 Region 81-85 NUTS 2 Region 81-85
1 FR10 Ile de France 7,745 11 ITC4 Lombardia 1,9122 DE21 Oberbayern 4,966 12 DE25 Mittelfranken 1,4973 DE71 Darmstadt 4,207 13 DE13 Freiburg 1,4264 DEA1 Dusseldorf 3,741 14 DEA5 Arnsberg 1,2965 DEA2 Koln 3,714 15 UKJ2 Surrey, E&W Sussex 1,2606 DE11 Stuttgart 2,981 16 SE11 Stockholm 1,1987 FR71 Rhone-Alpes 2,226 17 UKJ1 Berks, Bucks & Oxon 1,1208 DE12 Karlsruhe 2,130 18 DE14 Tubingen 1,0039 NL41 Noord-Brabant 2,090 19 ITC1 Piemonte 987
10 DEB3 Rheinhessen-Pfalz 2,073 20 UKI2 Outer London 896
NUTS 2 Region 01-05 NUTS 2 Region 01-05
1 FR10 Ile de France 15,312 11 DE13 Freiburg 4,9082 DE11 Stuttgart 13,050 12 DE14 Tubingen 4,3873 DE21 Oberbayern 12,198 13 DEB3 Rheinhessen-Pfalz 4,2114 NL41 Noord-Brabant 9,749 14 FI18 Etela-Suomi 4,0215 DE71 Darmstadt 7,361 15 DE25 Mittelfranken 3,9566 DEA2 Koln 7,315 16 ITD5 Emilia-Romagna 3,6077 ITC4 Lombardia 7,032 17 DEA5 Arnsberg 3,4838 DEA1 Dusseldorf 6,961 18 SE11 Stockholm 3,0559 DE12 Karlsruhe 6,768 19 DE30 Berlin 2,982
10 FR71 Rhone-Alpes 6,510 20 DK01 Hovedstaden 2,860
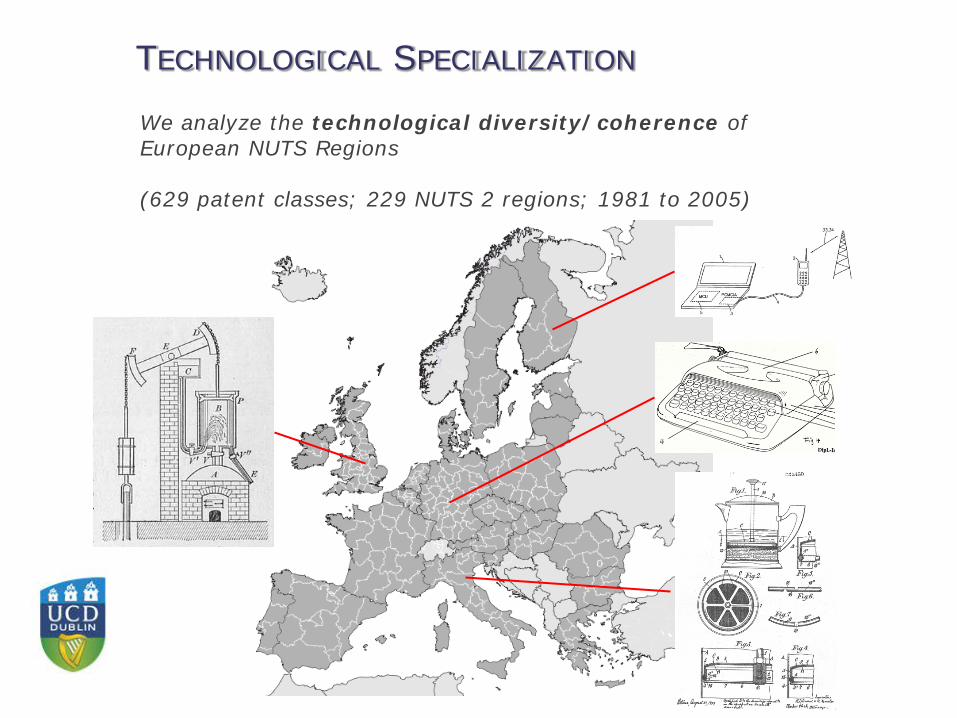
We analyze the technological diversity/coherence of European NUTS Regions (629 patent classes; 229 NUTS 2 regions; 1981 to 2005)
TECHNOLOGICAL SPECIALIZATION
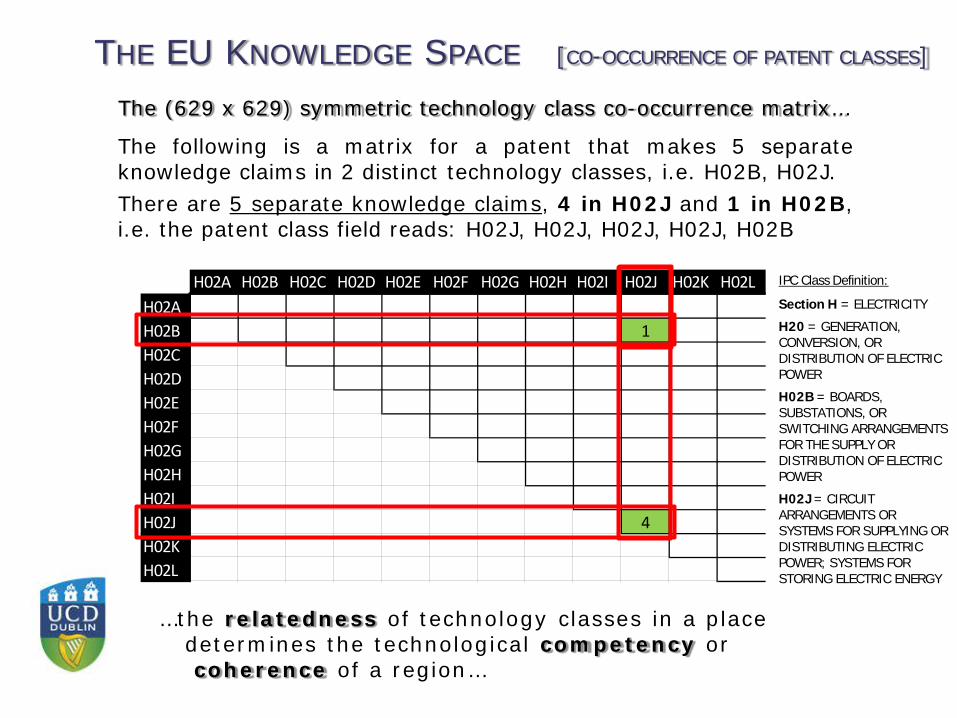
THE EU KNOWLEDGE SPACE [CO-OCCURRENCE OF PATENT CLASSES]
The (629 x 629) symmetric technology class co-occurrence matrix…
The following is a matrix for a patent that makes 5 separate knowledge claims in 2 distinct technology classes, i.e. H02B, H02J.
There are 5 separate knowledge claims, 4 in H02J and 1 in H02B, i.e. the patent class field reads: H02J, H02J, H02J, H02J, H02B
…the relatedness of technology classes in a place determines the technological competency or coherence of a region…
H02A H02B H02C H02D H02E H02F H02G H02H H02I H02J H02K H02LH02AH02B 1H02CH02DH02EH02FH02GH02HH02IH02J 4H02KH02L
IPC Class Definition:
Section H = ELECTRICITY
H20 = GENERATION, CONVERSION, OR DISTRIBUTION OF ELECTRIC POWER
H02B = BOARDS, SUBSTATIONS, OR SWITCHING ARRANGEMENTS FOR THE SUPPLY OR DISTRIBUTION OF ELECTRIC POWER
H02J = CIRCUIT ARRANGEMENTS OR SYSTEMS FOR SUPPLYING OR DISTRIBUTING ELECTRIC POWER; SYSTEMS FOR STORING ELECTRIC ENERGY
THE EU KNOWLEDGE SPACE [CO-OCCURRENCE OF PATENT CLASSES]
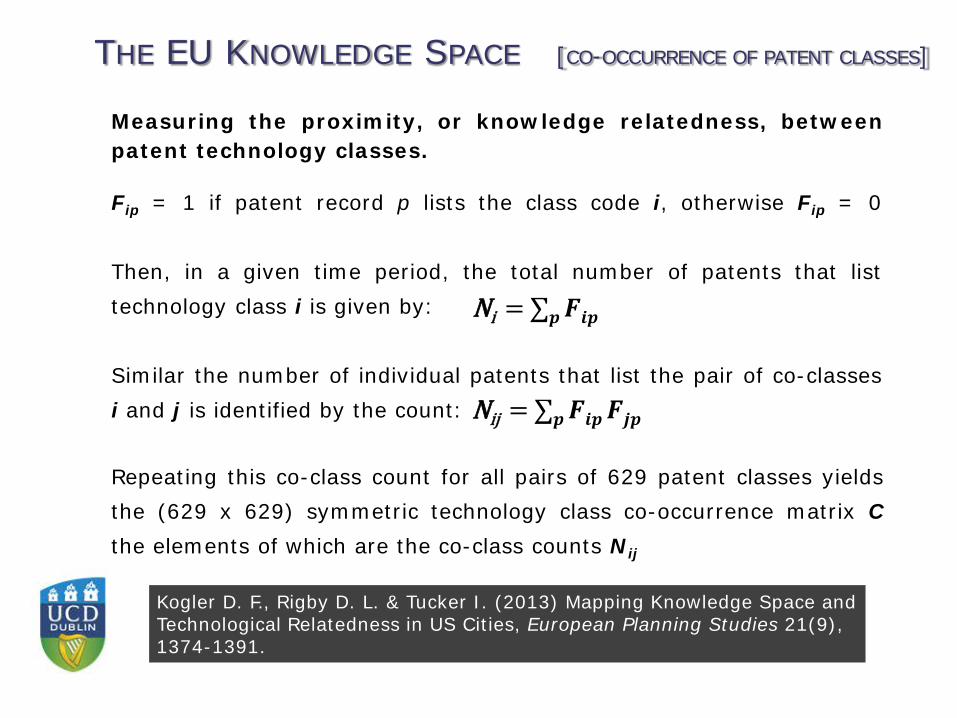
Repeating this co-class count for all pairs of 629 patent classes yields the (629 x 629) symmetric technology class co-occurrence matrix C the elements of which are the co-class counts Nij
Measuring the proximity, or knowledge relatedness, between patent technology classes.
Fip = 1 if patent record p lists the class code i, otherwise Fip = 0 Then, in a given time period, the total number of patents that list technology class i is given by: Similar the number of individual patents that list the pair of co-classes i and j is identified by the count:
Ni = ∑𝒑𝒑 𝑭𝑭𝒊𝒊𝒑𝒑
Nij = ∑𝒑𝒑 𝑭𝑭𝒊𝒊𝒑𝒑
𝑭𝑭𝒋𝒋𝒑𝒑
Kogler D. F., Rigby D. L. & Tucker I. (2013) Mapping Knowledge Space and Technological Relatedness in US Cities, European Planning Studies 21(9), 1374-1391.
THE EU KNOWLEDGE SPACE [CO-OCCURRENCE OF PATENT CLASSES]
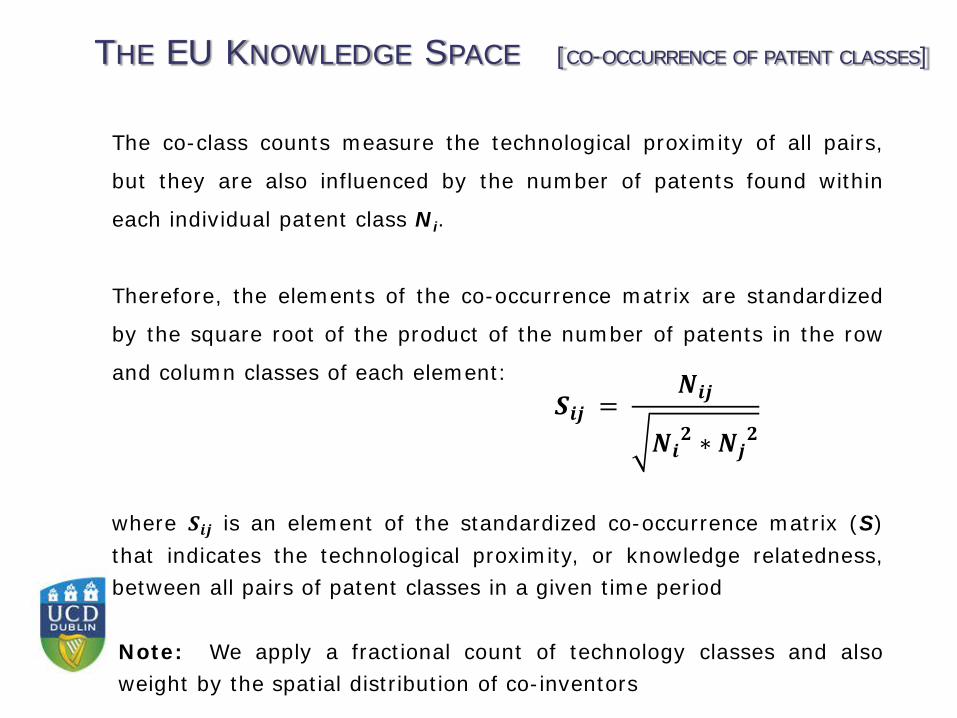
𝑺𝑺𝒊𝒊𝒋𝒋 = 𝑵𝑵𝒊𝒊𝒋𝒋
𝑵𝑵𝒊𝒊𝟐𝟐 ∗ 𝑵𝑵𝒋𝒋
𝟐𝟐
where 𝑺𝑺𝒊𝒊𝒋𝒋 is an element of the standardized co-occurrence matrix (S) that indicates the technological proximity, or knowledge relatedness, between all pairs of patent classes in a given time period
Note: We apply a fractional count of technology classes and also weight by the spatial distribution of co-inventors
The co-class counts measure the technological proximity of all pairs,
but they are also influenced by the number of patents found within
each individual patent class Ni.
Therefore, the elements of the co-occurrence matrix are standardized
by the square root of the product of the number of patents in the row
and column classes of each element:
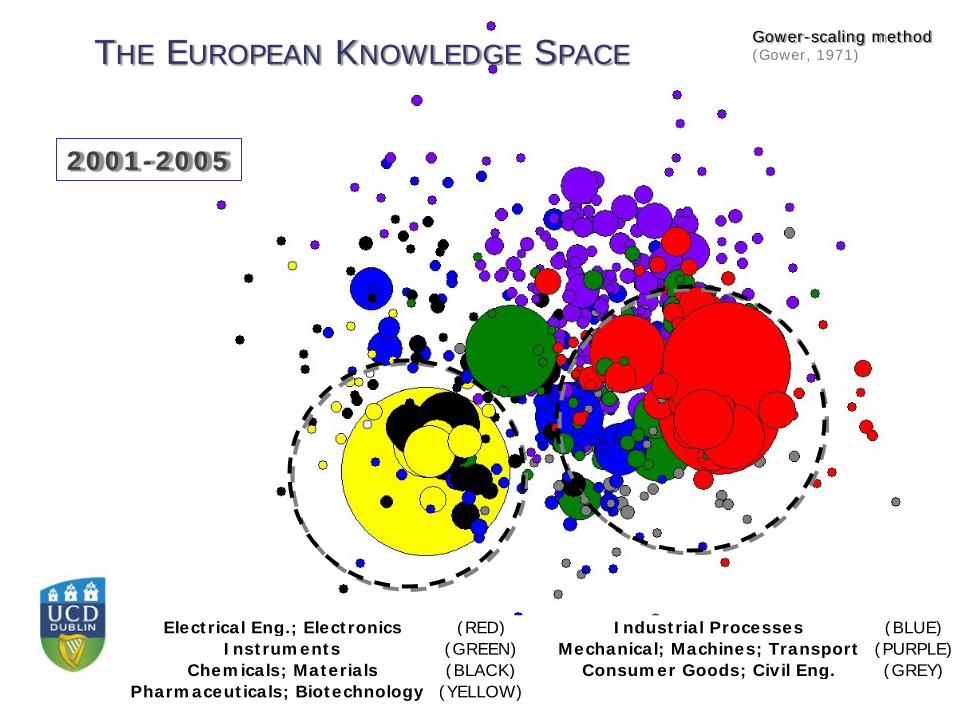
THE EUROPEAN KNOWLEDGE SPACE
2001-2005
Electrical Eng.; Electronics (RED) Industrial Processes (BLUE)Instruments (GREEN) Mechanical; Machines; Transport (PURPLE)
Chemicals; Materials (BLACK) Consumer Goods; Civil Eng. (GREY)Pharmaceuticals; Biotechnology (YELLOW)
Gower-scaling method (Gower, 1971)
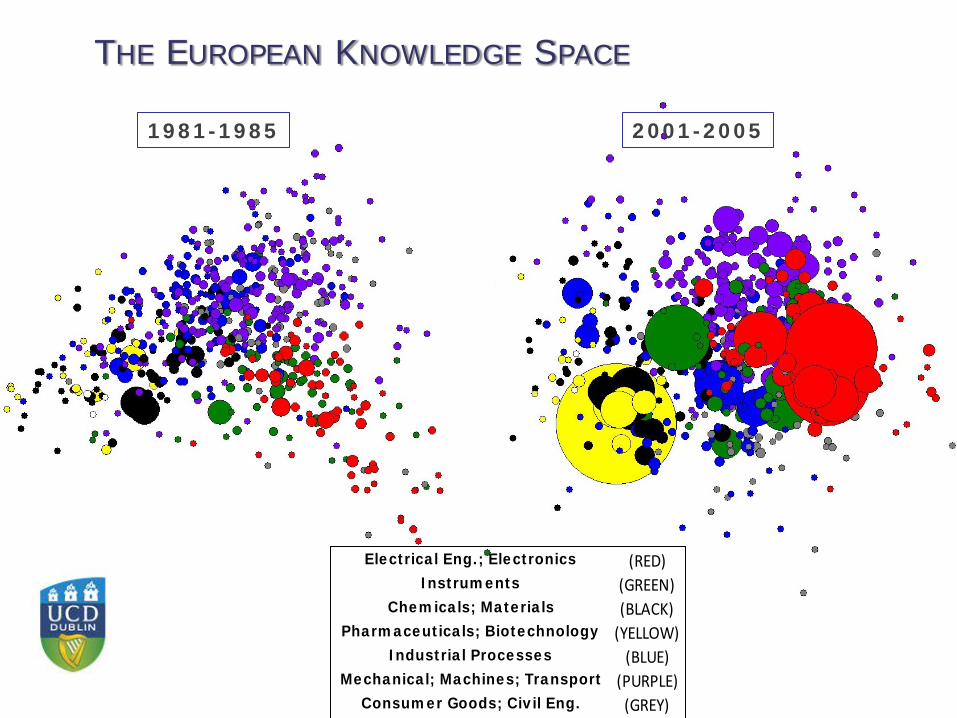
THE EUROPEAN KNOWLEDGE SPACE
Electrical Eng.; Electronics (RED)Instruments (GREEN)
Chemicals; Materials (BLACK)Pharmaceuticals; Biotechnology (YELLOW)
Industrial Processes (BLUE)Mechanical; Machines; Transport (PURPLE)
Consumer Goods; Civil Eng. (GREY)
1981-1985 2001-2005
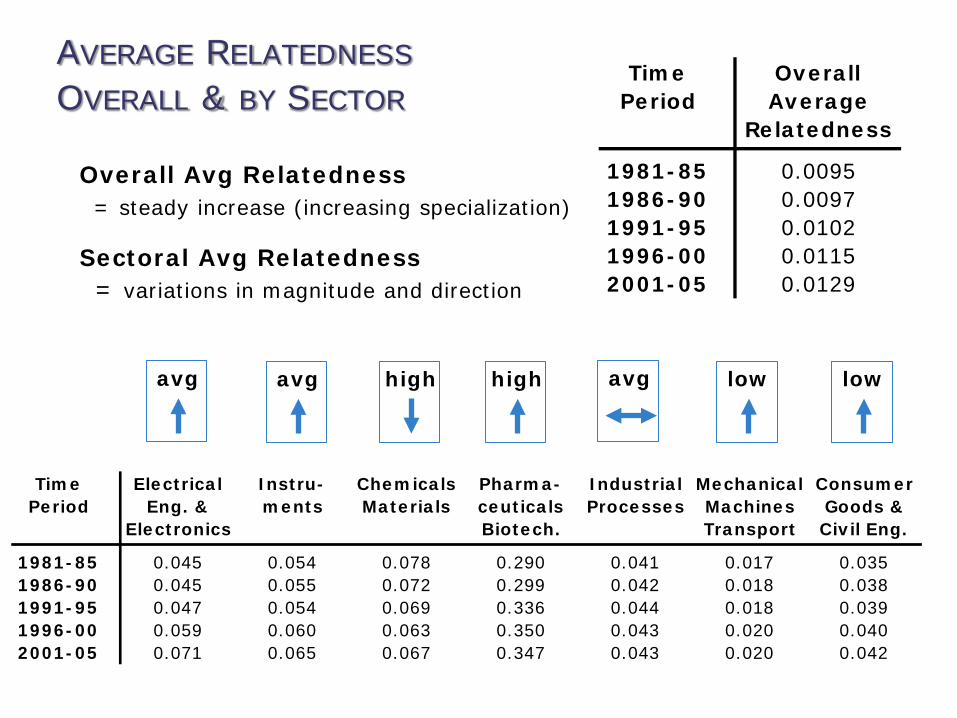
AVERAGE RELATEDNESS OVERALL & BY SECTOR
avg avg high high avg low low
Overall Avg Relatedness = steady increase (increasing specialization)
Sectoral Avg Relatedness = variations in magnitude and direction
Time OverallPeriod Average
Relatedness
1981-85 0.00951986-90 0.00971991-95 0.01021996-00 0.01152001-05 0.0129
Time Electrical Instru- Chemicals Pharma- Industrial Mechanical ConsumerPeriod Eng. & ments Materials ceuticals Processes Machines Goods &
Electronics Biotech. Transport Civil Eng.
1981-85 0.045 0.054 0.078 0.290 0.041 0.017 0.0351986-90 0.045 0.055 0.072 0.299 0.042 0.018 0.0381991-95 0.047 0.054 0.069 0.336 0.044 0.018 0.0391996-00 0.059 0.060 0.063 0.350 0.043 0.020 0.0402001-05 0.071 0.065 0.067 0.347 0.043 0.020 0.042
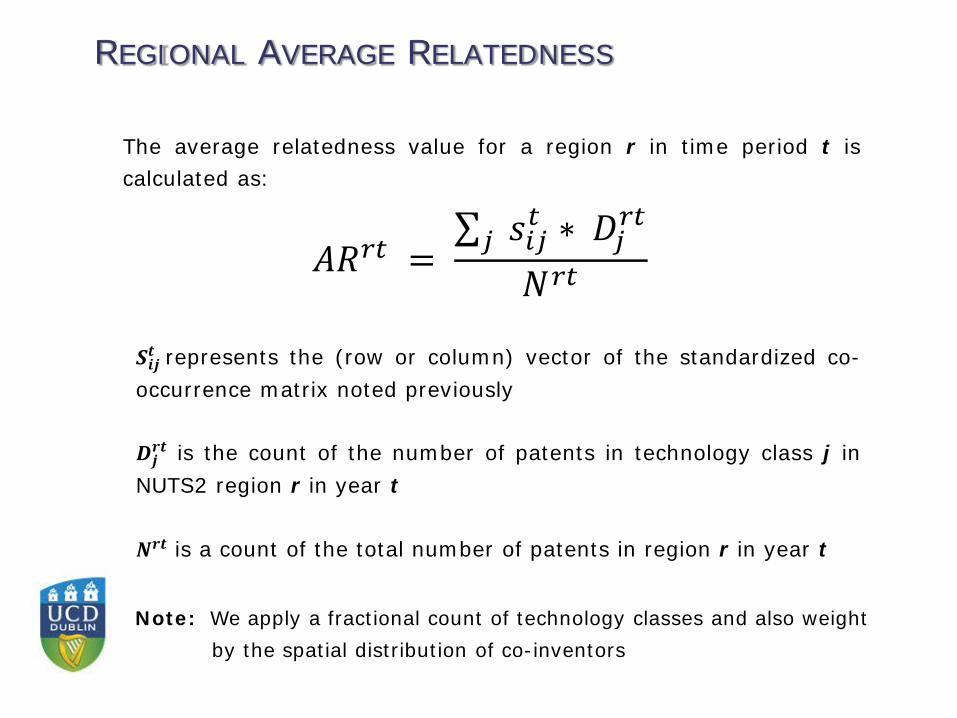
REGIONAL AVERAGE RELATEDNESS
𝐴𝐴𝐴𝐴𝑟𝑟𝑟𝑟 = ∑ 𝑠𝑠𝑖𝑖𝑖𝑖𝑟𝑟𝑖𝑖 ∗ 𝐷𝐷𝑖𝑖𝑟𝑟𝑟𝑟
𝑁𝑁𝑟𝑟𝑟𝑟
𝑺𝑺𝒊𝒊𝒋𝒋𝒕𝒕 represents the (row or column) vector of the standardized co-occurrence matrix noted previously 𝑫𝑫𝒋𝒋𝒓𝒓𝒕𝒕 is the count of the number of patents in technology class j in
NUTS2 region r in year t 𝑵𝑵𝒓𝒓𝒕𝒕 is a count of the total number of patents in region r in year t
The average relatedness value for a region r in time period t is calculated as:
Note: We apply a fractional count of technology classes and also weight by the spatial distribution of co-inventors
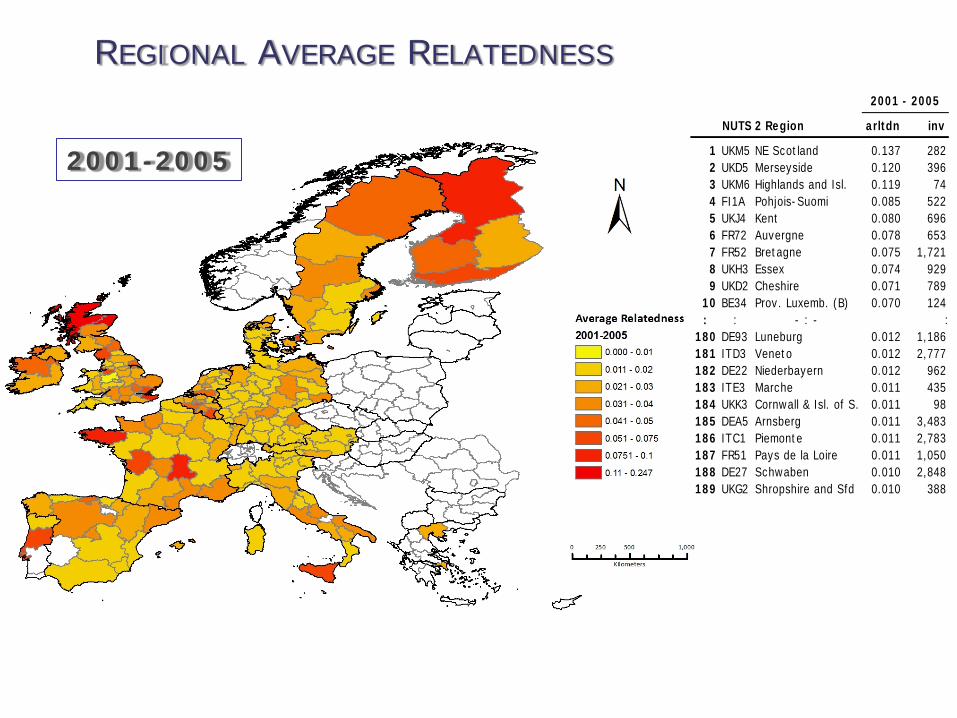
REGIONAL AVERAGE RELATEDNESS
2001-2005 NUTS 2 Region arltdn inv
1 UKM5 NE Scotland 0.137 2822 UKD5 Merseyside 0.120 3963 UKM6 Highlands and Isl. 0.119 744 FI1A Pohjois-Suomi 0.085 5225 UKJ4 Kent 0.080 6966 FR72 Auvergne 0.078 6537 FR52 Bretagne 0.075 1,7218 UKH3 Essex 0.074 9299 UKD2 Cheshire 0.071 789
10 BE34 Prov. Luxemb. (B) 0.070 124 : : - : - :180 DE93 Luneburg 0.012 1,186181 ITD3 Veneto 0.012 2,777182 DE22 Niederbayern 0.012 962183 ITE3 Marche 0.011 435184 UKK3 Cornwall & Isl. of S. 0.011 98185 DEA5 Arnsberg 0.011 3,483186 ITC1 Piemonte 0.011 2,783187 FR51 Pays de la Loire 0.011 1,050188 DE27 Schwaben 0.010 2,848189 UKG2 Shropshire and Sfd 0.010 388
2001 - 2005
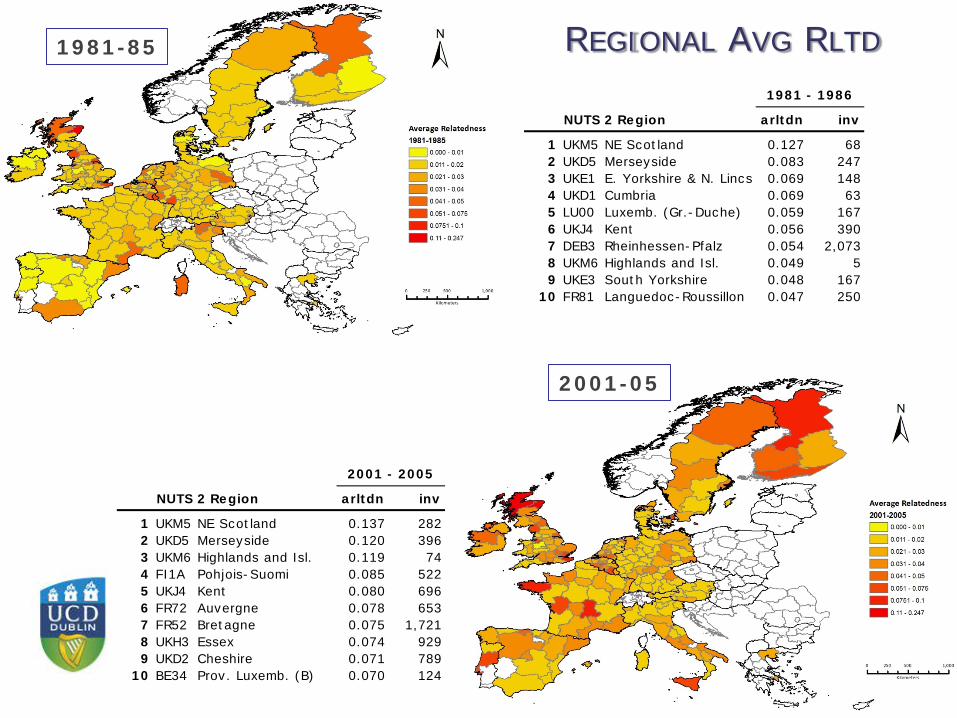
REGIONAL AVG RLTD 1981-85
2001-05
NUTS 2 Region arltdn inv
1 UKM5 NE Scotland 0.137 2822 UKD5 Merseyside 0.120 3963 UKM6 Highlands and Isl. 0.119 744 FI1A Pohjois-Suomi 0.085 5225 UKJ4 Kent 0.080 6966 FR72 Auvergne 0.078 6537 FR52 Bretagne 0.075 1,7218 UKH3 Essex 0.074 9299 UKD2 Cheshire 0.071 789
10 BE34 Prov. Luxemb. (B) 0.070 124
2001 - 2005
NUTS 2 Region arltdn inv
1 UKM5 NE Scotland 0.127 682 UKD5 Merseyside 0.083 2473 UKE1 E. Yorkshire & N. Lincs 0.069 1484 UKD1 Cumbria 0.069 635 LU00 Luxemb. (Gr.-Duche) 0.059 1676 UKJ4 Kent 0.056 3907 DEB3 Rheinhessen-Pfalz 0.054 2,0738 UKM6 Highlands and Isl. 0.049 59 UKE3 South Yorkshire 0.048 167
10 FR81 Languedoc-Roussillon 0.047 250
1981 - 1986
DECOMPOSING REGIONAL CHANGES IN TECHNOLOGICAL SPECIALIZATION
According to our theory of knowledge and technology evolution:
The process of technological diversification and abandonment is shaped by the region’s technological structure at the beginning of the period.
How do regions become more or less technologically cohesive (related)?
The need to examine:
the impact of changes in technology classes present in a region (incumbent technologies)
technologies added to the regional portfolio (entry); and
abandoned technologies (exit).
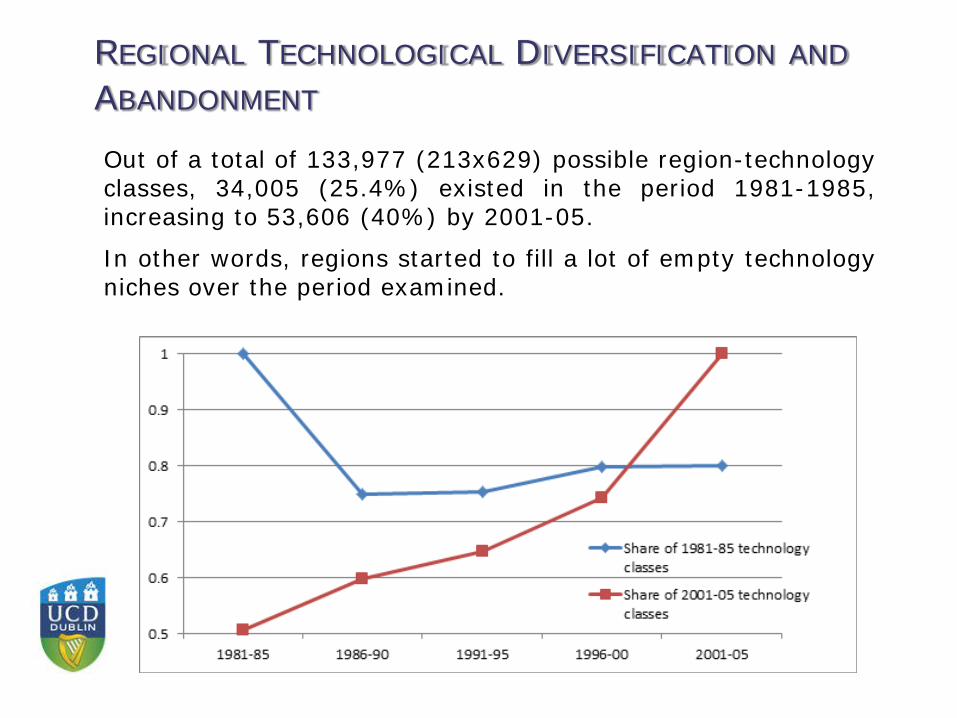
REGIONAL TECHNOLOGICAL DIVERSIFICATION AND ABANDONMENT Out of a total of 133,977 (213x629) possible region-technology classes, 34,005 (25.4%) existed in the period 1981-1985, increasing to 53,606 (40%) by 2001-05.
In other words, regions started to fill a lot of empty technology niches over the period examined.
DECOMPOSING REGIONAL CHANGES
tijr
Xij
tijr
tijr
Nij
tijr
tr
tijr
INCij
tir
tir
tir
tir
INCij
tr
tijr
tijr
tijr
tijr
INCij
tijr
tijr
tr
tr
sCpsCpssSCSC
CpsssppCC
)()())((
))(()(
1111
111
∑∑∑
∑∑
∈∈
++
∈
++
∈
+
∈
++
−−−+−−
−−+−=−
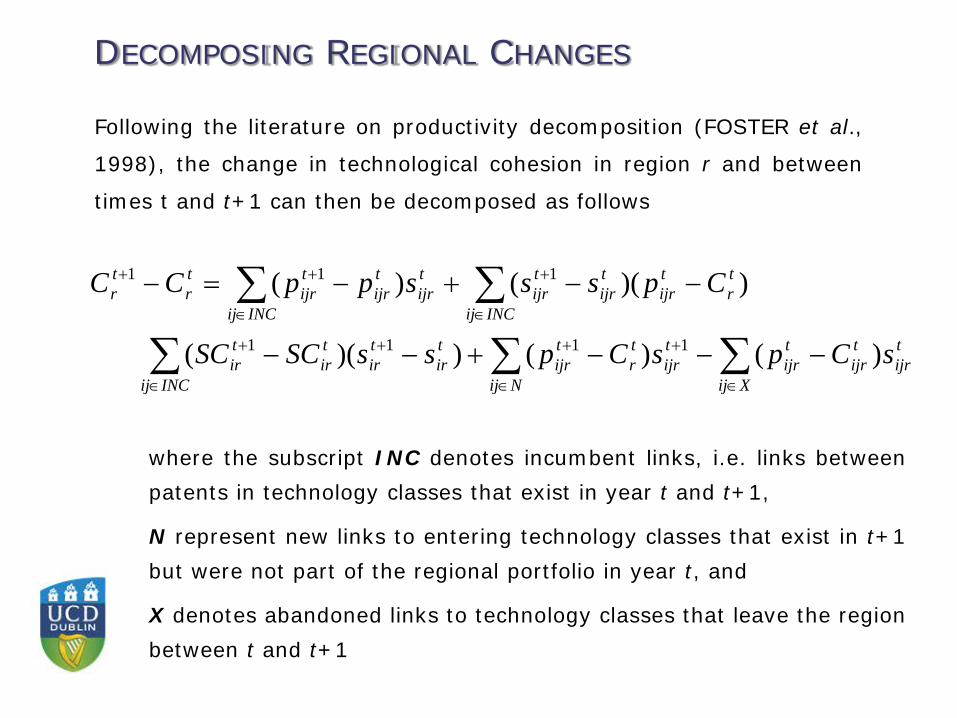
Following the literature on productivity decomposition (FOSTER et al.,
1998), the change in technological cohesion in region r and between
times t and t+1 can then be decomposed as follows
where the subscript INC denotes incumbent links, i.e. links between patents in technology classes that exist in year t and t+1,
N represent new links to entering technology classes that exist in t+1 but were not part of the regional portfolio in year t, and
X denotes abandoned links to technology classes that leave the region between t and t+1
DECOMPOSING REGIONAL CHANGES
tijr
Xij
tijr
tijr
Nij
tijr
tr
tijr
INCij
tir
tir
tir
tir
INCij
tr
tijr
tijr
tijr
tijr
INCij
tijr
tijr
tr
tr
sCpsCpssSCSC
CpsssppCC
)()())((
))(()(
1111
111
∑∑∑
∑∑
∈∈
++
∈
++
∈
+
∈
++
−−−+−−
−−+−=−
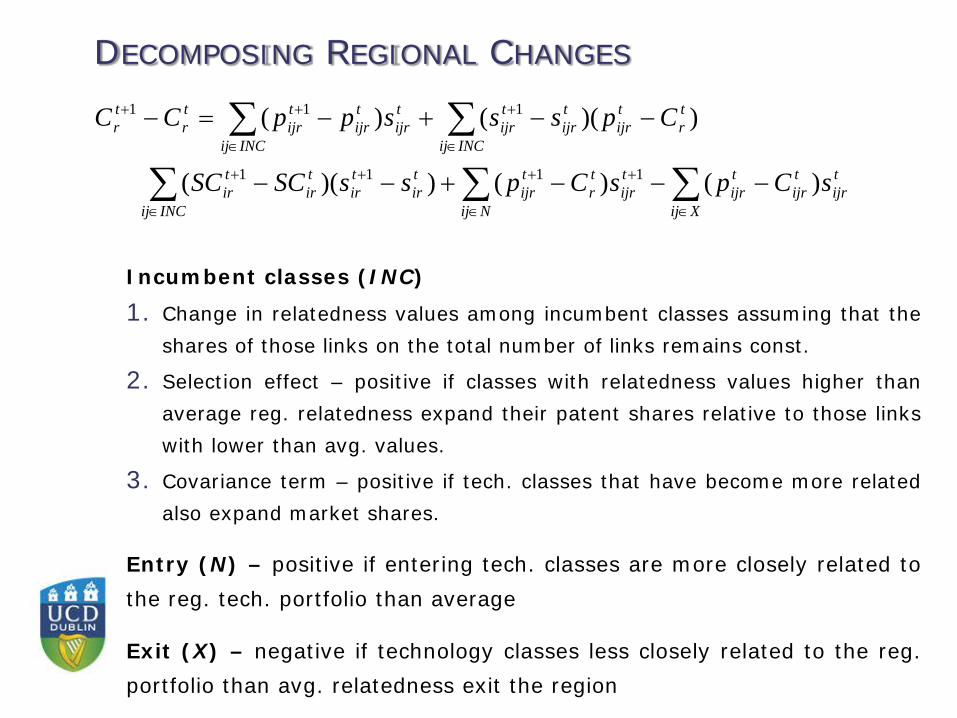
Incumbent classes (INC)
1. Change in relatedness values among incumbent classes assuming that the shares of those links on the total number of links remains const.
2. Selection effect – positive if classes with relatedness values higher than average reg. relatedness expand their patent shares relative to those links with lower than avg. values.
3. Covariance term – positive if tech. classes that have become more related also expand market shares.
Entry (N) – positive if entering tech. classes are more closely related to the reg. tech. portfolio than average
Exit (X) – negative if technology classes less closely related to the reg. portfolio than avg. relatedness exit the region
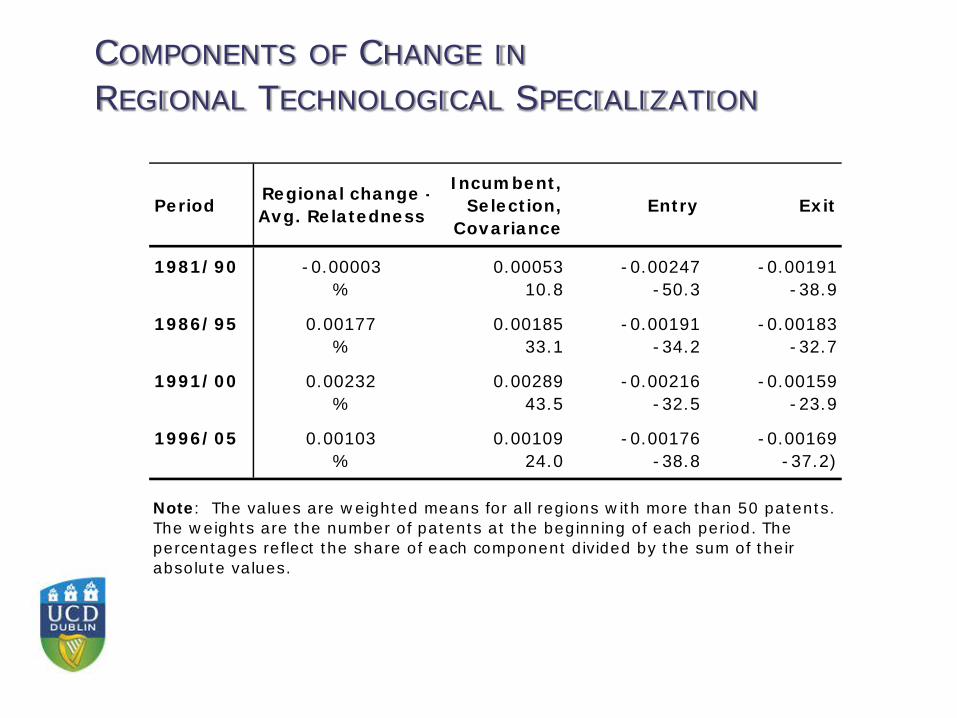
COMPONENTS OF CHANGE IN REGIONAL TECHNOLOGICAL SPECIALIZATION
PeriodRegional change - Avg. Relatedness
Incumbent, Selection,
CovarianceEntry Exit
1981/90 -0.00003 0.00053 -0.00247 -0.00191% 10.8 -50.3 -38.9
1986/95 0.00177 0.00185 -0.00191 -0.00183% 33.1 -34.2 -32.7
1991/00 0.00232 0.00289 -0.00216 -0.00159% 43.5 -32.5 -23.9
1996/05 0.00103 0.00109 -0.00176 -0.00169% 24.0 -38.8 -37.2)
Note: The values are weighted means for all regions with more than 50 patents. The weights are the number of patents at the beginning of each period. The percentages reflect the share of each component divided by the sum of their absolute values.
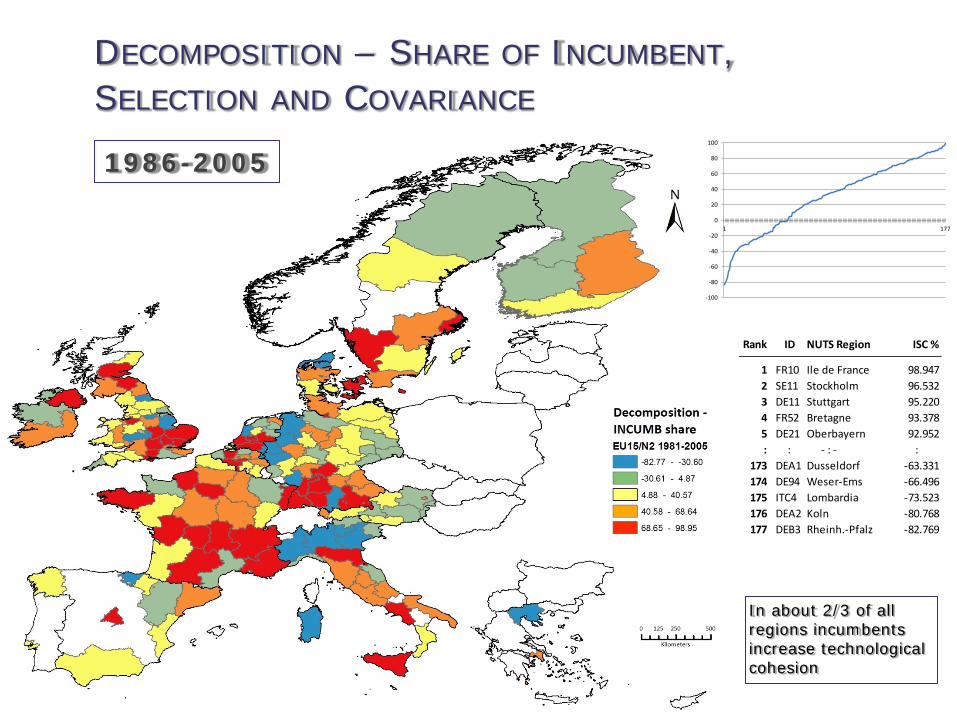
DECOMPOSITION – SHARE OF INCUMBENT, SELECTION AND COVARIANCE
1986-2005
-100
-80
-60
-40
-20
0
20
40
60
80
100
1 177
Rank ID NUTS Region ISC %
1 FR10 Ile de France 98.9472 SE11 Stockholm 96.5323 DE11 Stuttgart 95.2204 FR52 Bretagne 93.3785 DE21 Oberbayern 92.952: : - : - :
173 DEA1 Dusseldorf -63.331174 DE94 Weser-Ems -66.496175 ITC4 Lombardia -73.523176 DEA2 Koln -80.768177 DEB3 Rheinh.-Pfalz -82.769
In about 2/3 of all regions incumbents increase technological cohesion
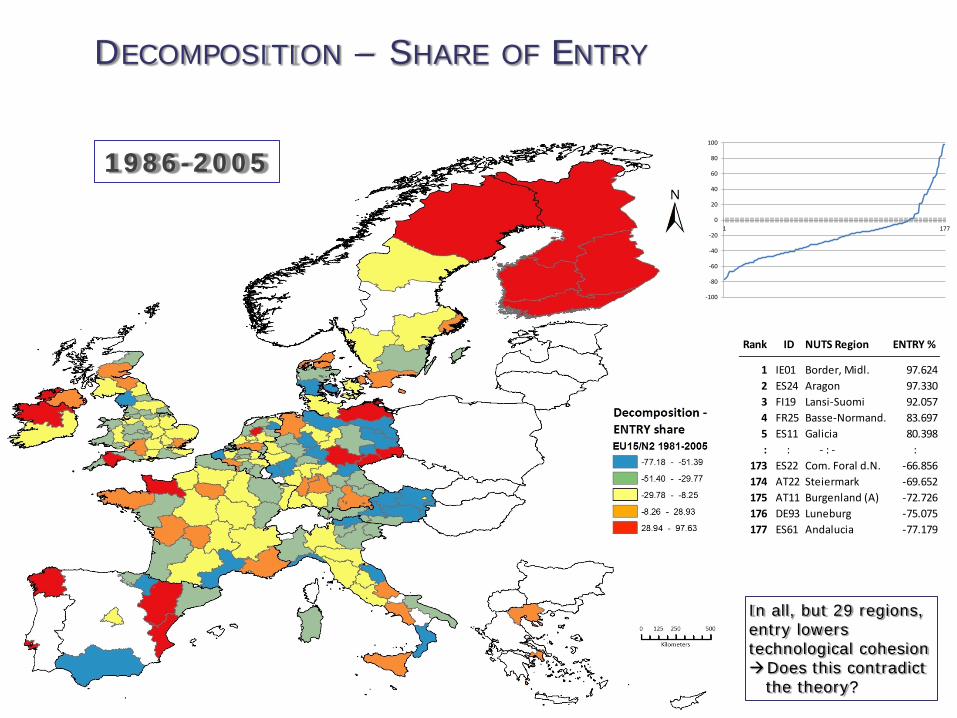
DECOMPOSITION – SHARE OF ENTRY
1986-2005
-100
-80
-60
-40
-20
0
20
40
60
80
100
1 177
Rank ID NUTS Region ENTRY %
1 IE01 Border, Midl. 97.6242 ES24 Aragon 97.3303 FI19 Lansi-Suomi 92.0574 FR25 Basse-Normand. 83.6975 ES11 Galicia 80.398: : - : - :
173 ES22 Com. Foral d.N. -66.856174 AT22 Steiermark -69.652175 AT11 Burgenland (A) -72.726176 DE93 Luneburg -75.075177 ES61 Andalucia -77.179
In all, but 29 regions, entry lowers technological cohesion Does this contradict the theory?
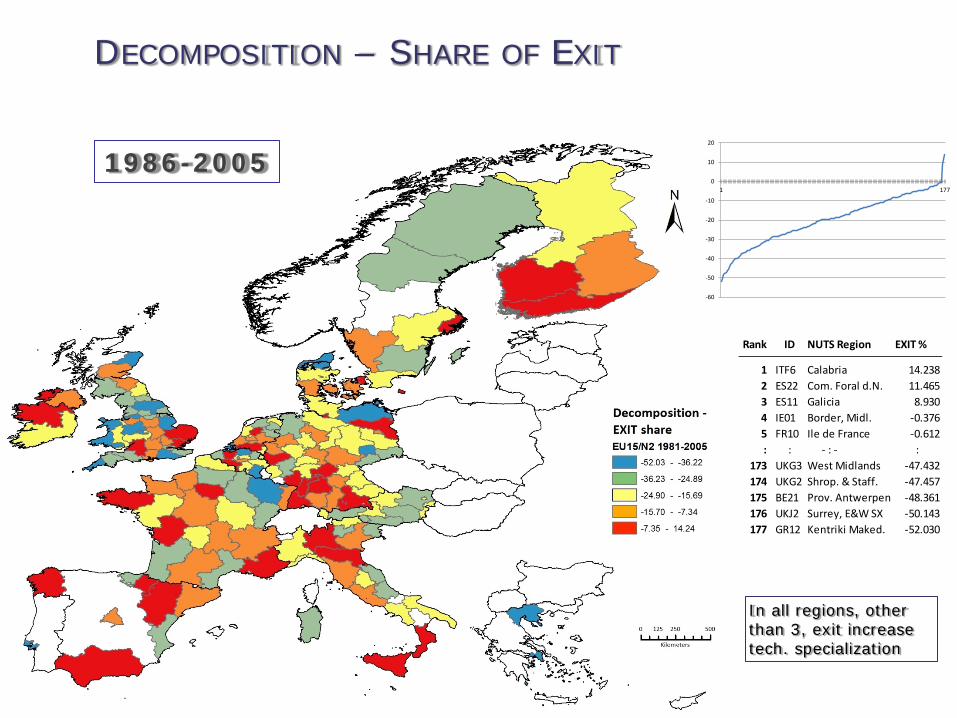
DECOMPOSITION – SHARE OF EXIT
1986-2005
-60
-50
-40
-30
-20
-10
0
10
20
1 177
Rank ID NUTS Region EXIT %
1 ITF6 Calabria 14.2382 ES22 Com. Foral d.N. 11.4653 ES11 Galicia 8.9304 IE01 Border, Midl. -0.3765 FR10 Ile de France -0.612: : - : - :
173 UKG3 West Midlands -47.432174 UKG2 Shrop. & Staff. -47.457175 BE21 Prov. Antwerpen -48.361176 UKJ2 Surrey, E&W SX -50.143177 GR12 Kentriki Maked. -52.030
In all regions, other than 3, exit increase tech. specialization
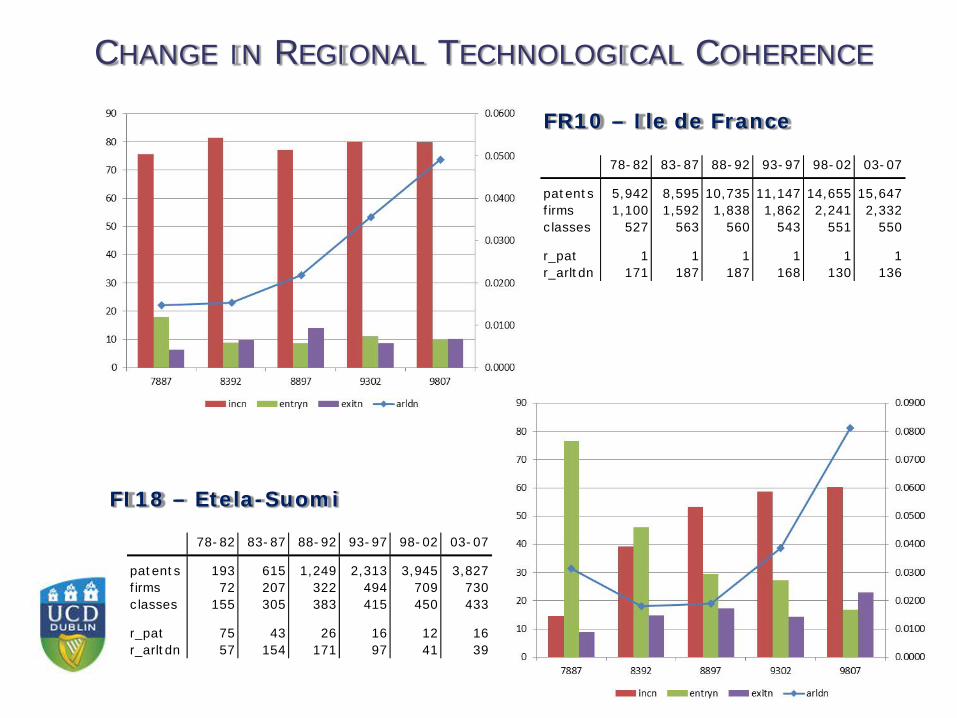
CHANGE IN REGIONAL TECHNOLOGICAL COHERENCE
FR10 – Ile de France
FI18 – Etela-Suomi
78-82 83-87 88-92 93-97 98-02 03-07
patents 5,942 8,595 10,735 11,147 14,655 15,647firms 1,100 1,592 1,838 1,862 2,241 2,332classes 527 563 560 543 551 550
r_pat 1 1 1 1 1 1r_arltdn 171 187 187 168 130 136
78-82 83-87 88-92 93-97 98-02 03-07
patents 193 615 1,249 2,313 3,945 3,827firms 72 207 322 494 709 730classes 155 305 383 415 450 433
r_pat 75 43 26 16 12 16r_arltdn 57 154 171 97 41 39
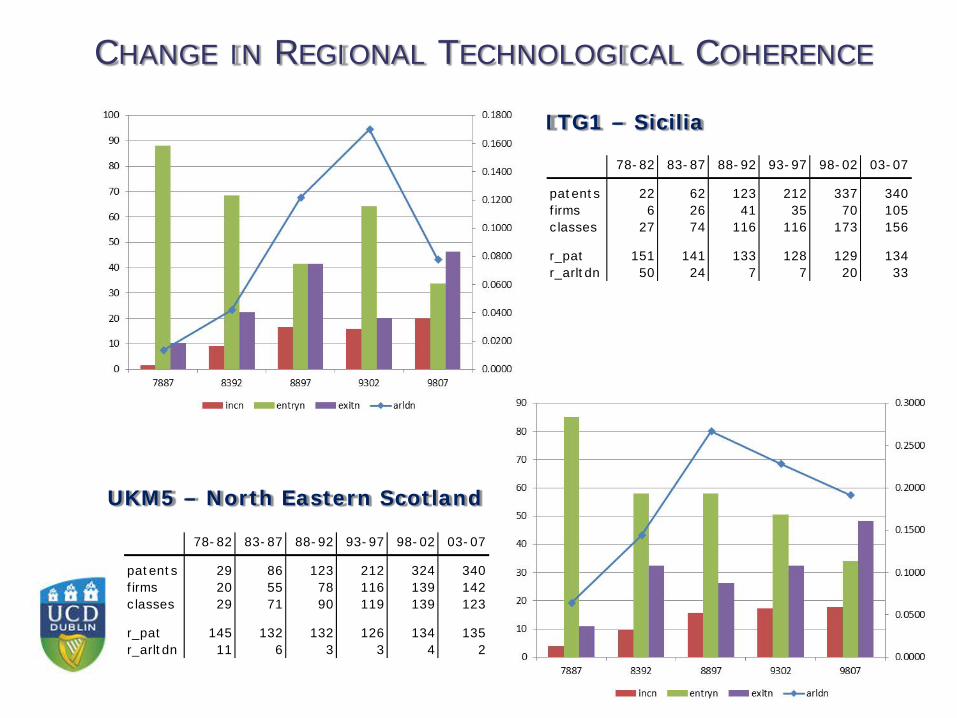
CHANGE IN REGIONAL TECHNOLOGICAL COHERENCE
ITG1 – Sicilia
UKM5 – North Eastern Scotland
78-82 83-87 88-92 93-97 98-02 03-07
patents 22 62 123 212 337 340firms 6 26 41 35 70 105classes 27 74 116 116 173 156
r_pat 151 141 133 128 129 134r_arltdn 50 24 7 7 20 33
78-82 83-87 88-92 93-97 98-02 03-07
patents 29 86 123 212 324 340firms 20 55 78 116 139 142classes 29 71 90 119 139 123
r_pat 145 132 132 126 134 135r_arltdn 11 6 3 3 4 2
ENTRY & EXIT OF TECHNOLOGIES IN REGIONS
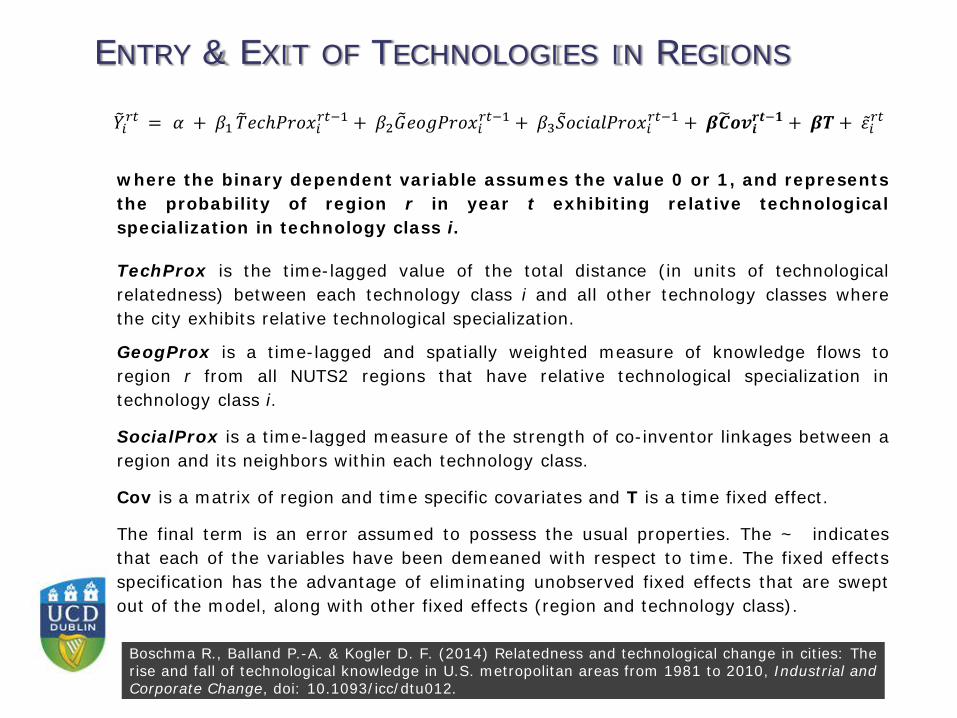
𝑌𝑌�𝑖𝑖𝑟𝑟𝑟𝑟 = 𝛼𝛼 + 𝛽𝛽1 𝑇𝑇�𝑒𝑒𝑒𝑒𝑒𝑒𝑒𝑒𝑒𝑒𝑒𝑒𝑒𝑖𝑖𝑟𝑟𝑟𝑟−1 + 𝛽𝛽2𝐺𝐺�𝑒𝑒𝑒𝑒𝑒𝑒𝑒𝑒𝑒𝑒𝑒𝑒𝑒𝑒𝑖𝑖𝑟𝑟𝑟𝑟−1 + 𝛽𝛽3�̃�𝑆𝑒𝑒𝑒𝑒𝑜𝑜𝑜𝑜𝑜𝑜𝑒𝑒𝑒𝑒𝑒𝑒𝑒𝑒𝑖𝑖𝑟𝑟𝑟𝑟−1 + 𝜷𝜷𝑪𝑪�𝒐𝒐𝒐𝒐𝒊𝒊𝒓𝒓𝒕𝒕−𝟏𝟏 + 𝜷𝜷𝜷𝜷 + 𝜀𝜀�̃�𝑖𝑟𝑟𝑟𝑟
where the binary dependent variable assumes the value 0 or 1, and represents the probability of region r in year t exhibiting relative technological specialization in technology class i. TechProx is the time-lagged value of the total distance (in units of technological relatedness) between each technology class i and all other technology classes where the city exhibits relative technological specialization.
GeogProx is a time-lagged and spatially weighted measure of knowledge flows to region r from all NUTS2 regions that have relative technological specialization in technology class i.
SocialProx is a time-lagged measure of the strength of co-inventor linkages between a region and its neighbors within each technology class.
Cov is a matrix of region and time specific covariates and T is a time fixed effect.
The final term is an error assumed to possess the usual properties. The ~ indicates that each of the variables have been demeaned with respect to time. The fixed effects specification has the advantage of eliminating unobserved fixed effects that are swept out of the model, along with other fixed effects (region and technology class).
Boschma R., Balland P.-A. & Kogler D. F. (2014) Relatedness and technological change in cities: The rise and fall of technological knowledge in U.S. metropolitan areas from 1981 to 2010, Industrial and Corporate Change, doi: 10.1093/icc/dtu012.
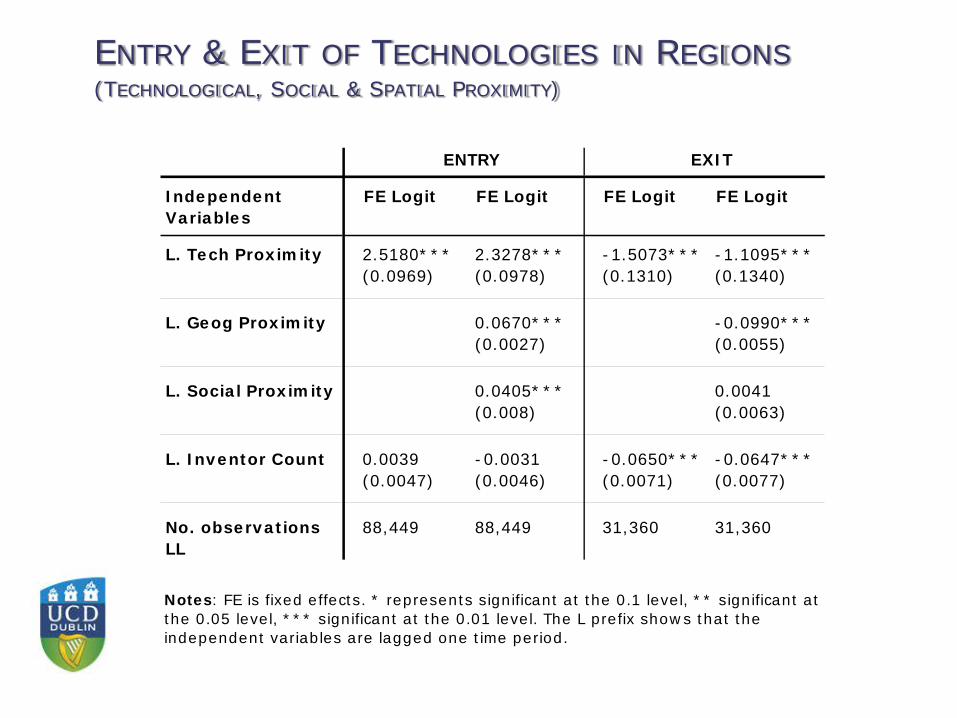
ENTRY & EXIT OF TECHNOLOGIES IN REGIONS (TECHNOLOGICAL, SOCIAL & SPATIAL PROXIMITY)
Independent FE Logit FE Logit FE Logit FE LogitVariables
L. Tech Proximity 2.5180*** 2.3278*** -1.5073*** -1.1095***(0.0969) (0.0978) (0.1310) (0.1340)
L. Geog Proximity 0.0670*** -0.0990***(0.0027) (0.0055)
L. Social Proximity 0.0405*** 0.0041(0.008) (0.0063)
L. Inventor Count 0.0039 -0.0031 -0.0650*** -0.0647***(0.0047) (0.0046) (0.0071) (0.0077)
No. observations 88,449 88,449 31,360 31,360LL
ENTRY EXIT
Notes: FE is fixed effects. * represents significant at the 0.1 level, ** significant at the 0.05 level, *** significant at the 0.01 level. The L prefix shows that the independent variables are lagged one time period.
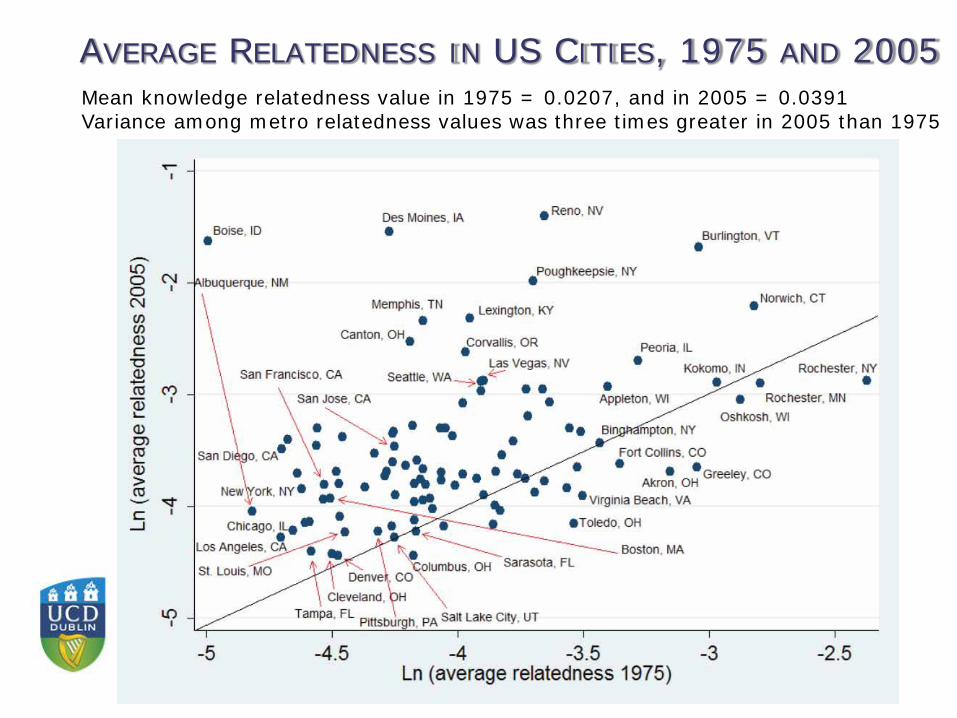
AVERAGE RELATEDNESS IN US CITIES, 1975 AND 2005 Mean knowledge relatedness value in 1975 = 0.0207, and in 2005 = 0.0391 Variance among metro relatedness values was three times greater in 2005 than 1975
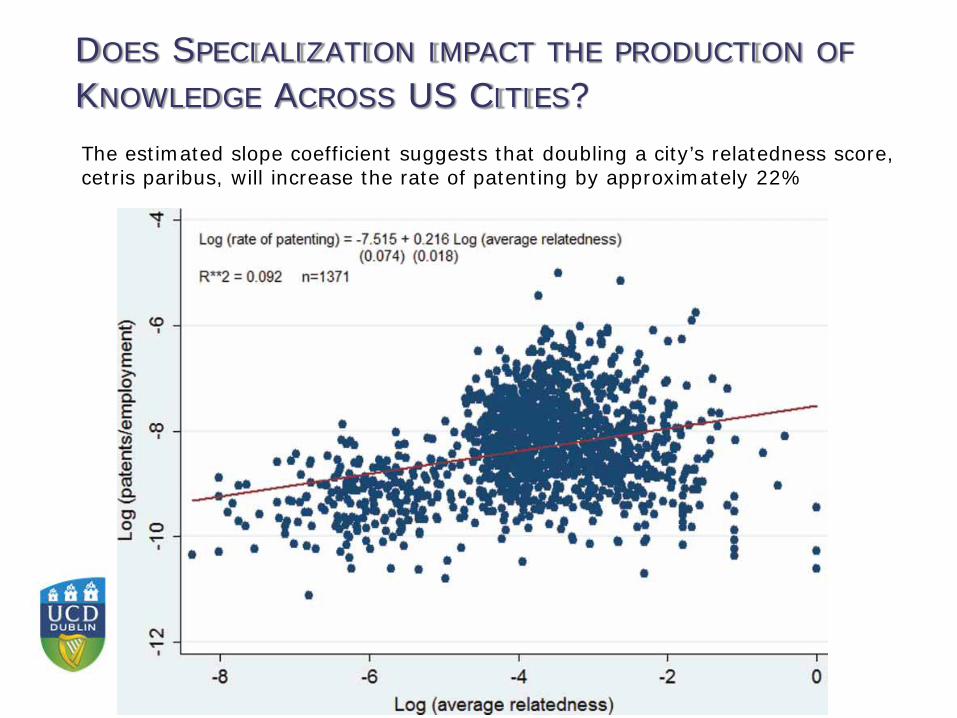
DOES SPECIALIZATION IMPACT THE PRODUCTION OF KNOWLEDGE ACROSS US CITIES? The estimated slope coefficient suggests that doubling a city’s relatedness score, cetris paribus, will increase the rate of patenting by approximately 22%
SUMMARY - CONCLUSIONS
The European and US Knowledge Space is evolving
Average Relatedness values increase overall, but vary substantially between technology sectors and regions
Changes in the technological coherence (specialization/diversification) of individual regions and cities are driven by entry, exit, and differential growth; the patterns point to specific regional technology trajectories
The entry and exit of regional technological knowledge is conditioned by technological and spatial proximity to existing knowledge cores, and to some extent also by social proximity and the number of inventors in a specific technology class.
Knowledge
Specialization TIME

POLICY IMPLICATIONS – FOLLOW-UP
The Smart Specialisation Thesis - weak empirical basis so far; the present research project should provide further insights.
Interpreting Results – difficult at times, e.g. entry decreases average relatedness, but on a second look the new technology classes that actually enter a place are closer to the regional knowledge space than the ones that don’t.
Follow-up and Next Steps – further analysis of the ‘actors’ (inventors/firms) of change, the ‘type’ of change (incremental/radical, and branching processes), and the link to policy initiatives, i.e. attracting vs. home grown.
Potential Avenue – drawing upon Ireland as a ‘laboratory’ to gain further insight into the evolutionary processes that potentially drive technological change/upgrading.
Knowledge
Specialization TIME

Dieter Franz Kogler
School of Geography, Planning & Env. Policy University College Dublin
MUNK School of Global Affairs - University of Toronto Innovation Policy Lab Speaker Series – Frontiers of Research in Global Innovation
Toronto, Canada, October 8th, 2014.
T H A N K Y O U !
Q E S T I O N S ?
Feldman M. P., Kogler D. F. & Rigby D. L. (2014) rKnowledge - The Spatial Diffusion & Adoption of rDNA Methods, Regional Studies, forthcoming March 2015.
Boschma R., Balland P.-A. & Kogler D. F. (2014) Relatedness and technological change in cities: The rise and fall of technological knowledge in U.S. metropolitan areas from 1981 to 2010, Industrial and Corporate Change, doi: 10.1093/icc/dtu012.
Kogler D. F., Rigby D. L. & Tucker I. (2013) Mapping Knowledge Space and Technological Relatedness in US Cities, European Planning Studies 21(9), 1374-1391.
Jürgen Essletzbichler University College London
David L. Rigby University of California, Los Angeles; UCLA
The research presented is part of the “International Knowledge Flows and Spillovers and the Evolution of National Technology Trajectories” Project. Financial support from the Regional Studies Association through the Early Career Grant Scheme, Ref.No. R13455, is gratefully acknowledged.
For further information and papers please visit: https://www.researchgate.net/profile/Dieter_Kogler or https://ucd.academia.edu/DieterFranzKogler
The research presented is joined work with: