Embed Size (px)
Citation preview
Toyota Supports ASE Certification Page 1 of 43
SS
002-03
Title:
O2S TEST RESULTS (MODE 05)Models:
All ’96 – ’03, ’04 Corolla, ECHO, Matrix, Sienna& Scion xA & xB
Technical ServiceBULLETIN
December 17, 2003
This Service Bulletin contains Oxygen Sensor (O2S) Monitor threshold values for allmodels from 1996 to 2003 and some 2004 models. Starting in 2004, the O2S Monitorthreshold values can be found in the repair manual. These values are used whenanalyzing the O2S test results to determine the O2S condition.
� All 1996 – 2003 model year Toyota vehicles.
� 2004 model year Corolla, ECHO, Matrix and Sienna vehicles.� 2004 model year Scion xA and xB vehicles.
Checking O2S Test Results
To view O2S test results, the O2S Monitor must be completed and the test results mustbe checked within the same key cycle. If the ignition key is cycled OFF, the O2S testresults will be set to the minimum or maximum limits, and all test results will be erased.The O2S test results are stored in the ECU (SAE term: Powertrain Control Module/PCM)when the monitor is completed. The test results are static and will not change once themonitor is complete.
The process for checking O2S test results is described in the following three basic steps:1. Completing the O2S Readiness Monitor (page 2).2. Accessing O2S Test Results (page 3).3. Comparing O2S Test Results to Failure Thresholds (page 4).
SPECIAL SERVICE TOOLS (SSTs) PART NUMBER QUANTITY
Toyota Diagnostic Tester Kit*(or any OBDII Scantool)
01001271 1
12 Megabyte Diagnostic Tester Program Cardwith version 10.1a Software (or later)* 01002593-005 1
* Essential SSTs.
NOTE:Additional Diagnostic Tester Kits, Program Cards or other SSTs may be ordered bycalling SPX/OTC at 1-800-933-8335.
OP CODE DESCRIPTION TIME OFP T1 T2
N/A Not Applicable to Warranty – – – –
SP
EC
IAL S
ER
VIC
E TO
OLSIntroduction
ApplicableVehicles
FunctionDescription
RequiredSSTs
WarrantyInformation
O2S TEST RESULTS (MODE 05) – SS002-03 December 17, 2003
Page 2 of 43
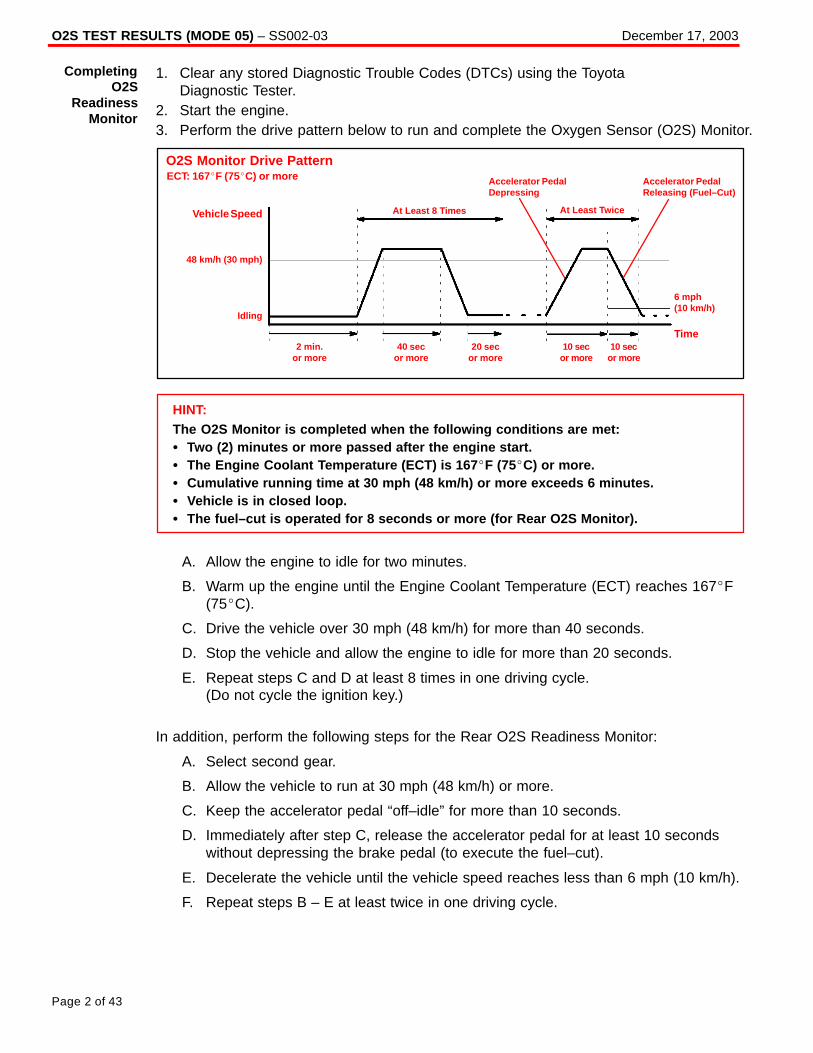
1. Clear any stored Diagnostic Trouble Codes (DTCs) using the Toyota Diagnostic Tester.
2. Start the engine.3. Perform the drive pattern below to run and complete the Oxygen Sensor (O2S) Monitor.
O2S Monitor Drive PatternECT: 167�F (75�C) or more
Vehicle Speed At Least 8 Times
48 km/h (30 mph)
Idling
At Least Twice
Accelerator PedalDepressing
Accelerator PedalReleasing (Fuel–Cut)
6 mph (10 km/h)
Time2 min.
or more40 sec
or more20 sec
or more10 sec
or more10 sec
or more
HINT:The O2S Monitor is completed when the following conditions are met:� Two (2) minutes or more passed after the engine start.� The Engine Coolant Temperature (ECT) is 167 �F (75�C) or more.� Cumulative running time at 30 mph (48 km/h) or more exceeds 6 minutes.� Vehicle is in closed loop.� The fuel–cut is operated for 8 seconds or more (for Rear O2S Monitor).
A. Allow the engine to idle for two minutes.
B. Warm up the engine until the Engine Coolant Temperature (ECT) reaches 167�F(75�C).
C. Drive the vehicle over 30 mph (48 km/h) for more than 40 seconds.
D. Stop the vehicle and allow the engine to idle for more than 20 seconds.
E. Repeat steps C and D at least 8 times in one driving cycle. (Do not cycle the ignition key.)
In addition, perform the following steps for the Rear O2S Readiness Monitor:
A. Select second gear.
B. Allow the vehicle to run at 30 mph (48 km/h) or more.
C. Keep the accelerator pedal “off–idle” for more than 10 seconds.
D. Immediately after step C, release the accelerator pedal for at least 10 secondswithout depressing the brake pedal (to execute the fuel–cut).
E. Decelerate the vehicle until the vehicle speed reaches less than 6 mph (10 km/h).
F. Repeat steps B – E at least twice in one driving cycle.
CompletingO2S
ReadinessMonitor

O2S TEST RESULTS (MODE 05) – SS002-03 December 17, 2003
Page 3 of 43
1. On the Diagnostic Tester* screen,select the following menus:
� DIAGNOSTICS� CARB OBD II� O2S TEST RESULTS
A list of the available oxygen sensorswill be displayed.
2. Select the desired oxygen sensor andpress Enter.
NOTE:The monitor result of the A/F sensor willnot be displayed. If you select“Bank 1–Sensor 1” or Bank 2–Sensor 1”for a vehicle equipped with an A/Fsensor, the Diagnostic Tester willdisplay “No parameter to display.”
3. Compare the test results with thevalues listed in the Failure Threshold Chart.
* Although this procedure references the Toyota Diagnostic Tester, the O2S test results can be checked using a generic OBDII scantool. Refer to your OBDII scantool operator’s manual for specific procedures.
AccessingO2S Test
Results
O2S TEST RESULT Screen
01 BANK 1 – SENSOR 1
01 BANK 1 – SENSOR 2
01 BANK 2 – SENSOR 1
01 BANK 2 – SENSOR 2
TEST DATA Screen
LOW SW V � � � � 0.400 V
HIGH SW V � � � � 0.550 V
MIN O2S V � � � � 0.100 V
MAX O2S V � � � � 0.900 V
TIME $81 � � � � � 17
NOTE:Before the O2S Monitor completes or after the ignition switch is turned OFF, theDiagnostic Tester displays the viewable upper limit or a lower limit of the test value(example: 0 V, 1.275 V, 0 s [seconds], 10.2 s, 0 and 255).
O2S TEST RESULTS (MODE 05) – SS002-03 December 17, 2003
Page 4 of 43
1. Determine the correct O2S Failure Threshold Chart for your vehicle by looking in the“O2S Application Table,” pages 5 – 9 in this bulletin.
2. Select appropriate year, model, and engine for specified O2S Failure Threshold Chart.
3. Compare O2S test results with the specified O2S Failure Threshold Chart. It may benecessary to convert O2S test results to a specific measurement unit using theconversion factor that is supplied in the specified table. See example below:
Example:
A. The Diagnostic Tester displays“17” as a value of the “Time $81”(see illustration).
B. Find the Conversion Factor valueof “Time $81” in the O2S FailureThreshold chart below. 0.3906 is specified for Time $81 in this chart.
C. Multiply “17” in step “A” by 0.3906(Conversion Factor) in step “B.”17 x 0.3906 = 6.6 %
D. If the answer is within theStandard Value of TEST LIMIT,the “Time $81” can be confirmedto be normal.
Example of O2S Failure Threshold Chart:
TEST ID DESCRIPTION OF TEST DATACONVERSION
FACTORUNIT
STANDARD VALUEOF TEST LIMIT
Time$81
Percentage of monitoring timewhere Oxygen Sensor voltage isless than 0.05V
Multiply 0.3906 % Within 60%
ComparingO2S Test
Results toFailure
Thresholds
Example
LOW SW V � � � � 0.400 VHIGH SW V � � � � 0.550 VMIN O2S V � � � � 0.035 VMAX O2S V � � � � 0.835 VTime $81 17Time $84 84Time $85 79
NOTE:� “LOW SW V” indicates the O2S
voltage when the O2S status changesfrom rich to lean.
� “HIGH SW V” indicates the O2Svoltage when the O2S status changesfrom lean to rich.
� If the O2S voltage is lower than“LOW SW V,” the O2S status is lean.
� If the O2S voltage is higher than“HIGH SW V,” the O2S status is rich.
O2S TEST RESULTS (MODE 05) – SS002-03 December 17, 2003
Page 5 of 43
MODEL YEAR MODEL ENGINE DRIVE TRAIN CERTIFICATIONSEE CHART NO.
(TSB PAGE)
Avalon 1MZ–FE All 50–State 1 (p. 10)
5S FEAll California 2 (p. 11)
Camry5S–FE
All Federal1 (p 10)
y
1MZ–FE All 50–State1 (p. 10)
7A–FE All 50–State 1 (p. 10)
Celica5S FE
All California 2 (p. 11)5S–FE
All Federal 1 (p. 10)
Corolla ALL All 50–State 1 (p. 10)
1996 Land Cruiser 1FZ–FE All 50–State 1 (p. 10)
Paseo 5E–FE All 50–State 1 (p. 10)
Previa 2TZ–FZE All 50–State 1 (p. 10)
RAV4 3S–FE All 50–State 2 (p. 11)
Supra ALL All 50–State 1 (p. 10)
Tacoma ALL All 50–State 1 (p. 10)
Tercel 5E–FE All 50–State 1 (p. 10)
T100 ALL All 50–State 1 (p. 10)
4Runner ALL All 50–State 1 (p. 10)
Avalon 1MZ–FE All 50–State 1 (p. 10)
5S FEAll California 3 (p. 12)
Camry5S–FE
All Federal1 (p 10)
y
1MZ–FE All 50–State1 (p. 10)
7A–FE All 50–State 1 (p. 10)
Celica5S FE
All California 2 (p. 11)5S–FE
All Federal 1 (p. 10)
Corolla ALL All 50–State 1 (p. 10)
Land Cruiser 1FZ–FE All 50–State 1 (p. 10)
Paseo 5E–FE All 50–State 1 (p. 10)
Previa 2TZ–FZE All 50–State 1 (p. 10)
1997 RAV4 3S–FE All 50–State 2 (p. 11)
Supra ALL All 50–State 1 (p. 10)
2RZ–FE All 50–State
A/T 50–State 1 (p. 10)
Tacoma 3RZ–FE M/T, 2WD 50–State
( )
M/T, 4WD 50–State2 (p 11)
5VZ–FE All 50–State2 (p. 11)
Tercel 5E–FE All 50–State 1 (p. 10)
T1003RZ–FE All 50–State 1 (p. 10)
T1005VZ–FE All 50–State 2 (p. 11)
4Runner3RZ–FE All 50–State 1 (p. 10)
4Runner5VZ–FE All 50–State 2 (p. 11)
O2SApplication
Table
O2S TEST RESULTS (MODE 05) – SS002-03 December 17, 2003
Page 6 of 43
MODEL YEAR MODEL ENGINE DRIVE TRAIN CERTIFICATIONSEE CHART NO.
(TSB PAGE)
Avalon 1MZ FEAll California 4 (p. 12)
Avalon 1MZ–FEAll Federal 1 (p. 10)
5S FEAll California 3 (p. 12)
5S–FEAll Federal 2 (p. 11)
CamryA/T
California 4 (p. 12)y
1MZ–FEA/T
Federal1 (p 10)
M/T 50–State1 (p. 10)
Celica 5S FEAll California 2 (p. 11)
Celica 5S–FEAll Federal 1 (p. 10)
Corolla 1ZZ–FE All 50–State 2 (p. 11)
1998 Land Cruiser 2UZ–FE All 50–State 2 (p. 11)
Paseo 5E–FE All 50–State 1 (p. 10)
RAV4 3S FEAll California 3 (p. 12)
RAV4 3S–FEAll Federal 2 (p. 11)
Sienna 1MZ–FE All 50–State 1 (p. 10)
Supra2JZ–GE All 50–State 2 (p. 11)
Supra2JZ–GTE All 50–State 1 (p. 10)
Tacoma ALL All 50–State 2 (p. 11)
Tercel 5E–FE All 50–State 1 (p. 10)
T100 ALL All 50–State 2 (p. 11)
4Runner ALL All 50–State 2 (p. 11)
Avalon 1MZ FEAll California 4 (p. 12)
Avalon 1MZ–FEAll Federal 5 (p. 13)
Camry CNG 5S–FNE All 50–State 6 (p. 13)
Celica 5S–FE All 50–State 5 (p. 13)
Corolla 1ZZ–FE All 50–State 2 (p. 11)
Land Cruiser 2UZ–FE All 50–State 2 (p. 11)
Paseo 5E–FE All 50–State 1 (p. 10)
RAV4 3S FEAll California 3 (p. 12)
RAV4 3S–FEAll Federal 2 (p. 11)
Sienna 1MZ FEAll California 4 (p. 12)
1999Sienna 1MZ–FE
All Federal 5 (p. 13)
5S FEAll California 3 (p. 12)
5S–FEAll Federal 5 (p. 13)
SolaraA/T
California 4 (p. 12)
1MZ–FEA/T
Federal5 (p 13)
M/T 50–State5 (p. 13)
Tacoma ALL All 50–State 2 (p. 11)
Tercel 5E–FE All 50–State 1 (p. 10)
3RZ–FE All 50–State 2 (p. 11)
4Runner5VZ FE
All California 4 (p. 12)5VZ–FE
All Federal 2 (p. 11)
O2SApplication
Table(Continued)
O2S TEST RESULTS (MODE 05) – SS002-03 December 17, 2003
Page 7 of 43
MODEL YEAR MODEL ENGINE DRIVE TRAIN CERTIFICATIONSEE CHART NO.
(TSB PAGE)
Avalon 1MZ–FE All 50–State 4 (p. 12)
Camry CNG 5S–FNE All 50–State 6 (p. 13)
Celica ALL All 50–State 1 (p. 10)
Corolla 1ZZ–FE All 50–State 7 (p. 14)
ECHO 1NZ–FE All 50–State 1 (p. 10)
Land Cruiser 2UZ–FE All 50–State 2 (p. 11)
MR2 1ZZ–FE All 50–State 1 (p. 10)
RAV4 3S FEAll California 4 (p. 12)
RAV4 3S–FEAll Federal 2 (p. 11)
Sienna 1MZ FEAll California 4 (p. 12)
Sienna 1MZ–FEAll Federal 5 (p. 13)
5S FEAll California 4 (p. 12)
5S–FEAll Federal 5 (p. 13)
SolaraA/T
California 4 (p. 12)
2000 1MZ–FEA/T
Federal5 (p 13)
M/T 50–State5 (p. 13)
2RZ FEAll California 4 (p. 12)
2RZ–FEAll Federal 2 (p. 11)
Tacoma 3RZ FEAll California 4 (p. 12)
Tacoma 3RZ–FEAll Federal 2 (p. 11)
5VZ FEAll California 8 (p. 15)
5VZ–FEAll Federal 2 (p. 11)
2UZ–FE All 50–State 2 (p. 11)
Tundra5VZ FE
All California 8 (p. 15)5VZ–FE
All Federal 2 (p. 11)
3RZ FEAll California 4 (p. 12)
4Runner
3RZ–FEAll Federal 2 (p. 11)
4Runner
5VZ FEAll California 8 (p. 15)
5VZ–FEAll Federal 2 (p. 11)
O2SApplication
Table(Continued)
O2S TEST RESULTS (MODE 05) – SS002-03 December 17, 2003
Page 8 of 43
MODEL YEAR MODEL ENGINE DRIVE TRAIN CERTIFICATIONSEE CHART NO.
(TSB PAGE)
Avalon 1MZ–FE All 50–State 4 (p. 12)
Camry CNG 5S–FNE All 50–State 6 (p. 13)
Celica ALL All 50–State 1 (p. 10)
Corolla 1ZZ–FE All 50–State 7 (p. 14)
ECHO 1NZ–FE All 50–State 1 (p. 10)
Highlander1MZ–FE All 50–State 9 (p. 15)
Highlander2AZ–FE All 50–State 3 (p. 12)
Land Cruiser 2UZ–FE All 50–State 1 (p. 10)
MR2 1ZZ–FE All 50–State 1 (p. 10)
2001Prius 1NZ–FXE All 50–State 11 (p. 17)
2001RAV4 1AZ–FE All 50–State 4 (p. 12)
Sequoia 2UZ–FE All 50–State 1 (p. 10)
Sienna 1MZ–FE All 50–State 4 (p. 12)
5S–FE All 50–State 3 (p. 12)
Solara1MZ FE
A/T 50–State 9 (p. 15)1MZ–FE
M/T 50–State 10 (p. 16)
Tacoma ALL All 50–State 4 (p. 12)
Tundra2UZ–FE All 50–State 1 (p. 10)
Tundra5VZ–FE All 50–State 4 (p. 12)
4Runner ALL All 50–State 4 (p. 12)
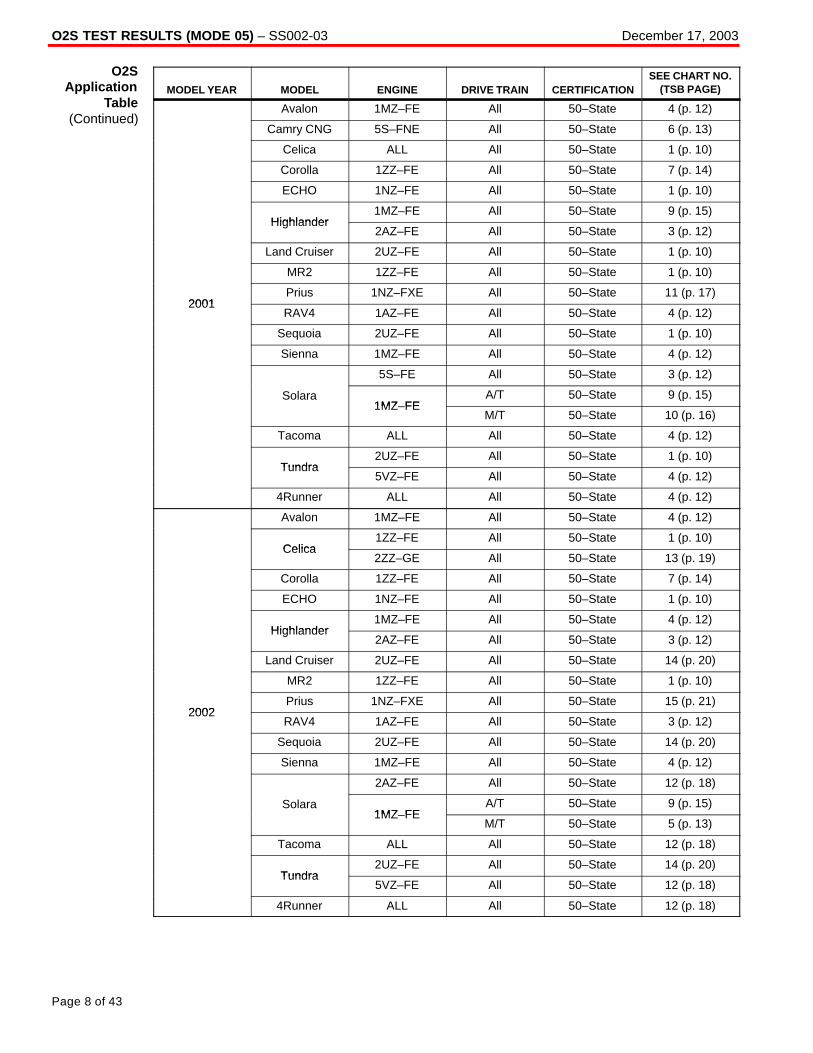
Avalon 1MZ–FE All 50–State 4 (p. 12)
Celica1ZZ–FE All 50–State 1 (p. 10)
Celica2ZZ–GE All 50–State 13 (p. 19)
Corolla 1ZZ–FE All 50–State 7 (p. 14)
ECHO 1NZ–FE All 50–State 1 (p. 10)
Highlander1MZ–FE All 50–State 4 (p. 12)
Highlander2AZ–FE All 50–State 3 (p. 12)
Land Cruiser 2UZ–FE All 50–State 14 (p. 20)
MR2 1ZZ–FE All 50–State 1 (p. 10)
2002Prius 1NZ–FXE All 50–State 15 (p. 21)
2002RAV4 1AZ–FE All 50–State 3 (p. 12)
Sequoia 2UZ–FE All 50–State 14 (p. 20)
Sienna 1MZ–FE All 50–State 4 (p. 12)
2AZ–FE All 50–State 12 (p. 18)
Solara1MZ FE
A/T 50–State 9 (p. 15)1MZ–FE
M/T 50–State 5 (p. 13)
Tacoma ALL All 50–State 12 (p. 18)
Tundra2UZ–FE All 50–State 14 (p. 20)
Tundra5VZ–FE All 50–State 12 (p. 18)
4Runner ALL All 50–State 12 (p. 18)
O2SApplication
Table(Continued)
O2S TEST RESULTS (MODE 05) – SS002-03 December 17, 2003
Page 9 of 43
MODEL YEAR MODEL ENGINE DRIVE TRAIN CERTIFICATIONSEE CHART NO.
(TSB PAGE)
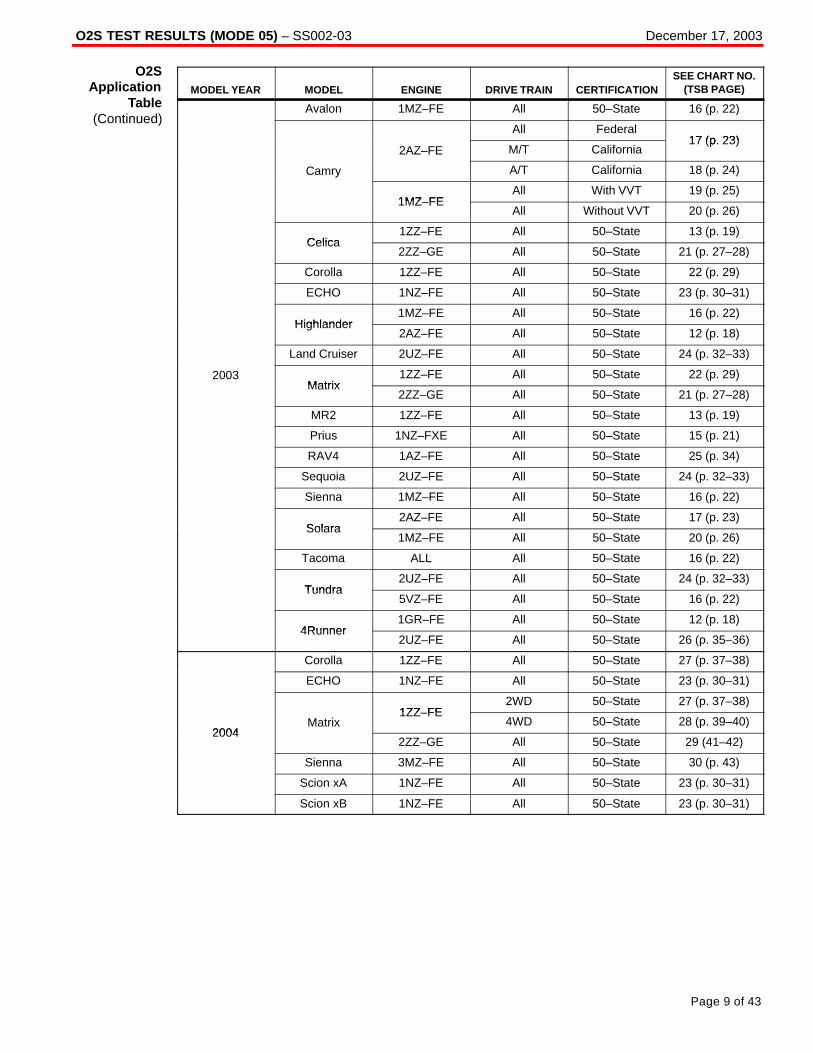
Avalon 1MZ–FE All 50–State 16 (p. 22)
All Federal17 (p 23)
2AZ–FE M/T California17 (p. 23)
Camry A/T California 18 (p. 24)y
1MZ FEAll With VVT 19 (p. 25)
1MZ–FEAll Without VVT 20 (p. 26)
Celica1ZZ–FE All 50–State 13 (p. 19)
Celica2ZZ–GE All 50–State 21 (p. 27–28)
Corolla 1ZZ–FE All 50–State 22 (p. 29)
ECHO 1NZ–FE All 50–State 23 (p. 30–31)
Highlander1MZ–FE All 50–State 16 (p. 22)
Highlander2AZ–FE All 50–State 12 (p. 18)
Land Cruiser 2UZ–FE All 50–State 24 (p. 32–33)
2003Matrix
1ZZ–FE All 50–State 22 (p. 29)Matrix
2ZZ–GE All 50–State 21 (p. 27–28)
MR2 1ZZ–FE All 50–State 13 (p. 19)
Prius 1NZ–FXE All 50–State 15 (p. 21)
RAV4 1AZ–FE All 50–State 25 (p. 34)
Sequoia 2UZ–FE All 50–State 24 (p. 32–33)
Sienna 1MZ–FE All 50–State 16 (p. 22)
Solara2AZ–FE All 50–State 17 (p. 23)
Solara1MZ–FE All 50–State 20 (p. 26)
Tacoma ALL All 50–State 16 (p. 22)
Tundra2UZ–FE All 50–State 24 (p. 32–33)
Tundra5VZ–FE All 50–State 16 (p. 22)
4Runner1GR–FE All 50–State 12 (p. 18)
4Runner2UZ–FE All 50–State 26 (p. 35–36)
Corolla 1ZZ–FE All 50–State 27 (p. 37–38)
ECHO 1NZ–FE All 50–State 23 (p. 30–31)
1ZZ FE2WD 50–State 27 (p. 37–38)
2004Matrix
1ZZ–FE4WD 50–State 28 (p. 39–40)
20042ZZ–GE All 50–State 29 (41–42)
Sienna 3MZ–FE All 50–State 30 (p. 43)
Scion xA 1NZ–FE All 50–State 23 (p. 30–31)
Scion xB 1NZ–FE All 50–State 23 (p. 30–31)
O2SApplication
Table(Continued)
O2S TEST RESULTS (MODE 05) – SS002-03 December 17, 2003
Page 10 of 43
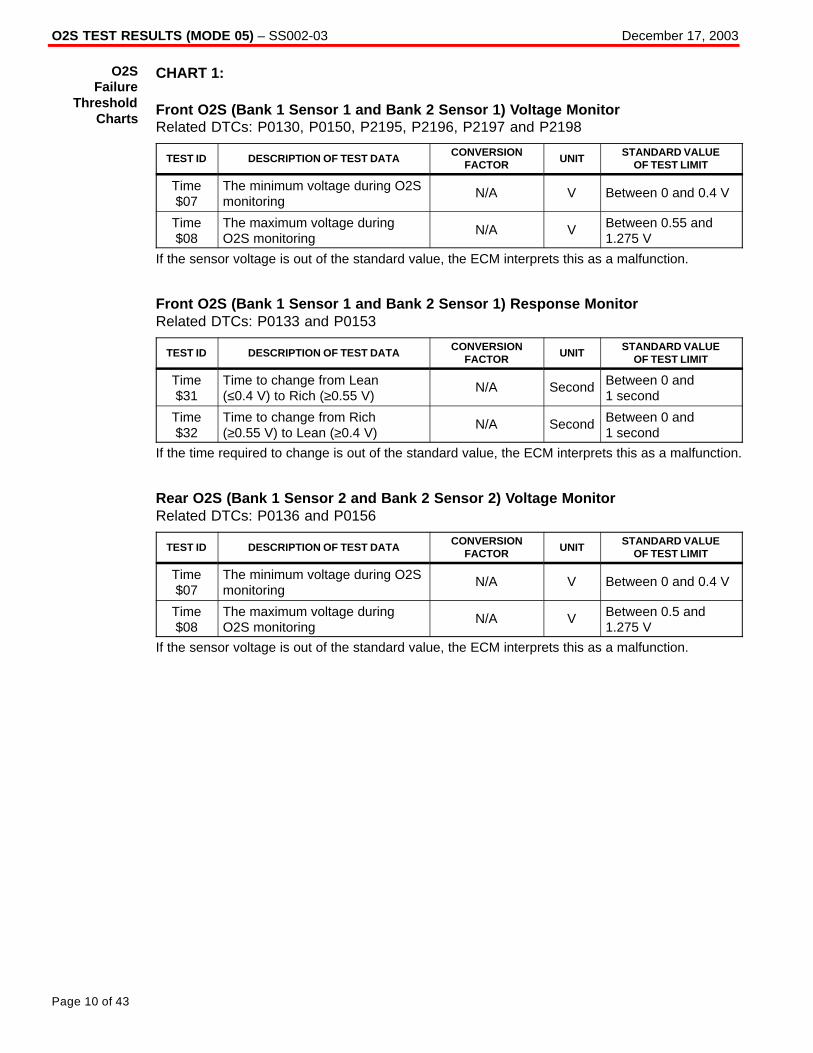
CHART 1:
Front O2S (Bank 1 Sensor 1 and Bank 2 Sensor 1) Voltage MonitorRelated DTCs: P0130, P0150, P2195, P2196, P2197 and P2198
TEST ID DESCRIPTION OF TEST DATACONVERSION
FACTORUNIT
STANDARD VALUEOF TEST LIMIT
Time$07
The minimum voltage during O2Smonitoring
N/A V Between 0 and 0.4 V
Time$08
The maximum voltage duringO2S monitoring
N/A V Between 0.55 and1.275 V
If the sensor voltage is out of the standard value, the ECM interprets this as a malfunction.
Front O2S (Bank 1 Sensor 1 and Bank 2 Sensor 1) Response MonitorRelated DTCs: P0133 and P0153
TEST ID DESCRIPTION OF TEST DATACONVERSION
FACTORUNIT
STANDARD VALUEOF TEST LIMIT
Time$31
Time to change from Lean(≤0.4 V) to Rich (≥0.55 V)
N/A Second Between 0 and1 second
Time$32
Time to change from Rich(≥0.55 V) to Lean (≥0.4 V)
N/A Second Between 0 and1 second
If the time required to change is out of the standard value, the ECM interprets this as a malfunction.
Rear O2S (Bank 1 Sensor 2 and Bank 2 Sensor 2) Voltage MonitorRelated DTCs: P0136 and P0156
TEST ID DESCRIPTION OF TEST DATACONVERSION
FACTORUNIT
STANDARD VALUEOF TEST LIMIT
Time$07
The minimum voltage during O2Smonitoring
N/A V Between 0 and 0.4 V
Time$08
The maximum voltage duringO2S monitoring
N/A V Between 0.5 and1.275 V
If the sensor voltage is out of the standard value, the ECM interprets this as a malfunction.
O2SFailure
ThresholdCharts

O2S TEST RESULTS (MODE 05) – SS002-03 December 17, 2003
Page 11 of 43
CHART 2:
Front O2S (Bank 1 Sensor 1 and Bank 2 Sensor 1) Voltage MonitorRelated DTCs: P0130, P0150, P2195, P2196, P2197 and P2198
TEST ID DESCRIPTION OF TEST DATACONVERSION
FACTORUNIT
STANDARD VALUEOF TEST LIMIT
$07 The minimum voltage duringO2S monitoring
N/A V Between 0 and0.35 V
Time$08
The maximum voltage duringO2S monitoring
N/A V Between 0.55 and1.275 V
If the sensor voltage is out of the standard value, the ECM interprets this as a malfunction.
Front O2S (Bank 1 Sensor 1 and Bank 2 Sensor 1) Response MonitorRelated DTCs: P0133 and P0153
TEST ID DESCRIPTION OF TEST DATACONVERSION
FACTORUNIT
STANDARD VALUEOF TEST LIMIT
Time$31
Time to change from Lean(≤0.35 V) to Rich (≥0.55 V)
N/A Second Between 0 and1.1 seconds
Time$32
Time to change from Rich(≥0.55 V) to Lean (≥0.35 V)
N/A Second Between 0 and1.1 seconds
If the time required to change is out of the standard value, the ECM interprets this as a malfunction.
Rear O2S (Bank 1 Sensor 2 and Bank 2 Sensor 2) Voltage MonitorRelated DTCs: P0136 and P0156
TEST ID DESCRIPTION OF TEST DATACONVERSION
FACTORUNIT
STANDARD VALUEOF TEST LIMIT
Time$07
The minimum voltage duringO2S monitoring
N/A V Between 0 and 0.4 V
Time$08
The maximum voltage duringO2S monitoring
N/A V Between 0.5 and1.275 V
If the sensor voltage is out of the standard value, the ECM interprets this as a malfunction.
O2SFailure
ThresholdCharts
(Continued)
O2S TEST RESULTS (MODE 05) – SS002-03 December 17, 2003
Page 12 of 43
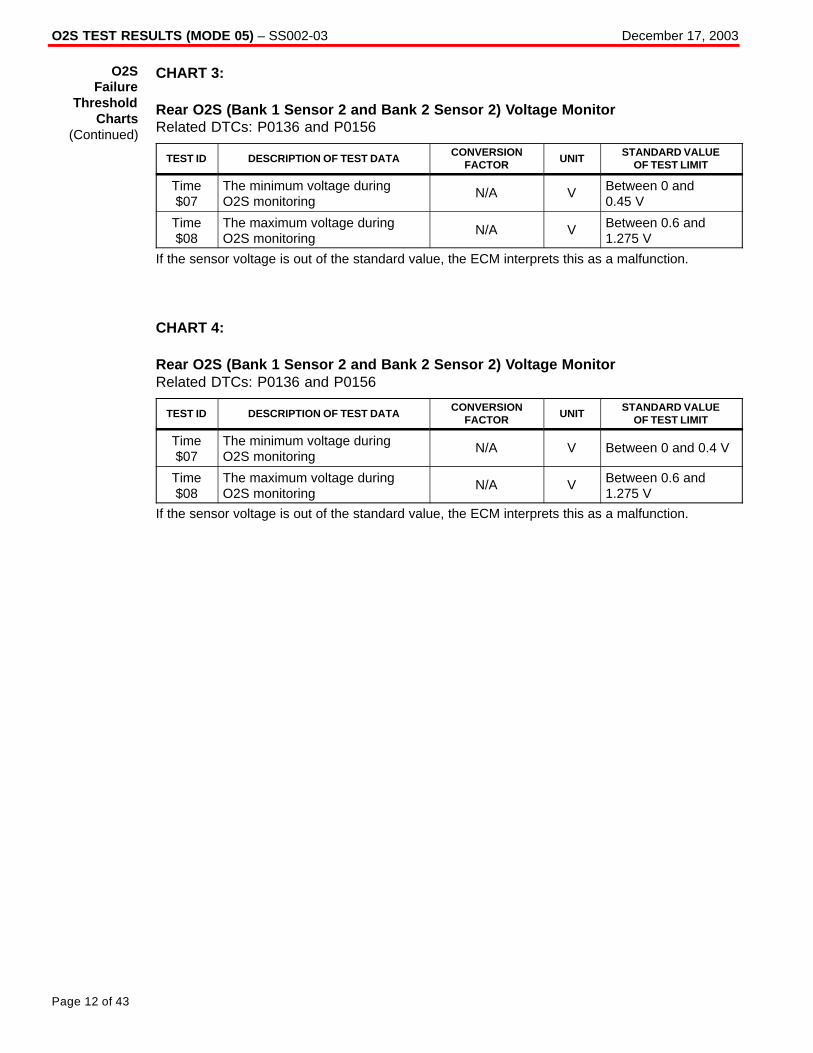
CHART 3:
Rear O2S (Bank 1 Sensor 2 and Bank 2 Sensor 2) Voltage MonitorRelated DTCs: P0136 and P0156
TEST ID DESCRIPTION OF TEST DATACONVERSION
FACTORUNIT
STANDARD VALUEOF TEST LIMIT
Time$07
The minimum voltage duringO2S monitoring
N/A V Between 0 and0.45 V
Time$08
The maximum voltage duringO2S monitoring
N/A V Between 0.6 and1.275 V
If the sensor voltage is out of the standard value, the ECM interprets this as a malfunction.
CHART 4:
Rear O2S (Bank 1 Sensor 2 and Bank 2 Sensor 2) Voltage MonitorRelated DTCs: P0136 and P0156
TEST ID DESCRIPTION OF TEST DATACONVERSION
FACTORUNIT
STANDARD VALUEOF TEST LIMIT
Time$07
The minimum voltage duringO2S monitoring
N/A V Between 0 and 0.4 V
Time$08
The maximum voltage duringO2S monitoring
N/A V Between 0.6 and1.275 V
If the sensor voltage is out of the standard value, the ECM interprets this as a malfunction.
O2SFailure
ThresholdCharts
(Continued)

O2S TEST RESULTS (MODE 05) – SS002-03 December 17, 2003
Page 13 of 43
CHART 5:
Front O2S (Bank 1 Sensor 1 and Bank 2 Sensor 1) Voltage MonitorRelated DTCs: P0130, P0150, P2195, P2196, P2197 and P2198
TEST ID DESCRIPTION OF TEST DATACONVERSION
FACTORUNIT
STANDARD VALUEOF TEST LIMIT
Time$07
The minimum voltage duringO2S monitoring
N/A V Between 0 and 0.4 V
Time$08
The maximum voltage duringO2S monitoring
N/A V Between 0.55 and1.275 V
If the sensor voltage is out of the standard value, the ECM interprets this as a malfunction.
Front O2S (Bank 1 Sensor 1 and Bank 2 Sensor 1) Response MonitorRelated DTCs: P0133 and P0153
TEST ID DESCRIPTION OF TEST DATACONVERSION
FACTORUNIT
STANDARD VALUEOF TEST LIMIT
Time$31
Time to change from Lean(≤0.4 V) to Rich (≥0.55 V)
N/A Second Between 0 and1.1 seconds
Time$32
Time to change from Rich(≥0.55 V) to Lean (≤0.4 V)
N/A Second Between 0 and1.1 seconds
If the time required to change is out of the standard value, the ECM interprets this as a malfunction.
Rear O2S (Bank 1 Sensor 2 and Bank 2 Sensor 2) Voltage MonitorRelated DTCs: P0136 and P0156
TEST ID DESCRIPTION OF TEST DATACONVERSION
FACTORUNIT
STANDARD VALUEOF TEST LIMIT
Time$07
The minimum voltage duringO2S monitoring
N/A V Between 0 and 0.4 V
Time$08
The maximum voltage duringO2S monitoring
N/A V Between 0.5 and1.275 V
If the sensor voltage is out of the standard value, the ECM interprets this as a malfunction.
CHART 6:
Rear O2S (Bank 1 Sensor 2 and Bank 2 Sensor 2) Voltage MonitorRelated DTCs: P0136 and P0156
TEST ID DESCRIPTION OF TEST DATACONVERSION
FACTORUNIT
STANDARD VALUEOF TEST LIMIT
Time$07
The minimum voltage duringO2S monitoring
N/A V Between 0 and0.55 V
Time$08
The maximum voltage duringO2S monitoring
N/A V Between 1 and1.275 V
If the sensor voltage is out of the standard value, the ECM interprets this as a malfunction.
O2SFailure
ThresholdCharts
(Continued)
O2S TEST RESULTS (MODE 05) – SS002-03 December 17, 2003
Page 14 of 43
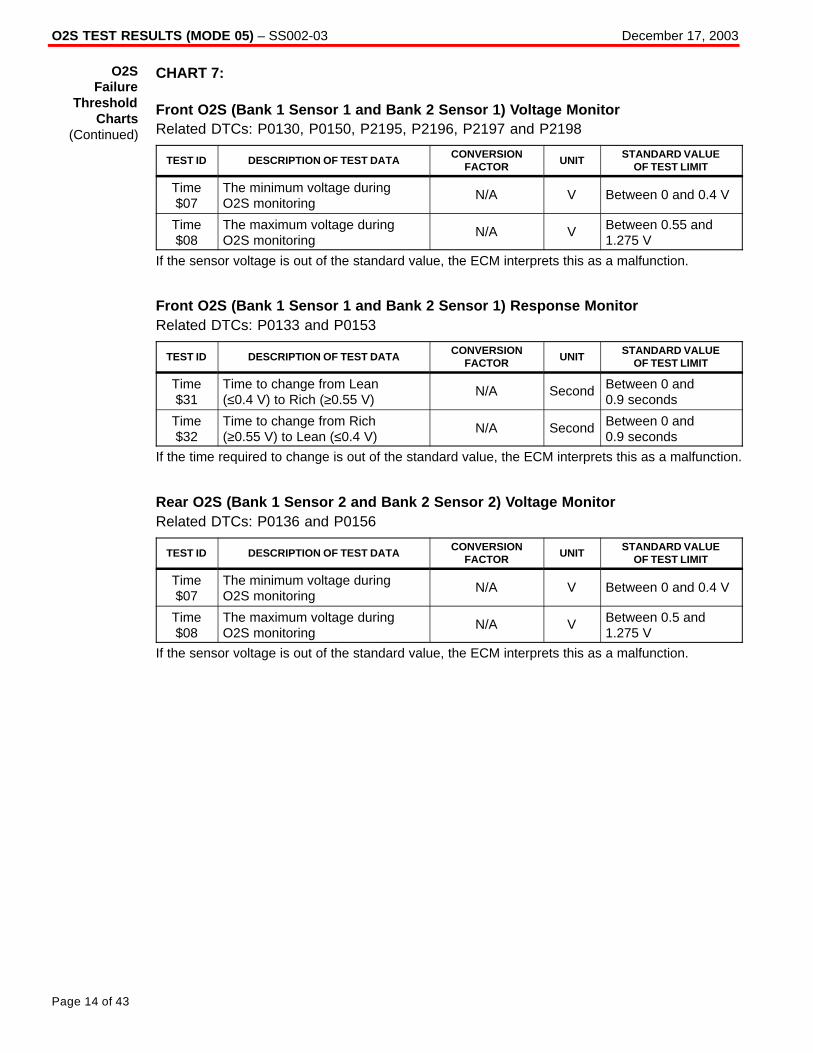
CHART 7:
Front O2S (Bank 1 Sensor 1 and Bank 2 Sensor 1) Voltage MonitorRelated DTCs: P0130, P0150, P2195, P2196, P2197 and P2198
TEST ID DESCRIPTION OF TEST DATACONVERSION
FACTORUNIT
STANDARD VALUEOF TEST LIMIT
Time$07
The minimum voltage duringO2S monitoring
N/A V Between 0 and 0.4 V
Time$08
The maximum voltage duringO2S monitoring
N/A V Between 0.55 and1.275 V
If the sensor voltage is out of the standard value, the ECM interprets this as a malfunction.
Front O2S (Bank 1 Sensor 1 and Bank 2 Sensor 1) Response MonitorRelated DTCs: P0133 and P0153
TEST ID DESCRIPTION OF TEST DATACONVERSION
FACTORUNIT
STANDARD VALUEOF TEST LIMIT
Time$31
Time to change from Lean(≤0.4 V) to Rich (≥0.55 V)
N/A Second Between 0 and0.9 seconds
Time$32
Time to change from Rich(≥0.55 V) to Lean (≤0.4 V)
N/A Second Between 0 and0.9 seconds
If the time required to change is out of the standard value, the ECM interprets this as a malfunction.
Rear O2S (Bank 1 Sensor 2 and Bank 2 Sensor 2) Voltage MonitorRelated DTCs: P0136 and P0156
TEST ID DESCRIPTION OF TEST DATACONVERSION
FACTORUNIT
STANDARD VALUEOF TEST LIMIT
Time$07
The minimum voltage duringO2S monitoring
N/A V Between 0 and 0.4 V
Time$08
The maximum voltage duringO2S monitoring
N/A V Between 0.5 and1.275 V
If the sensor voltage is out of the standard value, the ECM interprets this as a malfunction.
O2SFailure
ThresholdCharts
(Continued)
O2S TEST RESULTS (MODE 05) – SS002-03 December 17, 2003
Page 15 of 43
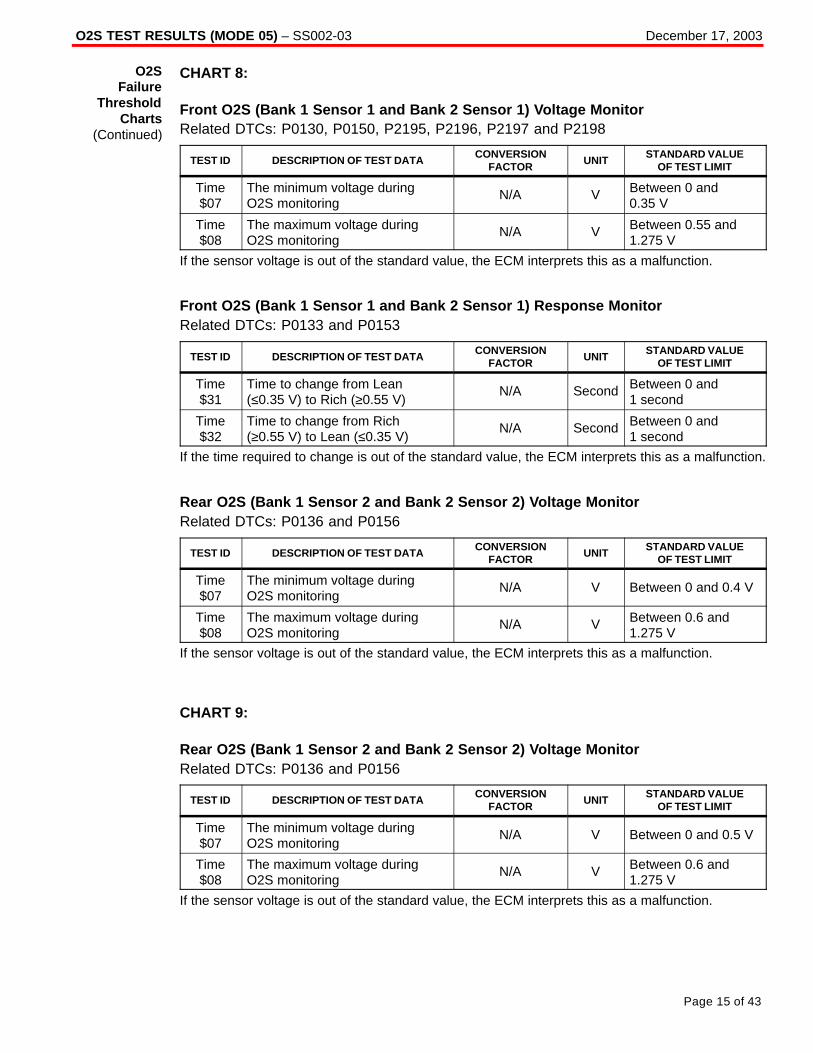
CHART 8:
Front O2S (Bank 1 Sensor 1 and Bank 2 Sensor 1) Voltage MonitorRelated DTCs: P0130, P0150, P2195, P2196, P2197 and P2198
TEST ID DESCRIPTION OF TEST DATACONVERSION
FACTORUNIT
STANDARD VALUEOF TEST LIMIT
Time$07
The minimum voltage duringO2S monitoring
N/A V Between 0 and0.35 V
Time$08
The maximum voltage duringO2S monitoring
N/A V Between 0.55 and1.275 V
If the sensor voltage is out of the standard value, the ECM interprets this as a malfunction.
Front O2S (Bank 1 Sensor 1 and Bank 2 Sensor 1) Response MonitorRelated DTCs: P0133 and P0153
TEST ID DESCRIPTION OF TEST DATACONVERSION
FACTORUNIT
STANDARD VALUEOF TEST LIMIT
Time$31
Time to change from Lean(≤0.35 V) to Rich (≥0.55 V)
N/A Second Between 0 and1 second
Time$32
Time to change from Rich(≥0.55 V) to Lean (≤0.35 V)
N/A Second Between 0 and1 second
If the time required to change is out of the standard value, the ECM interprets this as a malfunction.
Rear O2S (Bank 1 Sensor 2 and Bank 2 Sensor 2) Voltage MonitorRelated DTCs: P0136 and P0156
TEST ID DESCRIPTION OF TEST DATACONVERSION
FACTORUNIT
STANDARD VALUEOF TEST LIMIT
Time$07
The minimum voltage duringO2S monitoring
N/A V Between 0 and 0.4 V
Time$08
The maximum voltage duringO2S monitoring
N/A V Between 0.6 and1.275 V
If the sensor voltage is out of the standard value, the ECM interprets this as a malfunction.
CHART 9:
Rear O2S (Bank 1 Sensor 2 and Bank 2 Sensor 2) Voltage MonitorRelated DTCs: P0136 and P0156
TEST ID DESCRIPTION OF TEST DATACONVERSION
FACTORUNIT
STANDARD VALUEOF TEST LIMIT
Time$07
The minimum voltage duringO2S monitoring
N/A V Between 0 and 0.5 V
Time$08
The maximum voltage duringO2S monitoring
N/A V Between 0.6 and1.275 V
If the sensor voltage is out of the standard value, the ECM interprets this as a malfunction.
O2SFailure
ThresholdCharts
(Continued)

O2S TEST RESULTS (MODE 05) – SS002-03 December 17, 2003
Page 16 of 43
CHART 10:
Front O2S (Bank 1 Sensor 1 and Bank 2 Sensor 1) Voltage MonitorRelated DTCs: P0130, P0150, P2195, P2196, P2197 and P2198
TEST ID DESCRIPTION OF TEST DATACONVERSION
FACTORUNIT
STANDARD VALUEOF TEST LIMIT
Time$07
The minimum voltage duringO2S monitoring
N/A V Between 0 and 0.4 V
Time$08
The maximum voltage duringO2S monitoring
N/A V Between 0.55 and1.275 V
If the sensor voltage is out of the standard value, the ECM interprets this as a malfunction.
Front O2S (Bank 1 Sensor 1 and Bank 2 Sensor 1) Response MonitorRelated DTCs: P0133 and P0153
TEST ID DESCRIPTION OF TEST DATACONVERSION
FACTORUNIT
STANDARD VALUEOF TEST LIMIT
Time$31
Time to change from Lean(≤0.4 V) to Rich (≥0.55 V)
N/A Second Between 0 and1.1 seconds
Time$32
Time to change from Rich(≥0.55 V) to Lean (≤0.4 V)
N/A Second Between 0 and1.1 seconds
If the time required to change is out of the standard value, the ECM interprets this as a malfunction.
Rear O2S (Bank 1 Sensor 2 and Bank 2 Sensor 2) Voltage MonitorRelated DTCs: P0136 and P0156
TEST ID DESCRIPTION OF TEST DATACONVERSION
FACTORUNIT
STANDARD VALUEOF TEST LIMIT
Time$07
The minimum voltage duringO2S monitoring
N/A V Between 0 and 0.5 V
Time$08
The maximum voltage duringO2S monitoring
N/A V Between 0.6 and1.275 V
If the sensor voltage is out of the standard value, the ECM interprets this as a malfunction.
O2SFailure
ThresholdCharts
(Continued)
O2S TEST RESULTS (MODE 05) – SS002-03 December 17, 2003
Page 17 of 43
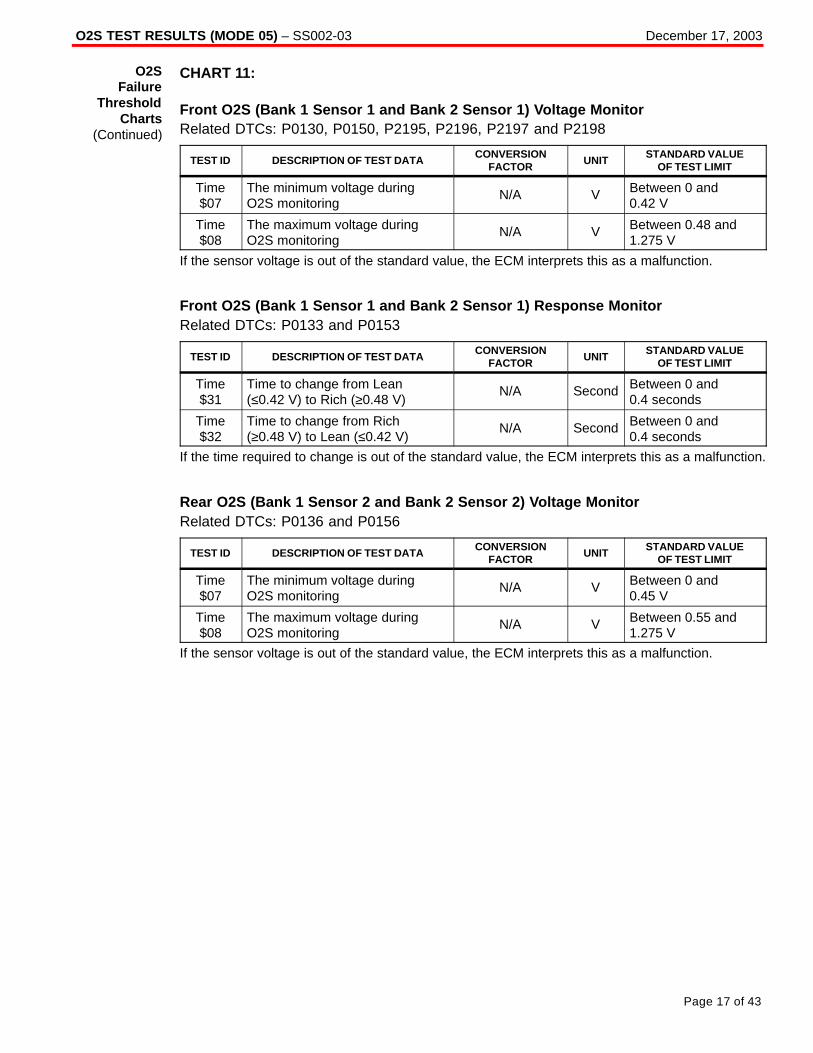
CHART 11:
Front O2S (Bank 1 Sensor 1 and Bank 2 Sensor 1) Voltage MonitorRelated DTCs: P0130, P0150, P2195, P2196, P2197 and P2198
TEST ID DESCRIPTION OF TEST DATACONVERSION
FACTORUNIT
STANDARD VALUEOF TEST LIMIT
Time$07
The minimum voltage duringO2S monitoring
N/A V Between 0 and0.42 V
Time$08
The maximum voltage duringO2S monitoring
N/A V Between 0.48 and1.275 V
If the sensor voltage is out of the standard value, the ECM interprets this as a malfunction.
Front O2S (Bank 1 Sensor 1 and Bank 2 Sensor 1) Response MonitorRelated DTCs: P0133 and P0153
TEST ID DESCRIPTION OF TEST DATACONVERSION
FACTORUNIT
STANDARD VALUEOF TEST LIMIT
Time$31
Time to change from Lean(≤0.42 V) to Rich (≥0.48 V)
N/A Second Between 0 and 0.4 seconds
Time$32
Time to change from Rich(≥0.48 V) to Lean (≤0.42 V)
N/A Second Between 0 and 0.4 seconds
If the time required to change is out of the standard value, the ECM interprets this as a malfunction.
Rear O2S (Bank 1 Sensor 2 and Bank 2 Sensor 2) Voltage MonitorRelated DTCs: P0136 and P0156
TEST ID DESCRIPTION OF TEST DATACONVERSION
FACTORUNIT
STANDARD VALUEOF TEST LIMIT
Time$07
The minimum voltage duringO2S monitoring
N/A V Between 0 and0.45 V
Time$08
The maximum voltage duringO2S monitoring
N/A V Between 0.55 and1.275 V
If the sensor voltage is out of the standard value, the ECM interprets this as a malfunction.
O2SFailure
ThresholdCharts
(Continued)
O2S TEST RESULTS (MODE 05) – SS002-03 December 17, 2003
Page 18 of 43
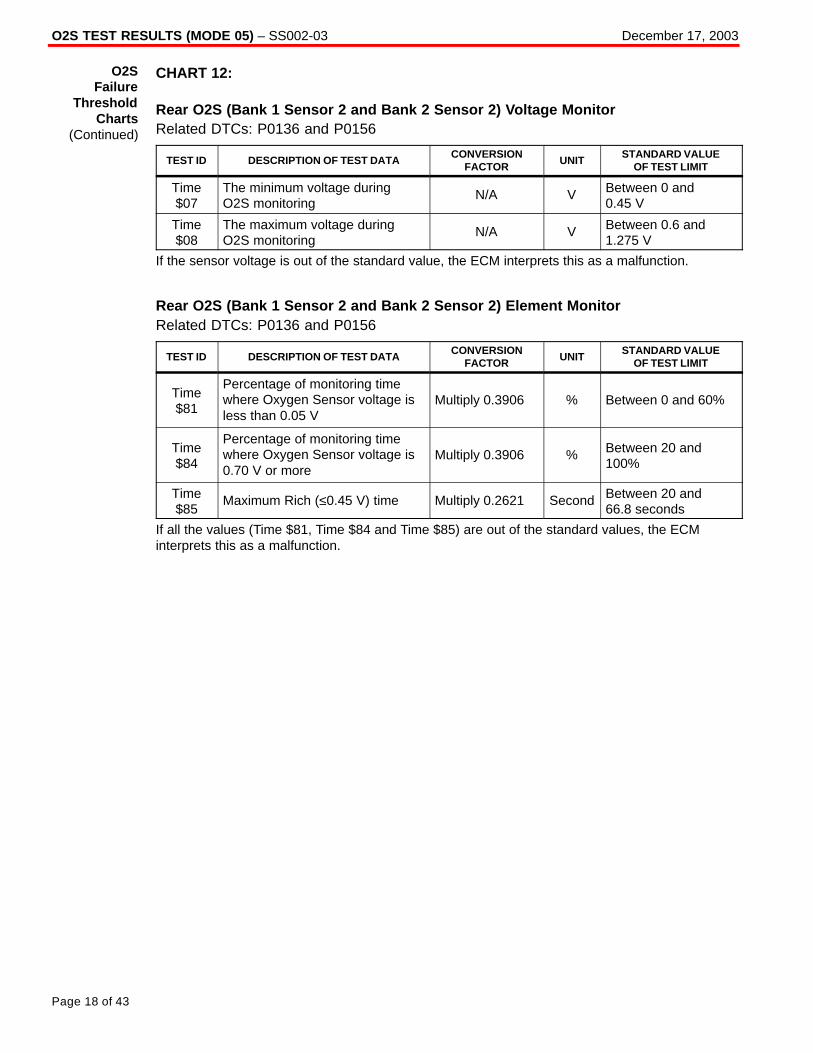
CHART 12:
Rear O2S (Bank 1 Sensor 2 and Bank 2 Sensor 2) Voltage MonitorRelated DTCs: P0136 and P0156
TEST ID DESCRIPTION OF TEST DATACONVERSION
FACTORUNIT
STANDARD VALUEOF TEST LIMIT
Time$07
The minimum voltage duringO2S monitoring
N/A V Between 0 and0.45 V
Time$08
The maximum voltage duringO2S monitoring
N/A V Between 0.6 and1.275 V
If the sensor voltage is out of the standard value, the ECM interprets this as a malfunction.
Rear O2S (Bank 1 Sensor 2 and Bank 2 Sensor 2) Element MonitorRelated DTCs: P0136 and P0156
TEST ID DESCRIPTION OF TEST DATACONVERSION
FACTORUNIT
STANDARD VALUEOF TEST LIMIT
Time$81
Percentage of monitoring timewhere Oxygen Sensor voltage isless than 0.05 V
Multiply 0.3906 % Between 0 and 60%
Time$84
Percentage of monitoring timewhere Oxygen Sensor voltage is0.70 V or more
Multiply 0.3906 % Between 20 and100%
Time$85
Maximum Rich (≤0.45 V) time Multiply 0.2621 Second Between 20 and 66.8 seconds
If all the values (Time $81, Time $84 and Time $85) are out of the standard values, the ECMinterprets this as a malfunction.
O2SFailure
ThresholdCharts
(Continued)

O2S TEST RESULTS (MODE 05) – SS002-03 December 17, 2003
Page 19 of 43
CHART 13:
Front O2S (Bank 1 Sensor 1 and Bank 2 Sensor 1) Voltage MonitorRelated DTCs: P0130, P0150, P2195, P2196, P2197 and P2198
TEST ID DESCRIPTION OF TEST DATACONVERSION
FACTORUNIT
STANDARD VALUEOF TEST LIMIT
Time$07
The minimum voltage duringO2S monitoring
N/A V Between 0 and 0.4 V
Time$08
The maximum voltage duringO2S monitoring
N/A V Between 0.55 and1.275 V
If the sensor voltage is out of the standard value, the ECM interprets this as a malfunction.
Front O2S (Bank 1 Sensor 1 and Bank 2 Sensor 1) Response MonitorRelated DTCs: P0133 and P0153
TEST ID DESCRIPTION OF TEST DATACONVERSION
FACTORUNIT
STANDARD VALUEOF TEST LIMIT
Time$31
Time to change from Lean(≤0.4 V) to Rich (≥0.55 V)
N/A Second Between 0 and 1 seconds
Time$32
Time to change from Rich(≥0.55 V) to Lean (≤0.4 V)
N/A Second Between 0 and 1 seconds
If the time required to change is out of the standard value, the ECM interprets this as a malfunction.
Rear O2S (Bank 1 Sensor 2 and Bank 2 Sensor 2) Voltage MonitorRelated DTCs: P0136 and P0156
TEST ID DESCRIPTION OF TEST DATACONVERSION
FACTORUNIT
STANDARD VALUEOF TEST LIMIT
Time$07
The minimum voltage duringO2S monitoring
N/A V Between 0 and 0.4 V
Time$08
The maximum voltage duringO2S monitoring
N/A V Between 0.5 and1.275 V
If the sensor voltage is out of the standard value, the ECM interprets this as a malfunction.
Rear O2S (Bank 1 Sensor 2 and Bank 2 Sensor 2) Element MonitorRelated DTCs: P0136 and P0156
TEST ID DESCRIPTION OF TEST DATACONVERSION
FACTORUNIT
STANDARD VALUEOF TEST LIMIT
Time$81
Percentage of monitoring timewhere Oxygen Sensor voltage isless than 0.5 V
Multiply 0.3906 % Between 0 and 60%
Time$84
Percentage of monitoring timewhere Oxygen Sensor voltage is0.70 V or more
Multiply 0.3906 % Between 20 and100%
Time$85
Maximum Rich (≥0.45 V) time Multiply 0.2621 Second Between 20 and 66.8 seconds
If all the values (Time $81, Time $84 and Time $85) are out of the standard values, the ECMinterprets this as a malfunction.
O2SFailure
ThresholdCharts
(Continued)
O2S TEST RESULTS (MODE 05) – SS002-03 December 17, 2003
Page 20 of 43
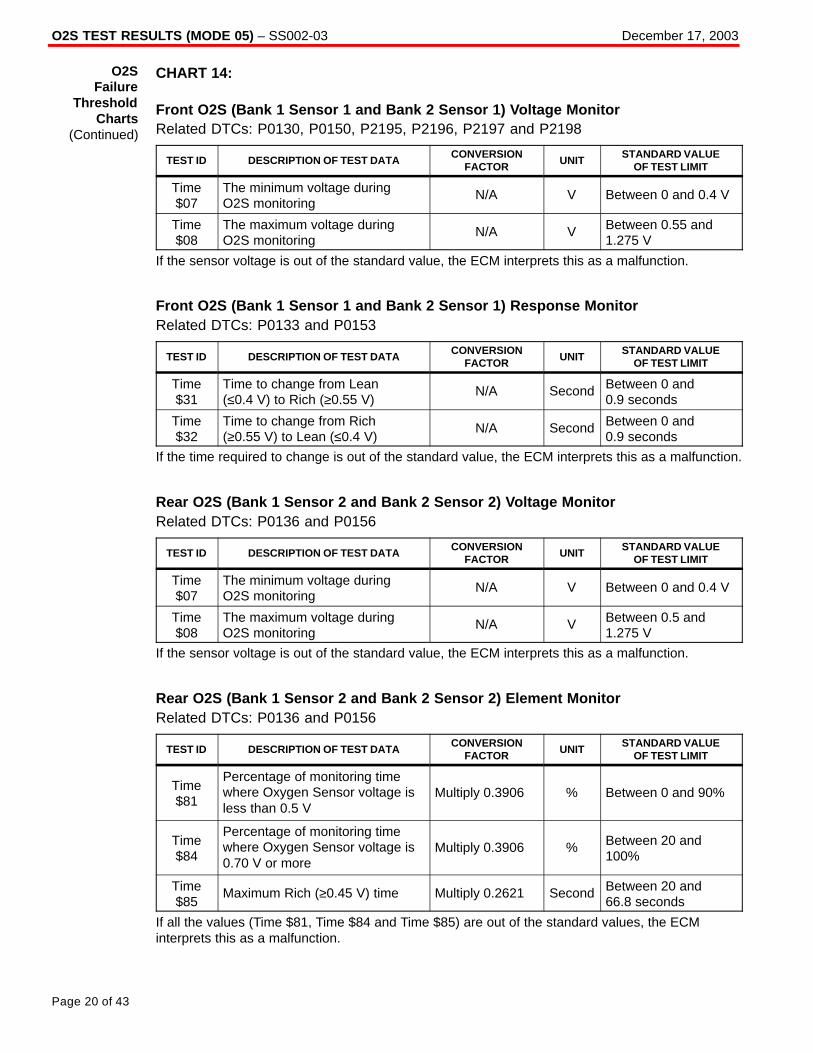
CHART 14:
Front O2S (Bank 1 Sensor 1 and Bank 2 Sensor 1) Voltage MonitorRelated DTCs: P0130, P0150, P2195, P2196, P2197 and P2198
TEST ID DESCRIPTION OF TEST DATACONVERSION
FACTORUNIT
STANDARD VALUEOF TEST LIMIT
Time$07
The minimum voltage duringO2S monitoring
N/A V Between 0 and 0.4 V
Time$08
The maximum voltage duringO2S monitoring
N/A V Between 0.55 and1.275 V
If the sensor voltage is out of the standard value, the ECM interprets this as a malfunction.
Front O2S (Bank 1 Sensor 1 and Bank 2 Sensor 1) Response MonitorRelated DTCs: P0133 and P0153
TEST ID DESCRIPTION OF TEST DATACONVERSION
FACTORUNIT
STANDARD VALUEOF TEST LIMIT
Time$31
Time to change from Lean(≤0.4 V) to Rich (≥0.55 V)
N/A Second Between 0 and 0.9 seconds
Time$32
Time to change from Rich(≥0.55 V) to Lean (≤0.4 V)
N/A Second Between 0 and 0.9 seconds
If the time required to change is out of the standard value, the ECM interprets this as a malfunction.
Rear O2S (Bank 1 Sensor 2 and Bank 2 Sensor 2) Voltage MonitorRelated DTCs: P0136 and P0156
TEST ID DESCRIPTION OF TEST DATACONVERSION
FACTORUNIT
STANDARD VALUEOF TEST LIMIT
Time$07
The minimum voltage duringO2S monitoring
N/A V Between 0 and 0.4 V
Time$08
The maximum voltage duringO2S monitoring
N/A V Between 0.5 and1.275 V
If the sensor voltage is out of the standard value, the ECM interprets this as a malfunction.
Rear O2S (Bank 1 Sensor 2 and Bank 2 Sensor 2) Element MonitorRelated DTCs: P0136 and P0156
TEST ID DESCRIPTION OF TEST DATACONVERSION
FACTORUNIT
STANDARD VALUEOF TEST LIMIT
Time$81
Percentage of monitoring timewhere Oxygen Sensor voltage isless than 0.5 V
Multiply 0.3906 % Between 0 and 90%
Time$84
Percentage of monitoring timewhere Oxygen Sensor voltage is0.70 V or more
Multiply 0.3906 % Between 20 and100%
Time$85
Maximum Rich (≥0.45 V) time Multiply 0.2621 Second Between 20 and 66.8 seconds
If all the values (Time $81, Time $84 and Time $85) are out of the standard values, the ECMinterprets this as a malfunction.
O2SFailure
ThresholdCharts
(Continued)

O2S TEST RESULTS (MODE 05) – SS002-03 December 17, 2003
Page 21 of 43
CHART 15:
Front O2S (Bank 1 Sensor 1 and Bank 2 Sensor 1) Voltage MonitorRelated DTCs: P0130, P0150, P2195, P2196, P2197 and P2198
TEST ID DESCRIPTION OF TEST DATACONVERSION
FACTORUNIT
STANDARD VALUEOF TEST LIMIT
Time$07
The minimum voltage duringO2S monitoring
N/A V Between 0 and0.42 V
Time$08
The maximum voltage duringO2S monitoring
N/A V Between 0.48 and1.275 V
If the sensor voltage is out of the standard value, the ECM interprets this as a malfunction.
Front O2S (Bank 1 Sensor 1 and Bank 2 Sensor 1) Response MonitorRelated DTCs: P0133 and P0153
TEST ID DESCRIPTION OF TEST DATACONVERSION
FACTORUNIT
STANDARD VALUEOF TEST LIMIT
Time$31
Time to change from Lean(≤0.42 V) to Rich (≥0.48 V)
N/A Second Between 0 and 0.4 seconds
Time$32
Time to change from Rich(≥0.48 V) to Lean (≤0.42 V)
N/A Second Between 0 and 0.4 seconds
If the time required to change is out of the standard value, the ECM interprets this as a malfunction.
Rear O2S (Bank 1 Sensor 2 and Bank 2 Sensor 2) Voltage MonitorRelated DTCs: P0136 and P0156
TEST ID DESCRIPTION OF TEST DATACONVERSION
FACTORUNIT
STANDARD VALUEOF TEST LIMIT
Time$07
The minimum voltage duringO2S monitoring
N/A V Between 0 and0.45 V
Time$08
The maximum voltage duringO2S monitoring
N/A V Between 0.55 and1.275 V
If the sensor voltage is out of the standard value, the ECM interprets this as a malfunction.
Rear O2S (Bank 1 Sensor 2 and Bank 2 Sensor 2) Element MonitorRelated DTCs: P0136 and P0156
TEST ID DESCRIPTION OF TEST DATACONVERSION
FACTORUNIT
STANDARD VALUEOF TEST LIMIT
Time$81
Percentage of monitoring timewhere Oxygen Sensor voltage isless than 0.5 V
Multiply 0.3906 % Between 0 and 80%
Time$84
Percentage of monitoring timewhere Oxygen Sensor voltage is0.70 V or more
Multiply 0.3906 % Between 20 and100%
Time$85
Maximum Rich (≥0.45 V) time Multiply 0.2621 Second Between 10 and 66.8 seconds
If all the values (Time $81, Time $84 and Time $85) are out of the standard values, the ECMinterprets this as a malfunction.
O2SFailure
ThresholdCharts
(Continued)

O2S TEST RESULTS (MODE 05) – SS002-03 December 17, 2003
Page 22 of 43
CHART 16:
Front O2S (Bank 1 Sensor 1 and Bank 2 Sensor 1) Voltage MonitorRelated DTCs: P0136 and P0156
TEST ID DESCRIPTION OF TEST DATACONVERSION
FACTORUNIT
STANDARD VALUEOF TEST LIMIT
Time$07
The minimum voltage duringO2S monitoring
N/A V Between 0 and 0.4 V
Time$08
The maximum voltage duringO2S monitoring
N/A V Between 0.6 and1.275 V
If the sensor voltage is out of the standard value, the ECM interprets this as a malfunction.
Rear O2S (Bank 1 Sensor 2 and Bank 2 Sensor 2) Element MonitorRelated DTCs: P0136 and P0156
TEST ID DESCRIPTION OF TEST DATACONVERSION
FACTORUNIT
STANDARD VALUEOF TEST LIMIT
Time$81
Percentage of monitoring timewhere Oxygen Sensor voltage isless than 0.5 V
Multiply 0.3906 % Between 0 and 60%
Time$84
Percentage of monitoring timewhere Oxygen Sensor voltage is0.70 V or more
Multiply 0.3906 % Between 20 and100%
Time$85
Maximum Rich (≥0.45 V) time Multiply 0.2621 Second Between 20 and 66.8 seconds
If all the values (Time $81, Time $84 and Time $85) are out of the standard values, the ECMinterprets this as a malfunction.
O2SFailure
ThresholdCharts
(Continued)

O2S TEST RESULTS (MODE 05) – SS002-03 December 17, 2003
Page 23 of 43
CHART 17:
Rear O2S (Bank 1 Sensor 2 and Bank 2 Sensor 2) Voltage MonitorRelated DTCs: P0136 and P0156
TEST ID DESCRIPTION OF TEST DATACONVERSION
FACTORUNIT
STANDARD VALUEOF TEST LIMIT
Time$07
The minimum voltage duringO2S monitoring
N/A V Between 0 and0.45 V
Time$08
The maximum voltage duringO2S monitoring
N/A V Between 0.6 and1.275 V
If the sensor voltage is out of the standard value, the ECM interprets this as a malfunction.
Rear O2S (Bank 1 Sensor 2 and Bank 2 Sensor 2) Element MonitorRelated DTCs: P0136 and P0156
TEST ID DESCRIPTION OF TEST DATACONVERSION
FACTORUNIT
STANDARD VALUEOF TEST LIMIT
Time$81
Percentage of monitoring timewhere Oxygen Sensor voltage isless than 0.05 V
Multiply 0.3906 % Between 0 and 55%
Time$84
Percentage of monitoring timewhere Oxygen Sensor voltage is0.70 V or more
Multiply 0.3906 % Between 20 and100%
Time$85
Maximum Rich (≥0.45 V) time Multiply 0.2621 Second Between 20 and 66.8 seconds
If all the values (Time $81, Time $84 and Time $85) are out of the standard values, the ECMinterprets this as a malfunction.
O2SFailure
ThresholdCharts
(Continued)
O2S TEST RESULTS (MODE 05) – SS002-03 December 17, 2003
Page 24 of 43
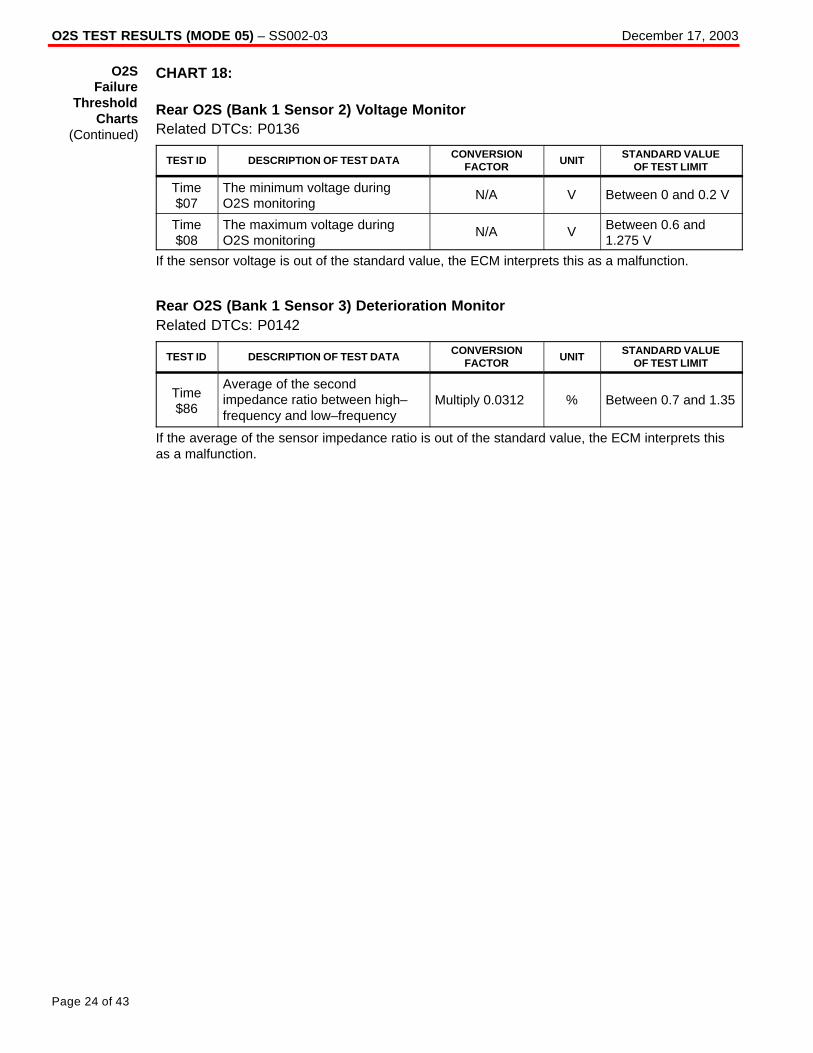
CHART 18:
Rear O2S (Bank 1 Sensor 2) Voltage MonitorRelated DTCs: P0136
TEST ID DESCRIPTION OF TEST DATACONVERSION
FACTORUNIT
STANDARD VALUEOF TEST LIMIT
Time$07
The minimum voltage duringO2S monitoring
N/A V Between 0 and 0.2 V
Time$08
The maximum voltage duringO2S monitoring
N/A V Between 0.6 and1.275 V
If the sensor voltage is out of the standard value, the ECM interprets this as a malfunction.
Rear O2S (Bank 1 Sensor 3) Deterioration MonitorRelated DTCs: P0142
TEST ID DESCRIPTION OF TEST DATACONVERSION
FACTORUNIT
STANDARD VALUEOF TEST LIMIT
Time$86
Average of the secondimpedance ratio between high– frequency and low–frequency
Multiply 0.0312 % Between 0.7 and 1.35
If the average of the sensor impedance ratio is out of the standard value, the ECM interprets thisas a malfunction.
O2SFailure
ThresholdCharts
(Continued)
O2S TEST RESULTS (MODE 05) – SS002-03 December 17, 2003
Page 25 of 43
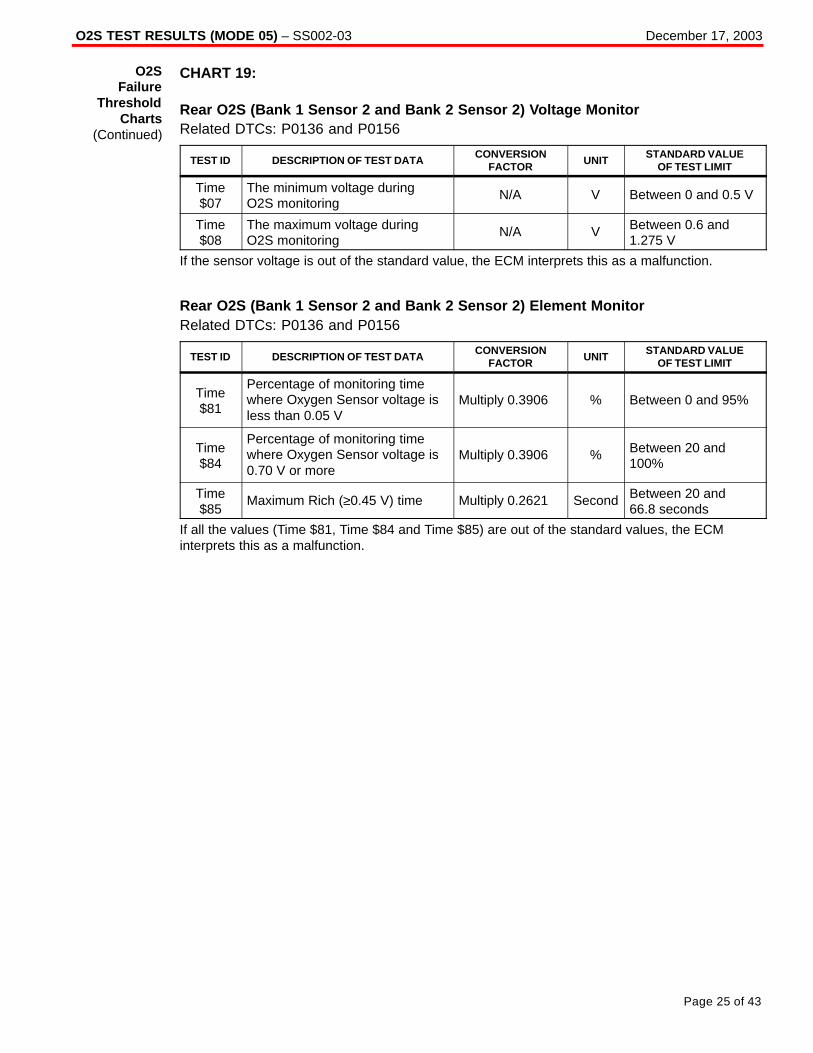
CHART 19:
Rear O2S (Bank 1 Sensor 2 and Bank 2 Sensor 2) Voltage MonitorRelated DTCs: P0136 and P0156
TEST ID DESCRIPTION OF TEST DATACONVERSION
FACTORUNIT
STANDARD VALUEOF TEST LIMIT
Time$07
The minimum voltage duringO2S monitoring
N/A V Between 0 and 0.5 V
Time$08
The maximum voltage duringO2S monitoring
N/A V Between 0.6 and1.275 V
If the sensor voltage is out of the standard value, the ECM interprets this as a malfunction.
Rear O2S (Bank 1 Sensor 2 and Bank 2 Sensor 2) Element MonitorRelated DTCs: P0136 and P0156
TEST ID DESCRIPTION OF TEST DATACONVERSION
FACTORUNIT
STANDARD VALUEOF TEST LIMIT
Time$81
Percentage of monitoring timewhere Oxygen Sensor voltage isless than 0.05 V
Multiply 0.3906 % Between 0 and 95%
Time$84
Percentage of monitoring timewhere Oxygen Sensor voltage is0.70 V or more
Multiply 0.3906 % Between 20 and100%
Time$85
Maximum Rich (≥0.45 V) time Multiply 0.2621 Second Between 20 and 66.8 seconds
If all the values (Time $81, Time $84 and Time $85) are out of the standard values, the ECMinterprets this as a malfunction.
O2SFailure
ThresholdCharts
(Continued)

O2S TEST RESULTS (MODE 05) – SS002-03 December 17, 2003
Page 26 of 43
CHART 20:
Rear O2S (Bank 1 Sensor 2 and Bank 2 Sensor 2) Voltage MonitorRelated DTCs: P0136 and P0156
TEST ID DESCRIPTION OF TEST DATACONVERSION
FACTORUNIT
STANDARD VALUEOF TEST LIMIT
Time$07
The minimum voltage duringO2S monitoring
N/A V Between 0 and 0.5 V
Time$08
The maximum voltage duringO2S monitoring
N/A V Between 0.6 and1.275 V
If the sensor voltage is out of the standard value, the ECM interprets this as a malfunction.
Rear O2S (Bank 1 Sensor 2 and Bank 2 Sensor 2) Element MonitorRelated DTCs: P0136 and P0156
TEST ID DESCRIPTION OF TEST DATACONVERSION
FACTORUNIT
STANDARD VALUEOF TEST LIMIT
Time$81
Percentage of monitoring timewhere Oxygen Sensor voltage isless than 0.05 V
Multiply 0.3906 % Between 0 and 80%
Time$84
Percentage of monitoring timewhere Oxygen Sensor voltage is0.70 V or more
Multiply 0.3906 % Between 20 and100%
Time$85
Maximum Rich (≥0.45 V) time Multiply 0.2621 Second Between 20 and 66.8 seconds
If all the values (Time $81, Time $84 and Time $85) are out of the standard values, the ECMinterprets this as a malfunction.
O2SFailure
ThresholdCharts
(Continued)

O2S TEST RESULTS (MODE 05) – SS002-03 December 17, 2003
Page 27 of 43
CHART 21:
Front O2S (Bank 1 Sensor 1 and Bank 2 Sensor 1) Voltage MonitorRelated DTCs: P0130, P0150, P2195, P2196, P2197 and P2198
TEST ID DESCRIPTION OF TEST DATACONVERSION
FACTORUNIT
STANDARD VALUEOF TEST LIMIT
Time$07
The minimum voltage duringO2S monitoring
N/A V Between 0 and 0.4 V
Time$08
The maximum voltage duringO2S monitoring
N/A V Between 0.55 and1.275 V
If the sensor voltage is out of the standard value, the ECM interprets this as a malfunction.
Front O2S (Bank 1 Sensor 1 and Bank 2 Sensor 1) Response MonitorRelated DTCs: P0133 and P0153
TEST ID DESCRIPTION OF TEST DATACONVERSION
FACTORUNIT
STANDARD VALUEOF TEST LIMIT
Time$31
Time to change from Lean(≤0.4 V) to Rich (≥0.55 V)
N/A Second Between 0 and 0.8 seconds
Time$32
Time to change from Rich(≥0.55 V) to Lean (≤0.4 V)
N/A Second Between 0 and 0.8 seconds
If the time required to change is out of the standard value, the ECM interprets this as a malfunction.
Front O2S (Bank 1 Sensor 1 and Bank 2 Sensor 1) Frequency Monitor DuringEngine IdlingRelated DTCs: P0133 and P0153
TEST ID DESCRIPTION OF TEST DATACONVERSION
FACTORUNIT
STANDARD VALUEOF TEST LIMIT
Time$33
Average Lean (≤0.4 V) time ofone waveform cycle
N/A Second Between 0 and 3.05 seconds
Time$34
Average Rich (≥0.55 V) time ofone waveform cycle
N/A Second Between 0 and 3.05 seconds
If the sum of Time $33 and Time $34 is out of the standard value, the ECM interprets this as amalfunction.
O2SFailure
ThresholdCharts
(Continued)

O2S TEST RESULTS (MODE 05) – SS002-03 December 17, 2003
Page 28 of 43
CHART 21 (Continued):
Front O2S (Bank 1 Sensor 1 and Bank 2 Sensor 1) Frequency Monitor DuringVehicle RunningRelated DTCs: P0133 and P0153
TEST ID DESCRIPTION OF TEST DATACONVERSION
FACTORUNIT
STANDARD VALUEOF TEST LIMIT
Time$35
Average Lean (≤0.4 V) time ofone waveform cycle
N/A Second
Between 0 and 0.95 seconds (varies depending on feedbackcompensation factor)
Time$36
Average Rich (≤0.55 V) time ofone waveform cycle
N/A Second
Between 0 and 0.95seconds (varies depending on feedbackcompensation factor)
If the sum of Time $35 and Time $36 is out of the standard value, the ECM interprets this as amalfunction.
Rear O2S (Bank 1 Sensor 2 and Bank 2 Sensor 2) Voltage MonitorRelated DTCs: P0136 and P0156
TEST ID DESCRIPTION OF TEST DATACONVERSION
FACTORUNIT
STANDARD VALUEOF TEST LIMIT
Time$07
The minimum voltage duringO2S monitoring
N/A V Between 0 and 0.4 V
Time$08
The maximum voltage duringO2S monitoring
N/A V Between 0.5 and1.275 V
If the sensor voltage is out of the standard value, the ECM interprets this as a malfunction.
Rear O2S (Bank 1 Sensor 2 and Bank 2 Sensor 2) Element MonitorRelated DTCs: P0136 and P0156
TEST ID DESCRIPTION OF TEST DATACONVERSION
FACTORUNIT
STANDARD VALUEOF TEST LIMIT
Time$81
Percentage of monitoring timewhere Oxygen Sensor voltage isless than 0.05 V
Multiply 0.3906 % Between 0 and 60%
Time$84
Percentage of monitoring timewhere Oxygen Sensor voltage is0.70 V or more
Multiply 0.3906 % Between 20 and100%
Time$85
Maximum Rich (≥0.45 V) time Multiply 0.2621 Second Between 20 and 66.8 seconds
If all the values (Time $81, Time $84 and Time $85) are out of the standard values, the ECMinterprets this as a malfunction.
O2SFailure
ThresholdCharts
(Continued)
O2S TEST RESULTS (MODE 05) – SS002-03 December 17, 2003
Page 29 of 43
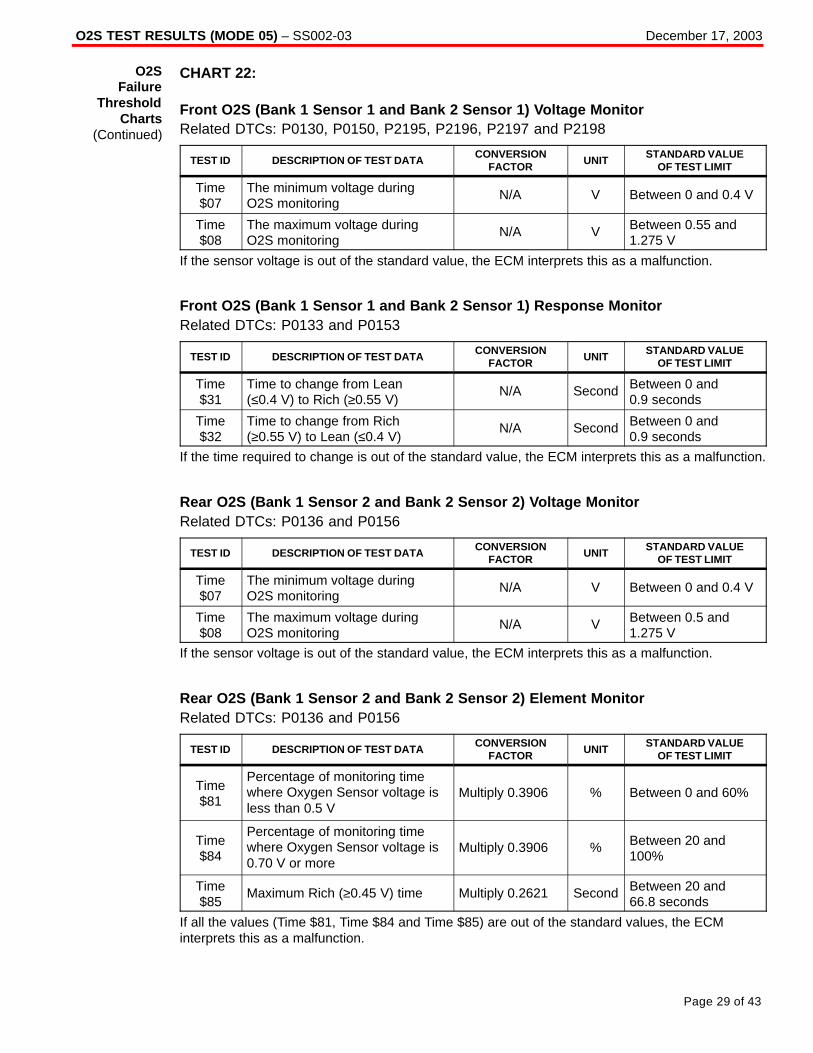
CHART 22:
Front O2S (Bank 1 Sensor 1 and Bank 2 Sensor 1) Voltage MonitorRelated DTCs: P0130, P0150, P2195, P2196, P2197 and P2198
TEST ID DESCRIPTION OF TEST DATACONVERSION
FACTORUNIT
STANDARD VALUEOF TEST LIMIT
Time$07
The minimum voltage duringO2S monitoring
N/A V Between 0 and 0.4 V
Time$08
The maximum voltage duringO2S monitoring
N/A V Between 0.55 and1.275 V
If the sensor voltage is out of the standard value, the ECM interprets this as a malfunction.
Front O2S (Bank 1 Sensor 1 and Bank 2 Sensor 1) Response MonitorRelated DTCs: P0133 and P0153
TEST ID DESCRIPTION OF TEST DATACONVERSION
FACTORUNIT
STANDARD VALUEOF TEST LIMIT
Time$31
Time to change from Lean(≤0.4 V) to Rich (≥0.55 V)
N/A Second Between 0 and 0.9 seconds
Time$32
Time to change from Rich(≥0.55 V) to Lean (≤0.4 V)
N/A Second Between 0 and 0.9 seconds
If the time required to change is out of the standard value, the ECM interprets this as a malfunction.
Rear O2S (Bank 1 Sensor 2 and Bank 2 Sensor 2) Voltage MonitorRelated DTCs: P0136 and P0156
TEST ID DESCRIPTION OF TEST DATACONVERSION
FACTORUNIT
STANDARD VALUEOF TEST LIMIT
Time$07
The minimum voltage duringO2S monitoring
N/A V Between 0 and 0.4 V
Time$08
The maximum voltage duringO2S monitoring
N/A V Between 0.5 and1.275 V
If the sensor voltage is out of the standard value, the ECM interprets this as a malfunction.
Rear O2S (Bank 1 Sensor 2 and Bank 2 Sensor 2) Element MonitorRelated DTCs: P0136 and P0156
TEST ID DESCRIPTION OF TEST DATACONVERSION
FACTORUNIT
STANDARD VALUEOF TEST LIMIT
Time$81
Percentage of monitoring timewhere Oxygen Sensor voltage isless than 0.5 V
Multiply 0.3906 % Between 0 and 60%
Time$84
Percentage of monitoring timewhere Oxygen Sensor voltage is0.70 V or more
Multiply 0.3906 % Between 20 and100%
Time$85
Maximum Rich (≥0.45 V) time Multiply 0.2621 Second Between 20 and 66.8 seconds
If all the values (Time $81, Time $84 and Time $85) are out of the standard values, the ECMinterprets this as a malfunction.
O2SFailure
ThresholdCharts
(Continued)

O2S TEST RESULTS (MODE 05) – SS002-03 December 17, 2003
Page 30 of 43
CHART 23:
Front O2S (Bank 1 Sensor 1 and Bank 2 Sensor 1) Voltage MonitorRelated DTCs: P0130, P0150, P2195, P2196, P2197 and P2198
TEST ID DESCRIPTION OF TEST DATACONVERSION
FACTORUNIT
STANDARD VALUEOF TEST LIMIT
Time$07
The minimum voltage duringO2S monitoring
N/A V Between 0 and 0.4 V
Time$08
The maximum voltage duringO2S monitoring
N/A V Between 0.55 and1.275 V
If the sensor voltage is out of the standard value, the ECM interprets this as a malfunction.
Front O2S (Bank 1 Sensor 1 and Bank 2 Sensor 1) Response MonitorRelated DTCs: P0133 and P0153
TEST ID DESCRIPTION OF TEST DATACONVERSION
FACTORUNIT
STANDARD VALUEOF TEST LIMIT
Time$31
Time to change from Lean(≤0.4 V) to Rich (≥0.55 V)
N/A Second Between 0 and 0.9 seconds
Time$32
Time to change from Rich(≥0.55 V) to Lean (≤0.4 V)
N/A Second Between 0 and 0.9 seconds
If the time required to change is out of the standard value, the ECM interprets this as a malfunction.
Front O2S (Bank 1 Sensor 1 and Bank 2 Sensor 1) Frequency Monitor DuringEngine IdlingRelated DTCs: P0133 and P0153
TEST ID DESCRIPTION OF TEST DATACONVERSION
FACTORUNIT
STANDARD VALUEOF TEST LIMIT
Time$33
Average Lean (≤0.4 V) time ofone waveform cycle
N/A Second Between 0 and 4.5 seconds
Time$34
Average Rich (≤0.55 V) time ofone waveform cycle
N/A Second Between 0 and 4.5 seconds
If the sum of Time $33 and Time $34 is out of the standard value, the ECM interprets this as amalfunction.
O2SFailure
ThresholdCharts
(Continued)
O2S TEST RESULTS (MODE 05) – SS002-03 December 17, 2003
Page 31 of 43
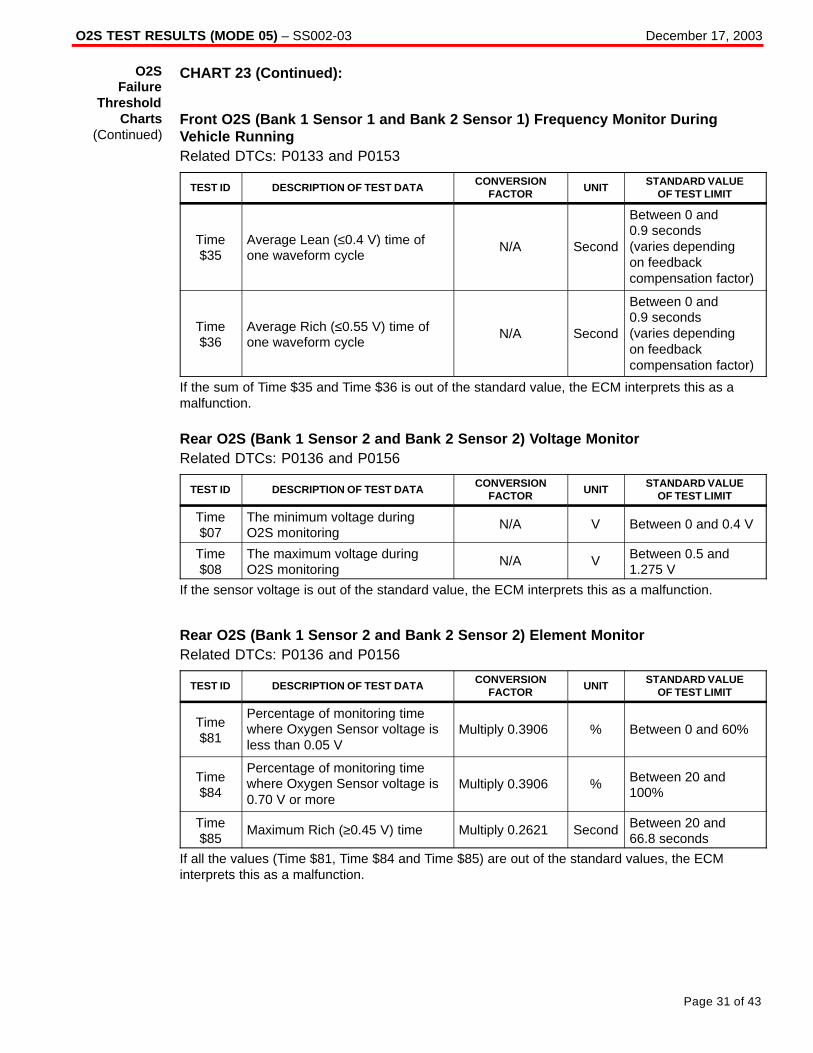
CHART 23 (Continued):
Front O2S (Bank 1 Sensor 1 and Bank 2 Sensor 1) Frequency Monitor DuringVehicle RunningRelated DTCs: P0133 and P0153
TEST ID DESCRIPTION OF TEST DATACONVERSION
FACTORUNIT
STANDARD VALUEOF TEST LIMIT
Time$35
Average Lean (≤0.4 V) time ofone waveform cycle
N/A Second
Between 0 and 0.9 seconds (varies depending on feedbackcompensation factor)
Time$36
Average Rich (≤0.55 V) time ofone waveform cycle
N/A Second
Between 0 and 0.9 seconds (varies depending on feedbackcompensation factor)
If the sum of Time $35 and Time $36 is out of the standard value, the ECM interprets this as amalfunction.
Rear O2S (Bank 1 Sensor 2 and Bank 2 Sensor 2) Voltage MonitorRelated DTCs: P0136 and P0156
TEST ID DESCRIPTION OF TEST DATACONVERSION
FACTORUNIT
STANDARD VALUEOF TEST LIMIT
Time$07
The minimum voltage duringO2S monitoring
N/A V Between 0 and 0.4 V
Time$08
The maximum voltage duringO2S monitoring
N/A V Between 0.5 and1.275 V
If the sensor voltage is out of the standard value, the ECM interprets this as a malfunction.
Rear O2S (Bank 1 Sensor 2 and Bank 2 Sensor 2) Element MonitorRelated DTCs: P0136 and P0156
TEST ID DESCRIPTION OF TEST DATACONVERSION
FACTORUNIT
STANDARD VALUEOF TEST LIMIT
Time$81
Percentage of monitoring timewhere Oxygen Sensor voltage isless than 0.05 V
Multiply 0.3906 % Between 0 and 60%
Time$84
Percentage of monitoring timewhere Oxygen Sensor voltage is0.70 V or more
Multiply 0.3906 % Between 20 and100%
Time$85
Maximum Rich (≥0.45 V) time Multiply 0.2621 Second Between 20 and 66.8 seconds
If all the values (Time $81, Time $84 and Time $85) are out of the standard values, the ECMinterprets this as a malfunction.
O2SFailure
ThresholdCharts
(Continued)
O2S TEST RESULTS (MODE 05) – SS002-03 December 17, 2003
Page 32 of 43
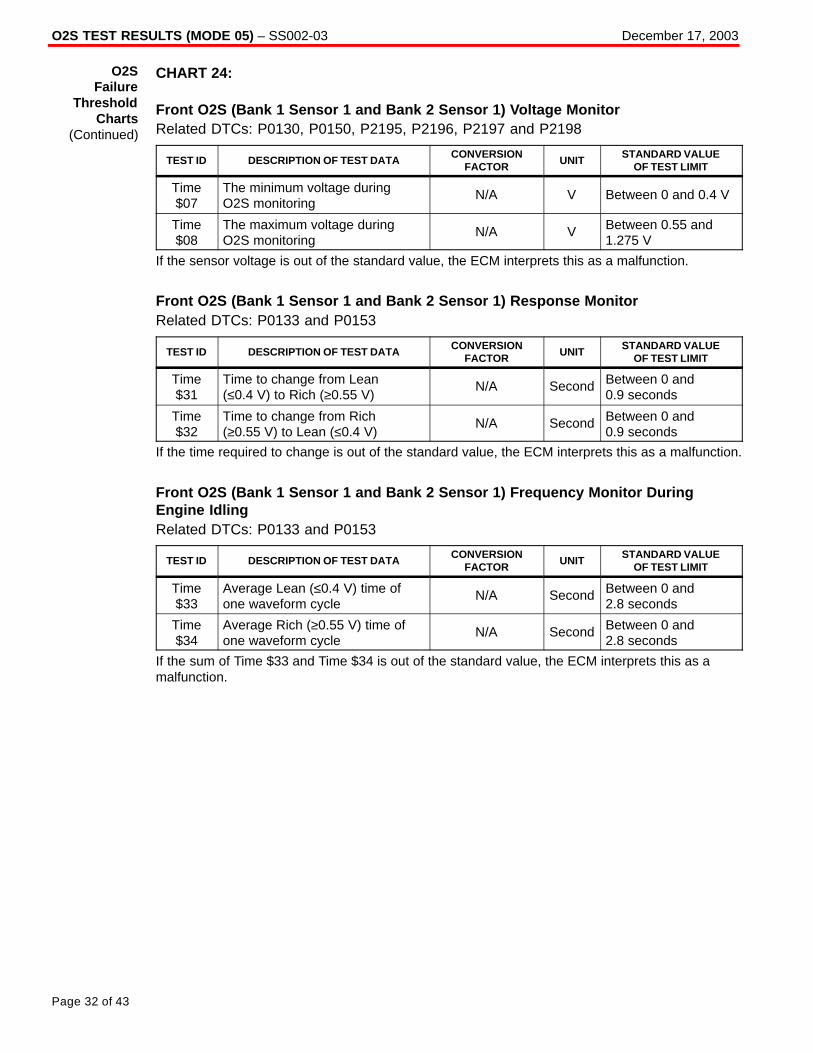
CHART 24:
Front O2S (Bank 1 Sensor 1 and Bank 2 Sensor 1) Voltage MonitorRelated DTCs: P0130, P0150, P2195, P2196, P2197 and P2198
TEST ID DESCRIPTION OF TEST DATACONVERSION
FACTORUNIT
STANDARD VALUEOF TEST LIMIT
Time$07
The minimum voltage duringO2S monitoring
N/A V Between 0 and 0.4 V
Time$08
The maximum voltage duringO2S monitoring
N/A V Between 0.55 and1.275 V
If the sensor voltage is out of the standard value, the ECM interprets this as a malfunction.
Front O2S (Bank 1 Sensor 1 and Bank 2 Sensor 1) Response MonitorRelated DTCs: P0133 and P0153
TEST ID DESCRIPTION OF TEST DATACONVERSION
FACTORUNIT
STANDARD VALUEOF TEST LIMIT
Time$31
Time to change from Lean(≤0.4 V) to Rich (≥0.55 V)
N/A Second Between 0 and 0.9 seconds
Time$32
Time to change from Rich(≥0.55 V) to Lean (≤0.4 V)
N/A Second Between 0 and 0.9 seconds
If the time required to change is out of the standard value, the ECM interprets this as a malfunction.
Front O2S (Bank 1 Sensor 1 and Bank 2 Sensor 1) Frequency Monitor DuringEngine IdlingRelated DTCs: P0133 and P0153
TEST ID DESCRIPTION OF TEST DATACONVERSION
FACTORUNIT
STANDARD VALUEOF TEST LIMIT
Time$33
Average Lean (≤0.4 V) time ofone waveform cycle
N/A Second Between 0 and 2.8 seconds
Time$34
Average Rich (≥0.55 V) time ofone waveform cycle
N/A Second Between 0 and 2.8 seconds
If the sum of Time $33 and Time $34 is out of the standard value, the ECM interprets this as amalfunction.
O2SFailure
ThresholdCharts
(Continued)
O2S TEST RESULTS (MODE 05) – SS002-03 December 17, 2003
Page 33 of 43
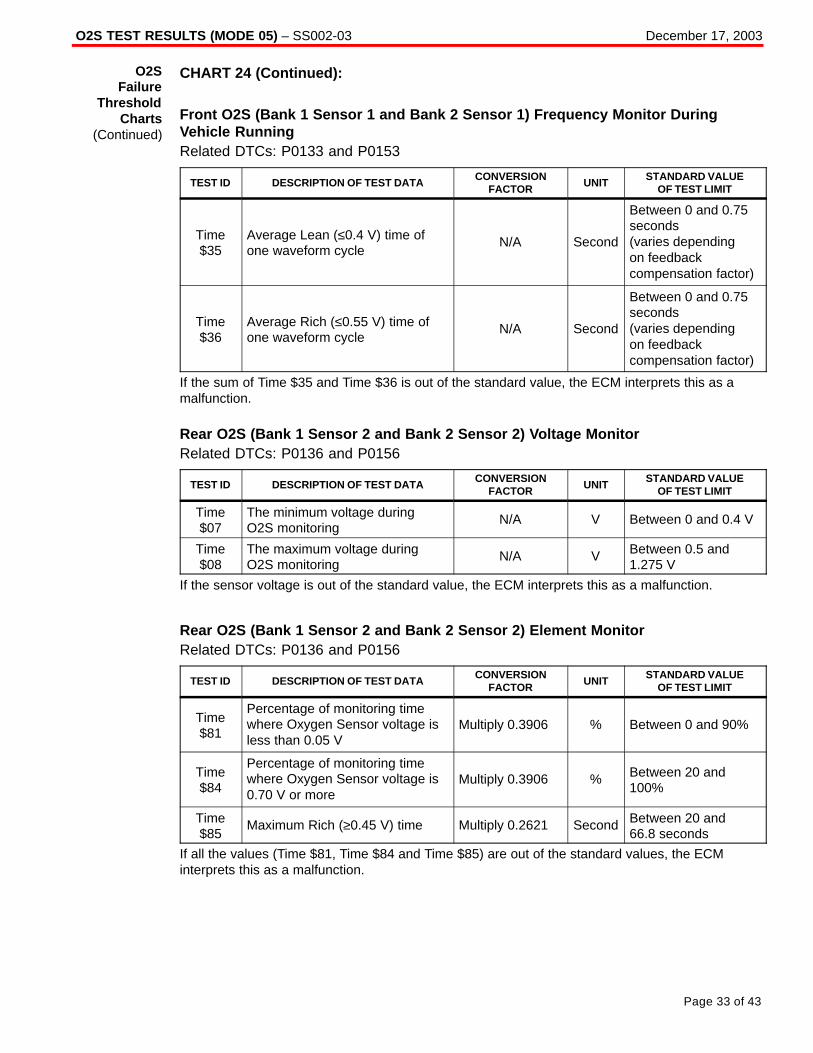
CHART 24 (Continued):
Front O2S (Bank 1 Sensor 1 and Bank 2 Sensor 1) Frequency Monitor DuringVehicle RunningRelated DTCs: P0133 and P0153
TEST ID DESCRIPTION OF TEST DATACONVERSION
FACTORUNIT
STANDARD VALUEOF TEST LIMIT
Time$35
Average Lean (≤0.4 V) time ofone waveform cycle
N/A Second
Between 0 and 0.75seconds (varies depending on feedbackcompensation factor)
Time$36
Average Rich (≤0.55 V) time ofone waveform cycle
N/A Second
Between 0 and 0.75seconds (varies depending on feedbackcompensation factor)
If the sum of Time $35 and Time $36 is out of the standard value, the ECM interprets this as amalfunction.
Rear O2S (Bank 1 Sensor 2 and Bank 2 Sensor 2) Voltage MonitorRelated DTCs: P0136 and P0156
TEST ID DESCRIPTION OF TEST DATACONVERSION
FACTORUNIT
STANDARD VALUEOF TEST LIMIT
Time$07
The minimum voltage duringO2S monitoring
N/A V Between 0 and 0.4 V
Time$08
The maximum voltage duringO2S monitoring
N/A V Between 0.5 and1.275 V
If the sensor voltage is out of the standard value, the ECM interprets this as a malfunction.
Rear O2S (Bank 1 Sensor 2 and Bank 2 Sensor 2) Element MonitorRelated DTCs: P0136 and P0156
TEST ID DESCRIPTION OF TEST DATACONVERSION
FACTORUNIT
STANDARD VALUEOF TEST LIMIT
Time$81
Percentage of monitoring timewhere Oxygen Sensor voltage isless than 0.05 V
Multiply 0.3906 % Between 0 and 90%
Time$84
Percentage of monitoring timewhere Oxygen Sensor voltage is0.70 V or more
Multiply 0.3906 % Between 20 and100%
Time$85
Maximum Rich (≥0.45 V) time Multiply 0.2621 Second Between 20 and 66.8 seconds
If all the values (Time $81, Time $84 and Time $85) are out of the standard values, the ECMinterprets this as a malfunction.
O2SFailure
ThresholdCharts
(Continued)

O2S TEST RESULTS (MODE 05) – SS002-03 December 17, 2003
Page 34 of 43
CHART 25:
Rear O2S (Bank 1 Sensor 2 and Bank 2 Sensor 2) Voltage MonitorRelated DTCs: P0136 and P0156
TEST ID DESCRIPTION OF TEST DATACONVERSION
FACTORUNIT
STANDARD VALUEOF TEST LIMIT
Time$07
The minimum voltage duringO2S monitoring
N/A V Between 0 and0.45 V
Time$08
The maximum voltage duringO2S monitoring
N/A V Between 0.6 and1.275 V
If the sensor voltage is out of the standard value, the ECM interprets this as a malfunction.
Rear O2S (Bank 1 Sensor 2 and Bank 2 Sensor 2) Element MonitorRelated DTCs: P0136 and P0156
TEST ID DESCRIPTION OF TEST DATACONVERSION
FACTORUNIT
STANDARD VALUEOF TEST LIMIT
Time$81
Percentage of monitoring timewhere Oxygen Sensor voltage isless than 0.05 V
Multiply 0.3906 % Between 0 and 80%
Time$84
Percentage of monitoring timewhere Oxygen Sensor voltage is0.70 V or more
Multiply 0.3906 % Between 20 and100%
Time$85
Maximum Rich (≥0.45 V) time Multiply 0.2621 Second Between 20 and 66.8 seconds
If all the values (Time $81, Time $84 and Time $85) are out of the standard values, the ECMinterprets this as a malfunction.
O2SFailure
ThresholdCharts
(Continued)
O2S TEST RESULTS (MODE 05) – SS002-03 December 17, 2003
Page 35 of 43
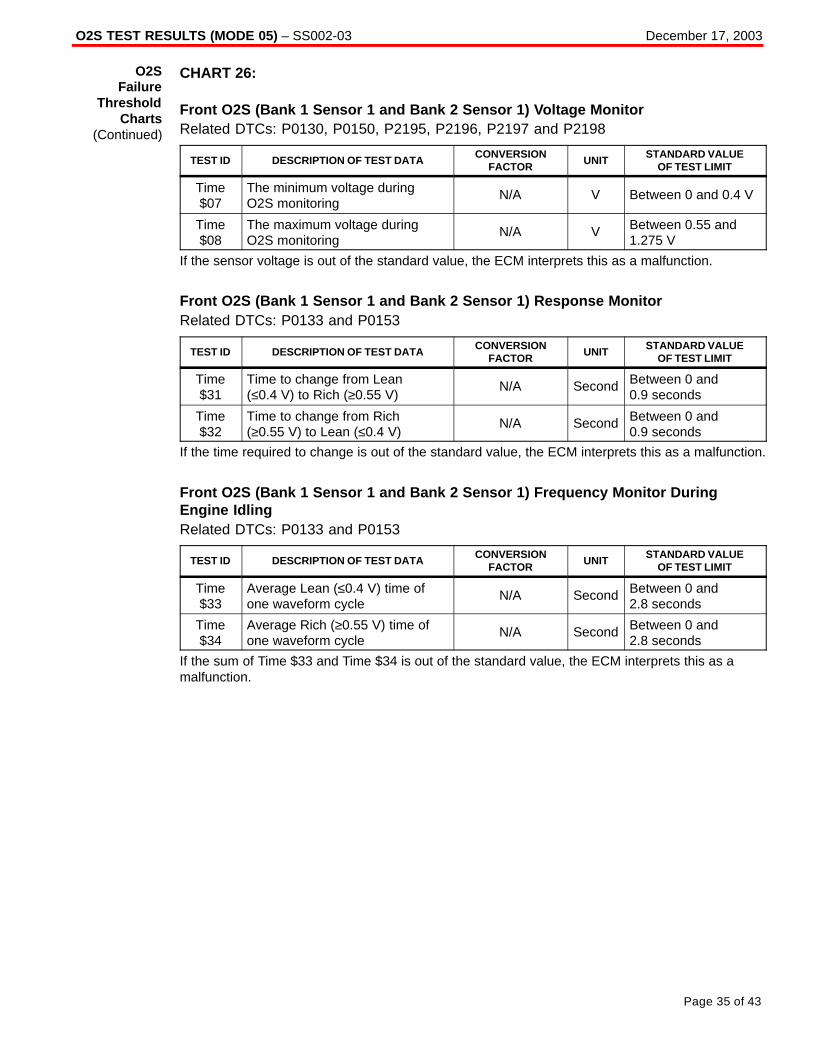
CHART 26:
Front O2S (Bank 1 Sensor 1 and Bank 2 Sensor 1) Voltage MonitorRelated DTCs: P0130, P0150, P2195, P2196, P2197 and P2198
TEST ID DESCRIPTION OF TEST DATACONVERSION
FACTORUNIT
STANDARD VALUEOF TEST LIMIT
Time$07
The minimum voltage duringO2S monitoring
N/A V Between 0 and 0.4 V
Time$08
The maximum voltage duringO2S monitoring
N/A V Between 0.55 and1.275 V
If the sensor voltage is out of the standard value, the ECM interprets this as a malfunction.
Front O2S (Bank 1 Sensor 1 and Bank 2 Sensor 1) Response MonitorRelated DTCs: P0133 and P0153
TEST ID DESCRIPTION OF TEST DATACONVERSION
FACTORUNIT
STANDARD VALUEOF TEST LIMIT
Time$31
Time to change from Lean(≤0.4 V) to Rich (≥0.55 V)
N/A Second Between 0 and 0.9 seconds
Time$32
Time to change from Rich(≥0.55 V) to Lean (≤0.4 V)
N/A Second Between 0 and 0.9 seconds
If the time required to change is out of the standard value, the ECM interprets this as a malfunction.
Front O2S (Bank 1 Sensor 1 and Bank 2 Sensor 1) Frequency Monitor DuringEngine IdlingRelated DTCs: P0133 and P0153
TEST ID DESCRIPTION OF TEST DATACONVERSION
FACTORUNIT
STANDARD VALUEOF TEST LIMIT
Time$33
Average Lean (≤0.4 V) time ofone waveform cycle
N/A Second Between 0 and 2.8 seconds
Time$34
Average Rich (≥0.55 V) time ofone waveform cycle
N/A Second Between 0 and 2.8 seconds
If the sum of Time $33 and Time $34 is out of the standard value, the ECM interprets this as amalfunction.
O2SFailure
ThresholdCharts
(Continued)

O2S TEST RESULTS (MODE 05) – SS002-03 December 17, 2003
Page 36 of 43
CHART 26 (Continued):
Front O2S (Bank 1 Sensor 1 and Bank 2 Sensor 1) Frequency Monitor DuringVehicle RunningRelated DTCs: P0133 and P0153
TEST ID DESCRIPTION OF TEST DATACONVERSION
FACTORUNIT
STANDARD VALUEOF TEST LIMIT
Time$35
Average Lean (≤0.4 V) time ofone waveform cycle
N/A Second
Between 0 and 0.75 seconds (varies depending on feedbackcompensation factor)
Time$36
Average Rich (≤0.55 V) time ofone waveform cycle
N/A Second
Between 0 and 0.75 seconds (varies depending on feedbackcompensation factor)
If the sum of Time $35 and Time $36 is out of the standard value, the ECM interprets this as amalfunction.
Rear O2S (Bank 1 Sensor 2 and Bank 2 Sensor 2) Voltage MonitorRelated DTCs: P0136 and P0156
TEST ID DESCRIPTION OF TEST DATACONVERSION
FACTORUNIT
STANDARD VALUEOF TEST LIMIT
Time$07
The minimum voltage duringO2S monitoring
N/A V Between 0 and 0.4 V
Time$08
The maximum voltage duringO2S monitoring
N/A V Between 0.5 and1.275 V
If the sensor voltage is out of the standard value, the ECM interprets this as a malfunction.
Rear O2S (Bank 1 Sensor 2 and Bank 2 Sensor 2) Element MonitorRelated DTCs: P0136 and P0156
TEST ID DESCRIPTION OF TEST DATACONVERSION
FACTORUNIT
STANDARD VALUEOF TEST LIMIT
Time$81
Percentage of monitoring timewhere Oxygen Sensor voltage isless than 0.05 V
Multiply 0.3906 % Between 0 and 60%
Time$84
Percentage of monitoring timewhere Oxygen Sensor voltage is0.70 V or more
Multiply 0.3906 % Between 20 and100%
Time$85
Maximum Rich (≥0.45 V) time Multiply 0.2621 Second Between 20 and 66.8 seconds
If all the values (Time $81, Time $84 and Time $85) are out of the standard values, the ECMinterprets this as a malfunction.
O2SFailure
ThresholdCharts
(Continued)

O2S TEST RESULTS (MODE 05) – SS002-03 December 17, 2003
Page 37 of 43
CHART 27:
Front O2S (Bank 1 Sensor 1 and Bank 2 Sensor 1) Voltage MonitorRelated DTCs: P0130, P0150, P2195, P2196, P2197 and P2198
TEST ID DESCRIPTION OF TEST DATACONVERSION
FACTORUNIT
STANDARD VALUEOF TEST LIMIT
Time$07
The minimum voltage duringO2S monitoring
N/A V Between 0 and0.35 V
Time$08
The maximum voltage duringO2S monitoring
N/A V Between 0.45 and1.275 V
If the sensor voltage is out of the standard value, the ECM interprets this as a malfunction.
Front O2S (Bank 1 Sensor 1 and Bank 2 Sensor 1) Response MonitorRelated DTCs: P0133 and P0153
TEST ID DESCRIPTION OF TEST DATACONVERSION
FACTORUNIT
STANDARD VALUEOF TEST LIMIT
Time$31
Time to change from Lean(≤0.35 V) to Rich (≥0.45 V)
N/A Second Between 0 and 0.6 seconds
Time$32
Time to change from Rich(≥0.45 V) to Lean (≤0.35 V)
N/A Second Between 0 and 0.6 seconds
If the time required to change is out of the standard value, the ECM interprets this as a malfunction.
Front O2S (Bank 1 Sensor 1 and Bank 2 Sensor 1) Frequency Monitor DuringEngine IdlingRelated DTCs: P0133 and P0153
TEST ID DESCRIPTION OF TEST DATACONVERSION
FACTORUNIT
STANDARD VALUEOF TEST LIMIT
Time$33
Average Lean (≤0.35 V) time ofone waveform cycle
N/A Second Between 0 and 3 seconds
Time$34
Average Rich (≥0.45 V) time ofone waveform cycle
N/A Second Between 0 and 3 seconds
If the sum of Time $33 and Time $34 is out of the standard value, the ECM interprets this as amalfunction.
O2SFailure
ThresholdCharts
(Continued)

O2S TEST RESULTS (MODE 05) – SS002-03 December 17, 2003
Page 38 of 43
CHART 27 (Continued):
Front O2S (Bank 1 Sensor 1 and Bank 2 Sensor 1) Frequency Monitor DuringVehicle RunningRelated DTCs: P0133 and P0153
TEST ID DESCRIPTION OF TEST DATACONVERSION
FACTORUNIT
STANDARD VALUEOF TEST LIMIT
Time$35
Average Lean (≤0.35 V) time ofone waveform cycle
N/A Second
Between 0 and 0.55seconds (varies depending on feedbackcompensation factor)
Time$36
Average Rich (≤0.45 V) time ofone waveform cycle
N/A Second
Between 0 and 0.55seconds (varies depending on feedbackcompensation factor)
If the sum of Time $35 and Time $36 is out of the standard value, the ECM interprets this as amalfunction.
Rear O2S (Bank 1 Sensor 2 and Bank 2 Sensor 2) Voltage MonitorRelated DTCs: P0136 and P0156
TEST ID DESCRIPTION OF TEST DATACONVERSION
FACTORUNIT
STANDARD VALUEOF TEST LIMIT
Time$07
The minimum voltage duringO2S monitoring
N/A V Between 0 and 0.4 V
Time$08
The maximum voltage duringO2S monitoring
N/A V Between 0.5 and1.275 V
If the sensor voltage is out of the standard value, the ECM interprets this as a malfunction.
Rear O2S (Bank 1 Sensor 2 and Bank 2 Sensor 2) Element MonitorRelated DTCs: P0136 and P0156
TEST ID DESCRIPTION OF TEST DATACONVERSION
FACTORUNIT
STANDARD VALUEOF TEST LIMIT
Time$81
Percentage of monitoring timewhere Oxygen Sensor voltage isless than 0.05 V
Multiply 0.3906 % Between 0 and 60%
Time$84
Percentage of monitoring timewhere Oxygen Sensor voltage is0.70 V or more
Multiply 0.3906 % Between 20 and100%
Time$85
Maximum Rich (≥0.45 V) time Multiply 0.2621 Second Between 20 and 66.8 seconds
If all the values (Time $81, Time $84 and Time $85) are out of the standard values, the ECMinterprets this as a malfunction.
O2SFailure
ThresholdCharts
(Continued)

O2S TEST RESULTS (MODE 05) – SS002-03 December 17, 2003
Page 39 of 43
CHART 28:
Front O2S (Bank 1 Sensor 1 and Bank 2 Sensor 1) Voltage MonitorRelated DTCs: P0130, P0150, P2195, P2196, P2197 and P2198
TEST ID DESCRIPTION OF TEST DATACONVERSION
FACTORUNIT
STANDARD VALUEOF TEST LIMIT
Time$07
The minimum voltage duringO2S monitoring
N/A V Between 0 and0.35 V
Time$08
The maximum voltage duringO2S monitoring
N/A V Between 0.45 and1.275 V
If the sensor voltage is out of the standard value, the ECM interprets this as a malfunction.
Front O2S (Bank 1 Sensor 1 and Bank 2 Sensor 1) Response MonitorRelated DTCs: P0133 and P0153
TEST ID DESCRIPTION OF TEST DATACONVERSION
FACTORUNIT
STANDARD VALUEOF TEST LIMIT
Time$31
Time to change from Lean(≤0.35 V) to Rich (≥0.45 V)
N/A Second Between 0 and 0.6 seconds
Time$32
Time to change from Rich(≥0.45 V) to Lean (≤0.35 V)
N/A Second Between 0 and 0.6 seconds
If the time required to change is out of the standard value, the ECM interprets this as a malfunction.
Front O2S (Bank 1 Sensor 1 and Bank 2 Sensor 1) Frequency Monitor DuringEngine IdlingRelated DTCs: P0133 and P0153
TEST ID DESCRIPTION OF TEST DATACONVERSION
FACTORUNIT
STANDARD VALUEOF TEST LIMIT
Time$33
Average Lean (≤0.35 V) time ofone waveform cycle
N/A Second Between 0 and 2 seconds
Time$34
Average Rich (≥0.45 V) time ofone waveform cycle
N/A Second Between 0 and 2 seconds
If the sum of Time $33 and Time $34 is out of the standard value, the ECM interprets this as amalfunction.
O2SFailure
ThresholdCharts
(Continued)
O2S TEST RESULTS (MODE 05) – SS002-03 December 17, 2003
Page 40 of 43
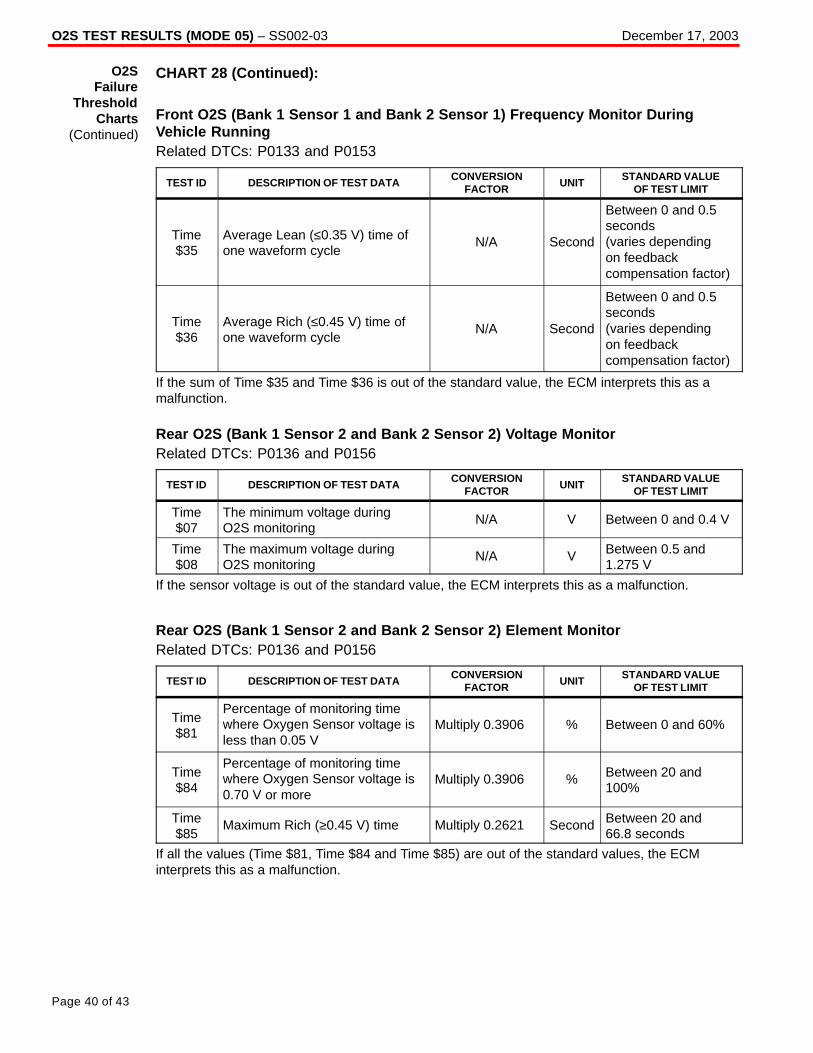
CHART 28 (Continued):
Front O2S (Bank 1 Sensor 1 and Bank 2 Sensor 1) Frequency Monitor DuringVehicle RunningRelated DTCs: P0133 and P0153
TEST ID DESCRIPTION OF TEST DATACONVERSION
FACTORUNIT
STANDARD VALUEOF TEST LIMIT
Time$35
Average Lean (≤0.35 V) time ofone waveform cycle
N/A Second
Between 0 and 0.5seconds (varies depending on feedbackcompensation factor)
Time$36
Average Rich (≤0.45 V) time ofone waveform cycle
N/A Second
Between 0 and 0.5seconds (varies depending on feedbackcompensation factor)
If the sum of Time $35 and Time $36 is out of the standard value, the ECM interprets this as amalfunction.
Rear O2S (Bank 1 Sensor 2 and Bank 2 Sensor 2) Voltage MonitorRelated DTCs: P0136 and P0156
TEST ID DESCRIPTION OF TEST DATACONVERSION
FACTORUNIT
STANDARD VALUEOF TEST LIMIT
Time$07
The minimum voltage duringO2S monitoring
N/A V Between 0 and 0.4 V
Time$08
The maximum voltage duringO2S monitoring
N/A V Between 0.5 and1.275 V
If the sensor voltage is out of the standard value, the ECM interprets this as a malfunction.
Rear O2S (Bank 1 Sensor 2 and Bank 2 Sensor 2) Element MonitorRelated DTCs: P0136 and P0156
TEST ID DESCRIPTION OF TEST DATACONVERSION
FACTORUNIT
STANDARD VALUEOF TEST LIMIT
Time$81
Percentage of monitoring timewhere Oxygen Sensor voltage isless than 0.05 V
Multiply 0.3906 % Between 0 and 60%
Time$84
Percentage of monitoring timewhere Oxygen Sensor voltage is0.70 V or more
Multiply 0.3906 % Between 20 and100%
Time$85
Maximum Rich (≥0.45 V) time Multiply 0.2621 Second Between 20 and 66.8 seconds
If all the values (Time $81, Time $84 and Time $85) are out of the standard values, the ECMinterprets this as a malfunction.
O2SFailure
ThresholdCharts
(Continued)
O2S TEST RESULTS (MODE 05) – SS002-03 December 17, 2003
Page 41 of 43
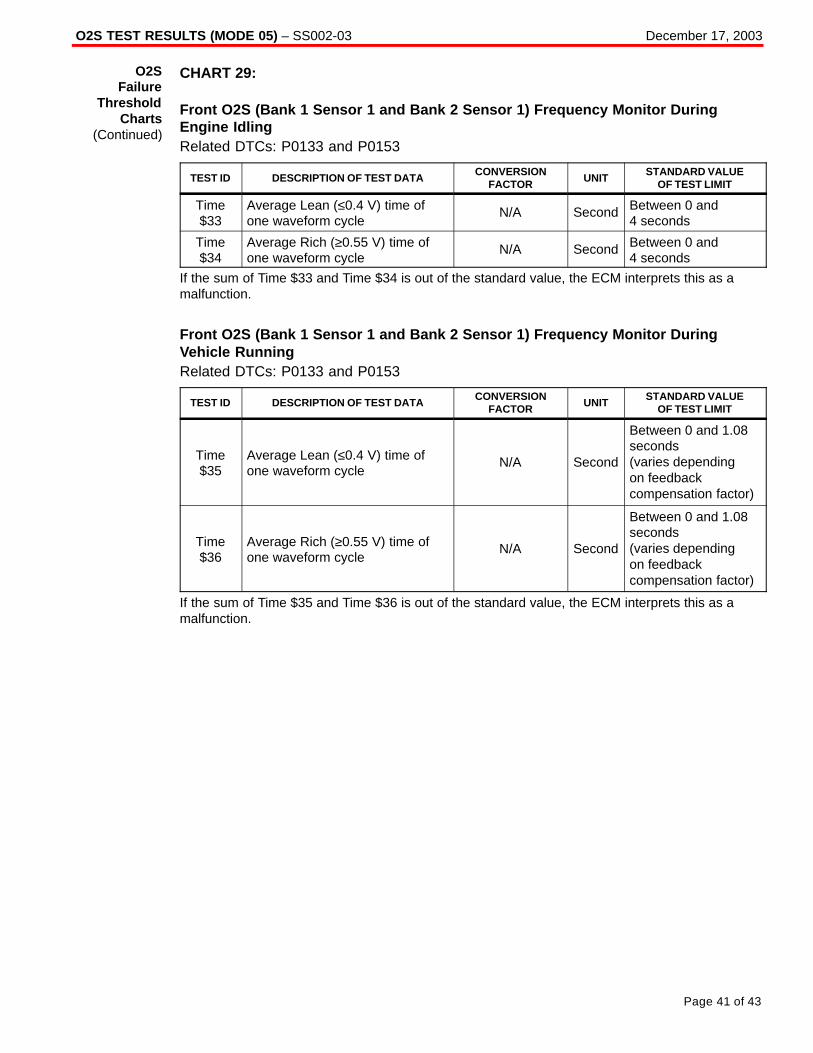
CHART 29:
Front O2S (Bank 1 Sensor 1 and Bank 2 Sensor 1) Frequency Monitor DuringEngine IdlingRelated DTCs: P0133 and P0153
TEST ID DESCRIPTION OF TEST DATACONVERSION
FACTORUNIT
STANDARD VALUEOF TEST LIMIT
Time$33
Average Lean (≤0.4 V) time ofone waveform cycle
N/A Second Between 0 and 4 seconds
Time$34
Average Rich (≥0.55 V) time ofone waveform cycle
N/A Second Between 0 and 4 seconds
If the sum of Time $33 and Time $34 is out of the standard value, the ECM interprets this as amalfunction.
Front O2S (Bank 1 Sensor 1 and Bank 2 Sensor 1) Frequency Monitor DuringVehicle RunningRelated DTCs: P0133 and P0153
TEST ID DESCRIPTION OF TEST DATACONVERSION
FACTORUNIT
STANDARD VALUEOF TEST LIMIT
Time$35
Average Lean (≤0.4 V) time ofone waveform cycle
N/A Second
Between 0 and 1.08seconds (varies depending on feedbackcompensation factor)
Time$36
Average Rich (≥0.55 V) time ofone waveform cycle
N/A Second
Between 0 and 1.08seconds (varies depending on feedbackcompensation factor)
If the sum of Time $35 and Time $36 is out of the standard value, the ECM interprets this as amalfunction.
O2SFailure
ThresholdCharts
(Continued)
O2S TEST RESULTS (MODE 05) – SS002-03 December 17, 2003
Page 42 of 43
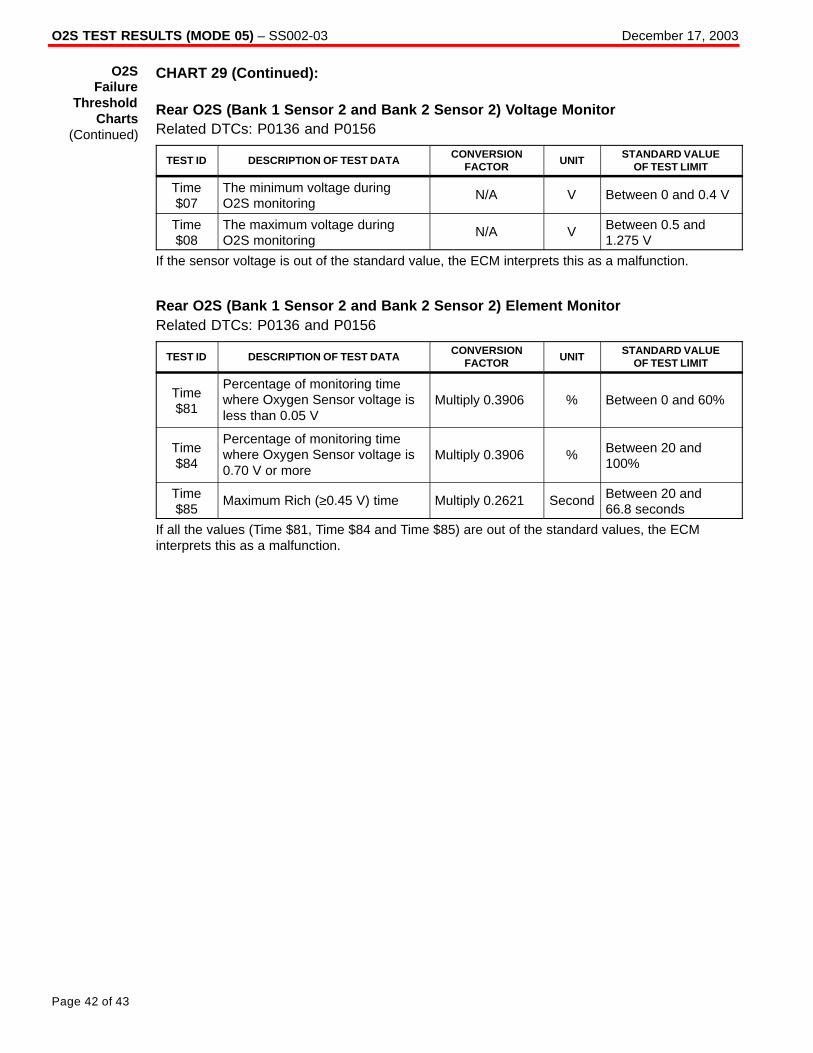
CHART 29 (Continued):
Rear O2S (Bank 1 Sensor 2 and Bank 2 Sensor 2) Voltage MonitorRelated DTCs: P0136 and P0156
TEST ID DESCRIPTION OF TEST DATACONVERSION
FACTORUNIT
STANDARD VALUEOF TEST LIMIT
Time$07
The minimum voltage duringO2S monitoring
N/A V Between 0 and 0.4 V
Time$08
The maximum voltage duringO2S monitoring
N/A V Between 0.5 and1.275 V
If the sensor voltage is out of the standard value, the ECM interprets this as a malfunction.
Rear O2S (Bank 1 Sensor 2 and Bank 2 Sensor 2) Element MonitorRelated DTCs: P0136 and P0156
TEST ID DESCRIPTION OF TEST DATACONVERSION
FACTORUNIT
STANDARD VALUEOF TEST LIMIT
Time$81
Percentage of monitoring timewhere Oxygen Sensor voltage isless than 0.05 V
Multiply 0.3906 % Between 0 and 60%
Time$84
Percentage of monitoring timewhere Oxygen Sensor voltage is0.70 V or more
Multiply 0.3906 % Between 20 and100%
Time$85
Maximum Rich (≥0.45 V) time Multiply 0.2621 Second Between 20 and 66.8 seconds
If all the values (Time $81, Time $84 and Time $85) are out of the standard values, the ECMinterprets this as a malfunction.
O2SFailure
ThresholdCharts
(Continued)

O2S TEST RESULTS (MODE 05) – SS002-03 December 17, 2003
Page 43 of 43
CHART 30:
Rear O2S (Bank 1 Sensor 2 and Bank 2 Sensor 2) Voltage MonitorRelated DTCs: P0136 and P0156
TEST ID DESCRIPTION OF TEST DATACONVERSION
FACTORUNIT
STANDARD VALUEOF TEST LIMIT
Time$07
The minimum voltage duringO2S monitoring
N/A V Between 0 and0.45 V
Time$08
The maximum voltage duringO2S monitoring
N/A V Between 0.5 and1.275 V
If the sensor voltage is out of the standard value, the ECM interprets this as a malfunction.
Rear O2S (Bank 1 Sensor 2 and Bank 2 Sensor 2) Element MonitorRelated DTCs: P0136 and P0156
TEST ID DESCRIPTION OF TEST DATACONVERSION
FACTORUNIT
STANDARD VALUEOF TEST LIMIT
Time$81
Percentage of monitoring timewhere Oxygen Sensor voltage isless than 0.05 V
Multiply 0.3906 % Between 0 and 80%
Time$84
Percentage of monitoring timewhere Oxygen Sensor voltage is0.70 V or more
Multiply 0.3906 % Between 20 and100%
Time$85
Maximum Rich (≥0.45 V) time Multiply 0.2621 Second Between 20 and 66.8 seconds
If all the values (Time $81, Time $84 and Time $85) are out of the standard values, the ECMinterprets this as a malfunction.
O2SFailure
ThresholdCharts
(Continued)