Embed Size (px)
Citation preview
Technical Report Documentation Page 1. Report No. SWUTC/02/167126-1
2. Government Accession No.
3. Recipient's Catalog No.
4. Title and Subtitle Effects of In-Vehicle Distracter Complexity on Driving and Emergency Response Performance
5. Report Date June 2002
6. Performing Organization Code
7. Author(s) Michael P. Manser and Dana M. Even
8. Performing Organization Report No. Research Report 167126-1 10. Work Unit No. (TRAIS)
9. Performing Organization Name and Address Texas Transportation Institute Texas A&M University System College Station, Texas 77843-3135 11. Contract or Grant No.
10727 13. Type of Report and Period Covered
12. Sponsoring Agency Name and Address Southwest Region University Transportation Center Texas Transportation Institute The Texas A&M University System College Station, Texas 77843-3135 14. Sponsoring Agency Code
15. Supplementary Notes Supported by general revenues from the State of Texas.
16. Abstract Imagine yourself driving along a dark foggy road, you are lost, are becoming worried, and refuse to pull over for any period of time in an unfamiliar area. To belay fears you switch on the in-vehicle map. This should help you to determine where you are and how to return to familiar territory. When you are scrolling through menu options your cell phone rings and you answer. At the same time your child in the back seat starts to cry and a buzzer in the vehicle is warning of a potential engine failure. All of a sudden, in the fog you see a vehicle approaching youÖ in your lane! While this example is exaggerated, it is a situation where a driver is presented with a variety of distracters that singularly or in concert may detract from the driving task and detract from a driverís ability to react to an emergency event. Previous research has shown that singular distracters, such as cell phones, can significantly detract from the driverís ability to perform the driving task. However, despite the marked influence on the driving task, little research has evaluated the relative influence of differing levels of distracter complexity influence driver behavior. The purpose of the two experiments presented here was to perform preliminary tests to determine if varying levels of distracter complexity differentially influence driver behavior. A second purpose was to determine the influence of varying levels of distracter complexity on driversí ability to react to an emergency event. Results of the studies indicate that driver performance was degraded with the introduction of a distracter and when the distracter is presented through a visual information delivery mode driver performance was degraded differentially with differing levels of distracter complexity. Results also indicate that when drivers are presented with an emergency response scenario their primary reaction is to brake. However, the number of participants who braked increased with the inclusion of a distracter and was differentially influenced by the level of complexity of the distracter. These results lend support to the contention that driver performance is negatively influenced by the inclusion of and increasing levels of complexity of a distraction and that this may be due to increasing amount of attentional resources that are captured with the introduction of a distracter. 17. Key Words Driving, Distraction, Distracters, Emergency Response, Emergency Maneuver
18. Distribution Statement No Restrictions. This document is available to the public through NTIS: National Technical Information Service 5285 Port Royal Road Springfield, Virginia 22161
19. Security Classif.(of this report) Unclassified
20. Security Classif.(of this page) Unclassified
21. No. of Pages 149
22. Price
Form DOT F 1700.7 (8-72) Reproduction of completed page authorized

EFFECTS OF IN-VEHICLE DISTRACTER COMPLEXITY
ON DRIVING AND EMERGENCY RESPONSE PERFORMANCE by:
Michael P. Manser Ph.D. Associate Research Scientist Center for Transportation Safety Texas Transportation Institute
Dana M. Even Research Associate
Center for Transportation Safety Texas Transportation Institute
Report Number SWUTC/02/167126-1
Sponsored by
Southwest Region University Transportation Center Texas Transportation Institute Texas A&M University System
College Station, Texas 77843-3135
June 2002

ii
iii
ACKNOWLEDGEMENTS
The authors recognize that support for this research was provided by a grant
from the U.S. Department of Transportation, University Transportation Centers Program
to the Southwest Region University Transportation Center, which is funded 50% with
general revenue funds from the State of Texas. The guidance and advice provided by
Mr. David Willis while at the American Automobile Association Foundation for Traffic
Safety and Dr. Peter Hancock at the University of Central Florida invaluable and greatly
appreciated. Additional acknowledgements and thanks are offered to Gary Gandy at
the Texas Transportation Institute for his programming expertise.
DISCLAIMER
The contents of this report reflect the views of the authors, who are solely
responsible for the facts and accuracy of the data, the opinions, and the conclusions
presented herein. The contents do not necessarily reflect the official view or policies of
the Department of Transportation (DOT), the Texas A&M University System, or the
Texas Transportation Institute (TTI). This document is disseminated under the
sponsorship of the Department of Transportation, University Transportation Centers
Program, in the interest of information exchange. Mention of trade names or commercial
products does not constitute endorsement or recommendation for use.

iv
v
ABSTRACT
Imagine yourself driving along a dark foggy road, you are lost, are becoming
worried, and refuse to pull over for any period of time in an unfamiliar area. To belay
fears you switch on the in-vehicle map. This should help you to determine where you
are and how to return to familiar territory. When you are scrolling through menu options
your cell phone rings and you answer. At the same time your child in the back seat
starts to cry and a buzzer in the vehicle is warning of a potential engine failure. All of a
sudden, in the fog you see a vehicle approaching youÖ in your lane! While this
example is exaggerated, it is a situation where a driver is presented with a variety of
distracters that singularly or in concert may detract from the driving task and detract
from a driverís ability to react to an emergency event. Previous research has shown
that singular distracters, such as cell phones, can significantly detract from the driverís
ability to perform the driving task. However, despite the marked influence on the driving
task, little research has evaluated the relative influence of differing levels of distracter
complexity on driver behavior. The purpose of the two experiments presented here was
to perform preliminary tests to determine if varying levels of distracter complexity
differentially influence driver behavior. A second purpose was to determine the
influence of varying levels of distracter complexity on driversí ability to react to an
emergency event. Results of the studies indicate that driver performance was degraded
with the introduction of a distracter and when the distracter is presented through a visual
information delivery mode driver performance was degraded differentially with differing
levels of distracter complexity. Results also indicate that when drivers are presented
with an emergency response scenario their primary reaction is to brake. However, the
number of participants who braked increased with the inclusion of a distracter and was
differentially influenced by the level of complexity of the distracter. These results lend
support to the contention that driver performance is negatively influenced by the
inclusion of and increasing levels of complexity of a distraction and that this may be due
to increasing amount of attentional resources that are captured with the introduction of a
distracter.

vi
vii
EXECUTIVE SUMMARY
Driver distraction, according to Stutts, Reinfurt, Staplin, and Rodgman (2001)
ìoccurs when a driver is delayed in the recognition of information needed to safely
accomplish the driving task because some event, activity, object, or person within or
outside the vehicle compels or induces the driverís shifting attention away from the
driving task.î Previous research examining the influence of distracters on driving
performance has indicated that, in general, various aspects of driving performance
degrade with the introduction of a distracter (Brown & Poulton, 1961; Lamble,
Kauranun, Laasko, & Summala, 1999; Reed & Green, 1999; Serafin, Wen, Paelke, &
Green, 1993). Most recently, with the popularity of cellular telephones and the
conception that they detract from the task of driving, many research efforts have been
directed at examining their influence on the driving task (Alm & Nilsson, 1994; Alm &
Nilsson, 1995; Briem, & Hedman, 1995; Brookhuis, De Vries, & De Waard, 1991;
Kames, 1978; Lamble, Kauranun, Laasko, & Summala, 1999; McKnight & McKnight,
1993; Redelmeier & Tibshirani, 1997; Reed & Green, 1999; Serafin, Wen, Paelke, &
Green, 1993; Stein, Parseghian, & Allen, 1987; Zwahlen, 1998). Additionally, the
results of some studies (Briem & Kedman, 1995; McKnight & McKnight, 1993) lend
support to the contention that varying levels of cognitive demands may differentially
influence driver performance. A limitation to these studies is that they did not directly
address the influence of varying levels of complexity of a single distracter presented via
a single information delivery mode such as vision or audition. Without directly
comparing various degrees of complexity of a single distracter, any veridical
conclusions drawn about the influence of varying levels of complexity of a distracter
would be tenuous. A purpose of the present investigation is to determine if varying
levels of complexity of a single distracter differentially influence various aspects of
general driver performance.
It is not difficult to imagine that the influence of a distracter may play an increasingly
significant role as the driving situation becomes increasingly more dangerous. If the
results of previous distraction research are extrapolated to emergency response events,
such as a head on collision, it is expected that driver performance would be negatively
impacted by the addition of a distracter.
viii
The purpose of the two experiments presented here was to perform preliminary
tests to determine if varying levels of distracter complexity differentially influence driver
behavior. A second purpose was to determine the influence of varying levels of
distracter complexity on driversí ability to react to an emergency event. A total of 60
drivers participated in two studies: one study examined the influence of an auditory
distracter and one study examined the influence of a visual distracter on general driving
performance and on emergency event response performance. General driving
performance consisted of straight line driving on a generic suburban roadway while the
emergency event consisted of a motorcycle approaching the driver in their lane.
Results of the studies indicate that driver performance was degraded with the
introduction of a distracter and when the distracter is presented through a visual
information delivery mode driver performance was degraded differentially with differing
levels of distracter complexity. Results also indicate that when drivers are presented
with an emergency response scenario their primary reaction is to brake. However, the
number of participants who braked increased with the inclusion of a distracter and was
differentially influenced by the level of complexity of the distracter. These results lend
support to the contention that driver performance is negatively influenced by the
inclusion of and increasing levels of complexity of a distraction, and that this may be
due to increasing amount of attentional resources that are captured with the introduction
of a distracter.
ix
TABLE OF CONTENTS
Table of Figures.................................................................................................. xiii Table of Tables....................................................................................................xv
ACKNOWLEDGEMENTS..................................................................................... iii
DISCLAIMER........................................................................................................ iii
ABSTRACT .......................................................................................................... v
EXECUTIVE SUMMARY.....................................................................................vii
CHAPTER ONE - REVIEW OF LITERATURE ..................................................... 1
Emergency Response Performance .............................................................. 3
Distraction, Response Performance, and Emergency Response
Performance ............................................................................................ 6
Purpose of this Study ..................................................................................... 9
CHAPTER TWO - EXPERIMENT ONE METHODLOGY ................................... 11
Experimental Participants ............................................................................ 11
Experimental Apparatus............................................................................... 11
Experimental Procedures............................................................................. 12
Experimental Design .................................................................................... 14
CHAPTER THREE - EXPERIMENT ONE RESULTS......................................... 17
General Driving Performance....................................................................... 17
Emergency Response Performance ............................................................ 17
Mental Workload, Number and Accuracy of Math Problems Performed ...... 21
CHAPTER FOUR - EXPERIMENT TWO ........................................................... 23
CHAPTER FIVE - EXPERIMENT TWO METHODOLOGY ................................ 25
Experimental Participants ............................................................................ 25
Experimental Procedures............................................................................. 25
CHAPTER SIX - EXPERIMENT TWO RESULTS .............................................. 27
Driving Performance .................................................................................... 27
Emergency Response Performance ............................................................ 28
Mental Workload, Number and Accuracy of Math Problems Performed ...... 32
Experiment One and Two Comparison ........................................................ 32
x
CHAPTER SEVEN - DISCUSSION.................................................................... 33
General Driving Performance....................................................................... 33
Emergency Response Performance ............................................................ 34
Sex Differences............................................................................................ 36
REFERENCES................................................................................................... 39
APPENDIX A Human Subjects Consent Form ................................................ 43
APPENDIX B Practice Session Instructions for Experiment One
No Math Group................................................................... 49
APPENDIX C Practice Session Instructions for Experiment One Simple
Math Group and Complex Math group ............................... 51
APPENDIX D Experiment One Experiment Session Instructions for the
No Math Group................................................................... 55
APPENDIX E Experiment One Experiment Session Instructions for the
Simple Math and Complex Math Groups............................ 57
APPENDIX F Experiment One Driving Data for the No Math, Simple
Math, and Complex Math Groups....................................... 59
APPENDIX G Experiment One and Two Problems for the Two
Simple Math Groups........................................................... 61
APPENDIX H Experiment One and Experiment Two Math Problems
for the Complex Math Groups ............................................ 69
APPENDIX I Experiment One Math Data for Simple and Complex
Math Groups....................................................................... 77
APPENDIX J Experiment Two Practice Session Instructions for the
No Math Group................................................................... 97
APPENDIX K Experiment Two Practice Session Instructions for the
Simple Math and Complex Math Groups............................ 99
APPENDIX L Experiment Two Instructions for the No Math Group.............. 103
APPENDIX M Experiment Two Session Instructions for the Simple
Math and Complex Math Groups...................................... 105
APPENDIX N Experiment Two Driving Data for the No Math, Simple
Math, and Complex Math Groups..................................... 107

xi
APPENDIX O Experiment Two Math Data for the Simple Math
and Complex Math Groups............................................... 109

xii
xiii
TABLE OF FIGURES
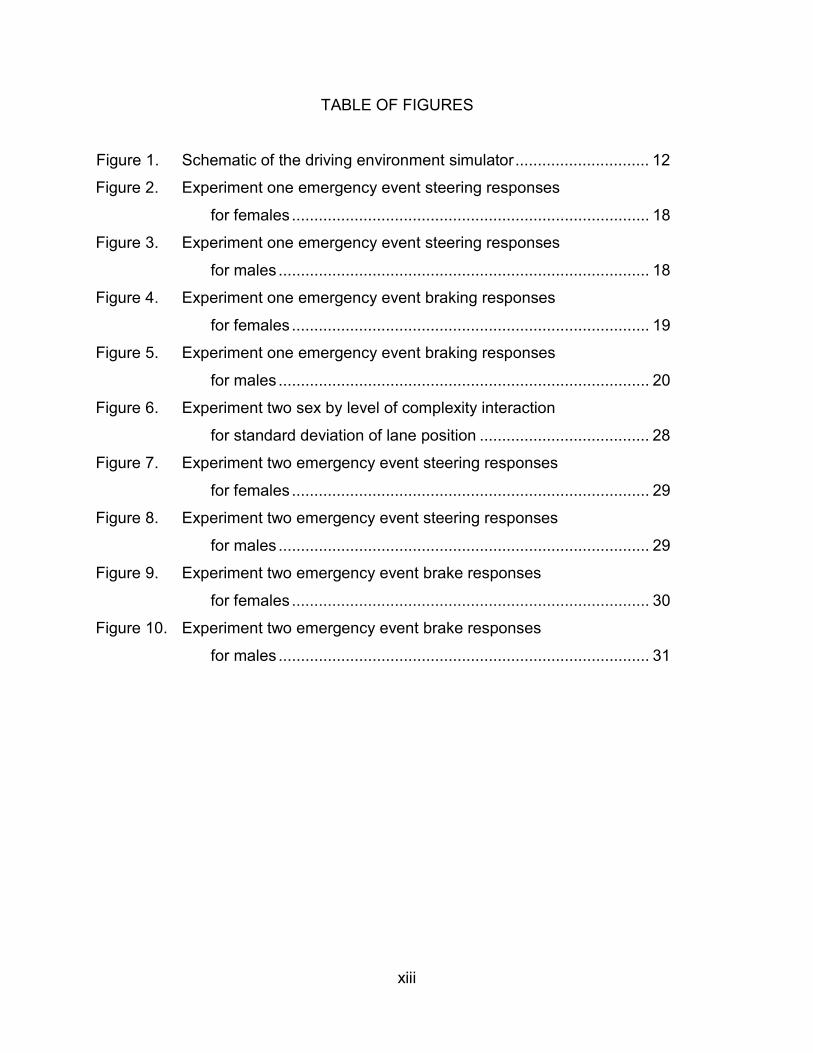
Figure 1. Schematic of the driving environment simulator.............................. 12
Figure 2. Experiment one emergency event steering responses
for females ................................................................................ 18
Figure 3. Experiment one emergency event steering responses
for males ................................................................................... 18
Figure 4. Experiment one emergency event braking responses
for females ................................................................................ 19
Figure 5. Experiment one emergency event braking responses
for males ................................................................................... 20
Figure 6. Experiment two sex by level of complexity interaction
for standard deviation of lane position ...................................... 28
Figure 7. Experiment two emergency event steering responses
for females ................................................................................ 29
Figure 8. Experiment two emergency event steering responses
for males ................................................................................... 29
Figure 9. Experiment two emergency event brake responses
for females ................................................................................ 30
Figure 10. Experiment two emergency event brake responses
for males ................................................................................... 31

xiv
xv
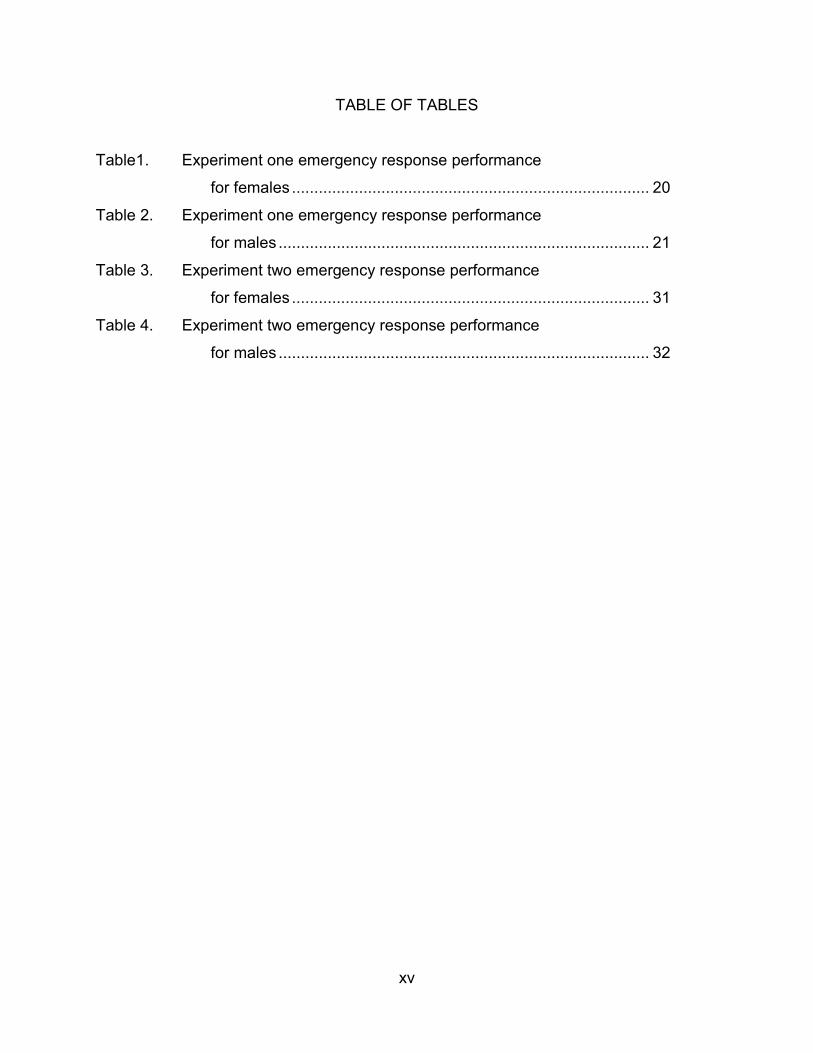
TABLE OF TABLES
Table1. Experiment one emergency response performance
for females ................................................................................ 20
Table 2. Experiment one emergency response performance
for males ................................................................................... 21
Table 3. Experiment two emergency response performance
for females ................................................................................ 31
Table 4. Experiment two emergency response performance
for males ................................................................................... 32

xvi
1
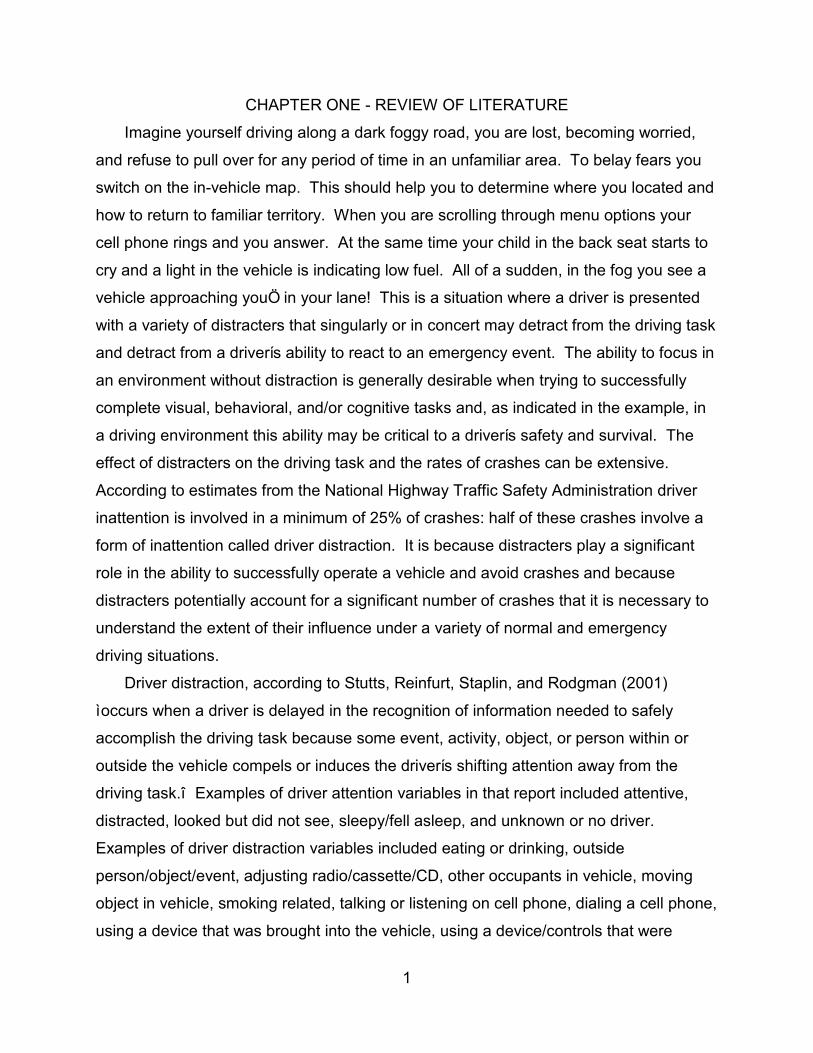
CHAPTER ONE - REVIEW OF LITERATURE
Imagine yourself driving along a dark foggy road, you are lost, becoming worried,
and refuse to pull over for any period of time in an unfamiliar area. To belay fears you
switch on the in-vehicle map. This should help you to determine where you located and
how to return to familiar territory. When you are scrolling through menu options your
cell phone rings and you answer. At the same time your child in the back seat starts to
cry and a light in the vehicle is indicating low fuel. All of a sudden, in the fog you see a
vehicle approaching youÖ in your lane! This is a situation where a driver is presented
with a variety of distracters that singularly or in concert may detract from the driving task
and detract from a driverís ability to react to an emergency event. The ability to focus in
an environment without distraction is generally desirable when trying to successfully
complete visual, behavioral, and/or cognitive tasks and, as indicated in the example, in
a driving environment this ability may be critical to a driverís safety and survival. The
effect of distracters on the driving task and the rates of crashes can be extensive.
According to estimates from the National Highway Traffic Safety Administration driver
inattention is involved in a minimum of 25% of crashes: half of these crashes involve a
form of inattention called driver distraction. It is because distracters play a significant
role in the ability to successfully operate a vehicle and avoid crashes and because
distracters potentially account for a significant number of crashes that it is necessary to
understand the extent of their influence under a variety of normal and emergency
driving situations.
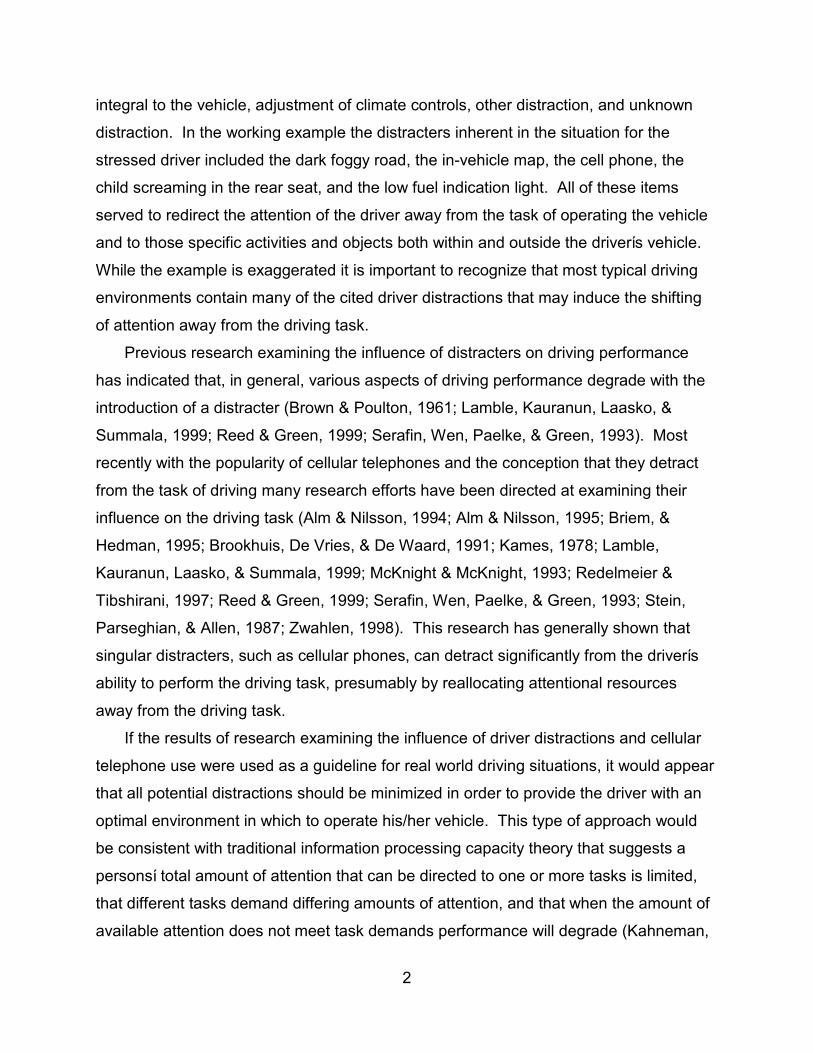
Driver distraction, according to Stutts, Reinfurt, Staplin, and Rodgman (2001)
ìoccurs when a driver is delayed in the recognition of information needed to safely
accomplish the driving task because some event, activity, object, or person within or
outside the vehicle compels or induces the driverís shifting attention away from the
driving task.î Examples of driver attention variables in that report included attentive,
distracted, looked but did not see, sleepy/fell asleep, and unknown or no driver.
Examples of driver distraction variables included eating or drinking, outside
person/object/event, adjusting radio/cassette/CD, other occupants in vehicle, moving
object in vehicle, smoking related, talking or listening on cell phone, dialing a cell phone,
using a device that was brought into the vehicle, using a device/controls that were
2
integral to the vehicle, adjustment of climate controls, other distraction, and unknown
distraction. In the working example the distracters inherent in the situation for the
stressed driver included the dark foggy road, the in-vehicle map, the cell phone, the
child screaming in the rear seat, and the low fuel indication light. All of these items
served to redirect the attention of the driver away from the task of operating the vehicle
and to those specific activities and objects both within and outside the driverís vehicle.
While the example is exaggerated it is important to recognize that most typical driving
environments contain many of the cited driver distractions that may induce the shifting
of attention away from the driving task.
Previous research examining the influence of distracters on driving performance
has indicated that, in general, various aspects of driving performance degrade with the
introduction of a distracter (Brown & Poulton, 1961; Lamble, Kauranun, Laasko, &
Summala, 1999; Reed & Green, 1999; Serafin, Wen, Paelke, & Green, 1993). Most
recently with the popularity of cellular telephones and the conception that they detract
from the task of driving many research efforts have been directed at examining their
influence on the driving task (Alm & Nilsson, 1994; Alm & Nilsson, 1995; Briem, &
Hedman, 1995; Brookhuis, De Vries, & De Waard, 1991; Kames, 1978; Lamble,
Kauranun, Laasko, & Summala, 1999; McKnight & McKnight, 1993; Redelmeier &
Tibshirani, 1997; Reed & Green, 1999; Serafin, Wen, Paelke, & Green, 1993; Stein,
Parseghian, & Allen, 1987; Zwahlen, 1998). This research has generally shown that
singular distracters, such as cellular phones, can detract significantly from the driverís
ability to perform the driving task, presumably by reallocating attentional resources
away from the driving task.
If the results of research examining the influence of driver distractions and cellular
telephone use were used as a guideline for real world driving situations, it would appear
that all potential distractions should be minimized in order to provide the driver with an
optimal environment in which to operate his/her vehicle. This type of approach would
be consistent with traditional information processing capacity theory that suggests a
personsí total amount of attention that can be directed to one or more tasks is limited,
that different tasks demand differing amounts of attention, and that when the amount of
available attention does not meet task demands performance will degrade (Kahneman,
3
1973; Keele, 1973). In allied areas participants are encouraged to reduce the number
of tasks in order to free up attentional resources (Cox, 1990). However, given the
desire for personal liberties eliminating or greatly reducing the number of distracters is
not a reasonable goal. One approach might be to reduce the attentional demands of
one or more distracters. Research examining this proposition within the context of
driver distraction and/or cellular telephone use is limited. The results of some studies
(Briem & Kedman, 1995; McKnight & McKnight, 1993) lend support to the contention
that varying levels of cognitive demands may differentially influence driver performance.
Briem and Hedman (1995) examined the influence of various cellular telephone related
activities including answering and dialing a cellular telephone using hands-free mode,
tuning a radio, engaging in a casual conversation, or answering cognitively engaging
questions on driversí performance. Results indicated that performance degraded
slightly when drivers engaged in a casual conversation and that performance could
suffer even further when they engaged in cognitively engaging questions. These results
are consistent with McKnight and McKnight (1983). In their study drivers experienced
four conditions consisting of tuning a radio, manually dialing a cellular telephone,
engaging in a casual conversation, and engaging in problem solving while being
presented with a series of traffic situations that required a response. The authors
indicate that engaging in casual conversation resulted in significantly less performance
decrements than engaging in problem solving. These results lend support the limited
information processing capacity approach. However, a limitation to these studies is that
they did not directly address the influence of varying levels of complexity of a single
distracter presented via a single information delivery mode such as vision or audition.
Without directly comparing various degrees of complexity of a single distracter any
veridical conclusions drawn about the influence of varying levels of complexity of a
distracter would be tenuous. A purpose of the present investigation is to determine if
varying levels of complexity of a single distracter differentially influence various aspects
of general driver performance.
Emergency Response Performance
In our working example, the driver of the vehicle encountered another vehicle
approaching them in their own lane. This lane-crossing situation is analogous to a
4
drunk driver, another distracted driver, or to a person performing a passing maneuver in
a no-passing zone who may have crossed the centerline without that realization or
concern. These types of situations are not common, are non-linear events, and are
very short-lived but it is an event most drivers will be required to deal with at some time
during their driving tenure. When the margins of safety (Gibson & Crooks, 1938) in
these situations are small and sometimes non-existent it would seem tenable that the
degradation in driver performance due to the presence of a distracter could have a
significant effect on successfully avoiding a potentially catastrophic crash. With regard
to the performance of emergency responses in crash likely situations there is a question
of ëwhatí behaviors drivers typically exhibit and whether these behaviors facilitated
avoidance of the impending crash.
Work performed by Malaterre, Ferrandez, Fleury, and Lechner (1988) involved
observing 72 crashes in the Salon-de-Provence region of France and comparing actual
emergency response performances against performances that would have resulted in
successfully avoiding the crash. Their work indicated that all emergency response
maneuvers failed, that the emergency response performed most often was braking, that
if drivers did steer they most often did so in the direction of the obstacle, and that 43%
of the crashes could have been avoided had at least one driver performed a different
emergency response such as a slight sideways movement. The tendency of drivers to
typically perform braking maneuvers in emergency situations was confirmed by
Hatterick and Bathurst (1976), Lechner and Malaterre (1991), Rice and DellíAmico
(1974), who found that 62.8%, 67%, and 70.5% of drivers, respectively, began by
braking in an emergency maneuver. More recently Adam, Flannagan, and Sivak (1995)
and Kloeppel, Peters, James, Fox, and Alicandri (1995) examined emergency response
performances in an interactive driving simulator. In their work Adams, Flannagan, and
Sivak attempted to identify the various behaviors drivers perform when attempting to
avoid an obstacle on the road given relatively short preview distances and relatively
high travel speeds and were also interested in examining the influence of driver age and
sex on emergency response behaviors. Drivers were assigned to either a younger (16-
19 yrs), middle age (31-47 yrs), or older age group (64-70 yrs) with each age group
divided equally by sex. Drivers were placed in the driving environment simulator and
5
viewed two-lane roadways consisting of straights, curves, and hills with the background
of each area consisting of mountains. During the experimental session, while drivers
were cresting a hill, they encountered a rock in the middle of their lane that they were
not aware of ahead of time. After responding to this emergency event, participants
continued to drive the simulated world and encountered additional rocks about 50% of
the time. Results of the investigation indicated emergency response performance for
the first rock occurrence consisted of eight drivers steering, three drivers braking and
steering, and one subject braking only. Successfully missing the rock was
accomplished by steering only, but only five drivers performed this action and were
successful. Sex did not affect the type of response behavior. For the remainder of the
rock events that were anticipated drivers braked and steered, steered only, and braked
only 51%, 46%, and 3% of the time, respectively. In addition, the emergency maneuver
that produced the highest success rate was braking and steering (96%), followed by
steering only (67%), followed by braking only (0%). These results are in contrast to
other real world and driving environment simulator studies that indicated braking was
the primary reaction to an emergency situation. The significant propensity of drivers to
steer away form the obstacle may be due to the relatively small size of the rock. Earlier
examinations of driver performance in emergency situations typically have used or
observed real-vehicles.
In a similar study Kloeppel, Peters, James, Fox, and Alicandri (1995) investigated
the emergency response performances of younger, middle age, and older age male and
female drivers (n=36) in response to two different emergency events each presented at
two difficulty levels. The emergency events consisted of an oncoming vehicle
performing a left turn maneuver in front of the driverís vehicle and of a vehicle pulling
out suddenly from the right side. Varying the amount of time the drivers had to react
created the two difficulty levels. Results of the study indicated no significant differences
in the number of crashes for age, sex, event type, or event difficulty, indicated non-
significant reaction times for both age and sex, and indicated that all drivers performed
braking maneuvers and few drivers performed braking and steering.
Collectively the results of these studies and earlier studies (Barrett, Kobayashi, &
Fox 1966; Hatterick & Bathurst 1976; Lechner & Malaterre 1991; Limpert & Gamero
6
1974; Malaterre, Ferrandez, Fleury & Lechner 1988) (see also Ferrandez, Fleury &
Lepesant 1984; Fleury, Ferrandez, Lepesant & Lechner 1988; Malaterre, Peytavin,
Jaumier & Kleinmann 1987; Rundkvist 1973 cited in Adams 1994) are generally
consistent and indicate that emergency response behaviors for most drivers consisted
of braking and further indicate that the most successful emergency response behavior
exhibited by drivers was steering or braking and steering combined. It is counter-
intuitive that most drivers attempt to avoid an emergency event by applying the brakes
due to the fact that braking does little to alter the lateral location of driverís vehicle thus
removing them from harmís way. In addition, under heavy braking the front wheels of
the vehicle have a higher propensity for ëlocking upí which quite effectively eliminates
any control the driver may have had over the vehicle and subsequently avoiding the
event.
Distraction, Response Performance, and Emergency Response Performance
With a substantial increase in cellular telephone use within the last decade there is
the question of the influence of this type of distracter on events where a driver response
is required in a very short period of time to avoid future problems. Alm and Nilsson
(1994) examined the influence of a cellular telephone task that included having the
driver answer a phone and complete a standard cognitive test and the influence of two
levels of driving environment difficulty on driving performance in a driving environment
simulator. Drivers were to apply the brakes of their vehicle when a red square was
shown in the driving scene. Results of their study indicated the inclusion of the phone
answering and cognitive test task negatively impacted response time to the appearance
of the red square. These results provide initial support for the contention that driving
performance, in particular, reaction to an event becomes degraded when a driver is
presented with an in-vehicle distracter. Additional support for this contention was
presented in 1995 by Alm and Nilsson who examined the influence of cellular telephone
use on driver performance when following a lead vehicle in a driving environment
simulator. Drivers were assigned to either a telephone answering/cognitive task
condition or a no telephone task condition and were instructed to follow the lead vehicle
and brake or engage the left-turn signal when the lead vehicle either braked or engaged
the right turn signal, respectively. Results indicated when drivers engaged in the
7
telephone answering/cognitive task their response time to the change in state of the
lead vehicle increased significantly compared to the no telephone task. In another car
following experiment Lamble, Kauranun, Laasko, and Summala (1999) investigated the
degree of influence a cognitive task and a cellular telephone dialing task on driving
performance when following a lead vehicle that eventually decelerated. Results of the
investigation support the contention that event response capabilities are compromised
when drivers are presented with a secondary task. Specific to the current study, driverís
time to collision threshold increased significantly with the inclusion of the cognitive task
and with the inclusion of the cellular telephone dialing task. In an examination of the
influence of an in-vehicle distracter on a decision making maneuver Hancock, Simmons,
Hashemi, Howarth, and Ranney (1999) performed a study on a closed-loop test track.
Participants performed a series of trials in which they drove the track and were required
to obey a lighted red-yellow-green traffic signal. On 30 of the 60 trials drivers were not
presented with the distraction task or presented with a changing traffic signal. Ten of
the trials consisted of the driver being presented with a distraction task that consisted of
determining if there was a match between a presented number and a number that had
been presented previous to the trial, and then confirming a match/no-match condition on
a touch screen. Ten of the trials required the driver to make a sudden stop when the
traffic signal changed from green to red. The final ten trials presented the driver with
both the distraction task and the sudden stop at the traffic signal. Results of their work
indicated brake response times were slower for the sudden stop at the traffic signal
when the distracter was presented. While stopping times decreased for the sudden
stop at the traffic signal while the distracter was present, there was an approximately
25% reduction in stationary distance from the intersection. The authors indicate
decreased levels of performance for distracter response accuracy and number recall
accuracy that lends support to the contention that there was a competing task for
drivers while performing the decision at the traffic signal. While the driverís task in this
situation is not an emergency response event, it does represent a situation where the
driver must make a decision in a very short period of time and implement that decision
to avoid breaking the law and potentially being involved in a serious crash.
8
It is not difficult to imagine that the influence of a distracter may play an increasingly
significant role as the driving situation becomes increasingly more dangerous. This type
of situation is exemplified in the example presented earlier where our driver was being
distracted and was required to perform the correct emergency response in order to
prevent a collision with the approaching vehicle. Given the potentially significant impact
of these situations little is known of how drivers respond to a true emergency event
while being distracted. However, if the results of previous distraction research are
extrapolated to emergency response events, such as a head on collision, it is expected
that driver performance would be negatively impacted by the addition of a distracter.
One study may provide initial insight into these behaviors. Crawford, Manser, Jenkins,
Court, and Sepulveda (2001) examined the influence of high and low complexity
conversations and hand-held and hands-free cellular telephone use on general driving
performance and emergency response performance. As part of the study, drivers
navigated their vehicle down a standard two lane road and engaged in one of four
cellular telephone conditions: high intensity conversation while using a hands free
cellular telephone, high intensity conversation while using a hand held cellular
telephone, low intensity while using a hands free cellular telephone, and a low intensity
conversation while using a hand held cellular telephone. At the conclusion of the
cellular telephone conversation a white delivery truck suddenly appeared directly in front
of the driverís vehicle with a time to collision of 2.6 seconds. Drivers were not informed
ahead of time about the emergency event. No performance benefits for were observed
during the emergency event for hand free versus hand held cellular telephone use and
no decrement in performance was observed for the high intensity versus the low
intensity conversation. Results did indicate females exhibited significantly greater
response times than their male counterparts. In general though, these results are
inconsistent with previous distraction research examining general driving behaviors and
inconsistent with the limited information processing capacity approach that would
postulate the addition of one or more tasks would demand more attentional capacity
and result in performance decrements. The results may be due to several
methodological constraints. In particular, the authors indicated challenges in creating
and sustaining high complexity naturalistic conversations. This challenge was
9
compounded by the fact a baseline condition in which drivers responded to the
emergency event without a distracter was not included in the study. This limits the
ability of the study to confirm the basic influence of a distracter on driving performance.
Finally, previous research has shown that the presentation of ecologically invalid
artificial driving scenarios can significantly impact how drivers respond to a driving event
(Hancock & Manser, 1997; Manser & Hancock, 1996). Relative to Crawford et al, driver
performance may have been significantly impacted by the ecologically invalid sudden
appearance of the white van.
Purpose of this Study
The purpose of the pilot work presented here was to determine if varying levels of
complexity of a single in-vehicle distracter delivered via an auditory information delivery
mode would differentially influence general driving performance and emergency
response performance. With regard to general driving performance the present study
sought to confirm previous results indicating the degradation of general driving
performance with the introduction of a distracter and to examine the influence of the
various levels of complexity of a distracter. If performance degrades markedly more
when drivers experience a high complexity distracter relative to a low-complexity
distracter, it would indicate that markedly more attentional resources were being
directed away from the driving task. This would also indicate that the distracters should
be designed to minimize complexity for the user.
An additional purpose of the pilot work presented here was to examine the influence
of various levels of complexity of a distracter on emergency response performance and
sought to address the challenges associated with Crawford et al. If the ability of drivers
to respond to an emergency event is differentially affected with the introduction of a
distracter it would support the contention that valuable attentional resources redirected
from the driving task.

10
11
CHAPTER TWO - EXPERIMENT ONE METHODLOGY
Experimental Participants
Participants in this study were fifteen males (mean age = 30.1, standard deviation =
9) and fifteen females (mean age = 33, standard deviation = 14.5) between 18 and 71
years of age. Participants were recruited from Texas Transportation Institute staff and
from the surrounding community. All participants possessed a valid drivers license,
20/40 vision or corrected to 20/40 vision via contact lenses or glasses, and possessed
no apparent physical or cognitive limitations that would have affected performance in
this study.
Experimental Apparatus
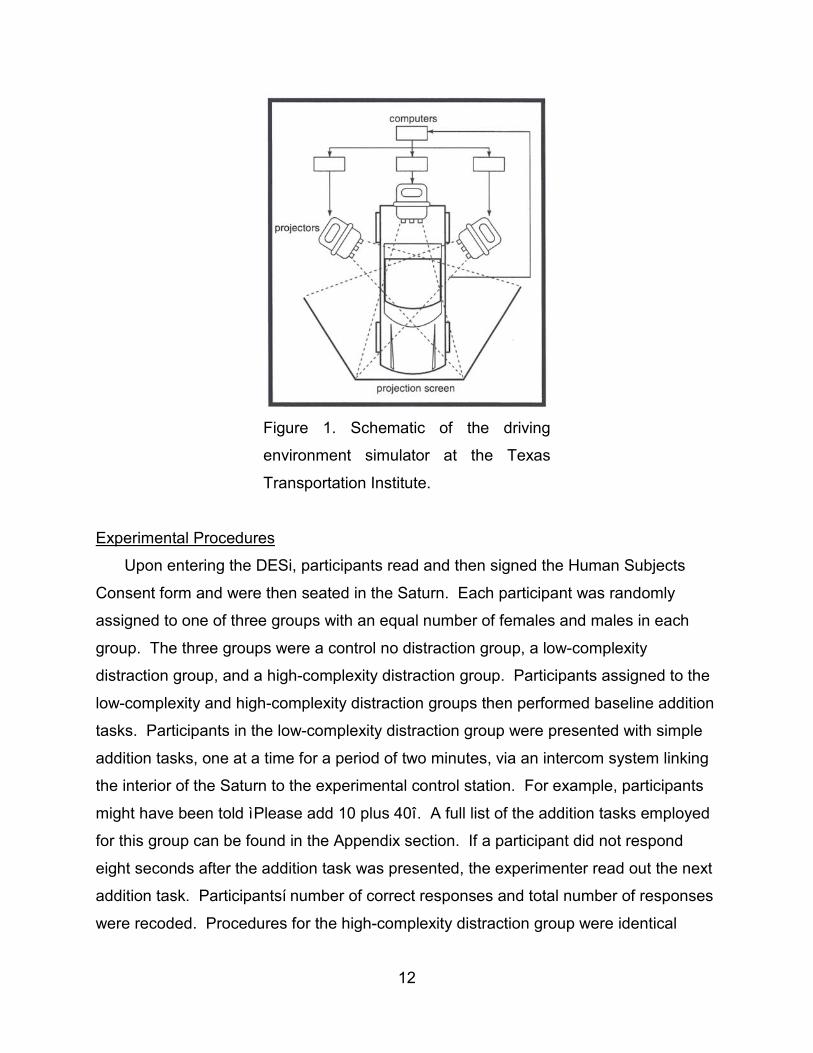
The apparatus used for this study was a driving environment simulator (DESi).
DESi consisted of three white polypropylene screens (each screen was 2.28 m (90 in) in
height and width, a 1995 Saturn SC2 complete vehicle, three image generation
computers, one data collection computer, and three liquid crystal display projectors.
The driving scene presented to participants was generated by GlobalSim Corporation
Hyperdrive software (Version 1.2) and projected through three Proxima 6810 liquid
crystal display projectors to the screens. The three separate images projected onto the
screens were aligned so they appeared as one single image covering a 150∫ field of
view horizontally and a 50∫ field of view vertically for the driver. Participants sat in the
driverís seat of the 1995 Saturn SL2, positioned in the center of the DESi (see Figure 1.
for a schematic). Participantsí performance measures were collected via the data
collection computer connected to the vehicle's steering column, brake pedal, and gas
pedal at a sampling rate of 60 times per second. Driver performance data collected as
part of this experiment included vehicle velocity, vehicle lane position, time and
magnitude of brake application, and time and magnitude of gas pedal application.
12
Figure 1. Schematic of the driving
environment simulator at the Texas
Transportation Institute.
Experimental Procedures
Upon entering the DESi, participants read and then signed the Human Subjects
Consent form and were then seated in the Saturn. Each participant was randomly
assigned to one of three groups with an equal number of females and males in each
group. The three groups were a control no distraction group, a low-complexity
distraction group, and a high-complexity distraction group. Participants assigned to the
low-complexity and high-complexity distraction groups then performed baseline addition
tasks. Participants in the low-complexity distraction group were presented with simple
addition tasks, one at a time for a period of two minutes, via an intercom system linking
the interior of the Saturn to the experimental control station. For example, participants
might have been told ìPlease add 10 plus 40î. A full list of the addition tasks employed
for this group can be found in the Appendix section. If a participant did not respond
eight seconds after the addition task was presented, the experimenter read out the next
addition task. Participantsí number of correct responses and total number of responses
were recoded. Procedures for the high-complexity distraction group were identical
13
except participants were presented with addition tasks read to them as ìPlease add 13
plus 48î. A full list of the addition tasks employed for this group can be found in the
Appendix section. The low-complexity and high-complexity addition tasks were
randomly generated, were identical for all participants within a specific distraction group,
and were presented in the same order for each participant within a specific distraction
group.
Participants then performed a five-minute practice drive to become familiar with the
control and operation of the vehicle. The practice drive consisted of having the
participant follow a lead vehicle that traveled at 56 km/h (35 mph) for five minutes on a
road consisting of straight and curved two-lane highway sections replete with traffic and
roadside features such as houses, barns, fields, etc. to the side of the roadway.
Additional instructions were then provided to each participant regarding their
experimental task. In particular, participants were told to drive in a normal fashion, to
maintain a speed of 64 km/h (40 mph), to obey all traditional and observable traffic laws,
and to respond appropriately and ëas best they couldí to the two two-minute addition
tasks. The experimental drive then began. The computer generated driving scenario of
the experimental drive consisted of an 8 km (5 miles) two-lane roadway with the first 4
km being straight roadway, the fifth km consisting of a large curve, and the last 3 km
consisting of a long deep decline (valley) followed by a steep hill. As the participant
drove up and then began cresting the steep hill a motorcycle appeared on the horizon in
the center of the participantís lane driving directly toward the participantís vehicle. The
period of time between the appearance of the motorcyclistís helmet on the horizon and
collision between the two vehicles was 2.8 seconds. To create the 2.8-second time to
collision, the speed of the motorcycle was continually modulated based on the driverís
speed. The 2.8 seconds time to collision was chosen because it afforded drivers an
opportunity to avoid the collision successfully if they performed the correct driving
maneuvers while not affording an excessive amount of time. Participants were not
provided with information regarding the motorcycle event. Unknown to all participants
when they reached 3 km into the driving world, a straight section of roadway,
performance data was collected for a period of two minutes (same two minute period
when drivers in the low and high level of complexity distraction conditions preformed
14
math tasks). When participants reached the bottom of the hill, approximately 7 km into
the drive, performance data was again collected from that point until approximately ten
seconds after the motorcycle appeared on the horizon.
Participants assigned to the no distraction control group simply drove through the
experimental drive without performing any addition problems. Participants assigned to
the low and high complexity distraction groups completed new low and high complexity
randomly generated addition tasks respective to each group during each of the two
performance data collection zones. The low and high complexity addition tasks for the
experimental drive can be found in the Appendix section. Immediately following the
completion of the first two-minute data collection zone drivers in each of the three
distraction conditions performed a Modified Cooper-Harper mental workload
assessment. The purpose of the assessment was to verify that driversí mental
workload was significantly higher in the no distraction condition as compared to the low
level of complexity distraction condition and significantly higher in the high level of
complexity distraction condition. Assessing mental workload after the second two
minute data collection zone was not possible as driversí estimates of mental workload
would be confounded due to the stress imposed by the emergency event response.
Immediately following the emergency event response participants finished the
experiment and exited the vehicle.
Experimental Design
General driving performance data (data collected during the first and the second
two-minute driving sections) consisted of mean velocity, standard deviation of velocity,
mean lane position, and standard deviation of lane position and were analyzed in a 2 x
3 (sex by level of distraction) analysis of variance with sex and level of distraction (no
distraction, low distraction, high distraction) as the between-subjects variables. The
alpha level was set at .05 and significant differences were distinguished using Tukeyís
Honestly Significant Difference (HSD) post hoc test.
Emergency response performance data consisted of discrete driver actions that
included accelerator (acceleration or no acceleration), brake (braking or no braking),
and steering behavior (steered left, right, or continued straight) in relation to the no
distraction, low complexity distraction, and high complexity distraction conditions for
15
both females and males that were analyzed in a series of chi square tests. The chi
square tests compared the discrete driver action variables with the levels of distraction
complexity and driver sex. The alpha level was set at .05.
Mental workload scores consisted of a discrete Modified Cooper-Harper score
between 0 and 10. Participant scores for level of complexity of distracter (no distraction,
low level of complexity of distraction, and high level of complexity) were analyzed using
a single variable ANOVA. The alpha level was set at .05 and significant differences
were distinguished using Tukeyís Honestly Significant Difference (HSD) post hoc test.
As a further test of the mental demands of the math test and driving task, the
percentage of math problems completed by drivers (relative to the total amount that
could be performed) and the percentage of correct responses for math problems
attempted in the low and high level of complexity distraction conditions for the first of the
two data collection zones were analyzed in a single variable ANOVA. The alpha level
was set at .05 and significant differences were distinguished using Tukeyís Honestly
Significant Difference (HSD) post hoc test.

16
17
CHAPTER THREE - EXPERIMENT ONE RESULTS
General Driving Performance
There was a sex main effect for standard deviation of velocity, where F = 5.75, p <
.05, with the means for females and males being 3.00 and 2.13 standard deviations,
respectively. These results indicate that females in Experiment One varied more in
velocity than did males.
Emergency Response Performance
Results from the chi square tests indicated significant differences between some
driver responses and levels of distraction complexity for either males or females.
However, as expected the limited number of driver responses (less than five) in several
categories compromised the validity of the results and the ability to make veridical
conclusions based on the results. However, presenting descriptive statistics can still
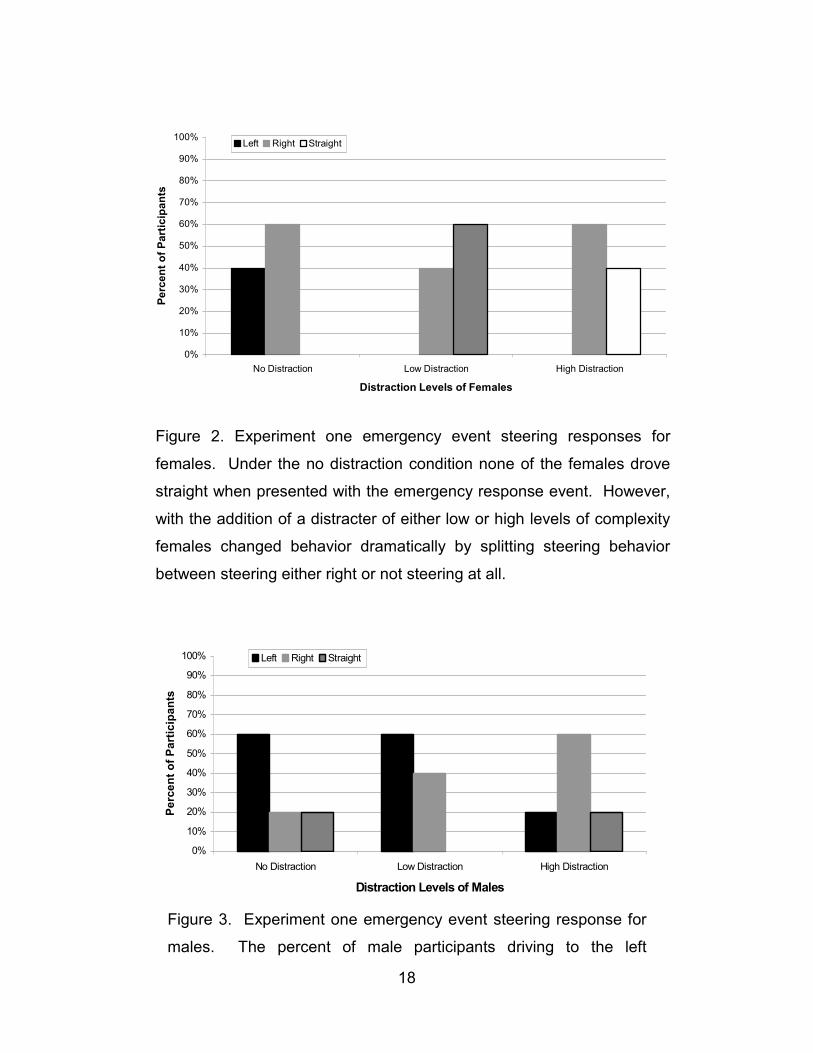
facilitate a general understanding of driversí emergency response performance. In
general, emergency event steering response performance while no distracter was
presented to drivers consisted mainly of steering either left or right when presented with
the approaching motorcycle. When this data is divided by driver sex (see Figures 2 and
3 for females and males respectively) it is evident that under the no distraction condition
females steered only to the left or right but when presented with either a low or high
complexity distracter females steered either right or continued to drive straight toward
the motorcycle. In contrast males steered employed steering left, right, and straight in
all three level of complexity distraction conditions but, in general, as level of complexity
of the distracter increased males tended to steered to the left less often and continue to
drive straight more often.
18
0%
10%
20%
30%
40%
50%
60%
70%
80%
90%
100%
No Distraction Low Distraction High Distraction
Distraction Levels of Females
Percent of Participants
Left Right Straight
Figure 2. Experiment one emergency event steering responses for
females. Under the no distraction condition none of the females drove
straight when presented with the emergency response event. However,
with the addition of a distracter of either low or high levels of complexity
females changed behavior dramatically by splitting steering behavior
between steering either right or not steering at all.
0%
10%
20%
30%
40%
50%
60%
70%
80%
90%
100%
No Distraction Low Distraction High Distraction
Distraction Levels of Males
Percent of Participants
Left Right Straight
Figure 3. Experiment one emergency event steering response for
males. The percent of male participants driving to the left
19
decreases and the percent of male participant driving to the right
increases as the level of complexity of the distracter increases.
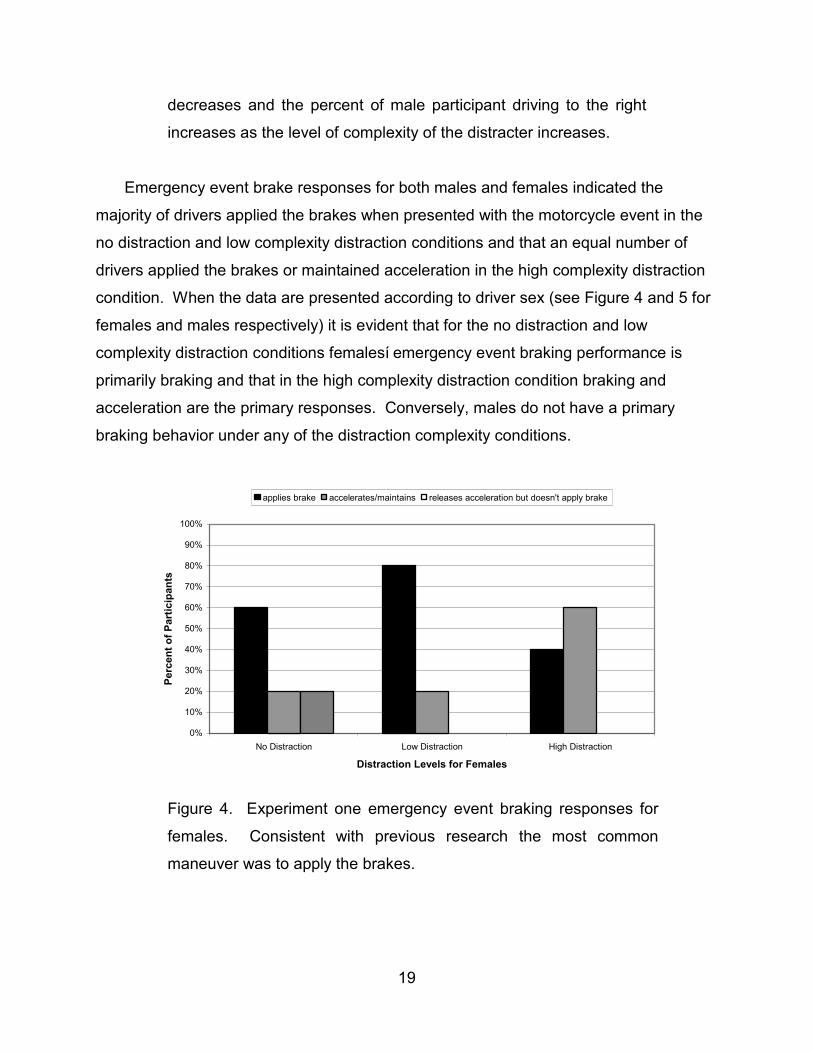
Emergency event brake responses for both males and females indicated the
majority of drivers applied the brakes when presented with the motorcycle event in the
no distraction and low complexity distraction conditions and that an equal number of
drivers applied the brakes or maintained acceleration in the high complexity distraction
condition. When the data are presented according to driver sex (see Figure 4 and 5 for
females and males respectively) it is evident that for the no distraction and low
complexity distraction conditions femalesí emergency event braking performance is
primarily braking and that in the high complexity distraction condition braking and
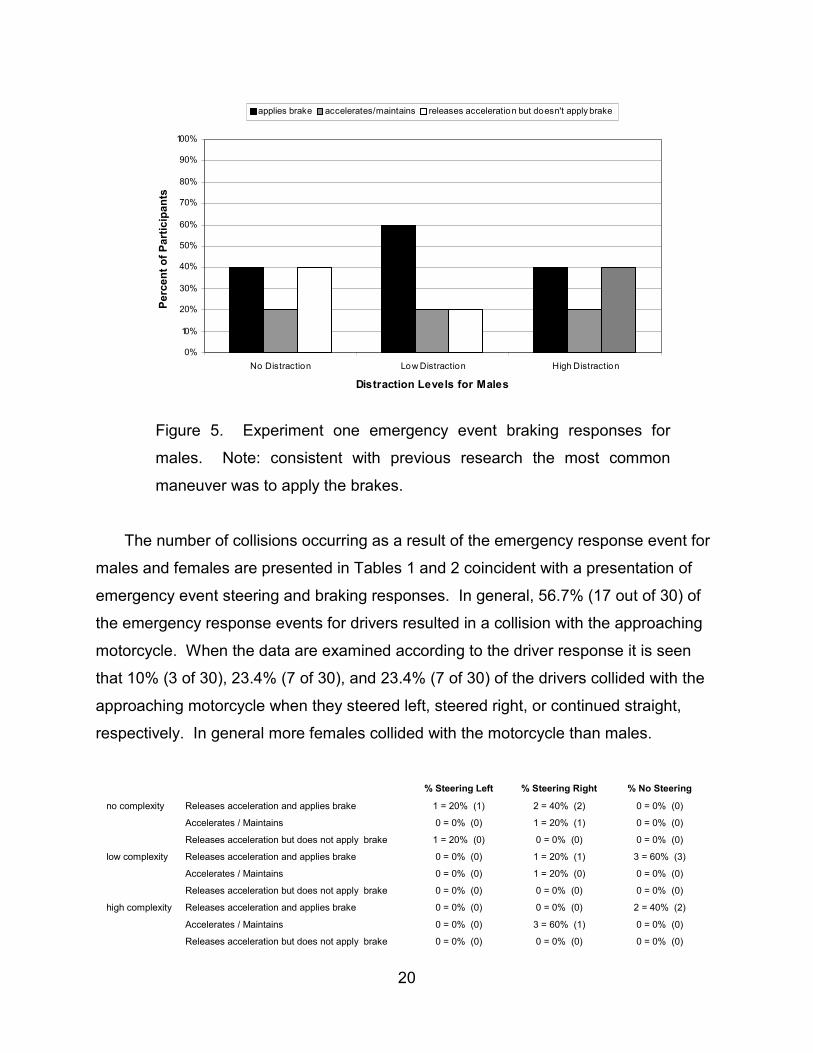
acceleration are the primary responses. Conversely, males do not have a primary
braking behavior under any of the distraction complexity conditions.
0%
10%
20%
30%
40%
50%
60%
70%
80%
90%
100%
No Distraction Low Distraction High Distraction
Distraction Levels for Females
Percent of Participants
applies brake accelerates/maintains releases acceleration but doesn't apply brake
Figure 4. Experiment one emergency event braking responses for
females. Consistent with previous research the most common
maneuver was to apply the brakes.
20
0%
10%
20%
30%
40%
50%
60%
70%
80%
90%
100%
No Distraction Low Distraction High Distraction
Distraction Levels for Males
Percent of Participants
applies brake accelerates/maintains releases acceleration but doesn't apply brake
Figure 5. Experiment one emergency event braking responses for
males. Note: consistent with previous research the most common
maneuver was to apply the brakes.
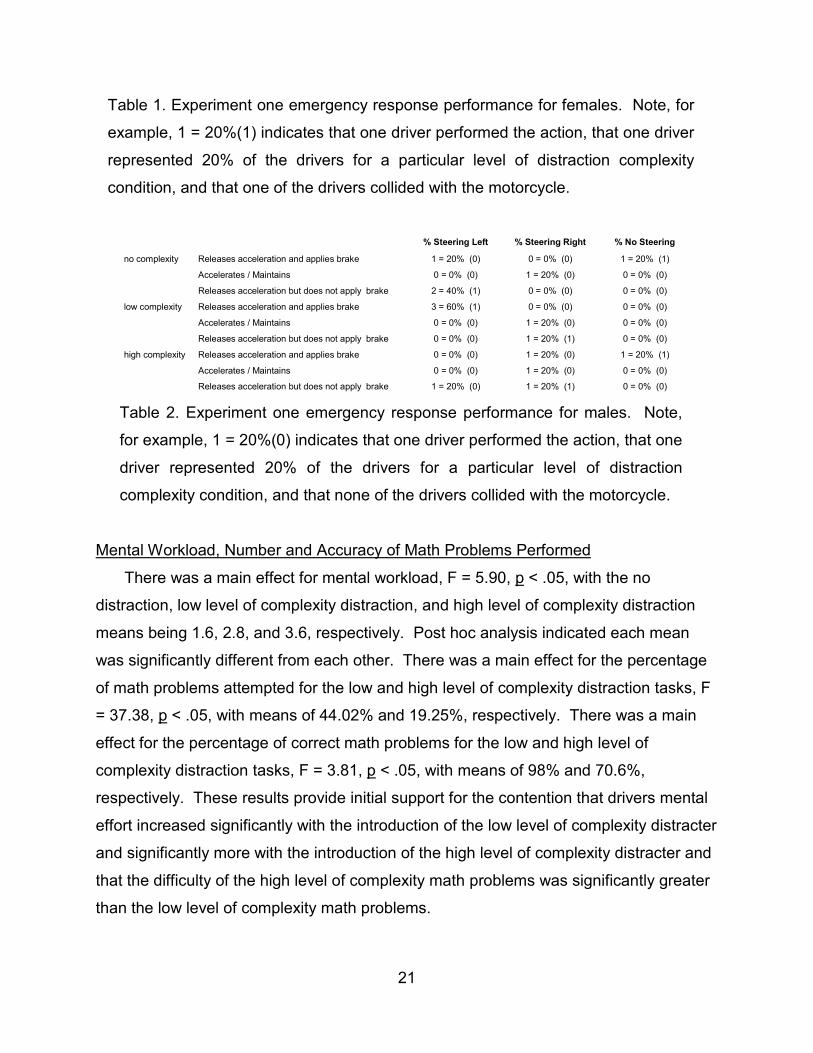
The number of collisions occurring as a result of the emergency response event for
males and females are presented in Tables 1 and 2 coincident with a presentation of
emergency event steering and braking responses. In general, 56.7% (17 out of 30) of
the emergency response events for drivers resulted in a collision with the approaching
motorcycle. When the data are examined according to the driver response it is seen
that 10% (3 of 30), 23.4% (7 of 30), and 23.4% (7 of 30) of the drivers collided with the
approaching motorcycle when they steered left, steered right, or continued straight,
respectively. In general more females collided with the motorcycle than males.
% Steering Left % Steering Right % No Steering
no complexity Releases acceleration and applies brake 1 = 20% (1) 2 = 40% (2) 0 = 0% (0)
Accelerates / Maintains 0 = 0% (0) 1 = 20% (1) 0 = 0% (0)
Releases acceleration but does not apply brake 1 = 20% (0) 0 = 0% (0) 0 = 0% (0)
low complexity Releases acceleration and applies brake 0 = 0% (0) 1 = 20% (1) 3 = 60% (3)
Accelerates / Maintains 0 = 0% (0) 1 = 20% (0) 0 = 0% (0)
Releases acceleration but does not apply brake 0 = 0% (0) 0 = 0% (0) 0 = 0% (0)
high complexity Releases acceleration and applies brake 0 = 0% (0) 0 = 0% (0) 2 = 40% (2)
Accelerates / Maintains 0 = 0% (0) 3 = 60% (1) 0 = 0% (0)
Releases acceleration but does not apply brake 0 = 0% (0) 0 = 0% (0) 0 = 0% (0)
21
Table 1. Experiment one emergency response performance for females. Note, for
example, 1 = 20%(1) indicates that one driver performed the action, that one driver
represented 20% of the drivers for a particular level of distraction complexity
condition, and that one of the drivers collided with the motorcycle.
% Steering Left % Steering Right % No Steering
no complexity Releases acceleration and applies brake 1 = 20% (0) 0 = 0% (0) 1 = 20% (1)
Accelerates / Maintains 0 = 0% (0) 1 = 20% (0) 0 = 0% (0)
Releases acceleration but does not apply brake 2 = 40% (1) 0 = 0% (0) 0 = 0% (0)
low complexity Releases acceleration and applies brake 3 = 60% (1) 0 = 0% (0) 0 = 0% (0)
Accelerates / Maintains 0 = 0% (0) 1 = 20% (0) 0 = 0% (0)
Releases acceleration but does not apply brake 0 = 0% (0) 1 = 20% (1) 0 = 0% (0)
high complexity Releases acceleration and applies brake 0 = 0% (0) 1 = 20% (0) 1 = 20% (1)
Accelerates / Maintains 0 = 0% (0) 1 = 20% (0) 0 = 0% (0)
Releases acceleration but does not apply brake 1 = 20% (0) 1 = 20% (1) 0 = 0% (0) Table 2. Experiment one emergency response performance for males. Note,
for example, 1 = 20%(0) indicates that one driver performed the action, that one
driver represented 20% of the drivers for a particular level of distraction
complexity condition, and that none of the drivers collided with the motorcycle.
Mental Workload, Number and Accuracy of Math Problems Performed
There was a main effect for mental workload, F = 5.90, p < .05, with the no
distraction, low level of complexity distraction, and high level of complexity distraction
means being 1.6, 2.8, and 3.6, respectively. Post hoc analysis indicated each mean
was significantly different from each other. There was a main effect for the percentage
of math problems attempted for the low and high level of complexity distraction tasks, F
= 37.38, p < .05, with means of 44.02% and 19.25%, respectively. There was a main
effect for the percentage of correct math problems for the low and high level of
complexity distraction tasks, F = 3.81, p < .05, with means of 98% and 70.6%,
respectively. These results provide initial support for the contention that drivers mental
effort increased significantly with the introduction of the low level of complexity distracter
and significantly more with the introduction of the high level of complexity distracter and
that the difficulty of the high level of complexity math problems was significantly greater
than the low level of complexity math problems.

22
23
CHAPTER FOUR - EXPERIMENT TWO
The purpose of the second experiment was to determine if the results of Experiment
one extend to a different type of information delivery mode. If general driving behavior
is degraded when drivers are presented with a manual distraction task of various levels
of complexity it would confirm results of previous studies indicating that when drivers
perform a manual cellular telephone task or other computer based manual task various
aspects of general driving behavior can be degraded. Additionally, the purpose of the
second experiment was to determine if the emergency event responses observed in
Experiment one extend to a manual distraction task of various levels of complexity.

24
25
CHAPTER FIVE - EXPERIMENT TWO METHODOLOGY
Experiment two methodology was identical to experiment one methodology with the
exception of the following items.
Experimental Participants
Participants in this study were males (mean female age = 25.5, standard deviation =
5) and females (mean male age = 28.9, standard deviation = 13.9) between 18 and 75
years of age.
Experimental Procedures
Participants assigned to the low-complexity distraction group were presented with
simple multiple of ten math problems, one at a time, on a 24 mm by 18 mm ELO touch-
screen located in the cockpit of the vehicle just to the right of the driver. For example
the screen would indicate:
30 1 2 3 enter
+50 4 5 6
7 8 9
0
The participantís task was to press the correct answer with their finger and then
select an enter button on the touch screen. After selecting the enter button, the next
math problem was presented. If the participant did not answer after eight seconds the
next problem was presented automatically. Math problems were presented
continuously for two minutes. Participants in the high-complexity distraction group
performed identical activities except the math problems were more complex. For
example, participants would be presented with the numbers 43 and 79. All math
problems were randomly generated and were identical for all participants within a
specific group.

26
27
CHAPTER SIX - EXPERIMENT TWO RESULTS
General Driving Performance
There was a sex main effect for standard deviation of lane position, a level of
complexity main effect for standard deviation of lane position, and sex by level of
complexity interaction for standard deviation of lane position. The sex main effect for
standard deviation of lane position, F = 10.05, p < .05, with the means for females and
males being .32 and .40 meter (1.05 and 1.31 foot) standard deviations, respectively.
There was a level of complexity main effect for standard deviation of lane position, F =
31.00, p < .05. Means for the no distraction, low complexity distraction, and high
complexity distraction groups were .23, .47, and .37 meter (.75, 1.54, and 1.21 foot)
standard deviations respectively. Post hoc analysis indicated each mean was
significantly different from each other. Lastly, there was a sex by level of complexity
interaction for standard deviation of lane position, F = 8.16, p < .05. The average lane
position standard deviation for females in the no distraction, low distraction, and high
distraction groups was on average .26, .39, and .30 meters, (.85, 1.28, and .98 feet)
respectively. The average lane position standard deviation for males in the no
distraction, low distraction, and high distraction groups on average were .20, .55, and
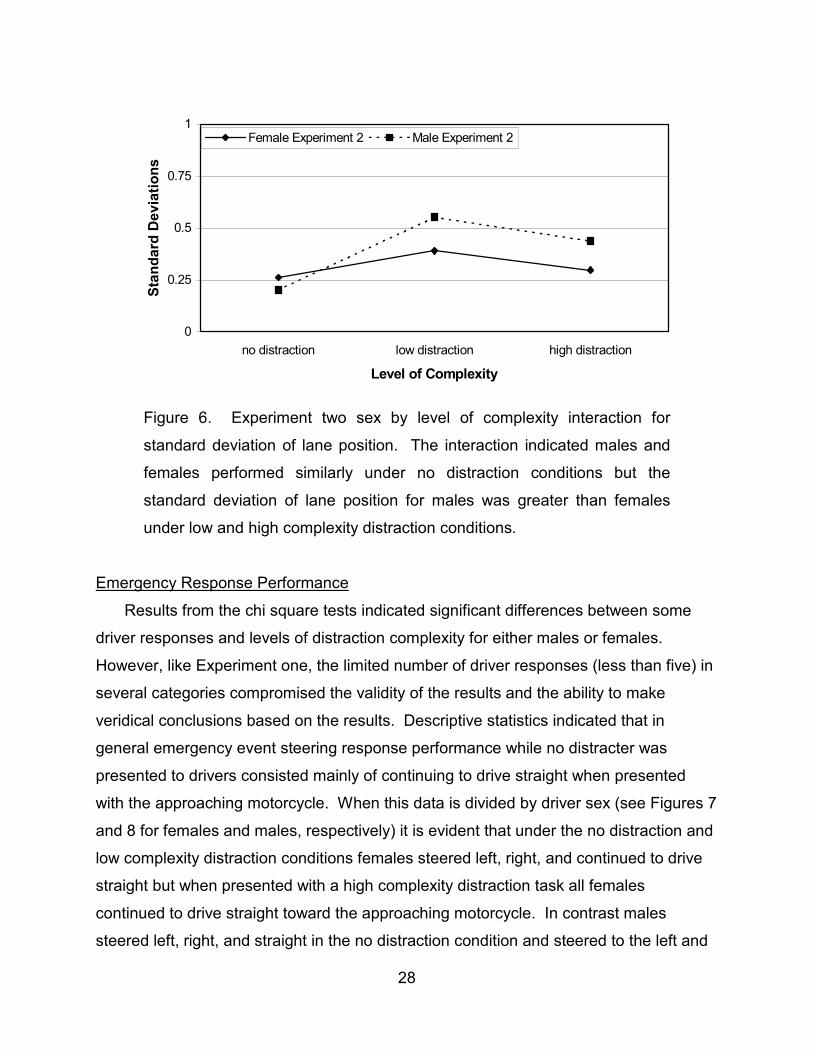
.44 meters (.66, 1.80, and 1.44 feet) respectively. Figure 6 presents the main effect for
sex, the main effect for distraction complexity, and the sex by level of complexity
interaction for standard deviation of lane position. The interaction indicates that males
and females performed similarly under no distraction conditions but that standard
deviation of lane position for males is greater than females under low and high
complexity distraction conditions. These results provide initial confirmation of previous
research indicating the introduction of a distracter can degrade general driving
performance and provide initial support for the contention that various degrees of
complexity of a single distracter presented via a single information delivery mode can
differentially impact general driving performance.
28
0
0.25
0.5
0.75
1
no distraction low distraction high distraction
Level of Complexity
Standard Deviations
Female Experiment 2 Male Experiment 2
Figure 6. Experiment two sex by level of complexity interaction for
standard deviation of lane position. The interaction indicated males and
females performed similarly under no distraction conditions but the
standard deviation of lane position for males was greater than females
under low and high complexity distraction conditions.
Emergency Response Performance
Results from the chi square tests indicated significant differences between some
driver responses and levels of distraction complexity for either males or females.
However, like Experiment one, the limited number of driver responses (less than five) in
several categories compromised the validity of the results and the ability to make
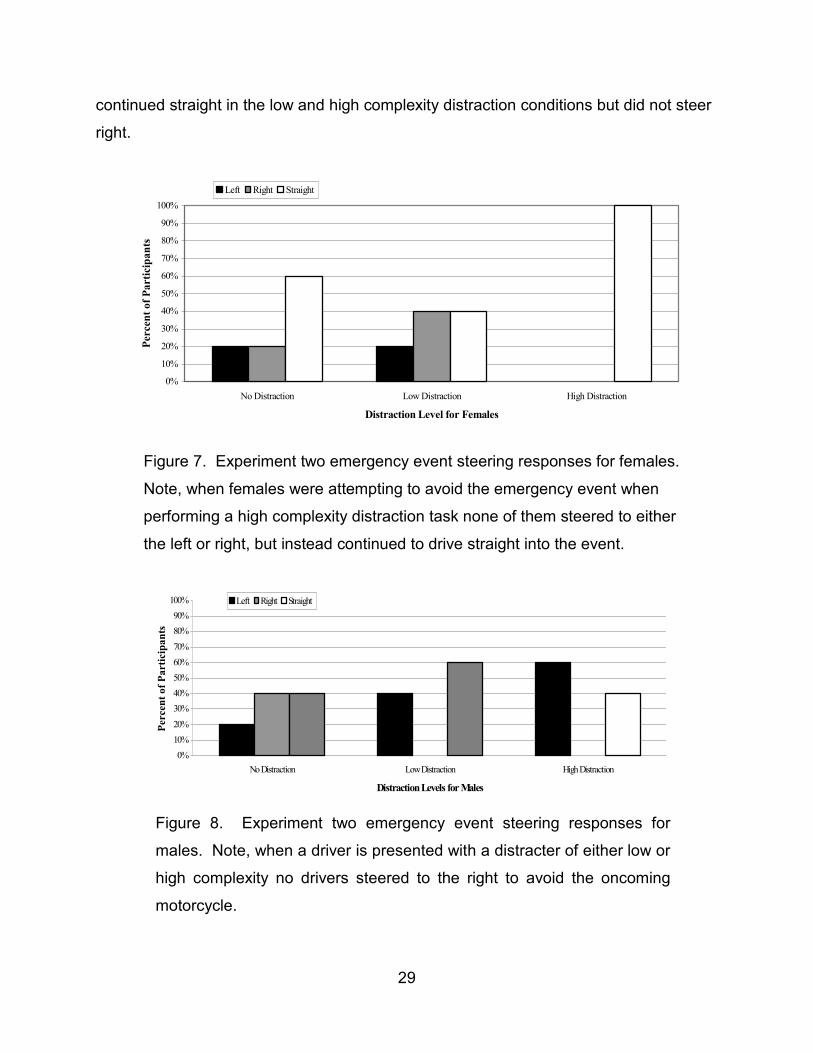
veridical conclusions based on the results. Descriptive statistics indicated that in
general emergency event steering response performance while no distracter was
presented to drivers consisted mainly of continuing to drive straight when presented
with the approaching motorcycle. When this data is divided by driver sex (see Figures 7
and 8 for females and males, respectively) it is evident that under the no distraction and
low complexity distraction conditions females steered left, right, and continued to drive
straight but when presented with a high complexity distraction task all females
continued to drive straight toward the approaching motorcycle. In contrast males
steered left, right, and straight in the no distraction condition and steered to the left and
29
continued straight in the low and high complexity distraction conditions but did not steer
right.
0%
10%
20%
30%
40%
50%
60%
70%
80%
90%
100%
No Distraction Low Distraction High Distraction
Distraction Level for Females
Percent of Participants
Left Right Straight
Figure 7. Experiment two emergency event steering responses for females.
Note, when females were attempting to avoid the emergency event when
performing a high complexity distraction task none of them steered to either
the left or right, but instead continued to drive straight into the event.
0%10%20%
30%40%50%60%70%
80%90%100%
No Distraction Low Distraction High Distraction
Distraction Levels for Males
Percent of Participants
Left Right Straight
Figure 8. Experiment two emergency event steering responses for
males. Note, when a driver is presented with a distracter of either low or
high complexity no drivers steered to the right to avoid the oncoming
motorcycle.
30
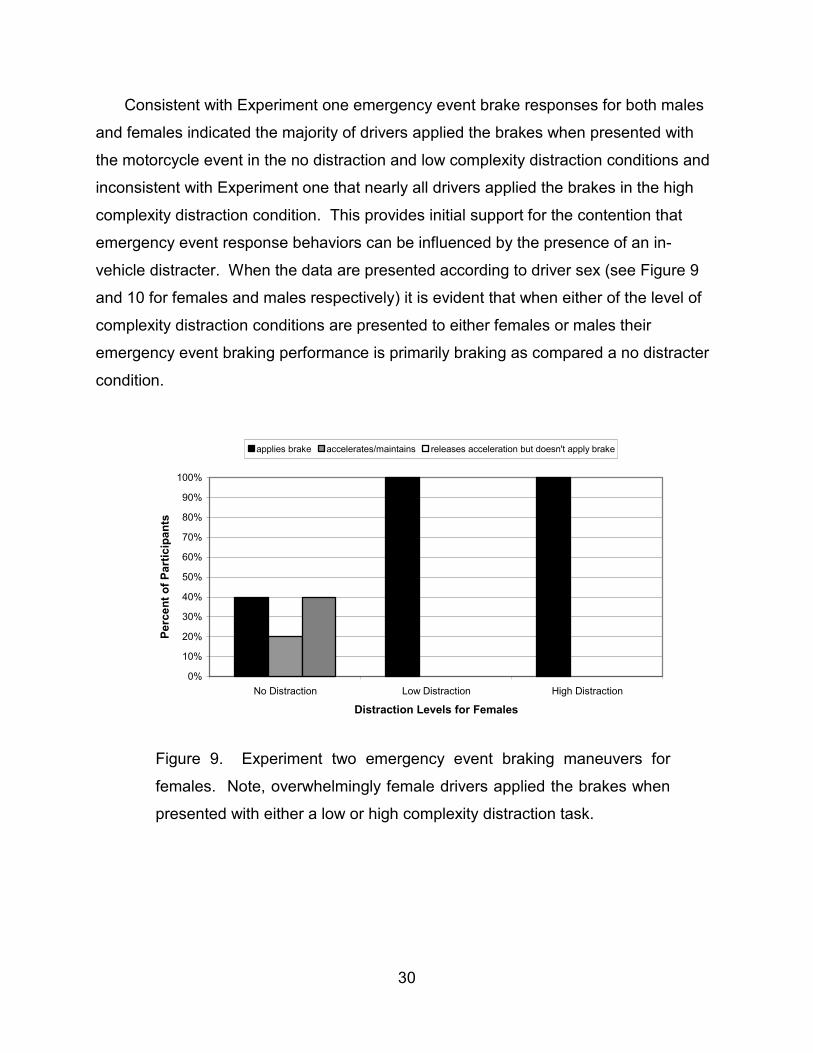
Consistent with Experiment one emergency event brake responses for both males
and females indicated the majority of drivers applied the brakes when presented with
the motorcycle event in the no distraction and low complexity distraction conditions and
inconsistent with Experiment one that nearly all drivers applied the brakes in the high
complexity distraction condition. This provides initial support for the contention that
emergency event response behaviors can be influenced by the presence of an in-
vehicle distracter. When the data are presented according to driver sex (see Figure 9
and 10 for females and males respectively) it is evident that when either of the level of
complexity distraction conditions are presented to either females or males their
emergency event braking performance is primarily braking as compared a no distracter
condition.
0%
10%
20%
30%
40%
50%
60%
70%
80%
90%
100%
No Distraction Low Distraction High Distraction
Distraction Levels for Females
Percent of Participants
applies brake accelerates/maintains releases acceleration but doesn't apply brake
Figure 9. Experiment two emergency event braking maneuvers for
females. Note, overwhelmingly female drivers applied the brakes when
presented with either a low or high complexity distraction task.
31
0%
10%
20%
30%
40%
50%
60%
70%
80%
90%
100%
No Distraction Low Distraction High Distraction
Distraction Levels for Males
Percent of Participants
applies brake accelerates/maintains releases acceleration but doesn't apply brake
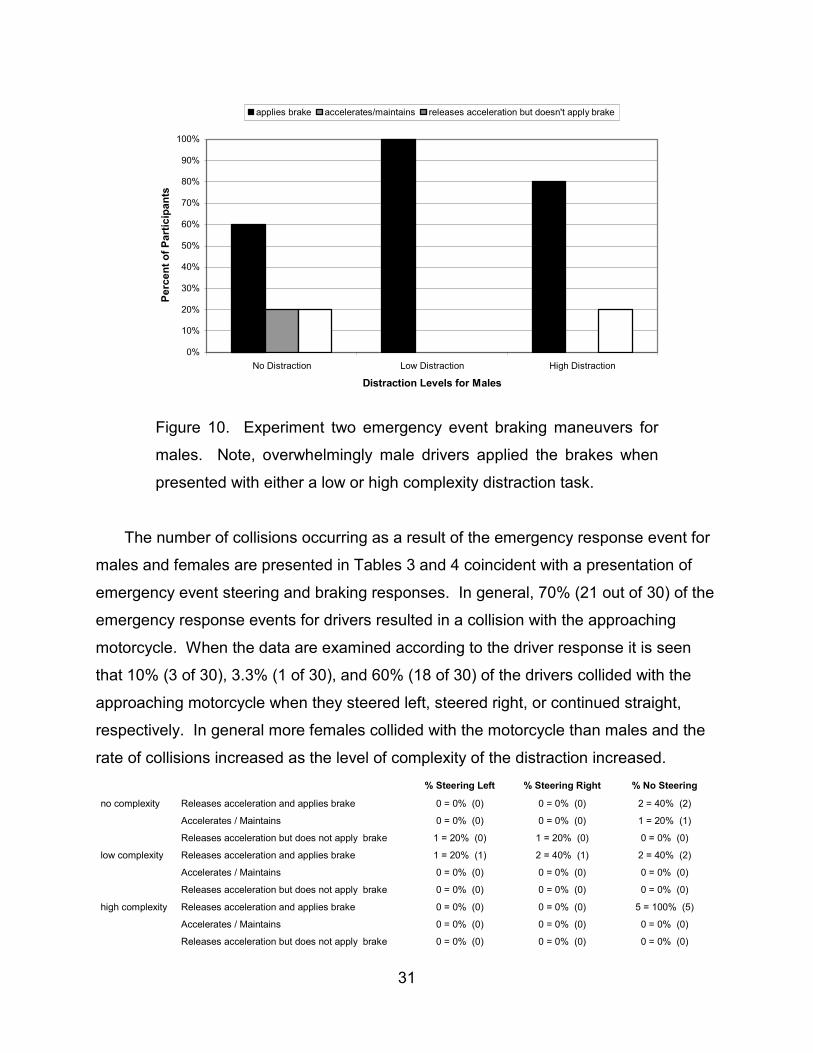
Figure 10. Experiment two emergency event braking maneuvers for
males. Note, overwhelmingly male drivers applied the brakes when
presented with either a low or high complexity distraction task.
The number of collisions occurring as a result of the emergency response event for
males and females are presented in Tables 3 and 4 coincident with a presentation of
emergency event steering and braking responses. In general, 70% (21 out of 30) of the
emergency response events for drivers resulted in a collision with the approaching
motorcycle. When the data are examined according to the driver response it is seen
that 10% (3 of 30), 3.3% (1 of 30), and 60% (18 of 30) of the drivers collided with the
approaching motorcycle when they steered left, steered right, or continued straight,
respectively. In general more females collided with the motorcycle than males and the
rate of collisions increased as the level of complexity of the distraction increased. % Steering Left % Steering Right % No Steering
no complexity Releases acceleration and applies brake 0 = 0% (0) 0 = 0% (0) 2 = 40% (2)
Accelerates / Maintains 0 = 0% (0) 0 = 0% (0) 1 = 20% (1)
Releases acceleration but does not apply brake 1 = 20% (0) 1 = 20% (0) 0 = 0% (0)
low complexity Releases acceleration and applies brake 1 = 20% (1) 2 = 40% (1) 2 = 40% (2)
Accelerates / Maintains 0 = 0% (0) 0 = 0% (0) 0 = 0% (0)
Releases acceleration but does not apply brake 0 = 0% (0) 0 = 0% (0) 0 = 0% (0)
high complexity Releases acceleration and applies brake 0 = 0% (0) 0 = 0% (0) 5 = 100% (5)
Accelerates / Maintains 0 = 0% (0) 0 = 0% (0) 0 = 0% (0)
Releases acceleration but does not apply brake 0 = 0% (0) 0 = 0% (0) 0 = 0% (0)
32
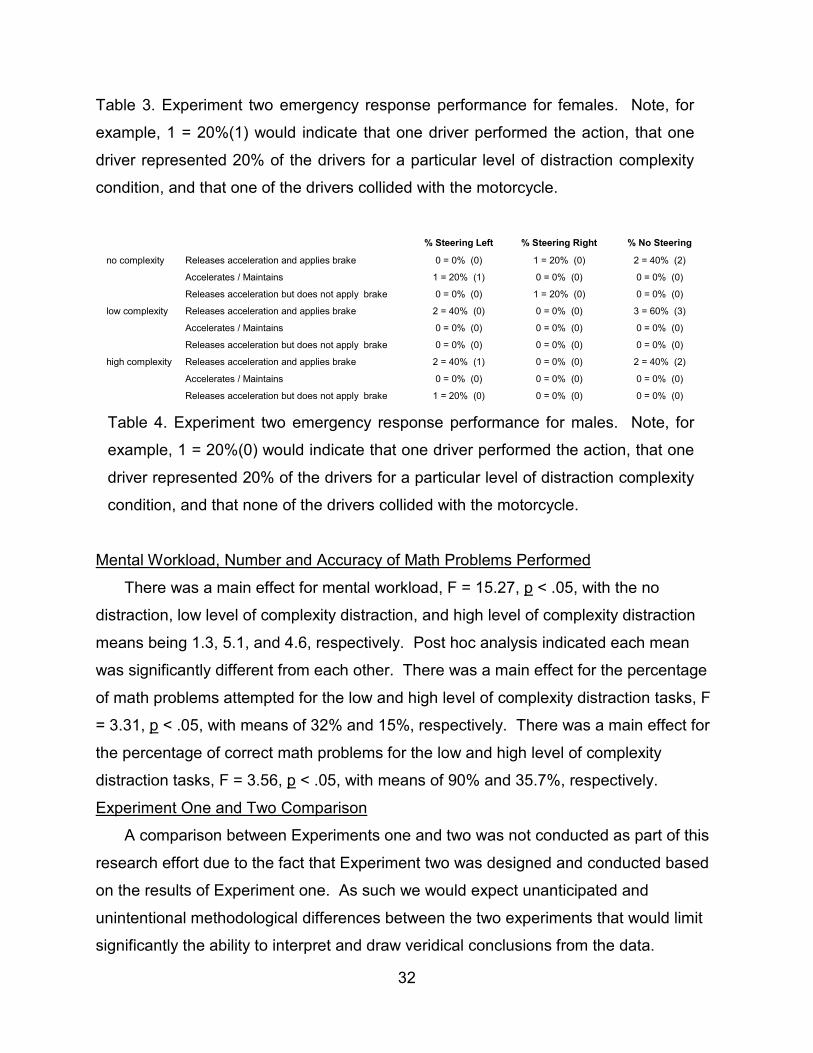
Table 3. Experiment two emergency response performance for females. Note, for
example, 1 = 20%(1) would indicate that one driver performed the action, that one
driver represented 20% of the drivers for a particular level of distraction complexity
condition, and that one of the drivers collided with the motorcycle.
% Steering Left % Steering Right % No Steering
no complexity Releases acceleration and applies brake 0 = 0% (0) 1 = 20% (0) 2 = 40% (2)
Accelerates / Maintains 1 = 20% (1) 0 = 0% (0) 0 = 0% (0)
Releases acceleration but does not apply brake 0 = 0% (0) 1 = 20% (0) 0 = 0% (0)
low complexity Releases acceleration and applies brake 2 = 40% (0) 0 = 0% (0) 3 = 60% (3)
Accelerates / Maintains 0 = 0% (0) 0 = 0% (0) 0 = 0% (0)
Releases acceleration but does not apply brake 0 = 0% (0) 0 = 0% (0) 0 = 0% (0)
high complexity Releases acceleration and applies brake 2 = 40% (1) 0 = 0% (0) 2 = 40% (2)
Accelerates / Maintains 0 = 0% (0) 0 = 0% (0) 0 = 0% (0)
Releases acceleration but does not apply brake 1 = 20% (0) 0 = 0% (0) 0 = 0% (0) Table 4. Experiment two emergency response performance for males. Note, for
example, 1 = 20%(0) would indicate that one driver performed the action, that one
driver represented 20% of the drivers for a particular level of distraction complexity
condition, and that none of the drivers collided with the motorcycle.
Mental Workload, Number and Accuracy of Math Problems Performed
There was a main effect for mental workload, F = 15.27, p < .05, with the no
distraction, low level of complexity distraction, and high level of complexity distraction
means being 1.3, 5.1, and 4.6, respectively. Post hoc analysis indicated each mean
was significantly different from each other. There was a main effect for the percentage
of math problems attempted for the low and high level of complexity distraction tasks, F
= 3.31, p < .05, with means of 32% and 15%, respectively. There was a main effect for
the percentage of correct math problems for the low and high level of complexity
distraction tasks, F = 3.56, p < .05, with means of 90% and 35.7%, respectively.
Experiment One and Two Comparison
A comparison between Experiments one and two was not conducted as part of this
research effort due to the fact that Experiment two was designed and conducted based
on the results of Experiment one. As such we would expect unanticipated and
unintentional methodological differences between the two experiments that would limit
significantly the ability to interpret and draw veridical conclusions from the data.
33
CHAPTER SEVEN - DISCUSSION
General Driving Performance
The main effect for distraction level of complexity (Experiment two) for the
performance measure of standard deviation of lane position indicated that when drivers
performed the low and high complexity distraction task their ability to maintain position
within their own lane was compromised as compared to a no distraction task. When
driver responses are expressed as the standard deviation of lane position the scores for
the no distraction, low complexity distraction, and high complexity distraction conditions
were .23, .47, and .37 meters, (.75, 1.54, and 1.21 feet) respectively, with the post hoc
analysis indicating each of the means for level of distracter complexity were significantly
different from each other. In general, these results are consistent with previous
research (Alm & Nilsson, 1994; Alm & Nilsson, 1995; Briem, & Hedman, 1995;
Brookhuis, De Vries, & De Waard, 1991; Kames, 1978; Lamble, Kauranun, Laasko, &
Summala, 1999; McKnight & McKnight, 1993; Redelmeier & Tibshirani, 1997; Reed &
Green, 1999; Serafin, Wen, Paelke, & Green, 1993; Stein, Parseghian, & Allen, 1987;
Zwahlen, 1998) and suggest driver performance is degraded with the introduction of a
distracter. These results further suggest that varying levels of complexity of a distracter
can differentially influence driver performance in that the result for Experiment two
indicated that standard deviation of lane position increased significantly with the
introduction of a low complexity distraction task but that as the level of complexity of the
distraction task continued to increase standard deviation of lane position decreased
slightly.
These significant differences exhibited in lane keeping consistency for varying
levels of complexity of a distracter are valuable for research investigation into attentional
resources. They suggest that a distracter can facilitate a shift of critical attention away
from the driving task. However, contrary to the research hypothesis and a strict
information processing capacity approach (Kahneman, 1973), results indicated lane
keeping consistency was slightly better when the level of complexity of the distracter
increased which would initially suggest that increasing the level of complexity of a
distraction would reduce the attentional demands placed on a driver, would allow more
attention to be redirected to the driving task, and would ultimately facilitate improved
34
driving performance. One of the implications of these findings is that if designers create
a device that may serve as a distracter they should design their products with high
levels of complexity in order to facilitate performance. While this approach is
counterintuitive it may be tenable. When drivers are not presented with a distracter they
are free to continually focus the majority or all attentional resources to the task of driving
which results in consistent driving performance. The introduction of a low complexity
distracter forces a division and continuing redirection of attentional resources between
the task of driving and the distracter in a back and forth fashion ultimately resulting in a
degradation of driving performance because driver is implementing new behaviors to
navigate the vehicle each time their attention is redirected to the task of driving.
However, when a distraction is highly complex it may redirect substantial amounts of
attentional resources to the distracter and serve to attenuate the amount of new
behaviors used to navigate the vehicle. At present, continuing research efforts are
attempting to either confirm or refute this proposition. However, other researchers are
strongly encouraged to examine the influence of varying levels of complexity of a
distracter, their impact on driving performance, and the underlying reasons for their
influence so that distracters can be more effectively designed to reduce any negative
influences on driving performance.
Emergency Response Performance
Previous work has indicated that driversí typical emergency response performance
consists of applying the brakes of their vehicle (Hatterick & Bathurst, 1976; Kloeppel,
Peters, James, Fox, & Alicandri, 1995; Lechner & Malaterre, 1991; Malaterre,
Ferrandez, Fleury, & Lechner, 1988; Rice & DellíAmico, 1974). Findings from the
present investigations also indicated that driversí emergency event responses typically
consisted of braking and that these responses are influenced by the addition of and
complexity of a distracter and by the sex of the driver. In Experiment one under the no
distraction and low complexity distraction conditions femalesí emergency event braking
performance consisted primarily of braking and that in the high complexity distraction
condition braking and acceleration are the primary responses. In contrast, males do not
have a primary braking behavior under any of the distraction complexity conditions. In
Experiment two regardless of the level of complexity of distraction for either females or
35
males emergency event braking performance is primarily braking as compared a no
distracter condition. Similarly dramatic steering behaviors existed. In Experiment one,
females steered only to the left or right when no distracter was present but when
presented with either a low or high complexity distracter females steered either right or
continued to drive straight toward the motorcycle. In contrast as level of complexity of
the distracter increased males tended to steered to the left less often and continued to
drive straight more often. In Experiment two under the no distraction and low
complexity distraction conditions females steered left, right, and continued to drive
straight. However, when performing the high complexity distraction task all females
continued to drive straight toward the approaching motorcycle. In contrast males
steered left, right, and straight in the no distraction condition and steered to the left and
continued straight in the low and high complexity distraction conditions.
Results also indicate a significant percentage of drivers would have collided with the
approaching motorcycle given their emergency event responses and that level of
complexity of distraction can influence this percentage. In Experiments one and two
56.7% and 70% of the drivers collided with the oncoming motorcycle. Relative to level
of complexity of distracter, in general a lower percentage of drivers collided with the
oncoming motorcycle when no distraction was present (10% for both Experiments one
and two) as compared to the low and high levels of complexity distracters (23.4% and
23.4% for Experiment one respectively and 3.3% and 60% for Experiment two).
These results provide initial support for the contention that the addition of a
distraction or the increase in a distracterís level of complexity in the driving environment
can negatively impact the ability of a driver to successfully avoid a collision in an
emergency event. While it is surmised, the reason for the negative impact is related to
the introduction of the distracter and the reallocation of attentional resources no theories
detailing the relationship have been introduced in the literature. These performance
trends are disturbing in light of the fact that simply applying brakes in an emergency
event or continuing to drive straight will do little to facilitate avoidance of a collision. In
addition, steering to the left potentially puts drivers in the path of an additional oncoming
vehicle. In both experiments anecdotal evidence presented by females indicated they
thought the oncoming vehicle would steer away from them in order avoid the collision.
36
However, they did not indicate why they did not steer to the right. These findings have
a direct impact on driver distraction/driver performance research in that there appear to
be additional measures of driver performance beyond that of lane position, steering
wheel reversals, speed, and others traditional measures that are markedly influenced by
the presence of in-vehicle distracters, the presence of an in-vehicle distracter can
markedly influence driver behavior in emergency response situations by presumably
redirecting or reallocating attentional resources, and that driver training protocols
intended to teach drivers what actions to perform in emergency event situations may
need to be revisited as it is evident drivers cannot practice what is preached.
Sex Differences
Previous work investigating the influence of cellular telephone use on general
driving performance has indicated differences between males and females for with
males driving closer to the centerline and males exhibiting greater mean steering input,
mean accelerator input, and mean speed (Crawford, Manser, Jenkins, Court, &
Sepulveda, 2001). The results of Experiment one indicated that males exhibited greater
standard deviation of velocity than their female counterparts. While the variables that
proved to be significant between the two studies were not identical they lend tentative
support the contention that males and females general driving performance differ
significantly. However, the results of Experiment two indicated females exhibited
greater standard deviation of lane position than their male counterparts. Results further
indicated that males and females performed similarly when no distraction was present
but that standard deviation of lane position for males was greater than females under
the low and high level of complexity distraction condition. One potential reason for the
inconsistent findings may be the mode of information delivery employed. For example,
in Crawford, Manser, Jenkins, Court, and Sepulveda (2001) and in Experiment one of
the current work the distraction task was delivered via an auditory information delivery
mode to males and females while in Experiment two a visual mode of information
delivery was used.
Results of previous research examining emergency response performance of male
and female drivers while being presented with distracter indicated that response time to
the sudden appearance of a van for females were faster than males. While it was not
37
possible to examine response times in the current experiments, the results do provide
continuing support for the contention that males and females exhibit dramatically
different emergency event response performances. For example, in Experiment one
when a distracter was being presented via a visual information delivery mode when the
approaching motorcycle appeared in the driversí lane females not presented with a
distracter steered only to the left or right and when presented with low and high level of
complexity distracters they steered only to the right or continued to drive straight. In
comparison, males employed all three steering variations but tended to steer left less
often and drive straight more often and the level of complexity of distraction increased.
The differences were even more dramatic when the distracter was presented via a
visual information delivery mode. For example, females exhibited all three steering
behaviors when performing the no distraction and low level of complexity distraction
tasks. However, all females continued to drive straight when performing the high level
of complexity distraction task. In contrast males exhibited all three steering behaviors
when performing the no distraction task and steered only to the left and straight when
performing the low and high level of complexity distraction tasks. Currently, there is
little literature which that indicate the reasons for the differences between females and
males emergency event response performances.

38
39
REFERENCES
Adams, L.D., Flannagan, M.J., & Sivak, M. (1995). Obstacle avoidance maneuvers in
an automobile simulator. (Technical Report UMTRI-95-3). Ann Arbor: University of
Michigan Transportation Research Institute.
Alm, H., and Nilsson, L. (1994). Changes in Behaviour as a Function of Hands-free
Mobile Phones ñ A Simulator Study. Accident Analysis & Prevention, 26: 441-451.
Alm, H., & Nilsson, L. (1995). The Effects of a Mobile Telephone Task On Driver
Behaviour in a Car Following Situation. Accident Analysis & Prevention, 27, 707-715.
Barrett, G., Kobayashi, M., & Fox, B. (1966). Feasibility of studying driver reaction to
sudden pedestrian emergencies in an automobile simulator. Presented at the 10th
Annual Human Factors Meeting, Anaheim, CA.
Briem, V., & Hedman, L. R. (1995). Behavioural Effects of Mobile Telephone Use
During Simulated Driving. Ergonomics, 38, 2536-2562.
Brookhuis, K. A., De Vries, G., & De Waard, D. (1991). The Effects of Mobile
Telephoning on Driving Performance. Accident Analysis and Prevention, 23, 309-316.
Brown, I. D., & Poulton, E. C. (1961). Measuring the Spare ëMental Capacityí of Car
Drivers by a Subsidiary Task. Ergonomics, 4, 35-40.
Cox, R.H. (1990). Sport psychology: concepts and applications. Dubuque, IA: William
C. Brown Publishers.
40
Crawford, J., Manser, M., Jenkins, J., Court, C., & Sepulveda, E. (2001). Extent and
effects of handheld cellular telephone use while driving. Southwest Region University
Transportation Center, Report No. 167706-1, College Station, TX.
Ferrandez, F., Fleury, D., & Lepesant, C. (1984). Analyse typologique des manoeuvres
díurgence. Rapport ONSER. France.
Fleury, D., Ferrandez, F., Lepesant, C., & Lechner, D. (1988). Analyse typologique des
manoeuvres díurgence en intersection. Rapport INRETS, No 62. France.
Gibson, J., & Crooks, L. (1938). A theoretical field-analysis of automobile driving.
American Journal of Psychology, 51, 453 - 473.
Hancock, P.A., & Manser, M.P. (1997). Time-to-contact: More than tau alone.
Ecological Psychology, 9(4), 265-297.
Hatterick, G.R., & Bathurst, J. (1976). Accident avoidance skill training and performance
testing (Final Report No. DOT/HS 801852). Falls Church, VA: URS/Matrix Company
Kames, A. J. A Study of the Effects of Mobile Telephone Use and Control Unit Design
on Driving Performance. (1978). IEEE Transactions on Vehicular Technology, VT-27
(4): 282-287.
Kahneman, D. (1973). Attention and effort. Englewood Cliffs, NJ: Prentice-Hall.
Keele, S.W. (1973). Attention and human performance. Pacific Palisades, CA;
Goodyear Publishing Company.
Kloeppel, E., Peters, R.D., James, C., Fox, J.E., & Alicandri, E. (1995). Comparison of
older and younger driver responses to emergency driving events. (Technical Report
FHWA-RD-95-056). Springfield, Virginia: National Technical Information Service.
41
Lamble, D., Kauranun, T., Laasko, M., & Summala, H. (1999). Cognitive Load and
Detection Thresholds in Car Following Situations: Safety Implications for Using Mobile
(Cellular) Telephones While Driving. Accident Analysis & Prevention, 31, (6) 617-623.
Lechner, D., & Malaterre, G. (1991). Emergency maneuver experimentation using a
driving simulator. Presented at Autotechnologies 5th Conference and Exposition, Monte
Carlo, Monaco. Report No. SAE 910016.
Limpert, R., & Gamero, R. (1974). The accident avoidance potential of the motor
vehicle: Accident data, vehicle handling, and safety standards. In Proceedings of the
Third International Congress on Automotive Safety, Volume II. Washington, D.C., GPO,
61 p.
Malaterre, B., Ferrandez, F., Fleury, D., & Lechner, D. (1988). Decision making in
emergency situations. Ergonomics, 31(4), 643-655.
Malaterre, B., Peytavin, J.F., Jaumier, F., & Kleinmann, A. (1987). Líestimation des
manoeuvres realisables en situation díurgence au Volant díune automobile. Rapport
INRETS, No 46. France.
Manser, M.P., & Hancock, P.A. (1996). The influence of approach angle on estimates
of time-to-contact. Ecological Psychology, 8, 71-99.
McKnight, J.A., & McKnight, A. S. (1993). The Effect of Cellular Phone Use Upon
Driver Attention. Accident Analysis & Prevention, 25, 259-265.
Redelmeier, D.A., & Tibshirani, R.J. (1997). Association Between Cellular Telephone
Calls and Motor Vehicle Collisions. The New England Journal of Medicine, 336, (7):
453-458.
42
Reed, M. P., & Green, P. A. (1999). Comparison of Driving Performance On-Road and
In a Low-Cost Simulator Using a Concurrent Telephone Dialing Task. Ergonomics, 42,
(8), 1015-1037.
Rundkvist, S. (1973). Field-testing statistical tests (Report No. 4-01). Sweden: Swedish
Experimental Safety Vehicle Program.
Serafin, C., Wen, C., Paelke, G., & Green, P. (1993). Development and Human Factors
Tests of Car Phones. (Technical Report UMTRI-93-17). Ann Arbor: University of
Michigan Transportation Research Institute.
Stein, A. C., Parseghian, Z., and Allen, R. W. (1987). A Simulator Study of the Safety
Implications of Cellular Mobile Phone Use. Proceedings of the 31st Annual Conference,
New Orleans, 181-200.
Zwahlen, H. T., Adams, C. C., Jr., and Schwartz, P. J. (1998). Safety Aspects of
Cellular Telephones in Automobiles. Presented at the 18th International Symposium on
Automotive Technology and Automation, Vol. 1, Paper No 88058B: 17P.
43
APPENDIX A
Experiment One and Experiment Two Human Subjects Consent Form
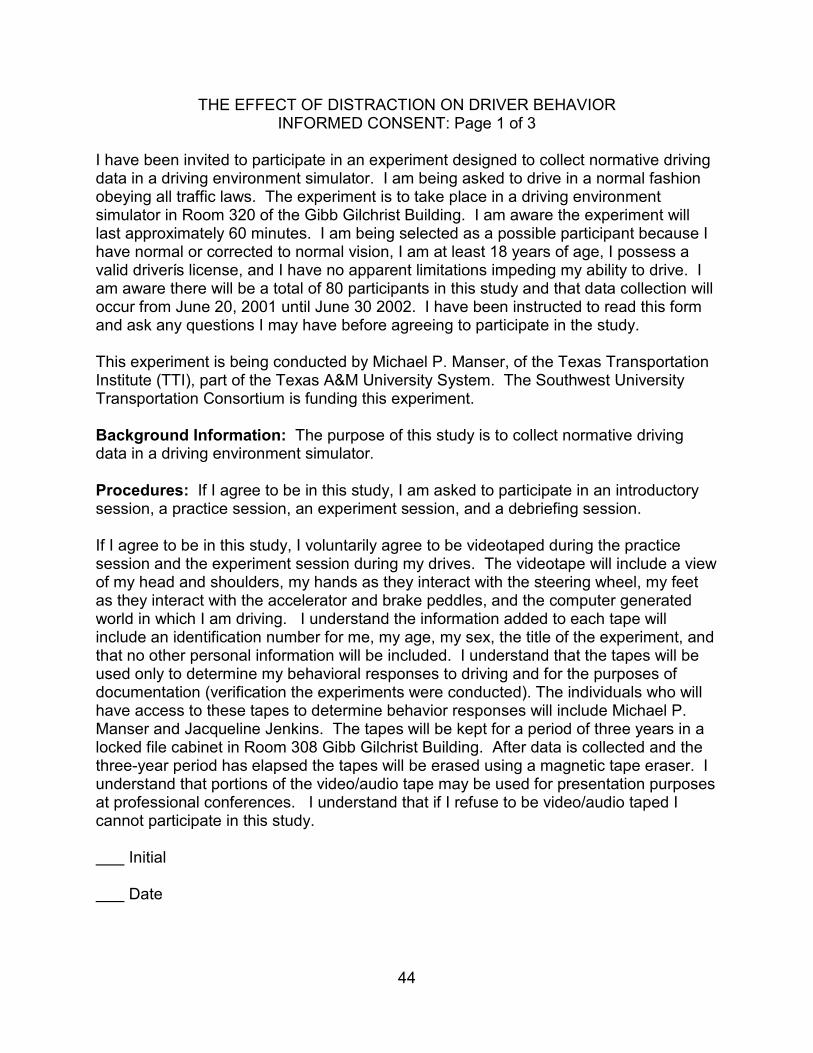
44
THE EFFECT OF DISTRACTION ON DRIVER BEHAVIOR INFORMED CONSENT: Page 1 of 3
I have been invited to participate in an experiment designed to collect normative driving data in a driving environment simulator. I am being asked to drive in a normal fashion obeying all traffic laws. The experiment is to take place in a driving environment simulator in Room 320 of the Gibb Gilchrist Building. I am aware the experiment will last approximately 60 minutes. I am being selected as a possible participant because I have normal or corrected to normal vision, I am at least 18 years of age, I possess a valid driverís license, and I have no apparent limitations impeding my ability to drive. I am aware there will be a total of 80 participants in this study and that data collection will occur from June 20, 2001 until June 30 2002. I have been instructed to read this form and ask any questions I may have before agreeing to participate in the study. This experiment is being conducted by Michael P. Manser, of the Texas Transportation Institute (TTI), part of the Texas A&M University System. The Southwest University Transportation Consortium is funding this experiment. Background Information: The purpose of this study is to collect normative driving data in a driving environment simulator. Procedures: If I agree to be in this study, I am asked to participate in an introductory session, a practice session, an experiment session, and a debriefing session. If I agree to be in this study, I voluntarily agree to be videotaped during the practice session and the experiment session during my drives. The videotape will include a view of my head and shoulders, my hands as they interact with the steering wheel, my feet as they interact with the accelerator and brake peddles, and the computer generated world in which I am driving. I understand the information added to each tape will include an identification number for me, my age, my sex, the title of the experiment, and that no other personal information will be included. I understand that the tapes will be used only to determine my behavioral responses to driving and for the purposes of documentation (verification the experiments were conducted). The individuals who will have access to these tapes to determine behavior responses will include Michael P. Manser and Jacqueline Jenkins. The tapes will be kept for a period of three years in a locked file cabinet in Room 308 Gibb Gilchrist Building. After data is collected and the three-year period has elapsed the tapes will be erased using a magnetic tape eraser. I understand that portions of the video/audio tape may be used for presentation purposes at professional conferences. I understand that if I refuse to be video/audio taped I cannot participate in this study. Initial Date
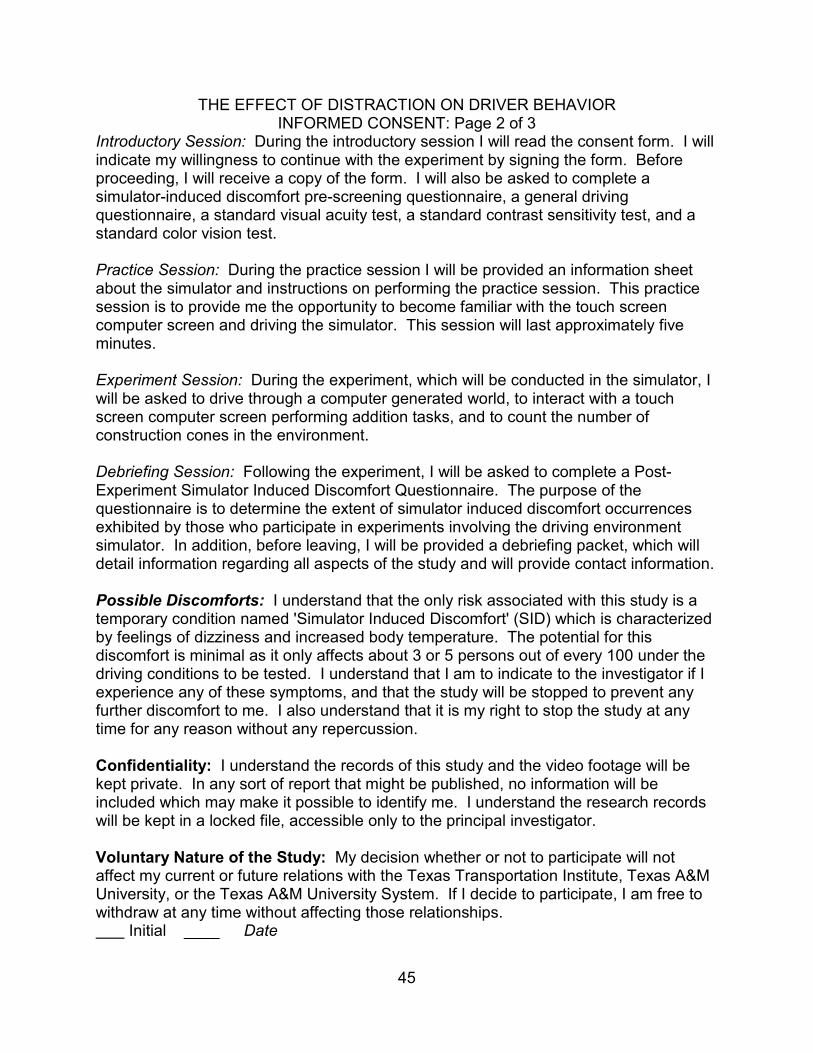
45
THE EFFECT OF DISTRACTION ON DRIVER BEHAVIOR INFORMED CONSENT: Page 2 of 3
Introductory Session: During the introductory session I will read the consent form. I will indicate my willingness to continue with the experiment by signing the form. Before proceeding, I will receive a copy of the form. I will also be asked to complete a simulator-induced discomfort pre-screening questionnaire, a general driving questionnaire, a standard visual acuity test, a standard contrast sensitivity test, and a standard color vision test. Practice Session: During the practice session I will be provided an information sheet about the simulator and instructions on performing the practice session. This practice session is to provide me the opportunity to become familiar with the touch screen computer screen and driving the simulator. This session will last approximately five minutes. Experiment Session: During the experiment, which will be conducted in the simulator, I will be asked to drive through a computer generated world, to interact with a touch screen computer screen performing addition tasks, and to count the number of construction cones in the environment. Debriefing Session: Following the experiment, I will be asked to complete a Post-Experiment Simulator Induced Discomfort Questionnaire. The purpose of the questionnaire is to determine the extent of simulator induced discomfort occurrences exhibited by those who participate in experiments involving the driving environment simulator. In addition, before leaving, I will be provided a debriefing packet, which will detail information regarding all aspects of the study and will provide contact information. Possible Discomforts: I understand that the only risk associated with this study is a temporary condition named 'Simulator Induced Discomfort' (SID) which is characterized by feelings of dizziness and increased body temperature. The potential for this discomfort is minimal as it only affects about 3 or 5 persons out of every 100 under the driving conditions to be tested. I understand that I am to indicate to the investigator if I experience any of these symptoms, and that the study will be stopped to prevent any further discomfort to me. I also understand that it is my right to stop the study at any time for any reason without any repercussion. Confidentiality: I understand the records of this study and the video footage will be kept private. In any sort of report that might be published, no information will be included which may make it possible to identify me. I understand the research records will be kept in a locked file, accessible only to the principal investigator. Voluntary Nature of the Study: My decision whether or not to participate will not affect my current or future relations with the Texas Transportation Institute, Texas A&M University, or the Texas A&M University System. If I decide to participate, I am free to withdraw at any time without affecting those relationships. Initial ____ Date
46
THE EFFECT OF DISTRACTION ON DRIVER BEHAVIOR INFORMED CONSENT: Page 3 of 3
Payment: I understand that if I accept payment for participating in this study, the fact that I participated in this study may be obtained under the Texas Open Records Act, even though any information that I gave to the investigator is confidential. As a non-Texas Transportation Institute employee, I understand that upon the completion of the introductory session, the practice session, the experiment session, and the debriefing session, I will receive payment of $10 for participation. However, if after reading the Simulator Induced Discomfort Pre-Screening Questionnaire, I wish not to participate in the experiment I will still receive $10. If the any of the three vision tests precludes my participation, I will still receive payment of $10. If I experience Simulator Induced Discomfort during the practice session or any portion of the experiment session, the experiment will be stopped and I will receive $10. If I decide not to complete all portions of the experiment for other reasons, compensation will not be awarded. If I choose to refuse to be video/audio taped the experiment will be stopped and I will not receive compensation. I understand that payment will be included with the debriefing packet, which I will receive prior to leaving the test location. I will acknowledge receipt of payment by signing a receipt form. As an employee of the Texas Transportation Institute I understand that I will not receive any compensation, credit, compensation time, or any other rewards for participating in this study. Contacts and Questions: The researcher conducting this study is Michael P. Manser. If I have questions now or later, I may contact Michael P. Manser at the Texas Transportation Institute, Texas A&M University, College Station, TX 77843-3135, (979) 862-3311. I will be given a copy of this form for my records. A copy of this form will be given to me prior to my proceeding with the experiment. I understand this research study has been reviewed and approved by the Institutional Review Board - Human Subjects in Research, Texas A&M University. For research-related problems or questions regarding subjects' rights, the Institutional Review Board may be contacted through Dr. Michael W. Buckley, Director of Support Services, Office of the Vice President for Research at (979) 458-4067. Statement of Consent: I have read and understand the explanation provided me. I have had all my questions answered to my satisfaction, and I voluntarily agree to participate in this study. I have been given a copy of this consent form.

47
______________________________ ___________ Signature of Research Participant Date ______________________________ ___________ Signature of Principal Investigator Date

48
49
APPENDIX B
Practice Session Instructions for Experiment One No Math group

50
THE EFFECT OF DISTRACTION ON DRIVER BEHAVIOR PRACTICE SESSION
Currently, you are seated in the driving environment simulator (DESi). It is an interactive simulator, which means the driving scenes you experience react to your steering and pedal inputs to provide a realistic driving experience. During your drive in the simulator, please drive in a normal fashion and obey all traffic laws. For the practice session your task is to get comfortable with driving in a simulated driving environment. The driving scene that will be presented to you begins with the simulator vehicle stopped at the side of a road. You are to start the vehicle, put it into ëdriveí, and proceed through the driving environment by following the car traveling in front of you. Please continue to follow the lead car at a comfortable distance. After a couple minute the lead car will pull off the road. Your task is to continue driving down the road. After a couple more minutes the screens will turn black. At that time please turn your attention to the experimenter. The practice session will take approximately five minutes. For the second part of the practice session it is also your task to become familiar with the touch screen and the mental workload questions. Please look at the touch screen and read through the questions. If you have any questions regarding the practice session please consult the experimenter. Otherwise, acknowledge that you are ready by telling the experimenter to begin the driving scene.
51
APPENDIX C
Practice Session Instructions for Experiment One Simple Math group and Complex Math group
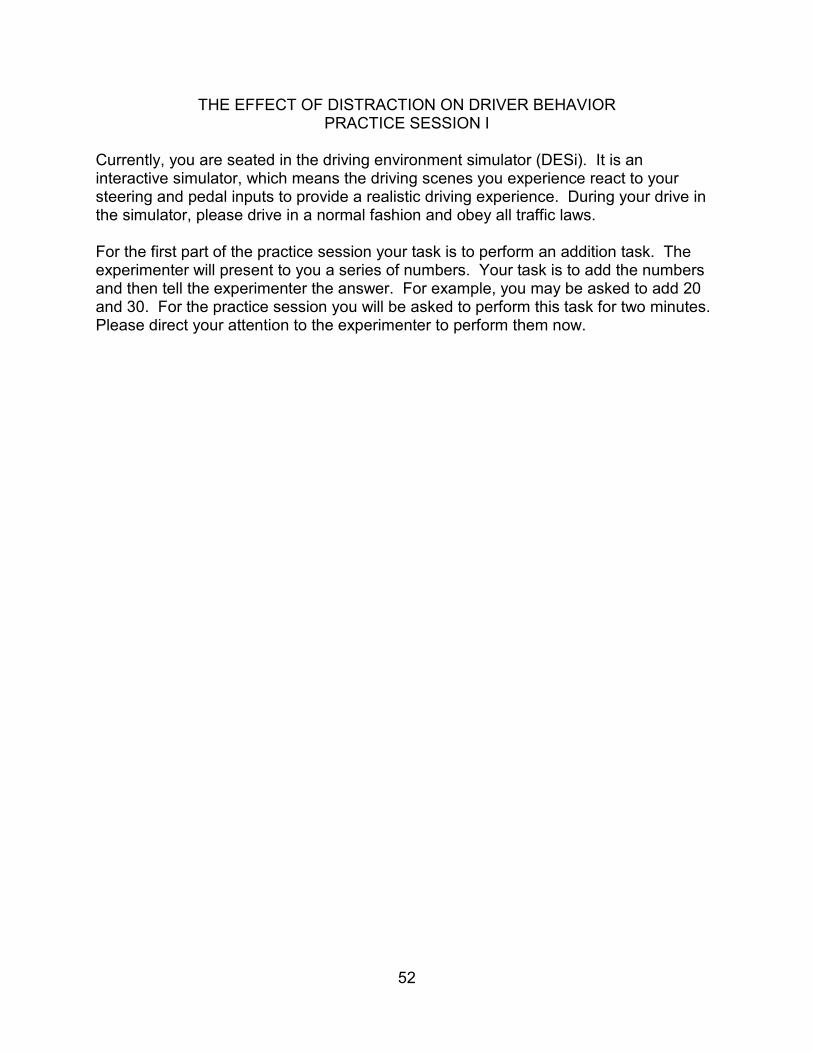
52
THE EFFECT OF DISTRACTION ON DRIVER BEHAVIOR PRACTICE SESSION I
Currently, you are seated in the driving environment simulator (DESi). It is an interactive simulator, which means the driving scenes you experience react to your steering and pedal inputs to provide a realistic driving experience. During your drive in the simulator, please drive in a normal fashion and obey all traffic laws. For the first part of the practice session your task is to perform an addition task. The experimenter will present to you a series of numbers. Your task is to add the numbers and then tell the experimenter the answer. For example, you may be asked to add 20 and 30. For the practice session you will be asked to perform this task for two minutes. Please direct your attention to the experimenter to perform them now.
53
THE EFFECT OF DISTRACTION ON DRIVER BEHAVIOR PRACTICE SESSION II
For the second part of the practice experiment your task is to get comfortable with driving in a simulated driving environment. The driving scene that will be presented to you begins with the simulator vehicle stopped at the side of a road. You are to start the vehicle, put it into ëdriveí, and proceed through the driving environment by following the car traveling in front of you. Please continue to follow the lead car at a comfortable distance. After a couple minute the lead car will pull off the road. Your task is to continue driving down the road. After a couple more minutes the screens will turn black. At that time please turn your attention to the experimenter. The practice session will take approximately five minutes. For the second part of the practice session it is also your task to become familiar with the touch screen and the mental workload questions. Please look at the touch screen and read through the questions. If you have any questions regarding the practice session please consult the experimenter. Otherwise, acknowledge that you are ready by telling the experimenter to begin the driving scene.

54

55
APPENDIX D
Experiment One Experiment Session Instructions for the No Math group
56
THE EFFECT OF DISTRACTION ON DRIVER BEHAVIOR
EXPERIMENT INSTRUCTIONS You are now asked to complete an experimental driving scene. Your task is to drive through the scene as you normally would drive in the real world at 40 mph. As before, drive through the scenes in a normal fashion obeying all traffic signs and laws. Please do not deviate from the directed course. If you reach an intersection please obey all traffic signs and proceed straight through the intersection as you would under normal driving circumstances. Task One Your task is to drive through the scene, obeying all traffic signs, traffic laws, and directional signs. Please try to complete the scenarios as you would normally in the real world. Do not drive with undue aggression or undue conservatism. When the driving scene begins, the simulator vehicle will be stopped on the side of the roadway. Place the vehicle in ëdriveí, drive onto the roadway, and proceed through the driving environment at 40 mph. Task Two At two different times during the experiment you will be asked questions regarding your mental workload. This will be presented on the touch screen to your side. Please select the most applicable answer and please answer these questions honestly. At the end of the experimental driving scene, there will be two vehicles positioned across the roadway. When you reach these vehicles, please bring the vehicle to a complete stop, place it in ëparkí, and direct your attention to the investigator. This experiment session will take approximately 20 - 25 minutes. If you have any questions regarding your task in the experiment consult the experimenter. Otherwise, acknowledge that you are ready by telling the experimenter to begin the driving scene.
57
APPENDIX E
Experiment One Session Instructions for the Simple Math and Complex Math groups
58
THE EFFECT OF DISTRACTION ON DRIVER BEHAVIOR EXPERIMENT INSTRUCTIONS
You are now asked to complete an experimental driving scene. Your task is to drive through the scene as you normally would drive in the real world at 40 mph. As before, drive through the scenes in a normal fashion obeying all traffic signs and laws. Please do not deviate from the directed course. If you reach an intersection please obey all traffic signs and proceed straight through the intersection as you would under normal driving circumstances. Task One Your task is to drive through the scene, obeying all traffic signs, traffic laws, and directional signs. Please try to complete the scenarios as you would normally in the real world. Do not drive with undue aggression or undue conservatism. When the driving scene begins, the simulator vehicle will be stopped on the side of the roadway. Place the vehicle in ëdriveí, drive onto the roadway, and proceed through the driving environment at 40 mph. Task Two You are asked to perform an addition task using two numbers as presented by the experimenter and then tell the experimenter the correct answer within 8 seconds. For example, you may be asked to add 20 and 30. This task will be presented twice and each time the task will last approximately two minutes. Task Three At two different times during the experiment you will be asked questions regarding your mental workload. This will be presented on the touch screen to your side. Please select the most applicable answer and please answer these questions honestly. At the end of the experimental driving scene, there will be two vehicles positioned across the roadway. When you reach these vehicles, please bring the vehicle to a complete stop, place it in ëparkí, and direct your attention to the investigator. This experiment session will take approximately 20 - 25 minutes. If you have any questions regarding your task in the experiment consult the experimenter. Otherwise, acknowledge that you are ready by telling the experimenter to begin the driving scene.
59
APPENDIX F
Experiment One Driving Data for the No Math, Simple Math, and Complex Math groups
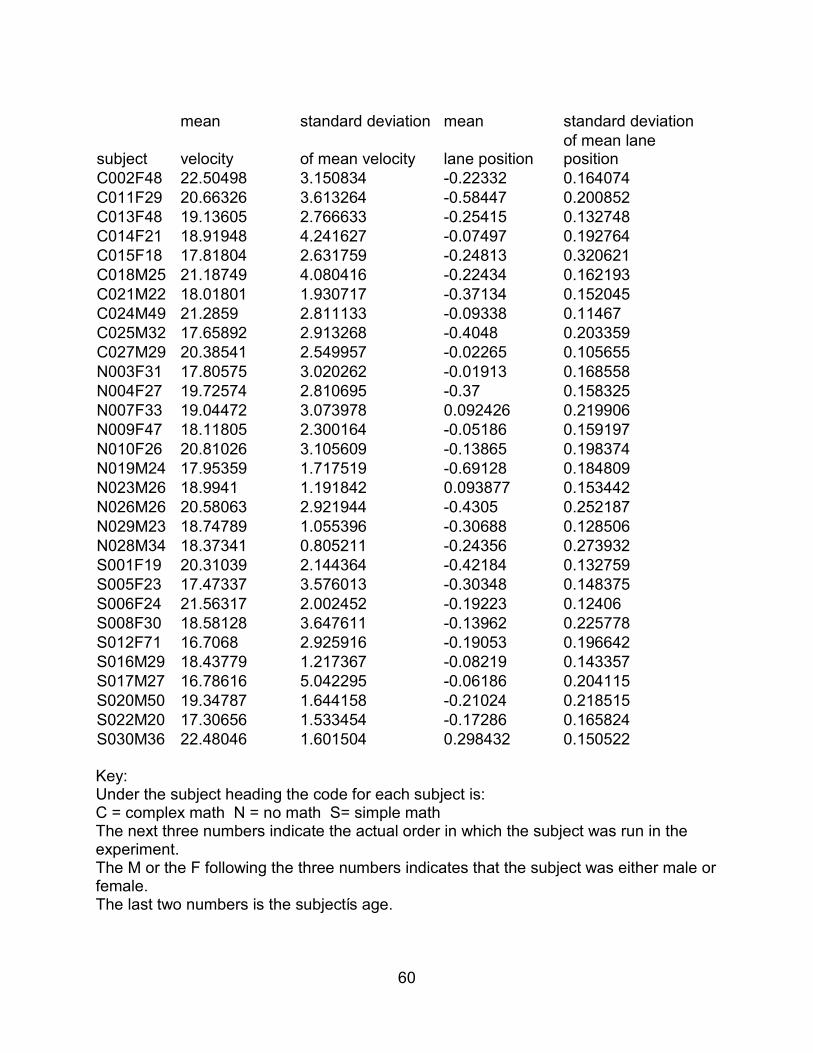
60
mean standard deviation mean standard deviation
subject velocity of mean velocity lane position of mean lane position
C002F48 22.50498 3.150834 -0.22332 0.164074 C011F29 20.66326 3.613264 -0.58447 0.200852 C013F48 19.13605 2.766633 -0.25415 0.132748 C014F21 18.91948 4.241627 -0.07497 0.192764 C015F18 17.81804 2.631759 -0.24813 0.320621 C018M25 21.18749 4.080416 -0.22434 0.162193 C021M22 18.01801 1.930717 -0.37134 0.152045 C024M49 21.2859 2.811133 -0.09338 0.11467 C025M32 17.65892 2.913268 -0.4048 0.203359 C027M29 20.38541 2.549957 -0.02265 0.105655 N003F31 17.80575 3.020262 -0.01913 0.168558 N004F27 19.72574 2.810695 -0.37 0.158325 N007F33 19.04472 3.073978 0.092426 0.219906 N009F47 18.11805 2.300164 -0.05186 0.159197 N010F26 20.81026 3.105609 -0.13865 0.198374 N019M24 17.95359 1.717519 -0.69128 0.184809 N023M26 18.9941 1.191842 0.093877 0.153442 N026M26 20.58063 2.921944 -0.4305 0.252187 N029M23 18.74789 1.055396 -0.30688 0.128506 N028M34 18.37341 0.805211 -0.24356 0.273932 S001F19 20.31039 2.144364 -0.42184 0.132759 S005F23 17.47337 3.576013 -0.30348 0.148375 S006F24 21.56317 2.002452 -0.19223 0.12406 S008F30 18.58128 3.647611 -0.13962 0.225778 S012F71 16.7068 2.925916 -0.19053 0.196642 S016M29 18.43779 1.217367 -0.08219 0.143357 S017M27 16.78616 5.042295 -0.06186 0.204115 S020M50 19.34787 1.644158 -0.21024 0.218515 S022M20 17.30656 1.533454 -0.17286 0.165824 S030M36 22.48046 1.601504 0.298432 0.150522 Key: Under the subject heading the code for each subject is: C = complex math N = no math S= simple math The next three numbers indicate the actual order in which the subject was run in the experiment. The M or the F following the three numbers indicates that the subject was either male or female. The last two numbers is the subjectís age.

61
APPENDIX G
Experiment One and Two Math Problems
for the Two Simple Math groups
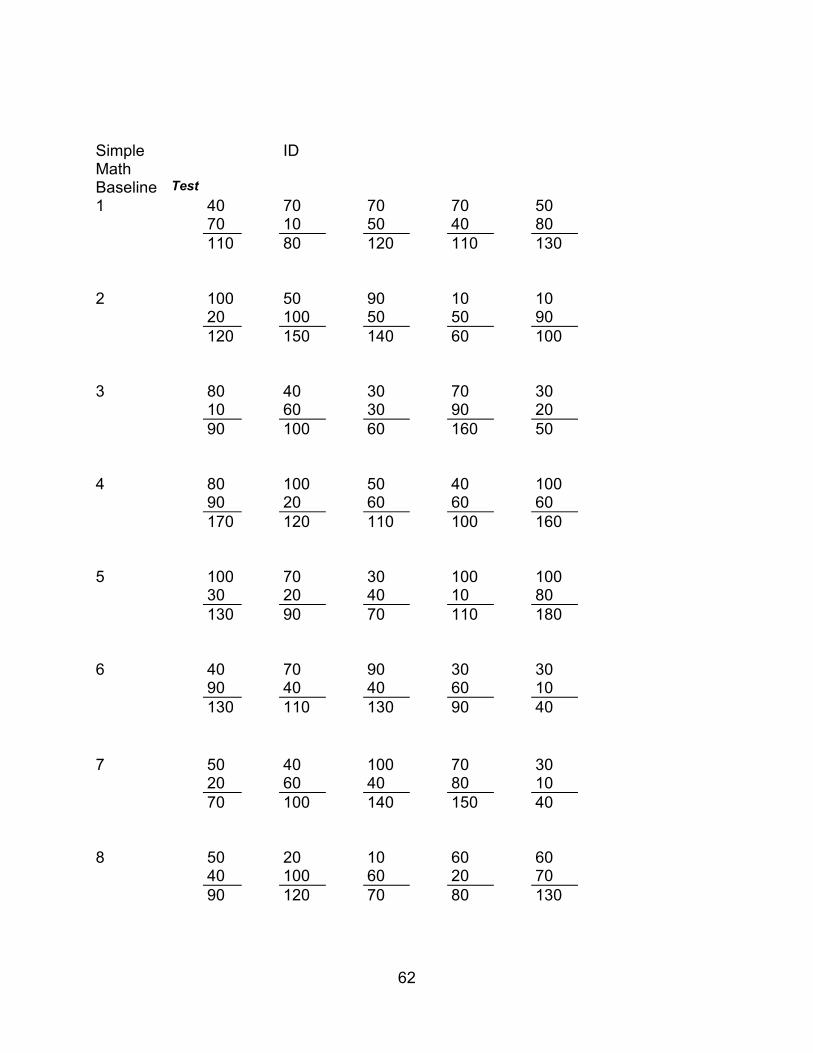
62
Simple Math
ID
Baseline Test 1 40 70 70 70 50 70 10 50 40 80 110 80 120 110 130 2 100 50 90 10 10 20 100 50 50 90 120 150 140 60 100 3 80 40 30 70 30 10 60 30 90 20 90 100 60 160 50 4 80 100 50 40 100 90 20 60 60 60 170 120 110 100 160 5 100 70 30 100 100 30 20 40 10 80 130 90 70 110 180 6 40 70 90 30 30 90 40 40 60 10 130 110 130 90 40 7 50 40 100 70 30 20 60 40 80 10 70 100 140 150 40 8 50 20 10 60 60 40 100 60 20 70 90 120 70 80 130
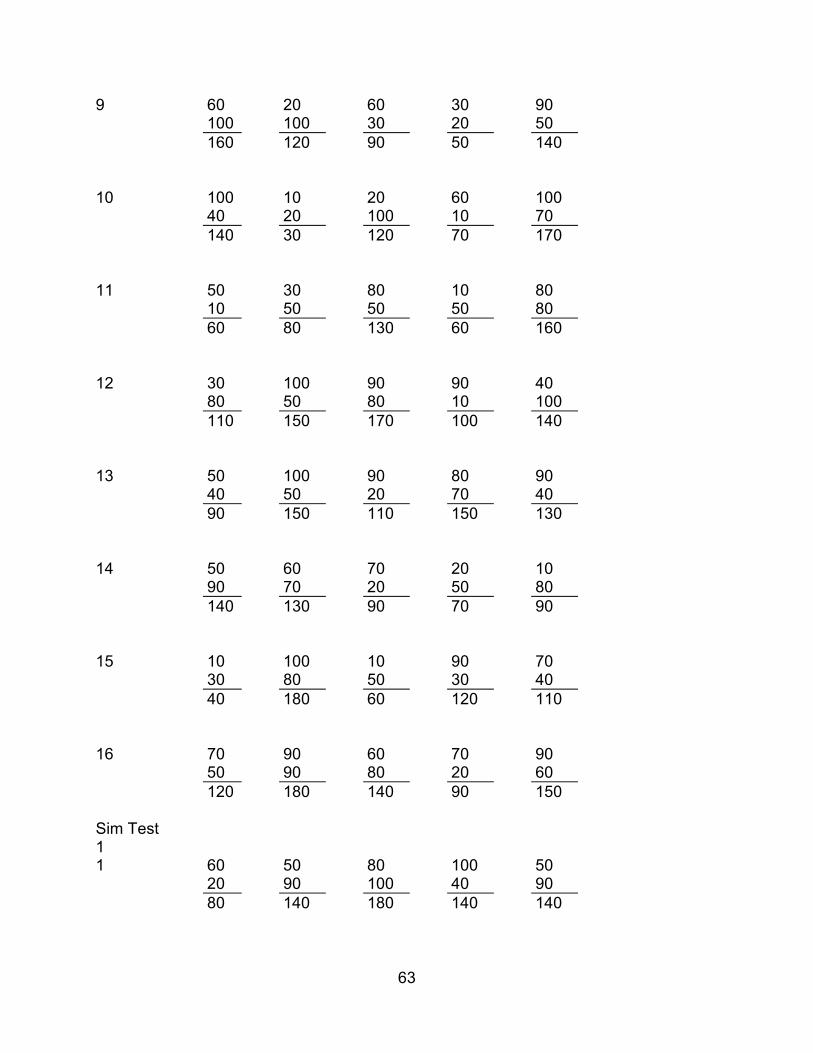
63
9 60 20 60 30 90 100 100 30 20 50 160 120 90 50 140 10 100 10 20 60 100 40 20 100 10 70 140 30 120 70 170 11 50 30 80 10 80 10 50 50 50 80 60 80 130 60 160 12 30 100 90 90 40 80 50 80 10 100 110 150 170 100 140 13 50 100 90 80 90 40 50 20 70 40 90 150 110 150 130 14 50 60 70 20 10 90 70 20 50 80 140 130 90 70 90 15 10 100 10 90 70 30 80 50 30 40 40 180 60 120 110 16 70 90 60 70 90 50 90 80 20 60 120 180 140 90 150 Sim Test 1
1 60 50 80 100 50 20 90 100 40 90 80 140 180 140 140
64
2 50 100 50 30 70 60 60 40 100 10 110 160 90 130 80 3 50 30 100 40 60 90 90 80 50 90 140 120 180 90 150 4 40 30 10 50 90 60 60 90 80 100 100 90 100 130 190 5 60 90 90 90 100 90 30 40 90 90 150 120 130 180 190 6 30 50 40 40 100 60 50 70 40 40 90 100 110 80 140 7 10 30 70 60 60 70 70 80 60 40 80 100 150 120 100 8 20 30 50 50 50 20 80 100 40 20 40 110 150 90 70 9 40 70 80 40 20 100 90 20 10 90 140 160 100 50 110 10 50 80 60 10 30 30 80 60 60 10 80 160 120 70 40 11 10 30 50 50 60 50 80 90 50 40
65
60 110 140 100 100 12 70 90 70 20 50 30 10 100 90 20 100 100 170 110 70 13 40 30 60 20 90 80 10 20 100 60 120 40 80 120 150 14 60 50 30 60 90 90 40 100 20 10 150 90 130 80 100 15 70 30 50 10 100 20 30 40 20 80 90 60 90 30 180 16 70 100 50 10 60 70 50 20 50 40 140 150 70 60 100 Sim Test 2 1 60 10 40 100 10 10 50 40 30 70 70 60 80 130 80 2 60 10 50 50 10 50 10 80 90 30 110 20 130 140 40 3 100 10 60 10 70 100 30 50 80 20 200 40 110 90 90 4 30 100 90 70 70 40 100 30 30 60 70 200 120 100 130
66
5 20 60 20 50 60 30 60 10 40 100 50 120 30 90 160 6 10 100 80 40 20 60 20 100 60 20 70 120 180 100 40 7 90 60 20 30 50 40 20 100 50 50 130 80 120 80 100 8 20 50 30 40 70 90 100 10 60 90 110 150 40 100 160 9 50 10 40 60 30 100 50 40 20 90 150 60 80 80 120 10 50 20 60 90 60 70 100 100 100 70 120 120 160 190 130 11 80 60 70 10 100 40 100 60 90 100 120 160 130 100 200 12 80 60 70 70 100 100 50 30 80 60 180 110 100 150 160 13 20 20 80 90 90 30 60 100 100 70 50 80 180 190 160 14 90 30 100 10 100 10 90 70 40 40 100 120 170 50 140
67
15 80 50 40 90 30 10 50 30 100 10 90 100 70 190 40 16 50 80 10 10 10 70 80 20 70 70 120 160 30 80 80

68

69
APPENDIX H
Experiment One and Experiment Two Math Problems for the Complex Math groups
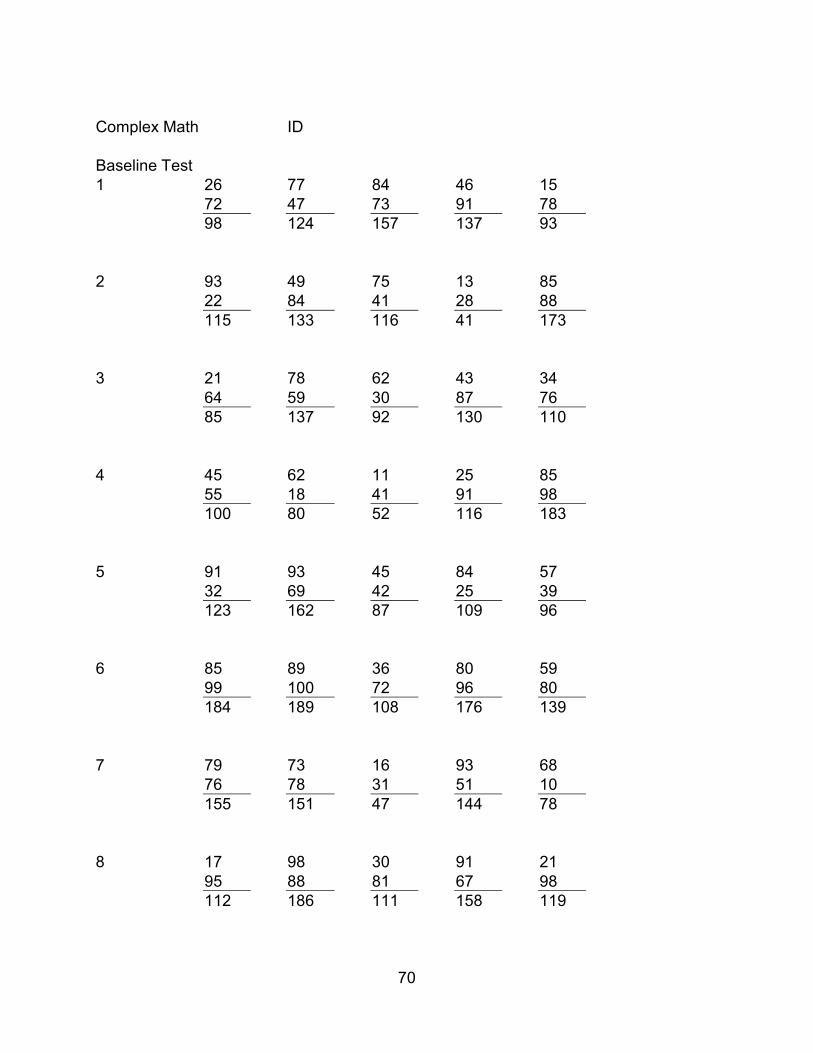
70
Complex Math ID Baseline Test 1 26 77 84 46 15 72 47 73 91 78 98 124 157 137 93 2 93 49 75 13 85 22 84 41 28 88 115 133 116 41 173 3 21 78 62 43 34 64 59 30 87 76 85 137 92 130 110 4 45 62 11 25 85 55 18 41 91 98 100 80 52 116 183 5 91 93 45 84 57 32 69 42 25 39 123 162 87 109 96 6 85 89 36 80 59 99 100 72 96 80 184 189 108 176 139 7 79 73 16 93 68 76 78 31 51 10 155 151 47 144 78 8 17 98 30 91 21 95 88 81 67 98 112 186 111 158 119
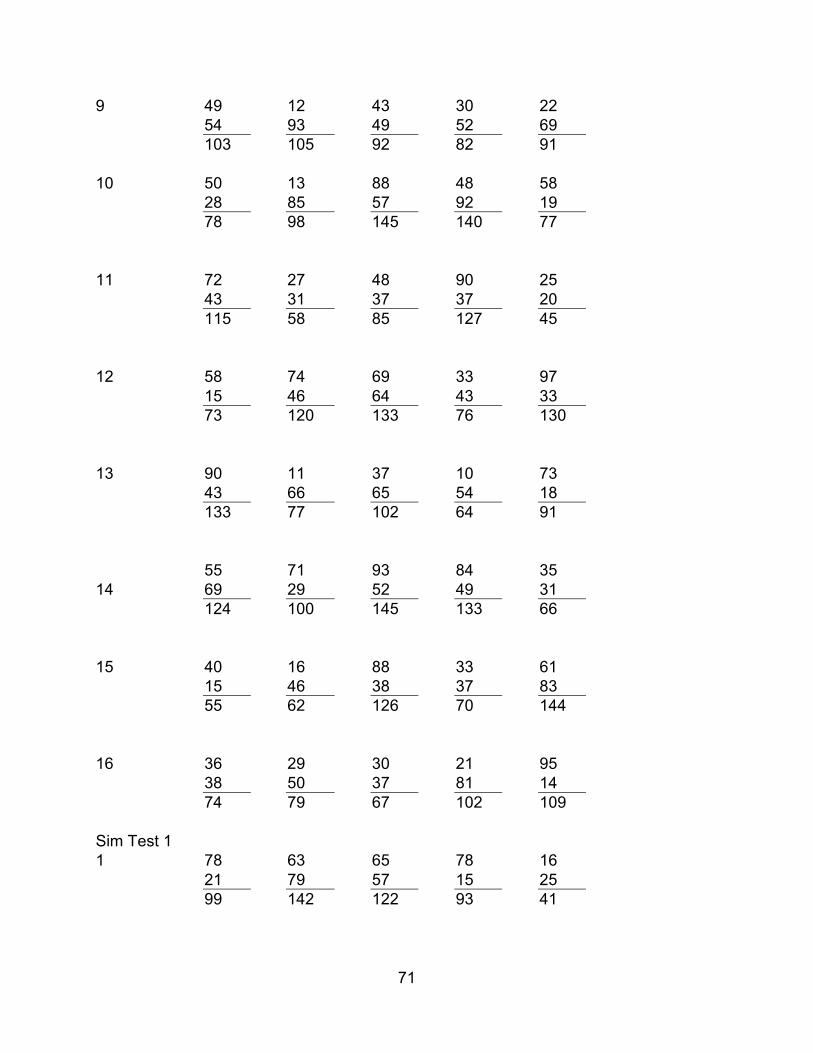
71
9 49 12 43 30 22 54 93 49 52 69 103 105 92 82 91 10 50 13 88 48 58 28 85 57 92 19 78 98 145 140 77 11 72 27 48 90 25 43 31 37 37 20 115 58 85 127 45 12 58 74 69 33 97 15 46 64 43 33 73 120 133 76 130 13 90 11 37 10 73 43 66 65 54 18 133 77 102 64 91 55 71 93 84 35 14 69 29 52 49 31 124 100 145 133 66 15 40 16 88 33 61 15 46 38 37 83 55 62 126 70 144 16 36 29 30 21 95 38 50 37 81 14 74 79 67 102 109 Sim Test 1 1 78 63 65 78 16 21 79 57 15 25 99 142 122 93 41
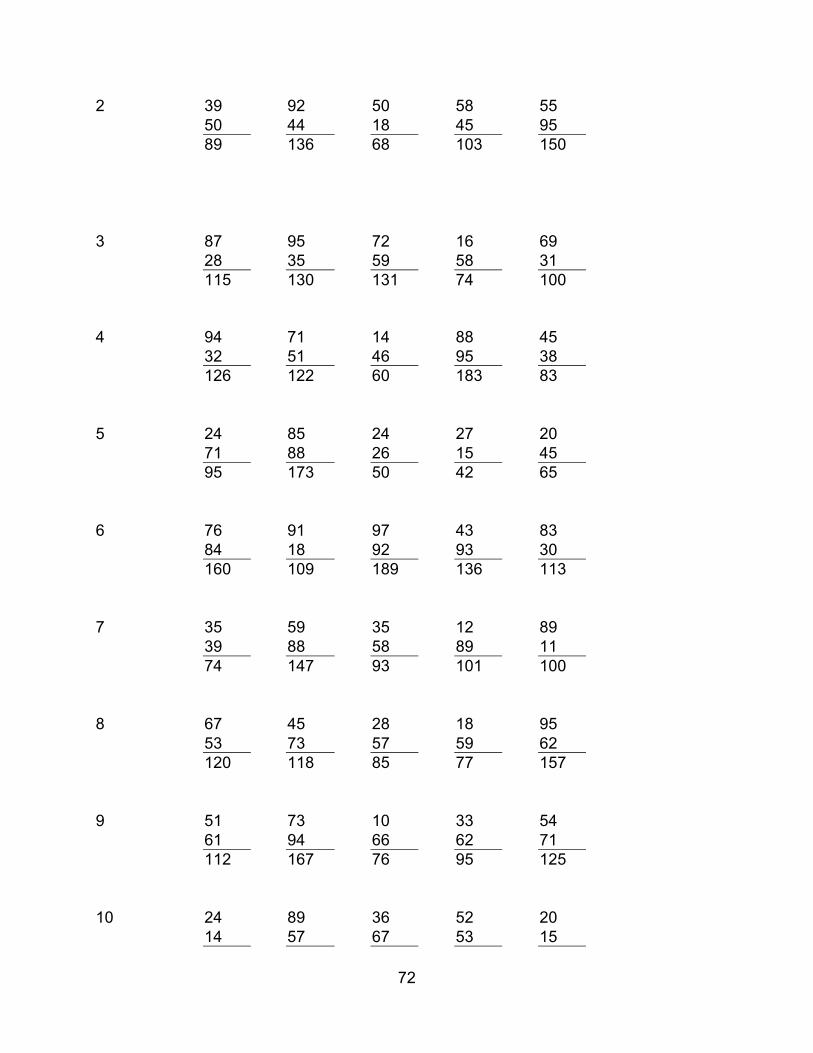
72
2 39 92 50 58 55 50 44 18 45 95 89 136 68 103 150 3 87 95 72 16 69 28 35 59 58 31 115 130 131 74 100 4 94 71 14 88 45 32 51 46 95 38 126 122 60 183 83 5 24 85 24 27 20 71 88 26 15 45 95 173 50 42 65 6 76 91 97 43 83 84 18 92 93 30 160 109 189 136 113 7 35 59 35 12 89 39 88 58 89 11 74 147 93 101 100 8 67 45 28 18 95 53 73 57 59 62 120 118 85 77 157 9 51 73 10 33 54 61 94 66 62 71 112 167 76 95 125 10 24 89 36 52 20 14 57 67 53 15
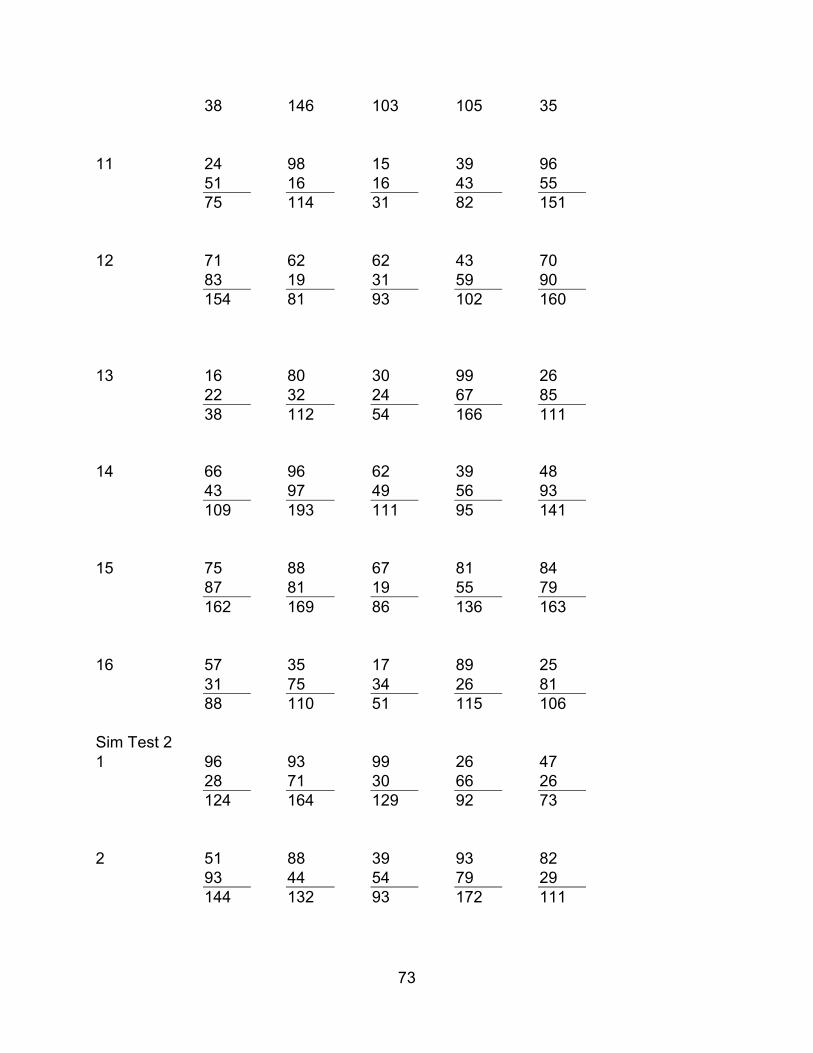
73
38 146 103 105 35 11 24 98 15 39 96 51 16 16 43 55 75 114 31 82 151 12 71 62 62 43 70 83 19 31 59 90 154 81 93 102 160 13 16 80 30 99 26 22 32 24 67 85 38 112 54 166 111 14 66 96 62 39 48 43 97 49 56 93 109 193 111 95 141 15 75 88 67 81 84 87 81 19 55 79 162 169 86 136 163 16 57 35 17 89 25 31 75 34 26 81 88 110 51 115 106 Sim Test 2 1 96 93 99 26 47 28 71 30 66 26 124 164 129 92 73 2 51 88 39 93 82 93 44 54 79 29 144 132 93 172 111
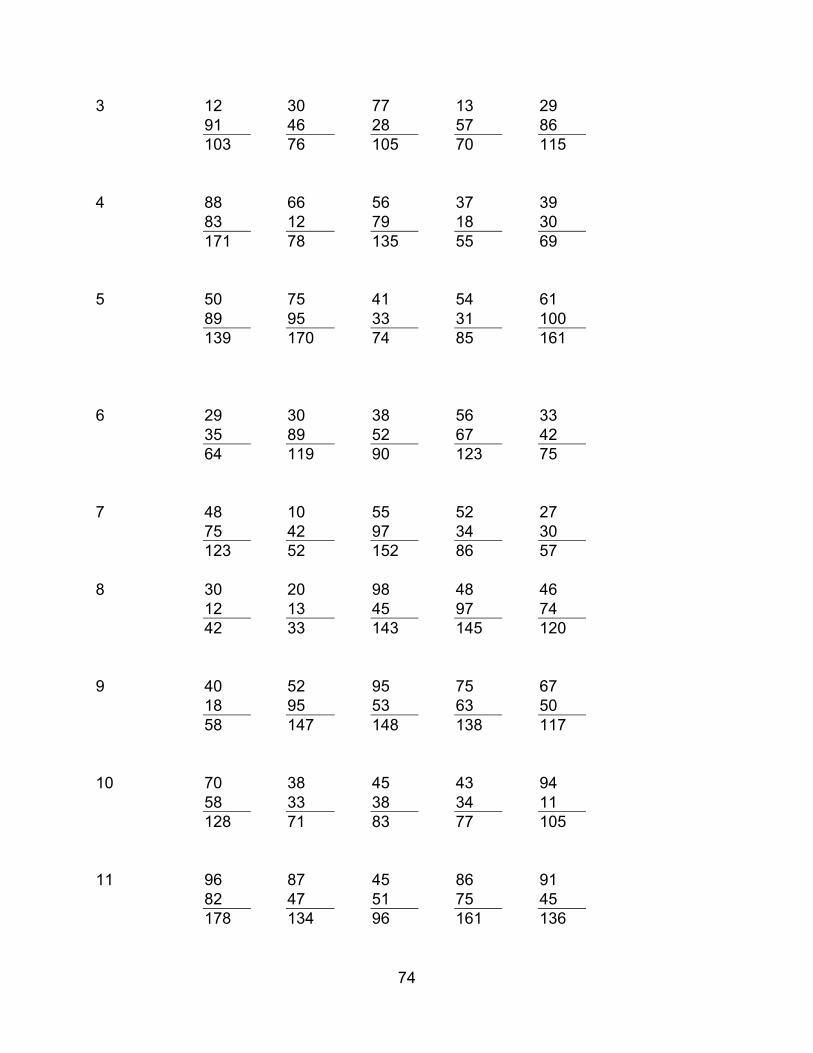
74
3 12 30 77 13 29 91 46 28 57 86 103 76 105 70 115 4 88 66 56 37 39 83 12 79 18 30 171 78 135 55 69 5 50 75 41 54 61 89 95 33 31 100 139 170 74 85 161 6 29 30 38 56 33 35 89 52 67 42 64 119 90 123 75 7 48 10 55 52 27 75 42 97 34 30 123 52 152 86 57 8 30 20 98 48 46 12 13 45 97 74 42 33 143 145 120 9 40 52 95 75 67 18 95 53 63 50 58 147 148 138 117 10 70 38 45 43 94 58 33 38 34 11 128 71 83 77 105 11 96 87 45 86 91 82 47 51 75 45 178 134 96 161 136
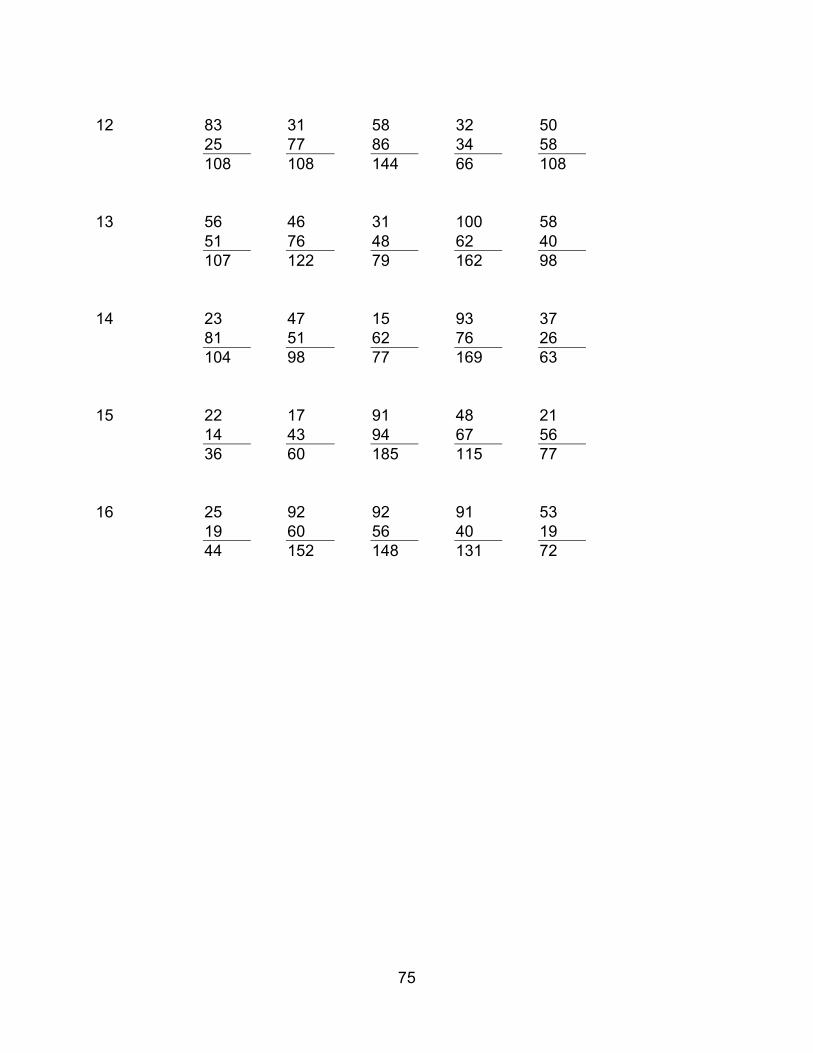
75
12 83 31 58 32 50 25 77 86 34 58 108 108 144 66 108 13 56 46 31 100 58 51 76 48 62 40 107 122 79 162 98 14 23 47 15 93 37 81 51 62 76 26 104 98 77 169 63 15 22 17 91 48 21 14 43 94 67 56 36 60 185 115 77 16 25 92 92 91 53 19 60 56 40 19 44 152 148 131 72

76

77
APPENDIX I
Experiment One Math Data for Simple and Complex Math groups
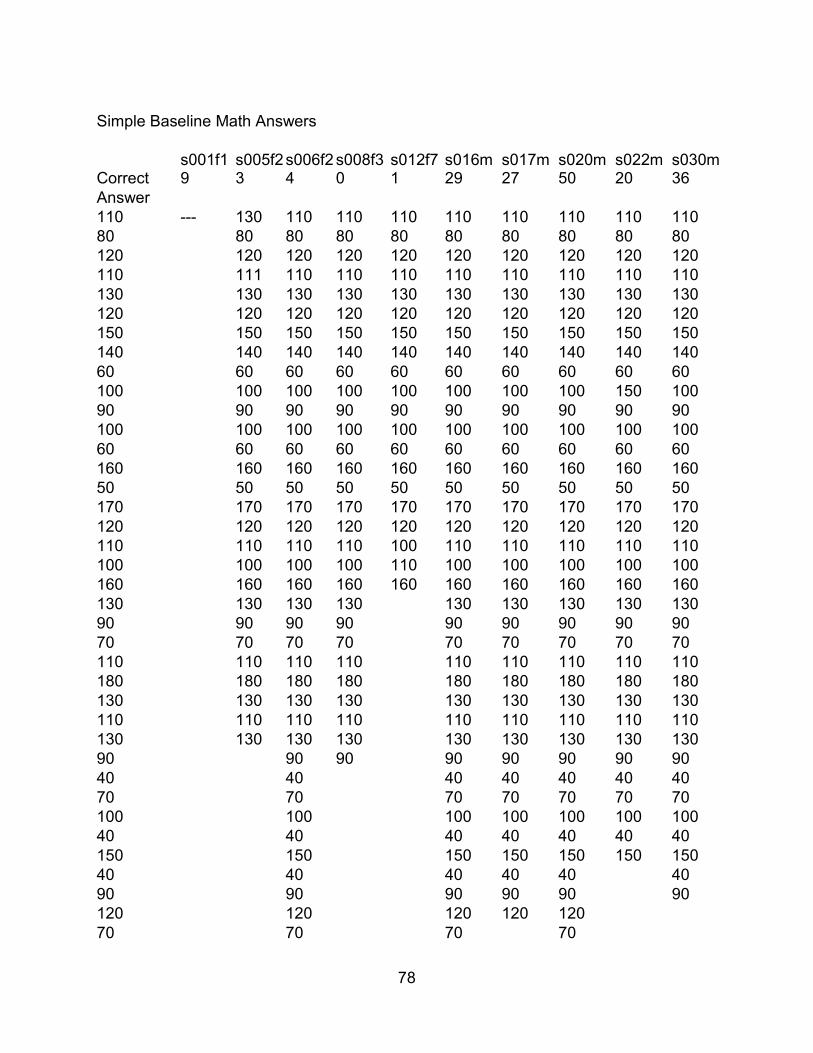
78
Simple Baseline Math Answers
Correct s001f19
s005f23
s006f24
s008f30
s012f71
s016m29
s017m27
s020m50
s022m20
s030m36
Answer 110 --- 130 110 110 110 110 110 110 110 110 80 80 80 80 80 80 80 80 80 80 120 120 120 120 120 120 120 120 120 120 110 111 110 110 110 110 110 110 110 110 130 130 130 130 130 130 130 130 130 130 120 120 120 120 120 120 120 120 120 120 150 150 150 150 150 150 150 150 150 150 140 140 140 140 140 140 140 140 140 140 60 60 60 60 60 60 60 60 60 60 100 100 100 100 100 100 100 100 150 100 90 90 90 90 90 90 90 90 90 90 100 100 100 100 100 100 100 100 100 100 60 60 60 60 60 60 60 60 60 60 160 160 160 160 160 160 160 160 160 160 50 50 50 50 50 50 50 50 50 50 170 170 170 170 170 170 170 170 170 170 120 120 120 120 120 120 120 120 120 120 110 110 110 110 100 110 110 110 110 110 100 100 100 100 110 100 100 100 100 100 160 160 160 160 160 160 160 160 160 160 130 130 130 130 130 130 130 130 130 90 90 90 90 90 90 90 90 90 70 70 70 70 70 70 70 70 70 110 110 110 110 110 110 110 110 110 180 180 180 180 180 180 180 180 180 130 130 130 130 130 130 130 130 130 110 110 110 110 110 110 110 110 110 130 130 130 130 130 130 130 130 130 90 90 90 90 90 90 90 90 40 40 40 40 40 40 40 70 70 70 70 70 70 70 100 100 100 100 100 100 100 40 40 40 40 40 40 40 150 150 150 150 150 150 150 40 40 40 40 40 40 90 90 90 90 90 90 120 120 120 120 120 70 70 70 70
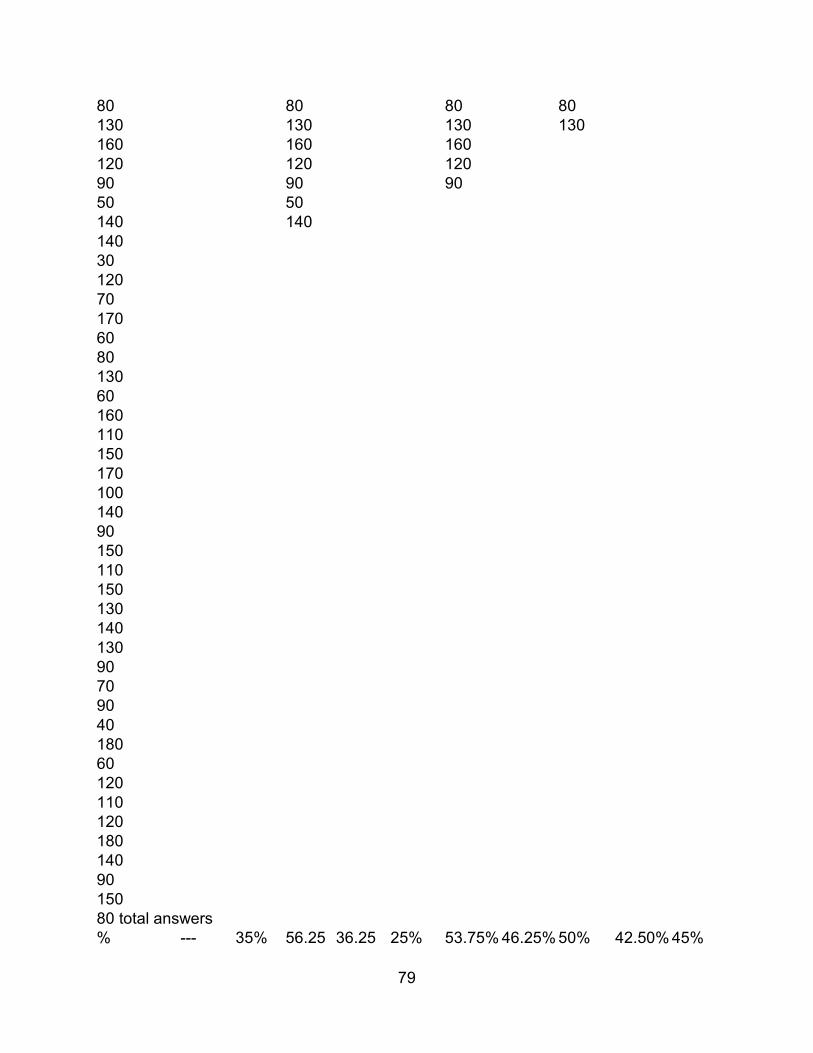
79
80 80 80 80 130 130 130 130 160 160 160 120 120 120 90 90 90 50 50 140 140 140 30 120 70 170 60 80 130 60 160 110 150 170 100 140 90 150 110 150 130 140 130 90 70 90 40 180 60 120 110 120 180 140 90 150 80 total answers % --- 35% 56.25 36.25 25% 53.75% 46.25%50% 42.50%45%

80
answered % % % correct --- 92.86 100% 100% 90% 100% 100% 100% 97.05%100%
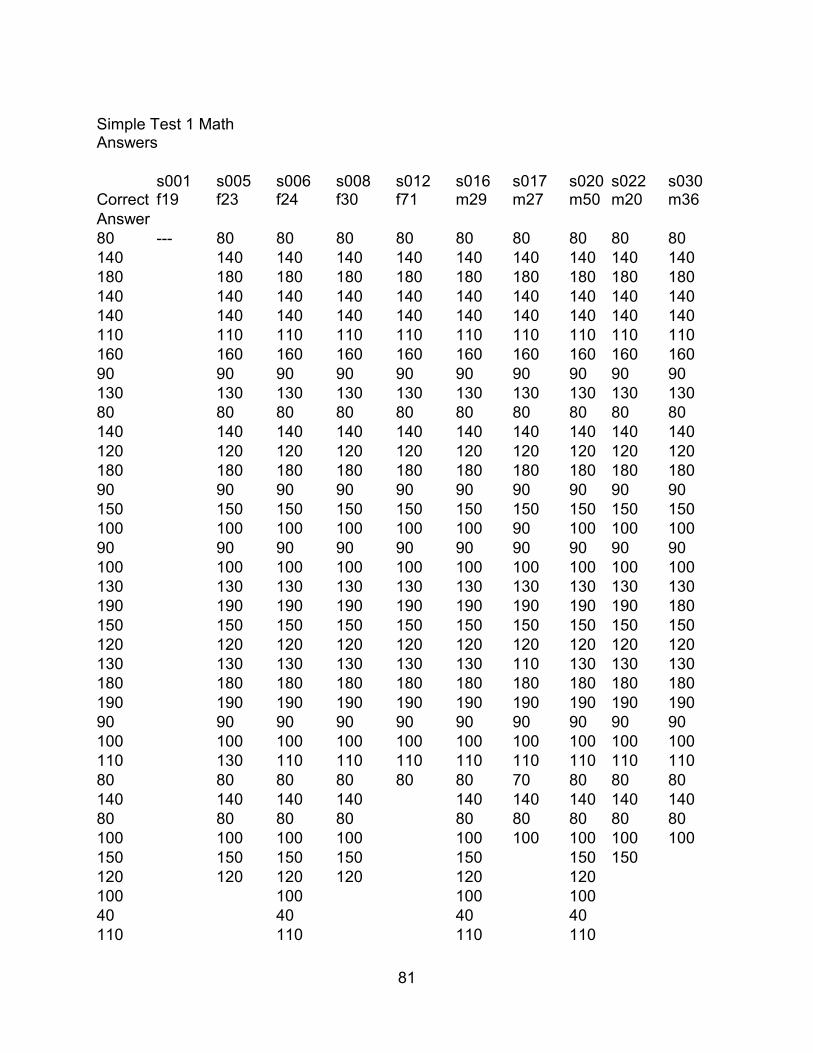
81
Simple Test 1 Math Answers
Correct s001 f19
s005 f23
s006 f24
s008 f30
s012 f71
s016 m29
s017 m27
s020 m50
s022 m20
s030 m36
Answer 80 --- 80 80 80 80 80 80 80 80 80 140 140 140 140 140 140 140 140 140 140 180 180 180 180 180 180 180 180 180 180 140 140 140 140 140 140 140 140 140 140 140 140 140 140 140 140 140 140 140 140 110 110 110 110 110 110 110 110 110 110 160 160 160 160 160 160 160 160 160 160 90 90 90 90 90 90 90 90 90 90 130 130 130 130 130 130 130 130 130 130 80 80 80 80 80 80 80 80 80 80 140 140 140 140 140 140 140 140 140 140 120 120 120 120 120 120 120 120 120 120 180 180 180 180 180 180 180 180 180 180 90 90 90 90 90 90 90 90 90 90 150 150 150 150 150 150 150 150 150 150 100 100 100 100 100 100 90 100 100 100 90 90 90 90 90 90 90 90 90 90 100 100 100 100 100 100 100 100 100 100 130 130 130 130 130 130 130 130 130 130 190 190 190 190 190 190 190 190 190 180 150 150 150 150 150 150 150 150 150 150 120 120 120 120 120 120 120 120 120 120 130 130 130 130 130 130 110 130 130 130 180 180 180 180 180 180 180 180 180 180 190 190 190 190 190 190 190 190 190 190 90 90 90 90 90 90 90 90 90 90 100 100 100 100 100 100 100 100 100 100 110 130 110 110 110 110 110 110 110 110 80 80 80 80 80 80 70 80 80 80 140 140 140 140 140 140 140 140 140 80 80 80 80 80 80 80 80 80 100 100 100 100 100 100 100 100 100 150 150 150 150 150 150 150 120 120 120 120 120 120 100 100 100 100 40 40 40 40 110 110 110 110

82
150 150 150 150 90 90 90 90 70 70 70 70 140 140 140 160 160 160 100 100 100 50 50 110 110 80 160 120 70 40 60 110 140 100 100 100 100 170 110 70 120 40 80 120 150 150 90 130 80 100 90 60 90 30 180 140 150 70 60 100 80 total answers
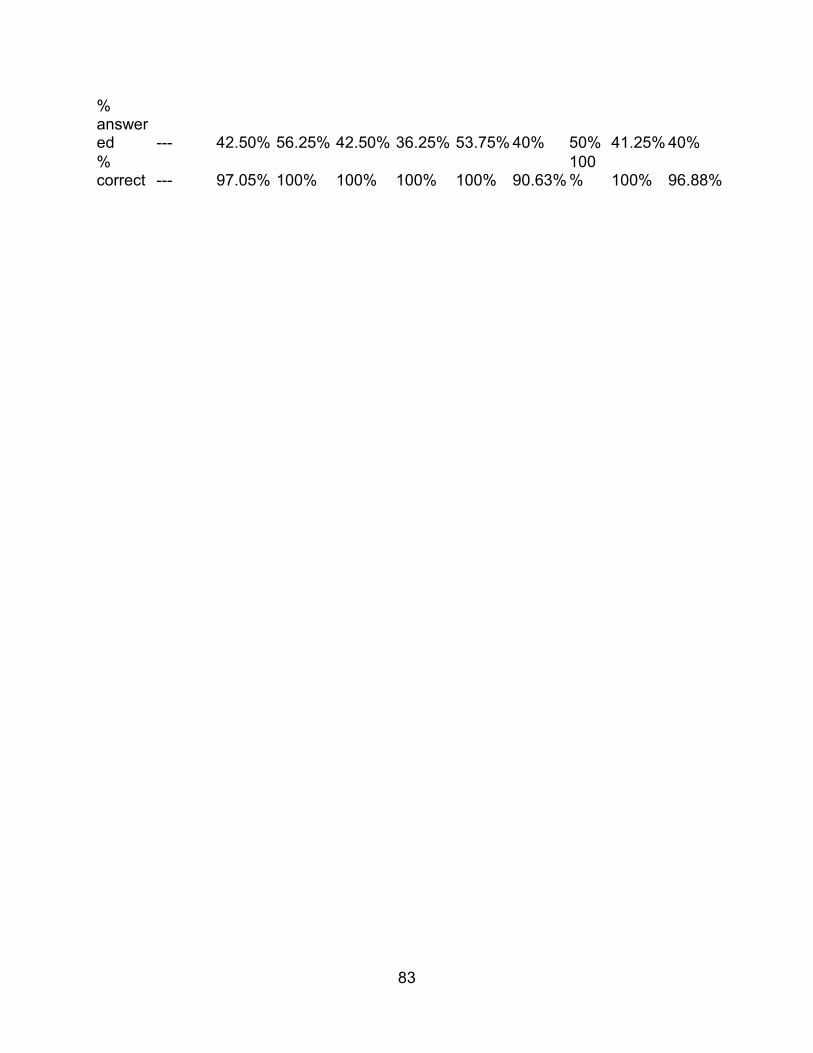
83
% answered --- 42.50% 56.25% 42.50% 36.25% 53.75% 40% 50% 41.25% 40% % correct --- 97.05% 100% 100% 100% 100% 90.63%
100% 100% 96.88%
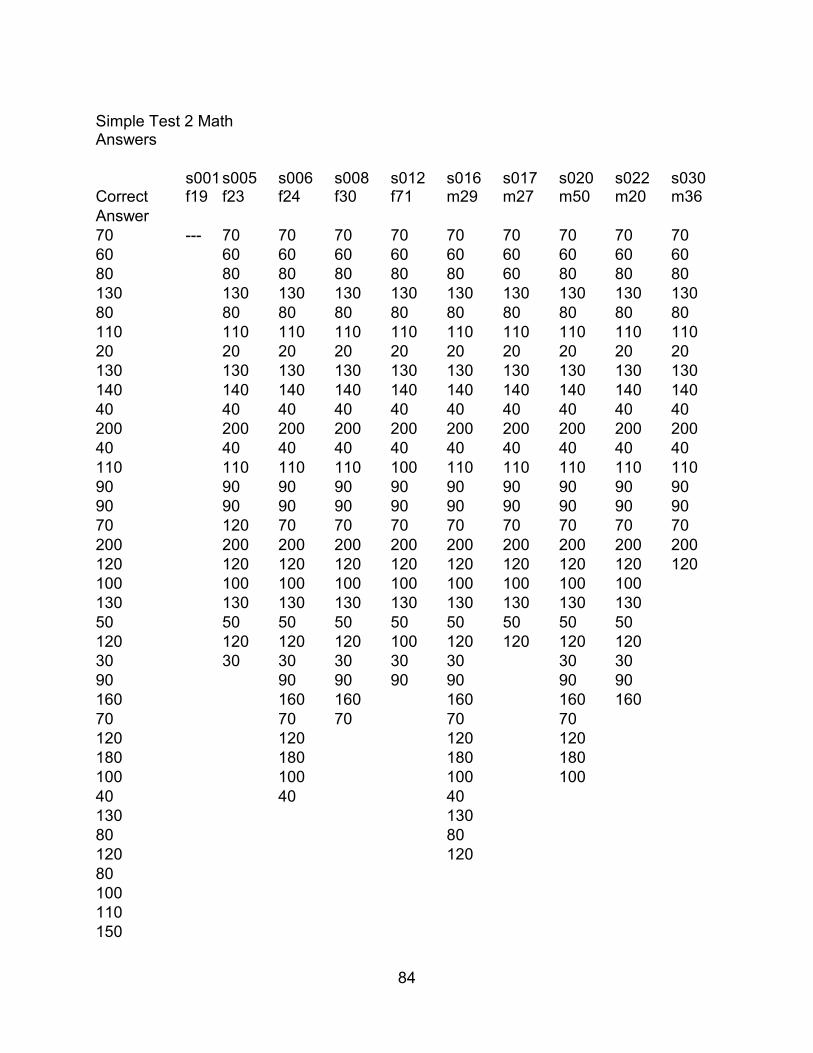
84
Simple Test 2 Math Answers
Correct s001 f19
s005 f23
s006 f24
s008 f30
s012 f71
s016 m29
s017 m27
s020 m50
s022 m20
s030 m36
Answer 70 --- 70 70 70 70 70 70 70 70 70 60 60 60 60 60 60 60 60 60 60 80 80 80 80 80 80 60 80 80 80 130 130 130 130 130 130 130 130 130 130 80 80 80 80 80 80 80 80 80 80 110 110 110 110 110 110 110 110 110 110 20 20 20 20 20 20 20 20 20 20 130 130 130 130 130 130 130 130 130 130 140 140 140 140 140 140 140 140 140 140 40 40 40 40 40 40 40 40 40 40 200 200 200 200 200 200 200 200 200 200 40 40 40 40 40 40 40 40 40 40 110 110 110 110 100 110 110 110 110 110 90 90 90 90 90 90 90 90 90 90 90 90 90 90 90 90 90 90 90 90 70 120 70 70 70 70 70 70 70 70 200 200 200 200 200 200 200 200 200 200 120 120 120 120 120 120 120 120 120 120 100 100 100 100 100 100 100 100 100 130 130 130 130 130 130 130 130 130 50 50 50 50 50 50 50 50 50 120 120 120 120 100 120 120 120 120 30 30 30 30 30 30 30 30 90 90 90 90 90 90 90 160 160 160 160 160 160 70 70 70 70 70 120 120 120 120 180 180 180 180 100 100 100 100 40 40 40 130 130 80 80 120 120 80 100 110 150
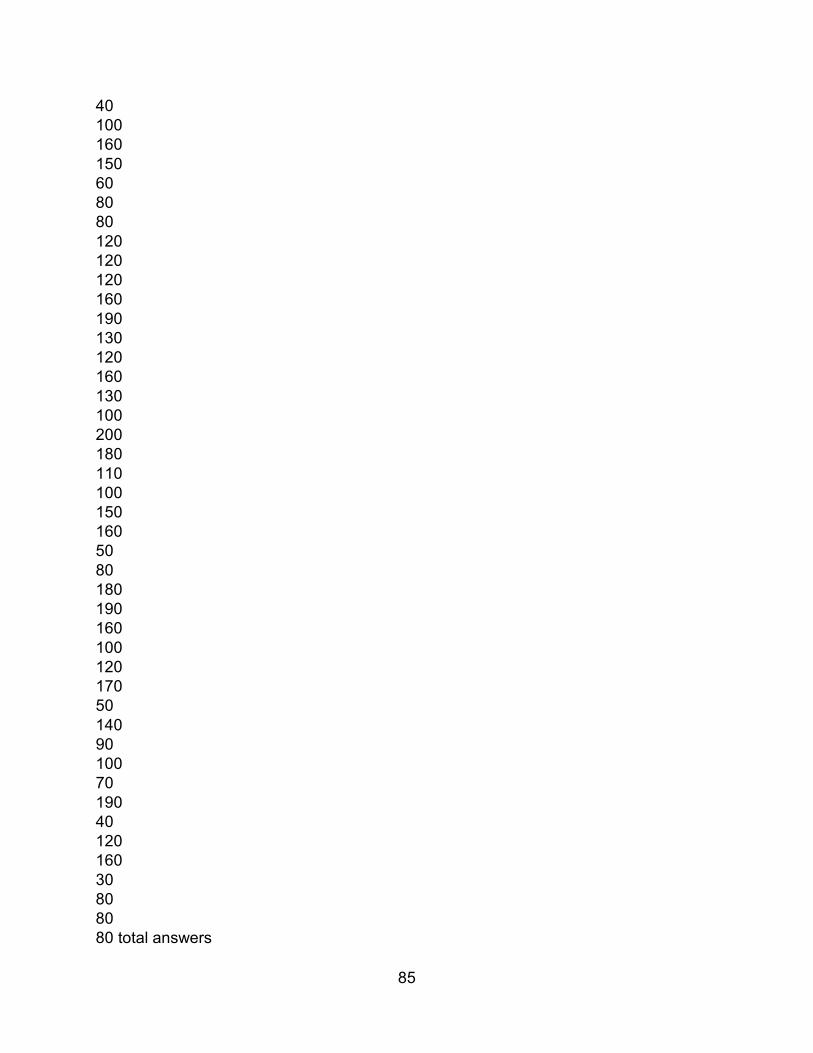
85
40 100 160 150 60 80 80 120 120 120 160 190 130 120 160 130 100 200 180 110 100 150 160 50 80 180 190 160 100 120 170 50 140 90 100 70 190 40 120 160 30 80 80 80 total answers
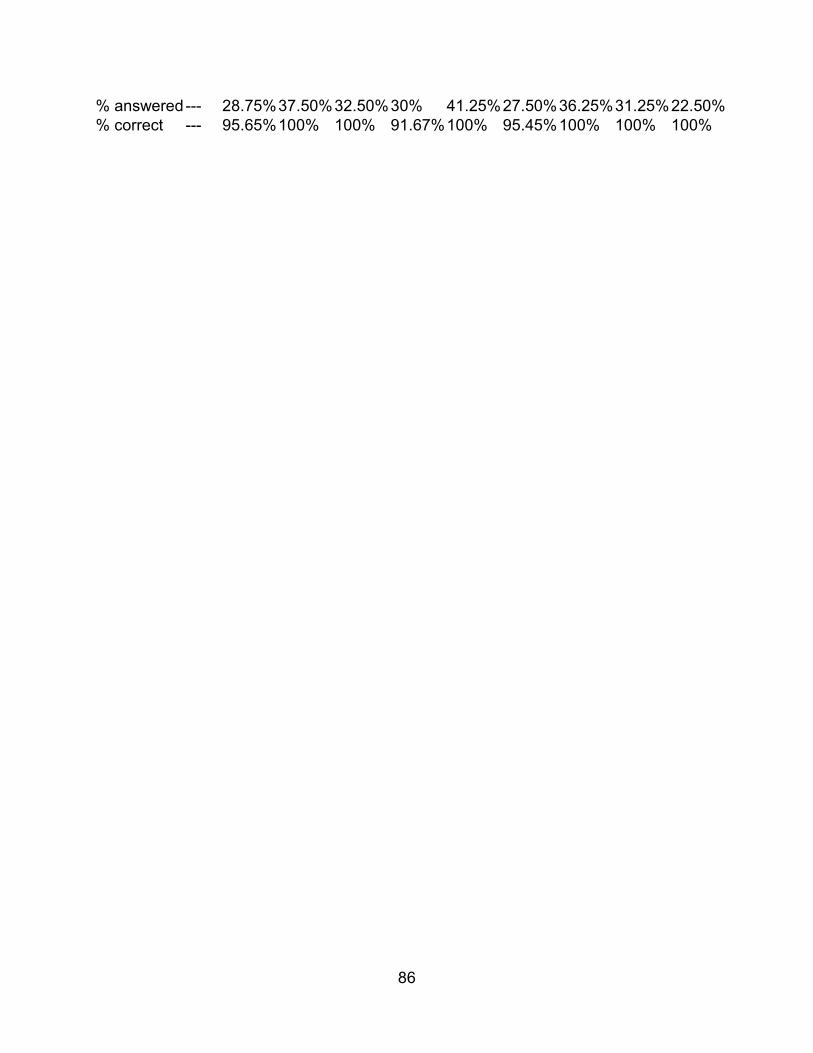
86
% answered --- 28.75% 37.50% 32.50% 30% 41.25% 27.50%36.25% 31.25% 22.50% % correct --- 95.65% 100% 100% 91.67% 100% 95.45%100% 100% 100%
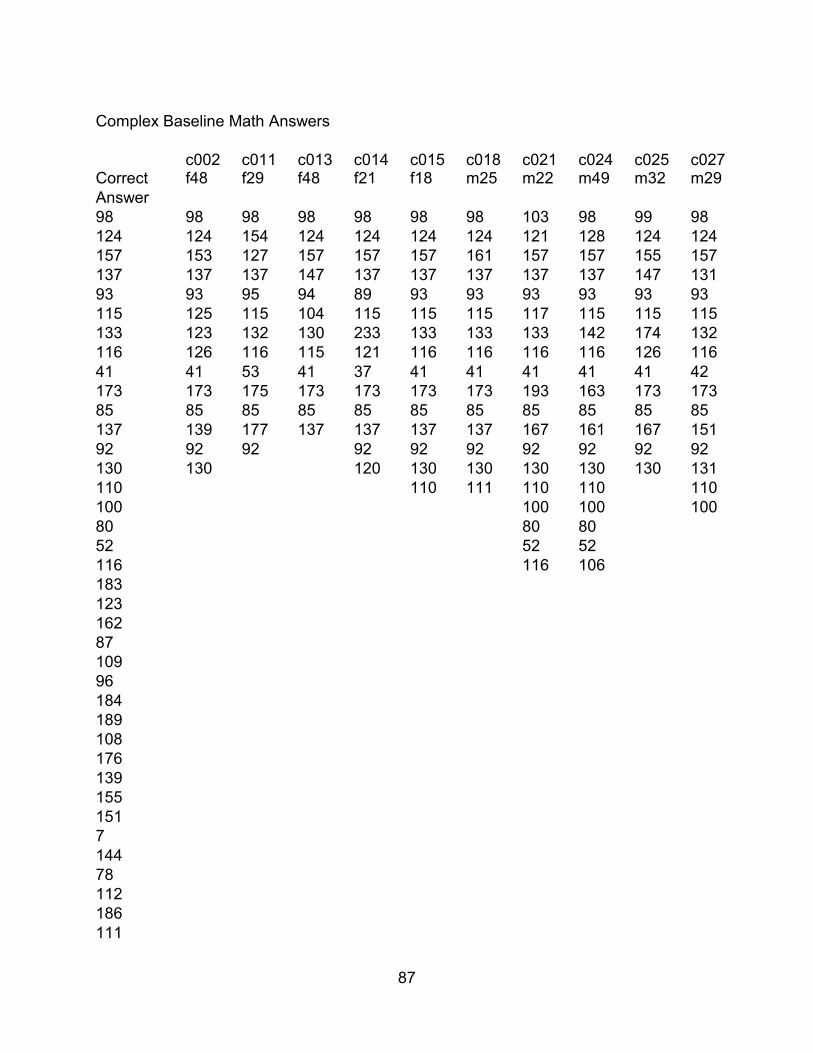
87
Complex Baseline Math Answers
Correct c002 f48
c011 f29
c013 f48
c014 f21
c015 f18
c018 m25
c021 m22
c024 m49
c025 m32
c027m29
Answer 98 98 98 98 98 98 98 103 98 99 98 124 124 154 124 124 124 124 121 128 124 124 157 153 127 157 157 157 161 157 157 155 157 137 137 137 147 137 137 137 137 137 147 131 93 93 95 94 89 93 93 93 93 93 93 115 125 115 104 115 115 115 117 115 115 115 133 123 132 130 233 133 133 133 142 174 132 116 126 116 115 121 116 116 116 116 126 116 41 41 53 41 37 41 41 41 41 41 42 173 173 175 173 173 173 173 193 163 173 173 85 85 85 85 85 85 85 85 85 85 85 137 139 177 137 137 137 137 167 161 167 151 92 92 92 92 92 92 92 92 92 92 130 130 120 130 130 130 130 130 131 110 110 111 110 110 110 100 100 100 100 80 80 80 52 52 52 116 116 106 183 123 162 87 109 96 184 189 108 176 139 155 151 7 144 78 112 186 111
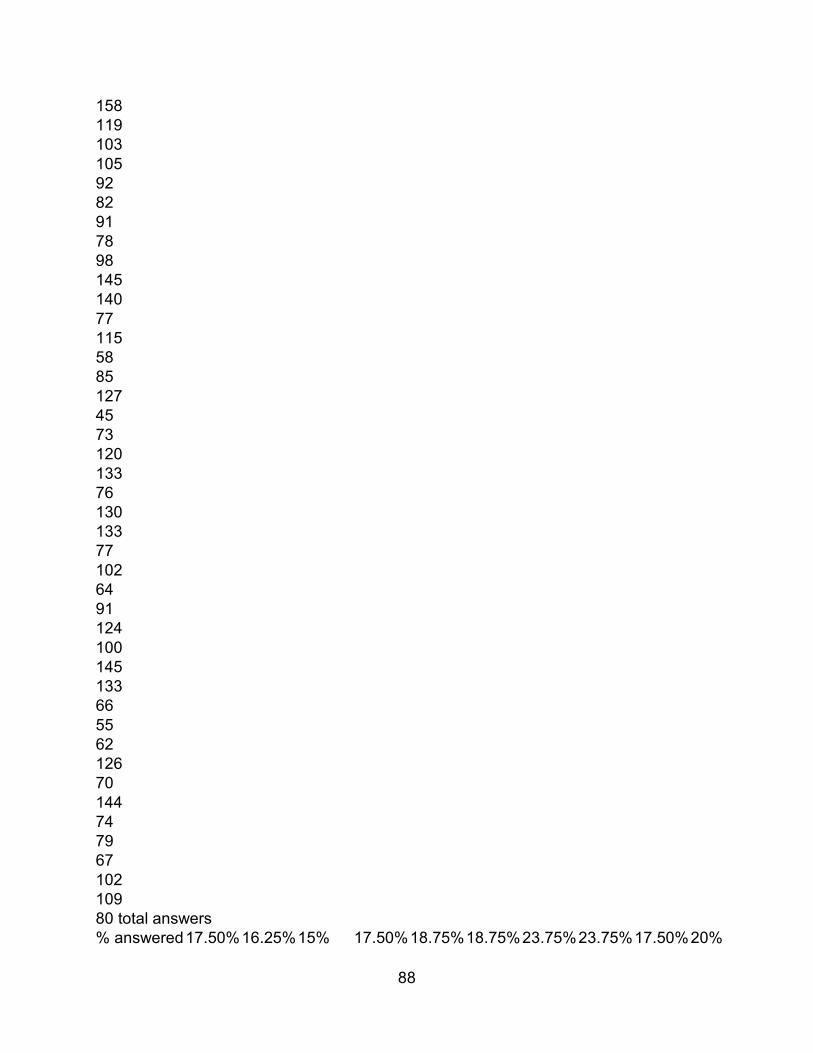
88
158 119 103 105 92 82 91 78 98 145 140 77 115 58 85 127 45 73 120 133 76 130 133 77 102 64 91 124 100 145 133 66 55 62 126 70 144 74 79 67 102 109 80 total answers % answered 17.50% 16.25%15% 17.50%18.75% 18.75% 23.75% 23.75% 17.50% 20%

89
% correct 64.29% 46.15%58.33%64.29%100% 86.67% 73.68% 73.68% 57.14% 68.75%
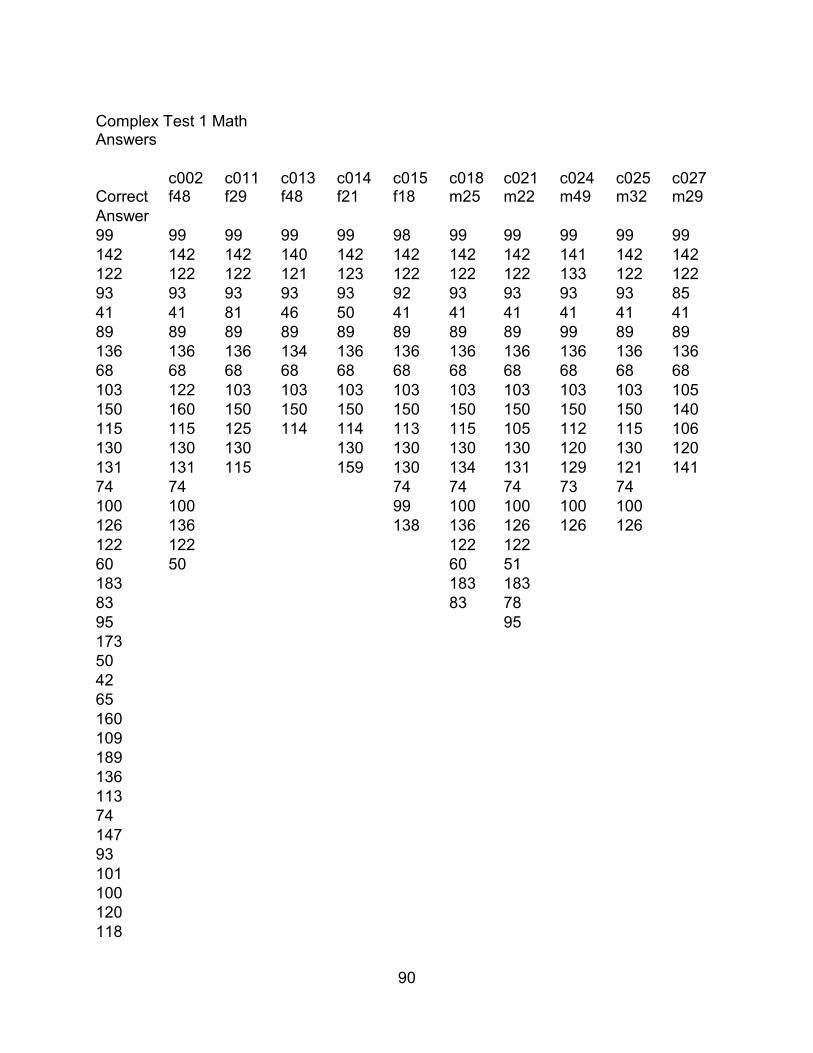
90
Complex Test 1 Math Answers
Correct c002 f48
c011 f29
c013 f48
c014 f21
c015 f18
c018 m25
c021 m22
c024 m49
c025 m32
c027m29
Answer 99 99 99 99 99 98 99 99 99 99 99 142 142 142 140 142 142 142 142 141 142 142 122 122 122 121 123 122 122 122 133 122 122 93 93 93 93 93 92 93 93 93 93 85 41 41 81 46 50 41 41 41 41 41 41 89 89 89 89 89 89 89 89 99 89 89 136 136 136 134 136 136 136 136 136 136 136 68 68 68 68 68 68 68 68 68 68 68 103 122 103 103 103 103 103 103 103 103 105 150 160 150 150 150 150 150 150 150 150 140 115 115 125 114 114 113 115 105 112 115 106 130 130 130 130 130 130 130 120 130 120 131 131 115 159 130 134 131 129 121 141 74 74 74 74 74 73 74 100 100 99 100 100 100 100 126 136 138 136 126 126 126 122 122 122 122 60 50 60 51 183 183 183 83 83 78 95 95 173 50 42 65 160 109 189 136 113 74 147 93 101 100 120 118

91
85 77 157 112 167 76 95 125 38 146 103 105 35 75 114 31 82 151 154 81 93 102 160 38 112 54 166 111 109 193 111 95 141 162 169 86 136 163 88 110 51 115 106 80 total answers

92
% answered 22.50% 16.25%13.75% 16.25% 20% 25% 26.25% 20% 20%
16.25%
% correct 77.78% 76.92%54.55% 69.23% 62.50%90% 85.71% 56.25%93.75% 53.85%
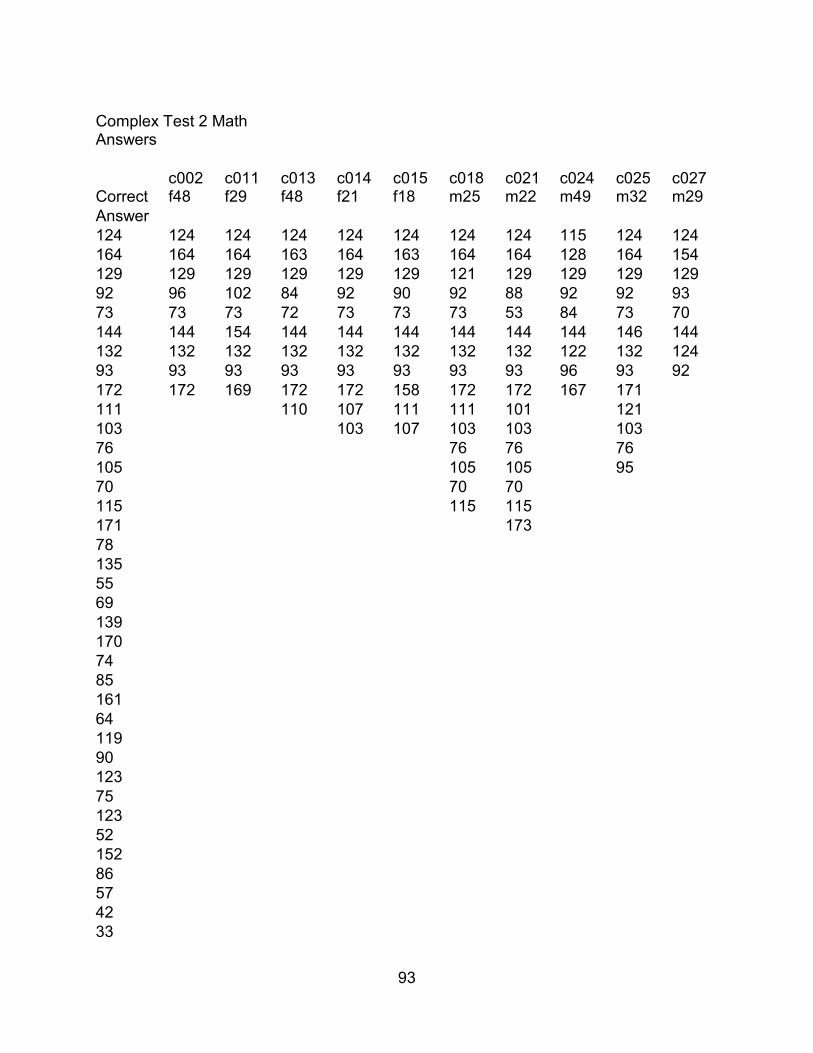
93
Complex Test 2 Math Answers
Correct c002 f48
c011 f29
c013 f48
c014 f21
c015 f18
c018 m25
c021 m22
c024 m49
c025 m32
c027 m29
Answer 124 124 124 124 124 124 124 124 115 124 124 164 164 164 163 164 163 164 164 128 164 154 129 129 129 129 129 129 121 129 129 129 129 92 96 102 84 92 90 92 88 92 92 93 73 73 73 72 73 73 73 53 84 73 70 144 144 154 144 144 144 144 144 144 146 144 132 132 132 132 132 132 132 132 122 132 124 93 93 93 93 93 93 93 93 96 93 92 172 172 169 172 172 158 172 172 167 171 111 110 107 111 111 101 121 103 103 107 103 103 103 76 76 76 76 105 105 105 95 70 70 70 115 115 115 171 173 78 135 55 69 139 170 74 85 161 64 119 90 123 75 123 52 152 86 57 42 33

94
143 145 120 58 147 148 138 117 128 71 83 77 105 178 134 96 161 136 108 108 144 66 108 107 122 79 162 98 104 98 77 169 63 36 60 185 115 77 44 152 148 131 72 80 total answers

95
% answered 11.25% 11.25%12.50% 13.75% 13.75%18.75%20% 11.25%16.25% 10%
% correct 88.89% 66.67%60% 90.91% 63.64%93.33%75% 33.33%69.23% 37.50%

96

97
APPENDIX J
Experiment Two Practice Session Instructions for the No Math group
98
THE EFFECT OF DISTRACTION ON DRIVER BEHAVIOR PRACTICE SESSION
Currently, you are seated in the driving environment simulator (DESi). It is an interactive simulator, which means the driving scenes you experience react to your steering and pedal inputs to provide a realistic driving experience. During your drive in the simulator, please drive in a normal fashion and obey all traffic laws. For the practice session your task is to get comfortable with driving in a simulated driving environment. The driving scene that will be presented to you begins with the simulator vehicle stopped at the side of a road. You are to start the vehicle, put it into ëdriveí, and proceed through the driving environment by following the car traveling in front of you. Please continue to follow the lead car at a comfortable distance. After a couple minute the lead car will pull off the road. Your task is to continue driving down the road. After a couple more minutes the screens will turn black. At that time please turn your attention to the experimenter. The practice session will take approximately five minutes. For the second part of the practice session it is also your task to become familiar with the touch screen and the mental workload questions. Please look at the touch screen and read through the questions. If you have any questions regarding the practice session please consult the experimenter. Otherwise, acknowledge that you are ready by telling the experimenter to begin the driving scene.
99
APPENDIX K
Experiment Two Practice Session Instructions for the Simple Math and Complex Math groups
100
THE EFFECT OF DISTRACTION ON DRIVER BEHAVIOR PRACTICE SESSION
Currently, you are seated in the driving environment simulator (DESi). It is an interactive simulator, which means the driving scenes you experience react to your steering and pedal inputs to provide a realistic driving experience. During your drive in the simulator, please drive in a normal fashion and obey all traffic laws. For the first part of the practice session your task is to perform an addition task. The experimenter will present to you a series of addition tasks on the touch screen. Your task is to add the numbers and then enter the correct answer. You will have a total of eight seconds to perform each addition task. For example, you may be asked to add 20 and 30. For the practice session you will be asked to perform this task for two minutes. Please direct your attention to the experimenter to perform them now.
101
THE EFFECT OF DISTRACTION ON DRIVER BEHAVIOR PRACTICE SESSION II
For the second part of the practice session your task is to get comfortable with driving in a simulated driving environment. The driving scene that will be presented to you begins with the simulator vehicle stopped at the side of a road. You are to start the vehicle, put it into ëdriveí, and proceed through the driving environment by following the car traveling in front of you. Please continue to follow the lead car at a comfortable distance. After a couple minute the lead car will pull off the road. Your task is to continue driving down the road. After a couple more minutes the screens will turn black. At that time please turn your attention to the experimenter. The practice session will take approximately five minutes. For the second part of the practice session it is also your task to become familiar with the touch screen and the mental workload questions. Please look at the touch screen and read through the questions. If you have any questions regarding the practice session please consult the experimenter. Otherwise, acknowledge that you are ready by telling the experimenter to begin the driving scene.

102

103
APPENDIX L
Experiment Two Instructions for the No Math group
104
THE EFFECT OF DISTRACTION ON DRIVER BEHAVIOR EXPERIMENT INSTRUCTIONS
You are now asked to complete an experimental driving scene. Your task is to drive through the scene as you normally would drive in the real world at 40 mph. As before, drive through the scenes in a normal fashion obeying all traffic signs and laws. Please do not deviate from the directed course. If you reach an intersection please obey all traffic signs and proceed straight through the intersection as you would under normal driving circumstances. Task One Your task is to drive through the scene, obeying all traffic signs, traffic laws, and directional signs. Please try to complete the scenarios as you would normally in the real world. Do not drive with undue aggression or undue conservatism. When the driving scene begins, the simulator vehicle will be stopped on the side of the roadway. Place the vehicle in ëdriveí, drive onto the roadway, and proceed through the driving environment at 40 mph. Task Two At two different times during the experiment you will be asked questions regarding your mental workload. This will be presented on the touch screen to your side. Please select the most applicable answer and please answer these questions honestly. At the end of the experimental driving scene, there will be two vehicles positioned across the roadway. When you reach these vehicles, please bring the vehicle to a complete stop, place it in ëparkí, and direct your attention to the investigator. This experiment session will take approximately 20 - 25 minutes. If you have any questions regarding your task in the experiment consult the experimenter. Otherwise, acknowledge that you are ready by telling the experimenter to begin the driving scene.
105
APPENDIX M
Experiment Two Session Instructions for the Simple Math and Complex Math groups
106
THE EFFECT OF DISTRACTION ON DRIVER BEHAVIOR EXPERIMENT INSTRUCTIONS
You are now asked to complete an experimental driving scene. Your task is to drive through the scene as you normally would drive in the real world at 40 mph. As before, drive through the scenes in a normal fashion obeying all traffic signs and laws. Please do not deviate from the directed course. If you reach an intersection please obey all traffic signs and proceed straight through the intersection as you would under normal driving circumstances. Task One Your task is to drive through the scene, obeying all traffic signs, traffic laws, and directional signs. Please try to complete the scenarios as you would normally in the real world. Do not drive with undue aggression or undue conservatism. When the driving scene begins, the simulator vehicle will be stopped on the side of the roadway. Place the vehicle in ëdriveí, drive onto the roadway, and proceed through the driving environment at 40 mph. Task Two You are asked to perform an addition task using two numbers as presented by the experimenter on the touch screen and then enter the correct answer within 8 seconds. For example, you may be asked to add 20 and 30. This task will be presented twice throughout your drive and each time the task will last approximately two minutes. Task Three At two different times during the experiment you will be asked questions regarding your mental workload. This will be presented on the touch screen to your side. Please select the most applicable answer and please answer these questions honestly. At the end of the experimental driving scene, there will be two vehicles positioned across the roadway. When you reach these vehicles, please bring the vehicle to a complete stop, place it in ëparkí, and direct your attention to the investigator. This experiment session will take approximately 20 - 25 minutes. If you have any questions regarding your task in the experiment consult the experimenter. Otherwise, acknowledge that you are ready by telling the experimenter to begin the driving scene.
107
APPENDIX N
Experiment Two Driving Data for the No Math, Simple Math, and Complex Math groups
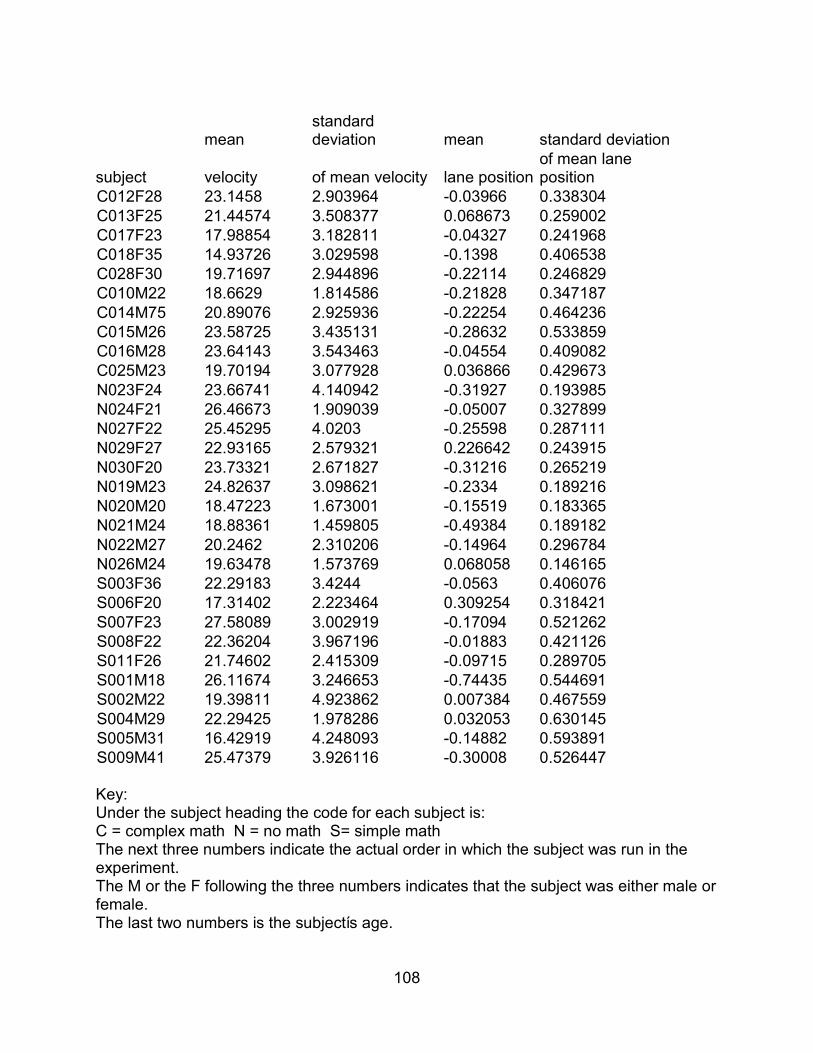
108
mean standard deviation mean standard deviation
subject velocity of mean velocity lane positionof mean lane position
C012F28 23.1458 2.903964 -0.03966 0.338304 C013F25 21.44574 3.508377 0.068673 0.259002 C017F23 17.98854 3.182811 -0.04327 0.241968 C018F35 14.93726 3.029598 -0.1398 0.406538 C028F30 19.71697 2.944896 -0.22114 0.246829 C010M22 18.6629 1.814586 -0.21828 0.347187 C014M75 20.89076 2.925936 -0.22254 0.464236 C015M26 23.58725 3.435131 -0.28632 0.533859 C016M28 23.64143 3.543463 -0.04554 0.409082 C025M23 19.70194 3.077928 0.036866 0.429673 N023F24 23.66741 4.140942 -0.31927 0.193985 N024F21 26.46673 1.909039 -0.05007 0.327899 N027F22 25.45295 4.0203 -0.25598 0.287111 N029F27 22.93165 2.579321 0.226642 0.243915 N030F20 23.73321 2.671827 -0.31216 0.265219 N019M23 24.82637 3.098621 -0.2334 0.189216 N020M20 18.47223 1.673001 -0.15519 0.183365 N021M24 18.88361 1.459805 -0.49384 0.189182 N022M27 20.2462 2.310206 -0.14964 0.296784 N026M24 19.63478 1.573769 0.068058 0.146165 S003F36 22.29183 3.4244 -0.0563 0.406076 S006F20 17.31402 2.223464 0.309254 0.318421 S007F23 27.58089 3.002919 -0.17094 0.521262 S008F22 22.36204 3.967196 -0.01883 0.421126 S011F26 21.74602 2.415309 -0.09715 0.289705 S001M18 26.11674 3.246653 -0.74435 0.544691 S002M22 19.39811 4.923862 0.007384 0.467559 S004M29 22.29425 1.978286 0.032053 0.630145 S005M31 16.42919 4.248093 -0.14882 0.593891 S009M41 25.47379 3.926116 -0.30008 0.526447 Key: Under the subject heading the code for each subject is: C = complex math N = no math S= simple math The next three numbers indicate the actual order in which the subject was run in the experiment. The M or the F following the three numbers indicates that the subject was either male or female. The last two numbers is the subjectís age.

109
APPENDIX O
Experiment Two Math Data for the Simple Math and Complex Math groups
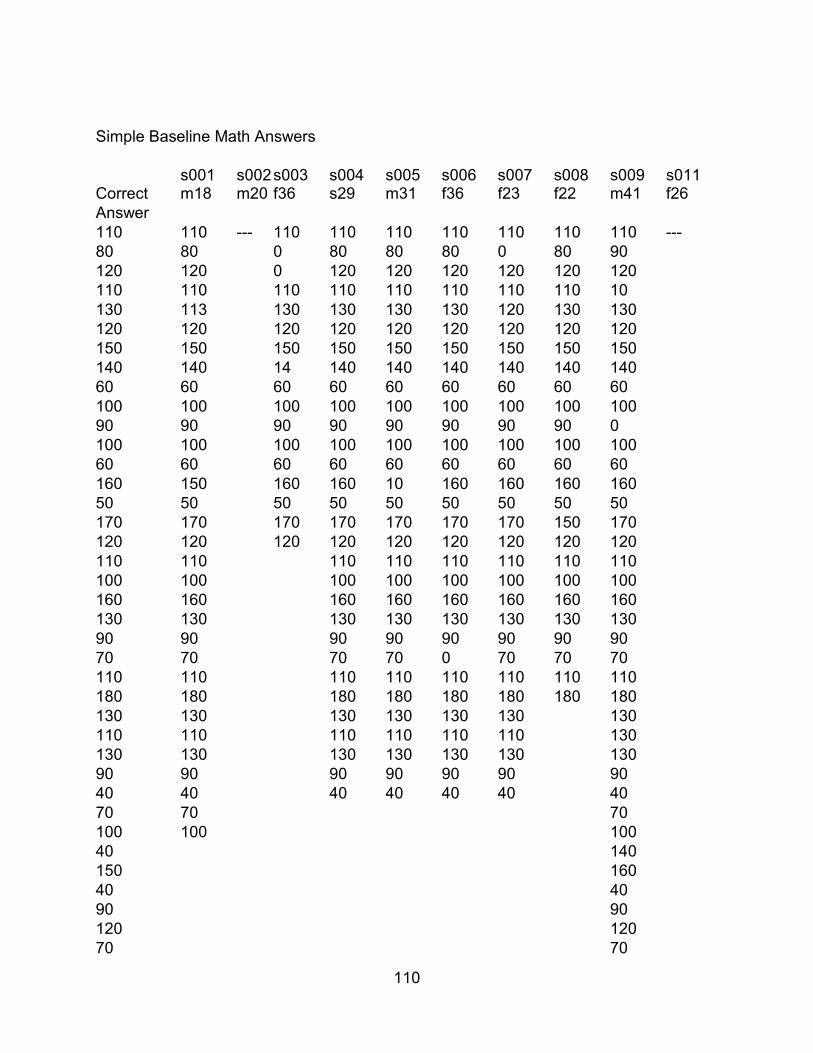
110
Simple Baseline Math Answers
Correct s001 m18
s002 m20
s003 f36
s004 s29
s005 m31
s006 f36
s007 f23
s008 f22
s009 m41
s011 f26
Answer 110 110 --- 110 110 110 110 110 110 110 --- 80 80 0 80 80 80 0 80 90 120 120 0 120 120 120 120 120 120 110 110 110 110 110 110 110 110 10 130 113 130 130 130 130 120 130 130 120 120 120 120 120 120 120 120 120 150 150 150 150 150 150 150 150 150 140 140 14 140 140 140 140 140 140 60 60 60 60 60 60 60 60 60 100 100 100 100 100 100 100 100 100 90 90 90 90 90 90 90 90 0 100 100 100 100 100 100 100 100 100 60 60 60 60 60 60 60 60 60 160 150 160 160 10 160 160 160 160 50 50 50 50 50 50 50 50 50 170 170 170 170 170 170 170 150 170 120 120 120 120 120 120 120 120 120 110 110 110 110 110 110 110 110 100 100 100 100 100 100 100 100 160 160 160 160 160 160 160 160 130 130 130 130 130 130 130 130 90 90 90 90 90 90 90 90 70 70 70 70 0 70 70 70 110 110 110 110 110 110 110 110 180 180 180 180 180 180 180 180 130 130 130 130 130 130 130 110 110 110 110 110 110 130 130 130 130 130 130 130 130 90 90 90 90 90 90 90 40 40 40 40 40 40 40 70 70 70 100 100 100 40 140 150 160 40 40 90 90 120 120 70 70
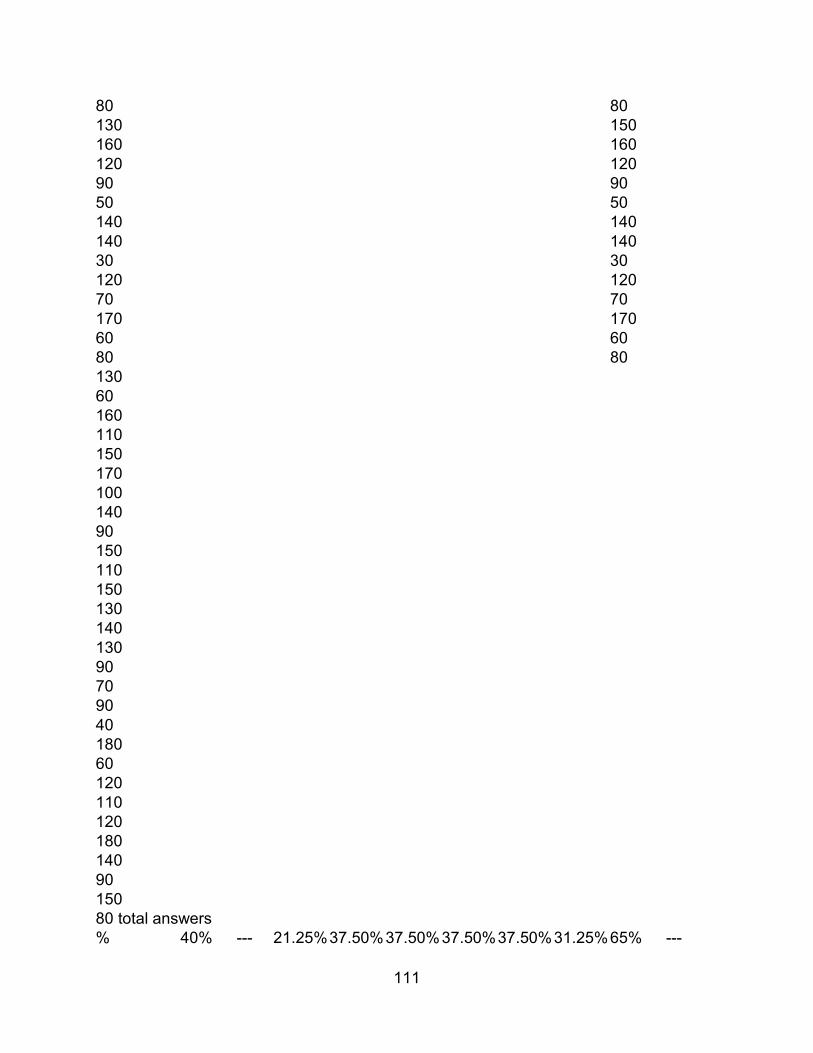
111
80 80 130 150 160 160 120 120 90 90 50 50 140 140 140 140 30 30 120 120 70 70 170 170 60 60 80 80 130 60 160 110 150 170 100 140 90 150 110 150 130 140 130 90 70 90 40 180 60 120 110 120 180 140 90 150 80 total answers % 40% --- 21.25% 37.50% 37.50%37.50%37.50%31.25% 65% ---

112
answered % correct 93.75% --- 82.35% 100% 96.67%96.67%93.33%96% 86.54% ---
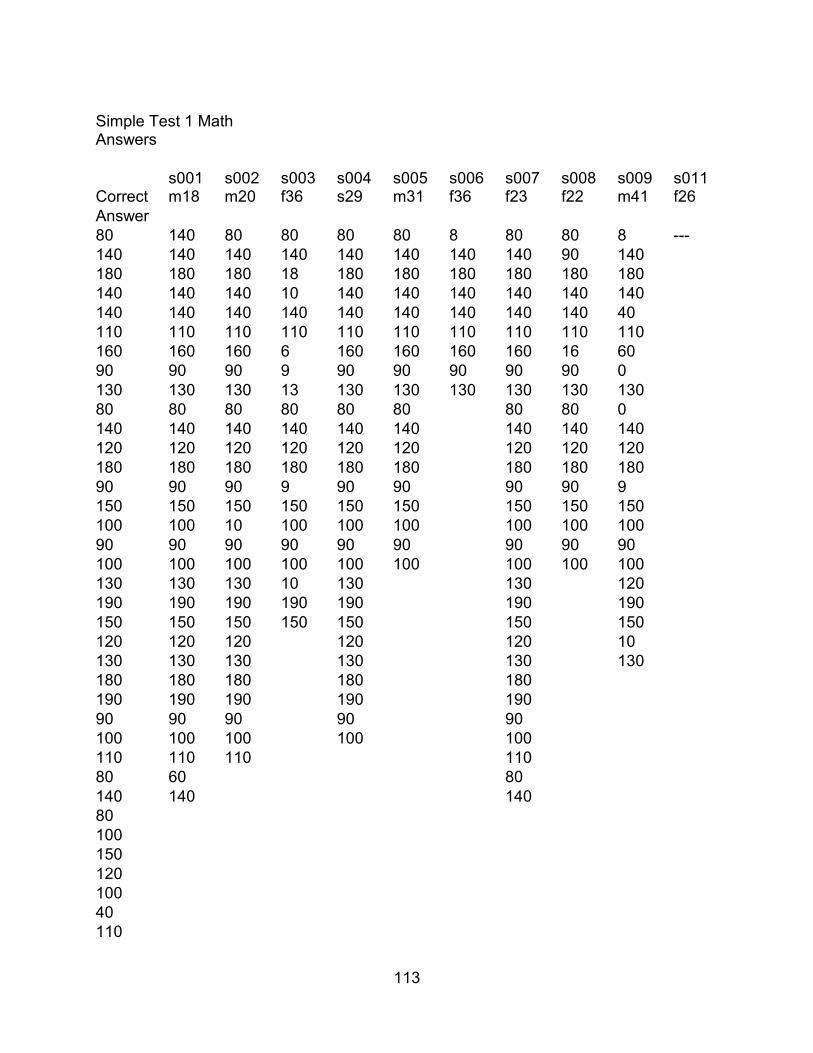
113
Simple Test 1 Math Answers
Correct s001 m18
s002 m20
s003 f36
s004 s29
s005 m31
s006 f36
s007 f23
s008 f22
s009 m41
s011 f26
Answer 80 140 80 80 80 80 8 80 80 8 --- 140 140 140 140 140 140 140 140 90 140 180 180 180 18 180 180 180 180 180 180 140 140 140 10 140 140 140 140 140 140 140 140 140 140 140 140 140 140 140 40 110 110 110 110 110 110 110 110 110 110 160 160 160 6 160 160 160 160 16 60 90 90 90 9 90 90 90 90 90 0 130 130 130 13 130 130 130 130 130 130 80 80 80 80 80 80 80 80 0 140 140 140 140 140 140 140 140 140 120 120 120 120 120 120 120 120 120 180 180 180 180 180 180 180 180 180 90 90 90 9 90 90 90 90 9 150 150 150 150 150 150 150 150 150 100 100 10 100 100 100 100 100 100 90 90 90 90 90 90 90 90 90 100 100 100 100 100 100 100 100 100 130 130 130 10 130 130 120 190 190 190 190 190 190 190 150 150 150 150 150 150 150 120 120 120 120 120 10 130 130 130 130 130 130 180 180 180 180 180 190 190 190 190 190 90 90 90 90 90 100 100 100 100 100 110 110 110 110 80 60 80 140 140 140 80 100 150 120 100 40 110
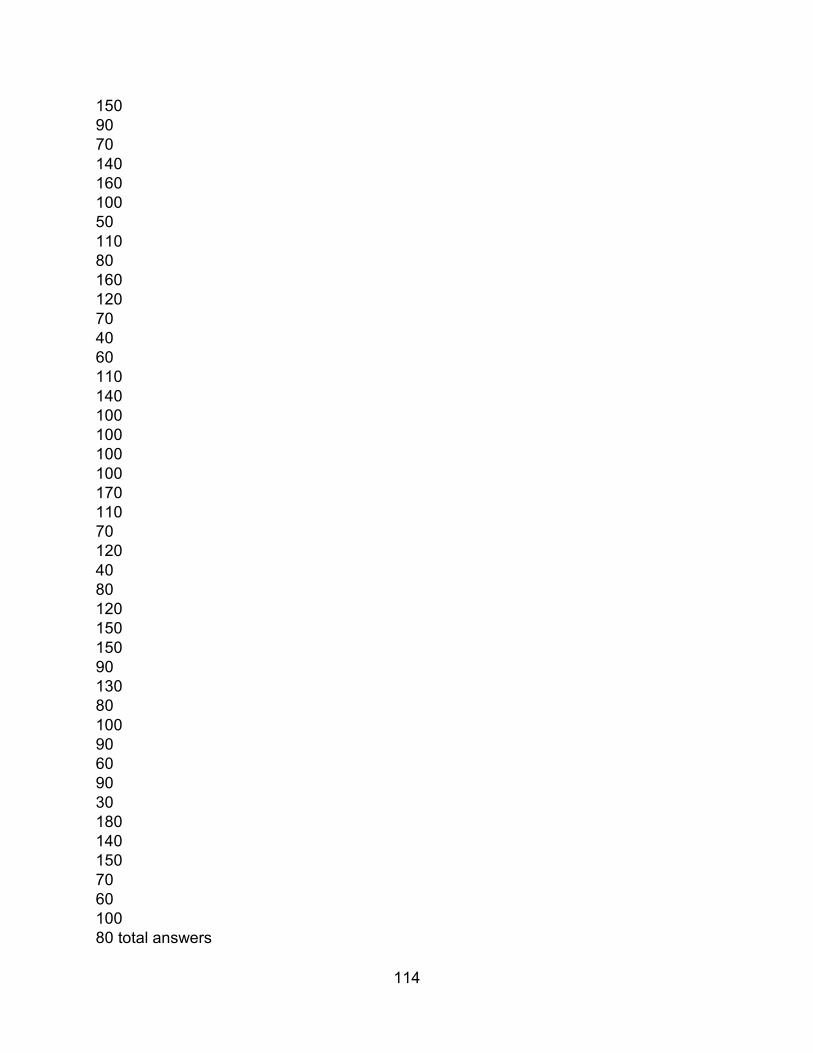
114
150 90 70 140 160 100 50 110 80 160 120 70 40 60 110 140 100 100 100 100 170 110 70 120 40 80 120 150 150 90 130 80 100 90 60 90 30 180 140 150 70 60 100 80 total answers

115
% answered 37.50% 35% 26.25% 33.75% 22.50%11.25%37.50%22.50% 28.75% --- % correct 93.33% 96.43%66.67% 100% 100% 88.89%100% 88.89% 65.22% ---
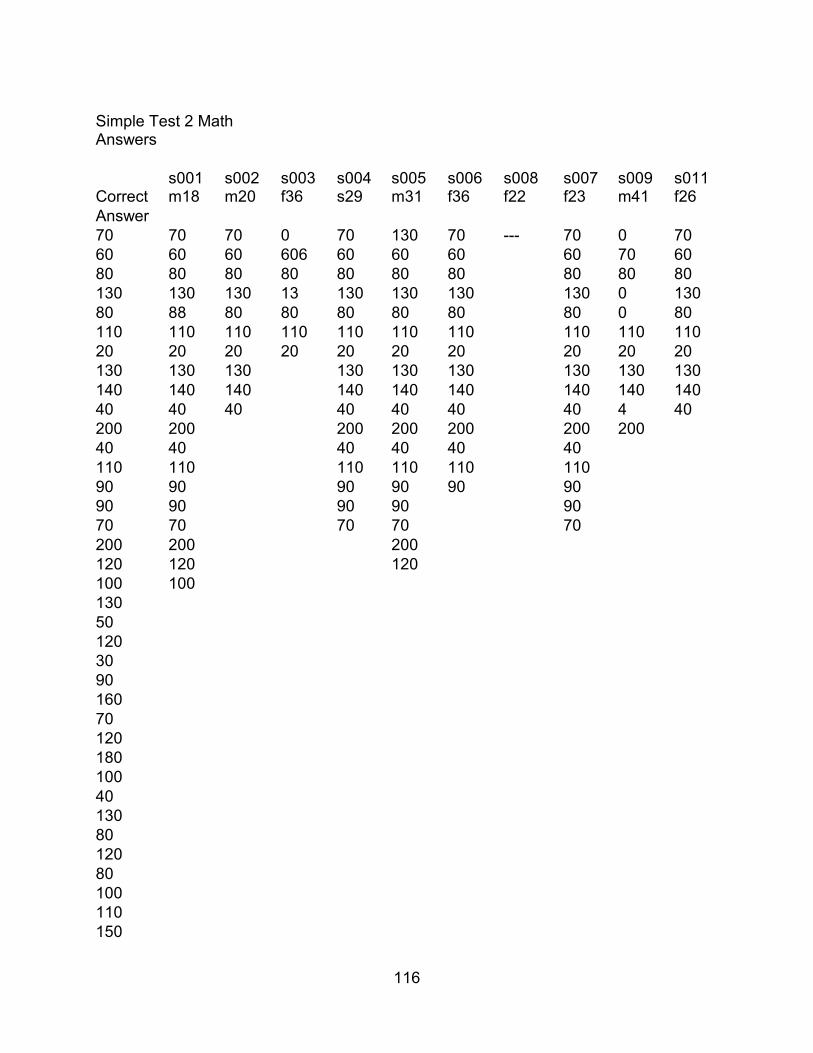
116
Simple Test 2 Math Answers
Correct s001 m18
s002 m20
s003 f36
s004 s29
s005 m31
s006 f36
s008 f22
s007 f23
s009 m41
s011 f26
Answer 70 70 70 0 70 130 70 --- 70 0 70 60 60 60 606 60 60 60 60 70 60 80 80 80 80 80 80 80 80 80 80 130 130 130 13 130 130 130 130 0 130 80 88 80 80 80 80 80 80 0 80 110 110 110 110 110 110 110 110 110 110 20 20 20 20 20 20 20 20 20 20 130 130 130 130 130 130 130 130 130 140 140 140 140 140 140 140 140 140 40 40 40 40 40 40 40 4 40 200 200 200 200 200 200 200 40 40 40 40 40 40 110 110 110 110 110 110 90 90 90 90 90 90 90 90 90 90 90 70 70 70 70 70 200 200 200 120 120 120 100 100 130 50 120 30 90 160 70 120 180 100 40 130 80 120 80 100 110 150

117
40 100 160 150 60 80 80 120 120 120 160 190 130 120 160 130 100 200 180 110 100 150 160 50 80 180 190 160 100 120 170 50 140 90 100 70 190 40 120 160 30 80 80 80 total answers
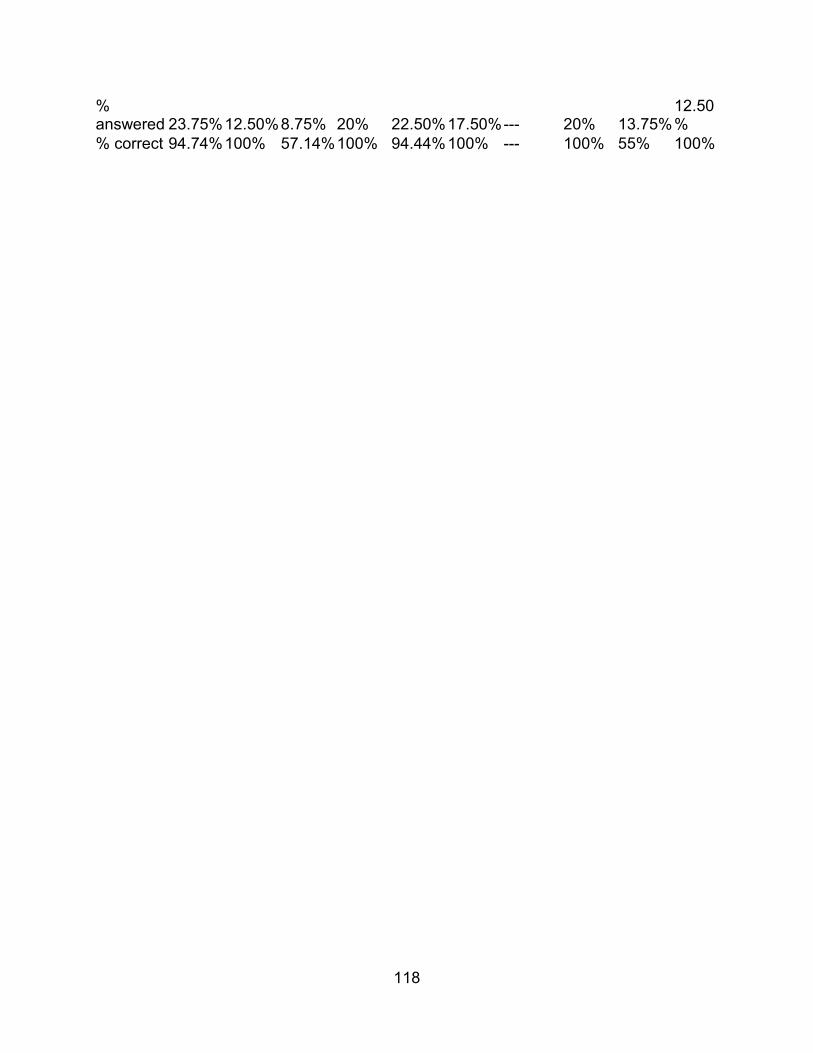
118
% answered 23.75% 12.50%8.75% 20% 22.50% 17.50% --- 20% 13.75%
12.50%
% correct 94.74% 100% 57.14% 100% 94.44% 100% --- 100% 55% 100%
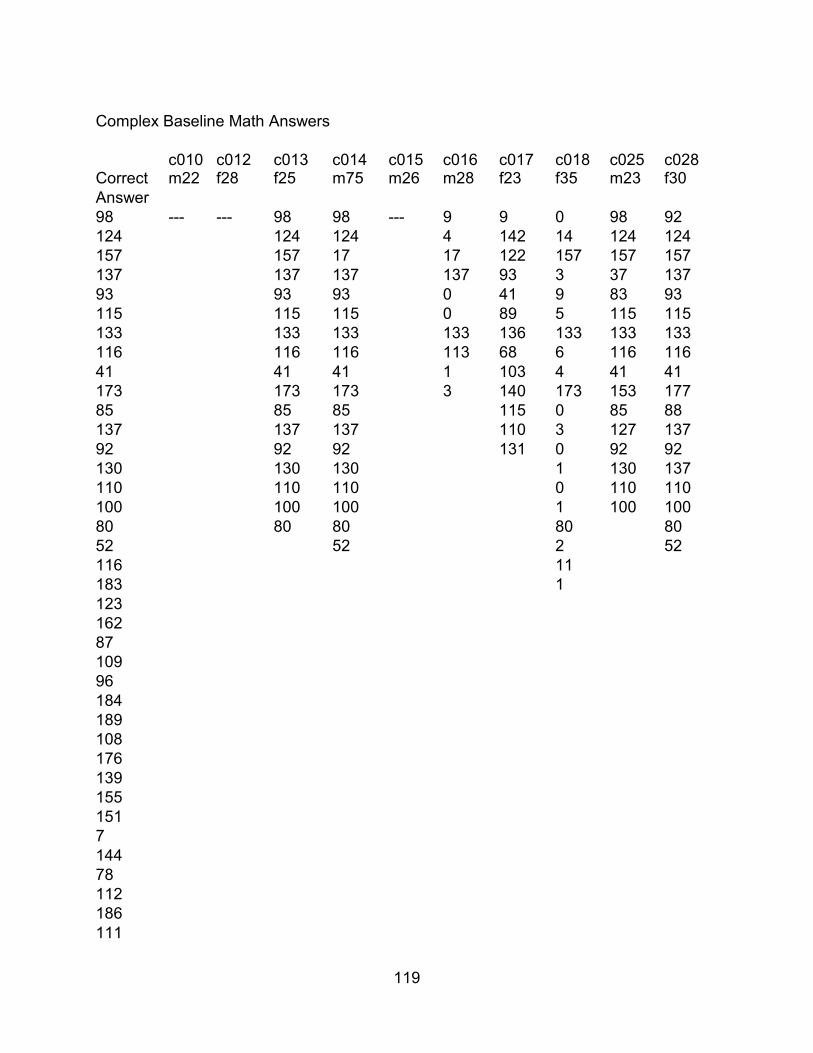
119
Complex Baseline Math Answers
Correct c010 m22
c012 f28
c013 f25
c014 m75
c015 m26
c016 m28
c017 f23
c018 f35
c025 m23
c028 f30
Answer 98 --- --- 98 98 --- 9 9 0 98 92 124 124 124 4 142 14 124 124 157 157 17 17 122 157 157 157 137 137 137 137 93 3 37 137 93 93 93 0 41 9 83 93 115 115 115 0 89 5 115 115 133 133 133 133 136 133 133 133 116 116 116 113 68 6 116 116 41 41 41 1 103 4 41 41 173 173 173 3 140 173 153 177 85 85 85 115 0 85 88 137 137 137 110 3 127 137 92 92 92 131 0 92 92 130 130 130 1 130 137 110 110 110 0 110 110 100 100 100 1 100 100 80 80 80 80 80 52 52 2 52 116 11 183 1 123 162 87 109 96 184 189 108 176 139 155 151 7 144 78 112 186 111
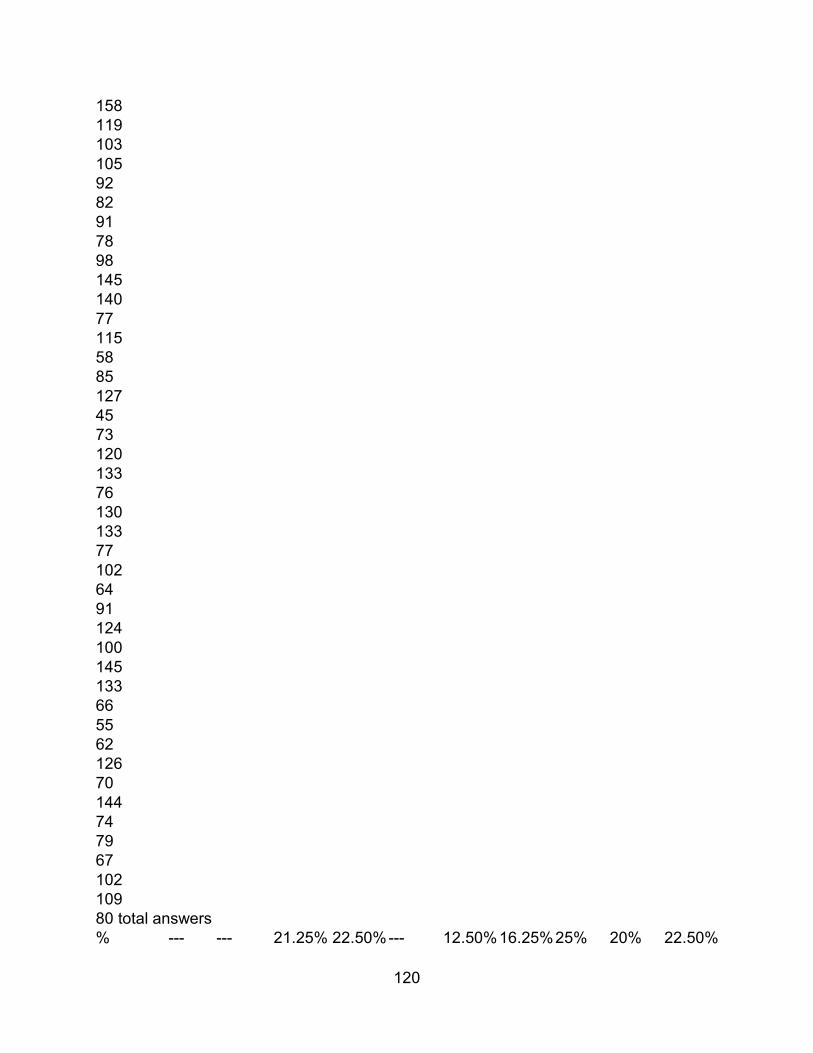
120
158 119 103 105 92 82 91 78 98 145 140 77 115 58 85 127 45 73 120 133 76 130 133 77 102 64 91 124 100 145 133 66 55 62 126 70 144 74 79 67 102 109 80 total answers % --- --- 21.25% 22.50%--- 12.50%16.25%25% 20% 22.50%

121
answered% correct --- --- 100% 94.44%--- 20% 0% 20% 75% 77.78%
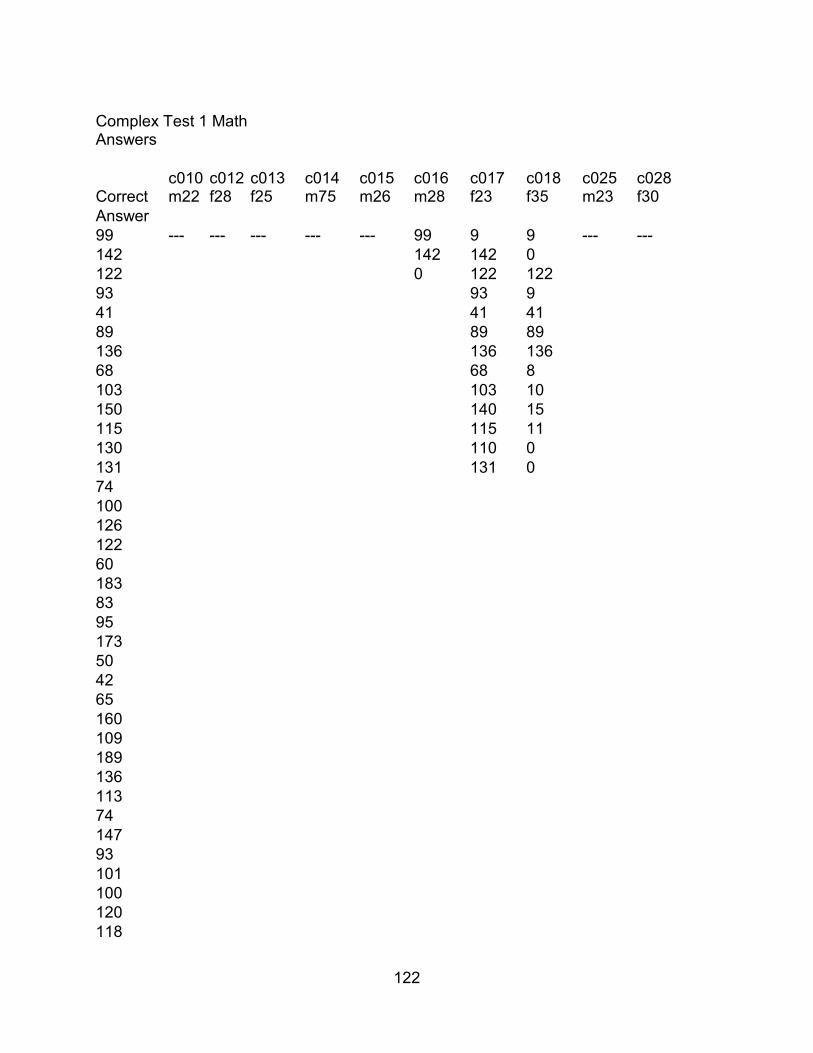
122
Complex Test 1 Math Answers
Correct c010 m22
c012 f28
c013 f25
c014 m75
c015 m26
c016 m28
c017 f23
c018 f35
c025 m23
c028 f30
Answer 99 --- --- --- --- --- 99 9 9 --- --- 142 142 142 0 122 0 122 122 93 93 9 41 41 41 89 89 89 136 136 136 68 68 8 103 103 10 150 140 15 115 115 11 130 110 0 131 131 0 74 100 126 122 60 183 83 95 173 50 42 65 160 109 189 136 113 74 147 93 101 100 120 118

123
85 77 157 112 167 76 95 125 38 146 103 105 35 75 114 31 82 151 154 81 93 102 160 38 112 54 166 111 109 193 111 95 141 162 169 86 136 163 88 110 51 115 106 80 total

124
answers % answered --- --- --- --- --- 3.75% 16.25%16.25% --- --- % correct --- --- --- --- --- 66.67% 76.92%30.76% --- ---
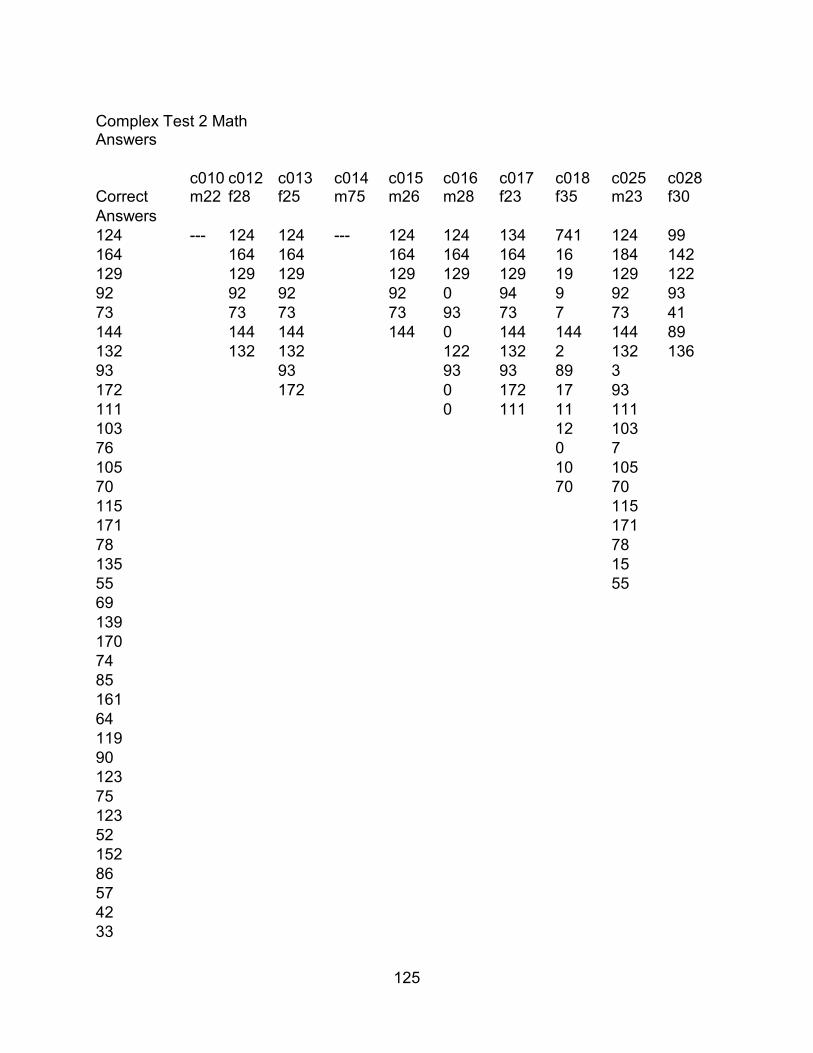
125
Complex Test 2 Math Answers
Correct c010 m22
c012 f28
c013 f25
c014 m75
c015 m26
c016 m28
c017 f23
c018 f35
c025 m23
c028 f30
Answers 124 --- 124 124 --- 124 124 134 741 124 99 164 164 164 164 164 164 16 184 142 129 129 129 129 129 129 19 129 122 92 92 92 92 0 94 9 92 93 73 73 73 73 93 73 7 73 41 144 144 144 144 0 144 144 144 89 132 132 132 122 132 2 132 136 93 93 93 93 89 3 172 172 0 172 17 93 111 0 111 11 111 103 12 103 76 0 7 105 10 105 70 70 70 115 115 171 171 78 78 135 15 55 55 69 139 170 74 85 161 64 119 90 123 75 123 52 152 86 57 42 33

126
143 145 120 58 147 148 138 117 128 71 83 77 105 178 134 96 161 136 108 108 144 66 108 107 122 79 162 98 104 98 77 169 63 36 60 185 115 77 44 152 148 131 72 80 total answers
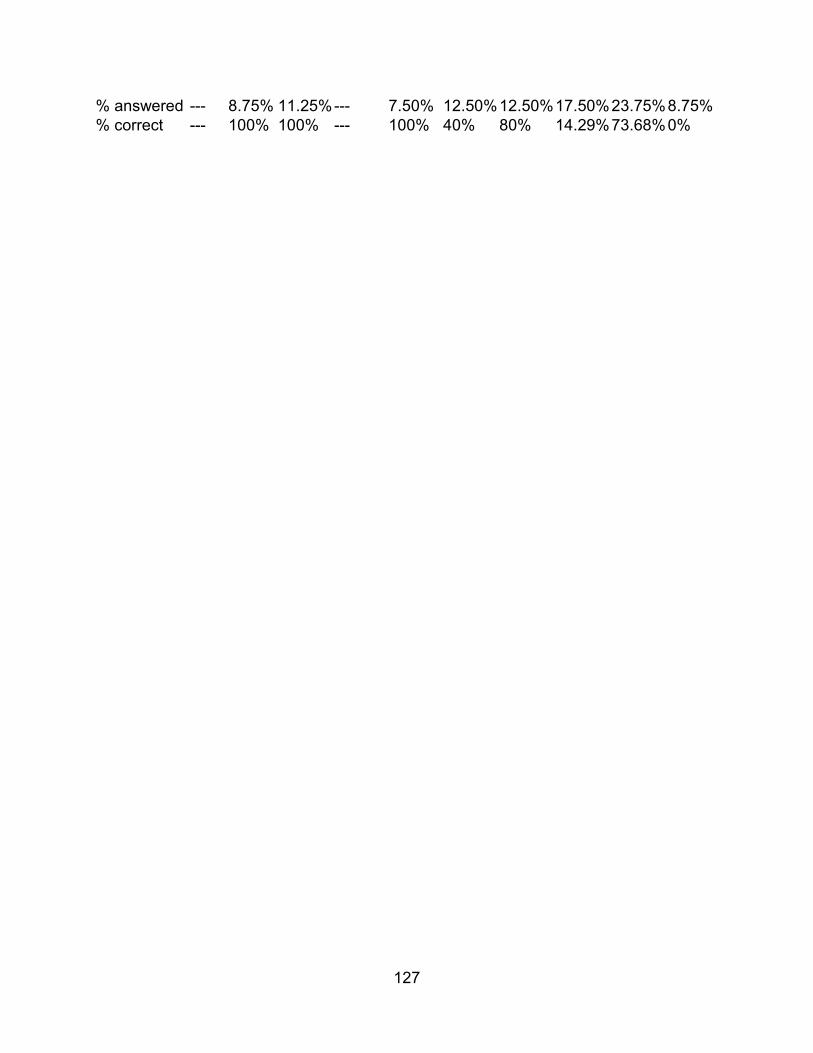
127
% answered --- 8.75% 11.25%--- 7.50% 12.50%12.50% 17.50% 23.75% 8.75% % correct --- 100% 100% --- 100% 40% 80% 14.29% 73.68% 0%