Embed Size (px)
Citation preview

Technical Report Documentation Page 1. Report No. FHWA/TX-15/0-6811-1
2. Government Accession No.
3. Recipient's Catalog No.
4. Title and Subtitle REDUCING LANE AND SHOULDER WIDTH TO PERMIT AN ADDITIONAL LANE ON A FREEWAY: TECHNICAL REPORT
5. Report Date Published: March 2015 6. Performing Organization Code
7. Author(s) Karen Dixon, Kay Fitzpatrick, Raul Avelar, Marcie Perez, Stephen Ranft, Roma Stevens, Steven Venglar and Tony Voigt
8. Performing Organization Report No. Report 0-6811-1
9. Performing Organization Name and Address Texas A&M Transportation Institute College Station, Texas 77843-3135
10. Work Unit No. (TRAIS) 11. Contract or Grant No. Project 0-6811
12. Sponsoring Agency Name and Address Texas Department of Transportation Research and Technology Implementation Office 125 E. 11th Street Austin, Texas 78701-2483
13. Type of Report and Period Covered Technical Report: January 2014 – March 2015 14. Sponsoring Agency Code
15. Supplementary Notes Project performed in cooperation with the Texas Department of Transportation and the Federal Highway Administration. Project Title: Reducing Lane and Shoulder Width to Permit an Additional Lane on a Freeway URL: http://tti.tamu.edu/documents/0-6811-1.pdf 16. Abstract
This research effort identified the operational and safety implications of using reduced lane and shoulder widths for a variety of freeway configurations. The research team used speed, crash, and geometric data for freeways in Dallas, Houston, and San Antonio.
The operational analysis identified an increase of about 2.2 mph in speed for a 12-ft lane as compared to an 11-ft lane. The shoulder width is significant when the adjacent lane is 11-ft wide, but not when it is 12-ft wide which suggests that left shoulder width is more important with a reduced lane width. Operating speeds on Texas freeways are 2 mph lower during night time (with roadside lighting present) than during the day. Speeds were higher (by 1.5 mph) on the weekends (Saturday) than on the week day studied (Wednesday).
The safety analysis determined a crash difference when comparing freeways with 12 ft to 11 ft lanes. There is a reduction in KAB crashes that ranges from 5% for 2-lane freeways up to 12% for 5-lane freeways, other roadway characteristics equal. Similarly, there are crash reductions associated with each additional lane, increased left shoulder widths, and increased right shoulder widths. While constructing an additional lane is beneficial in terms of safety, a larger safety detriment caused by narrow lanes or shoulders annuls such benefit. However, if it is possible to increase the total paved width when adding a travel lane, the safety model allows the analyst to identify lane and shoulder widths so that the number of crashes along the corridor will expectedly remain unchanged. 17. Key Words Freeway, Lane Width, Shoulder Width, Operating Speed, Crash Reduction
18. Distribution Statement No restrictions. This document is available to the public through NTIS: National Technical Information Service Alexandria, Virginia http://www.ntis.gov
19. Security Classif. (of this report) Unclassified
20. Security Classif. (of this page) Unclassified
21. No. of Pages 104
22. Price
Form DOT F 1700.7 (8-72) Reproduction of completed page authorized


REDUCING LANE AND SHOULDER WIDTH TO PERMIT AN ADDITIONAL LANE ON A FREEWAY: TECHNICAL REPORT
by
Karen Dixon, Ph.D., P.E. Research Supervisor
Texas A&M Transportation Institute
Kay Fitzpatrick, Ph.D., P.E. Researcher
Texas A&M Transportation Institute
and
Raul Avelar, Ph.D. Researcher
Texas A&M Transportation Institute
With contributions from Marcie Perez Stephen Ranft
Roma Stevens, P.E. Steven Venglar, P.E.
Tony Voigt, P.E.
Report 0-6811-1 Project 0-6811
Project Title: Reducing Lane and Shoulder Width to Permit an Additional Lane on a Freeway
Performed in cooperation with the Texas Department of Transportation
and the Federal Highway Administration
Published: March 2015
TEXAS A&M TRANSPORTATION INSTITUTE College Station, Texas 77843-3135


v
DISCLAIMER
This research was performed in cooperation with the Texas Department of Transportation
(TxDOT) and the Federal Highway Administration (FHWA). The contents of this report reflect
the views of the authors, who are responsible for the facts and the accuracy of the data presented
herein. The contents do not necessarily reflect the official view or policies of the FHWA or
TxDOT. This report does not constitute a standard, specification, or regulation.

vi
ACKNOWLEDGMENTS
This project was conducted in cooperation with TxDOT and FHWA. The authors thank
Darrin Jensen, the Research Project Manager for the TxDOT Research & Technology
Implementation Office. The authors would also like to express their gratitude to Jonathan Bean,
Bill Brudnick, Bill Knowles, and Andrew Oberlander, the members of the project monitoring
committee.
vii
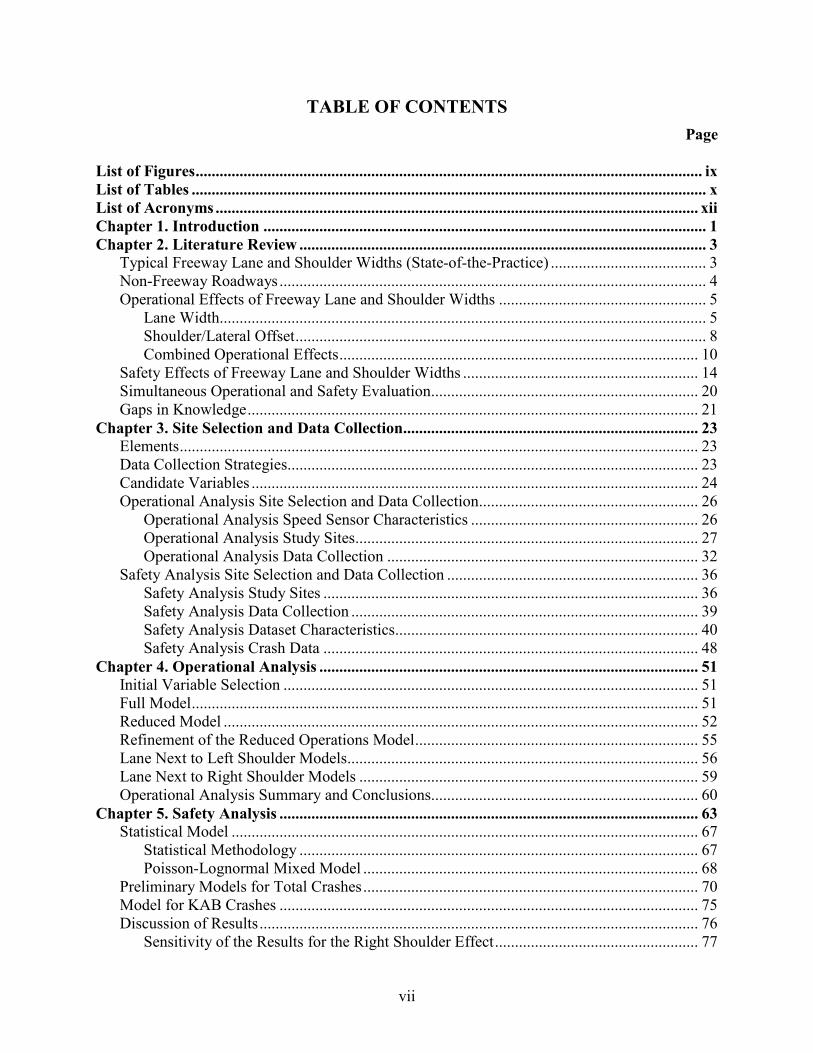
TABLE OF CONTENTS Page
List of Figures ............................................................................................................................... ix List of Tables ................................................................................................................................. x List of Acronyms ......................................................................................................................... xii Chapter 1. Introduction ............................................................................................................... 1 Chapter 2. Literature Review ...................................................................................................... 3
Typical Freeway Lane and Shoulder Widths (State-of-the-Practice) ....................................... 3 Non-Freeway Roadways ........................................................................................................... 4 Operational Effects of Freeway Lane and Shoulder Widths .................................................... 5
Lane Width.......................................................................................................................... 5 Shoulder/Lateral Offset ....................................................................................................... 8 Combined Operational Effects .......................................................................................... 10
Safety Effects of Freeway Lane and Shoulder Widths ........................................................... 14 Simultaneous Operational and Safety Evaluation................................................................... 20 Gaps in Knowledge ................................................................................................................. 21
Chapter 3. Site Selection and Data Collection.......................................................................... 23 Elements .................................................................................................................................. 23 Data Collection Strategies....................................................................................................... 23 Candidate Variables ................................................................................................................ 24 Operational Analysis Site Selection and Data Collection ....................................................... 26
Operational Analysis Speed Sensor Characteristics ......................................................... 26 Operational Analysis Study Sites...................................................................................... 27 Operational Analysis Data Collection .............................................................................. 32
Safety Analysis Site Selection and Data Collection ............................................................... 36 Safety Analysis Study Sites .............................................................................................. 36 Safety Analysis Data Collection ....................................................................................... 39 Safety Analysis Dataset Characteristics ............................................................................ 40 Safety Analysis Crash Data .............................................................................................. 48
Chapter 4. Operational Analysis ............................................................................................... 51 Initial Variable Selection ........................................................................................................ 51 Full Model ............................................................................................................................... 51 Reduced Model ....................................................................................................................... 52 Refinement of the Reduced Operations Model ....................................................................... 55 Lane Next to Left Shoulder Models........................................................................................ 56 Lane Next to Right Shoulder Models ..................................................................................... 59 Operational Analysis Summary and Conclusions................................................................... 60
Chapter 5. Safety Analysis ......................................................................................................... 63 Statistical Model ..................................................................................................................... 67
Statistical Methodology .................................................................................................... 67 Poisson-Lognormal Mixed Model .................................................................................... 68
Preliminary Models for Total Crashes .................................................................................... 70 Model for KAB Crashes ......................................................................................................... 75 Discussion of Results .............................................................................................................. 76
Sensitivity of the Results for the Right Shoulder Effect ................................................... 77

viii
Safety Associated with Freeway Sections ........................................................................ 78 Summary and Conclusions ..................................................................................................... 82
Chapter 6. Conclusions and Recommendations ....................................................................... 83 References .................................................................................................................................... 89

ix
LIST OF FIGURES
Page Figure 1. Outside Shoulder Width. ............................................................................................... 19 Figure 2. Dallas Operational Assessment Sites. ........................................................................... 28 Figure 3. Houston Operational Assessment Sites. ........................................................................ 30 Figure 4. San Antonio Operational Assessment Sites. ................................................................. 31 Figure 5. Number of Speed Measurements by Space to the Left of the Lane. ............................. 36 Figure 6. Number of Speed Measurements by Space to the Right of the Lane. ........................... 36 Figure 7. Dallas Safety Assessment Sites. .................................................................................... 37 Figure 8. Houston Safety Assessment Sites. ................................................................................. 38 Figure 9. San Antonio Safety Assessment Sites. .......................................................................... 39 Figure 10. Frequency by Right Shoulder Width. .......................................................................... 41 Figure 11. Satellite Image for Site 19-R-SA-4. ............................................................................ 42 Figure 12. Satellite Image for Sites 04-S-HO-3 and 20-S-HO-3: January 2010. ......................... 50 Figure 13. Satellite Image for Sites 04-S-HO-3 and 20-S-HO-3: March 2011. ........................... 50 Figure 14. Average Speed per Site for Lane Next to Left Shoulder by Left Shoulder
Width....................................................................................................................................... 57 Figure 15. Crashes per Mile vs. AADT. ....................................................................................... 63 Figure 16. (Yearly Crashes per VMT) × 1000 vs. Average Lane Width. .................................... 64 Figure 17. (Yearly Crashes per VMT) × 1000 vs. Left Shoulder Width. ..................................... 65 Figure 18. (Yearly Crashes per VMT) × 1000 vs. Right Shoulder Width. ................................... 66 Figure 19. Street View of Site with Narrowest Right Shoulder Width. ....................................... 67 Figure 20. Left Shoulder Width vs. Average Lane Width. ........................................................... 73 Figure 21. Left Shoulder Width vs. All-Lanes Width (All_Lanes_W) ........................................ 74

x
LIST OF TABLES
Page Table 1. Sample Freeway Design Criteria for Other States. ........................................................... 4 Table 2. FFS Adjustment Based on Freeway Lane Width.............................................................. 6 Table 3. FFS Reduction (mph) for Freeway Right-Side Lateral Clearance. .................................. 9 Table 4. Maximum Service Flow Rates (pc/hr/ln) for Freeways. ................................................. 10 Table 5. TTI Speed Prediction Equations for Freeways and Multilane Highways. ..................... 12 Table 6. 2010 HCM Variables Considered in the TTI Speed Prediction Equations. ................... 13 Table 7. TTI Speed Prediction Equation Summary Statistics for Site Characteristics. ................ 13 Table 8. Crash Effects of Adding Lanes by Narrowing Existing Lanes and Shoulders. .............. 15 Table 9. Lane Width CMF Values for Texas Urban Freeways (Injury + Fatal Crashes). ............ 16 Table 10. Outside (Right) Shoulder Width CMF Values for Texas Urban Freeways
(Injury + Fatal Crashes). ......................................................................................................... 17 Table 11. Inside (Left) Shoulder Width CMF Values for Texas Urban Freeways (Injury +
Fatal Crashes).......................................................................................................................... 17 Table 12. Lane Width CMF Values for Three-State Freeway Model (Injury + Fatal
Crashes)................................................................................................................................... 18 Table 13. Inside Shoulder Width CMF Values for Three-State Freeway Model (Injury +
Fatal Crashes).......................................................................................................................... 20 Table 14. Data Collection Elements and Sources. ........................................................................ 24 Table 15. Description of Candidate Geometric Variables. ........................................................... 25 Table 16. Description of Candidate Supplemental Variables. ...................................................... 25 Table 17. Number of Lanes in Database. ...................................................................................... 28 Table 18. Dallas Speed Study Sites. ............................................................................................. 29 Table 19. Houston Speed Study Sites. .......................................................................................... 30 Table 20. San Antonio Speed Study Sites. ................................................................................... 32 Table 21. Sunrise and Sunset Times for Dallas, Houston, and San Antonio. ............................... 34 Table 22. Number of Speed Measurements by Number of Freeway Lanes. ................................ 34 Table 23. Range of Values for Key Variables. ............................................................................. 35 Table 24. Number of Speed Measurements by Posted Speed Limit............................................. 35 Table 25. Distribution of Sites by Geometry Changes during the Analysis Period. .................... 42 Table 26. Distribution of Sites by Number of Time Periods for Analysis. .................................. 43 Table 27. Distribution of Sites by Length of Time Periods Available for Analysis. .................... 44 Table 28. Number of Segment-Periods Available for Analysis by City and Average Lane
Width....................................................................................................................................... 44 Table 29. Dallas Safety Study Sites. ............................................................................................. 45 Table 30. Houston Safety Study Sites........................................................................................... 46 Table 31. San Antonio Safety Study Sites. ................................................................................... 47 Table 32. Summary Statistics for Available Dataset for Years 2010–2013 (n=536). .................. 49 Table 33. Parameter Estimates for Full Model. ............................................................................ 53 Table 34. Parameter Estimates for Reduced Model...................................................................... 54 Table 35. Parameter Estimates for Refined (Final) Reduced Operations Model. ........................ 55 Table 36. Parameter Estimates for 12-ft Lane Next to Left Shoulder. ......................................... 58 Table 37. Parameter Estimates for 11-ft Lane Next to Left Shoulder. ......................................... 58

xi
Table 38. Parameter Estimates for 12-ft Lane Next to Right Shoulder. ....................................... 59 Table 39. Parameter Estimates for 11-ft Lane Next to Right Shoulder. ....................................... 60 Table 40. Adjustment to FFS for Left-Most Lane Due to Left-Side Lateral Clearance on
Freeway with 11-ft Lane Based on Findings from Evaluation that Focused on the Impact of Left Shoulder Width on Left-Most Lane. ............................................................... 62
Table 41. Full Model Estimates. ................................................................................................... 71 Table 42. Reduced Total Crash Model Estimates. ........................................................................ 72 Table 43. Final Reduced Model Estimates for Total Crashes ...................................................... 74 Table 44. Final Model Estimates for KAB Crashes. .................................................................... 75 Table 45. Safety of Lane Width (KAB Crashes). ......................................................................... 76 Table 46. Safety Change per Additional Lane (KAB Crashes). ................................................... 77 Table 47. Changes in Cross Section and Crashes for Site 13-R-SA-3. ........................................ 78 Table 48. Final Freeway Operating Speed Predictive Equation. .................................................. 86 Table 49. Texas Freeway Crash Prediction Models for Lane and Shoulder Width
Changes. .................................................................................................................................. 87

xii
LIST OF ACRONYMS
Abbreviation or Acronym Description
AADT Annual Average Daily Traffic CMF Crash Modification Factor / Function CRIS Crash Records Information System DA Dallas EB Empirical Bayes FFS Free Flow Speed HCM Highway Capacity Manual HOV High Occupancy Vehicle (lane) HSM Highway Safety Manual KAB Fatal and serious injury crashes KABCO Total crashes (severity scale) NB Negative Binomial pc/hr/ln Passenger cars per hour per lane RHiNo Road-Highway Inventory Network SPF Safety Performance Functions TMC Traffic Management Center TRB Transportation Research Board TxDOT Texas Department of Transportation VMT Vehicle miles traveled

1
CHAPTER 1. INTRODUCTION
As the demand for additional capacity on urban Texas freeways continues to increase,
there is a need to better understand how to optimize the lane and shoulder configurations to
improve capacity without adversely impacting the operating speed or increasing crashes. The
overall objective for this research effort was to identify the operational and safety implications of
using reduced lane and shoulder widths for a variety of freeway configurations. To effectively
assess the influence of the geometric features, the operational analysis only incorporated
uncongested speed data. The research team used detailed speed data, acquired from a variety of
sensors located along freeway corridors in Dallas, Houston, and San Antonio. In addition, the
evaluation of the safety implications of narrowed freeway lane and shoulder widths used crash
data that extended from 2010 to 2013. Using exploratory analysis and statistical evaluations, the
research team ultimately assessed how influential the various lane and shoulder widths can be on
the overall corridor.
This report includes a literature review (Chapter 2) of operational and safety studies
related to freeway lane and shoulder widths. Included in the literature review is a summary of
typical lane and shoulder width values followed by a review of the studied operational effects of
lane and shoulder widths. Similarly, the corresponding safety effects are then summarized. In
some cases, the operational and safety effects have been jointly evaluated, so the literature
review concludes with a summary of this literature.
Chapter 3 identifies the candidate data collection elements followed by a review of site
identification and selection for this study. The detailed analysis of operational and safety effects
of freeway lane and shoulder widths are then included in Chapter 4 and 5, respectively. The
report concludes with a summary of findings (Chapter 6). This concluding chapter also
highlights the individual findings and presents equations that can be used to assess unique lane
and shoulder width configurations. A companion spreadsheet is available to simplify these
calculations.


3
CHAPTER 2. LITERATURE REVIEW
TYPICAL FREEWAY LANE AND SHOULDER WIDTHS (STATE-OF-THE-PRACTICE)
A Policy on Geometric Design of Highways and Streets (AASHTO, 2011), the standard
highway design reference document in the United States, recommends lane and shoulder widths
for freeway facilities. This document, commonly referred to as the Green Book, identifies unique
features for urban freeways that are depressed, elevated, ground-level, or a combination of these
three configurations. The Green Book recommended dimensions for urban freeway corridors
include lane widths of 12 ft, right shoulder widths of 10 ft, left shoulder widths of 4 ft for
corridors with 2 lanes in each direction, and 10 ft for corridors with 3 or more lanes in each
direction.
In Texas, the Roadway Design Manual (TxDOT, 2013) establishes the criteria for
roadway dimensions. It indicates that lane widths for high-speed facilities such as freeways
should have a minimum width of 12 ft (3.6 meters). In addition, the Manual indicates that inside
shoulders should be 4 ft (1.2 meters) wide at 4 lane sections or 10 ft (3.0 meters) wide at
locations with 6 or more lanes, while outside shoulders should be 10 ft (3.0 meters) wide. These
recommendations are consistent with the Green Book values. This Texas design criteria further
indicates that at locations with sight distance constraints due to horizontal curvature, the shoulder
width on the inside of the curve may be increased to 8 ft (2.4 meters) and the shoulder width on
the outside of the curve decreased to 2 or 4 ft (0.6 or 1.2 meters).
The highway design standards for states may vary, but the freeway lane and shoulder
widths generally comply with the Green Book recommendations. As an example, the freeway
lane and shoulder width design criteria for a sample of states with major urban freeways are
presented in Table 1. As shown, the travel lane width of 12 ft (3.6 meters) is consistent between
agencies; however, the shoulder widths vary. In California, for example the paved shoulder
width is defined as the minimum continuous usable width and wider values are encouraged. This
width varies from 5 up to 10 ft depending on location and roadway cross-section.

4
Table 1. Sample Freeway Design Criteria for Other States.
State Lane
Width (ft)
Shoulder Width (ft) Source Description(1) Paved Left Paved Right
California 12 2 lanes 5 8(2)
(Caltrans, 2012) 3 or more lanes 10 10
Florida 12 2 lanes 4 10
(FDOT, 2014) 3 or more lanes 10 10 HOV lane 10 N/A
Georgia 12 Freeways or Interstates 10 12 (GDOT, 2013)
Nevada 12 Freeways or Interstates 8 desirable 4 minimum
12 desirable 8 minimum (NVDOT, 2011)
New York 12
General 4 10 (8 permitted if mountainous)
(NYDOT, 2013)
Where trucks exceed 250 directional design hourly volume
-- 12 desirable 10 minimum
3 or more lanes 10 desirable 4 minimum --
3 or more lanes & trucks exceed 250 directional design hourly volume
12 desirable 4 minimum --
(1)Total number of lanes in each direction. (2)10 ft width preferred. If shoulder is adjacent to an abutment wall, retaining wall in cut locations, or a noise wall, the 10 ft width is then required.
NON-FREEWAY ROADWAYS
Most previous studies evaluated operating speed on rural two-lane highways, with a
limited number of studies evaluating operating speed on multilane highways or freeways. For a
study on rural four-lane highways in Kentucky, the researchers developed a speed prediction
model that included consideration of lane (inside and outside), horizontal curve length or radius,
and indicatory variables for shoulder type (surfaced) median barrier presence, pavement type
(concrete or asphalt), approaching section grade, and curve presence on approach (Gong and
Stamatiadis, 2008). Himes and Donnell (2010) also found different speeds in the left and right
lanes for rural and urban four-lane highways and identified the following variables as relevant to
their study: heavy vehicle percentage, posted speed limit, and adjacent land use.
Because horizontal curves have such a notable effect on operating speed, the available
literature is greater for that roadway feature. Only a few previous studies have attempted to
quantify speed prediction on tangent sections including work by Polus et al. (2000) and Donnell
et al. (2001). Polus et al. considered tangent length and the previous and following curve radii

5
including grouping the radii into different categories in their attempts to develop usable speed
prediction equations. Donnell et al. used a combination of field data and simulation-generated
data. They found predicting truck speed prior to a horizontal curve to be a function of radius of
curve, length of approach tangent, grade of approach tangent, and the length of approach
tangent-radius interaction term.
OPERATIONAL EFFECTS OF FREEWAY LANE AND SHOULDER WIDTHS
Designers recognize operating speed as a measure of roadway consistency and driver
expectancy. Predicting operating speed allows designers to assess the expected speed of
individual vehicles traversing successive roadway segments. As documented in the
Transportation Research Board (TRB) Modeling Operating Speed Synthesis Report (TRB, 2011),
several factors influence operating speed, with most studies focusing on how horizontal
curvature influences the free-flow speed selected by roadway users. For example for rural two-
lane highways, studies by Krammes et al. (1995), Fitzpatrick et al. (2000), and Schurr et al.
(2002) developed speed prediction equations for horizontal curves that included characteristics
of the horizontal curve (e.g., degree or radius of curve, length of curve, deflection angle) and
tangent speed (e.g., the measured or assumed 85th percentile speed or the posted speed limit).
Additionally, several studies (Fitzpatrick et al., 2000; Donnell et al. (2001) report vertical
alignment has a significant impact on speeds, especially those of heavy vehicles.
In 2010, TRB published the most recent version of the Highway Capacity Manual
(HCM). This document includes information that can be used to estimate the relationship
between freeway lane widths, lateral clearances, and the resulting capacity and free flow speed
(FFS). In addition, a variety of research efforts have explored the effects of reducing lane and
shoulder widths. Many of these are temporary lane reductions at work zone locations; however,
the use of reduced lane and shoulder widths in constrained urban environments are becoming
more common. The following sections review the expected influences of these lane and shoulder
width reductions.
Lane Width
The 2010 HCM establishes a base condition lane width value of 12 ft for freeway facility
operations. As shown in Table 2, lane widths of 12 ft or greater are not expected to be directly

6
associated with reductions in FFS of the corridor. This means that unless a standard width lane
has additional variables such as high traffic volumes, steep grades, or similar, a wider lane width
will not directly affect the corridor speed. As the lane width is reduced, however, FFS is also
expected to lower. For lane reductions of 1 ft or less, FFS will be reduced by approximately
1.9 mph below that expected for the 12-ft base condition. As depicted in Table 2, lane widths as
narrow as 10 ft will substantially reduce FFS by values up to 6.6 mph. These FFS values are
based on freeway speeds ranging from 55 mph up to approximately 75 mph (a value of 75.4 mph
is used in HCM as this value most closely represented measured field data used to develop this
information).
Table 2. FFS Adjustment Based on Freeway Lane Width.
Average Lane Width (ft) Reduction in FFS (mph) ≥ 12 0.0
≥ 11–12 1.9 ≥ 10–11 6.6
Source: Highway Capacity Manual, Exhibit 11-8, p. 11-11 (TRB, 2010)
A limited number of studies have evaluated the influence of lane width on freeway
corridor operations. In many cases, operations are represented by the associated speed. In other
cases, lane keeping and total capacity values are used as indicators of the associated traffic
operations.
The Danish Road Directorate (1998) performed an evaluation of the capacity
implications associated with adding a lane to a freeway in Paris. They found that heavy trucks
moved closer to the edge lines, and although the addition of a travel lane was expected to result
in an increase in the total capacity, they found a minimal capacity improvement with congestion
levels remaining very close to those observed prior to construction of the additional lane.
Chitturi and Benekohal (2005) evaluated the influence of the lane width on the speeds of
cars and heavy vehicles in work zones. This Illinois freeway work zone study noted that the
observed speed reductions for freeway work zones were much larger than the values commonly
associated with lane reductions (per the HCM) (TRB 2000). Chitturi and Benekohal determined
that the freeway work zone speed reductions should be 10, 7, 4.4, and 2.1 mph for lane widths of
10, 10.5, 11, and 11.5 ft, respectively.

7
Though the number of freeway lane width studies is limited, a variety of studies
evaluated the influence narrower lanes have on the capacity of non-freeway road types.
Fitzpatrick et al. (2001) examined influential factors on four-lane suburban arterials. While this
research team did not explicitly consider speed limit as a predictor, they did determine that lane
width had a significant association to operating speed at tangent roadway sections. Ma et al.
(2010) examined a video dataset for urban arterials in the city of Hangzhou, China. They
selected nine road segments with similar characteristics and traffic patterns but with varying lane
widths. Ma et al. observed larger mean and 85th percentile speeds at sites with wider lanes.
Other researchers evaluated the influence of lane width at the approach to signalized
intersections. For example, Potts et al. (2007) used data for 25 intersection approaches located in
nine cities and five states to investigate how saturation flow rates change with lane width. They
found that the saturation flow rates vary in direct proportion to lane width. Kuan and Wanchao
(2011) evaluated signalized intersections in Beijing to determine how the effect of lane width on
saturation flow rate changes with varying percentage of heavy vehicles. They collected video
data from five urban intersections in Beijing and observed that the saturation flow reduction
associated with narrower lanes decreased with increasing percentages of heavy vehicles.
Some of the published research, however, challenges the operational impacts of narrower
lanes. Most of these research efforts are driver simulator studies and evaluated driver perception
issues as they relate to lane width. The road types considered for these simulator studies varied
but were generally focused on rural roadway configurations.
Godley et al. (2004) proposed that speed reduction will occur when the roadway is
configured to give the driver the perception of a reduced width even though the actual lane width
may remain constant. After evaluating 28 experienced drivers in a driver simulator environment,
Godley et al. determined that a speed reduction can be induced by delineating narrower lanes
while relocating the extra roadway width toward a painted median.
Rosey et al. (2009) conducted a study where they tested the effect of lane width within a
simulated environment. They based their study site on an actual field location, and the research
team evaluated actual before and after operational data for a lane width reduction/shoulder
increase project. Rosey et al. concluded that narrower lanes did not affect the choice of speed,
but that the vehicle position shifted toward the right side of the road. Although it was not
discussed by the authors, upon closer examination of the data presented in this paper, it does

8
appear that the field study data did experience a statistically significant reduction of speed.
Speeds changed from 95 to 92 km/h (approximately 59 to 57 mph) when the lane was reduced
from 3.3 to 3.0 meters (11 to 10 ft) and the shoulder width was increased by 0.3 meters (1 ft).
This difference is statistically significant for the large sample sizes presented (i.e., at least 67,000
data points per direction of travel for the smallest of the dataset configurations). Rosey et al.
based their conclusions on simulated results that reflected an increase in mean speed following a
lane reduction. The overall width remained the same for this analysis (the extra width removed
from the lane was transferred to the adjacent shoulder). This observation suggests that perhaps
the lane width operations are not independent of the shoulder configuration.
Shoulder/Lateral Offset
Often a shoulder width may be narrowed so that additional travel lanes can be
constructed within a fixed width roadway section. For urban freeway locations, this narrowed
shoulder then enables roadside objects to be physically located closer to the active travel lanes.
As noted in the HCM (TRB, 2010), this right-side lateral clearance extends “from the right edge
of the travel lane to the nearest lateral obstruction.” This reduced lateral clearance can influence
a driver’s selected speed at these locations. As shown in Table 3, speed reductions will begin to
occur when the right-side lateral clearances are less than 6 ft. The speed reductions can range
from as little as 0.1 mph (for right-side lateral clearances of 5 ft and roads with at least 5 lanes in
one direction of travel) up to 3.6 mph (for locations with no available right-side lateral clearance
and 2 lanes in one direction of travel).
The HCM also indicates that median-side lateral clearances that are greater than or equal
to 2 ft have little influence on freeway operations. Estimated speed reductions for median-side
lateral clearances less than 2 ft are not available.

9
Table 3. FFS Reduction (mph) for Freeway Right-Side Lateral Clearance.
Right-Side Lateral
Clearance (ft)
Lanes in One Direction
2 3 4 ≥ 5 ≥ 6 0.0 0.0 0.0 0.0 5 0.6 0.4 0.2 0.1 4 1.2 0.8 0.4 0.2 3 1.8 1.2 0.6 0.3 2 2.4 1.6 0.8 0.4 1 3.0 2.0 1.0 0.5 0 3.6 2.4 1.2 0.5 Source: Highway Capacity Manual, Exhibit 11-9, p. 11-12 (TRB, 2010)
The Chitturi and Benekohal (2005) study, reviewed in the previous lane width section,
similarly assessed the effect of using no shoulder or lateral offset on either side of the travel
lanes at freeway work zones. They determined that the freeway work zone speed reductions
would be approximately 5.6 mph for roads with lane widths of 12 ft and no available shoulder on
the left or right side.
Ben-Bassat and Shinar (2011) used a driver simulator study with 20 volunteer drivers to
evaluate the influence of shoulder width and guardrail placement on traffic operations. The
research team determined that the presence of a guardrail plays an important part in the overall
speed selection. For locations where the paved shoulder width varied, but a guard rail was not
located adjacent to the road, the speed remained relatively constant. This means that the shoulder
width may not play as critical of a role as the actual lateral offset to the nearest roadside object.
A second observation in this simulator study was that road sections with tangents or curves to the
right resulted in higher travel speeds when a guardrail was present than when it was not
(suggesting the guardrail was not perceived to be too close to the travel lane and may have even
assisted in better delineating the edge of the paved surface). A final observation by the research
team focused on lane position. For narrow roads with narrow shoulders, the drivers tended to
position their vehicles toward the left edge of the active travel lane. As the shoulder width
became wider, the drivers shifted the vehicle position to the center of the lane. Finally, at
locations where a guardrail was not present, the driver’s positioned the vehicle toward the right
edge of the travel lane for all observed shoulder widths.

10
Combined Operational Effects
According to the HCM (TRB, 2010), one direction of travel for a freeway segment with 2
lanes, lane widths of 10 ft, and no right-side lateral clearance is expected to have a FFS reduction
of 10.2 mph when compared to a base condition segment with 2 12-ft wide travel lanes with 6 ft
right-side clearances. As shown in Table 4, this reduced lane and right-side lateral clearance
combination directly corresponds to a reduction in the capacity of the travel lanes. For this
example, an approximate 10 mph FFS reduction from 75 to 65 mph would be equivalent to a
reduction of 80 passenger cars per hour per lane (pc/hr/ln) for a target level of service of D.
These example values are shaded for emphasis in Table 4.
Table 4. Maximum Service Flow Rates (pc/hr/ln) for Freeways.
FFS (mph)
Target Level of Service A B C D E
75 820 1310 1750 2110 2400 70 770 1250 1690 2080 2400 65 710 1170 1630 2030 2350 60 660 1080 1560 2010 2300 55 600 990 1430 1900 2250
Note: All values rounded to the nearest 10 pc/hr/ln Source: Highway Capacity Manual, Exhibit 11-17, p. 11-23 (TRB, 2010)
Melo et al. (2012) conducted a driving simulator study at the University of Porto,
Portugal, where they examined speed choice as a function of geometric road features located on
rural two-lane highways. Their simulator study included field validation of actual speed values
for six physical locations with equivalent conditions. Melo et al. found that both lane and
shoulder had an effect on speed choice, but that the assumptions of independent additive effects
in the HCM should be revisited; when both lane and shoulder widths were reduced, they found
greater changes in FFS than the independent additive effects would have explained.
A Texas study (Robertson et al., in press) generated speed prediction equations (see
Table 5) for freeways with posted speed limits up to 80 mph and multilane highways with posted
speed limits up to 75 mph. Those equations were used to develop suggested procedures for
calculating FFS on freeways and multilane highways that could be considered for a future edition
of the HCM (see Table 6). The researchers considered lane width in the statistical evaluations;
however, ultimately the lane width variable was determined not to be significant (possibly due to

11
the very limited range of widths available in the dataset). As shown in Table 7 while freeway
lane width did include a few sites with 13-ft lanes, the average lane width for the dataset was
only 12.06 ft and the majority of the sites had lanes that were 12-ft wide. Similarly, the study did
not include any sites with lanes 11-ft wide.

12
Table 5. TTI Speed Prediction Equations for Freeways and Multilane Highways. Fr
eew
ay
Free-flow speed on basic freeway segments with a posted speed limit of 65 mph to 80 mph: FFS65-80 = 77.5 – fPSL + 0.01012 × MW + 0.3893 × SW_L – 0.664 × TRD Where: FFS65-80 = FFS on basic freeway segment with a PSL of 65 to 80 mph (mph) fPSL = adjustment for posted speed limit (mph)
= If PSL = 80 mph, the reduction in free-flow speed is 0.0 mph = If PSL = 75 mph, the reduction in free-flow speed is 3.5231 mph = If PSL = 70 mph, the reduction in free-flow speed is 4.6514 mph = If PSL = 65 mph, the reduction in free-flow speed is 7.1769 mph
MW = median width, typical distance between pavement edges in the median (ft) SW_L = shoulder width left, typical left side (inside) shoulder width (ft) TRD = total ramp density, using HCM definition (ramps/mi) Limitations: It is advisable to limit the application to freeways with the following characteristics:
• Median widths ranging from 32 ft to 266 ft. • Left shoulder widths ranging from 4 ft to 6 ft. • Posted speed limits ranging from 65 mph to 80 mph. • Total ramp density ranging from 0 ramps/mi to 1.667 ramps/mi.
Values of variables included in the HCM methodology, but not found to be statistically significant: • Lane width ranged from 12 ft to 13 ft. • Total lateral clearance is always greater than 6 ft, the HCM’s default value.
Mul
tilan
e H
ighw
ay
Free-flow speed on multilane highways with a posted speed limit of 65 mph to 75 mph: BFFS65-75 = 71.7 – fPSL – 0.0266 × HCA + 0.0071 × MW + 1.5127 × SW_L – 0.4058 × SW_R Where: BFFS65-75 = base free-flow speed for multilane highway segments with a posted speed limit of 65 to 75 mph (mph) fPSL = adjustment for posted speed limit (mph)
= If PSL = 75 mph, the reduction in free-flow speed is 0.0 mph = If PSL = 70 mph, the reduction in free-flow speed is 1.3004 mph = If PSL = 65 mph, the reduction in free-flow speed is 2.1535 mph
HCA = horizontal curve angle, the typical angle for horizontal curves on the multilane highway (degrees) MW = median width (ft) SW_L = shoulder width on the left side of the traveled way (ft) SW_R = shoulder width on the right side of the traveled way (ft) Limitations: It is advisable to limit the application to multilane highways with the following characteristics:
• Median width ranging from 0 ft to 200 ft. • Left shoulder width ranging from 0 ft to 10 ft. • Right shoulder width ranging from 0 to 10 ft. • Posted speed limit ranging from 65 mph to 75 mph. • Horizontal curve angle (when present) ranging from 5.7 degrees to 42.0 degrees.
Values of variables included in the HCM methodology, but not found to be statistically significant: • Access point density ranged from 0 to 15.8 points/mi. • Lane width ranged from 12 ft to 12.5 ft. • Median type is either none or divided, there were no two-way left turn-lane facilities. • Total lateral clearance is always greater than 6 ft, the HCM’s default value.
Source: Robertson et al., in press

13
Table 6. 2010 HCM Variables Considered in the TTI Speed Prediction Equations.
Variable
Freeways Multilane Highways 2010 HCM TTI 2010 HCM TTI
Access Point Density - - Yes - Access Points - - - NS Base Free-Flow Speed - - Yes - Horizontal Curve Angle, Downstream - NS - Yes Horizontal Curve Angle, Upstream - NS - NS Horizontal Curves, Downstream - NS - NS Horizontal Curves, Upstream - NS - NS Lane (Inside or Outside) - Yes - Yes Lane Width Yes NS Yes NS Light Level (Day or Night) - NS - Yes Median Type - - Yes - Median Width - Yes - Yes Posted Speed Limit - Yes - Yes Percent Heavy Vehicles - Yes - NS Ramp Density, Total Yes - - - Ramp Points - Yes - - Shoulder Width Left - Yes - Yes Shoulder Width Right - NS - Yes Total Lateral Clearance Yes - Yes - Vehicle Type (Car or Truck) - Yes - Yes
NS Yes
-
= evaluated but found to be not significant. Variable not included in the final model = included in final model = not included in model
Source: Robertson et al., in press
Table 7. TTI Speed Prediction Equation Summary Statistics for Site Characteristics.
Variable Freeways Multilane Highways
Min Max Average Min Max Average Access Points - - - 0 6 1.82 Horizontal Curve Angle, Downstream 5.08 55.66 18.01 5.70 41.95 15.50 Horizontal Curve Angle, Upstream 5.08 55.66 18.01 5.70 41.95 15.50 Horizontal Curves, Downstream 0 2 0.25 0 3 0.67 Horizontal Curves, Upstream 0 2 0.25 0 3 0.67 Lane Width 12 13 12.06 12 12.5 12.04 Median Width 32 266 69.44 0 200 64.14 Ramp Points 0 10 3.56 - - - Shoulder Width Left 4 6 4.41 0 6 3.71 Shoulder Width Right 10 10 10 0 10 9.21 Source: Robertson et al., in press
14
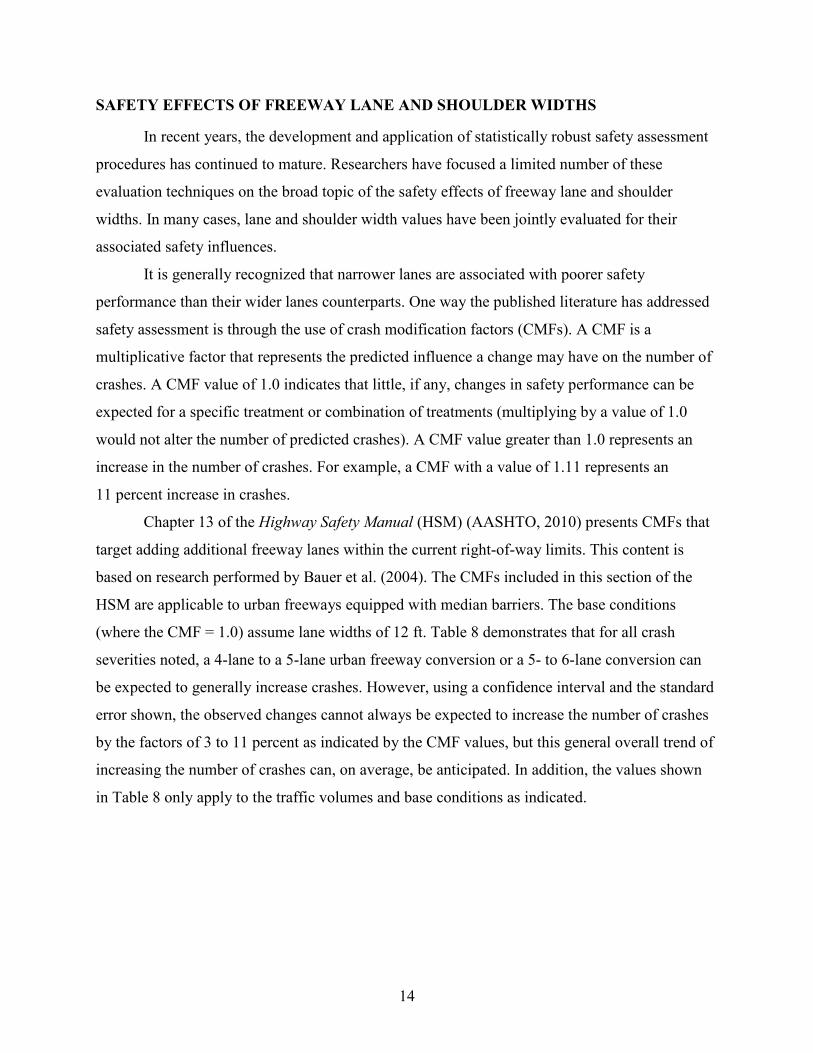
SAFETY EFFECTS OF FREEWAY LANE AND SHOULDER WIDTHS
In recent years, the development and application of statistically robust safety assessment
procedures has continued to mature. Researchers have focused a limited number of these
evaluation techniques on the broad topic of the safety effects of freeway lane and shoulder
widths. In many cases, lane and shoulder width values have been jointly evaluated for their
associated safety influences.
It is generally recognized that narrower lanes are associated with poorer safety
performance than their wider lanes counterparts. One way the published literature has addressed
safety assessment is through the use of crash modification factors (CMFs). A CMF is a
multiplicative factor that represents the predicted influence a change may have on the number of
crashes. A CMF value of 1.0 indicates that little, if any, changes in safety performance can be
expected for a specific treatment or combination of treatments (multiplying by a value of 1.0
would not alter the number of predicted crashes). A CMF value greater than 1.0 represents an
increase in the number of crashes. For example, a CMF with a value of 1.11 represents an
11 percent increase in crashes.
Chapter 13 of the Highway Safety Manual (HSM) (AASHTO, 2010) presents CMFs that
target adding additional freeway lanes within the current right-of-way limits. This content is
based on research performed by Bauer et al. (2004). The CMFs included in this section of the
HSM are applicable to urban freeways equipped with median barriers. The base conditions
(where the CMF = 1.0) assume lane widths of 12 ft. Table 8 demonstrates that for all crash
severities noted, a 4-lane to a 5-lane urban freeway conversion or a 5- to 6-lane conversion can
be expected to generally increase crashes. However, using a confidence interval and the standard
error shown, the observed changes cannot always be expected to increase the number of crashes
by the factors of 3 to 11 percent as indicated by the CMF values, but this general overall trend of
increasing the number of crashes can, on average, be anticipated. In addition, the values shown
in Table 8 only apply to the traffic volumes and base conditions as indicated.

15
Table 8. Crash Effects of Adding Lanes by Narrowing Existing Lanes and Shoulders.
Treatment Traffic Volume AADT (vehicles/day)
Crash Type (Severity) CMF Std.
Error
4 to 5 lane conversion
79,000 to 128,000 one direction
All types (All severities) 1.11 0.05 All types (Injury and
Non-injury tow-away) 1.10 0.07
All types (Injury) 1.11 0.08
5 to 6 lane conversion
77,000 to 126,000 one direction
All types (All severities) 1.03 0.08 All types (Injury and
Non-injury tow-away) 1.04 0.10
All types (Injury) 1.07 0.10 Base Condition: 4 or 5 lanes (12 ft wide) depending on initial roadway geometry Source: Adapted from the Highway Safety Manual, Table 13-5, p. 13-10 (AASHTO, 2010)
Bauer et al. (2005) specifically evaluated the safety effects of using narrow lanes and
shoulder-use lanes as a way to increase urban freeway capacity in California. Bauer et al.
examined freeway segments associated with reconstruction projects where the California
Department of Transportation added a travel lane without expanding the available paved width.
The researchers developed safety performance functions (SPFs) from a larger pool of sites that
did not undergo the lane addition and used these SPFs, in combination with the observed number
of crashes at the sites, for a period of two years prior to the lane change implementation. They
then used this information to predict the expected number of crashes for the six years following
the installation of the new travel lanes as compared to the actual crashes that occurred during the
period. They concluded that widening the number of lanes from 4 to 5 did have an impact on the
number of crashes equivalent to an increase of approximately 11 percent in total crashes and
10.6 percent in fatal and injury crashes.
A similar analysis for the 5- to 6-lane conversion did not provide statistically different
crash values; however, the actual observed changes in the number of crashes are positive,
suggesting an increasing trend in crashes. Although the authors discuss other potential
operational factors that may be confounding their results (such as shifting of bottleneck
locations), these effects are common items that can be expected to be present in similar cross-
section conversion efforts.
In Texas, Bonneson and Pratt (2009) developed the Roadway Safety Design Workbook.
Chapter 2 of this manual synthesizes the work of a previous research effort by Bonneson et al.
(2005). The work summarized by these two studies presents CMFs, developed using the
Empirical Bayes (EB) technique, which address lane width and shoulder width safety for Texas

16
freeways. The Roadway Safety Design Workbook includes CMFs that apply to rural and urban
freeway conditions. The base condition lane width is 12 ft (this corresponds to a CMF equal to
1.00). As shown in Table 9, urban freeways with lane widths less than 12 ft may be associated
with an increase in injury and fatal crashes that extends up to 7 percent (i.e., CMF = 1.07) for
corridors with 2 lanes or 5 lanes of travel per direction and lanes widths of 10 ft. The Workbook
includes equations and proportional adjustments, but the values in this table reflect the final
CMF after performing these calculations that would be applied to the total number of observed
injury and fatal crashes. The Workbook also includes similar adjustments for rural freeways, but
this information is not included since the focus of this effort is the urban freeway.
Table 9. Lane Width CMF Values for Texas Urban Freeways (Injury + Fatal Crashes).
Lane Width (ft) Number of Through Lanes (in One Direction) 2 3 4 5
10 1.07 1.06 1.06 1.07 10.5 1.06 1.05 1.05 1.05 11 1.04 1.03 1.03 1.03
11.5 1.02 1.02 1.02 1.02 12 1.00 1.00 1.00 1.00
Base Condition: Lane width of 12 ft Source: Developed from procedures presented in the Roadway Safety Design Workbook (Bonneson and Pratt, 2009)
The Roadway Safety Design Workbook also includes information about the expected
safety effects of varying shoulder widths for Texas urban freeways (see Table 10 and Table 11).
The outside or right paved shoulder is assumed to have a base condition width of 10 ft for
corridors with 2 or more through lanes. The resulting CMFs are applicable to outside shoulder
widths ranging from 6 to 12 ft. Shoulder widths less than 6 ft are assumed to have comparable
safety effects as those determined for the 6-ft wide outside shoulders. The most extreme CMFs
have a value of 1.06 (or a 6 percent increase in crashes) for urban freeways with 2 through lanes
per direction and outside shoulders that are less than or equal to 6 ft wide. Shoulder widths
greater than 10 ft provide negligible safety benefits (CMFs that range from 0.97 to 0.99).
The inside (left) shoulder base condition is different for an urban freeway with 2 through
lanes per direction when compared to corridors with 3 or more through lanes per direction. The
use of an inside shoulder that is 4 ft wide is associated with the freeway sections with 2 through
lanes per direction. In general, this narrower shoulder width is used with the assumption that a
vehicle must only cross one active travel lane (to the right) to reach a wide outside shoulder. As

17
the freeway cross-section widens and more lanes are added, the inside shoulder is then also
widened with a base condition value of 10 ft. As shown in Table 11, the safety effects associated
with the inside lane for an urban freeway with 2 lanes per direction of travel range from an
increase in crashes up to 7 percent (when no inside shoulder is available) to a reduction in
crashes of 10 percent (when the inside shoulder width is 10 ft). Texas urban freeway sections
with 3 or more lanes per direction of travel and no inside shoulder are expected to experience an
increase in crashes of approximately 15 percent.
Table 10. Outside (Right) Shoulder Width CMF Values for Texas Urban Freeways (Injury + Fatal Crashes).
Outside (Right) Shoulder Width (ft)
Number of Through Lanes (in One Direction) 2 3 4 5
≤ 6 1.06 1.04 1.03 1.03 7 1.05 1.03 1.02 1.02 8 1.03 1.02 1.01 1.01 9 1.02 1.01 1.01 1.01
10 1.00 1.00 1.00 1.00 11 0.99 0.99 0.99 0.99 12 0.97 0.98 0.99 0.99
Base Condition: Outside shoulder width of 10 ft Source: Developed from procedures presented in the Roadway Safety Design Workbook (Bonneson and Pratt, 2009) Table 11. Inside (Left) Shoulder Width CMF Values for Texas Urban Freeways (Injury +
Fatal Crashes).
Inside (Left) Shoulder Width (ft)
Number of Through Lanes (in One Direction) 2 3 4 5
0 1.07 1.16 1.14 1.15 1 1.05 1.14 1.12 1.13 2 1.04 1.12 1.11 1.12 3 1.02 1.11 1.09 1.10 4 1.00 1.09 1.08 1.08 5 0.98 1.07 1.06 1.07 6 0.97 1.06 1.05 1.05 7 0.95 1.04 1.04 1.04 8 0.93 1.03 1.02 1.03 9 0.92 1.01 1.01 1.01
10 0.90 1.00 1.00 1.00 Base Condition: Inside shoulder width of 4 ft for 2 lanes in one direction, and 10 ft for ≥ 3 lanes in one direction.
Source: Developed from procedures presented in the Roadway Safety Design Workbook (Bonneson and Pratt, 2009) A similar study by Gross et al. (2009) examined the crash databases for two-lane rural
highways in Pennsylvania and Washington. The focus of their analysis included run-off-road,

18
head-on, and sideswipe crashes. Gross et al. found that the cross-sectional analysis for
Pennsylvania data yielded remarkably similar CMFs to those developed in a Texas study
(Bonneson et al., 2007). In general, both studies determined that wider lanes, shoulders, and
paved surface (on rural two-lane highways) are associated with a reduction in the number of
crashes. Based on these findings, they recommended that lane widths should range from 11 to
12 ft. Gross et al. also stressed that the safety effects of lane and shoulder widths should be
considered jointly.
Bonneson et al. (2011) developed a prediction methodology for freeways and
interchanges using crash and road data from California, Maine, and Washington. They
supplemented their database with information collected from aerial photographs. This additional
data included width of cross-section elements, barrier location, horizontal curvature, and median
type. They then developed a lane width CMF for fatal and injury crashes. Ultimately, the models
and CMFs developed for this project will be included in a future edition of the HSM. The
resulting three-state CMF for lane width can be represented by the following equation:
𝐶𝐶𝐶 = 𝑒−0.0376×(𝑊𝑙−12)
This CMF is applicable for lane widths ranging from 10 ft up to 13 ft. For lane widths
that are greater than or equal to 13 ft, a constant CMF value of 0.96 (or a 4 percent crash
reduction from the base condition) is expected (see Table 12).
Table 12. Lane Width CMF Values for Three-State Freeway Model (Injury + Fatal
Crashes).
Lane Width (ft) CMF Value 10 1.08
10.5 1.06 11 1.04
11.5 1.02 12 1.00
12.5 0.98 ≥ 13 0.96
Base Condition: Lane width of 12 ft Source: Developed from procedures presented in the Roadway Safety Design Workbook (Bonneson and Pratt, 2009)
The shoulder CMF values, as determined by Bonneson et al. (2011), varied in character.
For the outside (right) shoulder width, the researchers determined that the outside shoulder did
not have a direct influence on multiple-vehicle crashes. Consequently, the outside shoulder width

19
CMF should only be applied to single vehicle crashes. In addition, the influence of this CMF can
be expected to vary depending on the horizontal curvature of the freeway, if present. The
equation for this CMF is more complex and the combined, no-curve segment influence is better
represented by the graphic shown in Figure 1. In this figure, thicker trend lines represent the area
type and through lane combinations. The outside shoulder CMF is applicable for widths ranging
from 6 to 14 ft with an assumed base condition of 10 ft. The figure also depicts similar CMFs
(shown with thin lines) that have been developed by others.
Source: Bonneson et al., 2011
Figure 1. Outside Shoulder Width.
The safety effects for inside shoulders, as determined by Bonneson et al. (2011), can be
represented by the following equation:
𝐶𝐶𝐶 = 𝑒−0.0172×(𝑊𝑖𝑖−6).
The inside shoulder CMF equation applies to shoulders with widths ranging from 2 to
11 ft. The base condition (CMF = 1.00) occurs when the inside shoulder width is 6 ft (see Table
13). The CMF shown represents fatal plus injury crashes and indicates an increase in fatal and
injury crashes of 7 percent (CMF = 1.07) for 2-ft wide inside shoulders up to a reduction in fatal
and injury crashes of 8 percent (CMF=0.92) for inside shoulder widths of 11 ft.

20
Table 13. Inside Shoulder Width CMF Values for Three-State Freeway Model (Injury + Fatal Crashes).
Inside Shoulder Width (ft) CMF Value
2 1.07 3 1.05 4 1.03 5 1.02 6 1.00 7 0.98 8 0.97 9 0.95
10 0.93 11 0.92
Base Condition: Inside shoulder width of 6 ft Source: Developed from procedures presented in the Roadway Safety Design Workbook (Bonneson and Pratt, 2009)
Stamatiadis et al. (2011) developed crash prediction functions for multilane rural roads,
focusing on the safety effects of lane width, shoulder width, and median width. They used data
from California, Kentucky, and Minnesota and found CMFs comparable to the HSM for median
and shoulder widths. In general, they indicated an observed crash reduction associated with
wider shoulders. Due to the consistent use of lanes with widths of 12 ft, they were not able to
evaluate the safety effects of lane widths.
Chen and Tian (2012) evaluated crash data for 490 kilometers of expressways and found
that the impact of shoulder on expected crash frequency and mortality rates varies, but did
observe that wider shoulders were associated with fewer crashes. Manuel et al. (2014) performed
a cross-sectional analysis using negative binomial (NB) SPFs with datasets assembled from crash
records, traffic-survey, and roadway-inventory data from Edmonton, Canada. When evaluating
the lane width, they found that road width is negatively associated with crashes, but that the
magnitude of that effect is reduced in proportion to how much traffic there is along the roadway
segment. They also noted that segments with a midblock change in their road width tended to be
less safe than segments with uniform widths.
SIMULTANEOUS OPERATIONAL AND SAFETY EVALUATION
In 1978, McCasland examined both operational and safety effects of converting sections
of 4-lane freeways with widths of 12 ft (located at U.S. 59 Southwest Freeway in Houston) into 5

21
lanes with widths of 10.5 ft by restriping and encroaching into the right shoulder (McCasland,
1978). This study also included a conversion of another section of the same freeway from 3 to 4
lanes with the same before and after lane widths. This effort identified clear operational benefits
(in terms of level of service and delay reduction) and presumed safety benefits resulting from the
operational improvements of reducing congested driving conditions. The statistical methods used
in this study, however, pre-date the development of currently acceptable statistical practices that
account for issues such as regression to the mean and deviations from a homogeneous (or
Poisson) distribution.
More recently in Texas, Cooner and Ranft (2006) examined the safety of buffer-separated
high occupancy vehicle (HOV) lanes at I-35 East and I-635 in the Dallas area. These lanes were
implemented by reducing travel lane width and converting the inside shoulder to an HOV lane.
Cooner and Ranft evaluated the operational impact by measuring the speed differential between
the HOV and other standard use lanes. Both study sites experienced an increase in crash rates
following the implementation of HOV lanes. The increase in crashes, however, occurred
primarily in the HOV lane and the adjacent standard use lane. The researchers linked this
increase in crashes to the differential of speed between the two lanes and recommended the use
of a buffer between the HOV and general purpose lanes.
GAPS IN KNOWLEDGE
The published literature included information regarding inside shoulder, outside shoulder,
and lane widths with specific consideration for the operational and safety performance of these
critical design features. A few gaps in the literature are notable. In some cases, it may simply be
that a configuration has not been widely used; however, these items merit note as the Texas
research effort moves forward. The following list summarizes these observed gaps:
• Lane widths are generally assumed to be equivalent across all lanes in one direction of
travel (wider outside lanes and narrower center lanes were not noted in the literature).
• Speed reductions for inside (referred to as median-side) clearances less than 2 ft are not
available per the HCM.
• Safety analysis for outside (right) shoulders narrower than 6 ft are generally treated as if
they are 6-ft wide (widths less than this were not included).


23
CHAPTER 3. SITE SELECTION AND DATA COLLECTION
The published literature identified a wide variety of data collection elements and
techniques commonly used for evaluating the operational and safety performance of lane and
shoulder widths. The following sections briefly identify the specific elements and data collection
analysis techniques, operational performance (speed) site identification and data collection
information, and safety data site identification and collection.
ELEMENTS
The data required for evaluating the operations and associated safety along an urban
freeway corridor and expected to in some way contribute to the performance of the lane and
shoulder widths can be divided into three general categories: roadway characteristic data,
operational data, and safety data. As shown in Table 14, a wide variety of potential data sources
may be used for this evaluation. These data elements are consistent with those identified in the
published literature. Because the intent of this study was to evaluate the direct effect of lane and
shoulder widths, the research team attempted to identify study sites located remotely from
influential site features, such as ramp gores, so that the evaluation could focus on the impacts of
the lane and shoulder width.
DATA COLLECTION STRATEGIES
Data collection strategies include site selection and data collection techniques. The
research team worked closely with the Texas Department of Transportation (TxDOT) to identify
candidate sites based on recent freeway lane and shoulder narrowing projects and/or site specific
knowledge of candidate locations. For the purposes of this study, this approach to site selection
did constrain the study locations to select cities (in this case Dallas, Houston, and San Antonio).
The data collection techniques required to determine the impacts of lane and shoulder
widening vary; however, the published literature overwhelming indicated the use of cross-
sectional speed and capacity analyses for determining traffic operations. Ideally, a more precise
approach would be to use before-after data at the same location so that roadways with similar
users, traffic volume, truck percentage, and physical site features could be directly evaluated. In
the published literature, most of the studies were conducted as cross-sectional evaluations. The
project team used this cross-sectional approach for the operational analysis component of this
24
study. For the safety analysis, most of the data were cross-sectional, but longitudinal data were
available for some study sites. As a result, the project team selected a statistical methodology for
the safety analysis such that data with both longitudinal and cross-sectional characteristics could
be accommodated.
Table 14. Data Collection Elements and Sources.
Data Element Data Source Roadway Characteristic Data (used for Operational and Safety Analysis)
Number, Width, and Configuration of Lanes Roadway/Highway Network Inventory (RHiNo) and Aerial Photos
Shoulder Widths Aerial Photos Horizontal Geometry Aerial Photos, and Site Inspection via Google
Street View Type and Placement of Barrier Aerial Photos and Site Inspection via Google
Street View Posted Speed Limit Site Inspection via Google Street View
Operational Data Traffic Volume Average (Annual Daily Traffic [AADT] and Design Hour Volume [DHV])
RHiNo, CRIS, Site Sensors
Operating Speed (spot speed data) Traffic Management Center (TMC) archived data [TranStar, DalTrans, TransVISION, and TransGuide], historic permanent loop data
Safety Data Crash Data (three years) – Includes crash type and crash severity
TxDOT Crash Records Information System (CRIS)
Boundaries of Homogeneous Segments RHiNo and Aerial Photos
Ideally, use of the exact same set of sites for the operational and the safety analysis would
simplify the data collection and enable direct comparisons, but in many cases a site that was
suitable for the safety analysis (based on a homogeneous segment of some length) could not be
used for the speed analysis (based on availability of speed sensor locations). Consequently, the
operational and safety data summaries are presented separately, though there was significant
overlap between the datasets.
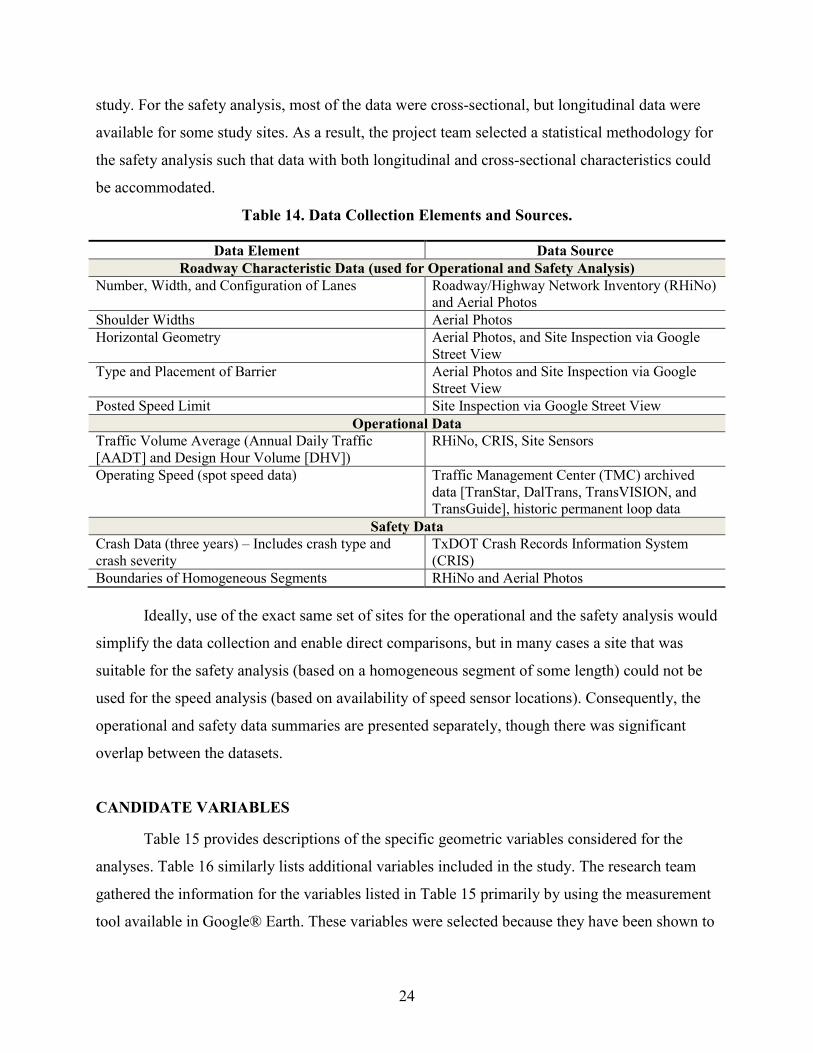
CANDIDATE VARIABLES
Table 15 provides descriptions of the specific geometric variables considered for the
analyses. Table 16 similarly lists additional variables included in the study. The research team
gathered the information for the variables listed in Table 15 primarily by using the measurement
tool available in Google® Earth. These variables were selected because they have been shown to
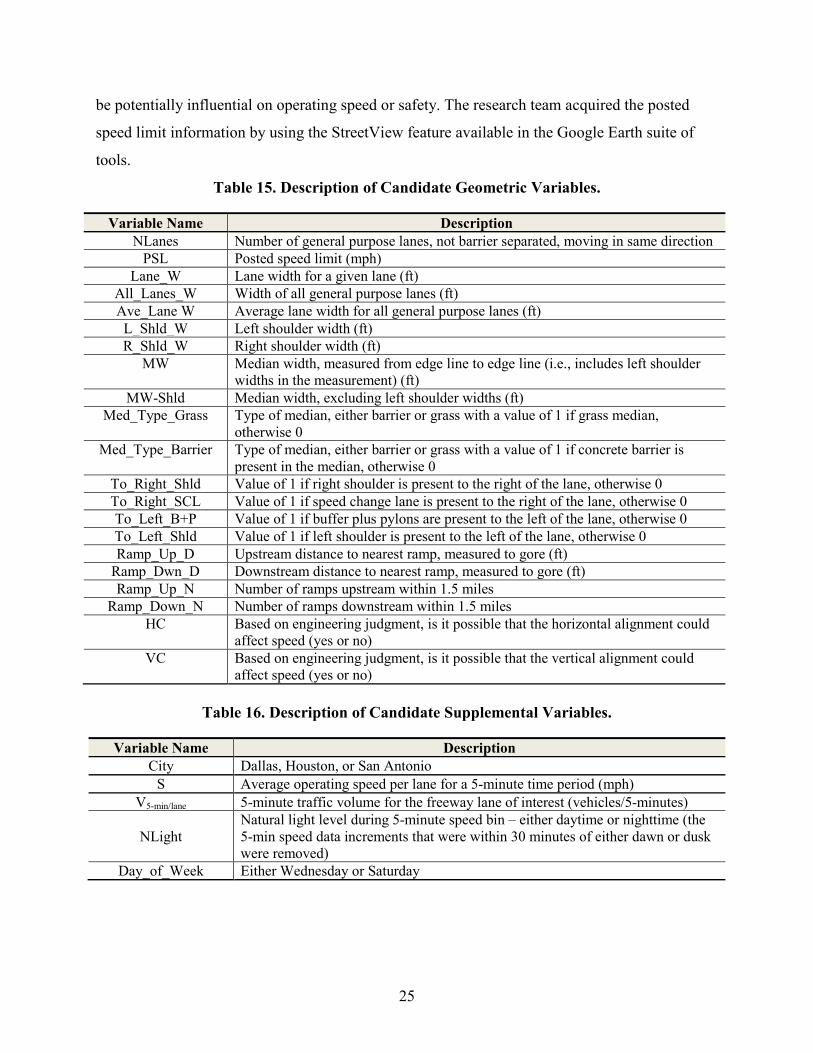
25
be potentially influential on operating speed or safety. The research team acquired the posted
speed limit information by using the StreetView feature available in the Google Earth suite of
tools.
Table 15. Description of Candidate Geometric Variables.
Variable Name Description NLanes Number of general purpose lanes, not barrier separated, moving in same direction
PSL Posted speed limit (mph) Lane_W Lane width for a given lane (ft)
All_Lanes_W Width of all general purpose lanes (ft) Ave_Lane W Average lane width for all general purpose lanes (ft) L_Shld_W Left shoulder width (ft) R_Shld_W Right shoulder width (ft)
MW Median width, measured from edge line to edge line (i.e., includes left shoulder widths in the measurement) (ft)
MW-Shld Median width, excluding left shoulder widths (ft) Med_Type_Grass Type of median, either barrier or grass with a value of 1 if grass median,
otherwise 0 Med_Type_Barrier Type of median, either barrier or grass with a value of 1 if concrete barrier is
present in the median, otherwise 0 To_Right_Shld Value of 1 if right shoulder is present to the right of the lane, otherwise 0 To_Right_SCL Value of 1 if speed change lane is present to the right of the lane, otherwise 0 To_Left_B+P Value of 1 if buffer plus pylons are present to the left of the lane, otherwise 0 To_Left_Shld Value of 1 if left shoulder is present to the left of the lane, otherwise 0 Ramp_Up_D Upstream distance to nearest ramp, measured to gore (ft)
Ramp_Dwn_D Downstream distance to nearest ramp, measured to gore (ft) Ramp_Up_N Number of ramps upstream within 1.5 miles
Ramp_Down_N Number of ramps downstream within 1.5 miles HC Based on engineering judgment, is it possible that the horizontal alignment could
affect speed (yes or no) VC Based on engineering judgment, is it possible that the vertical alignment could
affect speed (yes or no)
Table 16. Description of Candidate Supplemental Variables.
Variable Name Description City Dallas, Houston, or San Antonio
S Average operating speed per lane for a 5-minute time period (mph) V5-min/lane 5-minute traffic volume for the freeway lane of interest (vehicles/5-minutes)
NLight Natural light level during 5-minute speed bin – either daytime or nighttime (the 5-min speed data increments that were within 30 minutes of either dawn or dusk were removed)
Day_of_Week Either Wednesday or Saturday

26
OPERATIONAL ANALYSIS SITE SELECTION AND DATA COLLECTION
A primary characteristic for the candidate operational analysis sites was the presence of
speed measurement devices and the availability of speed data. Sensors are present in several
major Texas cities to collect speed and volume data.
Operational Analysis Speed Sensor Characteristics
For the purposes of this study, the research team selected locations in Dallas, Houston,
and San Antonio.
Dallas
The TxDOT DalTrans Traffic Management Center (TMC) is responsible for monitoring
traffic conditions, collecting traffic data, and storing traffic data within the Dallas District of
TxDOT. As of 2013, DalTrans deployed closed-circuit television at 342 locations and vehicle
detection units at 291 locations. Vehicle detection units (i.e., Wavetronix SmartSensor and video
image vehicle detection system) are installed on local freeways and are used to measure traffic
speeds, traffic volumes, lane occupancy, and long vehicle volumes. These units are mounted
alongside freeways and the information from the vehicle detection units is transmitted to the
TMC. The traffic data are archived by date/time (five minute intervals), detector name (location),
detector ID (unique identifier), and detector status (normal, error, out of service, no data,
incomplete).
Houston
For the Houston sites, the research team used speed values acquired from Smart Sensors,
which are digital wave radar devices used for vehicle detection. The devices measure vehicle
volume, occupancy, speed, and classification. The information is used to develop the speed map
shown on the TxDOT website and to generate travel times displayed on the dynamic message
signs on freeways. The data are stored in five-minute increments.
San Antonio
Freeway traffic conditions in San Antonio, Texas, are monitored and managed by the
TxDOT’s TransGuide intelligent transportation system. Two primary types of input are received
by the system’s operators: video feeds and detector/sensor data. Three types of detector/sensing

27
technologies are used: inductance loops (configured in each freeway lane as a two-loop speed
trap), microwave radar, and Bluetooth®. Inductance loops are the oldest technology used by the
system and were the initial detector type used when the system was first installed in the early
1990s. Over time, the loops have been displaced by radar detectors for ease of maintenance and
reduced cost. These more traditional traffic sensors (i.e., loops and radar) provide TransGuide
operators with both speed and lane-by-lane count data.
Data from all three sensing technologies are used by TransGuide operators to aid in
detecting freeway incidents and monitoring the onset and extent of freeway congestion. Data
from all sensors are stored in archived data files by hour, day, and month. Each file contains data
for all freeway sensors in the TransGuide system regardless of detector type. The files contain a
time stamp, link name (which includes the freeway corridor name and sensor milepoint location),
lane name (which includes the link name and lane designation code), speed (mph), volume, and
occupancy. The TransGuide central management software accumulates sensor data by polling
sensors every 20 or 30 seconds. Within each 20- or 30-second period, each sensor reports the
count over that time segment and a calculated average speed and percent occupancy. These data
are not processed further (for archiving purposes) by the TransGuide central software (TxDOT’s
Lonestar) but are simply accumulated and stored by hour. For use in this TxDOT study, the
research team binned the data into five-minute increments to match the time frame of data
available for Houston and Dallas.
Operational Analysis Study Sites
Members of the research team identified sites with 11-ft freeway lanes within each of the
three major Texas cities via team or panel member knowledge or by using aerial photographs to
assess the lane width for several freeways within one of the three Texas cities. Due to the limited
number of freeways with 11-ft lanes, more 12-ft lane sites were identified than 11-ft lane sites.
Table 17 lists the number of lanes that are 12-ft wide (121 lanes) and the number of lanes 11-ft
wide (83 lanes) included in the operational analysis database.

28
Table 17. Number of Lanes in Database.
City Lanes with 11-ft Width Lanes with 12-ft Width Total Number of Lanes Dallas 52 30 82
Houston 16 47 63 San Antonio 15 43 58
Total 83 121 204
The push pins in Figure 2 show the Dallas operational assessment site locations, and
Table 18 provides companion cross section dimensions.
Figure 2. Dallas Operational Assessment Sites.

29
Table 18. Dallas Speed Study Sites.
Site – Direction* Number of Lanes
Posted Speed Limit (mph)
Left Shoulder
Width (ft)
Average Lane Width
(ft)
Right Shoulder
Width (ft)
635-CenVil - NB 5 60 5 11 7 635-CenVil - SB 5 60 5 11 10 635-Skill - EB 5 60 5 11 10 635-Skill - WB 4 60 5 11 10 635-TwnCen - NB 5 60 10 12 10 635-TwnCen - SB 5 60 10 12 10 635-TwnEast - NB 5 60 10 12 9 635-TwnEast - SB 5 60 10 12 9 75-15th - NB 5 60 3.5 11 11 75-15th - SB 4 60 3.5 11 11 75-Allen - NB 3 65 1.5 12 9 75-Allen - SB 3 65 12 12 8 75-Exch - NB 3 65 13.5 12 9 75-Exch - SB 3 65 13.5 12 9.5 75-Legacy - NB 3 65 3 11 6 75-Legacy - SB 3 65 3 11 9.5 75-Midpark - NB 5 60 3.5 11 10 75-Midpark - SB 5 60 3.5 11 9 75-Ridge - NB 3 65 3.5 11 8 75-Ridge - SB 3 65 3.5 11 9 75-SprCre - NB 3 65 3.5 11 9 75-SprCre - SB 4 65 3.5 11 9 75-Valley - NB 4 60 3.5 11 10 75-Valley - SB 4 60 3.5 11 9
*See Table 15 for descriptions of geometric variables.
Figure 3 shows the Houston locations identified for the operational assessment
evaluation, and Table 19 depicts the companion cross section information. San Antonio
operational study sites and their cross-section characteristics are identified in Figure 4 and Table
20, respectively.

30
Figure 3. Houston Operational Assessment Sites.
Table 19. Houston Speed Study Sites.
Site – Direction* Number of Lanes
Posted Speed Limit (mph)
Left Shoulder
Width (ft)
Average Lane Width
(ft)
Right Shoulder
Width (ft)
10-Bunk - EB 5 60 5 12 10 10-Mer - EB 4 60 5 11 12 10-Mer - WB 4 60 10 12 12 10-Norm - EB 4 60 12 12 11 10-Norm - WB 4 60 11 12 12 288-Air - NB 3 60 10 12 10 288-Air - SB 3 60 10 12 10 290-43 - EB 3 60 1.5 11 12 290-43 - WB 3 60 1.5 11 12 290-Telge - EB 3 65 1.5 11 7 45N-Tidwell - SB 4 60 2 11 12 59-Air - NB 4 60 10 12 12 59-Air - SB 4 60 10 12 12 610-Braes - NB 5 60 11 12 4 610-Four - NB 5 60 11 12 11 610-Four - SB 5 60 11 12 10 90-Hunt - EB 3 60 10 12 11 90-Hunt - WB 3 60 10 12 11
*See Table 15 for descriptions of geometric variables.

31
Figure 4. San Antonio Operational Assessment Sites.

32
Table 20. San Antonio Speed Study Sites.
Site – Direction* Number of Lanes
Posted Speed Limit (mph)
Left Shoulder
Width (ft)
Average Lane Width
(ft)
Right Shoulder
Width (ft)
010E - 561.169 4 65 11 12 9 010E - 574.117 4 65 11.5 12 4 010E - 576.264 3 65 23 12 10 010W - 561.169 4 65 7 12 15 010W - 574.117 4 65 11 12 11 010W - 576.264 3 65 19.5 12 10 035N - 173.506 3 65 5 11 11 035S - 173.506 3 70 9 11 7 037S - 140.348 4 65 10 12 5 090E - 564.048 2 65 20 12 10 090W - 564.048 2 70 20 12 10 090W - 568.156 4 65 8.5 12 11 1604E - 028.549 2 60 5 12 10 1604W - 028.549 2 70 5 12 10 1604W - 029.042 2 70 10 12 4 1604W - 030.638 2 70 5 12 10 281N - 149.431 3 65 9 12 11 410E - 015.107 5 65 10 11 7 410N - 011.100 5 65 11 11 8 410S - 011.120 4 65 8 11 20 U10E - 568.248 3 65 9 12 11.5
*See Table 15 for descriptions of geometric variables.
Operational Analysis Data Collection
Shoulder widths were measured to the middle of the lane line and rounded to the nearest
0.5 ft. The lane width data element was typically obtained by measuring all lanes and then
dividing by the number of lanes, rounding to the nearest foot. At locations where a ramp merged
onto the freeway, the outside lane could be wider than the typical lane width. This atypically
wide lane was noted as a merging lane and removed from the study. Through the use of aerial
photographs, the research team determined that all but two of the sites had roadway lighting
present near the speed sensors.
The amount of available speed data is very large. To have a more manageable sample
size and to enable the research team to perform a statistical analysis on the data, members of the
team limited the speed data request to only two days in a month. The resulting dataset included
data from a Wednesday and a Saturday for each month in 2013 (pending data availability for the
33
requested day). In general, the team selected the second week of a month so as to avoid the
majority of the holidays (e.g., Thanksgiving). For some of the datasets, the week selected was
shifted due to lack of data in the second week of a month.
For Dallas and Houston, the format of the available speed data included bins of 5-minute
increments. For San Antonio, the data are in 20 or 30-sec bins. These bins were combined into
5-minute bins to match the time period in other cities.
To address prevailing lighting conditions, the following rules were applied:
• If any part of the 5-minute time period occurred within 30 minutes (before or after) of the
sunrise, the time interval was classified as dawn lighting conditions.
• If any part of the 5-minute time period occurred within 30 minutes (before or after) of the
sunset, the time interval was classified as dusk lighting conditions.
• If the 5-minute time period occurred more than 30 minutes after sunrise or more than 30
minutes before sunset, the light condition was classified as daytime.
• If the 5-minute time period occurred more than 30 minutes after sunset or more than 30
minutes before sunrise, the light condition was classified as nighttime.
• If the 5-minute time period occurred within 30 minute of sunrise or sunset, the associated
speed data were removed from subsequent evaluation.
Table 21 shows the associated sunrise and sunset times for Dallas, Houston, and San Antonio.
The focus of the operational analysis was to determine the effect of geometric features on
operating speed. To eliminate the potential effects of congestion, the research team removed data
from the dataset when speeds were less than 50 mph or when 5-minute volumes were greater
than 250 vehicles. The modeling effort used the pooled database from all three cities. A total of
667,297 speed records were available with about an even split between speed data for 11-ft lanes
(340,695 speed measurements) and 12-ft lanes (326,602 speed measurements). Table 22 shows
the number of speed measurements by number of lanes on the freeways.

34
Table 21. Sunrise and Sunset Times for Dallas, Houston, and San Antonio.
Date for Dallas Data
Time for Sunrise, Dallas
Time for Sunset, Dallas
Date for Houston
Data
Time for Sunrise, Houston
Time for Sunset,
Houston
Date for San
Antonio Data
Time for Sunrise,
San Antonio
Time for Sunset,
San Antonio
01/23/13 7:27 17:51 01/09/13 7:18 17:39 01/09/13 7:29 17:51 01/26/13 7:26 17:53 01/12/13 7:18 17:42 01/12/13 7:30 17:54 02/09/13 7:16 18:07 02/13/13 7:03 18:08 02/13/13 7:15 18:21 02/13/13 7:12 18:10 02/16/13 7:00 18:11 02/16/13 7:12 18:23 03/09/13 6:45 18:30 03/13/13 7:34 19:28 03/13/13 7:46 19:40 03/20/13 7:31 19:38 03/16/13 7:30 19:30 03/16/13 7:43 19:42 04/13/13 7:00 19:55 04/10/13 7:01 19:45 04/10/13 7:13 19:57 04/24/13 6:47 20:03 04/13/13 6:57 19:47 04/13/13 7:10 19:59 05/08/13 6:34 20:13 05/08/13 6:34 20:03 05/08/13 6:46 20:15 05/11/13 6:31 20:16 05/11/13 6:31 20:08 05/11/13 6:44 20:16 06/08/13 6:19 20:34 06/12/13 6:20 20:22 06/12/13 6:33 20:34 06/12/13 6:18 20:35 06/15/13 6:21 20:23 06/15/13 6:33 20:35 07/24/13 6:35 20:32 07/10/13 6:29 20:25 07/10/13 6:41 20:37 07/27/13 6:37 20:30 07/13/13 6:30 20:25 07/13/13 6:42 20:36 08/24/13 6:56 20:03 08/14/13 6:49 20:04 08/14/13 7:01 20:16 08/28/13 6:59 19:58 08/17/13 6:50 20:01 08/17/13 7:02 20:13 09/07/13 7:05 19:45 09/11/13 7:04 19:33 09/11/13 7:16 19:45 09/11/13 7:08 19:40 09/14/13 7:06 19:29 09/14/13 7:18 19:41 10/23/13 7:37 18:46 10/09/13 7:19 18:58 10/09/13 NA NA 10/26/13 7:40 18:43 10/12/13 7:21 18:55 10/12/13 NA NA 11/16/13 6:58 17:26 11/13/13 6:44 17:27 11/13/13 NA NA 11/20/13 7:02 17:24 11/16/13 6:47 17:26 11/16/13 NA NA 12/18/13 7:24 17:23 12/11/13 7:07 17:23 12/11/13 NA NA 12/21/13 7:25 17:25 12/14/13 7:09 17:24 12/14/13 NA NA
NA = not necessary as speed/volume data for this date not available
Table 22. Number of Speed Measurements by Number of Freeway Lanes.
11-ft Lane Width 12-ft Lane Width Number of Lanes Frequency Number of Lanes Frequency
2 0 2 3,005 3 108,715 3 110,575 4 123,684 4 87,119 5 108,296 5 125,903
All 340,695 All 326,602
Table 23 depicts the range of variables including the average value for left-shoulder
width, right-shoulder width, median width, median width without including left shoulder widths,
and number of ramps upstream and downstream of the speed measurement location. For 12-ft

35
lanes, the average left and right shoulder widths were similar (10.0 ft and 10.2 ft), while the
shoulder widths were not similar for 11-ft lanes (3.6 ft and 9.7 ft). The average left-shoulder
width for 11-ft lanes (3.6 ft) was smaller than the average left-shoulder width for 12-ft lanes
(10.0 ft). The indication of a more restricted cross section for segments with 11-ft lanes is also
apparent by the median width variable. The maximum median width is only 27 ft for 11-ft lane
segments as compared to 125 ft median width for a 12-ft lane segment.
The posted speed limits included in the dataset ranged between 60 and 70 mph. Table 24
lists the number of speed measurements by posted speed limit. Most of the data reflected 60 mph
sites with very few sites having 70 mph for the posted speed limit. The number of speed
measurements, based on the use of the space to the left and to the right of the lane, is shown in
Figure 5 and Figure 6, respectively. In most cases the use of the space to the left of the lane is
another lane or the inside shoulder. Buffers with vertical pylons (Buf+pyl) were present to the
left of the lane for several sites containing 11-ft lanes. All of these sites were in the Dallas
region.
Table 23. Range of Values for Key Variables.
Lane Width
(ft) Value
Left-Shoulder
Width (ft)
Right-Shoulder
Width (ft)
Median Width
(ft)
Median Width Minus
Shoulder (ft)
Number of Upstream
Ramps
Number of Downstream
Ramps
11.0 Minimum 1.5 6.0 6.0 3.0 1.0 2.0 Average 3.6 9.7 8.2 3.0 3.7 3.8
Maximum 11.0 20.0 27.0 7.0 7.0 7.0
12.0 Minimum 1.5 4.0 10.0 3.0 1.0 1.0 Average 10.0 10.2 33.0 10.1 3.8 3.8
Maximum 23.0 14.9 125.0 100.0 6.0 6.0
Table 24. Number of Speed Measurements by Posted Speed Limit.
Posted Speed Limit (mph)
Frequency of Data for Lanes with 11-ft Width
Frequency of Data for Lanes with 12-ft Width
Grand Total
60 237,032 243,649 480,681 65 103,380 80,755 184,135 70 283 2,198 2,481
Grand Total 340,695 326,602 667,297

36
Figure 5. Number of Speed Measurements
by Space to the Left of the Lane.
Figure 6. Number of Speed Measurements
by Space to the Right of the Lane.
SAFETY ANALYSIS SITE SELECTION AND DATA COLLECTION
In addition to identifying candidate sites and features for the operational analysis data
collection effort, the research team also acquired data for the purposes of quantifying the
relationship between safety and lane and shoulder width. The following section reviews this
Texas crash data and study sites.
Safety Analysis Study Sites
Initial site selection for this effort occurred in parallel with the operational analysis data
collection. As part of this effort, the research team again identified 11-ft lane freeway sites
located in Dallas, Houston, and San Antonio. Candidate sites were identified based on previous
knowledge of freeway sections and a systematic review of city freeways via aerial photographs.
The research team observed that the number of freeways with 11-ft lanes is somewhat limited.
As a result, the final dataset included more 12-ft lane width than 11-ft lane width sites. Due to
the physical separation of opposing directions of travel on a freeway and the intent to isolate the
effects of cross-sectional elements beyond those of the median, the research team elected to

37
analyze the sites for each direction of travel. The search concentrated on obtaining data from
one-direction freeway sections with three, four, and five lanes. The research team also identified
two additional freeway sites, a San Antonio site with two lanes per direction and a Houston site
with six lanes per direction of travel. The resulting sites are depicted as push pins in Figure 7
(Dallas), Figure 8 (Houston), and Figure 9 (San Antonio).
The majority of the safety sites were located in the vicinity of the operational analysis
locations; however, additional sites were identified and collected for each task. For example, an
important difference is that an operations site provides spot speed per lane at one point, but a
safety site requires a segment as uniform in its cross section as possible, yet long enough to have
a sufficient likelihood of crashes occurring. A safety site consisted of a freeway segment with a
uniform cross section in terms of number of lanes and lane or shoulder width. The segment did
not include any freeway on or off ramps within its limits. Therefore, a typical segment would
normally begin some distance after an entrance or exit ramp and would end some distance prior
to an entrance or exit ramp. A segment was typically about 2000 ft long.
Figure 7. Dallas Safety Assessment Sites.

38
Figure 8. Houston Safety Assessment Sites.

39
Figure 9. San Antonio Safety Assessment Sites.
The next section describes some basic information collected from each location in the
safety dataset.
Safety Analysis Data Collection
The research team collected individual site geometric information for variables
previously identified in Table 15 by using the measurement tool available in Google Earth.
These variables were selected because literature indicates they are potentially influential on the
safety of freeway sections. Lane and shoulder widths were measured to the middle of the lane
pavement marking stripe. The lane width was measured individually. The research team then
contrasted the sum of all lane widths against the sum of measuring across all lanes.
Measurements were repeated if this contrast yielded a difference larger than 5 percent of the
width of all lanes.

40
In contrast to the extremely large dataset available for the operational analysis, the
amount of crash data necessary for a robust safety evaluation depended greatly on the team’s
ability to collect data for a sufficiently large number of sites, with detailed geometric data and
crash data from each site. By combining the data collection effort for the operations and safety
tasks, the research team was able collect geometry from a sizeable number of freeway segments
(73 in total). However, an absolute minimum of 100 data points is recommended in order to
perform a robust statistical analysis based on Maximum Likelihood Estimation, as error
estimation from this type of analysis relies on a relatively large dataset to provide reliable results.
It is also recommended that there be at least 30 data points per explanatory variable included in
the analysis. For example, if it is anticipated that eight variables should be accounted for, then
there should be at least 8 × 30=240 data points for statistical inference to be realistic.
The research team obtained the minimum required sample size for analysis by
aggregating the data into six-month periods at each site. In other words, crash data were not
aggregated per site for the whole 2010 to 2013 period of time. Rather, the database was designed
such that each record represents a six-month period, though some records were adjusted to
represent shorter periods because construction was suspected to have taken place within the six-
month period. The research team selected a statistical technique capable of accounting for this
data grouping structure, as will be detailed later in this document.
Safety Analysis Dataset Characteristics
The most obvious advantage of analyzing six-month periods, as opposed to data
aggregated for four years from one site, is the number of data points available for analysis. There
is a potential pool of 73 segments × 4 years × 2 periods/year = 584 segment-periods for analysis
compared to just 73 data points representing crash counts aggregated at each site for the four
years under study. An additional advantage is that the analysis can explicitly capture within-site
variation, not only variation between sites. Finally, by using this approach, the research team was
able to include sites where the cross-section changed during the study period. Although only a
few sites with cross sectional changes were identified, the research team believes it is important
to include these modified sites because the objective of this research is to provide information to
support decision making regarding changes in freeway cross-section.

41
Construction periods should not be considered for this effort because of special signage,
temporary markings, temporary barriers, construction equipment, and shifting conditions that
prevail during construction activity. Based on satellite imagery, the research team identified 16
complete six-month periods with active construction, and removal of these sites reduced the
potential pool of six-month periods to 568 for the 73 sites.
Range of Right Shoulder Widths
The research team identified one site with an atypical shoulder width, as can be observed
in Figure 10. This site had a 20-ft paved right shoulder, wider than any of the actual travel lanes.
Additionally, this four-lane site is located just upstream of a merging zone (as shown in Figure
11), where the number of lanes is subsequently reduced to three. The proximity between this site
and a downstream merging zone increases the chances of additional weaving maneuvers and the
likelihood of crashes at this location. For those reasons, this site was removed from the formal
analysis.
Figure 10. Frequency by Right Shoulder Width.
Right Shoulder Width (ft)
Freq
uenc
y of
Site
s
6 8 10 12 14 16 18 20
05
1015
2025
30

42
Figure 11. Satellite Image for Site 19-R-SA-4.
Sites where Changes Occurred over Time
Having sites where physical changes occurred during the period of analysis offer the
opportunity to compare the effect of changing cross-sectional elements and implicitly accounting
for other unobserved elements unique to each site (e.g., land use, driving population, and
commuting patterns). For this reason, the research team made every effort to preserve as many of
these sites in the database as feasible. Initially, 11 such sites with cross-sectional changes were
identified, as indicated in the second column of Table 25. The research team observed counter-
intuitive findings that the width of lanes or shoulders increased during the period of analysis. A
closer examination found various explanations for these changes and prompted the research team
to re-classify these sites.
Table 25. Distribution of Sites by Geometry Changes during the Analysis Period.
Type of Change within Period of Analysis
Number of Sites Originally Identified
Number of Sites After Revision
None 61 62 Lane or Shoulder Reduction 8 7 Lane or Shoulder Expansion 3 0
Total: 72 69
In some instances, the sites originally identified as having experienced changes actually
had the changes occur outside of the analysis period, and thus were reclassified as sites with no
changes for the purpose of this study. The three sites with apparent lane width increases were all
located in Dallas. These sites are locations with the movable median barrier system, or zipper.

43
This barrier system accommodates the operations of reversible managed lanes that change three
times during a 24-hour cycle on week days. These sites were removed from the analysis, as the
variables of interest actively varied throughout a single day.
The research team also noted that other sites with shoulder width increases had also
experienced simultaneous lane width reductions. These changes were often followed by the
appearance of additional barriers, construction equipment, and additional lanes in the satellite
photographic record. These sites retained their original classifications, whenever it was clear that
construction was not ongoing.
After incorporating these changes, a total of 536 six-month segment-periods from 69 sites
remained available for analysis. The last column of Table 25 shows the site distribution of this
reduced dataset. Only seven sites with changes in their cross section remained in the dataset
(10 percent of all sites). Table 26 shows the distribution of the dataset by number of time periods
available for analysis. With the exception of one site, at least six periods are available for
analysis from each site. Due to photographic evidence of construction, several time periods for
this Houston site were excluded.
Table 26. Distribution of Sites by Number of Time Periods for Analysis.
Number of Six-Month Periods Available for Analysis Number of Sites
8 62 7 2 6 4 2 1
Reduced Time Periods for Analysis
The final dataset excluded 16 segment-periods (i.e., complete six-month-long periods
from a segment) because the data collectors noted evidence of ongoing construction activity. The
research team identified additional segment-periods when it was evident that construction had
ceased sometime before the end of the six-months. Instead of excluding these segment-periods
completely, the research team included only those months where construction had clearly ceased.
As a result, the research team retained segment-periods shorter than six months from 23 sites.
Table 27 shows the distribution of sites by average length of time periods available in the
dataset. Even though 23 sites had at least one shortened time period, the average study duration

44
is at least 4.8 months for all 69 sites. The next subsection provides more detailed summary
statistics for the reduced dataset.
Table 27. Distribution of Sites by Length of Time Periods Available for Analysis.
Average Length of Time Period Number of Sites 6 months 47
Between 5.4 and 6.0 months 15 Between 4.8 and 5.4 months 7
Geometric Data Summaries
The research team made a preliminary distinction between sites with narrow lanes
(narrower than 11.5 ft) and sites with standard lanes (wider than 11.5 ft) when collecting the
geometric data. Table 28 shows the number of periods available and the average lane width for
each of these categories in the three study cities.
Table 28. Number of Segment-Periods Available for Analysis by City and Average Lane
Width.
City
Total Number of Available
Segment-Periods
Number of Segment-Periods
from Narrow-
Lane Sites
Average Lane Width for
Narrow-Lane Sites (ft)
Number of Segment-
Periods from Standard-Lane Sites
Average Lane Width for Standard-Lane Sites
(ft) Dallas 120 72 11.0 48 12.1 Houston 226 66 11.4 160 12.1 San Antonio 190 55 11.3 135 12.0
Table 29 shows the key variables acquired for the Dallas sites. Similarly, Table 30 and
Table 31 depict data from Houston and San Antonio, respectively.

45
Table 29. Dallas Safety Study Sites.
Site ID No.
Periods Number of
Lanes
Posted Speed Limit (mph)
Left Shoulder Width (ft)
Average Lane
Width (ft)
Right Shoulder Width (ft)
01-R-DA-3 8 3 65 2.4 11.0 9.3 02-R-DA-3 8 3 65 3.2 10.8 9.1 03-R-DA-3 8 3 65 3.1 10.8 9.8 04-S-DA-3 8 3 65 14.1 12.1 8.9 05-S-DA-3 8 3 65 13.4 12.1 9.9 06-S-DA-3 8 3 65 13.2 12.1 10.3 07-R-DA-4 8 4 60 3.3 11.2 8.9 08-R-DA-4 8 4 60 5.7 11.0 9.6 09-R-DA-4 8 4 60 2.9 11.0 7.8 13-R-DA-5 8 5 60 1.3 11.1 9.8 14-R-DA-5 8 5 60 3.2 11.4 10.4 15-R-DA-5 8 5 60 1.9 11.1 10.8 16-S-DA-5 8 5 60 11.5 12.0 11.0 17-S-DA-5 8 5 60 12.1 11.9 9.9 18-S-DA-5 8 5 60 11.1 12.2 10.3

46
Table 30. Houston Safety Study Sites.
Site ID No.
Periods Number of
Lanes
Posted Speed Limit (mph)
Left Shoulder Width (ft)
Average Lane
Width (ft)
Right Shoulder Width (ft)
01-R-HO-3 6 3 65 6.5 11.2 8.8 02-R-HO-3 6 3 65 5.9 11.5 9.6 03-R-HO-3 8 3 60 1.4 11.3 12.2 04-S-HO-3 8 3 60 10.2 12.5 12.2 05-S-HO-3 8 3 60 13.3 12.2 10.0 06-S-HO-4 8 4 60 10.5 11.8 10.6 07-R-HO-4 6 4* 60 8.3 11.4 10.4 08-R-HO-4 8 4 60 6.4 11.2 13.5 09-R-HO-4 8 4 60 1.9 11.5 12.5 10-S-HO-4 8 4 60 12.6 12.2 11.9 11-S-HO-4 8 4 60 2.7 11.9 9.9 12-S-HO-4 8 4 60 10.4 12.1 13.2 13-S-HO-5 8 5 60 10.3 12.1 9.9 14-S-HO-5 8 5 60 11.8 12.2 10.2 15-S-HO-5 8 5 60 10.3 12.1 9.4 16-S-HO-5 8 5 60 14.5 12.2 10.4 17-S-HO-5 6 5 60 8.9 12.3 8.9 18-S-HO-6 8 6 60 11.6 12.2 10.6 19-R-HO-3 8 3 65 2.0 11.0 12.0 20-S-HO-3 8 3 60 9.8 12.2 11.1 21-S-HO-4 8 4 60 10.8 12.2 10.4 22-R-HO-4 8 4 60 10.0 12.0 12.0 23-R-HO-4 8 4 60 6.8 11.5 12.1 24-S-HO-4 8 4 60 12.7 11.9 11.9 25-S-HO-5 8 5 60 9.7 12.1 10.4 26-S-HO-5 8 5 60 14.4 11.9 9.3 27-S-HO-4 8 4 60 11.0 12.0 10.3 28-S-HO-4 8 4 60 12.9 12.3 10.0 29-S-HO-5 2 5 60 6.8 12.1 9.6 30-S-HO-5 8 5 60 9.4 12.3 12.0
* Site had 4 lanes during 2010 and 5 lanes during 2012 and 2013.
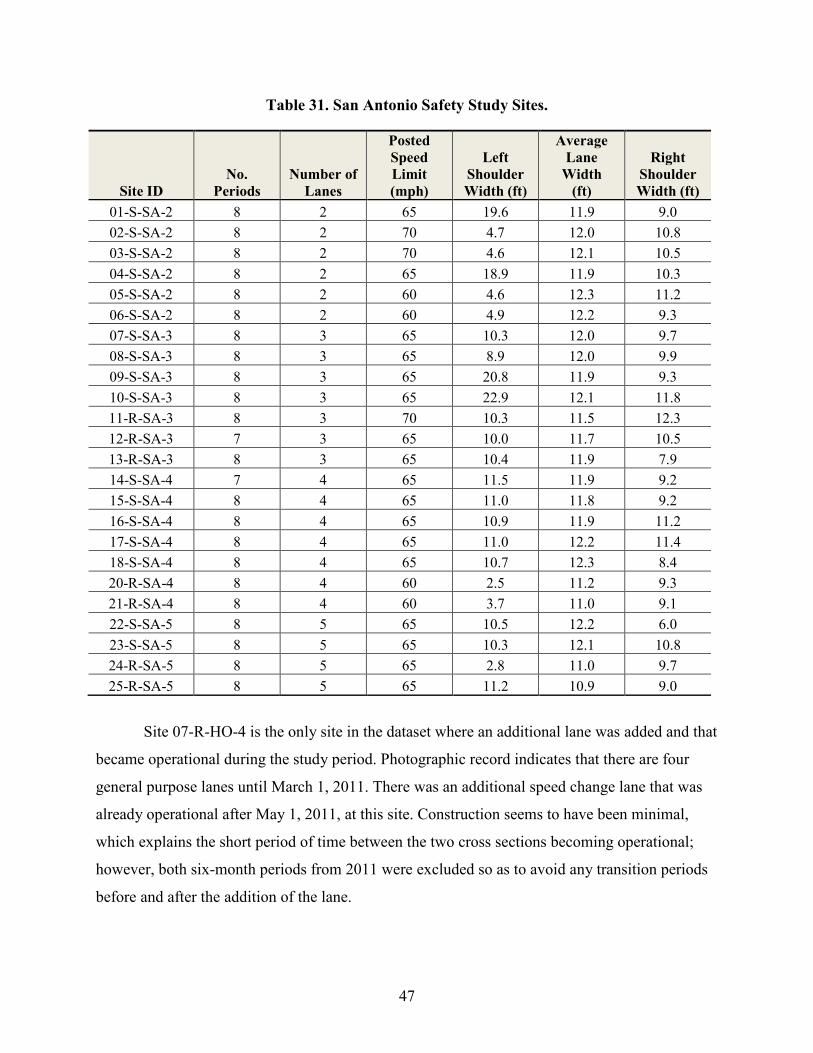
47
Table 31. San Antonio Safety Study Sites.
Site ID No.
Periods Number of
Lanes
Posted Speed Limit (mph)
Left Shoulder Width (ft)
Average Lane
Width (ft)
Right Shoulder Width (ft)
01-S-SA-2 8 2 65 19.6 11.9 9.0 02-S-SA-2 8 2 70 4.7 12.0 10.8 03-S-SA-2 8 2 70 4.6 12.1 10.5 04-S-SA-2 8 2 65 18.9 11.9 10.3 05-S-SA-2 8 2 60 4.6 12.3 11.2 06-S-SA-2 8 2 60 4.9 12.2 9.3 07-S-SA-3 8 3 65 10.3 12.0 9.7 08-S-SA-3 8 3 65 8.9 12.0 9.9 09-S-SA-3 8 3 65 20.8 11.9 9.3 10-S-SA-3 8 3 65 22.9 12.1 11.8 11-R-SA-3 8 3 70 10.3 11.5 12.3 12-R-SA-3 7 3 65 10.0 11.7 10.5 13-R-SA-3 8 3 65 10.4 11.9 7.9 14-S-SA-4 7 4 65 11.5 11.9 9.2 15-S-SA-4 8 4 65 11.0 11.8 9.2 16-S-SA-4 8 4 65 10.9 11.9 11.2 17-S-SA-4 8 4 65 11.0 12.2 11.4 18-S-SA-4 8 4 65 10.7 12.3 8.4 20-R-SA-4 8 4 60 2.5 11.2 9.3 21-R-SA-4 8 4 60 3.7 11.0 9.1 22-S-SA-5 8 5 65 10.5 12.2 6.0 23-S-SA-5 8 5 65 10.3 12.1 10.8 24-R-SA-5 8 5 65 2.8 11.0 9.7 25-R-SA-5 8 5 65 11.2 10.9 9.0
Site 07-R-HO-4 is the only site in the dataset where an additional lane was added and that
became operational during the study period. Photographic record indicates that there are four
general purpose lanes until March 1, 2011. There was an additional speed change lane that was
already operational after May 1, 2011, at this site. Construction seems to have been minimal,
which explains the short period of time between the two cross sections becoming operational;
however, both six-month periods from 2011 were excluded so as to avoid any transition periods
before and after the addition of the lane.

48
Matching AADT to Study Sites
The research team retrieved Annual Average Daily Traffic (AADT) from the Road-
Highway Inventory Network (RHiNo) for years 2010 to 2012. Each year was matched to the
corresponding time period. At the time of the data collection, AADT was not available for year
2013. The research team used simple linear regression to estimate AADT for year 2013. For each
site, the research team obtained a 2013 AADT estimate using the three AADT values from 2010
through 2012.
Safety Analysis Crash Data
The research team retrieved crash data from the TxDOT Crash Records Information
System (CRIS) for years 2010 to 2013 from all freeways in the three cities under study. From the
crash-level file, the research team obtained records including geo-location, date, route location,
environmental factors, severity of outcome, and number of vehicles, among other variables. The
research team obtained additional data from the vehicle-level file, including direction of travel,
among other variables.
Only crashes geo-located within a distance of 150 ft of a freeway section were extracted
and preliminarily matched to the study sites. At this stage, the research team excluded any
crashes classified as occurred on HOV lanes or frontage roads, per the CRIS database.
Because the sites represent only one direction of travel, the matching of geometric data to
crash data obtained from CRIS required considering the direction of travel variable available
from the vehicle file in CRIS. Crashes when the vehicles were traveling in the opposite direction
were excluded for each freeways section. For example, if the travel direction of a study site is
northbound, then all crashes with an indication of vehicles traveling southbound were excluded
from the directional dataset. The crashes were assigned to their corresponding segment-periods
and a subtotal was obtained for fatal or severe injury (KAB) crashes (i.e., the highest three
categories in the total crash or KABCO scale severity classification, containing only fatal and
injury crashes). Table 32 shows summary statistics for the assembled dataset.

49
Table 32. Summary Statistics for Available Dataset for Years 2010–2013 (n=536).
Variable Mean Std. Dev Min Max Total N Total Crashes 4.1 4.85 0 37 2202 536 KAB Crashes 0.8 1.08 0 6 407 536 Period Length (yr) 0.48 0.07 0.08 0.50 - 536 AADT (vpd) 152,163.0 59,511.34 200 281,450 - 536 Segment Length (ft) 1897.2 735.82 618 4510 - 536 Number of Lanes 3.8 0.98 2 6 - 536 All Lanes Width (ft) 45.2 11.78 24 73 - 536 Average Lane Width (ft) 11.8 0.48 10.8 12.5 - 536 Left Shoulder Width (ft) 9.1 4.87 1.3 22.9 - 536 Right Shoulder Width (ft) 10.3 1.46 2.0 14.8 - 536 Closest Downstream Ramp (ft) 1861.2 1503.32 17 6938 - 536 Closest Upstream Ramp (ft) 1738.7 1208.59 320 7170 - 536
The lowest AADT value of 200 vpd is quite notable. This low AADT value is associated
with sites 04-S-HO-3 and 20-S-HO-3, both sections of the Crosby Freeway. This freeway section
was under construction between 2008 and 2009 and became operational sometime during year
2010. An aerial photograph from January 2010 (Figure 12) shows that these sections are almost
ready to be opened to the public, but did not have any active traffic at the time of the photograph.
The next photograph dated March 2011 (Figure 13) shows some traffic on this facility. Notably,
the RHiNo database does not offer AADT readings for years earlier than 2010 for this site. For
years 2011 and 2012, the AADT values for this new section of freeway were 19,480 and
21,000 vpd, respectively. Since there is record of traffic for year 2010 in the RHiNo database,
this site was retained for subsequent safety analysis.

50
Figure 12. Satellite Image for Sites 04-S-HO-3 and 20-S-HO-3: January 2010.
Figure 13. Satellite Image for Sites 04-S-HO-3 and 20-S-HO-3: March 2011.

51
CHAPTER 4. OPERATIONAL ANALYSIS
INITIAL VARIABLE SELECTION
The operational dataset contained speeds per freeway lane. This detailed level of data
enabled consideration of how the space on either side of the lane may have influenced driver’s
speed choice. Common knowledge is that freeway drivers operate at higher speeds when driving
in the left-most lane as compared to the right-most lane. The “To_Left” and “To_Right”
variables previously identified in Table 15 account for how the space to the left or to the right of
a given lane is being used. When a shoulder is to the right of a lane, this variable indicates that
the lane is the right-most lane for the freeway. The expectation is that operating speed is lower
on this freeway lane compared to the other lanes.
The research team elected to model the relationship between operating speed and volume
as a second degree curve, based on evidence from classical models (i.e., the Greenshields curve)
and current characterizations (i.e., three-regime speed versus volume curves) that clearly shows
that the relationship between speed and volume is not linear, but rather curvilinear.
The variable posted speed limit was removed from the analysis because only five sites in
San Antonio had freeways with speed limits of 70 mph. While the posted speed limits for the
freeways in San Antonio ranged from 60 to 70 mph, the freeways in Houston and Dallas only
had either 60 or 65 mph speed limits. Because the city variable and the posted speed limit
variable are confounded, only one of these variables should be included in the model. The
research team selected the city variable for the subsequent model development activities.
FULL MODEL
The first step in the model development process is the construction of a full model that
includes all variables that the literature suggested may have an impact on operating speed. Table
33 shows the results for the full model with significant variables highlighted (see final column).
As noted in the table, several variables were not significant including variables of great interest
to this research, lane width and shoulder width. The results indicated that the following variables
are important:
• Volume.
• Natural light level of daytime or nighttime (NLight).

52
• Day of the week (Day_of_Week).
• Use of the space neighboring the lane (To_Left and To_Right).
• Median type (Med_Typ_Grass).
REDUCED MODEL
The next model development step was to remove the insignificant variables that were of
lower interest to this research. Table 34 shows the results of the reduced model, which indicate
that speeds are about 2.1 mph higher for 12-ft lanes as compared to 11-ft lanes. Additional left
shoulder and right shoulder width may also be associated with faster speeds; however, those
effects, if they exist, are too small to be determined as statistically significant in this model. It is
possible that the differences may not be noticeable because of the limited range of shoulder
width values. The HCM only includes adjustments to FFS when the right-side lateral clearance
(or right shoulder) is 5 ft or less (see Table 3). For this dataset, the right shoulder widths were a
minimum of 6 ft for 11-ft lane widths and 4 ft for 12-ft lane widths. In other words, very few
sites in this Texas dataset had right shoulder widths in the range that other researchers have
found to influence speeds on a freeway.
The model indicates that when a lane has a shoulder located to the immediate right (i.e.,
the lane on the far right of the freeway), the speed on that lane is about 7.2 mph lower than when
a lane is located between two lanes. This observation is statistically significant and based on the
assumption that everything else remains constant. The opposite effect is suggested for the left-
most lane (with an adjacent left shoulder) where speeds are higher by approximately 1.7 mph
when contrasted to a lane that is located between two lanes, but this finding was not statistically
significant.

53
Table 33. Parameter Estimates for Full Model.
Parameter Value Std. Error DF t-value p-value Pr(>|z|) Intercept 67.625 3.956 663,641 17.094 <10-05 *** V2
5-min/lane −1.8×10-04 1.0×10-06 663,641 −146.103 <10-05 ***
NLanes 0.113 0.812 51 0.139 0.890 Med_Typ_Grass 4.483 2.158 51 2.077 0.043 ** L_Shld_W 0.041 0.128 132 0.319 0.750 R_Shld_W 0.275 0.188 132 1.467 0.145 Lane_W 1.070 1.299 51 0.826 0.413 Ramp_Dwn_D −3.4×10-04 4.0×10-04 51 −0.849 0.400 Ramp_Up_D −3.2×10-04 5.0×10-04 51 −0.682 0.498 Ramp_Up_N −0.125 0.607 51 −0.205 0.838 Ramp_Dwn_N −0.021 0.499 51 −0.042 0.967 To_Left_B+P 3.674 0.890 132 4.127 1.0×10-04 *** To_Left_Shld 4.184 2.581 132 1.621 0.107 To_Right_SCL −4.284 1.177 132 −3.641 4.0×10-04 *** To_Right_Shld −7.004 1.961 132 −3.571 5.0×10-04 *** HC −1.092 1.814 51 −0.602 0.550 VC 0.088 1.432 51 0.062 0.951 CityHouston 2.187 1.682 51 1.300 0.200 CitySanAntonio 1.229 1.406 51 0.874 0.386 NLight −2.004 0.028 663,641 −71.708 <10-05 *** Day_of_Week −1.471 0.009 663,641 −171.533 <10-05 *** MW-Shld:Med_Type_ Barrier −0.810 0.627 132 −1.292 0.199
MW-Shld:Med_Type_ Grass −0.017 0.033 132 −0.514 0.608
Where: • Lane_W = {1 for 12 ft, otherwise 0} • Med_Type_Grass = {1 if Grass, otherwise 0} • To_Left_B+P = {1 if Buffer plus Pylons, otherwise 0} • To_Left_Shld = {1 if Shoulder, otherwise 0} • To_Right_SCL = {1 if Speed Change Lane, otherwise 0} • To_Right_Shld = {1 if Shoulder, otherwise 0} • NLight = {1 for Night, otherwise 0} • Day_of_Week = {1 for Wednesday (representing weekday), otherwise 0 (representing Saturday or weekend) • CityHouston = {1 for Houston, otherwise 0} • CitySanAntonio = {1 for San Antonio, otherwise 0}
Significance values are as follows: ~ p < 0.1; * p < 0.05; ** p < 0.01; and *** p < 0.001

54
Table 34. Parameter Estimates for Reduced Model.
Parameter Value Std. Error DF t-value p-value Pr(>|z|)
Intercept 67.695 0.701 663,641 96.570 <10-05 *** V2
5-min/lane −1.8×10-04 <10-05 663,641 −146.108 <10-05 ***
Med_Typ_Grass 4.861 1.697 60 2.865 0.006 ** L_Shld_W 0.038 0.124 134 0.303 0.762 R_Shld_W 0.289 0.184 134 1.575 0.118 Lane_W 2.050 0.991 60 2.068 0.043 * To_Left_B+P 3.569 0.879 134 4.060 1.0×10-04 *** To_Left_Shld 1.718 1.378 134 1.247 0.215 To_Right_SCL −4.336 1.170 134 −3.706 3.0×10-04 *** To_Right_Shld −7.248 1.910 134 −3.795 2.0×10-04 *** NLight −2.004 0.029 663,641 −71.708 <10-05 *** Day_of_Week −1.471 0.009 663,641 −171.533 <10-05 *** Where:
• Lane_W = {1 for 12 ft, otherwise 0} • Med_Type_Grass = {1 if Grass, otherwise 0} • To_Left_B+P = {1 if Buffer plus Pylons, otherwise 0} • To_Left_Shld = {1 if Shoulder, otherwise 0} • To_Right_SCL = {1 if Speed Change Lane, otherwise 0} • To_Right_Shld = {1 if Shoulder, otherwise 0} • NLight = {1 for Night, otherwise 0} • Day_of_Week = {1 for Wednesday (representing weekday), otherwise 0 (representing Saturday or
weekend) Significance values are as follows: ~ p < 0.1; * p < 0.05; ** p < 0.01; and *** p < 0.001
The results indicate that Texas freeway drivers operate their vehicles at 2 mph lower
speeds during nighttime conditions (with roadway lighting present). They also operate at higher
speeds (1.5 mph) on the weekends (Saturday as compared to Wednesday). Speeds are about
4.9 mph higher on freeways with a grass median as compared to freeways with concrete median
barriers (statistically significant).
Because the focus of this research effort is to determine the influence of the lane and
shoulder width on corridor speeds, this reduced model retained the insignificant shoulder width
variables; however, in order to further simplify the equation to predict speeds, the equation can
be further reduced. This refinement of the reduced model, for practical speed estimation
purposes, is included in the following section.

55
REFINEMENT OF THE REDUCED OPERATIONS MODEL
Table 35 depicts the significant variables in the final reduced model. With the removal of
the shoulder width variables, every coefficient is now significant. A reduction in the AIC value
of six points (from a value of 3,563,197 for the model shown in Table 34 to 3,563,191 for the
model shown in Table 35) is evidence of a better balance between model complexity and
goodness of fit. With the removal of the insignificant variables, the coefficients for some of the
variables have minor changes, for example, the difference in speed between an 11-ft lane and a
12-ft lane is 2.05 mph when the insignificant variables are present (see Table 34) and increases
slightly to 2.22 mph when the insignificant variables are removed (see Table 35). A moderate
change occurs for the To_Right_Shld variable, going from −7.25 in Table 34 to −4.39 in Table
35.
Table 35. Parameter Estimates for Refined (Final) Reduced Operations Model.
Parameter Value Std. Error DF t-value p-value Pr(>|z|)
Intercept 67.808 0.698 663,641 97.209 <10-05 *** V2
5-min/lane −1.8×10-04 <10-05 663,641 −146.108 <10-05 ***
Med_Typ_Grass 4.606 1.687 60 2.731 0.008 *** Lane_W 2.215 0.984 60 2.250 0.028 * To_Left_B+P 3.615 0.878 136 4.117 1.0×10-04 *** To_Left_Shld 2.028 0.599 136 3.385 9.0×10-04 *** To_Right_SCL −3.890 1.135 136 −3.429 8.0×10-04 *** To_Right_Shld −4.387 0.589 136 −7.447 <10-05 *** NLight −2.004 0.028 663,641 −71.709 <10-05 *** Day_of_Week −1.471 0.009 663,641 −171.533 <10-05 *** Where:
• Lane_W = {1 for 12 ft, otherwise 0} • Med_Type_Grass = {1 if Grass, otherwise 0} • To_Left_B+P = {1 if Buffer plus Pylons, otherwise 0} • To_Left_Shld = {1 if Shoulder, otherwise 0} • To_Right_SCL = {1 if Speed Change Lane, otherwise 0} • To_Right_Shld = {1 if Shoulder, otherwise 0} • NLight = {1 for Night, otherwise 0} • Day_of_Week = {1 for Wednesday (representing weekday), otherwise 0 (representing Saturday or
weekend) Significance values are as follows: ~ p < 0.1; * p < 0.05; ** p < 0.01; and *** p < 0.001
The exclusion of the shoulder width variable, however, should not be interpreted as
indicating that a shoulder does not influence speed choice. It is possible, for example, that speed
choice is only influenced on outer lanes or at locations where shoulders are very narrow. The

56
direct influence of the shoulder on the speeds in the adjacent lanes is further addressed in the
following sections.
There may be a need to predict the speed for roadway corridors that fit within the
boundary conditions observed for the sites studied in this research effort. The resulting equation,
based on values presented in Table 35, is represented by the following equation:
Speed = 67.80 – 0.00018V25-min/lane+ 4.60(Med_Type_Grass) + 2.22(Lane_W) +
3.62(To_Left_B+P) + 2.03(To_Left_Shld) – 3.89(To_Right_SCL) –
4.39(To_Right_Shld) – 2.00(NLight) – 1.47(Day_of_Week)
Where:
V5-min/lane = Volume per 5-minute time period per lane (Ranges from 0 to 250 veh/5
minutes).
Variables as described in Table 35.
An application of this procedure is included in the following scenario.
Scenario 1 A transportation agency would like to know the expected daytime operating speed on a weekday for a freeway lane with the following characteristics:
Hourly volume rate=1200 vehicles per hour, Number of lanes = 3, Median type = concrete barrier, Lane width = 12 ft, and Lane position = center lane.
Solution: The following conditions will apply to this calculation:
• An hourly volume rate of 1200 veh/hr corresponds to 100 veh/5-min = (1200 veh/hr)/(20 5-min/hr periods)].
• The center lane in a 3-lane freeway section has a lane on both the right and left. • Wednesday can be considered a representative weekday.
Speed = 67.80 – 0.00018(100)2
5-min/lane+ 4.60(0) + 2.22(1) + 3.62(0) + 2.03(0) – 3.89(0) – 4.39(0) – 2.00(0) – 1.47(1) = 66.8 mph
Conclusion: An operating speed of approximately 67 mph can be expected for the freeway lane.
LANE NEXT TO LEFT SHOULDER MODELS
The research team developed additional models to focus the investigation on the lane
next to a shoulder and whether this lane is affected by the shoulder width. Figure 14 is a graph of

57
the average speed (per site) on the lane next to the left shoulder contrasted to the left shoulder
width. The data are subdivided by the lane width of 12 ft or 11 ft. As illustrated in Figure 14, the
range of left shoulder widths is greater for the sites with 12-ft lanes (between 5 and 23 ft) as
compared to sites with 11-ft lanes (between 1.5 and 11 ft).
Figure 14. Average Speed per Site for Lane Next to Left Shoulder by Left Shoulder Width.
Table 36 provides the parameter estimates when the lane next to the left shoulder is 12 ft
while Table 37 shows a similar analysis for 11-ft lanes. For 12-ft lanes, left shoulder width is not
a significant variable. Left shoulder width is a significant variable for 11-ft lanes. Speeds
increase by about 1.1 mph for each additional foot of shoulder width. Finding left shoulder width
significant for 11-ft but not 12-ft lanes suggests that left shoulder width is more important with a
reduced lane width.
Similar to the findings for the reduced model that combined all lane widths, the variables
that are statistically significant are volume, natural light level, and the day of the week. The city
was also significant with speeds being higher in Houston when compared to Dallas (about
5.5 mph) for 12-ft lanes. Speeds were similar for San Antonio and Dallas 12-ft lane sites. For
11-ft lanes, speeds were higher in Houston than San Antonio (about 8.0 mph). A comparison

58
with Dallas sites was not possible for the 11-ft lane group because all Dallas sites with 11-ft
lanes had a managed lane between the left-most general purpose lane and the left shoulder. Data
for managed lanes were not included in this analysis.
Table 36. Parameter Estimates for 12-ft Lane Next to Left Shoulder.
Parameter Value Std. Error DF t-value p-value Pr(>|z|) Intercept 65.951 3.607 74,626 18.289 <10-05 *** V2
5-min/lane −3.0×10-04 5.0×10-06 74,626 −64.180 <10-05 ***
Med_Typ_Grass 5.859 2.818 28 2.080 0.047 * L_Shld_W 0.195 0.267 28 0.729 0.472 CityHouston 5.491 2.574 28 2.133 0.042 * CitySanAntonio 0.058 2.550 28 0.023 0.982 NLight −1.549 0.093 74,626 −16.569 <10-05 *** Day_of_Week −1.500 0.029 74,626 −51.127 <10-05 *** Where:
• Lane_W = {1 for 12 ft, otherwise 0} • Med_Type_Grass = {1 if Grass, otherwise 0} • To_Left_B+P = {1 if Buffer plus Pylons, otherwise 0} • To_Left_Shld = {1 if Shoulder, otherwise 0} • To_Right_SCL = {1 if Speed Change Lane, otherwise 0} • To_Right_Shld = {1 if Shoulder, otherwise 0} • NLight = {1 for Night, otherwise 0} • Day_of_Week = {1 for Wednesday (representing weekday), otherwise 0 (representing Saturday or weekend) • CityHouston = {1 for Houston, otherwise 0} • CitySanAntonio = {1 for San Antonio, otherwise 0}
Significance values are as follows: ~ p<0.1; * p < 0.05; ** p < 0.01; and *** p < 0.001
Table 37. Parameter Estimates for 11-ft Lane Next to Left Shoulder.
Parameter Value Std. Error DF t-value p-value Pr(>|z|) Intercept 64.999 1.391 14,792 46.720 <10-05 *** V2
5-min/lane −2.4×10-04 8.7×10-06 14,792 −27.855 <10-05 ***
L_Shld_W 1.141 0.394 5 2.893 0.034 * CitySanAntonio −8.028 2.690 5 −2.985 0.031 * NLight −2.080 0.183 14,792 −11.362 <10-05 *** Day_of_Week −1.582 0.059 14,792 −26.697 <10-05 *** Where:
• CitySanAntonio = {1 for San Antonio, otherwise 0} • NLight = {1 for Night, otherwise 0} • Day_of_Week = {1 for Wednesday (representing weekday), otherwise 0 (representing Saturday or weekend)
Significance values are as follows: ~ p<0.1; * p < 0.05; ** p < 0.01; and *** p < 0.001

59
LANE NEXT TO RIGHT SHOULDER MODELS
Next, the research team developed models for the right-most lane (i.e., the lane next to
the right shoulder). The right shoulder width does not show statistical significance in either the
12-ft-lane model (see Table 38) or the 11-ft-lane model (see Table 39). Note that the adjustments
in the HCM are for right-side lateral clearance of 0 to 6 or more feet. All of the 12-ft lane width
sites in this dataset had 6 ft or more right shoulder width (lateral clearance). For 11-ft lane width
sites, only four of the 37 sites had either 4-ft or 5-ft right shoulder widths.
Similar to left shoulder width, there is an increase in the size of the effect for right
shoulder when the model is fitted to 11-ft lanes as compared to 12-ft lanes. The estimated effect
per additional foot of shoulder width was an increase of 0.5 mph next to 12-ft lanes, compared to
1.1 mph next to 11-ft lanes. This observation suggests the possibility that the right shoulder
width may be more important on segments with reduced lane widths. However, this increased
effect is still not statistically significant.
Table 38. Parameter Estimates for 12-ft Lane Next to Right Shoulder.
Parameter Value Std. Error DF t-value p-value Pr(>|z|) Intercept 57.377 5.657 63,732 10.143 <10-05 *** V2
5-min/lane −2.3×10-04 5.0×10-06 63,732 −44.484 <10-05 ***
Med_Typ_Grass 4.796 2.962 22 1.619 0.120 R_Shld_W 0.518 0.556 22 0.931 0.362 CityHouston 2.338 3.233 22 0.723 0.477 CitySanAntonio 0.025 3.365 22 0.007 0.994 NLight −1.719 0.091 63,732 −18.785 <10-05 *** Day_of_Week −1.479 0.026 63,732 −56.491 <10-05 *** Where:
• Med_Type_Grass = {1 if Grass, otherwise 0} • CityHouston = {1 for Houston, otherwise 0} • CitySanAntonio = {1 for San Antonio, otherwise 0} • NLight = {1 for Night, otherwise 0} • Day_of_Week = {1 for Wednesday (representing weekday), otherwise 0 (representing Saturday or weekend)
Significance values are as follows: ~ p<0.1; * p < 0.05; ** p < 0.01; and *** p < 0.001

60
Table 39. Parameter Estimates for 11-ft Lane Next to Right Shoulder.
Parameter Value Std. Error DF t-value p-value Pr(>|z|) Intercept 50.903 6.334 50,861 8.036 <10-05 *** V2
5-min/lane −1.2×10-04 4.0×10-06 50,861 −32.126 <10-05 ***
R_Shld_W 1.118 0.655 11 1.707 0.116 CityHouston −5.300 2.508 11 −2.113 0.058 ~ CitySanAntonio 0.288 2.768 11 0.104 0.919 NLight −1.880 0.088 50,861 −21.458 <10-05 *** Day_of_Week −1.077 0.027 50,861 −40.385 <10-05 *** Where:
• CityHouston = {1 for Houston, otherwise 0} • CitySanAntonio = {1 for San Antonio, otherwise 0} • NLight = {1 for Night, otherwise 0} • Day_of_Week = {1 for Wednesday (representing weekday), otherwise 0 (representing Saturday or weekend)
Significance values are as follows: ~ p<0.1; * p < 0.05; ** p < 0.01; and *** p < 0.001
OPERATIONAL ANALYSIS SUMMARY AND CONCLUSIONS
The overall objective for the research effort reviewed in this chapter was to identify the
operational implications of using reduced lane and shoulder widths for a variety of freeway
configurations. The review of the literature identified several variables that could influence speed
on a freeway lane including:
• Lane and shoulder widths,
• Use of the space to the right or left of the lane,
• Number and distance to ramps near the speed measurement point,
• Presence of horizontal or vertical curves,
• Natural lighting condition (i.e., day or night),
• Median width,
• Median type,
• Posted speed limit, and
• Vehicle type (passenger car or truck).
Because of the nature of the speed data available for this study, the analysis could not
consider the type of vehicle. The data available were average speeds for 5-minute increments
along with the number of vehicles within the same 5-minute period. The data were for individual
lanes, allowing consideration of the effects of other lanes on the speed within a specific lane.

61
The dataset included speed and volume data for 121 lanes with 12-ft widths and 83 lanes
with 11-ft widths. The analysis included urban freeways in Dallas, Houston, and San Antonio
with 2 to 5 lanes per direction. The speed data were obtained for several hours on a Wednesday
and a Saturday for each month in 2013 where data existed. In general, the team selected the
second week of a month to avoid the majority of the holidays (e.g., Thanksgiving). Speed data,
collected within 30 minutes of sunrise or sunset, were removed from the evaluation. To remove
the potential effects of congestion, data when speeds were less than 50 mph or when 5-minute
volume exceeded 250 vehicles were removed from the dataset. The modeling effort used the
pooled database from all three cities. A total of 667,297 speed records were available with about
an even split between 11-ft lanes (340,695 speed measurements) and 12-ft lanes (326,602 speed
measurements).
The analysis found that there is an increase of about 2.2 mph in speed for a 12-ft lane as
compared to an 11-ft lane. Additional left shoulder and right shoulder width may also be
associated with faster freeway speeds; however, when evaluating 12-ft and 11-ft lane widths in
the same model, those effects, if they exist, are too small to be found statistically significant
within this dataset. Another possibility is that a difference may be present if smaller shoulder
widths were available. For this dataset the right shoulder widths were a minimum of 6 ft for 11-ft
lane widths and 4 ft for 12-ft lane widths. When evaluating the impacts of shoulder width on the
lane next to the shoulder, the research team noted a statistically significant relationship between
left shoulder width and speed on the left-most lane. Speed can be expected to increase by about
1.1 mph for each additional foot of shoulder width. Finding the left shoulder width significant for
11-ft but not 12-ft lanes implies that left shoulder width is more important with a reduced lane
width.
The model indicates that the lane on the far right of the freeway has a speed that is about
4.4 mph lower (compared with a lane located between two other lanes), everything else equal
(statistically significant). The results also indicate that Texas freeway drivers operate with 2 mph
lower speeds during night time (with roadside lighting present) and at higher speeds (1.5 mph)
on the weekends (Saturday as compared to Wednesday).
Posted speed limits have been found to be significant for other functional classification
roads such as arterials (TRB, 2011); however, the posted speed limit variable for this freeway
evaluation was not found to be significant in preliminary analyses. This finding is likely due to

62
the small (60 to 70 mph) range of speed limits with most of the data associated with the 60 mph
speed limit. Similarly, this study did not determine the number of freeway lanes to be significant
in the models.
The HCM includes adjustments to the freeway FFS for lane width and right-side lateral
clearance. The result of this Texas study indicates that the reduction in FFS is slightly greater for
11-ft lanes (2.2 mph) than the value present in the HCM (1.9 mph). The HCM provides FFS
reductions when the right-side lateral clearance is less than 6 ft. For left-side (or median-side)
lateral clearances, the HCM comments that clearances 2 ft or more have little influence on
freeway operations. The findings from this Texas study support the HCM right-side
recommendations for lateral clearances of 6 ft and greater in that no adjustments are needed to
the FFS. The findings from this Texas study did indicate that modifications to the HCM with
respect to left-side lateral clearances may be appropriate under select conditions. Table 40 shows
the adjustments to FFS of an 11-ft, left-most lane due to left-side lateral clearances of less than
10 ft, based on the findings from the evaluation that focused on the impact of left shoulder width
on left-most lane.
Table 40. Adjustment to FFS for Left-Most Lane Due to Left-Side Lateral Clearance on
Freeway with 11-ft Lane Based on Findings from Evaluation that Focused on the Impact of Left Shoulder Width on Left-Most Lane.
Left-Side Lateral Clearance (ft) Adjustment to FFS (mph) 10 ft or more 0.0
9 1.1 8 2.2 7 3.3 6 4.4 5 5.5 4 6.6 3 7.7 2 8.8 1 9.9
The research team developed a final reduced model for use in estimating speed, as
demonstrated in Scenario 1. This model can be used by decision makers to balance the various
geometric considerations, but should only be used for scenarios that adhere to its associated
boundary conditions.

63
CHAPTER 5. SAFETY ANALYSIS
In preparation for developing models to predict the number of crashes for a specific
freeway configuration, the research team examined marginal plots of the most relevant variables.
Figure 15 shows a direct proportion between the number of crashes and how they tend to
increase with increasing AADT. This observation is expected since it is known that there are
more opportunities for crashes in proportion to the AADT.
Figure 15. Crashes per Mile vs. AADT.
There are two exposure measures in the dataset: Number of Years (i.e., the length in time
represented by a database record, expressed in years) and Segment Length (length of a Site
segment, expressed in miles). The exploratory analysis helped to identify potential trends of the
variables of interest, when controlling preliminarily by exposure and AADT. For this purpose,
the research team calculated the quantity (yearly crashes per vehicle miles traveled [VMT]) ×
1000, which is the rate of 1000 crashes per vehicle-mile-traveled per year and contrasted this
variable to the cross-sectional elements of interest.
0 50000 100000 150000 200000 250000
050
100
150
Annual Average Daily Traffic (vehicles pe
Cra
shes
per
Per
iod
per M
CityDAHOSA

64
Figure 16 shows the trend of this variable versus the average lane width. Except for 2-
lane freeways (representing lanes wider than 11.8 ft only), there is a clear decreasing trend,
though there is a significant amount of unexplained variability, probably associated with
differences in other critical variables.
Figure 16. (Yearly Crashes per VMT) × 1000 vs. Average Lane Width.
As shown in Figure 17, the trend for left shoulder width, however, is more distinct.
Again, only 2-lane freeways appear to have a flat trend line.
11.0 11.5 12.0 12.5
0.0
0.2
0.4
0.6
0.8
1.0
1.2
1.4
Average Lane (ft)
(Yea
rly C
rash
es p
er V
MT
NLanes23456

65
Figure 17. (Yearly Crashes per VMT) × 1000 vs. Left Shoulder Width.
Next, the research team examined the relationship between the right shoulder and
crashes. Figure 18 shows a preliminary assessment of this relationship. In this case, although
there are a few sites with relatively narrow shoulders and a few sites with 15 ft shoulders, this
variable is representative of a narrow range with most shoulders being between 9 and 12 ft.
0 5 10 15 20
0.0
0.2
0.4
0.6
0.8
1.0
1.2
1.4
Left Shoulder Width (ft)
(Yea
rly C
rash
es p
er V
MT)
x 1
0
NLanes23456

66
Figure 18. (Yearly Crashes per VMT) × 1000 vs. Right Shoulder Width.
A gap in data is noticeable between 2 ft and 6 ft right shoulders. The three segment-
periods with a 2-ft right shoulder correspond to one site in San Antonio, where a concrete barrier
was present between October 2012 and September 2014 (see Figure 19). The implications of
having this site in the analysis will be reviewed later in this section.
2 4 6 8 10 12 14
0.0
0.1
0.2
0.3
0.4
0.5
Right Shoulder Width (ft)
(Yea
rly C
rash
es p
er V
MT)
x 1
0
NLanes2345

67
Figure 19. Street View of Site with Narrowest Right Shoulder Width.
Although this exploratory analysis suggests that the number of crashes tends to be
smaller for wider cross-sectional elements, a formal evaluation of that relationship requires
controlling for other influential variables. The next section describes the statistical methodology
and analysis results for this formal evaluation.
STATISTICAL MODEL
Every statistical evaluation is based on a set of assumptions about the data, and how that
data relates to mathematical structures and statistical distributions. The following section
provides an overview of the statistical methodology selected for this research.
Statistical Methodology
Because the data included more than one time period from each site, the statistical
methodology had to explicitly consider the grouping structure in the data. All crashes from a
common space unit (i.e., site) should be considered a cluster that shares an expected baseline
number of crashes. The methodology in this effort includes random effects as the modeling tool
to account for this baseline of crashes. Any contributions to the number of crashes at a site that

68
due to unobserved variables or factors is implicitly captured in the mentioned baseline for that
site, after controlling for the effects of the known variables.
A Poisson-lognormal Generalized Linear Mixed model has the required ability to account
for both random and fixed effects simultaneously. The model is constructed under the
assumption that the number of crashes at study sites for a given time period follows the Poisson
(or random) distribution. The random effect variability is modeled as white noise around the
average of crashes at the reference level in the sample of segment-periods of analysis.
Poisson-Lognormal Mixed Model
There are several analysis periods for a given site i in the dataset. The model specifies
that all observed crashes at site i from all available j analysis periods can be reasonably described
by the Poisson distribution, whose probability function is given by:
𝑃�𝑁𝑖 = 𝑛𝑖𝑖� =𝜆𝑖𝑛𝑖𝑖
𝑛𝑖𝑖!∙ 𝑒−𝜆𝑖
where:
𝑁𝑖 = Number of crashes at any given analysis period for the i-th site.
𝑛𝑖𝑖 = An actual count of crashes for the j-th analysis period at the i-th site, such that 𝑛𝑖𝑖 ∈ {0,ℤ+}.
𝜆𝑖 = Poisson distribution parameter at the i-th site.
It can be shown that the expected number of crashes at the i-th site is simply 𝐸(𝑁𝒊) = 𝜆𝑖
for the Poisson distribution.
The research team constructed the database to represent time periods of different lengths
(all shorter than a year, half a year at the most); additionally, each site was characterized by
different homogeneous cross-section freeway lengths. It is necessary to control for these
differences explicitly.
The product of the time period length (expressed in years) and the segment length
(expressed in miles) for each record in the database has units of mile-years (mi-yr). This product
quantifies the amount of exposure to the crash generation process that resulted in 𝑛𝑖𝑖 observed

69
crashes. Therefore, for a given segment-period with amount of exposure 𝛾, a model can be
established such that:
𝜆𝑖 = 𝛾 ∙ 𝜗𝑖 where:
𝜗𝑖 has units of crashes/mi-yr.
Since 𝛾 = 1.0 when segment length = 1 mi, and period length=1 year, 𝜗𝑖 can be
estimated by regression techniques, such that the interpretation of the results is in terms of the
change in expected yearly crashes per mile corresponding to changes in the critical observed
variables (named fixed effects from this point forward).
The exponential function is used to parameterize the quantity 𝜗𝑖 so that it links crash
counts from each site to a corresponding set of critical observed variables. For the i-th site, the
parameter 𝜗𝑖 is such that:
𝜗𝑖 = 𝐴𝐴𝐴𝐴𝛼 ∙ 𝑅𝐸𝑖 ∙ exp(𝑋𝑇 ∙ 𝛽) where:
AADT = Annual Average Daily Traffic (vpd).
𝛼 = Fixed exponent.
𝑋 T
=
=
Vector of fixed effects (i.e., explanatory variables).
Represents the matrix operation of transposition, necessary to multiply vectors X and 𝛽.
𝛽 = Vector of fixed-effects coefficients.
𝑅𝐸𝑖 = Random effect for i-th site.
All other variables as previously defined.
As indicated by the sub-index, the model estimates a unique 𝑅𝐸𝑖 for each site i. The
distribution of all 𝑅𝐸𝑖 should roughly be log-normal, a characteristic that must be verified after
the model estimation. This requirement is represented by the following equation form:
𝑅𝐸𝑖~LogNormal(𝜇,𝜎2) where:

70
𝜇 = Location parameter of lognormal distribution.
𝜎2 = Scale parameter of lognormal distribution.
All other variables as previously defined.
If the above condition holds, then it can be shown that:
𝜗 = 𝐴𝐴𝐴𝐴𝛼 ∙ exp�𝜇 +𝜎2
2� ∙ exp(𝑿𝑇 ∙ 𝜷)
where:
𝜗 = is the expected yearly crashes per mile, given AADT and the variables represented in X.
The above equation applies to a population of sites, given the sites in the database are
representative of the larger population. This representativeness is easily established if the data at
hand were a random sample of sites. For this study, the site selection process was not completely
random for a variety of reasons including the need to co-locate crash analysis sites with
operational sites where possible. However, statistical inference is still possible but in reference to
a theoretical underlying population of sites.
The statistical analysis estimates the quantities 𝜇ln(𝑅𝑅) and 𝜎2ln(𝑅𝑅) from the site random
effects variability alongside the coefficients for the fixed effects (i.e., 𝛼 and 𝛽). The quantity 𝜗
represents the expected number of yearly crashes per mile, at any site, after accounting for the
particular values of its fixed-effects since:
𝐸(𝑁) = 𝜆 = 𝛾 ∙ 𝜗 = 𝜗|𝛾 = 1.0
The next section reviews results from estimating the model from the methodology just
described.
PRELIMINARY MODELS FOR TOTAL CRASHES
As a first step, the research team selected the variables to be included as fixed effects in
the model and the variables that define exposure. These variables were selected based on the
findings of previous studies and as published in the associated literature. These initial model
variables included AADT, segment length, number of lanes, and proximity of ramps. The

71
researchers also included an indicator variable for the associated city so as to account for
differences among the three study cities that may be due to other characteristics not directly
captured by the variables. The cross-sectional elements (lane and shoulder width) were also
included at this point to explore their influence on the number and type of crashes. Table 41
shows the coefficients for the set of initial candidate variables.
Table 41. Full Model Estimates.
Parameter Estimate Std. Error z-val p-val Pr(>|z|)
𝜶 4.89×10-01 2.21×10-01 2.213 0.027 * Ave_Lane_W 2.54×10-01 3.42×10-01 0.741 0.459
NLanes −4.66×10-01 1.81×10-01 −2.569 0.010 *
Leftmost_Cond_Grass −1.32 9.82×10-01 −1.342 0.180
Leftmost_Cond_Barrier −1.20×10-01 6.33×10-01 −0.189 0.850
R_Shld_W −7.88×10-02 4.50×10-02 −1.749 0.080 ~ L_Shld_W −1.06×10-01 3.86×10-02 −2.741 0.006 **
CityHouston 3.66×10-01 5.26×10-01 0.697 0.486 CitySanAntonio 3.27×10-01 5.30×10-01 0.616 0.538
Ramp_Up_D −2.39×10-04 1.08×10-04 −2.212 0.027 * Ramp_Dwn_D) −2.02×10-04 9.62×10-05 −2.104 0.035 *
Posted Speed Limit −3.08×10-02 6.67×10-02 −0.462 0.644 𝝁𝐥𝐥(𝑹𝑹) 5.06×10-02 6.36 0.008 0.994
𝝈𝟐𝐥𝐥(𝑹𝑹) 1.104
Significance values are as follows: ~ p<0.1; * p < 0.05; ** p < 0.01; and *** p < 0.001
Several of the coefficients shown in Table 41 do not have significant influences for
explaining crash counts. In particular, (1) there are no significant differences between sites from
the three cities under study, and (2) there are no significant differences among the three left-most
conditions (i.e., beyond the left shoulder) of the segments represented in the database: (a)
buffer/pylons separating HOV lane from the general purpose lanes; (b) grass median; and (c)
concrete barrier.

72
However, the number of lanes and shoulder widths are statistically significant variables,
even when the model includes many other insignificant variables. As these variables increase
(e.g., when wider shoulders are present), fewer crashes occur. The number of lanes is associated
with a crash reduction, in contrast to the insignificant average lane width value. The research
team performed a step-wise model reduction, a procedure that arrived at the coefficients shown
in Table 42.
Table 42. Reduced Total Crash Model Estimates.
Parameter Estimate Std. Error z-val p-val Pr(>|z|) 𝜶 5.40×10-01 2.19×10-01 2.467 0.014 *
Ave_Lane_W 1.05×10-01 2.87×10-01 0.367 0.714 NLanes −3.02×10-01 1.54×10-01 −1.961 0.050 * R_Shld_W −7.31×10-02 4.38×10-02 −1.667 0.096 ~ L_Shld_W −8.09×10-02 3.19×10-02 −2.541 0.011 *
Ramp_Up_D −2.04×10-04 1.06×10-04 −1.932 0.053 ~ Ramp_Dwn_D −2.00×10-04 9.46×10-05 −2.111 0.035 *
𝝁𝐥𝐥(𝑹𝑹) −1.50 4.22 −2.41 1.59×10-02 * 𝝈𝟐𝐥𝐥(𝑹𝑹) 1.168561
Significance values are as follows: ~ p<0.1; * p < 0.05; ** p < 0.01; and *** p < 0.001
Following the systematic removal of the posted speed limit, left-most condition, and city
variables, the remaining variables previously depicted in Table 41 maintained their statistical
significance. The only critical variable without a significant effect is the average lane width.
After a closer examination of the explanatory variables, the research team determined
that an important correlation exists between two critical variables: left shoulder and average lane
widths. This correlation influences the relative magnitudes and statistical significance of the
estimates for the involved variables. Figure 20 illustrates this issue. The widest left shoulders in
the dataset tend to be paired with the widest average lane widths, regardless of the number of
lanes in the cross section.

73
Figure 20. Left Shoulder Width vs. Average Lane Width.
In contrast, the variable width of all lanes (All_Lanes_W) is relatively independent of the
left shoulder width, as can be seen in Figure 21. This figure also shows that the variable
All_Lanes_W is distinct for segments with different numbers of lanes; all segments with the
same number of lanes have a range for All_Lanes_W that does not overlap with the range of
segments with any other number of lanes. This implies that for segments with the same number
of lanes, the additional variability of All_Lanes_W is due to differences in the width of the
average lane. Accordingly, the mathematical relationship among Ave_Lane_W, All_Lanes_W,
and NLanes establishes that there is only one possible value for one variable, given that the other
two are fixed:
(Ave_Lane_W) = ( All_Lanes_W) / (NLanes)
Another important observation is that All_Lanes_W is a direct substitute for
Ave_Lane_W for a fixed NLanes value because of the distinct relationship between
All_Lanes_W and NLanes.
11.0 11.5 12.0 12.5
510
1520
Average Lane (ft)
Left
Sho
ulde
r Wid
th (f
t)
Number of Lanes 3456

74
Figure 21. Left Shoulder Width vs. All-Lanes Width (All_Lanes_W)
Considering the advantages of using All_Lanes_W instead of Ave_Lane_W, the research
team fit a model by substituting All_Lanes_W for the two variables (Ave_Lane_W and NLanes).
Table 43 shows the final total crash model.
Table 43. Final Reduced Model Estimates for Total Crashes
Parameter Estimate Std. Error z-val p-val Pr(>|z|) 𝜶 5.39×10-01 2.19×10-01 2.459 0.014 *
All_Lanes_W −2.41×10-02 1.30×10-02 −1.854 0.064 ~ R_Shld_W −7.35×10-02 4.33×10-02 −1.696 0.090 ~ L_Shld_W −6.46×10-02 2.20×10-02 −2.933 0.003 **
Ramp_Up_D −1.94×10-04 1.02×10-04 −1.901 0.057 ~ Ramp_Dwn_D −2.06×10-04 9.21×10-05 −2.238 0.025 *
𝝁𝐥𝐥(𝑹𝑹) −5.73×10-01 2.66 −3.44 5.76×10-04 𝝈𝟐𝐥𝐥(𝑹𝑹) 1.151329
Significance values are as follows: ~ p<0.1; * p < 0.05; ** p < 0.01; and *** p < 0.001
This model establishes that there is an inverse relationship between the number of crashes
and the following variables: All_Lanes_W, R_Shld_W, L_Shld_W, Ramp_Up_D, and
Ramp_Dwn_D. More details on these relationships will be provided later in this chapter. The
model can be presented in the following equation format:
40 50 60 70
510
1520
All Lanes Width (ft)
Left
Sho
ulde
r Wid
th (f
t) Number of Lanes 3456

75
NTotal= 1.0027 × L × AADT0.539 × e�−1.0243(Ramp_Up_D)−1.0877(Ramp_Dn_D)−0.0241�NLane×Lane_WAvg�−0.0735(R_Shld_W)−0.0646(L_Shld_W)� Where:
NTotal = Total number of predicted crashes (crashes per year).
L = Length of study segment.
AADT = Annual average daily traffic in one direction (vpd).
Ramp_Up_D = Distance to closest upstream ramp (ft).
Ramp_Dn_D = Distance to closest downstream ramp (ft).
NLane = Number of travel lanes in a single direction.
Lane_WAvg = Average lane width (ft).
R_Shld_W = Width of right shoulder (ft).
L_Shld_W = Width of left shoulder (ft).
MODEL FOR KAB CRASHES
The association of the lane and shoulder width on frequency of total crashes, while
important, may not be as critical as the relationship between these road characteristics and injury
crashes (specifically KAB crashes). To evaluate this relationship, the research team used the total
crash model and developed a corresponding KAB crash model. The resulting coefficients have
trends that are consistent to those previously observed for total crashes. Table 44 presents the
KAB model.
Table 44. Final Model Estimates for KAB Crashes.
Parameter Estimate Std. Error z-val p-val Pr(>|z|) 𝜶 6.62×10-01 2.65×10-01 2.495 0.013 *
All_Lanes_W −2.53×10-02 1.10×10-02 −2.295 0.022 * R_Shld_W −9.56×10-02 5.08×10-02 −1.883 0.060 ~ L_Shld_W −5.47×10-02 2.23×10-02 −2.455 0.014 *
Ramp_Up_D −2.99×10-04 9.36×10-05 −3.195 0.001 ** Ramp_Dwn_D −1.64×10-04 7.29×10-05 −2.249 0.024 *
𝝁𝐥𝐥(𝑹𝑹) −3.18 3.05 −3.85 1.17×10-04 𝝈𝟐𝐥𝐥(𝑹𝑹) 0.4186
Significance values are as follows: ~ p<0.1; * p < 0.05; ** p < 0.01; and *** p < 0.001

76
This model can be written in the following equation format: 𝑁𝐾𝐾𝐾= 0.0514 × 𝐿 × 𝐴𝐴𝐴𝐴0.662 × 𝑒�−1.5787(𝑅𝑅𝑅𝑅𝑅𝑅𝐷𝑖𝑖𝐷)−0.8659(𝑅𝑅𝑅𝑅𝑅𝑛𝐷𝑖𝑖𝐷)−0.0253�𝑁𝑁𝑁𝑛×𝑁𝑅𝑛𝐿𝑊𝐴𝐴𝐴�−0.0956(𝑅𝑅ℎ𝑙𝑙)−0.0547(𝑁𝑅ℎ𝑙𝑙)�
DISCUSSION OF RESULTS
The coefficients for the KAB crashes model indicate that:
• There is a safety improvement associated with increased lane width for lanes up to and
not exceeding 12-ft wide. Each coefficient estimate represents the rate of change for the
natural logarithm of KAB crashes per unit of change for the independent variable. In the
case of average lane width, the rate can be derived from the coefficient for All_Lanes_W
as follows:
𝜕𝜕𝐴𝜕𝑒_𝐿𝐿𝑛𝑒_𝑊
ln𝐸[𝐾𝐴𝐵𝐶𝐶𝑅𝐶ℎ𝐿𝐶] = �𝛽𝐾𝑙𝑙_𝑁𝑅𝑛𝐿𝐶_𝑊�. (𝑁𝑁_𝐿𝐿𝑛𝑒𝐿)
Using this relationship, Table 45 shows the safety benefit of 12-ft lanes compared to 11-ft
lanes, based on the number of travel lanes per direction, when there are no changes in the other
variables included in the model.
Table 45. Safety of Lane Width (KAB Crashes).
NLanes Multiplicative Effect in Model
KAB Crash Reduction of a 12-ft Lane Compared to 11-ft
2 0.95 5% 3 0.93 7% 4 0.90 10% 5 0.88 12%
• Similarly, there is a safety improvement associated with each additional lane. This effect
can be also derived from the coefficient for All_Lanes_W. For a constant lane width,
when there are no changes in the other model variables, calculating the reduction in
crashes for an additional lane can be determined using the following relationship:
𝜕
𝜕𝑁𝐿𝐿𝑛𝑒𝐿ln𝐸[𝐾𝐴𝐵𝐶𝐶𝑅𝐶ℎ𝐿𝐶] = �𝛽𝐾𝑙𝑙_𝑁𝑅𝑛𝐿𝐶_𝑊�. (𝐴𝜕𝑒_𝐿𝐿𝑛𝑒_𝑊)

77
Table 46 shows the safety benefit per additional lane, given different average lane widths.
Table 46. Safety Change per Additional Lane (KAB Crashes).
Average Lane Width (ft) Multiplicative Effect
Reduction of KAB Crashes per Additional Lane
11.0 0.76 24% 11.5 0.75 25% 12.0 0.74 26%
• There is a safety improvement associated with increased left shoulder widths. This effect
is a reduction of crashes by 5 percent (5 percent = 1 − exp(−5.47×10-02)) per additional
foot of left shoulder, when there are no changes to the other model variables.
• There is a safety improvement associated with increased right shoulder widths. This
effect is a reduction of crashes by 9 percent (9 percent =1 − exp(−9.56×10-02)) per
additional foot of right shoulder, when there are no changes in the rest of variables in the
model.
Sensitivity of the Results for the Right Shoulder Effect
The research team reviewed how the results are affected by including data from site 13-
R-SA-3 when right shoulder was reduced to 2 ft (see Figure 19). This is the narrowest right
shoulder width in the dataset and a sizable gap exists between this minimum value and the next
shoulder width value of 6 ft (see Figure 18). The effect of right shoulder in the model is distinct
and significant for the range of right shoulders represented when this site is included in the
analysis (2 ft to 14.8 ft). However, when the data from this site are not included in the analysis,
the effect of right shoulder is statistically insignificant (0.790 p-value), with the range of the
represented right shoulder widths represented being significantly reduced as well (6 ft to 14.8 ft).
The research team carefully examined the data from this site, but did not find any valid
reasons to not include it in the analysis. Furthermore, this site is one of the few in the dataset
where changes in the cross section were detected in the aerial photographs. Table 47 presents the
data corresponding to the two periods when this site had distinctly different widths for critical
cross-section elements. Unfortunately, the two periods differ in variables other than just the right
shoulder that impedes an intuitive, direct comparison of the effect of right shoulder. For

78
example, the AADT has expectedly increased, and the distances to the closest upstream and
downstream ramps have also changed, indicating the addition of new ramps and the removal of
older decommissioned ramps.
Table 47. Changes in Cross Section and Crashes for Site 13-R-SA-3.
Feature Before Period After Period Years 2010–2012 2012–2013 Period Length in Dataset 2.3 years 1.1 years AADT 138,008 vpd 162,800 vpd Right Shoulder 11.5 2.0 Ramp_Up_D 0.29 mi 0.41 mi Ramp_Dwn_D 0.93 mi 0.35 mi Yearly Total Crash Expectation 6.22 crashes/yr 7.99 crashes/yr Predicted Total Crashes for Period 14.30 8.79 Observed Total Crashes for Period 13 10 Yearly KAB Crash Expectation 1.73 crashes/yr 3.42 KAB/yr Predicted KAB for Period 3.98 3.76 Observed KAB Crashes for Period 4 4
The data presented in Table 47 corresponds to the site with the largest change in right
shoulder identified for this study. The researchers calculated the yearly crash expectations as
shown in Table 47 using the coefficients from the models in Table 43 and Table 44. These yearly
expectations indicate increases in both total crashes and KAB crashes between the periods with
different cross sections. The research team does not consider the trends observed at this site
anomalous at any level other than the unusually narrow right shoulder for the second time
period; on the contrary, the expected change in yearly crashes corresponds very closely with the
actual crash frequencies observed for each period.
Even when the analysis appropriately accounts for the crash trends observed at the site
with the narrowest right shoulder, the research team recognizes that the statistical significance of
the effect for right shoulder in the analysis is dependent upon including the data from this site.
This observation will be noted in the conclusions.
Safety Associated with Freeway Sections
Using the statistical model developed in this study, it is possible to make calculations of
the expected safety changes associated with various scenarios. The research team developed a

79
spreadsheet to help with the model calculations; however, the calculations can be manually
performed as demonstrated in the following scenario.
Scenario 2 A transportation agency would like to know the expected total number of crashes and number of injury crashes for a freeway section with the following characteristics:
Length = 0.5 miles AADT = 150,000 NLanes = 4 lanes Ramp_Up_D = 0.5 mi Ramp_Dwn_D = 1.0 mi Ave_Lane_W = 12 ft lanes (or All_Lanes_W = 48 ft) R_Shld_W = 10 ft L_Shld_W = 6 ft
𝑁𝑇𝑁𝑇𝑅𝑙 = 1.0027 × (0.5) × 150,0000.539
× 𝑒[−1.0243(0.5)−1.0877(1.0)−0.0241(4×12)−0.0735(10)−0.0646(6)] = 6.39 𝑁𝐾𝐾𝐾 =0.0514 × 0.5 × 150,0000.662 × 𝑒[−1.5787(0.5)−0.8659(1.0)−0.0253(4×12)−0.0956(10)−0.0547(6)] =1.08 Conclusion: A total number of approximately 6 crashes, including 1 injury crash, can be expected for the freeway location.
The research team prepared additional scenarios where the intent is to estimate the impact
on expected number of crashes associated with changes in cross sectional elements. In order to
address these scenarios, some of the variables present in the model are not necessary -- only the
variables where changes are expected.
The marginal safety change associated with the change for a particular variable is simply:
∆𝐾𝐴𝐵𝐶𝐶𝑅𝐶ℎ𝐿𝐶 = exp ��𝜕
𝜕𝜕𝐿𝜕𝜕𝐿𝜕𝜕𝑒ln𝐸[𝐾𝐴𝐵𝐶𝐶𝑅𝐶ℎ𝐿𝐶]� . (∆𝜕𝐿𝜕𝜕𝐿𝜕𝜕𝑒)�
By extension, to calculate the total change in crashes due to changes in multiple
variables, the expression inside the brackets on the right side of the equation can include
additional summands corresponding to marginal changes of each variable. Scenario 3 and
Scenario 4 demonstrate this procedure.

80
Scenario 3 A transportation agency is considering adding a general purpose lane to the freeway section introduced in Scenario 2, but would like to maintain the same width of the paved surface. Adding a lane requires reducing the width of the current the lanes and shoulders. The agency would like to know the expected change in KAB crashes due to the change in the cross section. If the 64 ft of available cross-sectional space were to be converted to 5 freeway lanes with an average lane width of 11 ft, a right shoulder of 8 ft, and a left shoulder of 1 ft, then the expected change in the number of crashes can be estimated as follows:
𝐶ℎ𝐿𝑛𝑎𝑒 𝜕𝑛 𝐶𝜕𝐿𝐿ℎ𝑒𝐿= exp[{(−2.53) × 10−02} × (55 − 48) + {(−9.56) × 10−02} × (8 − 10)+ {(−5.47) × 10−02} × (1 − 6)] = 1.33
Conclusion: If there are no other changes to the site variables, this would then represent an increase of 33% in the number of KAB crashes. The primary contributing factor to this predicted increase in crashes is the reduction of the shoulder widths. This resulted in larger adverse safety effects than the positive safety effects of adding a new lane. In fact, the analysis indicates that a net adverse safety effect is expected for any shoulder reduction that corresponds to an equal increase in the total width of the travel lanes, since the magnitude of coefficients corresponding to the shoulder widths are substantially larger than the coefficient for total lanes width.
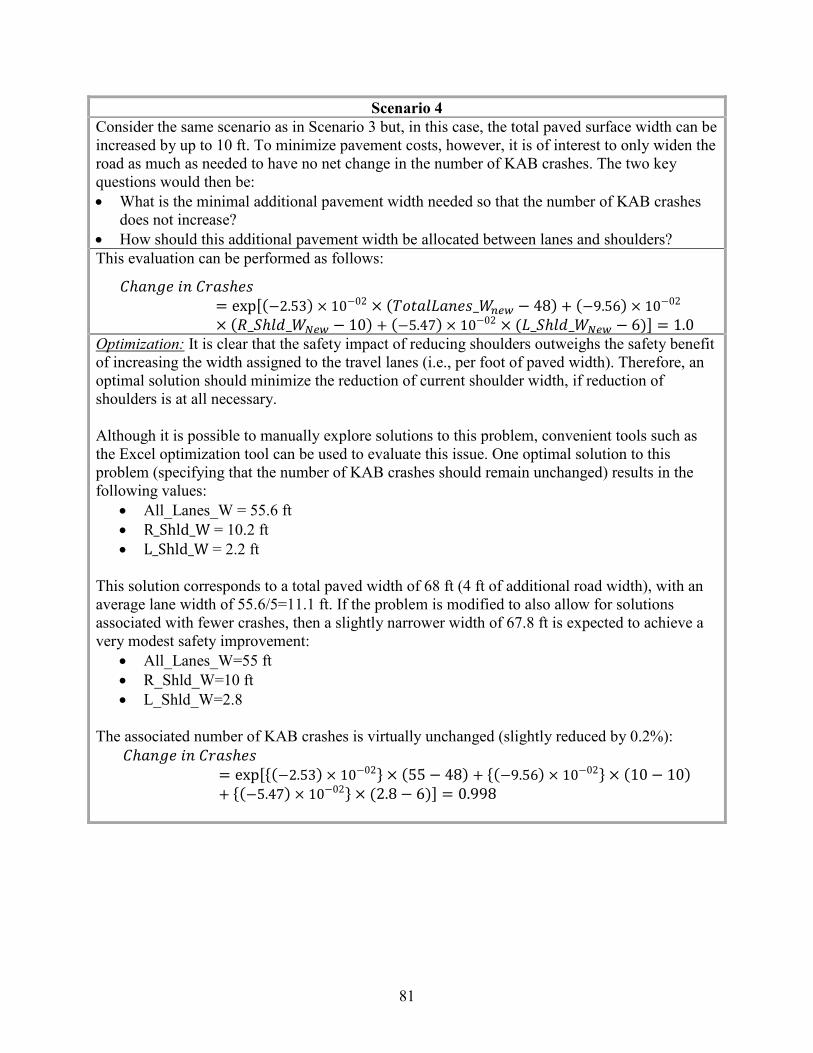
81
Scenario 4 Consider the same scenario as in Scenario 3 but, in this case, the total paved surface width can be increased by up to 10 ft. To minimize pavement costs, however, it is of interest to only widen the road as much as needed to have no net change in the number of KAB crashes. The two key questions would then be: • What is the minimal additional pavement width needed so that the number of KAB crashes
does not increase? • How should this additional pavement width be allocated between lanes and shoulders? This evaluation can be performed as follows:
𝐶ℎ𝐿𝑛𝑎𝑒 𝜕𝑛 𝐶𝜕𝐿𝐿ℎ𝑒𝐿= exp[(−2.53) × 10−02 × (𝐴𝑁𝑇𝐿𝜕𝐿𝐿𝑛𝑒𝐿_𝑊𝑛𝐿𝑛 − 48) + (−9.56) × 10−02
× (𝑅_𝑆ℎ𝜕𝑙_𝑊𝑁𝐿𝑛 − 10) + (−5.47) × 10−02 × (𝐿_𝑆ℎ𝜕𝑙_𝑊𝑁𝐿𝑛 − 6)] = 1.0 Optimization: It is clear that the safety impact of reducing shoulders outweighs the safety benefit of increasing the width assigned to the travel lanes (i.e., per foot of paved width). Therefore, an optimal solution should minimize the reduction of current shoulder width, if reduction of shoulders is at all necessary. Although it is possible to manually explore solutions to this problem, convenient tools such as the Excel optimization tool can be used to evaluate this issue. One optimal solution to this problem (specifying that the number of KAB crashes should remain unchanged) results in the following values:
• All_Lanes_W = 55.6 ft • R_Shld_W = 10.2 ft • L_Shld_W = 2.2 ft
This solution corresponds to a total paved width of 68 ft (4 ft of additional road width), with an average lane width of 55.6/5=11.1 ft. If the problem is modified to also allow for solutions associated with fewer crashes, then a slightly narrower width of 67.8 ft is expected to achieve a very modest safety improvement:
• All_Lanes_W=55 ft • R_Shld_W=10 ft • L_Shld_W=2.8
The associated number of KAB crashes is virtually unchanged (slightly reduced by 0.2%):
𝐶ℎ𝐿𝑛𝑎𝑒 𝜕𝑛 𝐶𝜕𝐿𝐿ℎ𝑒𝐿= exp[{(−2.53) × 10−02} × (55 − 48) + {(−9.56) × 10−02} × (10 − 10)+ {(−5.47) × 10−02} × (2.8 − 6)] = 0.998

82
SUMMARY AND CONCLUSIONS
The objective of this crash analysis was to quantify the safety implications of adding a
lane to a freeway segment cross section with limited space for expansion where cross-sectional
element widths are reduced.
The research team collected geometric, operational, and safety data from urban freeways
in three cities in Texas: Dallas, Houston, and San Antonio. This dataset represents the period
from 2010 to 2013. The research team estimated the safety effects of changing the width of
various cross-sectional elements using this dataset, after accounting for other influential
variables, such as AADT.
This analysis demonstrated that the adverse effect on the number of crashes due to
reducing shoulders outweighs the safety benefit of adding lanes, under the scenario that the total
paved width (lanes and shoulders) was not changed. However, results also show that if it is
possible to increase the total paved width when adding a travel lane, it is feasible to identify lane
and shoulder widths so that the number of crashes will remain consistent and safety along the
corridor will not be compromised. Any lane and shoulder widths identified using this procedure,
however, must be contrasted with recommended values in design manuals.

83
CHAPTER 6. CONCLUSIONS AND RECOMMENDATIONS
The research effort summarized in this report documents the analyses of lanes and
shoulders to determine how changing (narrowing) their widths can impact the overall operational
and safety performance of a Texas freeway facility. For the operational impacts, the review of
the literature identified several variables expected to influence freeway speed. They included:
• Lane width.
• Shoulder widths.
• Use of the space to the right or left of the lane.
• Number and distance to ramps near the speed measurement point.
• Presence of horizontal or vertical curves.
• Natural lighting condition (i.e., day or night).
• Median width.
• Median type.
• Posted speed limit.
• Vehicle type (passenger car or truck).
Due to the nature of the speed data available for this study, the analysis could not consider the
type of vehicle.
The research team evaluated average speed data per lane for 5-minute increments along
with the number of vehicles within the same 5-minute period. The study locations were in
Dallas, Houston, and San Antonio. These data included speed and volume data for 121 lanes
with 12-ft widths and 83 lanes with 11-ft widths for freeways with 2 to 5 lanes per direction of
travel. The speed data were obtained for several hours on a Wednesday and a Saturday for each
month in 2013 where data existed. To remove the potential effects of congestion, speeds less
than 50 mph and 5-minute volumes greater than 250 were removed from the dataset.
The operational analysis determined the following:
• There is an increase of about 2.2 mph in speed for a 12-ft lane as compared to an 11-ft
lane.
• Wider left shoulder and right shoulder widths appear to be associated with faster freeway
speeds; however, when evaluating 12-ft and 11-ft lane widths in the same model, those
effects, if they exist, are too small to be found statistically significant. Note that the
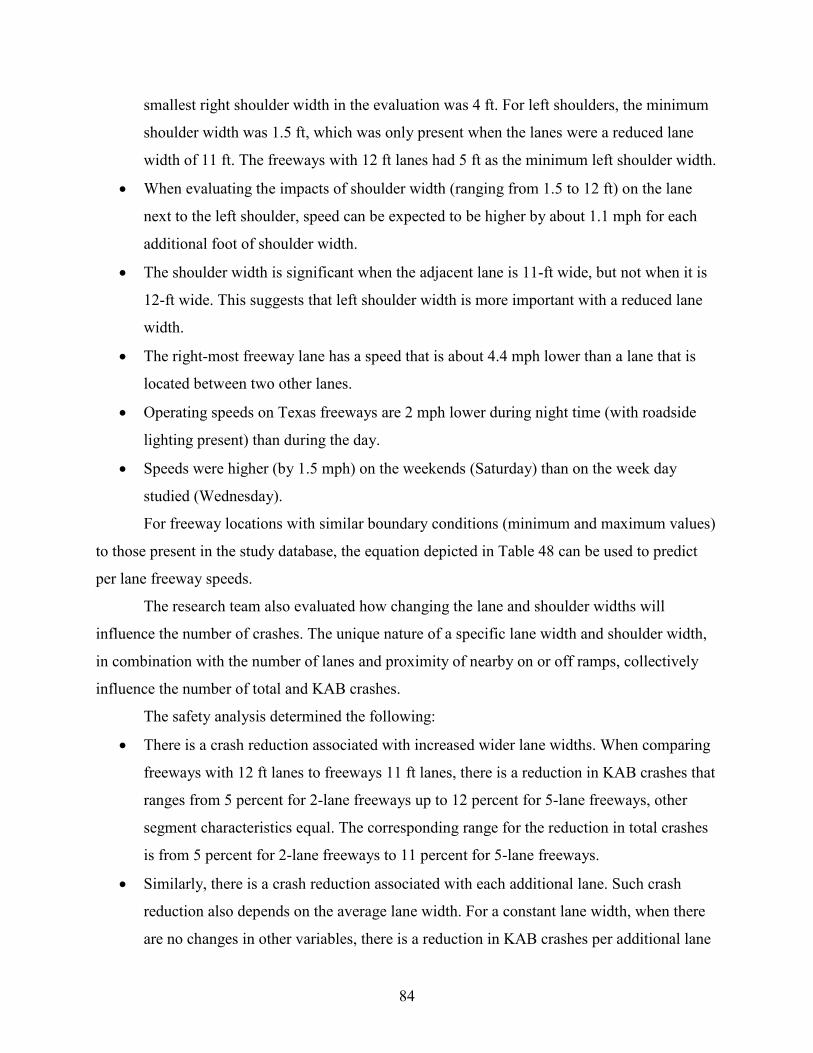
84
smallest right shoulder width in the evaluation was 4 ft. For left shoulders, the minimum
shoulder width was 1.5 ft, which was only present when the lanes were a reduced lane
width of 11 ft. The freeways with 12 ft lanes had 5 ft as the minimum left shoulder width.
• When evaluating the impacts of shoulder width (ranging from 1.5 to 12 ft) on the lane
next to the left shoulder, speed can be expected to be higher by about 1.1 mph for each
additional foot of shoulder width.
• The shoulder width is significant when the adjacent lane is 11-ft wide, but not when it is
12-ft wide. This suggests that left shoulder width is more important with a reduced lane
width.
• The right-most freeway lane has a speed that is about 4.4 mph lower than a lane that is
located between two other lanes.
• Operating speeds on Texas freeways are 2 mph lower during night time (with roadside
lighting present) than during the day.
• Speeds were higher (by 1.5 mph) on the weekends (Saturday) than on the week day
studied (Wednesday).
For freeway locations with similar boundary conditions (minimum and maximum values)
to those present in the study database, the equation depicted in Table 48 can be used to predict
per lane freeway speeds.
The research team also evaluated how changing the lane and shoulder widths will
influence the number of crashes. The unique nature of a specific lane width and shoulder width,
in combination with the number of lanes and proximity of nearby on or off ramps, collectively
influence the number of total and KAB crashes.
The safety analysis determined the following:
• There is a crash reduction associated with increased wider lane widths. When comparing
freeways with 12 ft lanes to freeways 11 ft lanes, there is a reduction in KAB crashes that
ranges from 5 percent for 2-lane freeways up to 12 percent for 5-lane freeways, other
segment characteristics equal. The corresponding range for the reduction in total crashes
is from 5 percent for 2-lane freeways to 11 percent for 5-lane freeways.
• Similarly, there is a crash reduction associated with each additional lane. Such crash
reduction also depends on the average lane width. For a constant lane width, when there
are no changes in other variables, there is a reduction in KAB crashes per additional lane

85
of 24 percent for 11-ft lanes and 26 percent for 12-ft lanes. For total crashes, the
reduction is 23 percent for freeways with 11-ft lanes and 25 percent for freeways with
12-ft lanes.
• There is a crash reduction associated with increased left shoulder widths. Other segment
characteristics equal, there are 5 percent fewer KAB crashes and 6 percent fewer total
crashes per additional foot of left shoulder.
• There is evidence of a crash reduction associated with increased right shoulder widths.
Other segment characteristics equal, there are 9 percent fewer KAB crashes and 7 percent
fewer total crashes per additional foot of right shoulder. However, the evidence
supporting this finding depends on the inclusion of data representing an uncommonly
narrow right shoulder width. These data are associated with one site where the right
shoulder was substantially reduced from 11.5 to 2.0 ft during the time period covered in
this study. The magnitude and significance of the estimated effect substantially change
when the data for this site are dropped from the model. The research team recommends
further research on this issue, ideally including data from multiple sites where right
shoulder widths range from 2.0 to 6.0 ft. However, finding such sites would be
challenging in all likelihood, given that this is an uncommon range for right shoulder
width.
• There is an adverse safety effect for any shoulder reduction that corresponds to an equal
increase in the total width of the travel lanes, other segment characteristics equal. While
constructing an additional lane is beneficial in terms of safety, a larger adverse effect
resulting in an increase in crashes due to reducing the shoulder widths offsets this benefit.
• However, if it is possible to increase the total paved width when adding a travel lane, the
safety model allows the analyst to identify lane and shoulder widths so that the number of
crashes along the corridor will expectedly remain unchanged.
The safety analysis resulted in two crash prediction models for the total and KAB
crashes, respectively. Table 49 presents the resulting equations.
Finally, the use of calculations similar to those shown in Table 48 and Table 49 can
create challenges as math errors are easy to make. Therefore, the research team developed a
companion spreadsheet that automatically performs these calculations based on user input.

86
Table 48. Final Freeway Operating Speed Predictive Equation.
Variable Definitions S = Estimated operating speed per lane for a 5-minute time period V = V5-min /lane = The five minute traffic volume for the freeway lane of interest (vehicles/5-minutes) MedTypeGrass = Value of 1 if grass median, otherwise 0
LaneW = Lane Width (ft) ToLeftB+P = Value of 1 if buffer plus pylons located to left of lane, otherwise 0 ToLeftShld = Value of 1 if shoulder located to left of lane, otherwise 0 ToRightSCL = Value of 1 if speed change lane located to right of lane, otherwise 0 ToRightShld = Value of 1 if shoulder located to right of lane, otherwise 0
NLight = Value of 1 if night time conditions, otherwise 0 DayofWeek = Value of 1 if Wednesday (representing weekday), otherwise 1 (weekend)
Boundary Conditions for Freeway Operating Speed Equations Applicable to freeway corridors with the following:
0 ≤ V5-min /lane ≤ 250 LaneW rounded to 11 ft or 12 ft 2 ≤ Number of Lanes ≤ 5 4.0 ft ≤ Right Shoulder Width ≤ 20.0 ft 1.5 ft ≤ Left Shoulder Width ≤ 23.0 ft 6.0 ft ≤ Median Width ≤ 125.0 ft 60 mph ≤ Posted Speed Limit ≤ 70 mph
Estimating Operating Speed for a Texas Freeway Lane 𝑆 = 67.80− 0.00018(𝜕2) + 4.60(𝐶𝑒𝑙𝐴𝑀𝑀𝑒𝐺𝐶𝑅𝐶𝐶) + 2.21(𝐿𝐿𝑛𝑒𝑊) + 3.62(𝐴𝑁𝐿𝑒𝑇𝑇𝐾+𝑃)
+ 2.03(𝐴𝑁𝐿𝑒𝑇𝑇𝑅ℎ𝑙𝑙) − 3.89(𝐴𝑁𝑅𝜕𝑎ℎ𝑇𝑅𝐶𝑁)− 4.39(𝐴𝑁𝑅𝜕𝑎ℎ𝑇𝑅ℎ𝑙𝑙)− 2.00(𝑁𝐿𝜕𝑎ℎ𝑇)− 1.47(𝐴𝐿𝑀𝑁𝑇𝑊𝑒𝑒𝐷)

87
Table 49. Texas Freeway Crash Prediction Models for Lane and Shoulder Width Changes.
Variable Definitions NTotal = Total number of predicted crashes (crashes per year) NKAB = Total number of predicted KAB crashes (crashes mile per year) AADT = Annual Average Daily Traffic in one direction (vpd) L = Length of study segment (mi) NLane = Number of travel lanes in a single direction Ave_Lane_W = Average lane width (ft) RShldW = Width of right shoulder (ft)
RampUpDist = Distance to closest upstream ramp (ft) RampDnDist = Distance to closest downstream ramp (ft)
Boundary Conditions for Freeway Crash Prediction Equations Applies to homogeneous segment from 0.10 to 1.25 miles in length Applicable to freeway corridors with AADT values up to 280,000 vpd 2 ≤ NLane ≤ 5 11.0 ft ≤ Ave_Lane_W ≤ 12.0 ft 2.0 ft ≤ RShldW ≤ 15.0 ft 1.0 ft ≤ LShldW ≤ 10.0 ft 0.0 mi ≤ RampUpDist ≤ 1.5 mi 0.0 mi ≤ RampDnDist ≤ 1.5 mi
Equation to Predict Total Texas Freeway Crashes due to Lane and Shoulder Width Changes 𝑁𝑇𝑁𝑇𝑅𝑙= 1.0027 × 𝐿 × 𝐴𝐴𝐴𝐴0.539 × 𝑒�−1.0243(𝑅𝑅𝑅𝑅𝑅𝑅𝐷𝑖𝑖𝐷)−1.0877(𝑅𝑅𝑅𝑅𝑅𝑛𝐷𝑖𝑖𝐷)−0.0241�𝑁𝑁𝑅𝑛𝐿×𝑁𝑅𝑛𝐿_𝑊𝐴𝐴𝐴�−0.0735(𝑅𝑅ℎ𝑙𝑙)−0.0646(𝑁𝑅ℎ𝑙𝑙)�
Equation to Predict KAB Texas Freeway Crashes due to Lane and Shoulder Width Changes 𝑁𝐾𝐾𝐾= 0.0514 × 𝐿 × 𝐴𝐴𝐴𝐴0.662 × 𝑒�−1.5787(𝑅𝑅𝑅𝑅𝑅𝑅𝐷𝑖𝑖𝐷)−0.8659(𝑅𝑅𝑅𝑅𝑅𝑛𝐷𝑖𝑖𝐷)−0.0253�𝑁𝑁𝑁𝑛×𝑁𝑅𝑛𝐿𝑊𝐴𝐴𝐴�−0.0956(𝑅𝑅ℎ𝑙𝑙)−0.0547(𝑁𝑅ℎ𝑙𝑙)�


89
REFERENCES
American Association of State Highway and Transportation Officials. (2010). Highway Safety Manual. AASHTO, Washington, D.C.
American Association of State Highway and Transportation Officials. (2011). A Policy on Geometric Design of Highways and Streets, 6th edition. AASHTO, Washington, D.C.
Bauer, K. M., D. W. Harwood, and K. R. Richard. (2005). Safety Effects of Using Narrow Lanes and Shoulder-Use Lanes to Increase the Capacity of Urban Freeways. Report No. FHWA-HRT-05-001, Federal Highway Administration, McLean, Virginia.
Bauer, K. M., D. W. Harwood, W. E. Hughes, and K. R. Richard. (2004). “Safety Effects of Using Narrow Lanes and Shoulder-Use Lanes to Increase the Capacity of Urban Freeways.” Transportation Research Record: Journal of the Transportation Research Board, No. 1897, TRB, National Research Council, Washington, D.C., pp. 71–80.
Ben-Bassat, T., and D. Shinar. (2011). “Effect of shoulder width, guardrail and roadway geometry on driver perception and behavior.” Accident Analysis and Prevention. Vol. 43, No. 6, pp. 2142–2152.
Bonneson, J. A., S. Geedipally, and M. P. Pratt. (2011). NCHRP Project 17-45: Safety Prediction Methodology and Analysis Tool for Freeways and Interchanges. Final Report, (publication pending).
Bonneson, J., and M. Pratt. (2009). Roadway Safety Design Workbook. Report No. FHWA/TX-09/0-4703-P2, TxDOT, Austin, Texas.
Bonneson, J., D. Lord, K. Zimmerman, K. Fitzpatrick, and M. Pratt. (2007). Development of Tools for Evaluating the Safety Implications of Highway Design Decisions. Report 0-4703-4, TxDOT, Austin, Texas.
Bonneson, J. A., K. Zimmerman, and K. Fitzpatrick. (2005). Roadway Safety Design Synthesis. Report 0-4703-P2, TxDOT, Austin, Texas.
California Department of Transportation. (May 2012). Highway Design Manual (located at: http://www.dot.ca.gov/hq/oppd/hdm/hdmtoc.htm).
Chen, J. Y., and X. P. Tian. (December 2012). “Safety Analysis of Expressway’s Shoulder Width.” Applied Mechanics and Materials. Vol. 256–259, pp. 1731–1736.
Chitturi, M. V., and R. F. Benekohal. (2005). “Effect of Lane Width on Speeds of Cars and Heavy Vehicles in Work Zones.” Transportation Research Record: Journal of the Transportation Research Board, No. 1920, TRB, National Research Council, Washington, D.C., pp. 41–48.

90
Cooner, S. A., and S. E. Ranft. (2006). “Safety Evaluation of Buffer-Separated High-Occupancy Vehicle Lanes in Texas.” Transportation Research Board: Journal of the Transportation Research Board, No. 1959, TRB, National Research Council, Washington, D.C., pp. 168–177.
Danish Road Directorate. (1998). “Effect of Narrow Lanes on the Capacity of Motorways: A trial in the Paris Region.” Third International Symposium on Highway Capacity. Copenhagen, Denmark, pp. 337–349.
Donnell, E. T., Y. Ni, M. Adolini, and L. Elefteriadou. (2001). “Speed Prediction Models for Trucks on Two-Lane Rural Highways.” Transportation Research Record: Journal of the Transportation Research Board, No. 1751, TRB, National Research Council, Washington, D.C., pp. 44–55.
Fitzpatrick, K., P. Carlson, M. Brewer, and M. Wooldridge. (2001). “Design Factors that Affect Driver Speed on Suburban Streets.” Transportation Research Record: Journal of the Transportation Research Board, No. 1751, TRB, National Research Council, Washington, D.C., pp. 18–25.
Fitzpatrick, K., L. Elefteriadou, D. Harwood, J. Collins, J. McFadden, I. B. Anderson, R. A. Krammes, N. Irizarry, K. J. Parma, K. Bauer, and K. Passetti. (2000). Speed Prediction for Rural Two-Lane Highways, Report No. FHWA-RD-99-171. Federal Highway Administration, U. S. Department of Transportation, Washington, D.C.
Florida Department of Transportation. (Revised January 2014). Plans Preparation Manual. (located at: http://www.dot.state.fl.us/rddesign/PPMManual/2014PPM.shtm).
Georgia Department of Transportation. (Revised December 2013). Design Policy Manual. (located at: http://www.dot.ga.gov/doingbusiness/PoliciesManuals/roads/designpolicies/ Pages/DesignPolicyManual.aspx).
Godley, S. T., T. J. Triggs, and B. N. Fildes. (2004). “Perceptual Lane Width, wide perceptual road centre markings and driving speeds.” Ergonomics: the official publication of the Ergonomics Research Society. No. 47, pp. 237–256.
Gong, H. and N. Stamatiadis. (2008). “Operating Speed Prediction Models for Horizontal Curves on Rural Four-Lane Highways.” Presented at the 87th Annual Meeting of the Transportation Research Board, Washington, D.C.
Gross, F, P. P. Jovanis, K. A. Eccles, and K. Y. Chen. (2009). Safety Evaluation of Lane and Shoulder Width Combinations on Rural, Two-Lane, Undivided Roads. Report No. FHWA-HRT-09-032, Federal Highway Administration, Washington, D.C.
Himes, S. C., and E. T. Donnell. (2010). “Speed Prediction Models for Multi-Lane Highways: A Simultaneous Equations Approach.” Journal of Transportation Engineering, American Society of Civil Engineering.

91
Krammes, R. A., Q. Brackett, M. A. Shafer, J. L. Ottesen, I. B. Anderson, K. L. Fink, K. M. Collins, O. J. Pendleton, and C. J. Messer. (1995). Horizontal Alignment Design Consistency for Rural Two-Lane Highways, Report No. FHWA-RD-94-034. Federal Highway Administration, U.S. Department of Transportation, Washington, D.C.
Kuan, Y. X., and Z. Wanchao. (2011). “Study on Mutual Interaction of Lane Width and Heavy Vehicles on Through Lane Saturation Flow Rate at Signalized Intersections.” Paper 11-1879. Transportation Research Board 90th Annual Meeting. Washington D.C., Transportation Research Board.
Ma, Y., Y. Zeng, and X. Yang. (2010). “Impact of Lane Width on Vehicle Speed of Urban Arterials.” Proceedings of the 10th International Conference of Chinese Transportation Professionals. Beijing, China: American Society of Civil Engineers, pp. 1844–1852.
Manuel, A., K. El-Basyouny, and M. T. Islam. (February 2014). “Investigating the safety effects of road width on urban collector roadways.” Safety Science. Vol. 62, pp. 305–311.
McCasland, W. (1978). Use of Freeway Shoulders to Increase Capacity, Report No. FHWATX78-210-2, TxDOT, Austin, Texas.
Melo, P., A. Lobo, A. Couto, and C. M. Rodrigues. (2012). “Road Cross-Section Width and Free-Flow Speed on Two-Lane Rural Highways.” Transportation Research Record, No. 2301, Washington, D.C., pp. 28–35.
Nevada Department of Transportation. (Revised May 2011). Road Design Guide. (located at: http://nevadadot.com/uploadedFiles/NDOT/About_NDOT/NDOT_Divisions/ Engineering/Design/2010_Road_Design_Guide.pdf).
New York State Department of Transportation. (November 2013). Highway Design Manual. (located at: https://www.dot.ny.gov/divisions/engineering/design/dqab/hdm).
Potts, I. B., J. F. Ringert, K. M. Bauer, J. D. Zegeer, D. W. Harwood, and D. K. Gilmore. (2007). “Relationship of Lane Width to Saturation Flow Rate on Urban and Suburban Signalized Intersection Approaches.” Transportation Research Record: Journal of the Transportation Research Board, No. 2027, TRB, National Research Council, Washington, D.C., pp. 45–51.
Polus, A., K. Fitzpatrick, D. B. Fambro. (2000). “Predicting Operating Speeds on Tangent Sections of Two-Lane Rural Highways.” Transportation Research Record: Journal of the Transportation Research Board, No. 1737, TRB, National Research Council, Washington, D.C., pp. 50–57.
Robertson, J., K. Fitzpatrick, E. S. Park, and V. Iragavarapu (in press). “Determining Level of Service on Freeways and Multilane Highways with Higher Speeds.” Transportation Research Record: Journal of the Transportation Research Board, TRB, National Research Council, Washington, D.C.

92
Rosey, F., J. M. Auberlet, O. Moisan, and G. Dupre. (2009). “Impact of Narrower Lane Width: Comparison Between Fixed-Base Simulator and Real Data.” Transportation Research Record No. 2138, Washington, D.C., pp. 112–119.
Schurr, K.S., P. T. McCoy, G. Pesti, and R. Huff. (2002). “Relationship of Design, Operating, and Posted Speeds on Horizontal Curves of Rural Two-Lane Highways in Nebraska.” Transportation Research Record: Journal of the Transportation Research Board, No. 1796, TRB, National Research Council, Washington, D.C. pp. 60–71.
Stamatiadis, N., D. Lord, J. Pigman, J. Sacksteder, and W. Ruff. (2011). “Safety Impacts of Design Element Trade-Offs for Multilane Rural Highways.” Journal of Transportation Engineering Vol. 137, pp. 333–340.
Texas Department of Transportation. (2013). Roadway Design Manual. TxDOT, Austin, Texas.
Transportation Research Board. (2010). Highway Capacity Manual. TRB, Washington, D.C.
Transportation Research Board. (2011). “Modeling Operating Speed: Synthesis Report.” Transportation Research Circular E-C151. (located at: http://onlinepubs.trb.org/onlinepubs/circulars/ec151.pdf.), Operational Effects of Geometric Committee, Washington, D.C.