Embed Size (px)
Citation preview

T E C H N I C A L M E M O R A N D U M CUiHIlL
TO: Mark Doolan, RPM, Region VH EPA
FROM: Dick Glanzman/DENBill Bluck/BOI
DATE: January 5, 1994
RECEIVED
FEB 0- l ib-}
SPFD BRANCH
SUBJECT: Evaluation of Additional Remedial Alternatives for the Baxter Springs andTreece Subsites, Cherokee County Superfund Site
PROJECT: RME68062.ES
1.0 Introduction
EPA requested that CH2M HILL assist them in the development of a Proposal Plan (PP)
and subsequently, a Record of Decision (ROD) for the Baxter Springs and Treece Sub-
sites, portions of the Cherokee County, Kansas, Superfund Site. The PRP group has
completed for these subsites, a Remedial Investigation (RI) Report, Risk Assessment
(RA), and Feasibility Study (FS). EPA, in conducting its review of the FS, became
concerned that insufficient consideration had been given to development of remedial
alternatives that could significantly improve surface water quality, hence improve the
aquatic environment in the subsite tributaries and downstream receiving waters. Certain
alternatives, such as Alternative 5a that had considered these issues had been screened out
earlier in the FS process and, as a result, did not have the opportunity to be compared in
the detailed analysis of alternatives.
EPA directed CH2M HILL to 1) develop a detailed cost estimate for Alternative Sa using
the cost basis used in the FS; 2) establish a methodology to quantitatively judge the effec-
tiveness of this alternative in improving surface water quality as compared to Alterna-
tive 3; and 3) using such a methodology, try to develop an "additional" alternative that
would greatly improve surface water quality in a more costly effective manner than
Alternative 5a.
DEN100150E9.WP5

M E M O R A N D U MPage 2February 3, 1994
The technical memorandum, containing such an analysis, will subsequently be used by
EPA, in conjunction with the other project documents, to assist in the formulation of a
PP and subsequent completion of a ROD.
2.0 Methodology
2.1 Background
In the FS, a total of seven alternatives were carried through detailed analysis and com-
pared to the No-Action Alternative (noted as Alternative 1). The alternatives developed
were focused in reducing risks in two areas: 1) Public Health; and 2) "Ecorisk" as
judged by water quality measurements. Public health risk was reduced principally by
taking steps to reduce human exposure to contaminated mine waste materials to varying
degrees. Alternatives 2 and 3 considered actions at two residences. Alternatives 6a and
c, 7a and c and 8a added increasing levels of management of surface mine wastes, which,
in turn, added to the capital costs. Ground water impacts to public health primarily
consisted of prevention of contamination to the deep aquifer for all the remedial alterna-
tives. Institutional controls were also a portion of the actions to protect public health for
both source materials and ground water remedial actions. As regards ecorisk, ground-
water contamination of Willow Creek at the Baxter Springs subsite as a result of reducing
discharge from the Bruger Shaft was a component of alternatives, and was included under
groundwater remedial actions.
The main component of ecorisk improvement covered in the range of alternatives that
was developed in the FS for detailed analysis dealt principally with removal of outwash
tailings in four tributaries: Willow Creek and Spring Branch Creek at the Baxter Springs
DEN100150E9.WP5

MEMORANDUMPage 3February 3, 1994
Subsite and Tar Creek and Tar Creek Tributary for the Treece Subsite. The removed
outwash tailings would be relocated to nearby tailings deposits which would also be stabi-
lized, capped, regraded and revegetated. In addition to these actions, erosion protection
utilizing stream channels, dikes and diversion ditches would be installed. Short term
water management and sediment control would also be utilized during the construction
phase to protect water quality. Essentially, all the alternatives carried forward into
detailed analysis, except the No-Action and Alternative 2 (which was primarily a public
health only alternative), considered this level of surface water protection. No opportunity
existed in the detailed analysis to further compare and contrast alternatives that contained
other additional actions that would improve surface water quality, thus decreasing
ecorisk.
2.2 Unit Cost Development
In Section 6.4 and Appendix D of the FS, individual components of the remedies under
consideration are described and costed. It should be noted that the costing of Alterna-
tive Sa and development of the "additional" alternative will have certain common com-
ponents with Alternative 3, namely Source Material and Groundwater actions. Also, in
Chapters 1 and 5 of the FS, descriptions of the various mine waste units and areas were
designated, including those that were deemed "largest" as well as those designated as
"significant" contributors to added metals loading to various tributary surface waters.
See Drawings No.'s 1.6-1, -2, and -3 as well as 5.2-1 and -2. Appendix A further item-
ized various waste units and areas. Consequently, these referenced sections of the FS
were used to develop the component elements shown in Table 1, Detailed Costs of
Alternative 3.
Note that the specific item numbers with their respective unit costs, and individual mine
waste units were designated for each of the four major tributaries of interest.
DEN1001SOE9.WP5

Una Daeriptioa
1.0 SoncoMamM Action
1 . 1 Ruidenlul toum removal aclioni
1.2 Injtilulionil contrail
Subtotal!
2.0 Oraundwalcr Aciiona
2.1 Deep iqiiibr well plut
2.2 Brager theft coraiol
2.3 OrwindwattrintfiUHionilcortroli
-Sutrtotale
3.0 Surface Wafer Action
3.1 Fill, cap, ragrade, >nd rcvcftution
uilin|apilea
3.2 Removil/diipoeeofoiitwaahuili
3.3 Stream chlimllutraa
3.4 ErahncoMraMiwreloiiililchei
Unit Costm
31,000 ei
100,000 ra
73,636 ei
11.000 ea
100,000 ««
39.359/tt
HMIjf
Conv.to3I.750/K
IS5.00/LP
•H-WLf
TJ.U 1DcUOcd Com- AHcraidT* 3
Outer Spriegi
Spring Bruch
(1)
(1)
0)
-
0)
BT-23(3.Wic), BT4(I0.4I ic)
BT-2,(6.26 K), BT-7(0.« K)
BT-8(3.53 ic), BT-9(I.04 u)
Toul -25.35 K
BOW-I (24.19 «c>-BT6, 7, 1, ud 9
BOW-4 (9.71 K>.gT-23
Toul-33.9*c
1,000' new BTT22 >nd breech ofBT23 cepiired
500 LF
Willow Cmk
N/A
N/A
N/A
(1)
N/A
BT-M4.07 K)
Trt.l-4.07ic
BOW-1 (1.36«c)mdBOW-3(1 1.17*0
-HT-I
Taul-I3.23ec
Nil
Nil
r*Sel«f2
Traett
TnrCretk
(1)
(1)
(1)_
(1)
TT-IO(IO.lK), TT-1I(I.5 ac)
TT- 14 (7 .96 ec)
Toul -20.26 ic
TOW-1 (I.I «c) ind TOW-2(2.5 K) end TOW-5 (0.22 ic)
-TTIOuidM
Toi>l-3.12 K
100' of channel end riprapnorth TT-I end dike npeir
9 TT-I 1 Md 22
500 LF
T.C. Tritntaiy
N/A
N/A
N/A
-
N/A
TT-2I(4.73ec)
Toul-4.73 ec
TOW-3 (9.13 K) end TOW-4(2.22 Kh>TT22
Toul-ll.35ac
Nil
BntarSpifad
Com0)
35,000
100.000
135,000
220,901
11,000
100,000
40J.90I
1,157,942
I,<I4,19I
115.000
11,000
Tnecc
Comm
35,000
100,000
135.000
519,0(1
0
100,000
M9.0II
913,511
542.321
141.000
11.000
DENIOOI4FF3.WP5

lion Docripltai
1.S Dik.1 ind embndmenu
3.6 ScdimenUlionbMini
3.7 Pond witcr hindlhn;
SubtaUli
4.0 Subutil-DlreclCotfi
5.0 Indirect COM
3.1 Enf incctinf OCMfn
3.2 Conitiuetlon miiuftimnl
5.3 Conlinftncjr
Subtouli
6.0 Toul Coil Eitiimta
TeUlCdft
IteftCoit($)
21.00/LF
47.397 n
26.070An|d
6* of 4.0
12.7X of 4.0
23.73* of 4.0
TikklDfUiI«I CnU-Allen»(lTe3 P i 2 of 1
BucttrSpri i
Spring Branch
500 LF
(1)
1 mf d
Willow Cratk
Nil
(I)
Imfd
Trace*
TarCmk
3,800 LF
(I)
0.5 mgd
TJC. Tribilny
Nil
(I)
0.5 mfd
ButarSpriMi
Coitt($)
14,000
94.794
52,140
3.199.774
3,743,682
224,621
475,441
SS9.I24
1,589,193
5,332,875
Tram
Cots($)
106.400
94,794
26.070
1,912.173
2.736.261
164,176
347.505
649,162
1.161,543
3.197,104
9.230,679
DEN 10014FF3.WP5

MEMORANDUMPage 4February 3, 1994
2.3 Alternate 5a Cost Estimate
With the unit costs and specific mine waste units established by tributary for both the
subsites, the next step was referral to Section 5.2.3.5 of the FS to assist in the develop-
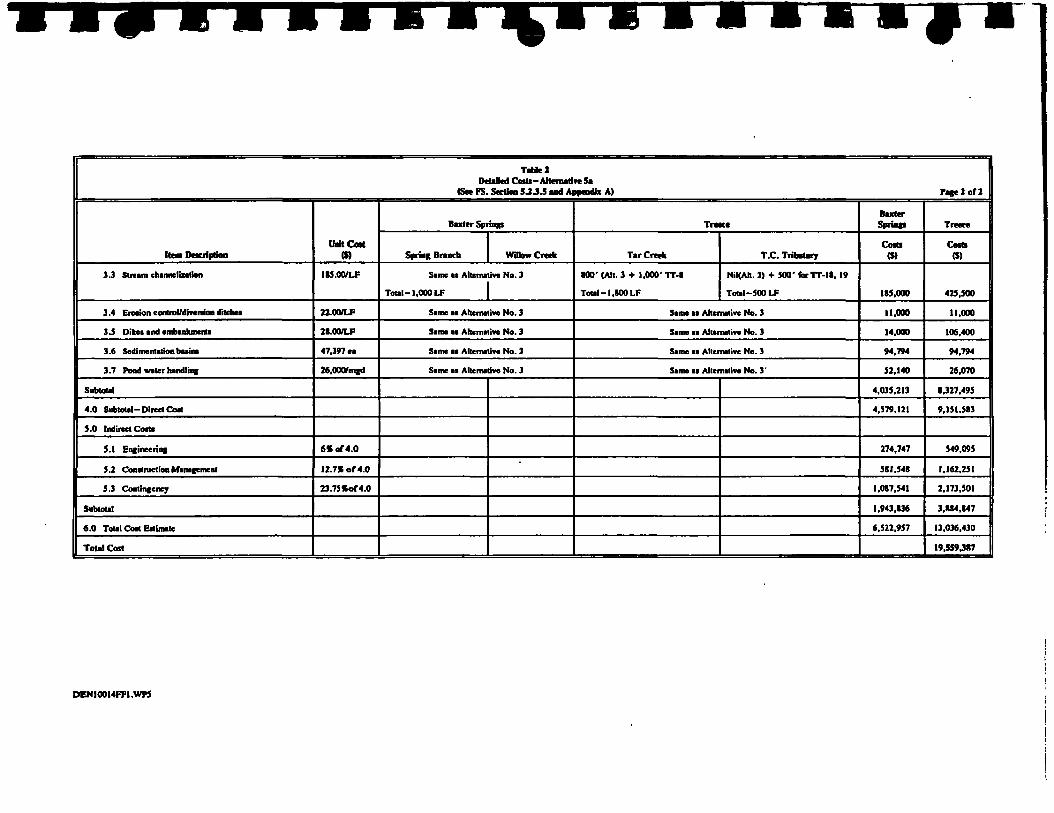
ment of Table 2, Detailed Costs of Alternative 5a. This alternative, along with others in
the FS, focused on additional methods to improve surface water quality of the various
tributaries by mine waste consolidation and other means, and, as mentioned earlier, had
been screened out so that they could not be further evaluated.
It should be recalled that surface water actions for Alternative 3, focused primarily on
removal of outwash tailings in the four tributaries and consolidating them in key tailings
deposits along with limited channelization, dikes and other surface water management
functions. Alternative 5a, on the other hand, considered remediating virtually all mine
waste units and areas considered the "largest" and "significant" contributors to metals
contamination of this tributary, in addition to that done with alternate 3. This alternative
offers a reasonable upper-bound, or ultimate solution, as regards potential remediation of
mine waste units and areas that clearly degrade surface water quality. As can be seen in
Table 2, appropriate mine waste units/areas were noted for each tributary and, using the
unit costs developed in Table 1, capital costs were then calculated. Indirect costs, for
engineering, construction management, and contingency using the same percentages of
direct costs that were utilized in Alternative 3. Also, source material actions and ground-
water actions were identical to that utilized for Alternative 3. Including these additional
"significant" and "largest" mine waste units to be remediated added over $10.3 million to
the capital cost, compared to Alternative 3, bringing total estimated capital costs to
$19.6 million.
DEN100150E9.WPS

Table!Detailed CoU- AlteruliTC Si
(Sn VS. SecooB 5 J 3 S ud Appendix A) Fa** > «' 1
tan Docrlpooa
1.0 Source Materiel Acton
2.0 Groundwatcr Action
1.0 Surface Water Action
3 . 1 .. FiH, up, Kfnde, in) icwfcliflai tallhifapiki
3. 1 .b Additional 'ilfiririCMl' tailing! nfraded.recantoured, capped, and nvtgcbkd
3.1 jc •SifniricMl- chat pllu, would b*icgavdad, ncooloiiiM, cappM( andRTC|etated
3.1 jt- -Sltnlfleanl' «carattd chat piUa wouldD9 ICf nOCfl •fid |WCfCUltC4
3.2 RamoK/diapOMofoulwaahUili
Unit Cart($)
39.1S9/M
39459/ic
13,410/ac
1.905/ac
11.00/yd1
or35,750/ic
Hauler Springi
Sprioc Braock WinowCndi
Santa ai Ahentalive No. 3
Santa ai Akcmalm No. 3
Same at Allemi
ToUI-Z5.35ac
BT.4 (1 .47 ac)
Tolal-l.47ac
BC-l2(53.l2ac)
ToUl-53.82 ac
BX-II(3.99A) +BX-290.79A) +BX-3I(2I.S4A)
Santa aa Ancrna
Toul-33.9A
ire No. 3
Total -4.07/ac
Nil
Nil
Nil
iv* No. 3
Total -13. 23 ac
Traece
T«r Creek T.C. TriboUry
Same ai Alternative No. 3
Same tl Ahcmaliwe No. 3
Same aa AHei
Tool- 20.26 «c
TT-5(2.42A) + TT-6 (2.46 A) +TT-«(32.92A) + TT-IO(IO.SA) +TT-I4(7.96A) + TT-30(O.Mac) +TT-3l(7.62ac) + T-32Q.57A) +TT-4I(6.26A) + TT-44(3.66ac)
T<K.I-77.5l.c
TC-3(50.76A) + TC-4(20.2A) +TC-7(6.67A) + TC-9(40.04A) +TC-I5,.(24.8IA) + TC-6H(17.35A)+TC-29(3.15A) +TC-37(eit. 2.0 ac)
Total- I64.9lac
TX-704.09A) + TX-16(5.94A) +TX-21(II.7A) + TX-5(I0.52A) -fTX-29(22.04A) + TX-30X2.7A) +TX-3I(II.79A) + TX-32(6.7IA) +TX-39(22.6A)
Same ai Altai
SI-3.R2A
mliva No. 3
Toul-4.73 ac
TT-17,,(S.13 ac) + IT-ISO .343A) + TT-I9(I.MA) +1T-2I(I.36A) -f TT-4K3.MA)
Toul-ll.l2ac
TC-20 (3.09A)
TouU-3.09ac
TX-20(I.2IA).TX-42(9.77A) +TX-43(19.7IA) 4 TX-46<O.JA<at.)
native No. 3
Total- II.35A
BaxterSorinfi
Comm
135.000
401.901
1.137.942
57,151
721.726
1.6*4,898
Tnecc
Comm
135,000
619,011
9(3,511
3,167,106
2.253.S19
542,321
DEN100I4FP1.WF3
Hen Dacrlptioa
3.3 Stream channelization
3.4 Eration conlrol/divenioB ditchtt
3 .5 Dikci and embankmcnti
3.6 Sedimentation batine
3.7 Pond witer handlinf
Subtotal
4.0 SubtoUl- Direct COM
5.0 Indirect Com
5.1 Enfineerinf
5.2 Conttniction Management
5.3 Contingency
Subtotal
6.0 Toul Co* Enim.lt
Total Cut
IMtCott($)
1S5.00/LF
22.00/LF
2S.OO/LF
47,397 ca
26.000/mgd
6* of 4.0
12.7»of4.0
23.75 *of4.0
Table 1Detailed Com- Alternate 5a
(See FS. Strtloo 5 JJ.5 and Appendix A) rage 2 of 2
Baxter Spring*
Sprat; Branch
Same at Alleraa
Total -1, 000 LF
Willow Creek
iveNo. 3
Same at Ahemative No. 3
Same ai Ahcmalive No. 3
Same n Allcnwlivt No. 3
Same aa Allemalin No. 3
Trace
Tar Crack
100' (All. 3 + 1,000' TT-I
Toul -1, 800 LF
T.C. Tributary
Nil(Ail. 3) + 500' fcrTT-U. 19
Total-500 LF
Same at Alternative No. 3
Sam at Alternative No. 3
Same at Alternative No. 3
Same at Alternative No. 3'
BaxterSpriafi
Com(S)
185,000
11.000
14.000
94.794
52,140
4,035,213
4.J79.I2I
274,747
5II.54S
1.017,541
1,943,836
6.522.957
Trcccc
Cam(J)
425,500
11.000
106.400
94.794
26.070
1.327.495
9,151.583
549.095
1.162.251
2.173,501
3,114,147
13,036.430
19.5594*7
DENIOOI4FFI.WP5

M E M O R A N D U MPageSFebruary 3, 1994
2.4 Determination of Effectiveness
It was then necessary to develop a method, using existing RI data, to assess whether the
addition of these actions which added over $10 million to the cost to Alternative 3 was a
cost effective action or not. These subsites are very large and the weathering and
oxidation of the various minerals from many different mine wastes as influenced by pre-
cipitation, physical location, and other factors, complicates the ability to measure these
changes and subsequently understand how these systems behave in detail, particularly
when the difference between "good" or "bad" is measured in parts per billion. The
extensive data base generated during the RI/FS process was again reviewed to find a
means to assist making this judgement and it was decided that about the only approach
practical would be based upon the zinc mass load measurements found in the FS, notably
summarized, in Figures 1.6-2 and -3, and based upon the hydrology of the tributaries.
As is noted in the FS, the Willow Creek and Spring Branch tributaries are relatively
small flow and contaminant mass load contributors to the Spring River near Baxter
Springs, compared to the river as a whole. Tar Creek and Tar Creek Tributary near
Treece, carry about 10-times the zinc loads by comparison to Willow Creek and Spring
Branch. When referring to Figures 5.2-1 and -2, it becomes very apparent that the quan-
tities and aerial extent of the various mine wastes are much greater in the Treece area so
it makes some sense as regards the differences in the mass loads from each.
In order to make comparisons of effectiveness between Alternatives 3 and Sa, it was
decided that, by utilizing the zinc mass load data for each subsite developed during the RI
and estimating mass load reduction based upon remediation of specific mine waste units/
areas, relative estimates of reduction of zinc loads could be made. Some professional
judgements had to be made in making minor adjustments to make the comparisons.
Calculations for the estimated zinc mass load reductions for Alternative 3 and Alterna-
tive Sa can be found in Appendix A. Since the remedies actual effectiveness is difficult
DEN100150E9.WP5

Table 3Mass Load Reduction and Effectiveness Estimate— Alternative 3
Description
• Zinc Mass load - noaction (Ibs./day)
• Load Reduction -Alt 3©100% efficiency@ 85% efficiency@ 65% efficiency
• Capital Cost - Alt 3items 3.1, 3.2,3.3CTable 1)
• Cost/lb. of zinc/persubsite reduction(85% efficiency)
• Weighted averagecost/lb. for bothsubsites@ 85% effectiveness
Baxter Springs
507 Ibs./day
216 Ibs./day184 Ibs./day140 Ibs./day
$3,028,840
$16,461/lb.
Treece
4,693 lbs./day
110 Ibs./day94 lbs./day72 lbs./day
$1,673,909
$17,808/lb.
$16,916
DEN100150F1.WK

Table 4Mass Load Reduction and Effectiveness Estimate -Alternative 5a
Description
• Zinc Mass load - noaction (Ibs./day)
• Load Reduction -AltSa©100% efficiency@ 85% efficiency@ 65% efficiency
• Capital Cost - Alt 5aitems 3. la, b, c, d,3.2, 3.3 (Table 2)
• Cost/lb./subsite ofzinc reduction(85% efficiency)
• Weighted averagecost/lb. for bothsubsites@ 85% effectiveness
Baxter Springs
507 Ibs./day
474 Ibs./day403 Ibs./day308 Ibs./day
$3,863,279
$9,586/lb.
Treece
4,693 Ibs./day
4,585 Ibs./day3,898 Ibs./day2,980 Ibs./day
$8,089,231
$2,075/lb.
$2,779/lb.
DEN100150FI.WP5

M E M O R A N D U MPage?February 3, 1994
2.6 Development of a More
Cost Effective Alternative
It can be seen, however, that the effectiveness of spending considerable monies in
remedying outwash tailings in the four tributary drainages as part of Alternative 3, is
really not very cost effective since the data clearly indicates that these wastes are not
truly significant contributors to the degradation of surface water quality. This fact was
considered in subsequently assessing additional engineering actions specifically geared to
improving surface water quality for the next phase of the work. During the development
of this report, discussions were held with EPA representatives regarding other concerns
that they have regarding outwash tailings. Although these concerns became more qualita-
tive than quantitative in nature, there is evidence to support the following:
(a) The outwash tailings do have elevated metals concentrations and pose
potential health risks via inhalation or ingestion while people recreate in
these drainages.
(b) The outwash tailings, if uncontrolled, will continue to add sediment and
dissolved metal loads to downstream reaches of the tributaries and subse-
quently to the Spring and Neosho Rivers and therefore pose ongoing
adverse threats to macroinvertebrates in the ecosystem.
Given these factors, it became apparent that remediation of the outwash tailings in all
four tributaries should be included in the subsequent development of a surface water
quality improvement remedy that is more cost effective and fits somewhere between
Alternatives 3 and 5a.
DEN100150E9.WP5

M E M O R A N D U MPageSFebruary 3, 1994
Referring back to FS Figures 1.6-3 and 5.2-2, it can be noted that the big load increase
occurs in the Tar Creek drainage between stations TC-1 and TC-2 where mass loads
increase from 36 Ibs/day to 3,674 Ibs/day or over 81 percent of the whole drainages'
mass load. Almost all of the identified mine waste areas were designated as "largest"
according to the FS. From station TC-2 to TC-3, the gain in zinc is over 800 Ibs./day
with one additional "largest" mine waste source noted (TT-8). It was therefore decided
to modify Alternative 5a to only remedy the mine waste areas designated as "largest"
rather than both varieties and include remediation of the outwash tailings as did Alterna-
tive 3 and 5a. A subsequent cost estimate for Modified Alternative Sa was developed and
is noted as Table 5. Capital cost for this alternative was determined to be approximately
$13.36 million or about $4.1 million more than Alternative 3 and about $6.2 million less
than Alternative Sa. A similar mass load reduction and effectiveness estimate for this
alternative was developed and is noted as Table 6. As can be seen, weighted cost/pound
for zinc reduction drops to $2,283 per pound. Details of the estimate are found in
Appendix A.
2.7 Development of Operating and
Maintenance Costs and NPV Calculations
In addition to the capital cost estimate for each alternative, EPA guidance requires that
annual operating and maintenance costs (O&M Costs) be developed for each alternative in
the detailed analysis. In addition, for each alternative, a present worth or Net Present
Value (NPV) calculation is also conducted on the combined capital and 0 and M costs for
a 30-year period using a 5 percent discount rate. In reviewing the FS, it appears the
present worth was calculated on a 5-year basis rather than 30-years. Both time frames
will be calculated so guidance is met but comparability to the FS can be measured as
well.
DEN100150E9.WP5

lien Dncriptln
1 .0 Source Material Aclioni
2.0 Oraundwiitr Aclion
3.0 Surface Water Actions
3.1« Per All H - Till, cap, rcgrede. indrevegelale tailing! piki
3.lb Add 'larger!- Irili to fill, regrade,revegeute
3.1c Add -largeM- chat pilci lo be rcgraded,recomoured, capped and icvcfeuied
3. Id Add -|arge«r excavated chai pilca lo beregcaded and revegetaled
3 .2 Removal/diapoic of outwith Mill
3.3 Slitam channelizalion
3.4 Ereiion control/divenion dilchet
3.5 Dikci and cmbankmenli
3.6 Sedimenlationbaaina
3.7 Pond water handling
Subtotal*
4.0 Subtotal -Direct Com
5.0 Indirect Com
TibatSModified AltenaitiTC 5« Page 1 of 2
UACoMIS)
39.359/ac
39.359/ac
13,410/ac
1,905/iC
ll.OO/ydor
35.750/ac
185/lf
22/ir
28/ir
47.397 ea
26,070/mfd
Baxter Sprfaiip
Sprint Branch Willow Cntk
Same aa Alternative 3
Same af Alternative 3
Same ai AllernTotH2i.J5.A
nil
nil
nil
Same at Ahem
33.9 ac
1,000 LF
500 LF
500 LF
(1)
1 mgd
live 3T<nal-4.07A
nil
nil
nil
Hive 3
13.23 ac
nil
nil
nil
(1)
Imgd
Trace*
TarCmfc T.C. Tributary
Same ai Alternative 3
Same ai Alternative 3
Same aa ATotil-20.26A
TT30(.84) + TT3 1(7.62)+TT32(2.57) + TT33(.7I) +Tn(32.92)Total-44.66ac
TC3(J0.76a) + TC29(24.4a)Total -75.1 6 ac
7X7(34.05) + TX29(24.4) +TX3I (11.79.),Total -70.28 ac
Same aa A
3.82 ac
IOOLF
500 LF
3,«(K) LF
(1)
0.5 mgd
tlemative 3Toul-4.73A
nil
nil
nil
lemalive 3
lt.35ac
nil
nil
nil
. 0)
0.5 mgd
Baxter Sprig*?
Coils($)
135,000
408,908
1.157,942
I.684.S98
1(5.000
11,000
14,000
94.794
52.140
3.199.774
3.743,612
Trent
Com($)
135,000
689,088
983,581
1,757,773
1,007,896
133.884
542.338
148,000
11,000
106,400
94,794
26.070
4,811,726
5,633.114
DENIOOI50F3.WP5

TiMcSModified AllcnMli*«5i P^ctoTl
lloa DocripliM
5.1 EminMrinfdoifn
5.1 Contraction imnifuneRl
5.3 Continfencjr
SubtoUli
6.0 Total Co* Ediimt*
ToUlCoft
UoilCnt(S)
6* of 4
!2.7«of4
23.75* of 4
BwrtcrSprfaKi
Spriag Branch Wiltew Cnch
Tram
TcrCntli T.C. TribuUiy
•wtar Sprajci
Cab($)
124,621
475.441
189,124
1,519.193
5,332,875
Tram
CnuIS)
338,149
715.741
1,338,506
2.392.403
8.028,117
134*1,092
DEN100IJOF3.WP5

Table 6Mass Load Reduction and Effectiveness Estimate-Modified Alternative 5a
Description Baxter Springs Treece
• Zinc Mass load - noaction (Ibs./day)
507 Ibs./day 4,693 Ibs./day
Load Reduction -Alt5§
@ 100% efficiency@ 85% efficiency@ 65% efficiency
216 Ibs./day184 Ibs./day140 Ibs./day
3,701 Ibs./day3,146 Ibs./day2,406 Ibs./day
Capital Cost -ModifiedAlternative 51 items3.1a, b, c, d, 3.2, 3.3(Table 5)
$3,027,840 $4,573,462
Cost/lb. of zincreduction (85%efficiency)
$16,456 $1,454
• Weighted averagecost/lb. for bothsubsites@ 85% effectiveness
$2,283/lb.
DEN100150F1.WPS

M E M O R A N D U MPage 9February 3, 1994
Upon further review of the FS, it was not possible to determine the basis of the O&M
costs used for Alternative 3 that could then be carried forward for the two other alterna-•s
lives under consideration. Therefore, an independent estimate was developed and is
shown in Appendix B. Operating and Maintenance Costs along with the capital costs are
summarized as follows along with present worth costs for a 5-year and 30-year period are
shown for all three alternatives in Table 7.
Table 7
Capital and O&M Summary of Costs
Capital Costs
O&M Costs (5 year)
Present Worth (5 year)
Present Worth (30 years)
Alternative 3
$9,230,679
360,437
9,513,091
10,233,424
Alternative 5a
$19,559,387
722,926
20,125,818
21,570,586
Modified
Alternative 5a
$13,361,092
505,365
13,757,059
14,767,031
3.0 Comparative Analysis
The levels of overall protection of human health and the environment attainable with
implementation of each of the three remedial alternatives are summarized and compared
in Table 8.
DEN1001SOE9.WPS

Table 8Comparative Analysis of Alternatives Page 1 of 3
Criteria/Description Alternative 3 Alternative 5a Modified Alternative 5a
1. Protection of Public Health andthe Environment
A. Source Materials
Human Health Risks
Environmental Risks
Assuming institutional controls areimplemental and enforced,Alternative 3 would minimize risksassociated with current and futureexposures to source materials.Removal and consolidation of outwashtailings reduces risk to recreators.
Risks to macroinvertebrates and otherterrestrial biota will be reduced due toremoval of outwash tailings and somecontrol of their sources.
Same as Alternative 3 Same as Alternative 3
Same as Alternative 3 Same as Alternative 3
B. Groundwater
Human Health Risks
Environmental Risks
Assuming institutional controls areimplemented and enforced,Alternative 3 would prevent futurehealth risks from consumption ofshallow groundwater. Protection ofdeeper aquifer addresses hiturepotential risks.
Remedial actions at Broger shaft toreduce environmental discharge toWillow Creek will reduce contaminantloading to Willow Creek, that maycontribute to infrequent exceedances ofTRVs in portions of Willow Creek.
Same as Alternative 3 Same as Alternative 3
Same as Alternative 3 Same as Alternative 3
Surface Water
Human Health Risks No risks to human health are attributedto surface water.
Same as Alternative 3 Same as Alternative 3
DEN10015142.WP5

Table 8Comparative Analysis of Alternatives Page 2 of 3
Criteria/Description Alternative 3 Alternative Sa Modified Alternative 5a
Environmental Risks Removal of outwash tailings andstabilization of major sources ofoutwash tailings will reduce zinc (andother metals) loading to the Spring andNeosho Rivers by about 5 percent. Itcannot be determined if TRVs orAWQCs could be met in variousreaches of the tributaries on acontinuous basis.
Removal of outwash tailings andreclamation and/or .stabilizationof all other "largest" and"significant" mine waste sourceswill reduce zinc (and othermetals) loading to the Spring andNeosho Rivers by about83 percent. It is very probablythat major improvements in waterquality will result than withAlternative 3 but it cannot bedetermined that TRVs orAWQCs could be met in variousreaches of the tributaries on acontinuous basis.
Removal of outwash tailings andreclamation and/or stabilizationof "largest" mine waste sourceswill reduce zinc (and othermetals) loading to the Spring andNeosho rivers by about64 percent. It is probable thatthere will still be dramaticimprovements in water qualitybut less than Alternative Sa andagain, it cannot be determinedwhether TRVs or AWQCs couldbe met in various reaches of thetributaries on a continuous basis.
2. Will Remedies Meet ARARs? See Subsection 7.1.2 of F.S. Doubtfulthat zinc reduction significant to meetTRVs or AWQCs.
Same as Alternative 3 but zincload reduction very significant.Cannot determine if TRVs orAWQCs can be met.
Same as Alternative 3 but zinclead reduction significant.Cannot determine if TRVs orAWQCs can be met.
3. Long-Term Effectiveness andPermanence
Magnitude of ResidualRisks
If institutional controls implementedand enforced, current and futureresidual risks will be minimized.Removal of outwash tailings reducesrisk to recreators and reduces ongoingcontaminated sediment loads toreceiving waters.
Surface water quality improvementsminimal based on small zinc loadreductions.
Same as Alternative 3 Same as Alternative 3.
Major surface water qualityimprovements expected intributaries.
Significant surface water qualityimprovements as great asAlternative Sa.
DEN10015142.WP5

Table 8Comparative Analysis of Alternatives Page 3 of 3
Criteria/Description
Adequacy/Reliability ofControls
4. Reduction of Mobility,Toxicity, and Volume ThroughTreatment
5. Short-Tenn Effectiveness
Protection of LocalCommunities, WorkerProtection, EnvironmentalImpacts
Time Required to ReachRemedial Goals
6. Implementability
7. Cost
Capital CostsBaxter Springs
Treece
Total Capital Costs
Annual O&M Costs
Total Present Worth (30 yearsat 5 percent discount)
Total Present Worth (5 Yean atS percent discount)
Alternative 3
Proposed engineering methods areadequate and reliable. Potentialdisturbances of capped materials couldresult in future risks.
Not applicable
Potential short-term risks tocommunities, workers, andenvironment are manageable andacceptable. Some siltation will occuras a result of outwash tailings removal.Alternative 3 could be completedwithin 2- to 3-year time frame withongoing post-remediation O&M forforeseeable future
Alternative 3 is Technically Feasible.Proposed institutional controls areimplernentable. All materials andservices are readily available.
$5.333 million
$3.898 million
$9.231 million
$72,087
$10.233 million
$9.513 million
Alternative 5a
Same as Alternative 3
Not applicable
Same as Alternative 3
Same as Alternative 3 butcompletion about 4 to 5 years.
Same as Alternative 3
$6.523 million
$13.036 million
$19.559 million
$144,585
$21.571 million
$20. 126 million
Modified Alternative 5a
Same as Alternative 3
Not applicable
Same as Alternative 3
Same as Alternative 3 butcompletion about 3 to 4 years
Same as Alternative 3
$5.333 million
$8.028 million
$13.361 million
$101,073
$14.767 million
$13.757 million
DEN10015142.WP5

Appendix AZinc Mass Load Calculations
I. Base Case - Baxter Springs (Figure 1.6-2 basis)
A. Spring Branch
(Note load loss between SB-1 and SB-2)
• Use SB1 and SB1A as basis (conservative) = 456 Ibs./day
• SBA1 @ 11 Ibs./day, SBA2 @ 60 Ibs./day(438 Ibs./day from lower outwash area)
B. Willow Creek
• WC-1 @ 51 Ibs./day
• Most load upgradient of station WC-1A (38 Ibs./day)
C. Total - use 456 + 51 = 507 Ibs./day into Spring River
n. Base Case - Treece
A. Tar Creek
Upgradient TC-1 @ 36 Ibs./dayTC-1B @ 923 Ibs./dayTC-2 @ 3,674 Ibs./dayTC-3 @ 4,479 Ibs./day
B. Tar Creek Tributary
TT-la @ 29 Ibs./dayTT-1 @ 214 lbs./day
C. Total - use 4,479 + 214 = 4.693 lbs./day
DEN100150EA.WK A-l

Alternate 3 - Reduction Estimate
Baxter Springs
Willow Creek -
Spring Branch -
Total reduction
if remedy 100% effectiveor
if remedy 85 % effective =or
if remedy 65% effective =or
Based upon outwash tails BOW-1 and BOW-2. Intributaries where maximum load reduction at 100%efficiency would equal 36 Ibs./day Zn.
•Based upon outwash tail BOW-2, area to beremediated is (33.9 + 25.35) 59.25 Ac out of 143.86Ac deemed to be "significant" or "largest."Assuming reduction proportionate to area, maximumload reduction would be
x (449-11) = 180 Ibs./day Zn
216 Ibs./day43% reduction
184 Ibs./day36% reduction
140 Ibs./day28% reduction
Treece
Tar Creek Drainage - Based upon outwash tails TOW-12 and 2, area tobe remediated totals 24.08 Ac from a total minewaste area of 395 Ac (6.1%). About 222 Ac isbelow TC-2. In this drainage, 82% (3,674Ibs./day Zn) comes from above station TC-2.Again, assuming load reduction proportional toaffected area remediated, the remaining 18% ofthe mass load (805 Ibs./day) may be reduced by/(24.08Ad\\ 222 Ac / 10.8% or 87 Ibs./day
Tar Creek Tributary -Calculations on same basis yields IMS
70.55 23 Ibs./day
DEN100150EA.WP5 A-2

Total reduction
if remedy 100% effective =or
if remedy 85% effective =or
if remedy 65% effective =or
IV. Alternate 5a-Reduction Estimate
110 Ibs./day2.3% reduction
94 Ibs./day2.0% reduction
72 Ibs./day1.5% reduction
We will use the same load reduction estimating basis as done for alternative 3.Since this remedy deals with all "largest" and "significant" defined sources, it isassumed that other minor waste units contribute no load and ignores theupgradient mass loads (assumes they pass through).
For Baxter Springs
Willow Creek (same as alternate 3)
Spring BranchAll 143.86 Ac will be remediated
Tar Creek Tributary - 70.55 Ac willbe remediated
= 36 Ibs./day reduction
= 438 Ibs./day reduction
= (214 - 29) = 185 Ibs./dayreduction
If remedy 100% effective = 4,585 Ibs./dayor 98% reduction
If remedy 85% effectiveor
If remedy 65% effectiveor
3,898 Ibs./day83% reduction
2,980 Ibs./day64% reduction
DEN100150EA.WP5 A-3

V. Modified Alternative 5a-Load Reduction Estimate
We will use same basis of load reduction used for alternative 5a.
Baxter Springs
Willow Creek (same as alternate 3)
Spring Branch (same as alternate 3)
If remedy 100% effectiveor
If remedy 85% effectiveor
If remedy 65% effectiveor
Treece
Tar Creek Tributary(same as alternate 3)
Tar CreekOutwash Tails Benefit(same as alternate 3)
Reach TC-1 to TC-2
"Largest"
36 Ibs./day reduction
180 Ibs./day reduction
216 Ibs./day43% reduction
184 Ibs./day36% reduction
140 Ibs./day28% reduction
23 Ibs./day reduction
87 Ibs./day reduction
TT-33TT-30TT-31TT-32TC-3TC-29TX-7TX-29TX-31Subtotal
TX-32Total
0.71 Ac0.84 Ac7.62 Ac2.57 Ac
50.76 Ac3.15 Ac
34.09 Ac22.04 Ac11.79 Ac
133.57
6.71 Ac140.28 Ac
"Significant"
% waste area to be remediated -122.57 -r 140.28 = 95%
DEN100150EA.WP5 A-4

Station TC-1 to TC-2
If remedy 100% effective
Reach TC-2 to TC-3
.95 x 3,638 - 3,456/lbs. day reduction
"Largest"Subtotal
"Significant"
Subtotal
Total
STA TC-2 to TC-3
TT-8
TC-1 6TC-15TC-9TC-37TC-7TC-4TX-25TT-5TT-6TT-41TX-25TX-39
If remedy 100% effective
32.92 Ac32.92 Ac
17.35 Ac24.81 Ac40.04 Ac
? Ac6.67 Ac20.2 Ac
10.52 Ac2.42 Ac2.46 Ac6.26 Ac
10.52 Ac22^ Ac
163.85 Ac
196.77 Ac
= 3.2,92 gQ5
196.77 ™135 Ibs./day reduction
Treece Summary
23 Ibs. + 87 Ibs. + 3,456 Ibs. + 135 Ibs. = 3,701 Ibs./day reductionif 100% effective
If remedy 85% effective = 3,146 Ibs./day reduction
If remedy 65% effective = 2,406 Ibs./day reduction
DEN100150EA.WP5 A-5
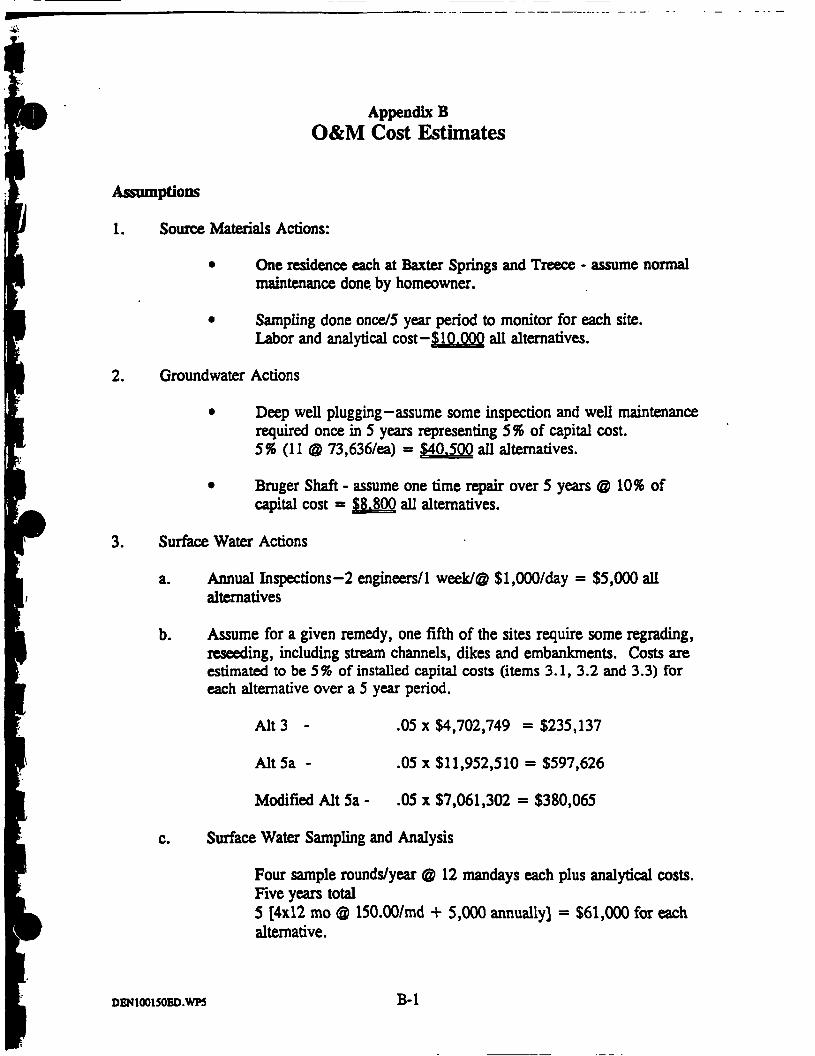
Appendix BO&M Cost Estimates
Assumptions
1. Source Materials Actions:
• One residence each at Baxter Springs and Treece - assume normalmaintenance done, by homeowner.
• Sampling done once/5 year period to monitor for each site.Labor and analytical cost-SlO.OOO all alternatives.
2. Groundwater Actions
• Deep well plugging-assume some inspection and well maintenancerequired once in 5 years representing 5% of capital cost.5% (11 @ 73,636/ea) = S40.500 all alternatives.
• Bruger Shaft - assume one time repair over 5 years @ 10% ofcapital cost = $8.800 all alternatives.
3. Surface Water Actions
a. Annual Inspections-2 engineers/1 week/® $l,000/day = $5,000 allalternatives
b. Assume for a given remedy, one fifth of the sites require some regrading,reseeding, including stream channels, dikes and embankments. Costs areestimated to be 5% of installed capital costs (items 3.1, 3.2 and 3.3) foreach alternative over a 5 year period.
Alt 3 - .05 x $4,702,749 =$235,137
Alt 5a - .05 x $11,952,510 = $597,626
Modified Alt 5a - .05 x $7,061,302 = $380,065
c. Surface Water Sampling and Analysis
Four sample rounds/year @ 12 mandays each plus analytical costs.Five years total5 [4x12 mo @ 150.00/md + 5,000 annually] = $61,000 for eachalternative.
DEN100150ED.WP5 B-l

Summary of 5 year O&M Costs
Alt 3 Alt 5a Atl 5a
1. Source Material 10,000 10,000 10,000
2. Groundwater 49,300 49,300 49,300
3. Surface Water
a. Inspections 5,000 5,000 5,000
b. Repairs 235,137 597,626 380,065
c. Sample & Analysis 61.000 61.000 61.000
Total 5 year costs $360,437 $722,926 $505,365
DEN100150ED.WP5 B-2