Embed Size (px)
Citation preview

Technical Memorandum 86151
PILOT CLIMATE DATA SYSTEMUSER'S GUIDE FOR CHARTSSUBSYSTEM
Carey E. Noll
SEPTEMBER 1984
National Aeronautics andSpace Administration
Goddard Space Flight CenterGreenbelt, Maryland 20771

PILOT CLIMATE DATA SYSTEM:USER'S GUIDE FOR CHARTS SUBSYSTEM
Carey E. Noll
National Space Science Data CenterData Management Systems Facility
Code 634
September 1984
GODDARD SPACE FLIGHT CENTERGreenbelt, Maryland 20771

PILOT CLIMATE DATA SYSTEM:USER'S. GUIDE FOR CHARTS SUBSYSTEM
Carey E. Noll
ABSTRACT
This document provides information and instructionon the use of the Pilot Climate Data System's(PCDS) CHARTS Subsystem. This facility is aninteractive software system for the . graphicalproduction, and enhancement of text and viewgraphdisplays.

Table of Concents
Section ' Page
1. Introduction... ...... 1
2. CHAETS Menu. 1
2.1 TEXT Procedure....... . 1
2.1.1 Input File Characteristics.... ... 1
2.1.2 Output Specifications....... 4
2.1.2.1 Title .. 42.1.2.2' Underline . 82.1.2.3 Border.. 82.1.2.4 Spacing 82.1.2.5 Font Style 11
2.2 VIEW Procedure . . 11
2..2.1 Input File Characteristics... .. ... 11
2-2.2 Output Specifications. ................ .......... 15
2.2.2.1 Color . 152.2.2.2 Bullets 152.2.2.3 Title 152.2.2.4 Border 192.2.2.5 Spacing. 19Z.2.2.6 Justification 192.2'.2.7 Font Style 222:.2.2.8 Hardcopy 22
2.2.3 Hardcopy Output. — 22
3. Reserved. Characters 25
3.1 Font Style Character. 25
3.2 Subscript and Superscript Characters. 26
4.. Bibliography... 29
Preceding Page Blank
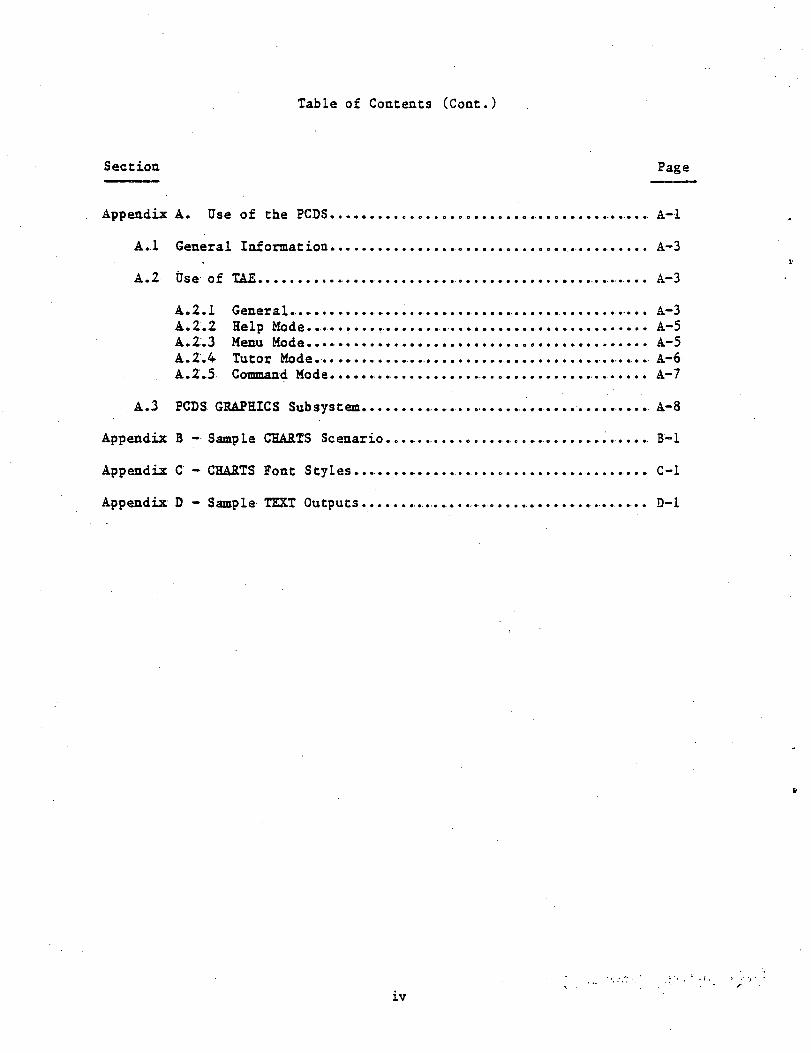
Table of Contents (Cont.)
Section Page
Appendix A. Use of the PCDS.. .... A-l
A.I General Information A-3
A.2 Use of TAE. .... A-3
A.2.1 General.. . A-3A.2.2 Help Mode... .-. A-5A.2.3 Menu Mode. . A-5A.2.4 Tutor Mode. A-6A. 2.5 Command Mode........ .. A-7
A.3 PCDS GRAPHICS Subsystem... . A-8
Appendix B - Sample CHARTS Scenario........ B'-l
Appendix C - CHARTS Font Styles... C-l
Appendix D - Sample TEXT Outputs ,.,.. ,.... D-l
IV

List of Figures
Figure- Page
2-1 CHARTS Menu 2
2-2. TEXT Tutor Display..... .... .. 3
2-3 Sample Text Input File, — 5
2-4 TEXTOPT Tutor Display.... 6
2-5 Sample Text Output... .. 7
2-6: TEXT Border Options... ...... 9
2-7 TEXT Spacing. Options. 10
2-8. Font Styles. 12
2-9- VIEW-Tutor Display... .... 13
2-10 Sample Viewgraph Input File.......... ........ . ........... 14
2-11 VIEWOPT Tutor Display. 16
2-12 Sample- Viewgraph Output...... .. ...... 17
2-13: TITLES Tutor Display 18
2-14 BORDERS Tutor Display ....... .................... . 20
2-15 VIEW Spacing Options..................... . ......... 21
2-16 Post-Processor Tutor Display...................— 23
2-17 Plot Number Tutor Display. .... 24
3-1 Sample Reserved Character Input File.,............. 27
3-2 Sample Reserved Character Output. .. 28
A-l PCDS ROOT Menu . A-4
A-2 GRAPHICS Subsystem Structure... ................... A-9
A-3 GRAPHICS Subsystem Menu. ... A-10

1. Introduction
The CHARTS utility provides the user a method to enhance thetraditional, printed output of text and viewgraph material. Two optionsare available for chart output: TEXT and VIEWgraph displays. The TEXToption provides an improvement over typical line-printer output in that a-variety of fonts may be used. The VIEW option provides an easy method toproduce standard: viewgraph output in varying colors and optionallyannotated with bullets.
Access to this utility is through the Pilot Climate Data System(PCDS).. This system provides scientific researchers with an easy method.to identify and access weather, climate, atmospheres, and oceans datasets. The: PCDS is composed of five subsystems: CATALOG, INVENTORY, DATAACCESS, DATA MANIPULATION, and GRAPHICS. The CHARTS utility is availablethrough the GRAPHICS subsystem. This User's. Guide assumes a knowledge ofthe PCDS and its user interface; however, further information andinstruction is available in Appendix A of this document and through thePCDS User's. Guide.
To utilize the features of the CHARTS facility, the user must havefirst created a file containing the desired display information with oneof the VAX standard editors.. Next, the user activates, the PCDS on theVAX (see Appendix: A), selects, the CHARTS facility, and enters, values forthe various options: which control the display of the input file.
2V CHARTS Menu
The CHARTS system allows the user to produce text and viewgraphoutput of. a-user-created input file. This menu consists of two items, asillustrated, in- Figure 2-1. Text pages will automatically be sent to thehigh resolution black and white output device (the VERSATECprinter/plotter); however,, the user may display the viewgraph pages on agraphics terminal or he may archive these pages to a file, for output viathe- PCDS GRAPHICS Subsystem- Post-Processor. The Post-Processor allowsthe combination of plots on- one page and. the specification of the mediumand size of output- See Section 2.2.3. for more details on. the use ofthis procedure.
2.1 TEXT Procedure
The TEXT procedure allows the user to output a single or multi-pagedinput file to the- VERSATEC printer/plotter. Thus, the user may improveover, the standard line-printer output by taking advantage of a variety offonts to enhance the textual display. This section discusses therequired format of the input file and the various options available toenhance the printed copy.
2.1.1 Input File Characteristics
The initial tutor display for the text input file is shown in Figure2-2. The input, file may contain several pages of textual information;all pages must be separated by a form feed character (ASCII character

Menu: "CHARTS", library "PCDS$LIB"
Text and Viewgraph Output
1) Text Charts ( TEXT )
2) Viewgraph Charts ( VIEW' )
Enter: selection number, HELP,. BACK, TOP, MENU, COMMAND, or LOGOFF.r
Figure 2-1. CHARTS Menu

Tutor:; proc "TEXT"',, library "PCDS$LIB" Pg. 1.
Text Output Charts,
pans. description value.
FILENAME Name of Input File ' "TEXT.DAT"
Enter.:: parm=value,, HELP,, PAGE,,. SHOW, RUN, EXIT, SAVE, RESTORE; RETURN to page.
Figure 2-2. TEXT Tutor Display

12). Each page of Che text input file-must be no more than 60 lines inlength. In, addition, the text lines- should be less than 80 characters inwidth. These lines of text may contain any non-reserved printablecharacter (including blank spaces). Reserved characters include:
\ ("back slash")* (tilde)* (carat)@- ("at" sign)% (accent)_ (underscore)
Similarly, special characters, such as the tab or line feed, should notbe: used within the text file. Any blank lines of text included in thisinput file will be displayed on output to the VERSATEC printer/plotter.In addition,, the spacing as it appears- in the input file is preservedupon: output, e.g*, indentation, etc. A sample one-page text input fileis given in Figure 2-3. It should be noted that the first line is partof a title and will be centered upon output.
2.1.2 Output Specifications.
Figure 2-4- shows the tutor display of text output options and theirassociated default values. By selecting various options from the tutoredparameters described below, the user may enhance the output of thecreated input file> All selected options will affect each page includedin. this, text file. Figure' 2-5 illustrates the results of the TEXTprogram for the; input file; shown in Figure 2-3.. Here, an UNderLINedtitle of ONE. line,, a MEDIUM border, SINGLE spacing, and the CROM fontwere: specified.
Following the selection of the desired options and the completion ofthe TEXT program, the output will be directed to the black and whiteprinter/plotter for retrieval at a later time. In other words., the userwill not view the results of. the TEXT program on the terminal screen;this procedure produces hardcopy results only.
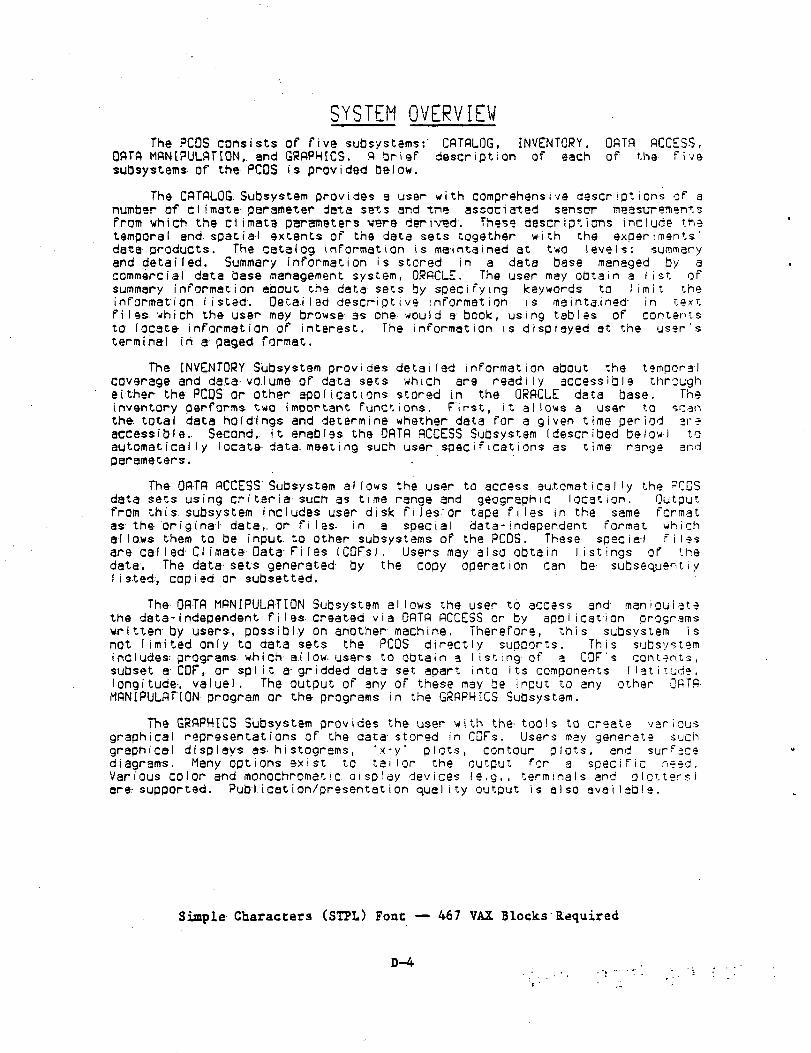
Depending upon, the size of the input file (i.e.,, the number of pagesand the number of lines, per page), the user may need a large amount offree space in his 7AX account. In addition to the size of the inputfile, the selected font style affects the size required for thegeneration of the text output. For example, the one-paged,fifty-four-lined text output shown, in Figure 2-5 required 2435 VAX blockswhen the TROM (Triplex Roman) font was specified.. However, using thesimplest font, STPL (Simple Characters), required 480 VAX blocks togenerate the output, while using the most complex font, GENG (GothicEnglish), required 2260 VAX blocks to produce the output. Followingcompletion of the printing, these large files will be deleted from theuser's VAX account. The complete set of the text outputs (and theirrespective, size requirements) generated from the input file shown inFigure 2-3 using the ten available fonts can be found in Appendix D.

STSTEfl OVERVIEW
The- PCDS consists* of five- subsystasa: CATALOG. IHVEHTORY. DATA. ACCESS.DATA HAHIPOLATION, and GRAPHICS. A. brief description of each of the fivesubsystem of th* PCDSi iai provided below.
The* CATALOG Subsyates- provides* a- user with' cosprehensive> descriptions? of a-nuaber of cliaatatparaaetar data sets and the associated sensor aeasurasentafroa;uhich tha cliaata parameters- wars* derived. These descriptions* include' thetemporal and spatial extents of the data eats together uith the> experiments'data products. The catalog, information is maintained at tuo levels: summaryand detailed'.. Suamary inforaation is stored, in a- data base aanaged by acommercial data base: aanageaent ays tea* ORACLE. The: user aay obtain a-, list ofsummary inforaation about the- data sets* by specifying, 'keywords; to liait theinformation- listed. Detailed descriptive^ inforaation is> aaintained in- textfiles! which; the- user aay browse as- one uould 3! book> using tables of: contents;ta locate inforaation of interest. The inforaation ia^displayed at the user'starainal in a paged foraat.
The- INVEMTORT Subsystaai provides: detailed inforaation about the taaporalcoverage- and data; voluaa- of data asts< uhich are- readily accessible- througheither the-- PCDS or other applications stored in th» ORACLE data base. Theinventory perforas; tuo iaportant functions. First, it allow a user to acanthe.- total data; holdings^ and dataraine- uhather data" for a- given tiae? period are'accessible. Second, it enablesv the DATA ACCESS Subsyataa (described belou) toautosatically locate data: aeeting; such', uasr specifications- as: tia« range andparaaetara.
Ths> DATA ACCESS Subsystem allous. the: user to access; autoaatically the' PCDSdata- aata- using criteria; such as tiae> range' and geographic locations OutputfroK thi» aubsysta» includes; user disk; files- or taper files; in the- saae. foraatas* the; original data or filaa^ in a special data-independent foraat uhichal:loos< thea> to- be; input to other aubsystaas; of' the PCDS. These special, files;are, called Cliaata Data Files (CDFa). Uaers «ay alao obtain listings^ of the:data. The: data sets generated by the copy operation can; be subsequentlylisted. copied' or subset tad.
The-, DATA HAMIPULATIOM Subsystaat allows: the user to access and aanipulatatthe- da tar-independent files- created vi» DATA ACCESS or by application programs?urittan by users*- possibly on another aachine. Therefore* thia aubaystea is-not. Visited only to data; sets the; PCDS directly supports. This* subsystaaincludes prograas uhich allow users to obtain a listing of a CDF'a contents,subset a-CDF. or split, a gridded data aet apart into its components: (latitude,longitude, value). The*output of any of these- aay be input to any other DATABAMIPULATIQM progras or the prograas in the- GRAPHICS: Subsystaa.
The; GRAPHICS Subsystaa. provides, the user uith the- tools, to create variousgraphical representations of the' data stored in CDFs. Users aay generate auchgraphical displays as hiatograss. "x-y"' plots, contour plots, and surfacediagraaa. flany options exiat to tailor the output for a specific need.Various color and aonochrosatic display devices (e.g.. terainala and plotters)are supported. Publication/presentation quality output is also available.
Figure 2-3. Sample TEXT Input File

Tutor: proc "TEXTOPT", library "PCDS$LIB"
parm
LINES;
ONLINE
BORDER
SPACE
FONT:
Text Output Charts
description
Number of Lines- in- the Title
Underline the Title Line(3)
Border on Text Output
Spacing of Lines-
Font Style
value
"NO"
"NONE"
"SINGLE"'
"STPL"
Enter: parm«value.-,. HELP, PAGE,. SHOW,. RUN, EXIT, SAVE, RESTORE; RETURN to page.
Figure 2-4. TEXTOPT Tutor Display

SYSTEM OVERVIEWCATALOG. INVENTORY. DATA ACCESS,
description of each of the fiveThe PCDS consists of five subsystess:
DATA yAUIPOLATION, and GRAPHICS. A'briefsubsystems of the PCDS is provided belo«
The CATALOG S'ibsystea provides a user » i t h cooprehensive descriptions of aamber of cliuate paraaeter data sets and the associated sensor oeasureoentsfroa viiich the cliaate parameter! »ere derived.. These descriptions include thetenporal and spatial extents of the data sets together »ilh the experioents'data products. The catalog iuforxation is naiutaiued at t»o levels: sunuaryand detailed. Suonary intonation is stored in a data base oanaged by *coaaercial data base aanagenent systea. ORACLE. The user may obtain a l i s t ofsunnary ittforaation about the data sets by specifying keywords to Unit theinformation listed. Detailed descriptive information is oaintained in' textfiles ihicb, the user may browse is one >ould a book, using tables of contentsto locate- iu/oraatiou of interest. The information is displayed at the user'steriinal in a paged format.
The- INVENTORY Subsystaa provides detailed infomation about the teiporalcoverage and data voluoe of data sets »hicb are readily accessible througheither the PCDS or other applications stored in the ORACLE data base. The-inventory perforns t*o iaportaat functions. F i r s t , it allots a user to scanthe total data holdings and determine vbether data for a given tine period areaccessible. Second', it enables the DATA ACCESS Subsisted (described below) toautoaaticaliy locate data aeeting such user specificatiocs as tine range andparaaeters.
The DATA ACCESS Subsystea allows the user to access autoaatically the PCDSdata sets 'ising criteria such is Use range and geographic location. Outputfroai this subsystea includes user disk files or tape files in the sane forsmtas the- original data, or files in a special data-independent format ihichallors then to be input to other subsysteas of the PCDS. These special filesare called Climate Data Files (CDFs). Users nay also obtain l i s t i n g s of thedata. The data sets generated by the copy operation can be subsequentlylisted, copied or subsetted.
The; DATA SIANIPULATION Subsystea allots the user to access and aanipulate-the! data-independent files created via DATA ACCESS or by application progransvritten by users, possibly on another machine. Therefore, this subsysten isnot United only to data sets the PCDS directly supports. This subsystea'includes prograos ibich allor users to obtain a l i s t i n g of a CDF" s contents,subset a CDF. or split a gridded data set apart into its conponents (latitude,longitude, value). The output of any of these nay be input to any other DATAUANIPULATION program or the prograns in the GRAPHICS Subsystem-.
The GRAPHICS Subsystea provides the user «ith the tools to create variousgraphical representations of the data stored in CDFs. Users nay generate suchgraphical displays as histograns. "i-y" plots, contour p l o t s , and surfacediagraas. Many options exist to tailor the output for a specific need.Various color and aooochronatic display devices (e.g.. terninals and plotters)are supported. Publication/presentation quality output is also available.
Figure 2-5. Sample TEXT Output

2.1.2.1 Title
Title lines may be included in the file. The user must enter thenumber of lines (0 indicating no title) included in the input file to beconsidered a title. If multiple pages are present in this file,, thenumber of title lines applies to all pages. Blank lines may be includedin. the title. Upon output, the title line(s) will be enlarged andcentered at the top of the page;, therefore, these lines should beleft-justified is the input file (see Figure 2-3).
2.1.2*2 Underline
If a> title has been indicated, the user may request the line(s) tobe underlined. However, if no title has been specified, this parameteris ignored* Neither blank, lines nor blank spaces included in the titlewill be underlined.
2.1.2.3 Border
Each page of output may be enclosed within a border of a selectedwidth* The user may select the type of border from the following:
NONE No borderNARROW One line-widthMEDIUM Three line-widthsWIDE, Five line-widths
Illustrations of these: border widths, are given in Figure 2-6.
2.1.2.4- Spacing
The user may select the spacing of text output lines; naturally, thetype of spacing will affect the number of lines which will fit on a. pageof output. Therefore, an excess of lines because of the spacingselection may cause the upper and lower lines of the page to be "clipped"from the- resulting; output (each text page is centered vertically onoutput). In other words, a full page is not continued on a seconddisplay; it is centered, thus removing the top and bottom portions of thepagev The: following options (and resulting page sizes) are available:
SINGLE Allows 64 lines per page (not includingtitle lines)
HALF One-half line-width inserted between eachline; allows 42 lines per page (notincluding title lines)
DOUBLE One full line-width inserted between eachline; allows 32 lines per page (notincluding title lines)
Samples of these spacing options are given in Figure 2-7. This figureillustrates the clipping which occurs at the upper portion of a text pagebecause of the space selection.
t-ritten by users, possibly OQact Halted only to data setsincludes programs fhich allotsubset a CDF, or split a grid.longitude, value), the outpuMANIPULATION' program or the'p
The GRAPHICS Subsystem p.graphical representations o.fgraphical displays as histogrdiagrams. Many options existVarious- color and aonochromatare- supported. Publicat ion/p.
fritten oy users, possioly OQaot limited only to data setsincludes programs thich allotsubset a CDF, or split a gridlongitude, value). The outpuMANIPULATION program or the p
The GRAPHICS Subsystem: ?graphical representations of"graphical displays as histogrdiagrams, Many options existVarious color and aonochrooatare supported. Publication/?
No Border NARROW Border
written by users, possialy on:not limited only to data- setsincludes programs. t-hich. a-llo*subset a CDF', or split a gridlongitude-, value).' The outpuMANIPULATION' program, or the- p
The GRAPHICS Subsystem pgraphical representations- of'graphical displays as histogrdiagrams. Many options existVarious color and. nonochrooatare- supported. Publicat i.oa/p
fTit ten. by users, possibly onnot limited only to data, setsincludes programs which allot'subset a-. CDF, or split a gridlongitude, value). The outpuMANIPULATION, program or the' p.
The GRAPHICS Subsystem ?graphical representations ofgraphical displays as histogrdiagrams. Many options existVarious color and monochromatare supported. Publication/?-
MEDIUM Border WIDE Border
Figure 2-6. TEXT Border Options

SYSTEM- QVERVIE*The ?C33 consists of fi*e subsystess: CATALOG. ISVEST08Y. CATA ACCESS.
DATA mi.'OtATIOff. lad 3RA?H[CS. A brief description of each of the fivesubsystems of tie ?CDS it provided below
Tie CATALOG Subsystsi provides i user «itli ccepretecsive descriptions of aamber of cliaate paraneter data sets aac the associated sensor oeasureoer.isfron-. vnici tie cliiate parsaeterj »ere derived. These descriptions include thetemporal and spatial elteats of tae iata sen together fitli the eipernents'data products. Tie catalog information is caiataUec at tio leveU: >unaryand detailed. Suaaarr mforaitian 13 jtorec IB .4 data base oanaged by aconercial data base jauagesent irtte:. C8AC1I. "he user aay obtain i Us: of«'l 1AA TV ilfnr^«*t'*^1 3*1111^ t h « - " a f a <4f^ IT :^«/*i*Tirff ^AtfWrtpHq
SINGLE Spaciag
suttiystsss ot tis yeas is providea aeiow
The CATAL3S Subsrstes pro»ides a user »itb cosprebeoji»e descriptions of aluiber of cliaate paraieter data lets ind the associatea sensor aeasureaentsfro*-. »hica tie cliaate aaraaeten rers iarired. These descriptions include tne:e»por»l and: >p«tial -T»»nt-« of tae: c.ata seta tojetber fitb tie eiperi»ents'data products. The catalog; information is laiaUined at t»o levels, suiaar?and* detailed. Stianary Uforiation is stored in a data base nanajed by acowereial data base jaai^cacat irstei'. ORACLI.. The user «ay obtain a l i s t ofsuiaary iaforiatioa about tie lata sets by soecifnng ke-'crds to Unit theiafonatioa listed, jetailed descriptive infcrjaticn is cainta-icec in testfiles 'Rica tie 'jsar a«» ;>ro««e as one «oulii a book, using tables of contents |-.0 locate information of iatsrsst. "he information is displayed at tte user's [k«p*-t«a.l i« * ft »«ro*4 f •M>«« f ^
HALF' Spaciag
da: a products. The catalog in/oraction is liintaiaec at t>o levels: suinary
and detailed. Suaaary Uforiation is itorec in a cata base canaged bv a
coaiercial data base saoageseat ;ystea. 3fUC'_; The user lay obtain i list of
senary iaforiation about tie -lati sets by soecifviag k«T»o.-ds to l i c i t 'he
intonation listed. Detailed descriptive infcr:aticn is eaic'.iicec ir. '.e:;'.
files »hici the user jay brorse as one »oulc a book, using tables of contents
:o locate information of iatsrest. 7ae information is displayed at the i;-=er =
teriiaal ia a paged foraat.
DOUBLE Spaciag
Figure 2-7 . TEXT Spaciag Options
10

2.1.2.5 Font Style
The user may specify one of several font styles. The title line(s)and the body of all pages, of text output will be drawn in the specifiedfont. The following fonts are available:
STPL. Simple charactersSROM Simplex Roman fontDROM Duplex Roman fontCROM Complex Roman fontTROM Triplex Roman fontCITA Complex Italic fontT1TA Triplex Italic fontSSCR Simplex Script fontGSCR Complex Script fontGENG Gothic English font
Figure 2-8 illustrates, these font styles. The complete character set foreach, font can be found in Appendix C.
2.2 VIEW; Procedure
The VIEW, procedure allows the user to output a single or multi-pagedinput: file in viewgraph format^ The initial tutor display for the VIEWproc is. given, in. Figure- 2-9. Here,, the user must enter the input filename- and desired output device, i.e., the output may be directed, to theviewing, terminal and/or to, a plot file for later display by the-, PCDS'.GRAPHICS: Subsystem Post-Processor (see Section 2.2.3). If the viewgraphs^are; to be' displayed on the terminal, the procedure will pause followingthe- graph of each page contained in the- input file. In, order to view,subsequent pages, the user should enter a carriage return.. This sectiondiscusses, the required format of the input file and the various optionsavailable to enhance the display of the viewgraph pages.
2.2.1 Input File Characteristics
The input file may contain, several pages of information; all pagemust be separated by a form feed character (ASCII character 12). Eachpage must be no more than 40 lines (including blank lines) in length; theviewgraph lines should be: less, than 80 characters in width. However, onoutput all lines will be wrapped, (at word breaks) after 50 characters inwidth.. The- lines; of the viewgraph may contain any non-reserved printablecharacter (including blank spaces). Reserved characters include:
\ ("back slash")- (tilde)*" (carat)@ ("at" sign)> (accent)_ (underscore)
Similarly, special characters, such as the tab or line feed, should notbe used within the viewgraph file. Any blank lines included in thisinput file will be displayed on output. A sample two-page input file isgiven in Figure 2-10. The first three lines of each page are part of atitle and will be centered upon output.
11

Thi? I ine i 9 output using the STPL ( S i mp 1 2 Character ) FONT,
This I me fr output using the SROM (Simplex Roman) FONT.
This. I In* I't output using. th»: OROM (Duplex Roman) FONT.
This line is output asiag the CBOM (Coupler Roman) FONT.
liae i* oatpat asiag .the TBOM1 (Tripler Soaaa) FONT.
Tk-it line is Otttjttt using the CITA (Complex Italic) FONT.
line: is output using; tk& TITA (Triples Italic) FONT.
v» «.
line- it ««.tf*t «itsf tlyr «€!!* («ailjir fa g l t i l f )
Figure 2-8. Font Styles
12

Tutor: proc "VISW",. library "PCDS$L1B"' Pg 1.
Viewgraph Output Charts
parm description value-
FILENAME. Name of Input File "VIEW.DAT""
TERMINAL Selection of Plotting, Device "YES*
Enter: parw value,. HELP,, PAGE,. SHOW, RUN, EXIT, SAVE, RESTORE;. RETURN to page.T
Figure 2-9.. VIEW Tutor Display
13

PCDS — PILOT CLIMATE DATA SYSTEMCOMPONENTS
Catalog Subsystem
Inventory Subsystem
Data. Access Subsystem
Data Manipulation Subsystem
Graphics Subsystem
<FORM FEED>GRAPHICS: SUBSYSTEM;CAPABILITIES
Create Two-Dimensional Representations of Data
Create Three-Dimensional Representations of Data
Create Text Charts.
Provide Post-Processing of Graphical Displays
Figure 2-10.. Sample Viewgraph Input File
14

2.2.2 Output Specifications
Figure 2-11 shows the first tutor display of viewgraph outputoptions and their associated default values. By selecting variousoptions, from the tutor parameters described below, the user may enhancethe output of the created input file. All selected, options will affecteach, page included in this viewgraph file. Figure 2-12 shows the resultsof the VIEW proc for the sample input file in Figure 2-10. Here,BULLETS,, a TITLE of THREE lines, a NARROW border, HALF spacing, LEFTjustification, and CROM font style were specified.
Following the initial viewing, the- user may find it necessary tomodify and then repeat the display of the input file. Therefore, it issuggested that the user first view the contents of the input file with alimited number of options, (e.g., no border, STFL font, etc.) and ifnecessary, enter TAB COMMAND mode, edit the input file to achieve thedesired results, and repeat the procedure.
2.2.2.1 Color
The user may select colors for various regions of the viewgraphpage. These areas, the main body,, the title line(s), and the border maybe output in different colors. However, if the output is, directed to ablack and white device,, the color selection has no effect upon theviewgraph display. The following list details the color definitions:
0. Default device color1. Black:2» Red3. Green4.. Yellow (Brown on the HP plotting device)5. Blue6. Magenta (Violet on the HP plotting device)7.. Cyan (Orange on the HP plotting device)8.. Waite
If title- line(s:) and/or a border is selected, the colors for theseregions are entered through subsequent tutor displays..
2.2.2.2 Bullets.
The- user may optionally specify that "bullets" are to precedenon-title lines in the viewgraph. output. If selected, all non-title,non-blank lines of all pages of output will be annotated with bullets(see Figure 2-12).
2.2.2.3 Title
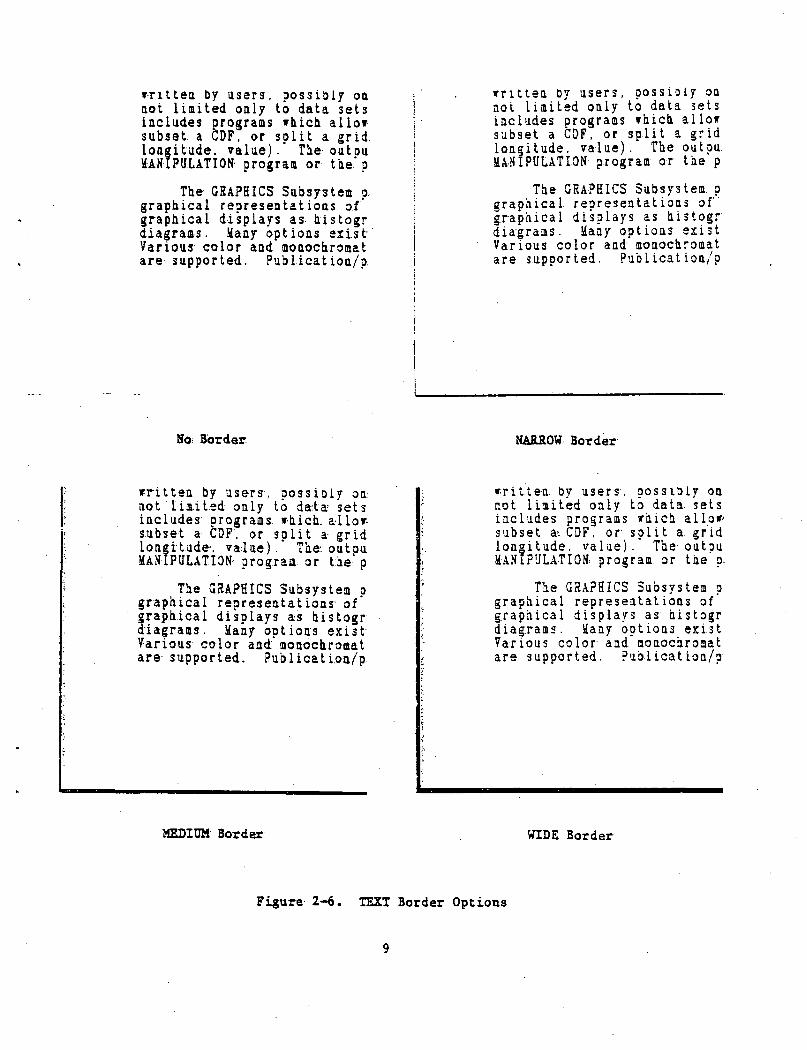
Title lines-may be included in the file. If multiple pages arepresent in the input file:,, the number of title lines applies to allpages. Blank lines may be included in the title. Upon output, the titleline(s) will be enlarged and centered on the page; therefore, these linesshould be left-justified in the input file (see Figure 2-10). If a titleis indicated, the user will view the tutor display shown in Figure 2-13 .
15

Tutor: proc "VIEWOPT", library "PCDS$LIB" Pg
Viewgraph Output Charts
parm description. value
COLOR Color for the Main Body 0.0
BULLET Annotation with Bullets "NO"
TITLE: Title in Input File: "NO"
BORDER: Border on Viewgraph "NONE"
SPACE Spacing of Lines "SINGLE"
JUSTIFY Type of Justification "LEFT"
FONT Font Style "STPL"
Enter: parm-value, HELP, PAGE, SHOW, RUN, EXIT, SAVE, RESTORE;; RETURN to pager
Tutor: proc "VIEWOPT", library "PCDS$LIB" Pg 2.
Viewgraph Output Charts
parm description value
HARDCOPY Hardcopy Device "NO"
Enter: parm»value, HELP, PAGE, SHOW,, RUN, EXIT, SAVE, RESTORE; RETURN to page.7
Figure 2-11. VIEWOPT Tutor Display
16

PCDS — PILOT CLIMATE DATA SYSTEM
COMPONENTS
9 Catalog Subaysten
Or Inventory Subsystem)
9 Data- Access Subsystem
0 Data Manipulation Subsystem
9 Graphical' Subrysteo*
GRAPH ICS SUBS YSTEM
CAPABILITIES
9 Croa-te- Two—Di aena ional, Repr aaen:ta 11 on aof Data
9 Create- Three—0inenaionalRepreaentationa of Data.
9' Create- Text Charts;
9' Provide Post-Processing of GraphicalDisplays
Figure 2-12. Sample VIEWgraph Output
17
Tutor: proc "TITLES", library "PCDSSLIB" Pg 1,
Titles for Viewgraph Output Charts
parm description value
LINES Number of Lines ia the Title. I
umiNE tfuderliae the Tit le Line (s) "NO"
COLOR Color for the Title 0.0
Eater: parmiavalue, HELP,, PAGE, SHOW, RUN, EXIT, SATE,, RESTORE; RETURN to page,
Figure 2-13. TITLES Tutor Display
18

Here, the user may enter the number of lines to be considered a title aswell as. the color of these lines. Optionally, the user may request thetitle line(3) to be-underlined. Neither blank title lines nor blankspaces will be underlined.
2.2.2.4 Border
Each page of output may be enclosed within a border of selectedwidth. The user, may select the type of border from the following:
NONE No borderNARROW One line-widthMEDIUM Three line-widths.WIDE Five line-widths
See Figure 2-6 for samples of these border width options. If a border isselected, the user will view the tutor display shown in Figure 2-14 toselect a color for the- border.
2.2.2.5 Spacing,
The user may select the spacing of viewgraph output lines;,naturally,, the type- of spacing will affect: the number of lines which willfit on a page of output. Therefore, an excess of lines because of thespacing; selection may cause the- upper and lower lines of the page to be"clipped"* from the- resulting, output (each viewgraph page is- centeredvertically on output). In. other words, a full- page- is- not continued on asecond, display;: it is centered thus removing, the top and bottom portions:.The following, options, (and resulting page sizes) are1 available:
SINGLE Allows 40 lines per page (not includingtitle lines)
HALF' One-half- line-width1 inserted between eachline;, allows. 27 lines per page (notincluding, title lines)
DOUBLE. One. full line-width inserted between eachline; allows. 20 lines- per page (notincluding title lines)
Figure. 2-15 shows the effects of the spacing selections on a particularviewgraph input file.
2.2.2.6 Justification
The type of justification for all non-title lines on. each page ofoutput may be specified. The following options are available:
LEFTCENTERRIGHT
19

Tutor: proc "BORDERS", library "PCDS$LIB" Pg 1,
Inserting Borders on Text and Viewgraph Output Charts
parm description value
COLOR Color for the border 0.0
Enter: pana=value, HELP, PAGE,. SHOW, RUN, EXIT, SAVE, RESTORE; RETURN to page.T
Figure 2-14. BORDERS Tutor Display
20

GRAPHICS SUBSYSTEMCAPABILITIES
«f 0«l*
Cr«*i« Tkr
• Craat* To«t Chart*
GRAPHICS SUBSYSTEM
CAPABILITIES
t» Text Ckart*
GRAPHICS SUBSYSTEM'
CAPABILITIES
Dftaoioyo-
SINGLE Spacing
HALF Spacing
DOUBLE Spacing
Figure 2-i5. VIEW Spacing Options
21

2.2.2.7 Font Style
The user nay specify one of several font styles. The title line(s)and the body of all pages of viawgraph output will be drawn in thespecified font. The following fonts are available:
STFL Simple charactersSROM Simplex Roman fontDROM Duplex Roman fontCROM Complex Roman fontTROM Triplex Roman fontCITA Complex Italic fontTITA Triplex Italic fontSSCR Simplex Script fontCSCR Complex Script fontGENG Gothic English font
See Figure- 2-8 for samples of the various font styles. The completecharacter set for each font can be found in Appendix C.
2.2.2.8 Hardcopy
If a hardcopy device is connected to the current display terminal,all screen output may be printed by specifying "YES" to the HARDCOPYoption. Alternatively, the user may enter a plot file name to archivethe results- for display by the PCDS GRAPHICS Subsystem Post-Processor. Amore detailed description of the Post-Processor procedure is presented inthe next section.
2.2.3; Hardcopy Output
The GRAPHICS Post-Processor provides the user a means forredisplaying plots generated by the CHARTS utility that have been savedin a plot file (i.e., TERMINAL was set to a file name in the first VIEWtutor or HARDCOPY was set to a file name in the second VIEW tutor). ThePost-Processor allows the user to specify the input file and the outputdevice. The output may be a terminal,. the black and whiteprinter/plotter (VERSATEC), the color HP plotting device, or a tape forlater slide production. A device for creating color viewgraphs directlyon transparencies will be available in the future. For specific hardcopydevices, the user will be prompted for such items as output medium, size,etc.. Figure 2-16 illustrates the first tutor display for thePost-Processor.
Each "printed" display may consist of one to four plots on a singlepage. Therefore, if several viewgraph pages, are included in the plotfile, the user may place up to four on one plot display. However, if onepage per plot is desired, the user must run the Post-Processor procedurefor each page. When two plots are selected, the layout may be splitvertically or horizontally. The second tutor display for thePost-Processor is shown in Figure 2-17. Here, the user may enter whichplot(s) are to be included in the display. For example, if the fourthplot in the input file is to be the only plot on the display, the userenters PLOTNO(1)=4, i.e., the first plot, here, the only one, is to be
22

Tutor: proc "PPOSTPROC", library "PCDS$LIB" Pg. 1+
Graphics Post Processor
parm description value
INFILE Input Plot file " "
OUTDEV Output, device "TERM'r
DELETE Deletion code "N"
TITLE: Plot Title
SAVEPLOT Save code for PDF format file: "N"
Enter: parm=value, HELP,. PAGE, SHOW, RUN, EXIT", SAVE,. RESTORE; RETURN to page..»
Tutor: proc "PPOSTPROC", library "PCDS$LIB" Pg 2.
Graphics Post Processor
parm description value
SKLPREAD' Skip code for skipping the input "N"'file-.
Enter: parm=value, HELP, PAGE, SHOW, RON, EXIT, SAVE, RESTORE; RETURN to page.
Figure 2-16.. Post-Processor Tutor Display
23

Tutor: proc "PLOTIN", Library "PCDS$LIB" Pg 1,
Plot Specific Information
parm description value
PLOTNO Plot number specification 1 (1)Enter zeroes - no blanks 0 (2)Enter all four plot numbers 0 (3)
0 (4).
Enter:; parm^value, HELP, PAGE> SHOW, RUN, EXIT, SAVE, RESTORE; RETURN to page.
Figure 2-17. Plot Number Tutor Display
24

the fourth plot found in the input file. As previously stated,subsequent tutor displays may appear for specific hardware options.
3. Reserved Characters
Several reserved characters may be used within lines of a text orviewgraph input file. These characters change the display of allsubsequent line elements until the end of the input line or anotherreserved character is encountered. These reserved characters and theirfunctions- are as follows:
@' ("at" sign) Font change character.
"" (tilde) Superscript character.
_ (underscore) Subscript character.
J.I Font Style Character
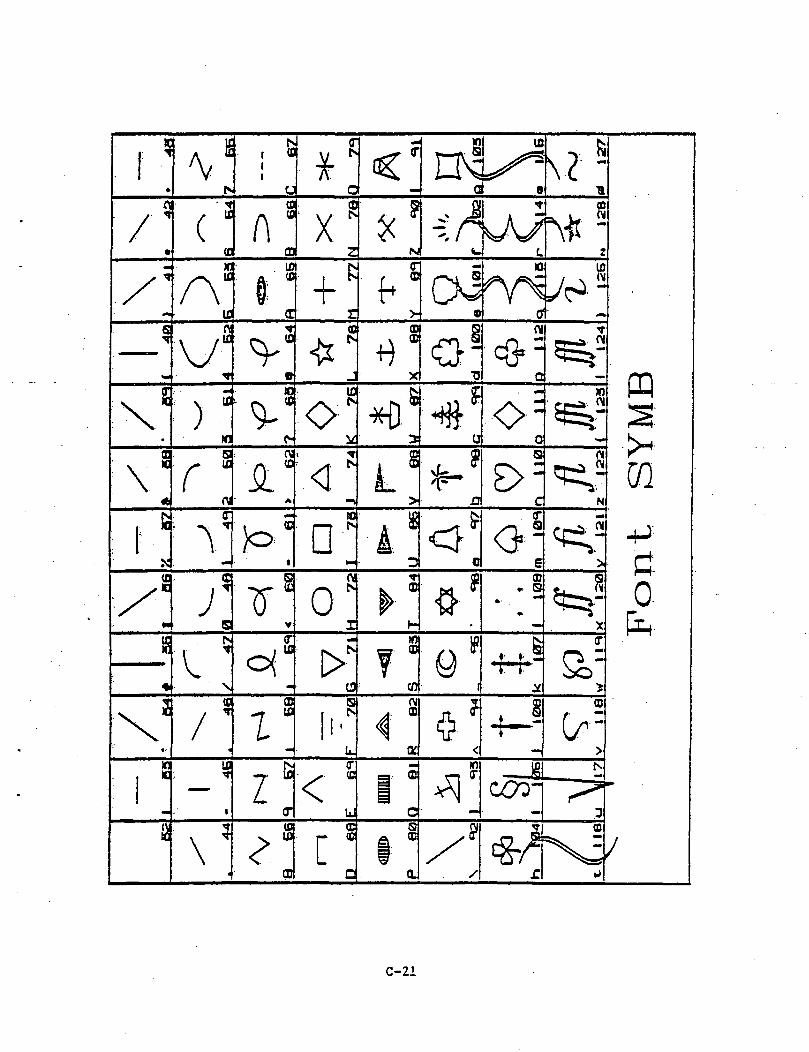
In both the- TEXT and VIEW options, the user may specify a font stylewhich will apply to all lines, of all pages, of the generated output.However, it is often desirable to change the character style within atext in order to emphasize a word or sentence or to insert a specialsymbol or mathematical character. This alteration of font can beaccomplished by inserting, the^ "Font Escape- Character" followed by thefull four-letter font name. Any of the previously mentioned fonts (seeSection 2.1.2.5 or 2.2.2.7) may be used here. In addition, many specialcharacters, may be included in the display by using one of the following,fonts:
SGRE Simplex Greek FontCGRE Complex Greek. FontGGER Gothic German FontGITA Gothic Italic FontCCYR Complex Cyrillic FontLMAT Lowercase Mathematics FontUMAr Uppercase Mathematics, FontASTR Astrology FontMETE Meterological FontMUSI Music FontSYHB Symbols. Font
The complete character set. for each font can be found in Appendix C..
In order to change the font within a line of text, the user mustinsert an "@" sign followed by the four-letter font name. All charactersfollowing this string and contained on the input line will be displayed,in the named font; however, the character style will return to thepre-set font on all subsequent lines. If a font string, is inserted andthe user wishes to return to the pre-set font (or display a second fontstyle) prior to the end of the line, an "@" sign followed by the pre-setfont name (or alternate font name) must follow the last character to beoutput in the alternate font. It should also be noted that the font name
25

must be in Che same case as the last alphabetic character preceding the"@" sign (all input lines are cycled through a procedure where changes incase are marked).
The viewgraph input file shown in Figure 3-1 illustrates the use ofthis font-change process; the output from this file is given in Figure3-2.. Here, the font style was altered from the pre-set Triplex Roman(TROM) font in order to italicize words and take advantage of severalspecial symbols. For example, the phrase "Taylor Expansion" is precededby the string "@tita" and succeeded by the string "Strom". Upon output,this phrase is placed in the Triplex Italic font and the remainder of theline is returned to the Triplex Roman font (i.e., the pre-set fontstyle). The. final line of the input file illustrates the use of theLowercase: Mathematical Font (Imat) in order to display a specialcharacter. This character is alphanumerically represented by a "?" andwill be displayed as an inequality sign (see Appendix C). To output allsubsequent characters in the pre-set font, the string "@trom" is insertedfollowing this special character. In both of these examples, the fontname following the "(§" sign is in lowercase letters since the precedingalphabetic character is also in this case.
3.2 Subscript and Superscript Character
The user may subscript or superscript characters by the insertion ofa reserved character. The Subscript Escape Character is the "_"(underscore); the Superscript Escape Character is the "~" (tilde). Eachoccurrence of the subscript character will lower the position ofsucceeding characters approximately one-third of the line-height;similarly each occurrence of the superscript character will raise theposition of succeeding characters approximately one-third of theline-height^ When the end of a line is reached, the scripting level isreturned to the zero position. If a subscript is inserted and Che userwishes to return to the normal position prior Co Che end of Che line,, asuperscript character must follow the last character to be subscripted.Likewise, a subscript character must follow the last character to besuperscripted.
The viewgraph. input file- shown in Figure 3-1 illustrates the use ofthis subscripting and superscripting process in order Co output severalmathematical expressions; the output from this file is given in Figure3-2. In the first formula, the superscript character is used Co indicateexponentiation. Following the completion of the line, the scriptinglevel, is returned to the zero position. Alternatively, in the inputphrase "r_n~(x)", the "_" causes the character "n" to be subscripted; the"""" following this "n" causes Che remainder of Che inpuc line to recurnCo the zero position.
26

TAYLOR'S FORMULA
The @titaTaylor Expansion@trom of the function..
is
1 +•• x +• x~2— -K x~3_. •«• ... if @symb(@tromx@symb((?trom<l
with remainder r_ja~(x) of
(l-x)~-l_ if. x@lmat?@troml
Figure 3-1. Sample Reserved Character Input File
27

TAYLOR'S FORMULA
The Ta-glo-f *»pan*-ton of the function
i*
rn(x) or
Figure 3-2. Sample Reserved Character Output
28

4.. Bibliography
1. Carlson, Patricia A., C. A» Emmanuelli,. E. L. Harris, and 0. C.Perkins. Primer for the Transportable Applications Executive,Version 1.0. NASA/GSFC. January, 1984.
2. The Pilot Climate Data Base Management System (PCDBMS) User'sGuide. NASA/GSFC, Information Management Branch. December,1983.
3. Template Reference Manual, Version 3. Megatek Corporation.December, 1983.
4. User's Reference Manual for the Transportable ApplicationsExecutive, Version 1.2. Century Computing, Incorporated82-TAE-USRV1F. March, 1984.
29
Appendix A — use of the PCDS

Use of the PCDS
A.I General Information
This appendix provides brief direction in the use of the PilotClimate Data System (PCDS). For more detailed instruction, the user isdirected to consult the PCDS User's Guide.
The user interface of the PCDS is. the Transportable ApplicationsExecutive (TAE). This system provides, menu selection displays, tutor(option selection) displays, and on-line help information. TAE providesthe inexperienced user an easy method to select the appropriate programs.and the required input for these programs. Alternatively, TAEfacilitates, program access, for the experienced user.
In order to access the PCDS, the user must have a user ID andpassword for this VAX 11/780 computer system- The log-on, procedure is asfollows:
<R£TURN>
Username; uname <RETURN>Password:, pword <RETURN> (the password will not be displayed)
(Computer Messages)
Following the- successful sign-on, to the computer,, the user must activatethe PCDS software system by entering the following command:
$: (3PCDSTJSER: START
Following activation of the PCDS, the user may be- required, to enter thetype of terminal he- is currently using. This is required for any remoteterminal not directly connected to the VAX. The user will then view PCDSsystem messages. A carriage return following this. PCDS banner willadvance the user to the initial (or root) menu (see Figure A-l)..
A..2 Use of TAE
A. 2.1 General
TAE provides a consistent interface to all programs and programinputs in the PCDS. TAE utilizes menus for program selection,, tutordisplays for specifying inputs to these programs, a command mode forprogram selection by experienced users, and help features. This sectionprovides basic instruction in the use of the TAE menu, tutor, command,and help functions. For more detailed information, the user shouldconsult the TAE Primer and/or the TAE User's Guide.
Preceding Page Blank A-3

Menu: "ROOT", library "PCDSSLIB:"
PCDS Version 3.0 Subsystems Menu
m
1) CATALOG Subsystem Menu . [ CATALOG ]
2) INVENTORY Subsystem Menu [ INVENTORY ]
3) DATA ACCESS Subsystem Menu [ DACCESS ]
4-) DATA MANIPULATION Subsystem Menu [ CDFUTIL ]
5) GRAPHICS Subsystem Menu [ GRAPHICS ]
Enter: selection number, HELP, BACK, TOP, MENU, COMMAND, or LOGOFF.7
Figure A-l. PCDS ROOT Menu
A-4

TAE displays (e.g., Menu, Tutor, and Help screens) follow severalconventions. First, multiple pages of information are indicated by a "+"following the page number on the first line of the display. Second,valid entries to be typed following the "?" prompt are listed on the lineproceeding the prompt line. Third, command and parameter names may beabbreviated with the first several characters which uniquely identify thedesignator (e.g., EX for EXIT, R for RUN, M for MENU, etc.)..
A.2.2 Help Mode
TAE provides help.information on itself as well as on individualprocedures and their required inputs. The available help options, are asfollows:
<RETURNX Move to the next page of the helpdisplay. The first page will be the"next" page after the last page.
PAGE n Display page number "n".
EXIT Exit the help display and return tomenu or tutor mode.
For example, when a menu is displayed, the user may enter "HELP"following, the: "?" prompt. The resulting information aids the: user in. TAEfunctions . Alternatively,, to receive instruction on a particular -menuitem,, the user may enter "HELP n" where "n." is the number in question.
A.2.3 Menu. Mode
-Following a successful access of the PCDS, the user will view theinitial (or root) menu of the PCDS system (see Figure A-l). A list ofvalid command entries followed by a prompt line is located at the bottomof. the menu mode screen. The user may enter one of these commandsfollowing the "?" prompt. The available prompt-line options are asfollows:
HELP- Display information on the operationof TAE.
HELP * Display information on the currentmenu.
HELP n Display information on entry "n" ofthe current menu.
HELP proc Display information on the namedprogram (following the menu item andin parentheses or brackets).
BACK Return to the previous menu.
TOP Return to root (first) menu.
A-5

MENU menuname Activate menu "menuname". If no menuname- is given, the current menu isredisplayed. The menu name is shownto the right of the initial menudisplay line.
COMMAND Exit the MENU mode and prompt for aTAE Command Language (TCL) command.
LOGOFF Log the user off the system.
To access one of the PCDS Subsystems, the user should now enter a number,one through five. The user will eventually access a program (or "proc"in TAE terminology) by making successive selections through menus.
A.2.4 Tutor Mode
After the user has successfully accessed a "proc", a "Tutor Display"will appear. This tutor display allows the user to enter inputparameters which the program requires. Initially, the screen shows theparameter name, description, and default value. Many of these parametershave default values. As the user selects values for these options, thetutor screen will be updated. In most cases, the entries made will bevalidated. A list of valid command entries followed by a prompt line islocated at the: bottom of the tutor screen. The user may enter one ofthese commands following the "?" prompt. The available prompt-lineoptions are as follows:
<RETURN> Display the next page of the tutordisplay.
parmavalue Assign a. new value to the option named"parm".
HELP Display help information on. TAE tutoroperation.
mETLP * Display text describing the currentprogram.
HELP parm' Display detailed text describing theoption "parm".
PAGE n Display page "n" of the tutor display.
PAGE parm Display the page containing the option"parm".
SHOW parm. Display the value entered for theoption "parm".
RUN Execute the program with the selectedoptions.
A-6

EXIT Terminate the tutor session withoutrunning, the program.
SAVE filename Save the current option values in afile named "filename".
RESTORE filename Restores the option values from thefile named "filename"'.
RESTORE LAST Restore the option values from themost, recent tutor RUN..
For example,, valid entries for the input parameters may be obtained byentering "HELP" followed by the parameter name. Once the value for aparticular parameter is selected, it may be entered by typing."PARM-VALUE", where PARM is the option name and VALUE is the selectedinput., The screen will automatically be updated with this entry. Whenall entries have been made, the user should enter "RUN" (or "R") to runthe program with these values. Depending upon the program, the user mayview a prompt line (e.g., "PCDS-VIEWOPT>") indicating that additionaltutor displays are available. In order to display these tutors on thescreen, the user should enter "TUTOR".
A.2.5 Command Mode
Command mode is. a method for an experienced user to gain Immediateaccess to a particular program, (proc). The user accesses command mode by"entering "COMMAND" while in menu mode. A prompt of "PCDS>" will appear.One: of the following; commands may now be entered:
DCL Access; the VAX from TAE; a "$_" promptappears - To return to command mode,enter "TAE"..
EXIT Terminates the TAE session and remainsconnected to the VAX account (i.e., a."$" prompt appears).
HELP" Display information on the operationof TAE. in command mode.
HELP command Display information, on the namedcommand.
LOGOFF Terminate' TAE. and log the user off thesystem.
MENU. Display the current, menu.
TUTOR Display the current tutor screen.
procname Run the program named "procname".
A-7

Thus, by entering a proc name in command mode, an experienced user mayrun programs without accessing a menu first. If input parameters arerequired by the program, the user must follow "procname" with"parm value". Alternatively, the user may enter the proc name only; amessage will be displayed indicating input values are required. The usermay then enter "TUTOR" to view the tutor display.
When the DCL command is entered, any valid VAX command may followthe "$_" prompt. For example, in the VIEW procedure, the user may needto modify an input file. Therefore, the user may enter "DCL" and invokeone of the VAX editors. After all modifications have been made, the userre-enters TAE and runs the VIEW program again. This process may berepeated until a satisfactory viewgraph display is attained.
A.3 PCDS GRAPHICS Subsystem
As shown in Figure A-2, the CHARTS facility is part of the GRAPHICSSubsystem. Therefore, the user should enter "5" in the root menu displayto access the GRAPHICS Subsystem. The GRAPHICS menu, Figure A-3, willnow appear. The CHART utility may be used by entering a "3". If a plotfile has been created, the Post-Processor may then be accessed throughmenu item 4.
A-8

GRAPHICSSubsystem Menu
PTWOOGRAPHV_ j
THREEDGRF CHARTS PPOSTPROC9
THREEDGRF ) MAPGRAPH TEXTV
j C VIEW J
Figure A-2. GBAPHICS Subsystem Structure
A-9

Menu: "GRAPHICS", library "PCDS$LIB"
GRAPHICS Subsystem Menu
1) Graph Two-Dimensional Data ( TWODGRAPH )
2) Three-Dinensional Graphics Menu [ THREEDGRF ]
3) Charts Menu [ CHARTS 1
4) Run Graphics Post Processor ( PPOSTPROC )
Enter: selection number, HELP, BACK, TOP, MENU, COMMAND, or LOGOFF.
Figure A-3. GRAPHICS Subsystem Menu
A-10

Appendix B — Sample GHAUTS Sceoario

Sample CHARTS Scenario
This appendix illustrates a typical user scenario of the PCDS CHARTSutility. In this scenario, the user accesses the Pilot Climate DataSystem and locates the CHARTS utility. The user first- runs the TEXTprocedure to print a specified input file. Next the user activates theVIEW process and graphically displays the specified input file. Thisfile is then modified and the VIEW procedure is run. a second time. Theresulting, hardcopy file is then used in the GRAPHICS SubsystemPost-Processor.
In the sample scenario, the left section of each page depicts thescreen displays the user will view; the right section providesexplanatory notes. A typical screen display consists of a screen or pageof input values- and one. line at the bottom of the page for the userresponse. In the sample case, the user inputs are shown on this line.In some instances, one screen display will require several responses fromthe user. The user will enter these values one at a time. The screen isthen, updated with the value; however, in this scenario, all requiredresponses will be shown on separate lines- of a single screen. Inaddition,, all user responses are terminated with a carriage return(<RETURN>),. though: the' <RETURN> is not explicitly shown in the scenariodisplays;.
This scenario- is intended to assist a new user in becoming familiarwith the: CHARTS utility.. However, it does not illustrate all capabilitesof the facility.. The user may obtain additional aid in running thesystem1: by utilizing the online HELP facility.
Preceding Page BlankB-3

Logging on to tt» PCDS VAX...
Osecnane: ONMJEENCBO
...logged on to PCOS, onmdnaing
to 7AX/7W v«aion V3.5
UM usoc begins by logging on totfc» PO3S VAX. flnpactant systeminfoaaatioj ia display ad. iheuser Chen invokes toe EOS
<«PUot CUnata cata
Spates Hocicaa:
S iiCBtoic SCutua:
Stand Aloae:
B-4

PILOT C L I M A T E DA.TA. YSTEM
by Coddardf l i g h t C t n l t r ' i / n / o r w a i t o n
If ana j « m « n l Brnnek
V e r s . i o n 3-.0 - F e b r u a r y I S . ' I 9 8 ' 4
Iha PCDS begins by displaying 4banner. If a rancea i-opn'"" isused, cue user will be promptedfor its type. The user attars acarriage return to continue.
B-5

HEOU: TOOT", library "POSSUBi*
PO33 Version 3.0 Subsystana Menu TS» first display is. the POSSubsystem Menu (BOOT menu). Tbutilise the CHAB3S facility, theuser aocnuBea the GBAIBICS
1) caaRLOC Sudsystan Menu [ OOftOS I Subsyataa.
2) iiWhlTIDffif Subsystem.Menu t fflVORDR? ]
3) OKA ACCESS Subayatea Menu [ UCCSSS ]
4) DMA HMHHILM3CH SubeyatBB Hem [ CSEUEL 1
5) GSMHKS Subsystem tteai [ (StSSBS I
aitar; selection nubec, HELP, a*O». 10?, «EHD, OCNUHD, or UEOFP.? 5
B-6

Menu *33AEBICS', library
GSffSKS SubsysCoB Hem. TSa G8AEHICS Subsysten- Menu isdisplayed and the user *tr.maea
1} fipaiph *
2) TJire»-Qlm«sianal Graphic* Menu
3), Qiarts tfenu
4) Am Crafbica Post Processor
{ BCCGKMH )
[ (3M3S ]
Qse*£: saiecticn nntee< BEL?; 3AOC, 1DP, «SD, OSMWND, or LQCQFF.? 3.
B-7

Mena: "aiARjs*, library "PCOSSUB
and
1)
2) Qiares
•OM CS«ns Menu provides TEXTand VTEWgraph opticna. Tha usersaleces cb* TSXT aenu
( TBEf )
( TOW )
sdectioi nuoiser, 3«3, TOP, MSO, COtVPSD, at LOGOFF.
B-8

Ttxeor: proc "THCT*; library "PODSSLia"
Output
value-
The user 13 then pronpeed toenter an input file name1 via atutor display. Bia ITLSStKEparameter is a required entry.
RLSUMB Urn* at Input Pile
attar: panpvalue, SELP, 3C2, SBCH, HJH, EXIT, SAVE, HESTDREj 8E39BH. CO paqe.
Tutor: proc library Pgl.
vain*
Hie user now begins the- TgCToutput process; by cunning thaprocedure* r
PILSUMB Mane of Input FUa
alter: paoUFvalue, HELP, StGS, SCW, TOJ, EXIT, SWE, SESTDBE; SE3UEN Co page.? anr
B-9

Tutor: pcoc •EODOFC*; library
Text Output Oiartapi mt
USES
description value'
ember of Lines la ttut title
OBdeeliBB- tnc title Une<s)
sacs Spacing of Uaes.
SCUT Pont Styla-
' user views a second tutorThese options define
output characteristics. Thereace default values £or allparaaieters.
°SHfc°
aitec: pano*value, aa?, 3CZV SHCH, BONf SOT. S5WB, BESTORB;??
to paqc.
Tutor: proe "IBI'lUKi", library TOBSUB"
descriptien vaiua
of r.jfMMt jjj hf^^. Title
CBUHE Onderline tte Title Una(s) "YES*
3C8DB& Socdfir on< Text Qut^yat ^if£Qj£'
Star Font Style -OEM'
All required parauatars areentered. Ttse program is &henna» TSCT output will bedirected to the black and whiteprinter/plotter for printing-later.
Otter: pans-value, HELP, SPCE, SOW, ECN, SOT; SfJ/E, m'lLIHB;? am
Job 23 altered on queueIcey for menu
£o page.
B-IO

Hem: "CHIOS-, library TO3SSUB*
Ttttt and Viewqzagb Output
1): Twe Qiarts
2) viwqrafh Oasts
PoOlowinq coopieticn of (becequeae, the- user is- eetutnadto me C3WOS Menu. Itaprocadira is saleceed.
Ostecr salecticn. namtaCr 3EL?> BM3, ID?, «EHD, CCMUWD, or LOGOFF.7-2:
B-ll
Tutor: ptoc "TSSif, library TOSSUS"
Output Glares
gum dafcrigeicn value
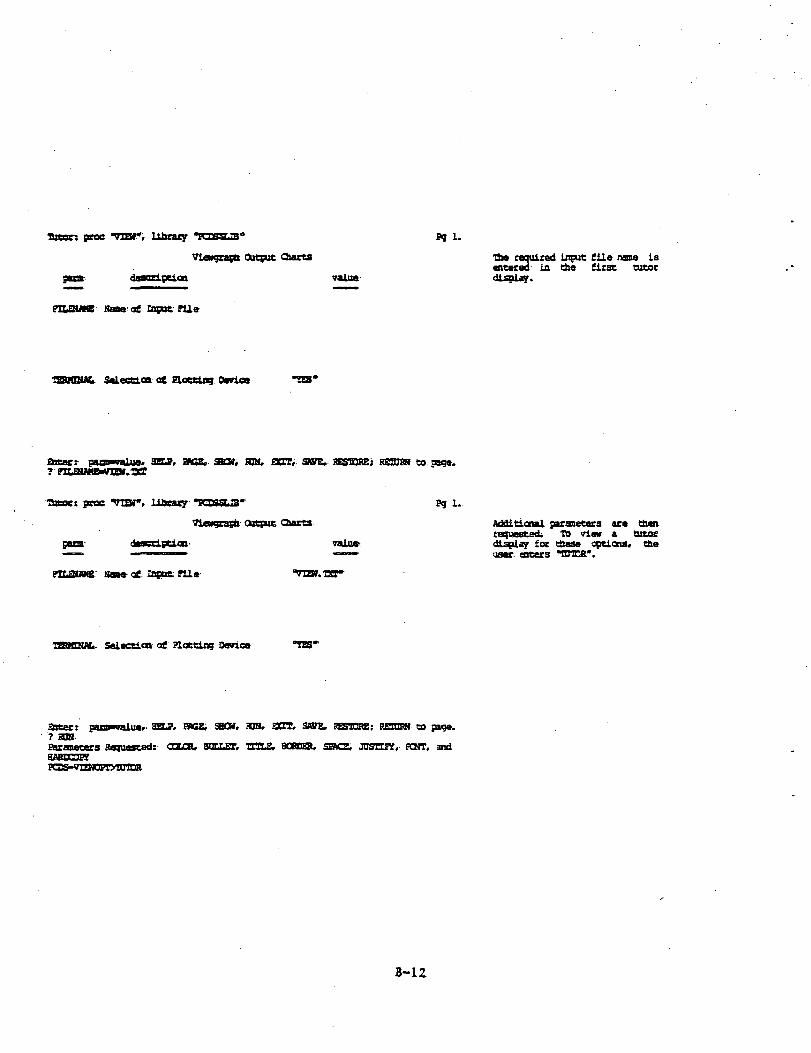
The required input file name isaltered in the first tutordisplay.
Nana of InputPUe
THWHMt Selection at Sleeting Device
Qltnrr DUBPvalue* 3BJt, EPCZo SOT, JON, 3XT> SK7B, RESIDUE; REIDOT U page.
Totoe: proc "TOH", Library *grnsgiTB* Pg 1.
Output
perm deacdpeifln
San* of. Input ?Ue-
7alu»
Additicnal paraaetera are Chenrequested, To view a tutocdisplay for tiaeso ooticna, tbeuser, enters TUTOR*.
Ti8HDU(>. Selection of: Plotting Device "IBS'
Otter: pann"nlua>- 3SL2, HPCS, SBCHr. £DNf E3QT, SfflTE, ffiS'll'JKK; BEIQSN to page.? ESWParanetars Saquastad: CQLCR, anr.r.gi>: TIttE, BCBDER, SEM2, JDSTHY, PCHT, andaaaccog
B-12

Taeat: proe "VliWUW, Library "PasstJB*
Tiaigraph Outpnc Qarts
deflccipticn-
03101
ET31T
Color Sot the ttoin Body
Annotation witb Bullets
Title in Input PU«
aoedte oa 7ta«}ta5h
Sptdaj a< Unas-
Typ» at JuttUieactoa
Font Styl*
value-
Q.O
Use user is then prompted withthe second tutor display or Tnwcpticna. Several pacaoetera areentered to ceplace the- defaultvalues.
•SO*
•SO*
"SOSB*"
tarr-
•snt*
attar: pam-value, 3SLP, EPC2, SHtW, JCN, EXIT, SXTS, S&STBSSt to page.
? SBO-6KF?
•Hitor: proe "TOTCPr*, library
Vlewgrspii-
descdpticn
pg 1*
Qiarts-
CQLCR Color for the tain Body
mrjifT Annotation witb Bullets
TTTTiB Title in Input PUa
BOOK Border oa Viewgrapti
SSMS Spacing o£
P08T Style
value
O.D
A '+• following the page nunberindicates the existence ofadditional pages of Hsig tutordisplay. ibe. user atters
to view *e next page.
Steer; pana-valua> HEL?, HPGE, SiCH, PDN, SOT, SiWE. SESTDKE; aESJtN to page.? <aEHJHl>
B-13

Tutor: pros. "TtZWOPT", library "?C8S41IB"
7i*vgrapa Output Ciart»
pans- description
2.
SAUCOFT Sardcopy Device- "TO"
The second page allow* the oaecCO racer a request for ahardeopy of the displayappeariag oa the camiiulacrean. A fila xaaa enteredhare indicaca* th* raaulti villlater b* output by cb« GBAfHICSSubayecea ?oat-?roeeaaor.
Enter: para-value, HUP, PACK, SHOW, SDH, EXIT, UTS. JESTOHE; aEIulK Co page.7 aaUCOTT-VTZH
Tutor: proe "TIZHOPT", library "?COS$LI3'
7ia*szapb, Output Charca
pam daacription
Z.
aardeopr Darica "SO"'
TJis- uaer nins cha procedure.Toa- indieaeioa of * ciela ia tba<«cond tutor proopei ttie uaarfor aodiciooal options. Toeoaor «acars TUTOR to viev atnizd tutor display.
Eater: parn-oalua, 3ZL2, ?AC2, SHOW, SOB, EXIT, SAVE, SESTORI; SETDHH co page.? UJH?araoeceri Kaqueaced: LIBES, OB1ISS, and COLOR.
B-14

Tatar: fne tlttffl", Uarmrr "KOSSIU"
Title*, for Tievgraph Output Chart*
para deicription
?g 1.
Sumb«r of Una* U th» Title
OHLUE JadaHiae, the- Titl«
COLO! Color for =i» Tiela 0.0
Tin uar Accept* c&a defaultvalues for uadarlUM aau colorof the-title. However, a titleof three lioai- ii indicated.
Eacar: ?arm«"ralu«. HUP. PACS, SHOW. SOT, EXIT, 3A?E. 2SSTOBE; IOTIBS co page.r UMBS-3
Tutor: proc "TIJ1Z5", library "ICDSSUar
Title*; for 7ia«(rapa Output Coart»
para deaeripcion valo«>
"30"
thnBbor of. Lisa*- in ctie Title
OHUBK Hadetliaa- cAa Title Una(»)
COLOR, Color for eb*. Title-
Tie procadare ia. ma. Thaiel«etioo of a aediua border iacbe> jacond tutor indicates theoeed for tba- ipecificacioa of anadditional option for ebisborder. The uaer enters TTTIOELCo view a fourth tutor display.
0.0-
SJtor: paxo-valua-, 307; ?ACZ, SHOW, SOT, SOS,. SAVE, SESTOHZ; lETOSS co page.r sra?araaater* &equ«ated: COLOR.pCOS-SORDEa^TtTtOR
B-15
Ttteae: proc "BOEESS*, library "Rasas' Pg 1.
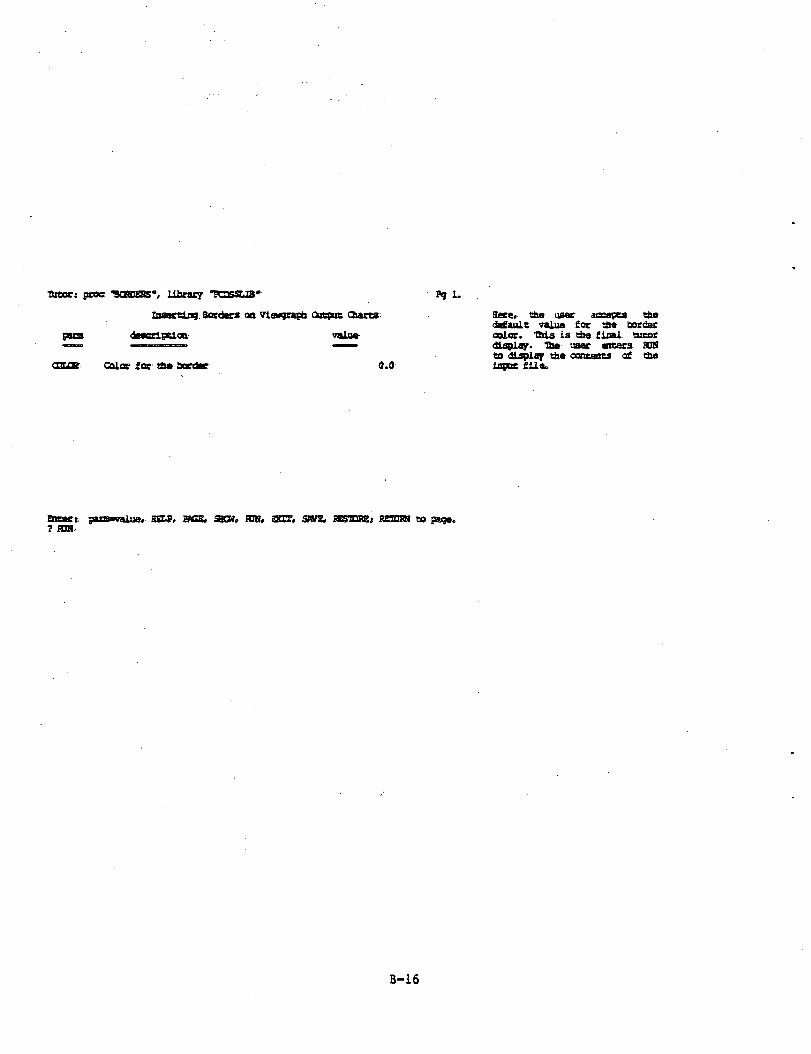
Inserting. Borders oo 7lewgtapb Output Oiatts Here, the user accepts thedefault Talua foe tfte border
deactlpeiors vait» ooiot. ibis is tfaa ficai mtoe_«_„««_ . __ display. The user enters 3DN
to display the contents of thaColor for e&» border 0.0 input flla.
Otter: pazm-vaiua, a£t?r 3GE, aO*P ION, SOT; SWE, SSSTEREj RETDF8 to page.? HJH
B-16

PCDS — PILOT CLIMATE DATA SYSTEM
COMPONENTS
9»t» !!••! pa 1 « tloa
TJiO'user now views the eesulesof the specified options an theeditor-created input file, Acarriage return will display asecond page, or in this case,advance the'user to the (3AR3S
S-17

Menu: "CHARTS", library "?COS$U3*
t«*t «n4 7i«vjr«ph Output
1) tttKc. Chore*
2) Vitwfttyti- Chare*-
input £il« tad rsdiapUy citsrosuiai.
( tzrr )
< nxa )
tas*s: salecsioa mubvr, 3SL?, UCX. TOP. HKOT, CfflHUBD. or LOGO??.f COtiKUIDPCDS>OCI,
TTEB.IS.
B-18

?os — ?iLot CLOUTS am stscatcoHFomns.
Caulog, 3ub«yit«m
Oaca Ace*** Su4»yic
H«aipalacioa
Th« uaer oodifi«» cha inpuc ill*tiling, the 7AX EDT iditor. Th«edicor it exicad and cli«- o*arrscums. co TAB and diiplay* chaCHA4TS Moan. Ti« praviou*vicwgraph display iccnario i*rapucid but aoc «hovn tier*.
ST3Snsai:[un«m«iVTBB.IXI;l 1J linn-*.TL8
B-19

PCDS — PILOT CLIMATE DATA SYSTEM
COMPONENTS
Oet* M«n i pu 1 • 1 1 on 3
Graphic • S»b*jrvte*
12ie: user now^ vieis the- resultso£ the specified options on themodified u^uc me. Acarriage return will advance theuser to the OARTS ownu*
B-20

11
2)
"Owns*"; library "5CBSSL1B*'
4od
ttacc Qarta
Oiacta
Ouccvc-
( THBT )
( 713H
Hie usac wisbea to return to etseOHAfHICS Subsystan Menu in ordertio- out^uc chs hardcofy £ilousing, t&a Pose-Processor. "Stauoac enters B^CC to proceed toth» previous menu..
? 3XS: stiecttcn oumtxsr, HELP; BJO, 'W, IGBD, OMmiDf oe UXOF7,»•.
B-21

Menu* tOlMBXS*, library
GSWHXCS Sub«ystaB Menu
1)
2)
3)
4)
oarta (*wi
am Graphics POOR Processor
( WQOSBAIH )
[ THSESEGBP 1
[ cams ]( 8EGSSBQC )
•Use CTAPBICS SUfaayseaa Mem isdisplayed and the PostProcessor procatiira ia aalecEad.
74,: stdection cusbec, 3K3, TOP, >OO, aomND? or IXCObV.
B-21

Tutor: ptoc "PfiUfl U&cary *K3SSUB*
Sortie* Post Ptoceaaoc
deacrtptior
Ingut Floe «U«- " *
vaiu*
Oaieeicn cod*
TtU,»:
Sgi*
ms user noM "lews tha PostStoceseor tutor display. UMfile name- is the sana isptevtcualy specified Sot theaWDCOP? garamacar. Ibeseaeceed cutpuc dewica is tbeblack aod wtusa(ttae VStSMEC).
fonat
HEtP> 9CZr SCT, SSSTE, SESTDREj to psqa.
: ptoc •9SCSHBBUCV Uhrar? *?CDSSUB*
Ocafbia ?<>«. Sneasaor
deicnpelcn
99
H- "<•*' JeOIwinq ete psqe-nuaser ifldicatss- the existence<rf sctHtiwai pa<5ea of (bistaitoc dlsgiay. TSe user antars<3SSSHS> to Tiev the next
Ul'iUtV
ood»
•TOO"
•H*
tnts
Saws co*- toe EOF Jonaat £Ua
Sneer; 3Q2, HPC2,. SSOfr Sfflr OO3, SfUZ, HES3DBE: .unUHtl to pwje.
B-23

Tttoc: pcoe. "PSCSI580C*;. library "SCDSSL1B*
deceztpticn
SKSSBAD Skip cod* foe skipping t&a topee
T3» default value is acceptedsod tbe ^xmjiidB is nn«Additional pacanetecs atarequested, tb view a tutordisplay foe these options, tbeuser antees TUTOR.
HELP, BftSE, SOU, 3JS, EXIT, S9V&.? sroBsranoters Saquestad: HJODB.
KfeTUHB; aESJRH to pege.
B-24

Tutors proc •KOnXT, Library "SasSUS* Pq 1.
Bloc Spaciiic rnforaatiai One paga is la the plot Silajtherefore* ttie. default value
daacripeicn value for the plot ncmtwc is iccsptad———— —— and tite program ia cm.
Plot tuibtf spaci£lcatian 1 (IV Additional pacaoeeecs araSttae zeroM- - w QlanJca 0 (2) reqnestad. Da via* a tutor
all four pilot nabors Q: (3) display for ttese options, (bea (4). user sneers anna.
ajtar: pam^alue. HOP, 9G& SCH, am, SOT, 3S/E, RESTORE; HEIDBN to psqa.? 80H'Parmetaca Requeaced; MEDIA.
B-25

proc "780", library "POSSUB"' Pg 1.
•jftia ia a» dtta. sjacific to tt» Vetaaoc 7-90 Qectxomaeic gglntgr/gloetag The default value for fan-foldpaper is selected,
pwa Jocd.pd.or>
MBDU. Typ» <tf Htdia (?,3) *?•
Otters $aatmaiu*f HELP, BK& 3CW, JBH, 317, SWE, fflSTORE; HEIDES to?UJH-
JoO 25 encated on qu«u» SSSSXiaPresa aEDK) leay for nem
B-26

Moan "SamiCS*, library "SCDSSUB"
GBKSBXS5 Subsystem Menu At the end o£ the session, tiieuser logs off the ?OS and the-ooopucec witt a single
$M»>flijMosiaiai Qtca
2) tttea Oimaaiocal Gtapiics Menu
3): Qiarta Menu.
4)- an Srapbtcs ?°st Processor
( •aaassna >
C2WOS J
Efttar; s&leetioR nunbar, HELP, 3KX 'OP; MOD,. OMWMD, oc UEOFP.TUSOft
B-27

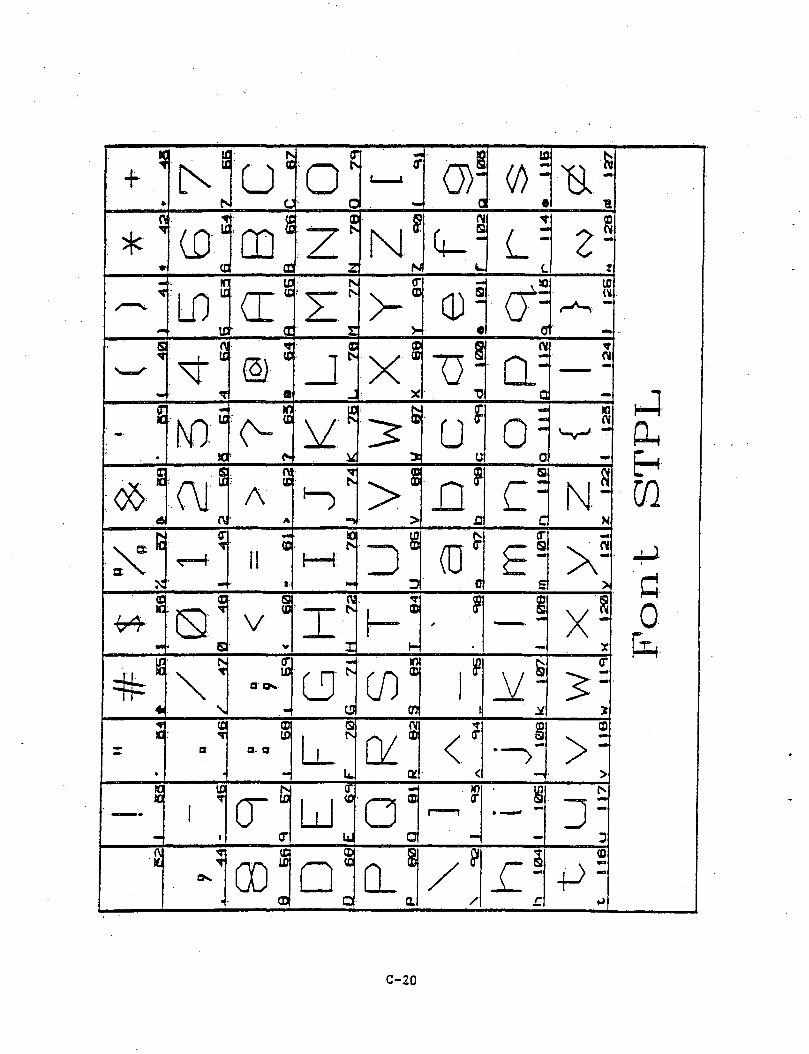
Appendix G — CHARTS Font Styles

CHARTS Font Styles
This appendix presents the complete character set for each of thetwenty-one supported font styles. Each page shows the characters of onefont. Each character is centered within a box; in the lower-left handcorner is the corresponding keyboard character, in the lower-right handcorner is the corresponding ASCII code.
84
The font name is, listed in- large letters at the bottom- of the page,
Preceding Page BlanKC-3

XN - co-u
?*•' CO"03
<fltsi
Nl
m
ID
UJ to U)N
1'V (V
Fo
nt
AS
TRo (
0 =w(\
£ a
EH NO -
U3
IS
n
0)(C 03 a; 8
Of
to
l£-Cq;
to
oa eO
(0
10
C-4

1C
0 =
ca 8
10"UJ & K)
3-inpU
ni
Fo
nt
CC
YR(T
K -
CO M— 1 ffl1 0 =«
d)2
A01(C ra5
N
009
1C
#. «\CJ0
tn3"=
« 03LD a.1
tc fs
O-
(0
CO" c'03 X
(0
05

-N
*10
* COCD NJ
tOtcII
LC
10 n n
g
W$ •ol
5
01
HR0 =
u
An rt
H
Owi td
X
V<M
H-M
IF 0
ur
3
en3 =
K COID
»• t XCD
uc
K(C
CO"09
IS
(0
C-6

U)
/\ V 5- =
toK1C
IT
1C
S <\U I <at* (V
v —
<CO" cw o f
uO r n
M
OoJ
fl:0fc
**X
(C0!
(TIfl
CO\ CD
m
"C/3
IF
(GU3
as 'u
(0
(Da, 1 CD
C-7

l£ o c <rN U
CQ"(C
ISIs
10IflU
id
in
a H
T?sci
OTK a 0 =
Fo
nt
CR
O
o Gl£
0!
n
.a ?
NUJ
cc v h- X 2
(TUX
\ (Tm s
enAt
(D
fcg
aO) O1 IP
H -U
Q *0)
C-8

It dl ID
QD"<BN
CO N
IT
U
(\l£
01
Po
nt
CS
CR& 4 =
si
Xa
cr
so
0)
UDs
»• r-
i LD en 'u
co ' 9, '
C-9

CJ0
to
(n-
*(£>"
(Dor <D
L.-CO CO
to10
(D 2 10
H
^B
<B
xNi
dr£ U3
o ft
U
Fo
nt
DR
O
CM A01(C
X)
VS(C
(VI <*•cc
\ 05
s CD10
» ff
U3
CD" LT au
CO 8Q
CD
Q. "
X
If
9
/\
CD
> r
3 =(0
C-10

-K NN tfl
CD14
id
U r
n
g
OR
HO
£0fc
A m
Sa
i UJt
X
v(TU3
-V(firnCD
en
IP
IXU3
(0
HIJC
1C'8
(0
C-ll

N U)
n
N
10
in"U3 M
w1C
Q- HOO
-Pct0fe
l A<\ffi ro-
N
H 2
V<>5
?§> O
cn<ct (0
U)
a
IF*>• " s=
0}
ic1C
U3
w '82) 'Ul
<C
CE
CD (0
C-12

u
£C
5orU)
*%> --«^Q.03 M
LC
UJ<B
K)
S^ ;
(M
Xi
M
O01
F0"7
IfD
C0
«w
a-T s
DI x-s
IF\ en
0)UJ
f * 01/«M^
Ga0
Q
i; ' CD "UJa
a(0
CO
cc
Q*
C-13

C-14

Cuc CP
u
oo-(Cor IT
N03
\D"id
N
r(D
tt
(0
XCl
H01 H
c ? <NoN-
<rt O 8
O' ft0!N a x-
X
o\
m
en*
_5O<q a
00 '8
U3 0(C o y
UJ
CDQ
CD
"
C-15

t IV c (TN
10
GO-
CDu
(0 Nfl
JCL
MJ
10"l£
O)5
JTs ^r
Cl
o 0 =M
mD
mi ut
XJ
0 C0!
CD
m
CO(C
rCDU>
Lul£
u
H co sa
a.
IF
0fe
C-16

xu0B 1C
JlS
CD" CD<onj
in" w -Q
10
Ct < S^~
(V c
HKO
roIfl
x'sa
CM"N
i c sfi0fe
«*
0T V i <vN
U3 IF\ d en
a 10
*•• 0.' xITU
w<D
UJ0
(0
0}
(D
c P5
C-17

uc a
CD
N
LOMl1£
id
U3
qu "OJ 0.= Cf
O f 0
Fo
nt
SR
O
Ns A01 N
II
1C^
E-nx-«•
X"
=*= (TU3
#• fV 0\
n
05
K<OI OD
U3(S
in
0) ' ou
3 =t
03 s0Q" Q.
(0
C-18

-d
LO
0
ca
(0
cnf
A
10UJ ^ 2
^s
^
Fo
nt
SS
CR(T
Kn
A ISN
(T W
>J
S••<
S
O' V" V*
(TID
»• A
X
m
cn0)U! «
eo"u
CO(0
"CQ
CD <0
C-19
M
*0
* '*«
*
«•
ST
+•*
£
•• „. E05
<6
X- *
_X
<cK
^ w
*;1C
•
KKJ
<\It
ir
N'fvi
'CD."<cin
in"UJft
:ta•*
MO1w
. 5
:CM f\(Tt
••
1Cs;8
•v\(C^
a
1CT
1
I
^
*0*.
«
^
0"c<c! rr ial£
•a:'<r
® saMl
'c-e.
ft
' A 'A
II S
1
8
v a
v
ITin
a o«.
CD1C
a. o
••
N
(ya<T(C
CO*CD
ff
'0'C
2szN
Zrc_rjip
v:]*T••vsf — i(V
z:CIfs
0!
L8L
ueUl1Ccro
-ff
—
N1Ncr
>-'>9
X*X
^J>'
>
D13r
h-°-H10
c^8en(Vorx
o5o
Ma.
o>!a
r 8
0-'k_
O)10
D1•ofa0
rr ?
j:
(Ds0
?^
IP
< !<
' ?
/'/
u
0 =•
/L"
L
•<<?<V
a=Q
0E0s
C =C<r
Es-s
i
^5^
•->'_ i
-c!
•a-•a
^s2'
<•H - -
^n
nc
v-^-( •"«•»
N!N
x->
X 5Xcr
£ =i
CD
> r
>^
Dr3<D
P =v>
Pont
ST
PL
C-20
CMu
d
C " x a
1C
U3
6
G(V
<#-
Fo
nt
SY
MBn
0 o=u
r(V 9
X
n
<r
0Si CO
1C
\
(TU!
in
'cn
» - or50
CD CO
Ml in
z '(T U
\ ! (0
CDC
s 03
C-21

U
U2 ftC\ O
(fl
fc10
* VV (V
ACW o fO
« M» «
A" £>n: N
10 U3
flC^
V 0(TU3
\
«)
en(IU)
s
o-u
(\X
(0
03
0)
C-22

IS 1_y
a
en-e
CO<o
03
<n
IDItX
id
m
Q 2 10
a* 8
xE
0 =
m
Fo
nt
TR
O
45 EA
01
01
»'
N-
*? ^N
0'5<C
crid
\
mt
en
- 21 (BID
a
0!
£1C
U)
f T ffi' _H "(C
CD
ffi
0" 80.
C-23

o(
CD"(D
GO"en
NN
in5
x £ , . , 2 01
E-"All
I
VIIdn
.
A(M
N
D
DinQ
*E>
cr i (VN
08 0
fcx
IS'
en
ir *a
CD
-LD
'0) 'UJ" a0
trS!
COCD
CD
Q"<
C-24


Sample TEXT Output
This appendix illustrates, the various font styles for the sampleTEXT input file of Figure 2-3. The displays have been reduced slightlyfor inclusion in this document. In all cases, an UNderLINed title of ONEline, a MEDIUM border, and SINGLE spacing were specified; only the fontselection was varied. In addition, the size required for the generationof the output is shown beneath the display.
Preceding Page BlankD-3
SYSTEM QVERVIEVThe PCOS consists of five subsystems: CflTflLOG, INVENTORY, OflTfl PCCESS,
OflTfl MfiNlPULflTION,. and GRAPHICS, fl brief description of aach of the fivesubsystems of the PCDS is provided below.
The CRTflLOG Subsystem provides a user with comprehensive descriptions of anumber of cl imate- parameter data sets and-the associated sensor measurementsfrom which the climate parameters vere derived. These descriptions include thetemporal and. spatial extents of the data sets together w-ith the experiments'data, products. The catalog information is ma-intained at two levels: summaryand detailed. Summary information is stored in a data base managed by acommercial data base management system, ORRCLE. The user may obtain a l i s t ofsummary information about the data- sets by specifying keywords to l i m i t theinformation listed-. Oeta-iled descriptive information is mainta.inecr in textfiles, which the user may browse- as one would a book, using tables of contentsto locate- information of interest. The information is displayed at the user'sterminal in a paged format.
The INVENTORY Subsystem provides detailed information about the temporalcoverage and data-vo.lume of data sets which are readily accessible througheither the PCDS or other applications stored in the ORflCLE data base. Theinventory performs two important functions. First, it allows a user to scanthe' total data holdings and determine whether data for a given time period arraccessible. Second,, it enables the DflTfl flCCESS Subsystem (described below) toautomatically locate data, meet ing such user specifications as time range andparameters.
The - OflTfl flCCESS Subsystem allows the user to access automatically the ?CDSdata sets using criteria- such as time range and geographic location. Outputfrom this, subsystem includes user disk files'or tape f i l e s in the same formatas- the' origina-l data,, or files- in a special data-independent format whichallows them to be input, to other subsystems of the PCDS. These specia-l f i l e sare called: Cl i mate Data- Fi les iCDFs). Users may also obtain l i s t i n g s of '.hedata-. The data-sets generated: by the copy operation can be- subsequentlylisted, copied or subsetted.
The OR-Tfl MRNIPULflTION Subsystem allows the user to access and manipulatethe data-independent f i l e s created via OflTfl flCCESS or by application programswritten by users., possibly on another machine. Therefore, this subsystem isnot l i m i t e d only to data sets the PCDS directly supports. This subsystemincludes: programs which allow, users to obtain a I isting of a CQF's contents,subset a CDF, or s p l i t a-gridded data set apart into its components ( l a t i t u d e ,longitude, value). The output of any of these may be input to any other DPT.Q-MflNIPULATIQN program or the- programs in the GRRPHICS Subsystem.
The GRAPHICS Subsystem provides the user with the- tools to create variousgraphical representations of the data- stored in CDFs. Users may generate suchgraphical displays as- histograms, 'x-y' plots, contour plots, and surfacediagrams. Many options exist to t a i l o r the output for 3 specific need.Various color and monochromatic d i s p l a y devices (e.g., terminals and plotter?)are1 supported. Publication/presentation quality output is also a v a i l a b l e .
Simple Characters (STPL) Font — 467 VAX. Blocks Required
D-4

SYSTEM OVERVIEW 'The-PCOS. consfs-ts of five subsystems: CATALOG, INVENTORY. DATA ACCESS.
DATA MANIPULATION, and GRAPHICS. A.brief description of each of the f i v esubsystems of the PCOS is provided below.
The CATALOG' Subsystem provides a user with comprehensive descriptions of anumber of- cl imate parameter data sets and the associated sensor measurementsfrom which the climate-parameters were derived. These descriptions include thetemporal and spatial extents of the data sets together w i t h the experiments'data products. The catalog information is maintained at two l e v e l s : summaryand detailed. Summary information is stored in a data base managed by acommercial data base- management system, ORACLE. The user may obtain a l i s t ofsummary information about the data sets by specifying keywords to l i m i t theinformation listed. Detailed d e s c r i p t i v e information is maintained in t e x tf i l e s which- the-user may browse as one would-a book, using tables of contentsto locate- information of interest. The information is displayed at the user'sterminal in a: paged format.
The- INVENTORY Subsystem provides detailed information about the temporalcoverage- and. data volume of- data' sets which are rea d i l y accessible througheither the PCOS: or other applications s.tored in the ORACLE data base. Theinventory performs: two important functions. F i r s t , it a l l o w s a user to scanthe- total data, holdings, and determine whether data for a given time period oreaccessible. Second, it enables the DATA ACCESS Subsystem (described below) toautomatically- locate data meet ing. such user specifications as time range andparameters.
The- DATA, ACCESS. Subsystem a l l o w s the user to access automatically the PCD3data.-s.ets using, cri teria- such as time range and. geographic location. Outputfrom this subsystem includes user d i s k f i l e s or tape- f i l e s , in the- same formata.s- the orig-inal data., or f i l e s in a special data-independent, format -*hichallots-, them- to be- input to other subsystems of the PCDS. These special- f i l e sare caMed-Cl imate Data Files. (CDFs). Users may. also obtain l i s t i n g s of the-data. The data: sets generated, by the copy operation can be subsequentlylisted,, copied or subsetted.
The.'DATA MANIPULATION Subsystem a l l o w s the user to access and manipulatethe'data-independent f i les created- v ia O'ATA-. ACCESS or.by application programswritten by users, possib l y on another machine. Therefore, t h i s subsystem isnot l i m i t e d - o n l y to data- sets- the- PCDS directly supports. This subsystemincludes programs- which allow, users to obtain a l i s t i n g of a COF' s contents,subset a CDF, or s p l i t a gridded data set apart into its components ( l a t i t u d e ,longitude, value). The- output of any of these may be input to any other DATAMANIPULATION-program or the programs in the GRAPHICS Subsystem.
The GRAPHICS Subsystem provides the user w i t h the tools to create variousgraphical representations- of the data, stored in CDFs. Users may generate suchgraphical d i s p l a y s as histograms, "x-y" p l o t s , contour p l o t s , and surfacediagrams. Many options e x i s t to t a i l o r the output for a s p e c i f i c ns-rd.Various color and monochromatic d i s p l a y devices (e.g.. t e r m i n a l s and p l o t t e r s )are- supported. Publication/presentation qua.Mty output is also a v a i l a b l e .
Simplex Rooaa (SROM) Font — 870 VAX Blocks Required
D-5

SYSTEM" OVERVIEfThe PCDS consists of five subsystems: CATALOG. INVENTORY, DATA ACCESS.
DATA MANIPULATION, and GRAPHICS. A brief description of each of the fivesubsysteas of the PCDS is provided beloir.
The CATALOG Subsystem provides a user with comprehensive descriptions of anumber of climate parameter data sets and the associated sensor measurementsfrom which the climate parameters fere derived. These descriptions include thetemporal and spatial extents of the data sets together fith the experiments'data products. The catalog informal ion is maintained at two levels: summaryand detailed. Summary information is stored in a data base managed by acommercial data base management system. .ORACLE. The user may obtain a l i s t ofsummary information about the data sets by specifying keywords to l i m i t theinformation listed. Detailed descriptive infornation is maintained in textfiles *hich the user may browse as one- would, a book, using tables of contentsto loca.te information of interest. The information is displayed at the user'steninal in a paged format.
The INVENTORY Subsystem provides detailed information about the temporalcoverage and data, volume of data sets which are readily accessible througheither the PCDS or other applications stored in the ORACLE data base. Theinventory performs two .important functions. First, it allows a user to scanthe total data holdings and determine rhether data for a given time period areaccessible. Second, it enables the DATA ACCESS Subsystem (described below) toautomatically locate data meeting such user specifications as time range andparaaeters.
The DATA ACCESS Subsystem allows the user to access automatically the PCDSdata' sets using criteria such as time range and geographic location. Outputfrom; this subsystem includes user disk files or tape files in the same formatas the original data, or files in a special data-independent format whichallows thea= to be input to other subsystems of the PCDS. These special filesare called Climate- Data Files (CDFs). Users nay also obtain listings of thedata. The data sets generated by the copy operation can be subsequentlylisted, copied: or subset ted.
The DATA MANIPULATION Subsystem allows the user to access and manipulatethe data-independent files created via DATA ACCESS or by application programswritten by users, possibly on. another machine. Therefore, this subsystem isnot Limited only 'to data sets the PCDS directly supports. This subsystemincludes programs fhich allow users to obtain a listing of a CDF's contents,subset a CDF, or split a gridded data set apart into its components (latitude,longitude', value). The output of any of these may be input to any other DATAMANIPULATION program or the programs in the GRAPHICS Subsystem.
The GRAPHICS. Subsystem provides the user w i t h the tools to create variousgraphical representations of the data stored in CDFs. Users may generate suchgraphical displays as histograms, "r-y" plots, contour plots, and surfacediagrams. Many options exist to tailor the output for a specific need.Various color and monochromatic display devices (e.g.. terminals and plotters)are- supported. Publication/presentation quality output is also available.
Complex Roman (CB.OM) Font — 1647 VAX Blocks Required
D-6

SYSTEM OVERVIEWThe ?COS comis-ts of -fi-78' jutorrs-tBTHST CATAtCC, INVENTORY. DATA ACCESS,
DATA MANIPULATION, and GRAPHICS. A brief description of each of the f i v esubsystems of the PCOS is provided below.
The CATALOG Subsystem provides a user with comprehensive descriptions of anumber of c I imate- parameter data sets and the associated sensor measurementsif«» .which the <: I t«at« pjaraae-fer j ware derived. These descriptions include thetemporal and spatial extents of the data sets together w i t h the experiments'data products. The catalog information is maintained at two l e v e l s : summer/and: detai led. Summary- information .is stored in a data base- managed by acommercial data base- management- system, ORACLE. The user may obtain a l i s t ofsummary Information about the data sets by specifying keywords to l i m i t the-information listed. Oetai led descriptive information is maintained in textfiles which the user may browse- as one would a book, using tables of contentsto locate information of interest. The information Is displayed at the- user'sterminal in a paged format.
The INVENTORY Subsystem provides detailed information about the temporalcoverage and data volume- of data sets which are readily accessible througheither the PCOS or other applications stored in the1 ORACLE data base. Theinventory performs two important functions. First, It a l l o w s a user to scanthe- total: data holdings and determine whether data for a given time period areaccessible. Second, if enables the DATA ACCESS Subsystem (described below) toautomatically locate- data meeting, such user specifications as time range andparameters .
The- DATA ACCESS Subsystem allows the user to access automat Teal I y the. PCD3data, sets using criteria: such as time range and geographic location. Outputfrom thi.s subsystem includes user disk f i l e s or tape f i l e s in the same- formalas the original data, or f i l e s in a special data-independent format- whichallows thenr to be input to other subsystems of the PCDS. These special f i l e sare- cal led Cl imate Data Fi les (CDFs). Users may also obtain l i s t i n g s of the-.data. The data sets generated by the copy operation can be subsequentlylisted, copied, or subsetted.
The DATA MANIPULATION Subsystem allows the user to access and manipulatethe- data- independent f i l e s created via DATA ACCESS' or by application programswri ttea by users , possibly on another machine. Therefore, this subsystem isnot l i m i t e d only to data sets the PCOS directly supports. This subsystemincludes- programs which allow- users to obtain a l i s t i n g of a CDF's content?,subset a: CDF,, or s p l i t a gridded data set apart into its components (latitude,longitude, value). -The- output of any of these may be input to any other DATA.MANIPULATION program or the programs in the GRAPHICS Subsystem.
The- GRAPHICS. Subsystem provides the user w i t h the tools to create variousgraphical representations of the data stored in- COFs. Users may generate suchgraphical displays, as histograms, "x-y" plots, contour plots, and surface-diagrams. Many options exist to t a i l o r the output for a specific need.Various, color and monochromat ic. di splay devices (e.g., termin a l s and p l o t t e r s )are- supported. Publication/presentation quality output is a l s o ava.flable-.
Duplex Roman (DROM) Font — 1863 VAX Blocks Required
D-7

SYSTEM QVERVIEf :The PCDS consists of fire subsystems: CATALOG, INVENTORY, DATA ACCESS.
DATA MANIPULATION, and GRAPHICS. A brief description of each of the fivesubsystem of tie PCDS is provided belot.
The CATALOG Subsystem, provides a user with comprehensive descriptions of anumber of cliaate parameter data sets aad the associated sensor neasureaentsfrom fhich the cliaate parameters were derived. These descriptions include theteaporal and spatial extents of the data sets together w i t h the experiments'data products. The catalog information is aaintained at two levels: sumnaryand. detailed. Summary information is stored in a data base managed by acommercial data base1 management 375ten, ORACLE. The user nay obtain a l i s t ofsummary information about the data sets by specifying keywords to l i m i t theinformation listed. Detailed descriptive information is aaintained in textfiles fhich the user aay browse as one tould a book, using tables of contentsto locate information of interest. The information is displayed at the user'sterminal ia a paged format.
The INVENTORY Subsystem provides detailed information about the temporalcoverage and data volume of data sets which are readily accessible througheither the PCDS or other applications stored in the ORACLE data base. Theinventory performs two important functions. First, it allows a user to scanthe total data holdings and determine whether data for a given time period areaccessible. Second, it enables the DATA ACCESS Subsystem (described below) toautomatically locate data meeting such user specifications as time range andparameters.
The DATA ACCESS Subsystem allows the user to access automatically the PCDSdata sets using criteria such as time range and geographic location. Outputfrom: this subsystem includes user disk files or tape files in the same formatas the original data, or files in a special data-independent format whichallows them to be input to other subsystems of the PCDS. These special filesare called Climate Data Files (CDFs). Users may also obtain listings of thedata=. The data sets generated by the copy operation can be subsequentlylisted, copied or subset ted.
The DATA MANIPULATION Subsystem allows the user to access and manipulatethe- data-independent files created via DATA ACCESS or by application programswritten by users., possibly on another machine. Therefore, this subsystem isnot limited only to data sets the PCDS directly supports. This subsystemincludes programs which allot"? users- to obtain a listing of a CDF'a contents,subset a CDF, or split a< gridded data set apart into its components (latitude,longitude, value). The output of any of these aay be input to any other DATAHANIPULATION program* or the- programs in the GRAPHICS Subsystem.
The GRAPHICS Subsystem: provides the user with the tools to create variousgraphical representations of the data stored in CDFs. Users nay generate suchgraphical displays as histograms, "r-y" plots, contour plots, aad surfacediagrams. Hany options esist to tailor the output for a specific need.Various color and monochromatic display devices (e.g., terminals and plotters)are supported. Publication/presentation quality output is also available.
Triplex Roman (TROM) Font — 2357 VAX Blocks Required
D-8

SYSTW QVERVIHThe PCOS consists of five subsystem: CATALOG. IXV8HTORY. DATA ACCESS.
DATA lAHIPULATtQH, and GRAPSICS. A brief description of each of the fivesubsystems of the PCDS is provided belov.
The CATALOG Subsystem provides a user oit/i comprehensive description: of anumber of dilute parameter data sets and the associated sensor seasurerter.tsfrom-vhich the climate parameters oere derived. These descriptions include thetemporal and spatial extents of the data sets together aith the experiments'data products. The catalog information is maintained at two levels: susaaryand detailed. Summary information is stored in a data base managed by <icommercial data base management system, ORACLE. The user may obtain a list ofsummary information about the data .sets by specifying keywords to limit theinformation listed. Detailed descriptive information is maintained in textfiles yhich the user may browse as one aould a: book, using tables of contentsto locate information of interest. The information is displayed at the user'sterminal in- a. paged format.
The rHVSXTQRY Subsystem, provides detailed information about the temporalcoverage and data, volume of data sets ahich are readily accessible througheither the PCOS or other applications stored in the ORACLS data base. Theinventory performs tvo important functions. First, it allots a user to srunthe total data, holdings and determine' ahether data for a given time period areaccessible: Second, it enables the SATA ACCESS Subsystem (described belo>a) toautomatically locate data meeting such user specifications as tine range andparameters.
The OATA;ACCESS Subsystem allovs the user to access automatically the PCDSdata sets, using criteria such as time range and geographic location. Outputfrom this subsystem includes user disk files or tape files in the same formatas the original data-, or files in a special data-independent format whichallovs them to be input to^ other subsystems- of the PCDS. These special filesare: called- Climate' Data files (COFs). Users, may also obtain listings of thedata. The: data sets generated, by the copy operation can be- subsequentlylisted, copied- or subsetted:
The- OATA lAXrPULATIQH- Subsystem-allows the user to access and manipulatethe data-independent files created via OATA ACCESS or by application programswritten by users,, possibly on another machine. Therefore. this subsystem isnot limited only to data, sets the PCOS directly supports. This subsystemincludes programs which allov users to obtain a listing of a CDF's contents,subset a CO?, or split a gridded. data- set apart .into its components (latitude,longitude, value). The output of any of these may be- input to any other DATAIAHPULATFQN program or the programs in the GRAPSICS Subsystem. ' '
The GRAPHCS Subsystem provides the' user aith the tools to create variousgraphical representation's of the: data stored in CDFs. Users may generate suchgraphical displays as histograms, "r-y" plots, contour plots, and surfacediagrams. ifany options exist to tailor the output for a specific need.Various color and monochromatic display devices (e.g.. terminal's and plotters)are supported. Publication/presentation quality output is also available.
Complex Italic (CITA) Font — 1961 VAX Blocks Required
D-9

SYSTHThe PCDS consists of five subsystems: CATALOG. IHVEHTORY, DATA ACCESS,
BAT A: HA8IPVLATIQH, and GRAPHICS. A. brief description of each of the fivesubsystems of the PCDS ia provided below.
The CATALOG Subsystem- provides a user vith comprehensive descriptions of anua6«r of climate parameter d«<« sets and ike ass-ocixted s-eusar meas-nr-emfnts/ro« v-kick the climate parameters sere derived. These descriptions include thetemporal and spatial extents of the data sets together with the experiments'data products. The catalog information is maintained at two levels: summaryand detailed. Summary information is stored in a data base managed by acommercial datar base management system, ORACLE. The user may obtain a list ofaummary; information about the data sets by specifying keywords to Unit theinformation listed. Detailed descriptive information is maintained, in textfiles' vhich the user may brovse as one icon Id a book, using tables- of contentsto locate information of interest. The information is displayed at the user'sterminal in a paged format.
The IRVISTQRY Subsystem provides detailed in/ormation about the temporalcoverage and data volume of data sets which are readily accessible througheither the PCDS or other applications stored in the ORACLE data base. Theinventory, performs two important /unctions. First, it allows a user to scanthe total data holdings and determine vhether data for a given time period areaccessible. Second* it enables; the DATA ACCESS Subsystes (described belov) toautomatically locate data meeting such user specifications as time range andparameters.
The DATA- ACCESS Jubsyste* allows the user to access automatically the PCSSdata, sets using criteria such as time range and geographic location. Outputfro* this- subsystem includes user disk- files- or tape files in the same . formatas the original data, or files in a special data- independent format whichallova them to be input to other subsystems of the PCOS. These special filesare called Climate Data files (CDFs). Users may also obtain listings of thedata. The data sets generated by the copy operation can. be subsequentlylitted,. copied or subset ted.
The DATA' H.ASIPULATIOH Subsystem allows tAe user to access and manipulatethe data-independent files created via DATA ACCESS or by application programswritten by users,, possibly on another machine. Therefore, this subsystem isnot limited only to data sets the PCDS directly supports. This subsystemincludes programs which alloy users to obtain a listing of a CSF ' 3 contents,subset a CDF, or split a gridded data set apart into its components (latitude,longitude, value). The output of any of these may be input to any other DATA1&HT7TLATIOR program or the programs in the GRAPHICS Subsystem.
The GRAPHICS Subsystem- provides the user \sith the tools to create variousyrapAicaf representations of the data stored in CDFs. Users may generate suchgraphical displays as histograms^ "x-y" plots, contour plots, and surfacediagrams, ifany options exist to tailor the output for a specific need.Various color and monochromatic display devices (e.g., terminals and plotters)are supported. Publication/presentation quality output is also available.
Triplex Italic (TITA) Font — 2500 VAX Blocks Required
D-10

v >^i>w»cx<tc-
u^Cfr*- >^»tk£*^v »• ur^or'v »c-o*A, &o>*<>i<a.Aar n4.oV<>* a* v o^c-aoo-***^ »j-O
Aa£fe afr'vaAafd&'w i»0r*v& ia/'vc-w"^ . 7&&^& ia,vc 1/00^6 »*i, £ffcc£u.(£a, ttA,<a^ «,c^*.*tv */^ ^4>a> ia-^a. v^£v C»a*^Ao,x ^c-CA, ^A,a- i 'S>*'v^*a,ft^ v
» fl»O 3, <* R» m <* ^r U>
£ (vu. a/. * k& 0,4-0,1, wau. *i.ic,6n. a. Z^^C +£
>u ^f>«/oc-p^<> tva. w<* O<bo>o^<» *^ voi* </•<>// c*w»v c«i»cio^«<fcCo***
»u>£<i a*. 5.* . ,
i>a4
ruv&4r<v- >^»e*-<^*a^ v <ia*£<vi.£*'<i liftp i*^ Aa^c-^fv d^ouC iA.* Co. nf><vt,a 6
«/& v »R>c^onf AT/* i/«/*(*C'O »o&&v^o^v4^ C A/ 1"*'.* A*
, <^ C aCC'ifrw^ a* t*V4-t/ i-v
. &&'*' <V 9<x '><&(» OO- »* »«^ l/C'-Xl *!/<&
) 60a.i »j,f\(t
ae/oa-'iv tfrirt-'V 6v 6^v >-T/ Cct&O'
- , »% J^L>&<UV c-»v a* •wp.«/cc.»o (ia,Ca,-
. ,ft.^& i.&C/CL-'i C-4
^-^a,c^ ^ u ^ C i ^ n ^ ^ >^ ^A
» »C jto-t^r v s, a- «.»&*•<* o-o.* j 4v 4 46 GS> oo **t- i-y- aaa-Co-c-a^o-Afv ot»a.'fi-u» t*^«rifV', >9>4«^cr&&u» »»»- arfb»on*«r'v nOfcAfG-nf^/ . * a «/ 1/ «/p * -v «
>^*&'va*v »At^Cr^ *&S»«*- a V 4*^4* £« »y--Cac'#* a 60-4,^0.^0- */^o- 1/
at
ai
«.a'\a*i»"fe«t£>aCt'»**i» a*p -*- *aCa. vC»t/ara o. fv u<f $, . r*i*t ^/i, nau aa.**<t-i*aC«» vt*o
a I* a & Ar o & a 6 ao-v»6<*tbV *v Ar^v&^-^'viLw^ p »"•> a»o»Cv , C->A£OUI/ ^Co-Ci, , Ofitfi i. a, -^ ,£ a, o
vi*. »aC<l-of&-v C'Sc- V t Co t*o- •^»'V Ca-«/ >u,£pur£ ,P*a' ^ i* O c- c- c- c a 3, 4, A .. a. , C e r i / A c n & C ^ i ad
a-u.aC-*>(> *.<* t&tu t £>$> a £ i-» *t*a,c-tic* vy>Ca*cfr a-^t^c-ca- !»
Simplex Script (SSCR) Font — 1444 VAZ Blocks Required
D-ll

iv lil
jnt
{,!* 6 i,u-* <>iv/?
»«i*ca a
*/
£»» 9 »& C * C^* £••» i. Op
^«a«^A«i> oi.6k tka, »s^»i* i.»« »<f». '
^AC(B&A»a oc &»»- & C ' t * 4 > & > ' >(*n*naru
i t
»j«
, it
SA3A
&at&.
c&«i«bA ^<*on>
«&v
000*1.1.
i , ,oi-a^ ii,Ln,if* of tk,t<*v^^aucn& &
, hs"^t,i,l i »«, . 5 li c
3 k
6 6 a atvu SA3A
3 n
»A t <>»f** t /&o*(^ i>»i»»cA?»»«a & u- i, c t, *
a aao <^C<*
6 «/c T*«/ a 6 «/ o a
<*C(ii* o r 9 ^ A* c </ i/ e.
Complex Script (CSCR) Font — 1749 VAX Blocks Required
D-12
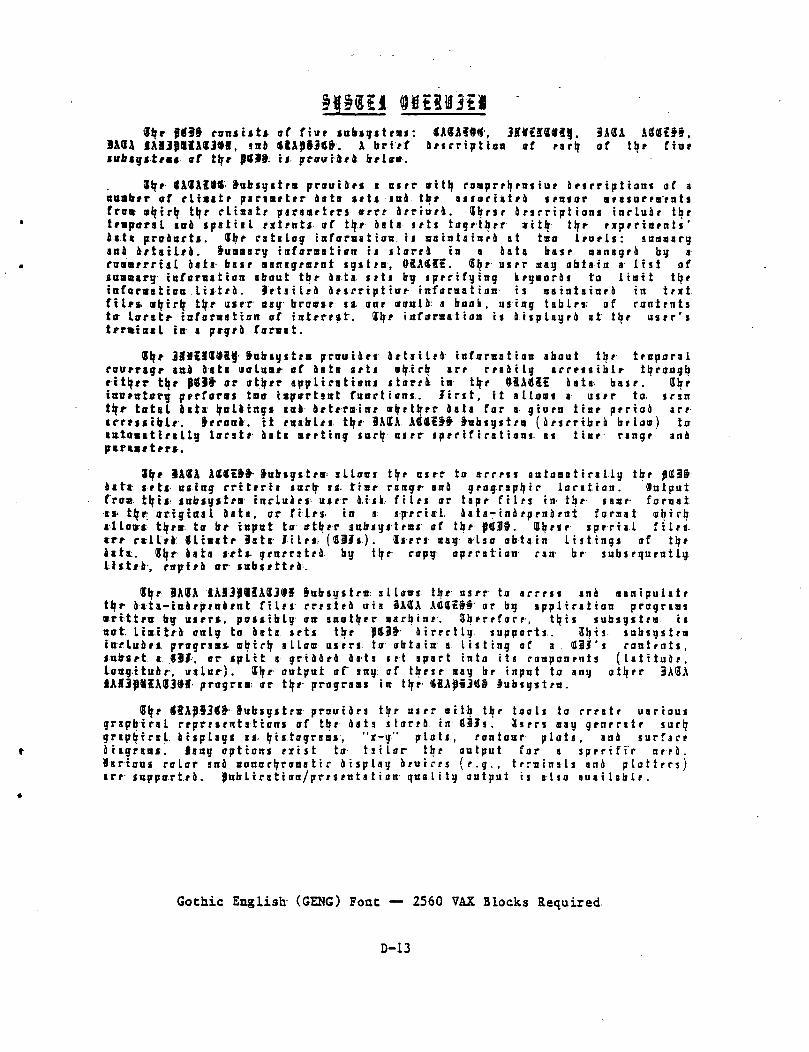
««?r J9«9§ eont i t t t of f i v r subsgs t ra s : «A«A?fl«, JI<r€2T<I«if . IA«A A««£§»,1A9A mjjjaiAtJtffl, sni «Afl8J«&. A b r i r f a r s r r i p t i o a of r a r t f of t i f f f i n *»ubig»tra« af tljr {Wl§ if prauiara brio*.
Jiff HVAilft f u c i g i t r m p rau t i r s a a s r r »itb. roapr r If rni iur o r s r r i p t i a n t af anaatrrr a f r l i a i t r p a r s a r t r r i a t s s*t* mi tb r a s s a r i a t r f t s r a s a r B r a s u r r a f n t sfro* o l f i r l f t i f f r l i a a t r p a r s a r t r r s v r r r i r r i w r i . 3 b r s f a r s r r i p i i a n s i n r l u a r t b rt r apo ra l a n i s p a t i a l r x t r n t i a f t i f f o a t a i r i s t o g r t b r r x i t l i t l jf t t p t r i a t n t i 'l a t t proiar ts . I I f f r i t i l o f i a f a r a a t t a n t i a a t n t a t n r i a t t an i r n r i s : s a o a a r gsni i r t s t l r i . §uaaary t i t f t r rns t tan t j i l o r r i in a i a t a b s s r n a n s g r i bi j af o a a i f r r t i l o a t a - b a i f a a n s g r o r n t i g s i r a , OSASii. 31rr o s r r aai) o b t a i n a- l i s t ofjuasurg i n f o r a a t t o n abou t t b r i a t a t t t i bg f p f r i f g i n g i r y t o r b t t o U n i t t i f ft u f a r a a t t a u l i » t * a . I r t a i U t i r i r r i p t t u f i i t f a r a a t i a n t j a a i n t a i n r i i n t r x tfi lri . « If tr If t i ff u j r r aag braosr Ji anr mil 14 a b o o k , u s i n g t a b l r r of r a n i r n t st f f lirrstf t a f a r a a t i o R o f t r t t fm t . Jb f i n f o r a a t t a n i t a i i p l a g f i a t t i f f u i r r ' ttrrstiital in a pagril f o r m a t .
Slff JlVZIXHSf- J u b i g i t f B p r o u t o f j a f t s t l f a i n f o r a a t i o n a b o u t t b f t r a p o r a lrovfTigp atta g a t a uolaif- a f 4s t a t t t i o b t r l r a r r r r a H l g a r r r i s i b l r t b r o u g i jf t t t f f r tiff J8381 or otb.fr a p p l i r s t i o n i t t o r r a in t l f r 9SAtfi£ 6 a t a b a i f . 31 brtnnrn targ p r r fa rn too t a p o r t j i t t f a n r t t a n s . . J i n t , i t a l l o a t i \ i t t r to . ( r a ntiff to ta l b a t a I f o l o t n g i a a i S f t f r a i i t f « b , f t b , r r a a t a f o r a - g i u r n t t a f p r r i o A a r ra r r r j i t b l f . § f r o n o , i t f n a b l f i t l fr i&IA A<Ui§£ J n b j g j t r i s ( i n r r i b r i b f l a o ) toaatoaat i r a l l g t o r a t r a a t a a r r t t n g sarb, u i r r i p r r i f t r a t ioni- a i t t a r - r a n g r a n dptr«»r trr».
3lfr IAUA A«I»» §ubtgitr» al loni tbr airr to a r r r t t au toaa t i rallg tbroata- i f t l u i t ng r r t t r r i a «a rb / > « . t t a r r a n g r - a n i g rog . r apb . t r l o r a t i o n . f l u t a u tf ro» t l f t i sansystr i i n r l u l r i u » r r a t i k f t I r s o r t a p r f i l r s i n t l f r s a a r - f o r a a ta s tlfr o r i g t a a l a a t a , o r f i l r a . i n a ip r r i a -1 . l a t a - i n o r p r n o r n t f o r m a t o b i r ba t lout tlfrar to br inpu t to o t b f r subiui t ra i of tbr f f f l JS . l l f r s r s p r r i a i f t Us .a r r r tUra « l i « a t r iats- J i U « (Sill.), d s r r i nag a l s o o b t a i n l i s t i n g s o f t l f raata:. 31; r o a t a srt» g r n r r a t r a bg t i f f rapg- a p r r a t i a n r an - br s u b s r q u r n t Igl istro, r t r j r t ra or » B b s r t t r « .
8 I f f iAUA lASJJ«IA3Ji|f J u b i g s t r o : a l l o w s tb r u s e r to a r r r s s sni) a a n t p u l a t rtb,f s-a-ta-tnar pr t t o rn t f i l r s : r r r a t r i u ta 1A3A AfflSt§§ or bg a p p l i r a t i o n p r o g r a a s• r t t t r a bg u s r r t , po i t i b lg o i r anatb . t r n a r b t n r . H b r r r f o r f ' , t h i s s u b s g i t r t ) i sn o t I t a t t f o onlg t o 6 a t a s r t i t b r JU3* a t r r r t t g suppor t s . . B h t j s n b s g s t r ai n r l u o r i . progrsas- nb i r l f a l l o o asm to- o b t a i n a l i s t i n g of a (il J ' J r o n t r n t s ,subsf t a : 917. o r s p l i t a g r i o o r i a a t a i r t a p a r t i n t o i t s r o a p o n r n t s ( l a t i t u a r ,l o n g i t u d f , v a l a r ) . Jiff ou tpu t of ing af t b r s r Bag br i n p u t to any a t l j r r 3AC5A
prograaj ; or t l f r p rograas t i t t l f r ' <tiA|iJ«l§ » u b s g s t r a .
9ifr ISAJiJ*^- S u b j g s t f a p r o u i a r s t b r u s r r n i t b t b r t o o l s t o r r r a t r u a r t o u sg r i p b i r a l r r p r r s r n t a t ions o f t b f a a t a s t o r r o i n SIJs. 3 s r r s n a y g r n r r a t r s u r t fg r t p b i r i l H i p l a g i i s I f t s t o g r s a s , "<~g" p l ' t s , r o n t o u r p l o t s , a n i s u r f a r rHigraai. tang op t i ons r z i s t t o t i i l t t r t b r o u t p u t f o r a s p r r i f i ' r n r r o .V a r i o u s ro lo r a n i aonor l f roaa 1 1 r i t s p l a g i r u t r r s ( f . g . , t r r a t n a l s an i l p l o t t r r j )t r r suppor t . f i . f u b l i r a t i on /pr r s r n t a 1 1 on- q u a l i t y o u t p u t i s a l s o a u a i l a b l r .
Gothic English (GENG) Font — 2560 VAX Blocks Required
D-13

BIBLIOGRAPHIC DATA SHEET
1. Report No.TM-86151
2. Government Accession No. 3. Recipient's Catalog No.
4. Title and Subtitle
Pilot Climate Data System: User's Guidefor Charts Subsystem
5. Report DateSeptember 1984
6. Performing Organization Code
7. Author(s)Carey E. Noll
8. Performing Organization Report No.
9. Performing Organization Name and AddressNational Space Science Data CenterData Management Systems FacilityGoddard Space Flight CenterGreenbelt, Maryland 20771
10. Work Unit No.
11. Contract or Grant No.
13. Type of Report and Period Cowered
12: Sponsoring Agency Name and Address
14. Sponsoring Agency Code
15. Supplementary Notes
16. Abstract
This document provides information and instruction on the useof the Pilot Climate Data System (PCDS) Charts Subsystem.This facility is an interactive software system for'thegraphical production and enhancement of text and viewgraphdisplays.
17. Key Words (Selected by Author(s))
Pilot Climate Data System,Template, Viewgraphs,Text Processing, Graphics
18. Distribution Statement
19. Security Classif. (of this report)
U
20. Security Classif. (of this page) 21. No. of Pages
98
22. Price'
*For sale by the National Technical Information Service, Springfield, Virginia l c."\ GSFC 25-44 (10/7/J