Embed Size (px)
Citation preview
Technical guide to the Cortana Analytics Solution Template for predictive maintenance in aerospace and other businesses
Acknowledgements
This article is authored by data scientists Yan Zhang, Gauher Shaheen, Fidan Boylu Uz and software engineer Dan Grecoe at Microsoft.
Overview
Solution Templates are designed to accelerate the process of building an E2E demo on top of Cortana Analytics Suite. A deployed template will provision your subscription with necessary Cortana Analytics components and build the relationships between them. It also seeds the data pipeline with sample data generated from a data generator application which you will download and install on your local machine after you deploy the solution template. The data generated from the generator will hydrate the data pipeline and start generating machine learning predictions which can then be visualized on the Power BI dashboard. The deployment process will guide you through several steps to set up your solution credentials. Make sure you record these credentials such as solution name, username, and password you provide during the deployment.
The goal of this document is to explain the reference architecture and different components provisioned in your subscription as part of this solution template. The document also talks about how to replace the sample data with real data of your own to be able to see insights and predictions from your own data. Additionally, the document discusses the parts of the Solution Template that would need to be modified if you wanted to customize the solution with your own data. Instructions on how to build the Power BI dashboard for this Solution Template are provided at the end.
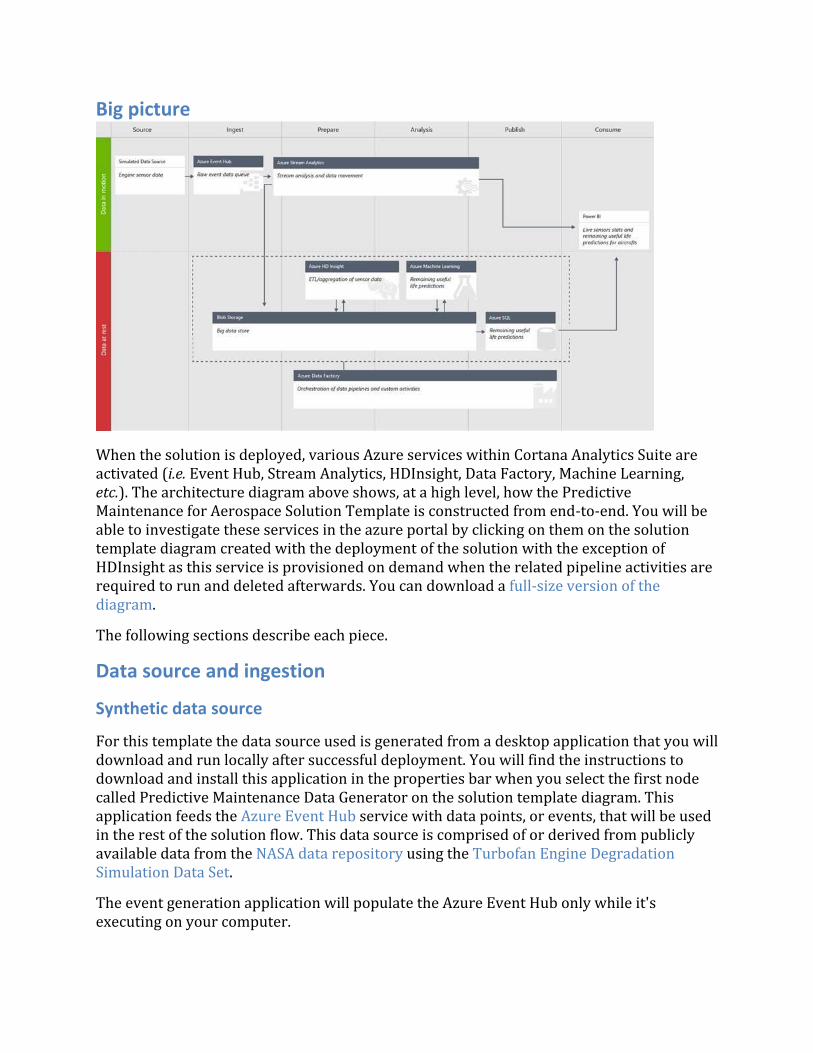
Big picture
When the solution is deployed, various Azure services within Cortana Analytics Suite are activated (i.e. Event Hub, Stream Analytics, HDInsight, Data Factory, Machine Learning, etc.). The architecture diagram above shows, at a high level, how the Predictive Maintenance for Aerospace Solution Template is constructed from end-to-end. You will be able to investigate these services in the azure portal by clicking on them on the solution template diagram created with the deployment of the solution with the exception of HDInsight as this service is provisioned on demand when the related pipeline activities are required to run and deleted afterwards. You can download a full-size version of the diagram.
The following sections describe each piece.
Data source and ingestion
Synthetic data source
For this template the data source used is generated from a desktop application that you will download and run locally after successful deployment. You will find the instructions to download and install this application in the properties bar when you select the first node called Predictive Maintenance Data Generator on the solution template diagram. This application feeds the Azure Event Hub service with data points, or events, that will be used in the rest of the solution flow. This data source is comprised of or derived from publicly available data from the NASA data repository using the Turbofan Engine Degradation Simulation Data Set.
The event generation application will populate the Azure Event Hub only while it's executing on your computer.
Azure event hub
The Azure Event Hub service is the recipient of the input provided by the Synthetic Data Source described above.
Data preparation and analysis
Azure Stream Analytics
The Azure Stream Analytics service is used to provide near real-time analytics on the input stream from the Azure Event Hub service and publish results onto a Power BI dashboard as well as archiving all raw incoming events to the Azure Storage service for later processing by the Azure Data Factory service.
HD Insights custom aggregation
The Azure HD Insight service is used to run Hive scripts (orchestrated by Azure Data Factory) to provide aggregations on the raw events that were archived using the Azure Stream Analytics service.
Azure Machine Learning
The Azure Machine Learning service is used (orchestrated by Azure Data Factory) to make predictions on the remaining useful life (RUL) of a particular aircraft engine given the inputs received.
Data publishing
Azure SQL Database Service
The Azure SQL Database service is used to store (managed by Azure Data Factory) the predictions received by the Azure Machine Learning service that will be consumed in the Power BI dashboard.
Data consumption
Power BI
The Power BI service is used to show a dashboard that contains aggregations and alerts provided by the Azure Stream Analytics service as well as RUL predictions stored in Azure SQL Database that were produced using the Azure Machine Learning service. For Instructions on how to build the Power BI dashboard for this Solution Template, refer to the section below.
How to bring in your own data
This section describes how to bring your own data to Azure, and what areas would require changes for the data you bring into this architecture.
It's unlikely that any dataset you bring would match the dataset used by the Turbofan Engine Degradation Simulation Data Set used for this solution template. Understanding your data and the requirements will be crucial in how you modify this template to work with your own data. If this is your first exposure to the Azure Machine Learning service, you can get an introduction to it by using the example in How to create your first experiment.
The following sections will discuss the sections of the template that will require modifications when a new dataset is introduced.
Azure Event Hub
The Azure Event Hub service is very generic, such that data can be posted to the hub in either CSV or JSON format. No special processing occurs in the Azure Event Hub, but it's important that you understand the data that's fed into it.
This document does not describe how to ingest your data, but you can easily send events or data to an Azure Event Hub using the Event Hub API's.
Azure Stream Analytics
The Azure Stream Analytics service is used to provide near real-time analytics by reading from data streams and outputting data to any number of sources.
For the Predictive Maintenance for Aerospace Solution Template, the Azure Stream Analytics query consists of four sub-queries, each consuming events from the Azure Event Hub service, and having outputs to four distinct locations. These outputs consist of three Power BI datasets and one Azure Storage location.
The Azure Stream Analytics query can be found by:
• Logging into the Azure portal
• Locating the stream analytics jobs that were generated when the solution was deployed (e.g., maintenancesa02asapbi and maintenancesa02asablob for the predictive maintenance solution)
• Selecting
o INPUTS to view the query input
o QUERY to view the query itself
o OUTPUTS to view the different outputs
Information about Azure Stream Analytics query construction can be found in the Stream Analytics Query Reference on MSDN.
In this solution, the queries output three datasets with near real-time analytics information about the incoming data stream to a Power BI dashboard that's provided as part of this
solution template. Because there's implicit knowledge about the incoming data format, these queries would need to be altered based on your data format.
The query in the second stream analytics job maintenancesa02asablob simply outputs all Event Hub events to Azure Storage and hence requires no alteration regardless of your data format as the full event information is streamed to storage.
Azure Data Factory
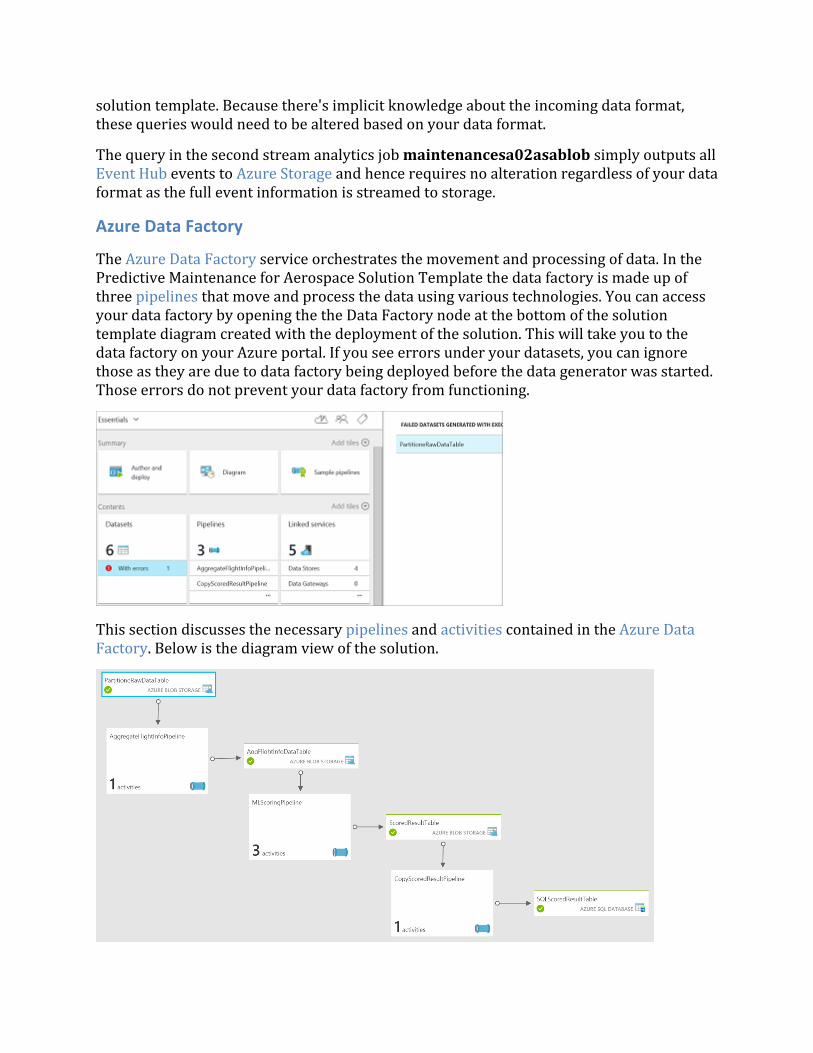
The Azure Data Factory service orchestrates the movement and processing of data. In the Predictive Maintenance for Aerospace Solution Template the data factory is made up of three pipelines that move and process the data using various technologies. You can access your data factory by opening the the Data Factory node at the bottom of the solution template diagram created with the deployment of the solution. This will take you to the data factory on your Azure portal. If you see errors under your datasets, you can ignore those as they are due to data factory being deployed before the data generator was started. Those errors do not prevent your data factory from functioning.
This section discusses the necessary pipelines and activities contained in the Azure Data Factory. Below is the diagram view of the solution.
Two of the pipelines of this factory contain Hive scripts that are used to partition and aggregate the data. When noted, the scripts will be located in the Azure Storage account created during setup. Their location will be: maintenancesascript\\script\\hive\\ (or https://[Your solution name].blob.core.windows.net/maintenancesascript).
Similar to the Azure Stream Analytics queries, the Hive scripts have implicit knowledge about the incoming data format, these queries would need to be altered based on your data format and feature engineering requirements.
AggregateFlightInfoPipeline
This pipeline contains a single activity - an HDInsightHive activity using a HDInsightLinkedService that runs a Hive script to partition the data put in Azure Storage during the Azure Stream Analytics job.
The Hive script for this partitioning task is AggregateFlightInfo.hql
MLScoringPipeline
This pipeline contains several activities and whose end result is the scored predictions from the Azure Machine Learning experiment associated with this solution template.
The activities contained in this are:
• HDInsightHive activity using an HDInsightLinkedService that runs a Hive script to perform aggregations and feature engineering necessary for the Azure Machine Learning experiment. The Hive script for this partitioning task is PrepareMLInput.hql.
• Copy activity that moves the results from the HDInsightHive activity to a single Azure Storage blob that can be access by the AzureMLBatchScoring activity.
• AzureMLBatchScoring activity that calls the Azure Machine Learning experiment which results in the results being put in a single Azure Storage blob.
CopyScoredResultPipeline
This pipeline contains a single activity - a Copy activity that moves the results of the Azure Machine Learning experiment from the MLScoringPipeline to the Azure SQL Database that was provisioned as part of the solution template installation.
Azure Machine Learning
The Azure Machine Learning experiment used for this solution template provides the Remaining Useful Life (RUL) of an aircraft engine. The experiment is specific to the data set consumed and therefore will require modification or replacement specific to the data that's brought in.
For information about how the Azure Machine Learning experiment was created, see Predictive Maintenance: Step 1 of 3, data preparation and feature engineering.
Monitor Progress
Once the Data Generator is launched, the pipeline begins to get hydrated and the different components of your solution start kicking into action following the commands issued by the Data Factory. There are two ways you can monitor the pipeline.
1. One of the Stream Analytics job writes the raw incoming data to blob storage. If you click on Blob Storage component of your solution from the screen you successfully deployed the solution and then click Open in the right panel, it will take you to the management portal. Once there, click on Blobs. In the next panel, you will see a list of Containers. Click on maintenancesadata. In the next panel, you will see the rawdata folder. Inside the rawdata folder, you will see folders with names such as hour=17, hour=18 etc. If you see these folders, it indicates that the raw data is successfully being generated on your computer and stored in blob storage. You should see csv files that should have finite sizes in MB in those folders.
2. The last step of the pipeline is to write data (e.g. predictions from machine learning) into SQL Database. You might have to wait a maximum of three hours for the data to appear in SQL Database. One way to monitor how much data is available in your SQL
Database is through azure portal.On the left panel locate SQL DATABASES and click it. Then locate your database pmaintenancedb and click on it. On the next page at the bottom, click on MANAGE
.
Here, you can click on New Query and query for the number of rows (e.g. select count(*) from PMResult ). As your database grows, the number of rows in the table should increase.
Power BI Dashboard
Overview
This section describes how to set up Power BI dashboard to visualize your real time data from Azure stream analytics (hot path), as well as batch prediction results from Azure machine learning (cold path).
Setup cold path dashboard
In the cold path data pipeline, the essential goal is to get the predictive RUL (remaining useful life) of each aircraft engine once it finishes a flight (cycle). The prediction result is updated every 3 hours for predicting the aircraft engines that have finished a flight during the past 3 hours.
Power BI connects to an Azure SQL database as its data source, where the prediction results are stored. Note: 1) Upon deploying your solution, a real prediction will show up in the database within 3 hours. The pbix file that came with the Generator download contains some seed data so that you may create the Power BI dashboard right away. 2) In this step, the prerequisite is to download and install the free software Power BI desktop.
The following steps will guide you on how to connect the pbix file to the SQL Database that was spun up at the time of solution deployment containing data (e.g.. prediction results) for visualization.
1. Get the database credentials.
You'll need database server name, database name, user name and password before moving to next steps. Here are the steps to guide you how to find them.
o Once 'Azure SQL Database' on your solution template diagram turns green, click it and then click 'Open'.
o You'll see a new browser tab/window which displays the Azure portal page. Click 'Resource groups' on the left panel.
o Select the subscription you're using for deploying the solution, and then select 'YourSolutionName_ResourceGroup'.
o In the new pop out panel, click the icon to access your database. Your database name is next to the this icon (e.g., 'pmaintenancedb'), and the database server name is listed under the Server name property and should look similar to YourSoutionName.database.windows.net.
o Your database username and password are the same as the username and password previously recorded during deployment of the solution.
2. Update the data source of the cold path report file with Power BI Desktop.
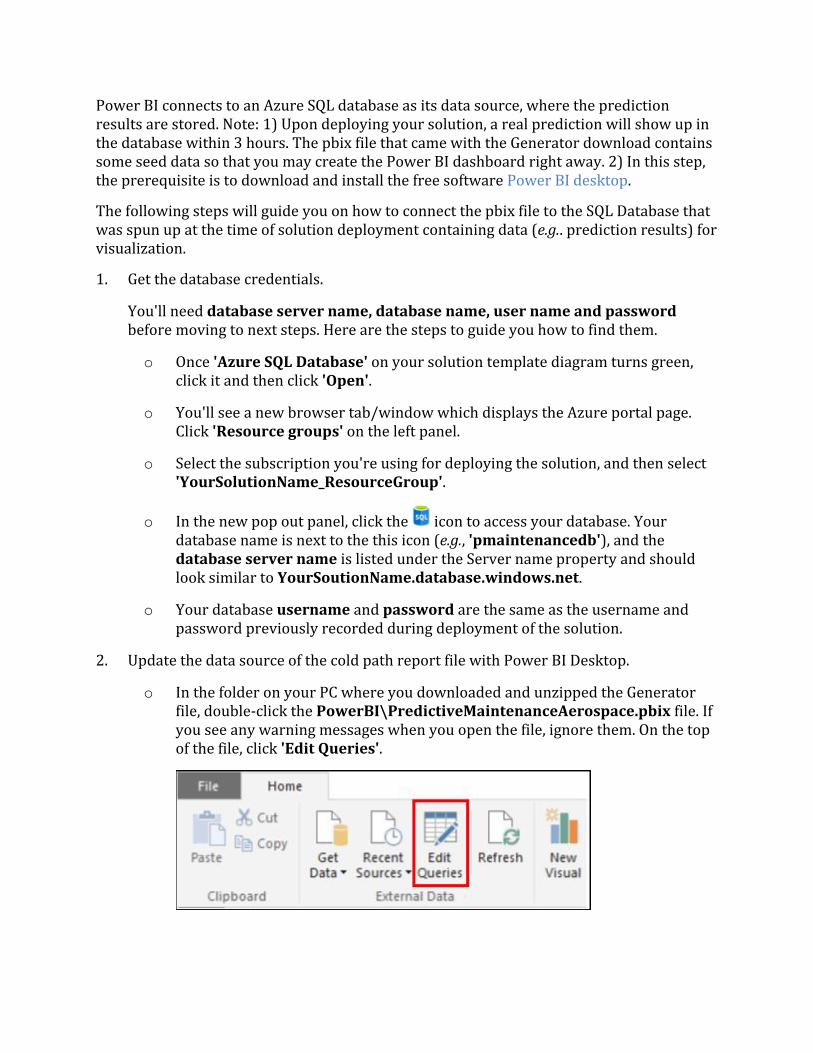
o In the folder on your PC where you downloaded and unzipped the Generator file, double-click the PowerBI\PredictiveMaintenanceAerospace.pbix file. If you see any warning messages when you open the file, ignore them. On the top of the file, click 'Edit Queries'.
o You'll see two tables, RemainingUsefulLife and PMResult. Select the first table and click next to 'Source' under 'APPLIED STEPS' on the right 'Query Settings' panel. Ignore any warning messages that appear.
o In the pop out window, replace 'Server' and 'Database' with your own server and database names, and then click 'OK'. For server name, make sure you specify the port 1433 (YourSoutionName.database.windows.net, 1433). Leave the Database field as pmaintenancedb. Ignore the warning messages that appear on the screen.
o In the next pop out window, you'll see two options on the left pane (Windows and Database). Click 'Database', fill in your 'Username' and 'Password' (this is the username and password you entered when you first deployed the solution and created an Azure SQL database). In Select which level to apply these settings to, check database level option. Then click 'Connect'.
o Click on the second table PMResult then click next to 'Source' under 'APPLIED STEPS' on the right 'Query Settings' panel, and update the server and database names as in the above steps and click OK.
o Once you're guided back to the previous page, close the window. A message will pop out - click Apply. Lastly, click the Save button to save the changes. Your Power BI file has now established connection to the server. If your visualizations are empty, make sure you clear the selections on the visualizations to visualize all the data by clicking the eraser icon on the upper right corner of the legends. Use the refresh button to reflect new data on the visualizations. Initially, you will only see the seed data on your visualizations as the data factory is scheduled to refresh every 3 hours. After 3 hours, you will see new predictions reflected in your visualizations when you refresh the data.
3. (Optional) Publish the cold path dashboard to Power BI online. Note that this step needs a Power BI account (or Office 365 account).
o Click 'Publish' and few seconds later a window appears displaying "Publishing to Power BI Success!" with a green check mark. Click the link below "Open PredictiveMaintenanceAerospace.pbix in Power BI". To find detailed instructions, see Publish from Power BI Desktop.
o To create a new dashboard: click the + sign next to the Dashboards section on the left pane. Enter the name "Predictive Maintenance Demo" for this new dashboard.
o Once you open the report, click to pin all the visualizations to your dashboard. To find detailed instructions, see Pin a tile to a Power BI dashboard from a report. Go to the dashboard page and adjust the size and location of your visualizations and edit their titles. To find detailed instructions on how to edit your tiles, see Edit a tile -- resize, move, rename, pin, delete, add hyperlink.
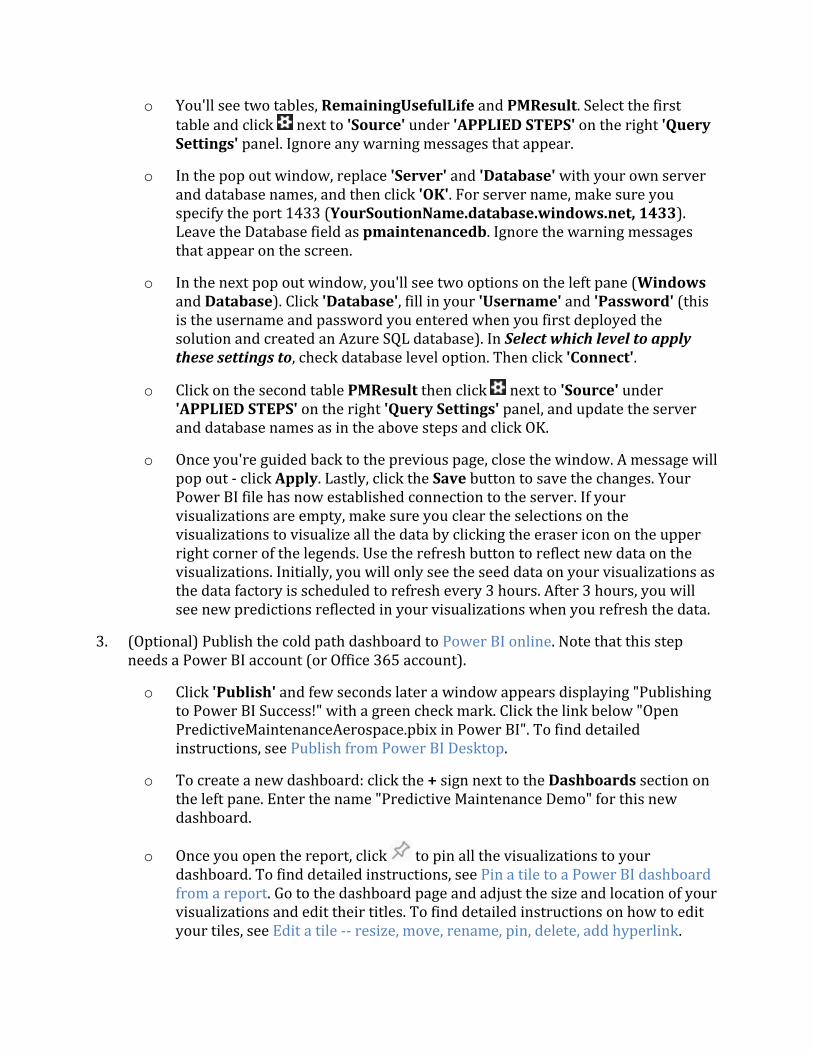
Here is an example dashboard with some cold path visualizations pinned to it. Depending on how long you run your data generator, your numbers on the visualizations may be different.
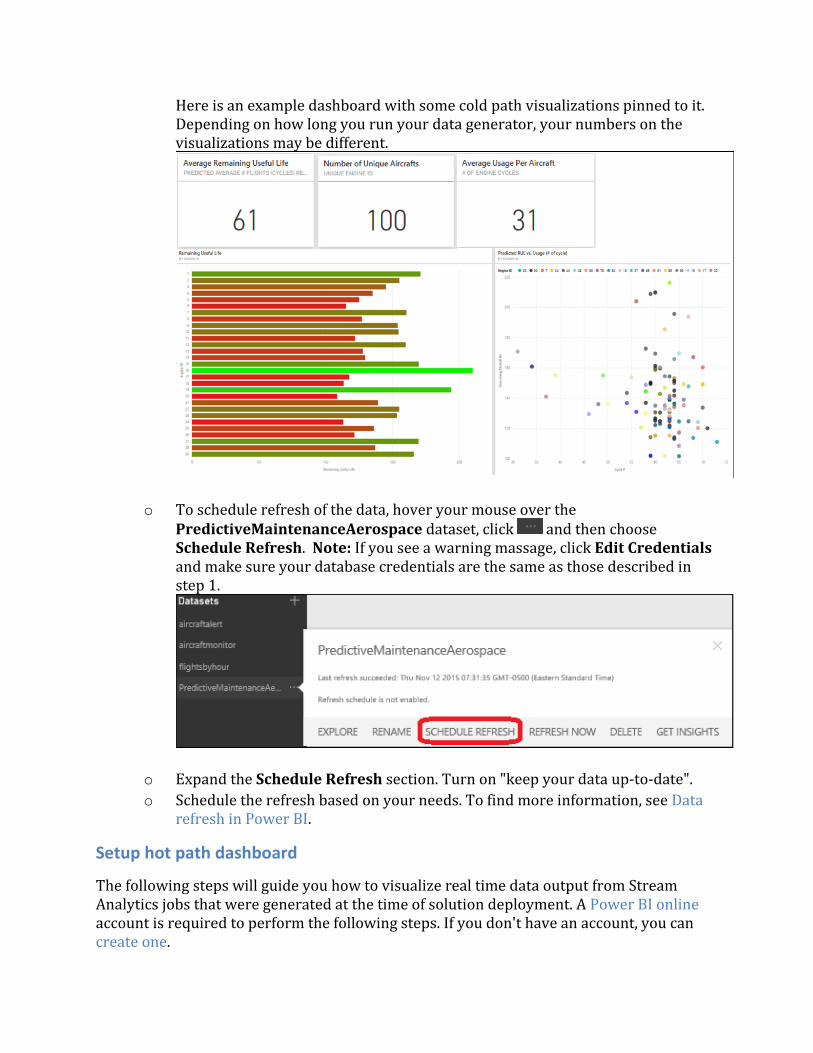
o To schedule refresh of the data, hover your mouse over the PredictiveMaintenanceAerospace dataset, click and then choose Schedule Refresh. Note: If you see a warning massage, click Edit Credentials and make sure your database credentials are the same as those described in step 1.
o Expand the Schedule Refresh section. Turn on "keep your data up-to-date".
o Schedule the refresh based on your needs. To find more information, see Data refresh in Power BI.
Setup hot path dashboard
The following steps will guide you how to visualize real time data output from Stream Analytics jobs that were generated at the time of solution deployment. A Power BI online account is required to perform the following steps. If you don't have an account, you can create one.
1. Add Power BI output in Azure Stream Analytics (ASA).
o You will need to follow the instructions in Azure Stream Analytics & Power BI: A real-time analytics dashboard for real-time visibility of streaming data to set up the output of your Azure Stream Analytics job as your Power BI dashboard.
o The ASA query has three outputs which are aircraftmonitor, aircraftalert, and flightsbyhour. You can view the query by clicking on query tab. Corresponding to each of these tables, you will need to add an output to ASA. When you add the first output (e.g. aircraftmonitor) make sure the Output Alias, Dataset Name and Table Name are the same (aircraftmonitor). Repeat the steps to add outputs for aircraftalert, and flightsbyhour. Once you have added all three output tables and started the ASA job, you should get a confirmation message (e.g., "Starting stream analytics job maintenancesa02asapbi succeeded").
2. Log in to Power BI online
o On the left panel Datasets section in My Workspace, the DATASET names aircraftmonitor, aircraftalert, and flightsbyhour should appear.This is the streaming data you pushed from Azure Stream Analytics in the previous step.The dataset flightsbyhour may not show up at the same time as the other two datasets due to the nature of the SQL query behind it. However, it should show up after an hour.
o Make sure the Visualizations pane is open and is shown on the right side of the screen.
3. Once you have the data flowing into Power BI, you can start visualizing the streaming data. Below is an example dashboard with some hot path visualizations pinned to it. You can create other dashboard tiles based on appropriate datasets. Depending on how long you run your data generator, your numbers on the visualizations may be different.
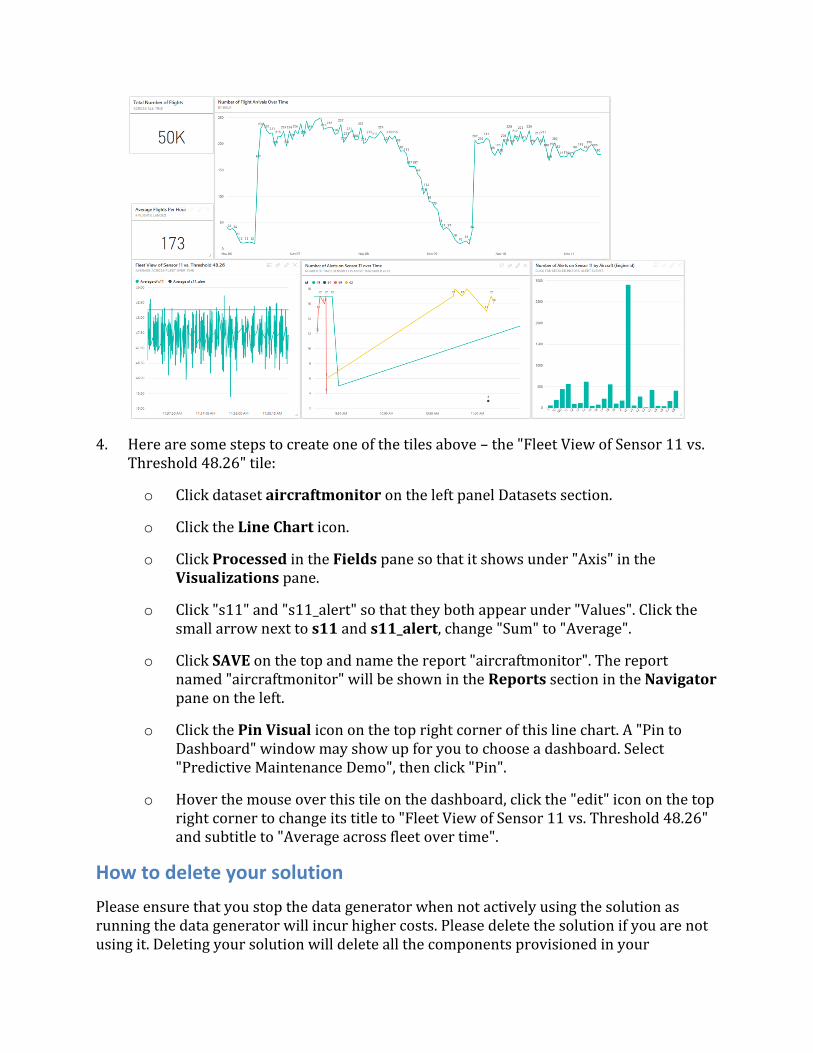
4. Here are some steps to create one of the tiles above – the "Fleet View of Sensor 11 vs. Threshold 48.26" tile:
o Click dataset aircraftmonitor on the left panel Datasets section.
o Click the Line Chart icon.
o Click Processed in the Fields pane so that it shows under "Axis" in the Visualizations pane.
o Click "s11" and "s11_alert" so that they both appear under "Values". Click the small arrow next to s11 and s11_alert, change "Sum" to "Average".
o Click SAVE on the top and name the report "aircraftmonitor". The report named "aircraftmonitor" will be shown in the Reports section in the Navigator pane on the left.
o Click the Pin Visual icon on the top right corner of this line chart. A "Pin to Dashboard" window may show up for you to choose a dashboard. Select "Predictive Maintenance Demo", then click "Pin".
o Hover the mouse over this tile on the dashboard, click the "edit" icon on the top right corner to change its title to "Fleet View of Sensor 11 vs. Threshold 48.26" and subtitle to "Average across fleet over time".
How to delete your solution
Please ensure that you stop the data generator when not actively using the solution as running the data generator will incur higher costs. Please delete the solution if you are not using it. Deleting your solution will delete all the components provisioned in your
subscription when you deployed the solution. To delete the solution click on your solution name in the left panel of the solution template and click on delete.
Cost estimation tools
The following two tools are available to help you better understand the total costs involved in running the Predictive Maintenance for Aerospace Solution Template in your subscription:
• Microsoft Azure Cost Estimator Tool (online)
• Microsoft Azure Cost Estimator Tool (desktop)