Embed Size (px)
Citation preview
TechnicalAnalysisof
GapsIdentifying
ProfitableGapsforTrading

JulieR.DahlquistRichardJ.Bauer,Jr.

VicePresident,Publisher:TimMooreAssociatePublisherandDirectorofMarketing:AmyNeidlingerExecutiveEditor:JimBoydEditorialAssistant:PamelaBolandOperationsSpecialist:JodiKemperAssistantMarketingManager:MeganGraueCoverDesigner:AlanClements

ManagingEditor:KristyHartSeniorProjectEditor:LoriLyonsCopyEditor:ApostropheEditingServicesProofreader:KathyRuizIndexer:LisaStumpfCompositor:NonieRatcliffManufacturingBuyer:DanUhrig
©2012byJulieR.Dahlquist/RichardJ.Bauer,Jr.
PearsonEducation,Inc.PublishingasFTPressUpperSaddleRiver,NewJersey07458
Thisbookissoldwiththeunderstandingthatneithertheauthornorthepublisherisengagedinrenderinglegal,accounting,orotherprofessionalservicesoradvicebypublishingthisbook.Eachindividualsituationis
unique.Thus,iflegalorfinancialadviceorotherexpertassistanceisrequiredinaspecificsituation,theservicesofacompetentprofessionalshouldbesoughttoensurethatthesituationhasbeenevaluatedcarefullyandappropriately.Theauthorandthepublisherdisclaimanyliability,loss,orriskresultingdirectlyorindirectly,fromtheuseor

applicationofanyofthecontentsofthisbook.FTPressoffersexcellent
discountsonthisbookwhenorderedinquantityforbulkpurchasesorspecialsales.Formoreinformation,pleasecontactU.S.CorporateandGovernmentSales,1-800-382-3419,[email protected].,pleasecontactInternational
StockchartscreatedwithTradeStation.©TradeStationTechnologies,Inc.Allrightsreserved.
Companyandproductnamesmentionedhereinarethetrademarksorregisteredtrademarksoftheirrespectiveowners.
Allrightsreserved.Nopart
ofthisbookmaybereproduced,inanyformorbyanymeans,withoutpermissioninwritingfromthepublisher.
PrintedintheUnitedStatesofAmerica
FirstPrintingJune2012
ISBN-10:0-13-290043-2ISBN-13:978-0-13-290043-0
PearsonEducationLTD.PearsonEducationAustralia

PTY,Limited.PearsonEducationSingapore,Pte.Ltd.PearsonEducationAsia,Ltd.PearsonEducationCanada,Ltd.PearsonEducacióndeMexico,S.A.deC.V.PearsonEducation—JapanPearsonEducationMalaysia,Pte.Ltd.
LibraryofCongressCataloging-in-Publication
DataDahlquist,JulieR.,1962-Technicalanalysisofgaps:identifyingprofitablegapsfortrading/JulieR.Dahlquist,RichardJ.Bauer,Jr.p.cm.ISBN978-0-13-290043-0(hbk.:alk.paper)1.Stocks—Charts,diagrams,etc.2.Technicalanalysis(Investmentanalysis)I.
Bauer,RichardJ.,1950-II.Title.HG4638.D342012332.63’2042—dc232012010828

ToKatherineandSepp
Contents
AbouttheAuthors
Chapter1:WhatAreGaps?
Chapter2:WindowsonCandlestickCharts
Chapter3:TheOccurrenceofGaps
Chapter4:HowtoMeasureReturns
Chapter5:GapsandPreviousPriceMovement
Chapter6:GapsandVolume
Chapter7:GapsandMovingAverages
Chapter8:GapsandtheMarket
Chapter9:ClosingtheGap

Chapter10:PuttingItAllTogether
Index
Acknowledgments
We first started looking atgaps because they provideuseful illustrations whenteaching our students how toread stock charts. Studentshear a news report that theirfavorite company justreported earnings, that acompany is being sued, orthat a well-known company,suchasApple,islaunchinga
new product and ask howthese events will affect theprice of the stock of thecompany.These news eventsoften trigger sizeable pricemoves, frequently on a gap.Wecanintroducetheconceptof a gap easily and quicklyandthenusetheconversationas a jumping-off point forbroader discussion of thetoolsoftechnicalanalysis.Gaps repeatedly come up
during small talk whenpeoplefindoutthatwehaveabackground in technicalanalysis. Even individualswho know little about thestock market seem to haveheard the adage “the gap isalways filled.” The twotechnical analysis terms thatpeopleseemtolatchontoare“head and shoulders” and“gaps.” After engaging in anumber of theseconversations, we thought it
would be interesting topursue this topic a bit more.Gaps seem to have capturedthe attention of the earliesttechnical analysts, but wefound surprisingly littlesystematic study of gaps.Much of the recent work inthe area of technical analysishas been based on complexmathematical models. Wethoughtitwouldbeafunandinteresting endeavor toinvestigateoneofthesimple,

basic ideas of technicalanalysisinmoredepth.Thus,a couple of years ago webeganourinquiry.In the beginning, we
thoughtwewouldengageinasimple study that wouldprovide some interestingstories regarding gaps to usein our classrooms. As westarted looking at gaps, ourappreciationfortheiruseasatool of technical analysis
grewandourinquirygrew.InMay 2011,wewere honoredas recipients of the MarketTechnicians Association’sCharles H. Dow Award inTechnical Analysis for ourpaper, “Analyzing Gaps forProfitable TradingStrategies.” We realized thatin our paper we had onlybeen able to scratch thesurface of gaps. Our editor,Jim Boyd, suggested wecontinue our investigation in

the form of a book—theresult of which you areholdinginyourhands.We are indebted to a
numberofpeoplewhohelpeduslearnmoreaboutgapsandwho helped put thisknowledge together in theform of this book. First, weare indebted to CharlieKirkpatrickforallthesupportandassistancehehasgivenusin learning about technical

analysis over the years. Hisknowledge and patience areendless. Ellie Kirkpatrick,Charlie’swife, is thegreatestcheerleader anyone couldhave in their corner. Shecontinues to motivate andinspire us. We thank bothCharlie and Ellie for theendlesslistofthingsthattheyhave done for us and ourchildren.We would like to thank

Fred Meissner and HankPruden for their support andencouragement. They areboth stellar examples of thefriendliness and warmthexhibited by many in thetechnical analysiscommunity. They, too, havebeen especially kind to ourchildren. Thanks to all thosewhoworkintheMTAoffice,especially Tom Silveri, TimLicitra, and Shane Skwarek.This project has benefited

from conversations withmembersoftheMTAthroughelectronic discussion groups,webinars, and meetingsacross the world—fromHouston toPrague.Aspecialthanks to Robert Colby andRalph Acampora foransweringquestionsalongtheway.Thanks,also,toNorgateInvestorServicesforgrantingus permission to publish ourresults,whichwere based ontheir stock price data

marketedasPremiumData.We are grateful to the
Pearson staff, especiallyexecutive editor Jim Boyd,managing editor Kristy Hart,andseniorprojecteditorLoriLyonsfortheirhardworkanddedication in bringing thisprojecttofruition.We have dedicated this
book to our children,Katherine and Sepp. Theychallenge, inspire, and

entertain us in innumerableways. It is bittersweetwatching our children growup. We miss their youngerversions, but our relationshipwith them both deepens andbecomes more meaningfulandspecialwitheachpassingyear. We feel richly blessedwith thehonorofbeing theirparents.—JulieandRichard

Being able to undertake aproject like this requires theencouragement and supportof family, teachers, friends,andcolleaguesoveranumberofyears.Thanks tomymomforencouragingmetopursuestudies in economics andfinance, although she claimsnot to understand anythingaboutitherself.Thankstomysisters, Carrie and Katie, forbeingtheretolaughaboutoldfamily stories whenever I

need a break from work.Good luck to my nephew,John,asheembarksuponhiscollegecareer!—Julie
I want to thank familymembers for their support. Ithankmyfather,DickBauer,for his continued love andencouragement. He has alsogivenme an appreciation fordedication, perseverance, and

striving forexcellence. I alsothankAmyandMaryfortheirongoing love and support. Ilook forward to seeing thepaths taken by Jake, Sophia,Joshua,Grant,andLucy;theyhave incredible parents.Thanks to Don, Ruth, andBrenda for all of theirencouragingwords.—Richard

AbouttheAuthors
JulieR.Dahlquist,Ph.D.,CMT is a senior lecturer,DepartmentofFinance,attheUniversity of Texas at SanAntonioCollegeofBusiness.She is the recipient of the2011CharlesH.DowAwardfor excellence and creativityin technical analysis. She isthe coauthor (with CharlesKirkpatrick) of Technical
Analysis: The CompleteResource for FinancialMarket Technicians andcoauthor (with RichardBauer) of Technical MarketIndicators: Analysis andPerformance. Her researchhas appeared in a number ofpublications, includingFinancial Analysts Journal,Journal of TechnicalAnalysis, Active Trader,Working Money, ManagerialFinance, Financial Practices

and Education, and theJournal of FinancialEducation. She serves on theboard of the MarketTechnicians AssociationEducational Foundation andis a frequent presenter atnational and internationalconferences. She earned herB.B.A. and Ph.D. ineconomicsfromUniversityofLouisiana at Monroe andTexas A&M, respectively,and her M.A. in Theology

fromSt.Mary’sUniversity.Richard J. Bauer, Jr.,
Ph.D., CFA, CMT isProfessor of Finance at theBill Greehey School ofBusiness at St. Mary’sUniversity in San Antonio,Texas.His degrees include aB.S. in Physics, M.S. inPhysics, M.S. in Economics,andaPh.D.inFinance.Heisthe author of GeneticAlgorithms and Investment

Strategies and TechnicalMarket Indicators (with J.Dahlquist),bothpublishedbyJohn Wiley and Sons. He isthe recipient of the 2011Charles H. Dow Award forexcellence and creativity intechnical analysis. Hisresearch has appeared in anumber of publications,including Financial AnalystsJournal, Journal of BusinessResearch, ManagerialFinance, and Korean

Financial ManagementJournal. He became a CFAcharterholder in 1990 and aCMT charterholder in 2010.He is a past president of theCFASocietyofSanAntonio.
Chapter1.WhatAreGaps?
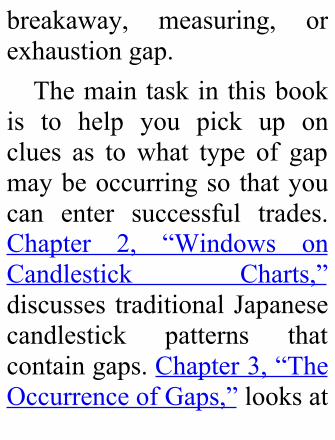
Gaps have attracted theattention of markettechnicians since the earliestdaysofstockcharting.Agapoccurs when a security’sprice jumps between twotradingperiods,skippingovercertainprices.Agapcreatesahole, or a void, on a pricechart.
Because technical analysishas traditionally been anextremelyvisualpractice,itiseasy tounderstandwhyearlytechnicians noticed gaps.Gaps are visuallyconspicuousonapricechart.Consider, for example, thestock chart for HuntingtonBancshares (HBAN) inFigure1.1.Aquickglanceatthepriceactivityrevealsfourgaps.
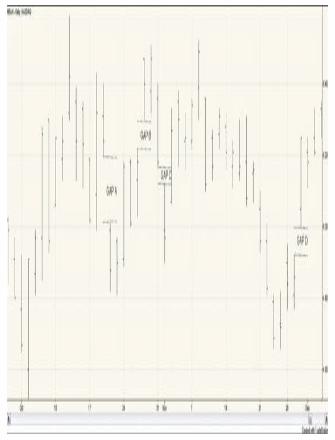
CreatedwithTradeStationFigure1.1.Gapsonstock
chartforHBANSeptember29–December2,2011In Figure 1.1, Gap A and
Gap C are known as a gapdown. A gap down occurswhenoneday’shighislowerthan the previous day’s low.InthefigureyoucanseethatthelowestpriceforHBANonSeptember 19was$5.20.On
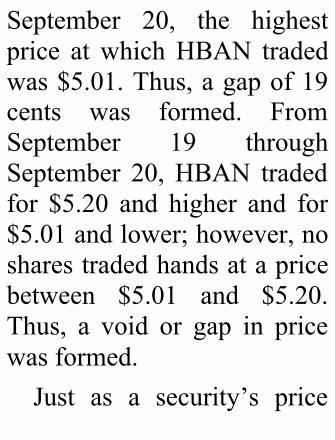
September 20, the highestprice atwhichHBAN tradedwas$5.01.Thus,agapof19cents was formed. FromSeptember 19 throughSeptember 20,HBAN tradedfor $5.20 and higher and for$5.01andlower;however,nosharestradedhandsatapricebetween $5.01 and $5.20.Thus, a void or gap in pricewasformed.Just as a security’s price
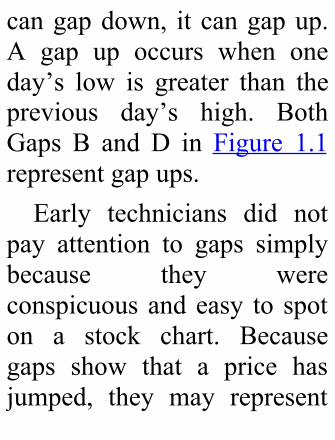
cangapdown, it cangapup.A gap up occurs when oneday’s low is greater than theprevious day’s high. BothGaps B and D in Figure 1.1representgapups.Early technicians did not
pay attention to gaps simplybecause they wereconspicuousandeasy to spoton a stock chart. Becausegaps show that a price hasjumped, they may represent
some significant change inwhat is happening with thestock and present a tradingopportunity.A technical analyst
watchesstockpricebehavior,searching for signs of anychangeinbehavior.Ifastockis in a strong uptrend, theanalyst watches for any signthat the trend has ended.When a stock is in aconsolidation period, the
analyst watches for any signof a change in behavior thatwould indicate a breakouteither to the upside or to thedownside. Spotting thesechanges leads to profitabletrading,allowingthetradertojump on a trend, ride thetrend,andexitoncethetrendhas ended. Gaps can be oneindication of an impendingchangeintrend.Given the persistence of
superstitions, such as “a gapmust be closed,” surprisinglylittle study has beenundertaken to analyze theeffectivenessofusinggapsintrading.Thisbookprovidesacomprehensive study of gapsin an attempt to isolate gapswhich present profitabletradingstrategies.
TypesofGapsGap types differ based on
the context in which theyoccur. Some price gaps aremeaningful,andotherscanbedisregarded.
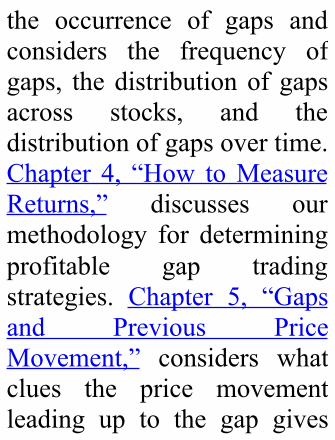
Breakaway(orBreakout)GapsA breakaway gap is one
that occurs at the beginningofatrend(seeFigure1.2).InNovember 2006, AT&T (T)was in a trading range. OnNovember 29, the stockgapped up and an uptrend
began. Because profits aremade by jumping on andriding a trend, breakawaygaps are considered themostprofitable gaps for tradingpurposes.
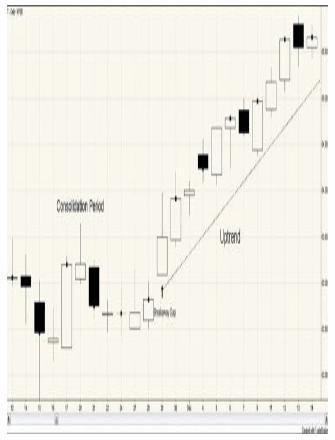
CreatedwithTradeStationFigure1.2.Breakaway
gaponstockchartforT,November13–December14,
2006
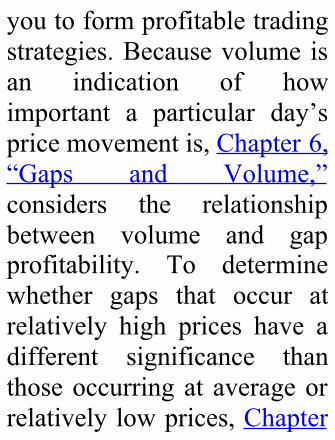
Runaway(orMeasuring)GapsA gap that occurs along a
trendlineiscalledarunawaygap or a measuring gap.Often,arunawaygapappearsinastrongtrendthathasfew
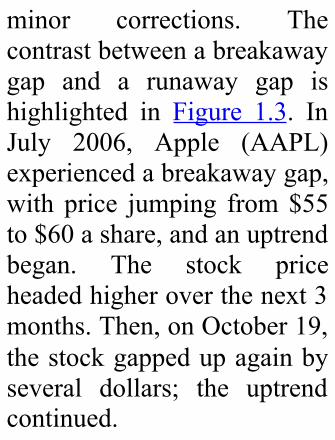
minor corrections. Thecontrastbetweenabreakawaygap and a runaway gap ishighlighted in Figure 1.3. InJuly 2006, Apple (AAPL)experiencedabreakawaygap,with price jumping from$55to$60ashare,andanuptrendbegan. The stock priceheadedhigheroverthenext3months.Then,onOctober19,thestockgappedupagainbyseveral dollars; the uptrendcontinued.
CreatedwithTradeStationFigure1.3.RunawaygaponstockchartforAAPL,June23,2006–January24,
2007Runaway gaps are often
referredtoasmeasuringgapsbecause of their tendency tooccurataboutthemiddleofapricerun.Indeed,thisiswhatAAPL did in Figure 1.3.Thus, the distance from the
beginning of the trend to therunawaygapcanbeprojectedabove the gap to obtain atarget price. Bulkowski(2010) finds that an upwardrunaway gap occurs, onaverage, 43%of the distancefrom the beginning of thetrend to the eventual peak,and a downward gap occurs,on average, at 57% of thedistance.
ExhaustionGaps
As its name sounds, anexhaustiongapoccursat theendofa trend. In thecaseofan uptrend, price makes onelast attempt to move higheron a last gasp of breath;however, the trend isexhausted, and the higherpricecannotbesustained.Forexample, the gap up onJanuary 9, 2007 (refer toFigure1.3)occursasAAPL’spowerful uptrend is comingtoanend. It iseasy todetect
an exhaustion gap inhindsight; however,distinguishing an exhaustiongap from a runaway gap atthe time of the gap can bedifficult because the twosharemanycharacteristics.Popular wisdom suggests
that trading exhaustion gapscan be dangerous. Anexhaustion gap signals theendofa trend.However,oneoftwothingscanhappen;the
trend may reverseimmediately, or price mayremain in a congestion areaforsometime.Anexhaustiongap signals a trader to exit aposition but does notnecessarily signal thebeginning of a new trend intheoppositeposition.
OtherGapsIn addition to breakaway,
runaway, and exhaustiongaps, technical analysts
identify a few types of gapsthat are generally of noconsequence for a trader.Common gaps occur inilliquid trading vehicles, aresmall in relation to the priceof the vehicle, or appear inshort-term trading data. Anex-dividend gap may occurin a stock price when adividendispaidandthestockprice is adjusted thefollowing day. Ex-dividendgapsareinsignificant,andthe
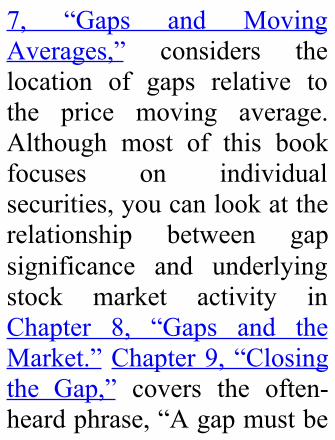
tradermust be careful not tomisinterpret them.Suspension gaps can occurin 24-hour futures tradingwhen one market closes andanother opens, especially ifone market is electronic andtheotherisopenoutcry;thesearealsoinsignificant.An opening gap occurs
when the opening price forthe day is outside theprevious day’s range. After
the opening, price mightcontinue to move in thedirection of the gap, formingagapfortheday.Orthepricemight retrace, closing thegap. Figure 1.4 shows threeopeninggapsforMcDonald’s(MCD). See how, onDecember2,MCDopenedata price higher than theDecember 1 price range.However, the price movedlower during the day, fillingthe gap, resulting in an
overlap for the December 1andDecember2bars.
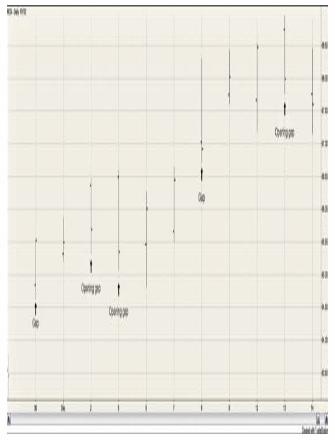
CreatedwithTradeStationFigure1.4.Openinggap
onstockchartforMCD,November29–December14,
2011Of course, any gap begins
as an opening gap. OnNovember 30 and December8,MCD had an opening gapto the upside, and the pricenever retraced enough onthose days to fill the gap.
Throughout this book, whenweusetheterm“gap”wearereferring to instances inwhich the gap is not filledwithin the trading sessionunless we directly specifythat we are discussingopeninggaps.Some traders watch for
trading opportunities withopening gaps. Generalwisdomsuggeststhatifagapis not filled within the first
half hour, the odds of thetrend continuing in thedirectionof thegap increase.Figure1.4showedanopeninggap on December 2 and onDecember5forMCD.Figure1.5 shows howquickly theseopening gapswere closed byconsidering intradaydataandusing 5-minute bars. OnDecember2,forexample,theopeningwasfilledonthefifth5-minute bar, or within 25minutes of the open. On
December5, theopeninggapwas filled within the first 5minutesoftrading.
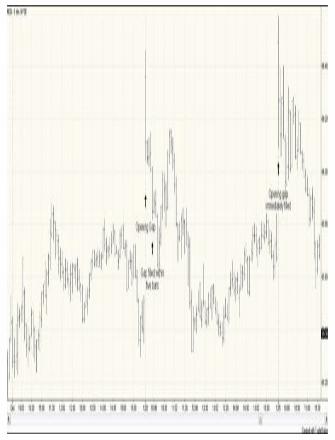
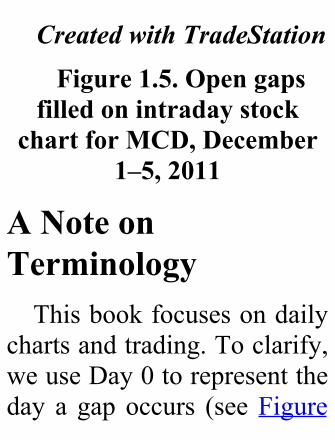
CreatedwithTradeStationFigure1.5.Opengaps
filledonintradaystockchartforMCD,December
1–5,2011
ANoteonTerminologyThisbookfocusesondaily
chartsandtrading.Toclarify,weuseDay0torepresenttheday a gap occurs (seeFigure
1.6). The day before the gapis Day –1 and the stock’shigh on Day –1 is thebeginning of the gap.On thenextday (Day0), the stock’slowexceeds thehighonDay–1,formingthegap.WerefertothedayofthegapasDay0becausewedonotknowuntilthe close of trading that daywhether we simply have anopening gap or if we have agapthatremainsunfilled.
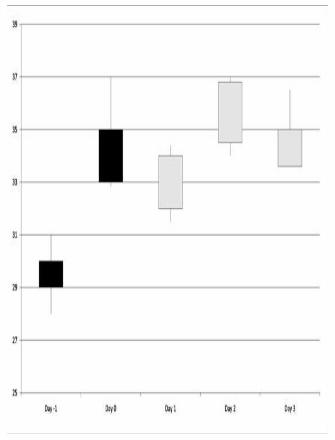
Figure1.6.GapoccursonDay0
If we are to make tradingdecisions based upon theoccurrence of a gap, thesoonest wewould be able toenterapositionistheopenonDay1.Thus,whenwereporta 1-day return, we base thereturn calculation from theopenonDay1tothecloseonDay 1. To calculate longerreturns, the return is
calculated from the open atDay1tothecloseonthedayofthereturnlength;therefore,a3-dayreturniscalculatedasbuying at the open ofDay 1and selling at the close ofDay3.
HowtoUseGapsinTradingHowmightatrader,seeing
a gap, react to theinformation? If the trader
thinks that the gap is abreakaway gap, he wouldwant to trade in thedirectionof thegap. Inotherwords, ifabreakawayupgapoccurred,he would assume an uptrendis beginning and take a longposition. If a breakawaydowngapoccurred,hewouldassume a downtrend isbeginning and take a shortposition.Hewouldalsowanttotradeinthedirectionofthegap, if the stock were
trending and a gap occurredthat he thought was ameasuring gap. Throughoutthis bookwe refer to tradinginthedirectionofthegapasacontinuationstrategyinthatthe trader is expecting theprice to continue in thedirectionofthegap.If a trader sees a gap she
thinks drives the price up somuch that there is little roomfor the price to push higher,
she would want to tradeoppositeofthegap.Suppose,forexample,apharmaceuticalcompany announces that ithas received FDA approvalfor a new drug. Upon thereleaseofthisgoodnews,thestock gaps up. If the traderthinksthatthemarketisover-reacting to this good news,she would want to short thestock.Likewise, ifshe thinksthat market players havedriventhepricedowntoolow
on a gap, shewouldwant totake a long position.Remembertheoldadagethata gap must be filled. Thenotion that a gap is alwaysfilledisbasedontheideathatthemarketplayersdonotliketo see a hole or a void in aprice movement and willworktofillthatgap.Wereferto trading in the oppositedirection of a gap as areversalstrategy.
Traditional technicalanalysistheorywouldtellyouto trade breakaway andmeasuring gaps using acontinuation strategy. Youmight want to trade anexhaustion gap with areversal strategy; however, amajor problem is thattraditional theory has notprovided a sound way toclassify a gap as it occurs. Itis only in hindsight that youcan tell if a gap was a
breakaway, measuring, orexhaustiongap.Themaintaskinthisbook
is to help you pick up onclues as to what type of gapmaybeoccurringsothatyoucan enter successful trades.Chapter 2, “Windows onCandlestick Charts,”discusses traditionalJapanesecandlestick patterns thatcontaingaps.Chapter3,“TheOccurrenceofGaps,”looksat
the occurrence of gaps andconsiders the frequency ofgaps, thedistributionof gapsacross stocks, and thedistributionofgapsovertime.Chapter 4, “How toMeasureReturns,” discusses ourmethodology for determiningprofitable gap tradingstrategies. Chapter 5, “Gapsand Previous PriceMovement,” considers whatclues the price movementleading up to the gap gives
youtoformprofitabletradingstrategies.Becausevolume isan indication of howimportant a particular day’spricemovementis,Chapter6,“Gaps and Volume,”considers the relationshipbetween volume and gapprofitability. To determinewhether gaps that occur atrelatively high prices have adifferent significance thanthoseoccurringat averageorrelativelylowprices,Chapter
7, “Gaps and MovingAverages,” considers thelocation of gaps relative tothe price moving average.Although most of this bookfocuses on individualsecurities,youcanlookattherelationship between gapsignificance and underlyingstock market activity inChapter 8, “Gaps and theMarket.”Chapter9,“Closingthe Gap,” covers the often-heardphrase,“Agapmustbe
closed.” Last, Chapter 10,“Putting It All Together,”provides an overall summaryof how gaps can be used aspart of an effective tradingandinvestmentstrategy.
EndnotesBulkowski, Thomas N.
“Bulkowski’s Free PatternResearch,”http://www.thepatternsite.com2010.
Chapter2.WindowsonCandlestickCharts
Nowthatwehavecoveredthe basics of what gaps are,let’s look at how gaps areviewed on Japanesecandlestick charts. Japanesecandlestick charts displaythe same information (open,high, low,andclose) thatbarcharts display but in a more
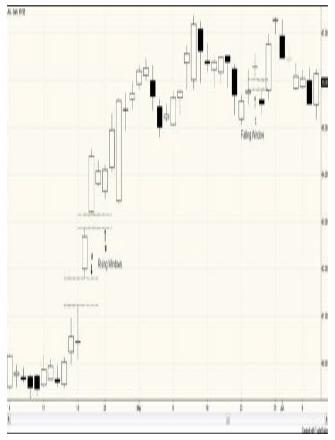
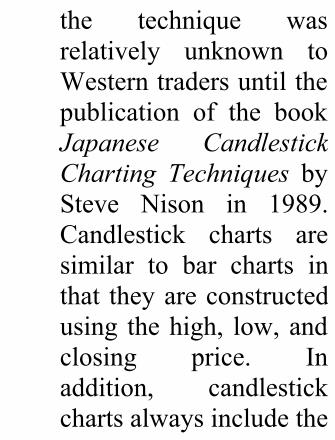
striking way visually. Also,special vocabulary oftenaccompanies the candlestickcharts. For example, inJapanesecandlestickcharts,agap is referred to as awindow.The candlestick chart of
Johnson & Johnson (JNJ) inFigure 2.1 shows gaps, orwindows,atpointsA,B,andC. For a window to occur,theremustnotbeanyoverlap
between two adjacentcandles. For a window tooccur, space must existbetween the shadows ofadjacent candles; because ofthis space, windows are alsoknownasdisjointedcandles.InFigure2.1, the realbodiesof the candles on April 14andApril 15 do not overlap,but the shadows overlap;thus, a window does notoccur.
CreatedwithTradeStationFigure2.1.Risingand
fallingwindows,candlestickchartforJNJ,April4–June
8,2011Agapupisreferredtoasa
rising window. Windows AandBare examplesof risingwindows(refertoFigure2.1).In his book, JapaneseCandlestick ChartingTechniques,1 Steve Nison
states that Japanesetechnicians viewwindows ascontinuation signals and sayto “go in thedirectionof thewindow.” Thus, risingwindows are consideredbullish. When, a windowoccurs with a large whitecandle(refertoWindowBinFigure 2.1), it is a runningwindow because the marketis said to be running in thedirectionofthewindow.
A down gap, such as thegap that occurs atPointC inFigure 2.1, is known as afalling window. Fallingwindows are consideredbearish.
CandlestickChartingBasics
Although candlestickcharts have beenwidelyused in the Far East asearly as the mid-1600s,
the technique wasrelatively unknown toWesterntradersuntilthepublication of the bookJapanese CandlestickCharting Techniques bySteve Nison in 1989.Candlestick charts aresimilar to bar charts inthat theyareconstructedusing thehigh, low,andclosing price. Inaddition, candlestickchartsalwaysincludethe
opening price,something not alwayspresentonabarchart.Arectangular box iscreated using theopening and closingprices, forming the realbodyofthecandle.Iftheclose exceeds the open,the real body is “white”or“open.”Ifthecloseislower than theopen, therealbodyis“closed”andshaded black. Thin
vertical bars, known asshadows, represent thehigh and low for thesession.
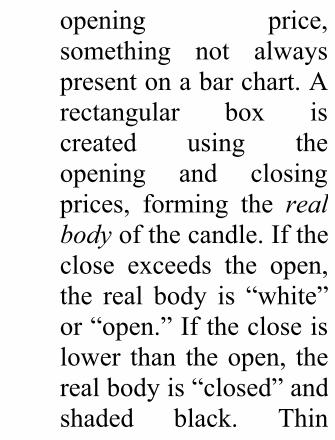
Closing the window issimply fillingagap.Refer toFigure 2.1 to see that thefalling Window C is closedthe following day. For awindowtobeclosed,therealbody of a candle must closebeyond the window,2 as
shown in Figure 2.2 forCROX. A falling windowoccurs on March 15. Theupper shadow of the March28 candle rises above thewindow; however, the realbody still lies within thewindow. The window is notcloseduntil2dayslaterwhentherealbodyoftheMarch30candlestickclosesbeyondthegap.
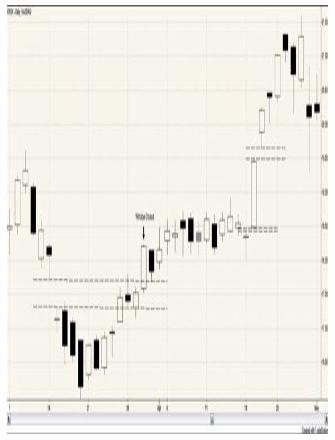
CreatedwithTradeStationFigure2.2.Closingthe
window,candlestickchartforCROX,March7—May
1,2011Some Japanese traders
claim that ifawindow isnotclosed within three sessions,it is confirmation that themarket should continue tomove in the direction of thewindow. These traders see
these unfilledwindows as anindicationthatthemarkethasthe power to continue itstrendfor13moresessions.Inhis book BeyondCandlesticks,3 Nisonquestions the preciseness ofthis claim but supports thenotion of waiting threesessionsforconfirmationofapricetrend(p.100).
WindowsasSupport
andResistanceIncandlestickcharts,rising
windows become supportzones, and falling windowsbecome resistance zones.Thus, you hear Japanesecandlestick chart analystsstating that “Corrections stopat the window.” Look, forexample, at the September 1rising window in Figure 2.3(ATVI). The price initiallymoveshigherinthedirection
of the rising window.However, on September 16,thepricefallsintothesupportzone. The price approachesbut does not close below the10.75 August 31 high.Because the window is notclosed, traders can use thiscorrection as a buyingopportunity.
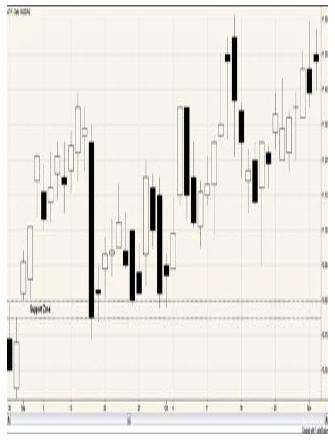
CreatedwithTradeStationFigure2.3.Agapas
support,candlestickchartforATVI,August30–November2,2010
Remember that a windowcanbelargeorsmall.Aone-point risingwindow is still awindow and serves as asupport zone. According toNison, the size of a windowdoes not impact the
importance of the window’sroleasasupportorresistancezone. However, a largewindowhas thedisadvantageofcreatingalargezone.Whatdoes seem to be a factor indetermining the importanceof the zone is the tradingvolume for the gap candle.Heavy volume tends toenhance the effectiveness ofwindow support andresistancezones.4
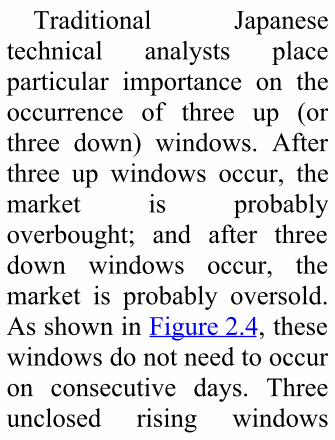
Traditional Japanesetechnical analysts placeparticular importance on theoccurrence of three up (orthree down) windows. Afterthree up windows occur, themarket is probablyoverbought; and after threedown windows occur, themarket is probably oversold.AsshowninFigure2.4,thesewindowsdonotneedtooccuron consecutive days. Threeunclosed rising windows
occurring during an uptrendwould suggest anoverboughtmarket. Nison suggests thatthis idea comes from theemphasis that Japanese placeon the number 3. In hisexperience, traders shouldconsider the uptrend in placeuntil themost recentwindowis closed rather than as soonas the third window rises.RefertoFigure2.4toseefourrisingwindows.However,thefourthwindowisimmediately
closed, suggesting that theuptrendhascometoanend.
CreatedwithTradeStationFigure2.4.Fourrising
windows,candlestickchartforMRK,March15–April
19,2011Rememberthat,ingeneral,
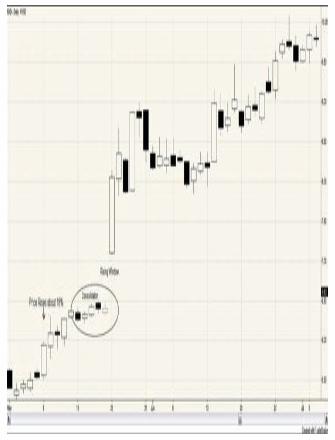
arisingwindowisbullishanda falling window is bearish.This is especially true withhigh-price and low-pricegapping plays. Figure 2.5portraysahigh-pricegapping
play for Krispy KremeDonuts (KKD). An advancein price of about 18% at thebeginningofMayisfollowedby a consolidation period.This consolidation period iscomposed of small-bodiedcandlesticks and signals aperiod of market indecision.The breakout from theconsolidation occurs on arising window, which isviewedasbullish.Indeed,theprice of KKD continued to
advance through June to $10ashare.
CreatedwithTradeStationFigure2.5.High-price
gappingplay,candlestickchartforKKD,May1–July
5,2011A low-price gapping play
is simply the reverse of thehigh-price gapping play. Adowntrend is followed by aperiod of small-bodiedcandles. During thisconsolidation period it
appears that a base may beforming. However, a bearishfallingwindow indicates thatthiswasnotthecase,andthedownward trend in priceshouldresume.
CandlestickPatternsContainingWindowsAlthoughmanycandlestick
patterns have Westernequivalents,somepatternsareunique to candlestick
charting.Thesepatternsoftenhave intriguing namesstemmingfromtheirJapaneseheritage. Most candlestickpatterns are short term andcomposedofonetofivebars.Patterns are defined by therelative position of the bodyand shadow of a candlestickand the location of acandlestick in relation to itsneighbors. Candlestickpatternsthatcontainwindowswithin the pattern are
describedbelow.
TasukiThetasuki isa two-candle
pattern. The upwardgapping tasuki is composedofarisingwindowcreatedbyawhitecandle followedbyablack candle that has a realbody top that lies below theclose of the previoussession’s close. The realbodiesforthetwocandlesareabout the same size. Figure
2.6showsanupwardgappingtasuki for Tyco (TYC) thatoccurredDecember1,2011.
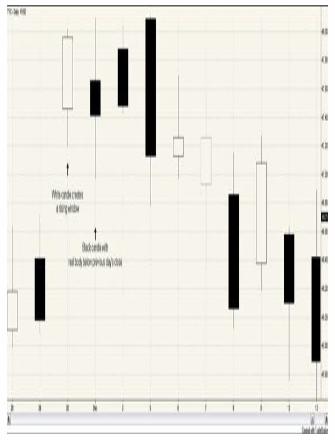
CreatedwithTradeStationFigure2.6.Upward
gappingtasuki,candlestickchartforTYC,November28–December13,2011Thedownwardgaptasuki
is simply the reverse of theupward gapping tasuki.Figure2.7showsadownwardgapping tasuki for Pearson(PSO). First, a black candleonAugust18createsafalling
window. Second, a whitecandle occurs on August 19with a real body about thesame size as the blackcandle’s real body. The realbody low for this whitecandleliesabovethecloseforthe black body candle. Thereal bodies of the August 18and August 19 candles areroughly the same size, andthe window is not closed bytheAugust19whitecandle.
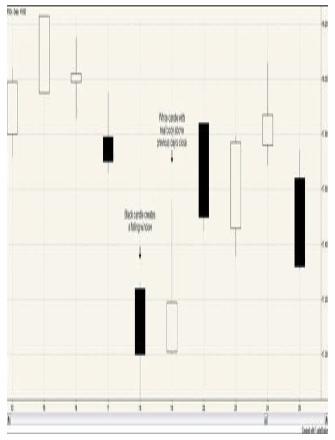
CreatedwithTradeStationFigure2.7.Downward
gappingtasuki,candlestickchartforPSO,August12–
25,2011The tasuki candlestick
pattern is identified by thecolors, relative sizes, andrelative positions of thecandlesticksonthedayofandthe day following thewindow. However, these
characteristics do not appearto have a significant impacton the importance of thewindow. The significantitemsare thedirectionof thewindow and whether thewindow is closed. Thus,although interesting forinformational purposes,identifying the tasuki patternin not extremely useful to atrader.
GappingSide-by-Side
WhiteLinesThe upgap side-by-side
white lines pattern is createdwhen, during an uptrend, awindow occurs with a whitecandle.Thefollowingsessionis also a white candle ofsimilar size, with a similaropen. This is a bullishcontinuation pattern. Again,the unclosed rising windowby itself would be bullish.The two white candles
reinforce this bullish signal,asshowninFigure2.8.
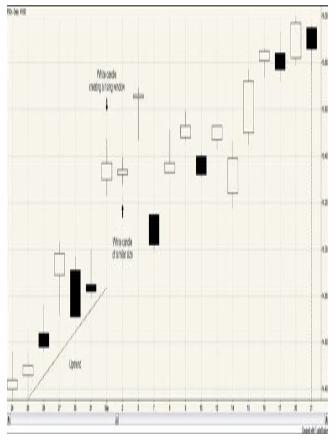
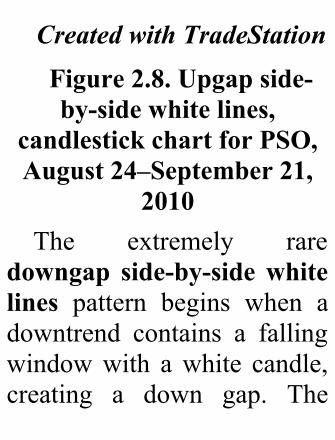
CreatedwithTradeStationFigure2.8.Upgapside-by-sidewhitelines,
candlestickchartforPSO,August24–September21,
2010The extremely rare
downgap side-by-sidewhitelines pattern begins when adowntrend contains a fallingwindowwith awhite candle,creating a down gap. The
next session is also a whitecandle. The adjacent whitecandles that compose theside-by-sidewhitelinesareofsimilarsizeandsimilaropen.Also,thesecondwhitecandlecannot close the window.Because the window is afallingwindow,thispatternisviewedasbearishdespite theexistence of two whitecandles. The white candlesare assumed to be shortcovering, and the downtrend
isexpectedtocontinue.
TwoBlackGappingCandlesIf a downside gap is
followed by two blackcandlesratherthantwowhitecandles, thepattern isknownas two black gappingcandles. The falling windowisabearishindicatorbyitself.When it is followed by twoblackcandles, it isviewedasevenmorebearish.
Figure 2.9 illustrates thetwo black gapping candlespattern that occurred for BPin May 2010. BP was in astrong downtrend when ablackcandlecreatedafallingwindowonMay14.Thenexttradingday,May17, anotherblack candle formed; thissecond black candle had asimilar open to the May 14candle. As this bearishindicator would suggest, thestock price continued to fall,
resultinginadeclineinpriceof approximately 10% overthenextweek.
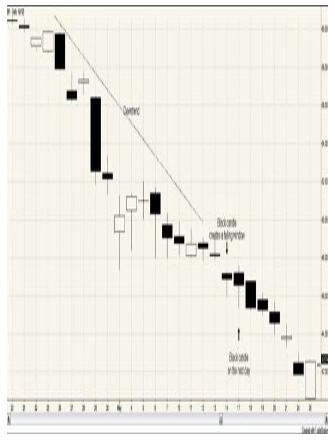
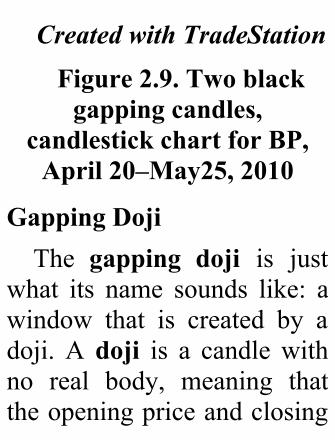
CreatedwithTradeStationFigure2.9.Twoblackgappingcandles,
candlestickchartforBP,April20–May25,2010
GappingDojiThe gapping doji is just
what its name sounds like: awindow that is created by adoji. Adoji is a candlewithno real body, meaning thattheopeningpriceandclosing
price for the session areidentical. A gapping dojiappearingduringadowntrendis considered bearish. Thegapping doji is anotherpatternthatisrarelyseen.Although the traditional
Japanese materials mentionthe gapping doji only in adowntrend, Nison (BeyondCandlesticks,p.106)suggeststhat there is no reason tobelieve that the same logic
would not apply to gappingdojisinuptrends.Inaddition,Nison recommends waitingfor confirmation of acontinued downtrend in thesession after the window; along,whitecandlethat tradeshigher in the followingsessionwouldcreateabullishmorning star pattern thatwould negate the negativesignalofthegappingdoji.
CollapsingDojiStar
Thecollapsingdojistar isabearishpatternthatcontainstwo windows. It begins at ahigh price level as a whitecandle pushes the price evenhigher. The session after thewhite candle is a doji thatgapsdown, creating a fallingwindow. The next sessioncreates another fallingwindowwith a black candle.This pattern is known as the“omen of a large decline”among Japanese candlestick
chartists. (BeyondCandlesticks, p. 115) Acollapsing doji star occurredon November 8, 2010 forRBS stock, as shown inFigure2.10.
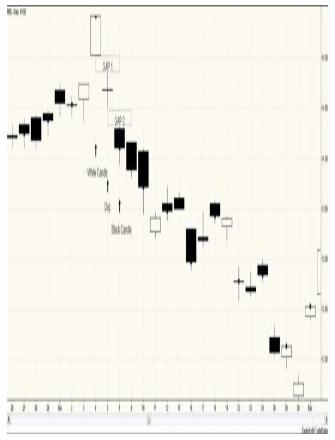
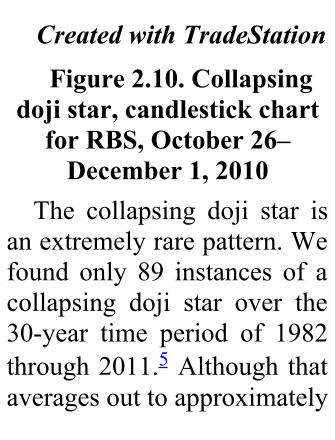
CreatedwithTradeStationFigure2.10.Collapsing
dojistar,candlestickchartforRBS,October26–December1,2010
The collapsing doji star isanextremelyrarepattern.Wefound only 89 instances of acollapsing doji star over the30-year time period of 1982through2011.5Although thataveragesouttoapproximately
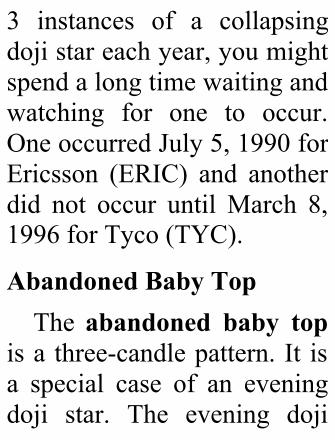
3 instances of a collapsingdojistareachyear,youmightspendalongtimewaitingandwatching for one to occur.OneoccurredJuly5,1990forEricsson (ERIC) and anotherdid not occur untilMarch 8,1996forTyco(TYC).
AbandonedBabyTopThe abandoned baby top
isa three-candlepattern.It isa special case of an eveningdoji star. The evening doji
star is composed of a whitecandle, followed by a dojiwith the real body lyingabove the real body of thewhite candle, followed by ablack candle with the realbody lying below the realbody of the doji. For theabandoned baby top, thebottom shadow of the dojidoesnotoverlaptheshadowsof the first or third candles,resulting in two windows.These two windows are
shown in Figure 2.11 forRBS.
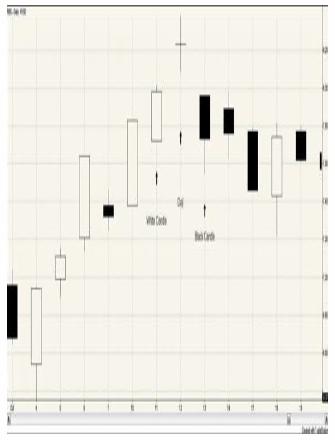
CreatedwithTradeStationFigure2.11.Abandoned
babytop,candlestickchartforRBS,October3–October19,2011
This top reversal signal israre. Only 299 occurredduring the study period of1950through2011.However,the abandoned baby top hasbeenmoreprevalentinrecentyears. About half of the
abandoned baby topsobserved over the 60-yearstudy periodwere in the lastdecade. Twenty-threeoccurred in 2010 and 18occurred in 2011, accountingforapproximately14%oftheabandoned baby tops in thepast60years.
AbandonedBabyBottomLike the abandoned baby
top, the reverse pattern, anabandoned baby bottom is
extremely rare. During the1950–2011 studyperiod,320abandoned baby bottomsexisted.Only two abandonedbabybottomsoccurredbefore1980,bothin1974.However,16 of the abandoned babybottoms occurred in 2010,and another 32 of theabandoned baby bottomsoccurred in2011.Thus,15%of the abandoned babybottoms occurring during thepast60yearshavebeenseen
inthepast2years.Anabandonedbabybottom
forHasbro(HAS)isshowninFigure 2.12. The first candlein this pattern is black. Thesecond candle is a doji, andthe shadow of the doji liescompletelybelowtheshadowof the first candle, creating awindow. The third candle iswhite, with the shadowcompletelyabovetheshadowof thedoji, creatinga second
window.(Nison,p.70)
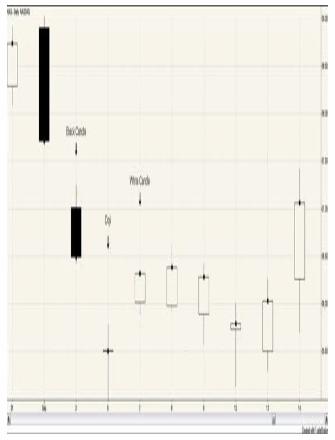
CreatedwithTradeStationFigure2.12.Abandoned
babybottom,candlestickchartforHAS,August31–
September14,2011
TradingwithWindowsCandlestick patterns are
tools, not a system. Thesignificance of many of thepatterns depends upon
previouspricemovement.Todetermine how meaningful apattern is, the analyst mustoften consider whether itoccurs during an uptrend,downtrend, or a sidewaysmoveinthemarket.In addition, some of these
patterns are extremely rare.Themorebarsincludedinthepattern, the more constraintsput on the construction ofeach bar, and the more
constraintsputontherelativepositionsof thebars, the lessfrequentapatternwillbe.Thomas Bulkowski
maintains a Web site thatcontains information about anumber of technical patterns,including 103 candlestickpatterns(www.thepatternsite.com).Searching through almost 5million candlesticks,Bulkowski provides statistics
about the frequency andperformance of candlestickpatterns. In general,Bulkowski’s results are notthat favorable for this subsetofcandlestickpatterns.Thebestperformingofthe
patterns containing windowsistheupwardgappingtasuki.The upward gapping tasukiranks 4th among the 103candlestick patterns,according to Bulkowski’s
performance measurements.Unfortunately, this pattern israre; Bulkowski finds only704 instances of the upwardgapping tasuki in 4.7millioncandlesticks. Another patternthatperformsreasonablywell(9th out of 103) is theabandoned baby bottom.However,anabandonedbabybottom is even rarer than theupward gapping tasuki; theabandoned baby bottom isranked92outof103patterns
for its frequency. Thecollapsing doji star is evenrarer; Bulkowski finds only16 examples of the pattern.At this rate, he points out, atrader using minute barswould find a collapsing dojistar only once every 3.3years!Bulkowski finds that the
two black gapping candlespattern occurs morefrequentlythanotherwindow
containingpatterns;outofthe103 candlestick patterns heconsidered, the two blackcandles pattern is the 29thmost common pattern. Thepattern also ranks 10th forhowwell itperforms relativetoothercandlestickpatterns.Although patterns with
names such as “abandonedbaby bottom” garner muchattention, looking at thetraditional window-
containing patterns has notseemed to be exceptionallybeneficial to traders. Therarity of these patterns notonlymeansthatatradermustwaitalongtimewatchingforsomeofthem,butitalsocallsinto question the validity ofthe results you see for thepatterns. As you go throughthe remainder of the booklooking at how gaps can betraded, you will encountersome of the candlestick

terminologyandlookatsomenontraditional ways thatcandle colors and patternsmight be helpful in thedevelopment of a successfultradingstrategy.
Endnotes1.Nison,Steve.JapaneseCandlestickChartingTechniques.New
York,NY:NewYorkInstituteofFinance,2001.2.Theterminologyof“closingawindow”isusedinJapanesecandlestickchartinginaslightlydifferentwaythan“closingagap”intraditionaltechnicalanalysis.Whenany
pricemovementtotallyfillsthevoidonabarchart,thegapissaidtobeclosed.Withacandlestickchart,thewindowisclosedonlyifthebodyofacandlefillsthegap.Thus,intraditionalbarchartanalyses,thegapinFigure2.2wouldbesaidtobe
closedonMarch28.BecausethischapterdiscussesJapanesecandlestickpatterns,weusetheJapanesedefinitionofclosingawindowwhenreferringtogapsinthischapter.3.Nison,Steve.Beyond
Candlesticks.NewYork,NY:JohnWiley&Sons,1994.4.Wewillexaminetheimpactthatgapsizeandtradingvolumehaveontradingperformanceindepthinfuturechapters.Thischapterfocuseson
thewaysinwhichgapsaregenerallyviewedbythosewhoanalyzetraditionalcandlestickchartpatterns.5.Thesearchperiodbeginsin1950;nocollapsingdojisexistforthestocksinthisstudypriorto1982.
Chapter3.TheOccurrenceofGaps
This chapter examines thefrequency of gaps acrossmanydimensions.Howoftendo gaps occur? Are gapsbecoming more frequent orlessfrequentovertime?Doesindexmembershipplayarolein gap frequency? Thischapter explores thesequestions.
DataandSoftwareBefore getting into the
answers to those questions,you need to understand thedata used in writing thisbook. The stock data camefrom Norgate InvestorServices, which sells asoftware package calledPremiumData.Therearetwodifferent U.S. stock pricedatasets available withinPremium Data. Historical
data can be purchased foreither currently listed stocksor delisted stocks. The basepackage for each containsprice history from 1985, butan add-on extends the pricehistoryto1950.You can find details
concerning the databasemethodologyandadiscussionof delisting on the PremiumData Web site(www.premiumdata.net/products/premiumdata/ushistorical.php#delisted
Thepriceshavebeenadjustedfor splits, reverse splits, andothercapital-relatedcorporateactions. Adjusting for splitscauses prices to be adjustedbackwardintimetoprovideacontinuous series from avalue perspective. Forexample,a2for1stocksplitshould cause a stock’s pricetodropinhalf(intheabsenceof other information). So ifbefore the split you owned100 shares at $50 per share,
afterthesplityouwouldown200 shares at $25 per share.Obviously, the value of yourstockholdingsisnotdownby50%. To avoid theappearanceof a50%drop invalue, the pre-split price isadjusted to $25. This priceadjustment is continuedbackward in time to thebeginningofthepricedata.The price adjustment
previously described can
cause some confusion. Saythatthisbookdescribespricesaround the occurrence of agap that occurred sometimein 2002. If youwere to referto price charts, price quotes,newspaper articles, webdiscussions, and so on at thetime of the actual gap, theprice may be different thanwhat this book uses due toprice adjustments that havebeenmadetokeepcontinuityin the series. Although price
adjustments affect thequotednumbers, they do not affectthe identification of gaps orpercentage changes (such asinvestment returns). If theopen, high, low, and closeprices have all been adjustedby the same factor, a gapbetween numbers such as 50and 52 is still a gap if thenumbers have been adjustedto 25 and 26. Furthermore,the percentage differencebetween the two numbers is
4%inbothcases.For purposes of this book,
our dataset goes from 1995through the end of 2011.(Later you will learn that2011was an interesting yearfor gaps.)1 The ending dateaffectsindexmembershipandindustry designation. It isextremely difficult toreconstruct indexmembership over time.Because index membership
vis-à-vis gaps is interesting,but not critical, we opted tosimplyuseindexmembershipand industry designations asoftheendof2011.
LiquidityConsiderationsLiquidity is a tricky issue
to handle. Suppose you usesoftware that helps youidentifystockpricegaps,andyou see that a certain stockhas gapped up on a certaindate. Examining more
closely,youseethatthepricegapwas from$1.02 to$1.03and that the total tradingvolume for the 2 days was5,000 shares. Would this beof interest? Unless you werean individual investor withlimited funds, probably not.Adollarvolumeoftradingofapproximately $5,000 over a2-day period for mostinvestors would be woefullyinadequate liquidity. What ifthepricegapwerefrom$102
to $103 and the total tradingvolume were 50,000,000shares? Would this beadequate liquidity? Foralmost all investors theanswerwouldbe”Yes.”But,the two examples areradically different. Whatabout examples that fallbetweenthesetwo?In trying to determine a
reasonable liquidityconstraint, we talked to
various experienced marketprofessionals. We got avariety of opinions aboutwhatnumbersshouldbeusedto impose a liquidityconstraint concerning whichgaps to include in our study.In the end, we opted toimpose a constraint that thedollar-volume of trading(closing price times sharestraded) had to be at least$5,000,000on thedayof thegap and the two preceding
days. Therefore, a stocktrading at approximately $5per share with a tradingvolumeof500,000sharesperdaywouldnothavemadethecut.Butifthepricehadbeenapproximately $10 per sharewith volume of 500,000sharesperday,itwouldhavemadethecut.Inaddition,wealso imposed a separatevolumeconstraintof100,000sharesperday.
The $5 million dollar-volume and 100,000 sharesper day volume criteriaseemed reasonable for 2011,butwhat about earlier years?We experimented withvarious approaches to adjustthe two constraints in earlieryears. There seemed to besome problems with everyapproach; there isn’t anyperfectway tomake such anadjustment. In the end, weopted to make a linear
adjustment based on thenumber of years prior to2011. After examining thetotal number of gaps relativetothenumberofstockslistedat the time and examiningwhich stocks were includedor excluded at various pointsin time, we arrived at anadjustment that we felt wasreasonable.2
FrequencyofGaps
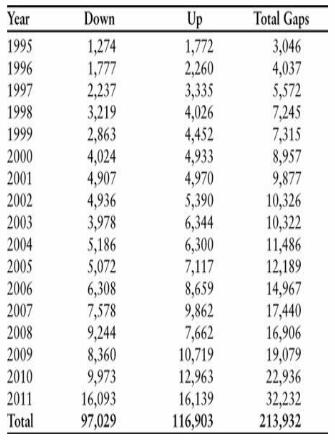
So,howfrequentlydogapsoccur? Table 3.1 shows thetotal numberofgapsbyyearforcurrentlylistedstocks.Asshown,thereisnoshortageofgaps to examine. In 2010,22,936 gaps occurred; in2011, this number increasedto32,232.A logicalquestionfroma tradingperspective is,“How many gap tradingopportunities am I going tohave on an average day?”Because the total number of
gaps has been increasingfairly steadilyover theyears,you could just take a dailyaverageusingthemostrecentyear as an estimate of whatyou might expect. Thenumber of trading days in ayearvariesslightlyfromyeartoyear,but252isanaverageoftenused.Withthatinmind,the 32,232 gaps in 2011divided by 252 gives anaverageofabout128gapspertradingday.Clearly,itwould
seem that potential tradingopportunities are frequentoccurrences.
Table3.1.FrequencyofGapsbyYear,1995–2011
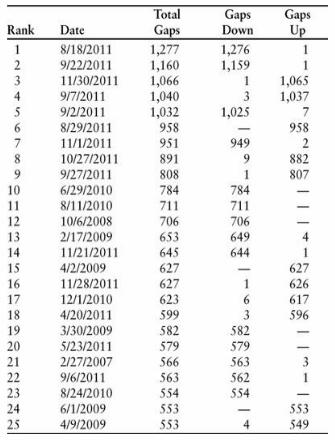
However, the situation ismore complicated due toclumping. Gaps are notevenly distributed across theyear.Thenumberofgapscanbe extremely high on certaindays, which leads to someother questions addressedshortly.Table 3.2 shows the 25
dayswiththehighestnumberofgaps.Itisquiteinterestingthat the 9 days with the
highest number of gaps alloccurred in2011and that14of the top 25 were in 2011.Therewasmuchdiscussionin2011aboutthehighdegreeofmarket volatility. The highincidence of extreme gapdays was anothermanifestation of marketvolatility.
Table3.2.DayswiththeGreatestNumberofGaps,
1995–2011
Now think about somereasons that gaps mightoccur. You can divide thereasons into three categories:marketwide events, industry-specific events, andcompany-specific events.Some events that may havebroad market impact arepolitical events, acts ofwar/terrorism, commodityprice shocks (especially oil),interest rate changes, and
currency changes. For theseevents to have substantialmarket impact, they wouldneedtobeunexpectedevents.Things like the election
results concerning the 2008election would not be totallyunexpected. The polling dataleading into election daysuggested that Obama waslikely to be elected, so littlemarket impact would beexpected when the expected
occurred. On the day of theelection, November 4, therewere116upgapsand9downgaps. On the following day,therewere39downgapsand3upgaps,notahighamountof activity. What about the2000Bush-Goreelectionwithits chaotic Florida recount?The gap activity onNovember8,thedayaftertheelection, was minimal; therewere39downgapsand3upgaps.
Compare these events to avirtually unexpected eventsuch as the tragedy of 9/11.Because the attacks occurredintheearlymorning,theNewYork markets had not yetopened that Tuesday.Due tothe damage in New YorkCity, the New York StockExchange, the AmericanStock Exchange, and theNASDAQ remained closeduntilMonday, September 17.The gap activity when
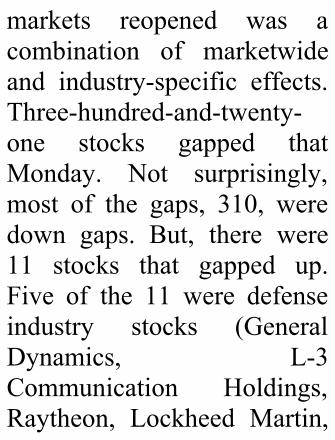
markets reopened was acombination of marketwideand industry-specific effects.Three-hundred-and-twenty-one stocks gapped thatMonday. Not surprisingly,most of the gaps, 310, weredown gaps. But, there were11 stocks that gapped up.Five of the 11 were defenseindustry stocks (GeneralDynamics, L-3Communication Holdings,Raytheon, Lockheed Martin,
andNorthrupGrumman).3
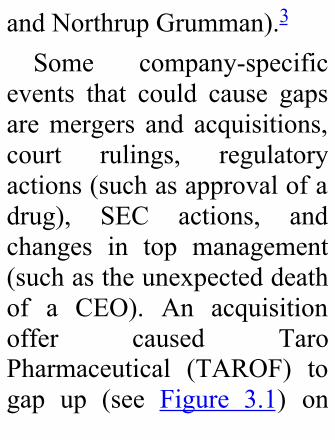
Some company-specificevents that could cause gapsaremergers and acquisitions,court rulings, regulatoryactions(suchasapprovalofadrug), SEC actions, andchanges in top management(suchastheunexpecteddeathof a CEO). An acquisitionoffer caused TaroPharmaceutical (TAROF) togap up (see Figure 3.1) on
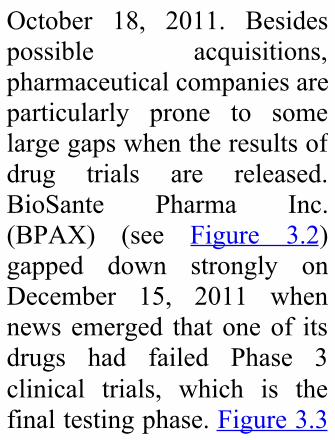
October 18, 2011. Besidespossible acquisitions,pharmaceuticalcompaniesareparticularly prone to somelargegapswhentheresultsofdrug trials are released.BioSante Pharma Inc.(BPAX) (see Figure 3.2)gapped down strongly onDecember 15, 2011 whennewsemerged thatoneof itsdrugs had failed Phase 3clinical trials, which is thefinaltestingphase.Figure3.3
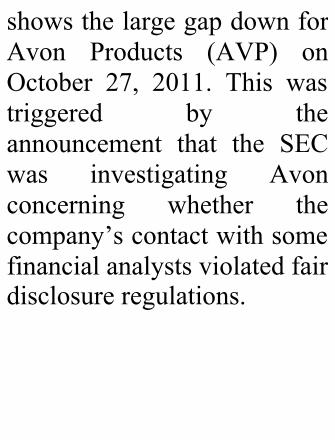
showsthelargegapdownforAvon Products (AVP) onOctober 27, 2011. This wastriggered by theannouncement that the SECwas investigating Avonconcerning whether thecompany’scontactwithsomefinancialanalystsviolatedfairdisclosureregulations.
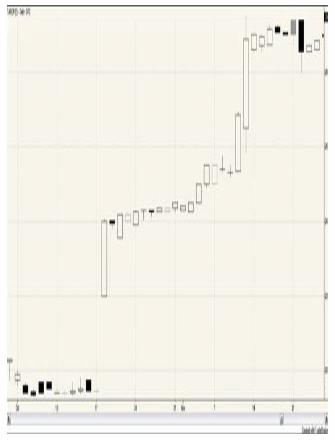
CreatedwithTradeStationFigure3.1.DailystockchartforTAROF,
September30–November24,2011
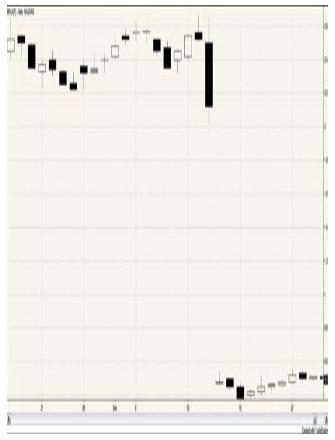
CreatedwithTradeStationFigure3.2.Dailystock
chartforBPAX,November17–December30,2011
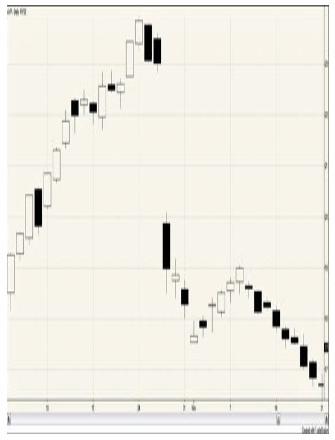
CreatedwithTradeStationFigure3.3.Dailystock
chartforAVP,October3–November21,2011
Anotherquestion toask is,“Are gaps more likely tooccur on some days of theweek rather than others?”You might hypothesize, forexample, that more gapswouldoccuronMondaythanother days of the week
because 3 days of newinformation is incorporatedinto theprice rather than justone. However, theinformationprovidedinTable3.3 suggests that gaps occurwith about the samefrequency on Mondaythrough Thursday, withFriday seeing slightly fewergaps.
Table3.3.OccurrenceofGapsbyDayoftheWeek,
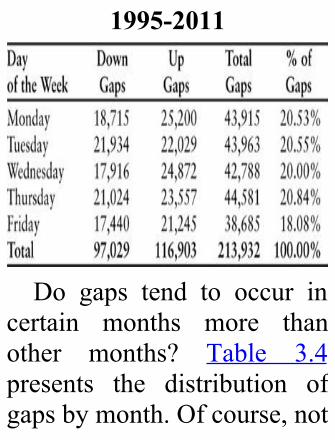
1995-2011
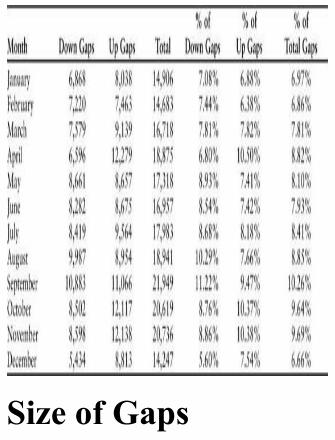
Do gaps tend to occur incertain months more thanother months? Table 3.4presents the distribution ofgapsbymonth.Ofcourse,not
every month has the samenumber of trading days.February, for example, oftenhas fewer trading days thanothermonths simply becauseit is a shorter month. Thenumber of trading days in agiven month is also affectedby when weekends andholidays fall. The highestpercentage of gaps (10.26%)occur in the month ofSeptember, whereas only6.66% of the gaps occur in
December. Approximately21.5%ofdowngapsoccurinSeptemberandOctober.Aprilisaninterestingmonthinthatit has the highest percentageof up gaps of any month(10.5%)butissecondlowest,onlybehindDecember in thepercentageofdowngaps.
Table3.4.OccurrencesofGapsbyMonth,1995–2011
SizeofGaps
In addition to lookingsimplyatthenumberofgaps,it is useful to examine gapsize; all gaps are not createdequally.Rememberthatagapmeans that there isa jumpinthemovementofa security’sprice from one day to thenext.Agapcanbeassmallasapenny,or itcanbeas largeas several dollars. There istheoretically no limit to thesize of an up gap, but astock’s price can’t fall more
than100%.This raises the question of
how to measure the size ofthegap.Theauthorschosetolookatthepercentagesizeofthegapusingawick-to-wick(in candlestick terms)measure. For stocks thatgapped up, calculate thepercentage change from theprevious day’s high to thelowonthedayofthegap.Informulaform,thisis
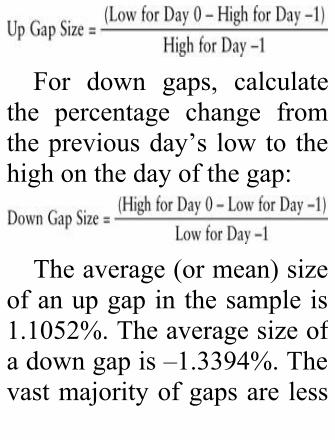
For down gaps, calculatethe percentage change fromthepreviousday’s lowto thehighonthedayofthegap:
Theaverage(ormean)sizeofanupgapinthesampleis1.1052%.Theaveragesizeofadowngapis–1.3394%.Thevastmajorityofgapsareless
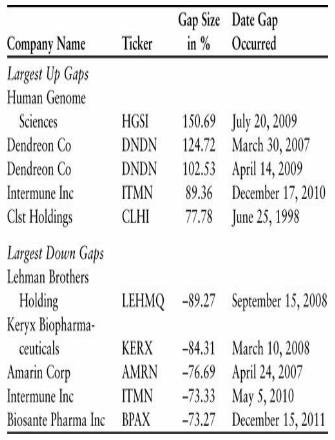
than 1% either up or down.However, there are someextreme cases: Table 3.5showsthefivelargestupgapsand down gaps over the1995–2011 time period. Thelargestupgapinthedatabaseoccurred on July 20, 2009,when Human GenomeSciences (HGSI) gapped up150.69%.AsshowninFigure3.4, HGSI had been tradingbetween $2 and $4 a sharesincelateMay2009.OnJuly
20, the stock opened at aprice of $10.89; even thoughthe price fell to a low of$9.10 during the day, itclosednearitshighat$12.51,leaving a substantial hole, orgap,visibleinthechart.
Table3.5.LargestUpGapsandDownGapsin%,
1995–2011
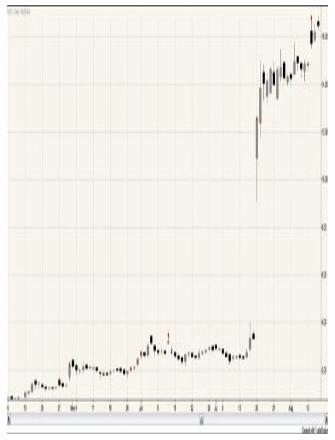
CreatedwithTradeStationFigure3.4.Largestgap
up,dailystockchartforHGSI,April6–August13,
2009Whathappenedthatcaused
HGSI’s stock to more thandouble in price from onetrading day to the next?Business news headlines thatdaystated,“SharesofHumanGenome Sciences Inc.
rocketedonMondayafterthecompany released a positivelate stage study for its newlupus drug Benlysta, fuelingspeculation that it could betaken over by commercialpartner GlaxoSmithKine.”(Kennedy) This enormousgap occurred due tosubstantial company-specificnews.At the other end of the
spectrum, the stock with the
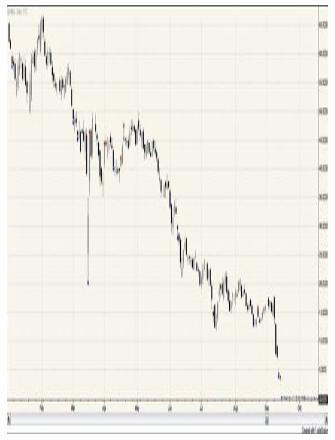
largest down gap willprobablycomeasnosurprise.On September 17, 2008,Lehman Brothers HoldingCompany(LEHMQ)droppedwithagapofmorethan89%.Figure 3.5 shows thedownward move in LEHMQleading up to this enormousgap.AsrecentlyasFebruary,the stock was trading at 65.By August the stock haddroppedto15.BySeptember9, the stockhad fallenbelow
10, and 2 days later, onSeptember 11, it was downbelow5.Itwaslikewatchinga limbo contest. How lowcould it go? On September15, with the stock atapproximately 20 cents pershare, the company filed apetition under Chapter 11 ofthe U.S. bankruptcy code.Furthermore, on September17, the NYSE moved tosuspend trading of LEHMQontheexchange.
CreatedwithTradeStationFigure3.5.Largestgap
down,dailystockchartforLEHMQ,January1—
October17,2008
GapsbyIndexMembershipandIndustryAnotherwaytoslicethings
is to view the data by indexmembership. The index
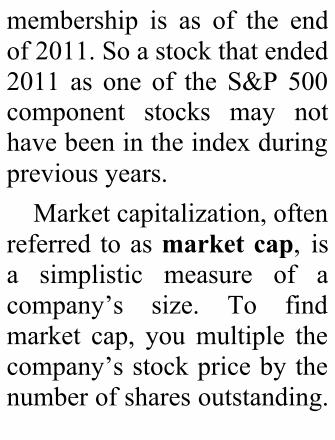
membership is as of the endof2011.Soastockthatended2011 as one of the S&P 500component stocks may nothavebeenintheindexduringpreviousyears.Marketcapitalization,often
referred toasmarketcap, isa simplistic measure of acompany’s size. To findmarket cap, youmultiple thecompany’sstockpricebythenumberofsharesoutstanding.
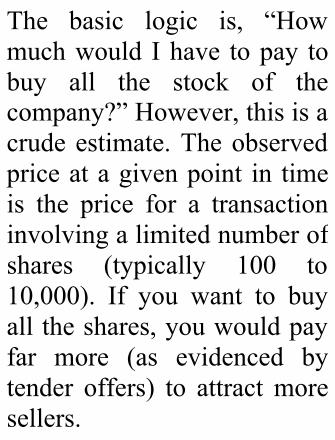
The basic logic is, “Howmuchwould Ihave topay tobuy all the stock of thecompany?”However,thisisacrudeestimate.Theobservedpriceatagivenpoint in timeis the price for a transactioninvolvingalimitednumberofshares (typically 100 to10,000). If you want to buyalltheshares,youwouldpayfar more (as evidenced bytender offers) to attractmoresellers.
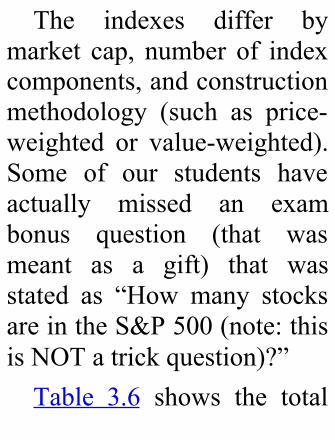
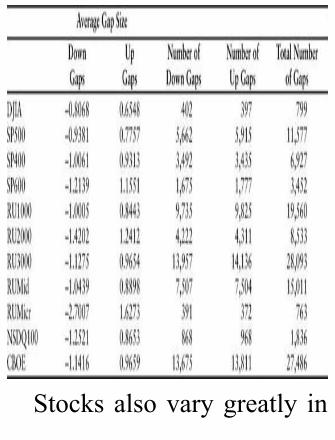
The indexes differ bymarket cap, number of indexcomponents,andconstructionmethodology (such as price-weighted or value-weighted).Some of our students haveactually missed an exambonus question (that wasmeant as a gift) that wasstated as “How many stocksareintheS&P500(note:thisisNOTatrickquestion)?”Table 3.6 shows the total
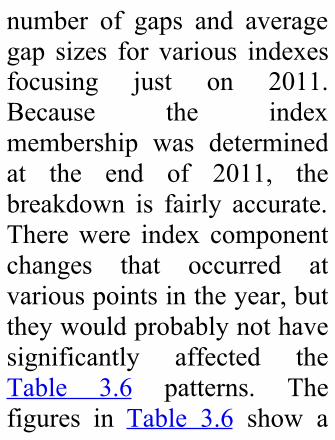
number of gaps and averagegap sizes for various indexesfocusing just on 2011.Because the indexmembership was determinedat the end of 2011, thebreakdown is fairly accurate.Therewere index componentchanges that occurred atvariouspointsintheyear,buttheywouldprobablynothavesignificantly affected theTable 3.6 patterns. Thefigures in Table 3.6 show a
tendency for stocks withsmaller market caps to have(onaverage)largergaps.Oneconjecture is that it relates toliquidity. Think about Wal-Mart (WMT) versusTravelZoo(TZOO),aRussellMicrocap stock.Wal-Mart isacomponentofboththeS&P500 and the Dow JonesIndustrialAverage.WMThasa largeanalyst followingandhad an average volume of17.3 million shares on the
days it gapped in 2011.TZOO’s average volume onthe days it gapped was justunder 2 million shares. Thelarge number of eyesfollowing WMT means thatmany people are aware ofevery small piece of newsthat might impact its price.Evenasmallnewsitemmightcause someone to initiate atrade. On the other hand,minornews related toTZOOmay go unnoticed or may
simplybeignored.Thiscouldlead to larger price jumpswhen an accumulation ofnews occurs, which wouldcausemorepricegapping.
Table3.6.GapOccurrencesin2011byIndexMembership
Stocksalsovarygreatly in
the number of gaps theyexperience.Thereweremorethan 9,000 stocks in thedatabase of currently listedstocks. Of these there were2,714 that experienced atleastonegap(subjecttopriceandvolumeconstraintsat thetime of the gap) during the1995–2011 time period. Theaverage number of gaps perstock was 79. The medianwas50.
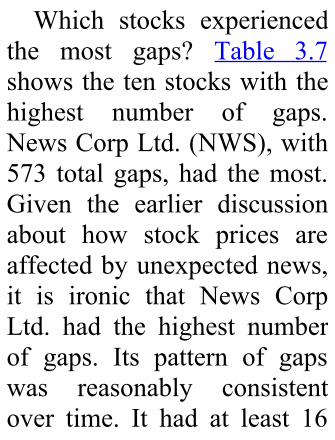
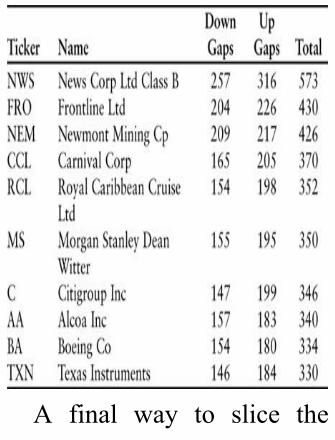
Which stocks experiencedthe most gaps? Table 3.7showsthetenstockswiththehighest number of gaps.NewsCorpLtd.(NWS),with573 total gaps, had themost.Given the earlier discussionabout how stock prices areaffectedbyunexpectednews,it is ironic that News CorpLtd. had the highest numberof gaps. Its pattern of gapswas reasonably consistentover time. It had at least 16
gaps in each of the 17 yearsfrom1995through2011.Thepeak was in 2000 when itgapped69times.
Table3.7.TenStockswiththeHighestNumberof
Gaps,1995–2011
A final way to slice the
number of gaps is byindustry.Theterm“industry”seems straightforward at firstblush. However, there aremany complications. Is theresuch a thing as the“computer” industry? It is atermyoumightuse incasualconversation. However, doesit make sense to lump IBM,EA, andSTX together? IBMengages in a wide range ofactivities from various typesof software to various types

of hardware to consultingservices.ElectronicArts(EA)makes multimedia andgraphics software. SeagateTechnology PLC (STX)specializes in data storagedevices. You could easilysubdivide “computerindustry” into multiplesmaller industries. Whodecides which industry agiven company is in? Thereare a number of differentclassification schemes, some
developed by private sourcesand some developed bypublicentities.PremiumDataprovides a classificationscheme that assigns eachcompany into one of 102different industries (103 ifyoucount“unclassified”).Table 3.8 lists the
industries (the unclassifiedcategory is not shown in thislist but would have ranked2ndwith8,155gaps)withthe
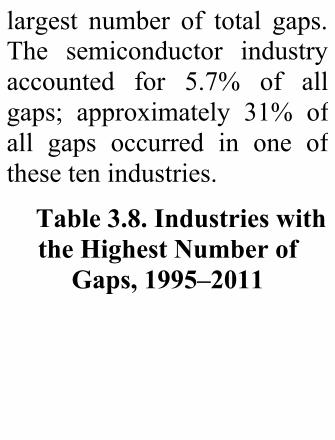
largest number of total gaps.The semiconductor industryaccounted for 5.7% of allgaps; approximately 31% ofall gaps occurred in one ofthesetenindustries.
Table3.8.IndustrieswiththeHighestNumberof
Gaps,1995–2011
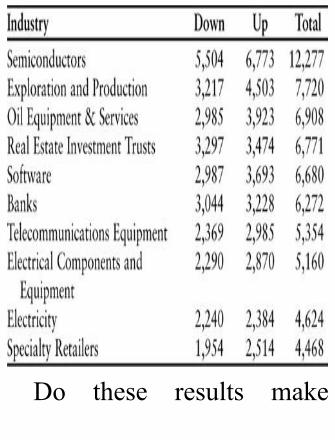
Do these results make
sense? We think they do, atleast in a general sense. Itseems logical that stocks inindustries sensitive to majormarketwide events (such asoilpriceshocks)mighthaveahigh number of gaps. Thiswould explain why theexploration and productionindustry, for example, issecond in the list. Beyondmarketwide factors someindustries are just morevolatile than others. For
example,high-techstocksaremore volatile than consumerstaplestocks.
SummaryGaps can occur for a
varietyofreasons.Theremaybe some macroeconomicevent such as a sudden jumpin the price of oil or theimpact of a terrorist attack.Oilpricechangesaffectsomeindustries, such as airlines,
morethanotherindustries,sothere are days whenmost ofthegapsareconcentratedinafew industries. At theindividual company levelthere are many possibleevents that could lead to agap in the company’s stockpricesuchascourtdecisions,mergers and acquisitions,regulatoryrulingssuchastheresults of pharmaceuticaltrials,andsoon.
Gaps are quitecommonplace. The mediannumber of gaps per day forthe stocks that met ourcriteriawas31;onoverone-halfofthetradingdays,thereweremorethan31gaps.Theliquidity constraints werefairly rigorous, so there areactually many more stocksthat gap on a typical day.Individual investors shouldnot have difficulty findingpotentialgap-basedtrades.
Something that came as asurprisewas that the numberof gaps has been growingover time. There were moregaps(32,232)in2011thaninanyofthepreceding16years.As shown in Table 3.1, theannualincreaseinthenumberofgapshasbeenquitesteady.Some days have an
extremely high number ofgaps. Refer to Table 3.2 toseethe25dayswiththemost
gaps. The total number ofgaps ranges from 553 to1,277. Another remarkablethingabout2011showsupinthis table; 9 of the 10 dayswith the highest number ofgaps occurred in 2011. Onegap direction was alwaysdominant. The highestnumber of gaps in theopposite direction from themajority was only 9; in 8 ofthetop25days,thegapswereentirely either up or down
with none in the oppositedirection.There seems to be some
slight seasonality in thenumberofgaps.Inthestudy,more gaps (10.26% of thetotal) occur in Septemberthan in any other month,whereas December is thelowestmonthforgaps(6.66%of the total).Over the courseofaweek,thenumberofgapswas quite even between
Monday and Thursday. OnFridays there were slightlyfewergaps(about18%ofthetotal).All gaps are not created
equal; some aremuch biggerthanothers.Yousawhowthepercentage size of a gap canbe calculated, which gives arelativemeasureofthesizeofthe gap. Stocks can’t gapdown lower than–100%,butthereistheoreticallynoupper
limittothesizeofanupgap.Themostextremegapsinthesample were an up gap of151% and a down gap of –89%.In addition to certain days
havingahigherconcentrationof gaps, certain stocks andcertainindustriescanhavefarmore than the averagenumber of gaps for theircategory. The ten stocks inthestudythathadthehighest
numberofgapshadgaptotalsrangingfrom330to573.Theindustry with the highestnumberof totalgapswas thesemiconductor industry,which had a significantlylargernumberofgapsthanitstwo closest competitors:exploration and production,and oil equipment andservices.Approximately31%of the total number of gapsfell into one of the tenindustriesshowninTable3.8.
In the research, nofoolproof get-rich methodsfor trading gaps were found.However, knowing some ofthe tendencies can be usefulin trading. In subsequentchapters gaps will bedissected at deeper levels.There are some clues as towhere you might focus yourattentionforgaptrading.
Endnotes
1.Theauthorsoriginallyconsideredgapsgoingbackto1950andfoundanincreasingincidenceofgapsinrecentyears,whichraisedquestionsaboutthebenefitsofgoingfurtherbackintimeintheanalysis.The1995–2011period
providesenoughmarketdiversitytoanalyzebothbearandbullmarketswhileminimizingsomeoftheproblems,suchashowtocontrolformarketreturnsandliquiditymeasures,whichoccurwhentryingtoanalyzedatafromseveraldecadesago.
2.Issuessuchasstocksplitsaddcomplicationstodetermininghistoricalliquiditymeasuresforstocks.Supposeastocktradesfor$6ashareandhasavolumeof1millionsharesonMonday;thiscompany’sdollarvolumeoftradingwouldbe$6
million.IfthestocksplitsonTuesdayandthevolumeonTuesdayis2millionsharesatapriceof$3,thedollartradingvolumewouldbe$6million.Thehistoricalpriceisadjustedto$3sothatitdoesnotappearthatthecompany’sstock
justlosthalfitsvalue.However,historicalvolumeisreportedastheactualvolume.So,goingbackandlookingatthedollarvolumeonMonday,itwouldappeartobeonly$3X1millionsharesor$3million.Therefore,youneedtousealowerdollar
volumetofilterforliquidityconstraintsinearlieryears.3.Interestingly,September17doesn’tmakethelistofthetop25highestgapdays.Themarketdidexperiencealargedecline,however,withtheDJIAfalling7.1%.The
684pointlosswasthebiggest-everone-daypointdeclinethemarkethadexperienceduntilSeptember29,2008whenitdeclined777points.
Chapter4.HowtoMeasureReturns
Howdoyoutellwhetheragiven investment strategy isworth following? Althoughthis seems like a simplequestion, it isn’t. Supposeyour friend Daniel tells youthat he has developed anincredible trading strategy.He tells you that he made a20% return on ABC, a 25%
return on DEF, and a 35%return on GHI over the pastmonth!Danielofferstosharehis strategy with you so thatyou, too, may enjoy thesegains. Daniel’s returns dosound impressive, but,unfortunately, it isn’t thatsimple.Aswelookathowwemeasurereturns,wemustalsoconsider two other importantfactors:luckandrisk.
CalculatingReturns
With this discussion asbackdrop, let’s now turn tohow we measure theprofitability of gap-basedtradesinthisbook.Chapter1,“WhatAreGaps?” discussedhow to number the daysaround gaps. The day of thegap iscalledDay0.Thedaybefore is Day –1, the dayafter is Day 1, and so forth.Because a gap can’t beunambiguously determineduntilthecloseofDay0,there
would be no opportunity toinitiate a gap-based tradeuntilDay1.Of course, therewould be some days forwhichyoucouldsafelyguessby the last hour or lastminutesof trading that eitheradowngaporanupgapwasgoingtooccur.But,theFlashCrash of May 6, 2010,showed that prices canchange quickly anddramatically.
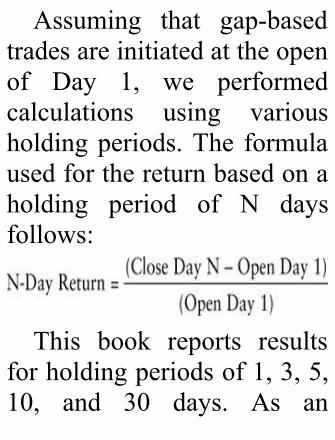
Assuming that gap-basedtradesareinitiatedattheopenof Day 1, we performedcalculations using variousholdingperiods.The formulausedforthereturnbasedonaholding period of N daysfollows:
This book reports resultsforholdingperiodsof1,3,5,10, and 30 days. As an
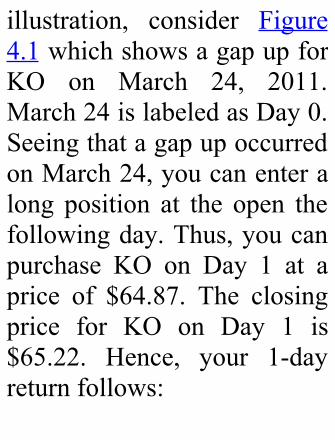
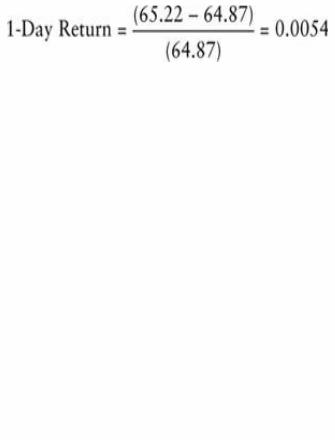
illustration, consider Figure4.1whichshowsagapupforKO on March 24, 2011.March24islabeledasDay0.SeeingthatagapupoccurredonMarch24,youcanenteralong position at the open thefollowingday.Thus,youcanpurchase KO on Day 1 at aprice of $64.87. The closingprice for KO on Day 1 is$65.22. Hence, your 1-dayreturnfollows:
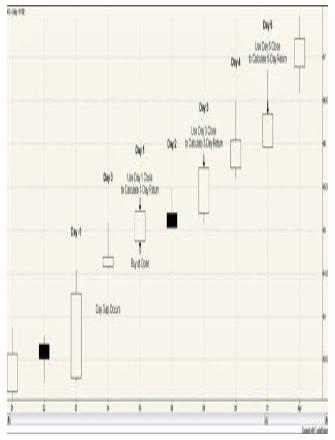
CreatedwithTradeStationFigure4.1.Dailystock
chartforKO,March21–April1,2011
The1-day return is simplymeasuring how much youwouldearn ifyoubought thestock at the open on Day 1and sold at the close onDay1. You can calculate longerreturns in the same manner.Forexample,a3-dayreturnis
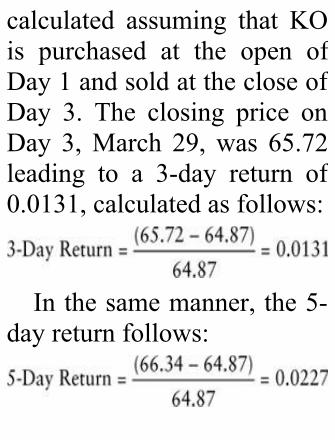
calculated assuming that KOis purchased at the open ofDay1andsoldatthecloseofDay 3. The closing price onDay 3,March 29,was 65.72leading to a 3-day return of0.0131,calculatedasfollows:
Inthesamemanner,the5-dayreturnfollows:
These calculations do notmake any adjustments fortransactions costs. The profitthat an investor wouldactually make on this tradewould be reduced by thecosts, such as commissions,theinvestormustpaytoenterthe trades. In recent years,transactions costs have fallendramatically. Also,transactionscostsvarywidelyacross investors, dependingupon their portfolios and
trading frequency. Therefore,returns not adjusted fortransactions are reported,allowing individual investorsto determine if theprofitability of a strategywould be great enough tocovertheirtransactionscosts.Table 4.1 provides the
averagereturnsforstocksthatgappedduringthe1995–2011sample period. All thesereturnsarecalculatedforlong
positions; if a stock gappedupordownonDay0,a longpositionisenteredattheopenonDay1.Thereturnsshownare in percentages. So, thevalue of –0.0204 for theaverage 1-day return fordown gap stocks means –0.0204%.Likewise,the5-dayreturn from buying stocksthat experienced down gapswas0.3712%,oralittlemorethan1/3of1%.Anotherwaytostatethisisinbasispoints.
One basis point (abbreviatedbp) is1/100thof1%;100bpequals 1%. The return of0.3712% could be describedas 37.12 bp. These numberssound quite small. However,37.12bpovera5-dayperiodis approximately 20.35% onan annualized basis(assuming about 250 tradingdaysinayear).
Table4.1.AverageReturnsforStockswith
Gaps,1995–2011
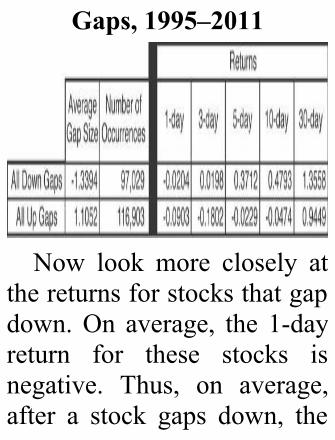
Now look more closely atthereturnsforstocksthatgapdown.On average, the 1-dayreturn for these stocks isnegative. Thus, on average,after a stock gaps down, the
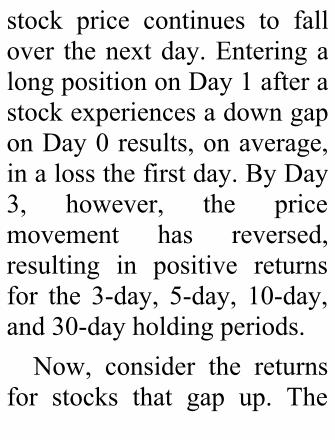
stock price continues to fallover thenextday.EnteringalongpositiononDay1afterastockexperiencesadowngaponDay0results,onaverage,inalossthefirstday.ByDay3, however, the pricemovement has reversed,resulting in positive returnsfor the 3-day, 5-day, 10-day,and30-dayholdingperiods.Now, consider the returns
for stocks that gap up. The
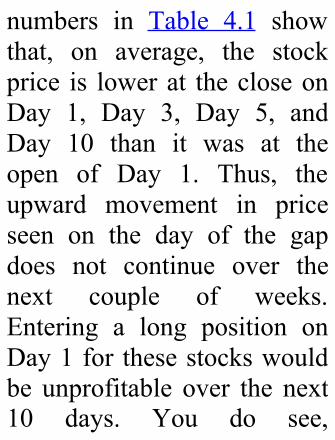
numbers in Table 4.1 showthat, on average, the stockprice is lowerat thecloseonDay 1, Day 3, Day 5, andDay 10 than it was at theopen of Day 1. Thus, theupward movement in priceseen on the day of the gapdoes not continue over thenext couple of weeks.Entering a long position onDay1for thesestockswouldbe unprofitable over the next10 days. You do see,
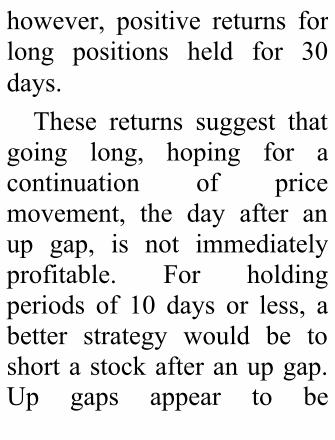
however, positive returns forlong positions held for 30days.These returns suggest that
going long, hoping for acontinuation of pricemovement, the day after anup gap, is not immediatelyprofitable. For holdingperiods of 10 days or less, abetter strategy would be toshortastockafteranupgap.Up gaps appear to be
associated with a reversal inpricetrendovertheshort(10-day) time frame. Down gapsdo appear to be associatedwith price continuation, thatis, the price continuesdownward, fora shortperiodof time, suggesting a shortpositionisinitiallyprofitable.Within 3 days, however, thisprice movement tends toreverse, suggesting that alongpositionshouldfollowadowngapforholdingperiods
of3daysorlonger.
DailyandAnnualizedReturns
The authors reportnominal returns for thevarious time periods.These returns are not,exceptfor thecaseof1-day returns, dailyreturns, nor are theyannualized returns.Consider, for example,
the 5-day return of0.3712 and the 10-dayreturn of 0.4793 fordowngaps inTable4.1.These numbers are notdirectly comparable; inother words you cannotsimply say that the 10-day return is betterbecause it is a biggernumber.Howwouldyouconvert these returns toannualized returns? The5-day return says that
overa5-daytimeperiodyou would have earned0.3712%;thereare505-day time periods in ayear (assuming 250tradingdays).Thus,withcompounding, anannualized return wouldbe (1+ 0.003712)50 – 1= 20.35%. The 10-dayreturn of 0.4793 wouldbe (1+ 0.004793)25 – 1= 12.70%. You must
also be careful abouthow to view pricemovement.Consider,forexample, the 1-day, 3-day, and 5-day returnsforupgapsinTable4.1.If, after an up gap, aninvestor purchased thestockattheopenonDay1andsolditatthecloseon thatday, the investorwould,onaverage,havea loss of 0.09%. If aninvestor bought at the
openonDay1 and soldat the close on Day 3,thelosswouldbe0.18%.Thus, price must havemoved lower betweenthe close on Day 1 andthecloseonDay3.Ifaninvestor bought at theopenonDay1 and soldat the close on Day 5,the loss would be only0.02%. Although the 5-day return is stillnegative, it is smaller in
absolute value than the3-day return; thus, theprice must have movedhigherbetweenthecloseon Day 3 and the closeonDay5.However, theupward price movementwas not enough toovercomethedownwardmovement of the first 3days.
TheImpactofLuck
The authors live in SanAntonio, home of theAlamodome, which wasprimarily designed as afootball stadium even thoughSan Antonio has no profootball team. Go figure.Let’s conduct a thoughtexperiment. There is afootball game and theAlamodome, which can holdapproximately80,000people,is packed. At halftime youhold a special coin-flipping
event. You have everyonestandupandflipacoin.Youtell everyone who flipped“tails” to sit down.You thentellthepeoplestillstandingtorepeat this process. Youcontinue this process untilonly one person, thechampion head-flipper,remains.If thecoinswereallfair coins, you would expectthe sequence of people stillstandingtobesomethinglike40,000, 20,000, 10,000,
5,000, and so on. It is quitelikely that thewinner,whomyou can call Pat,might haveflipped 16 or moreconsecutiveheads.1
Areportermight interviewPat about her head-flippingsuccess.The interviewmightbegin with the reporterasking, “Pat, tell me. Wereyou surprised when youflipped 16 consecutive headsinarow?”
Would you expect Pat’sresponse to be, “No, notreally.YouseewhenIwasincollege,Iskippedalotofmyclasses. I spent hourspracticing coin flipping.Somehow I knew thatsomeday it would pay off.Today it has. I get to be onnationalTV.Hi,Mom!Itoldyou it would all work outsomeday.”Ordoyouthinkaresponse
such as, “I’m as surprised asyouare.Iguesstodaywasmylucky day. It was definitelyblind luck, but it willcertainly make a good storyformy grandkids.”would bemorelikely?So what does this have to
do with investing? Giventhousands and thousands ofinvestors, some people arebound to get lucky. Just asyouneedtoquestionwhether
a winning coin flipper hassomespecial talentorsimplygot lucky, you must askwhether an investor’swinningrecordisaresultofasuperior investment strategyorsimplyluck.WasDanielinthe opening scenario of thischapter like Pat? Did hisinvestment strategy win justduetopureluck?Be careful not to attribute
goodperformanceandahigh
return to a superior tradingmethodology too quickly.Asyou have just seen, you canwin repeatedly just becauseof luck. As Americanscreenwriter Frank HowardClarksaid,“It’shardtodetectgood luck—it looks somuchlike something you’veearned.” Knowing when toattributegoodperformancetoluck and when to attribute itto methodology is a difficulttask.Onewaytodothisisto
see if the strategy makesrational sense. If Patwere totell you that the winningmethodologyforcoinflippingwas to stand on her left footwhenshetossedthecoin,youwould attribute her winningto luck.Likewise, ifDaniel’sstock-picking methodologywere to pick stocks bychoosing three stock tickersby pulling tickers from a hatthatcontainedslipsofpaperswith the names of all the
tickers in the S&P500, youwould attribute hisperformance to luck. But,sometimes,itisn’teasytotellif the strategymakes rationalsense. Suppose that Danielsaid he picked stocks basedon a recent vacation he tookto a west coast city. He sawlots of new businessesopening, a booming realestate market, and a vibranteconomy. He enjoyed hisvisit so much he decided to
invest in companiesheadquartered in that city.Was Daniel’s goodperformance luck? Or didDaniel’s strategy help himchoose companies that weregrowingand inanexpandingindustry?In addition to asking
whetherrationalreasonsexistfor a winning strategy, youcan control for risk to somedegreebyusing largesample
sizes.Patmaythrow16headsin a row, but can she throw20 heads in row by standingon her left foot?What about25 or 30 heads? As youincrease the sample size andthe time period considered,thechancetohaveawinningstrategy simply because ofluckdiminishes.
TheImpactofRiskThe second factor with
which youneed towrestle isrisk. Say someone comes toyou with a stock-pickingsystem that produces a highnumber of winning trades.The relevant riskquestion is,“Does this system merelytendtoselectstockswithhighrisk?” If so, the results maynot look so impressive afteradjustingforrisk.But,howdoyouadjustfor
risk? There’s the rub. One
method frequently used inacademic finance is to adjustbased on the stock’s beta,which is a measure of thestock’s systematic, ornondiversifiable, risk.This ispartofwhatiscalledModernPortfolioTheory (MPT).Thework thatwent intoMPTledto Nobel Prizes for HarryMarkowitz and WilliamSharpein1990.Although beta is
commonlyusedasameasureofriskintheacademicworld,it is not without problems.Academics are still arguingabout risk adjustments. Thelast doctoral dissertation onriskandassetpricinghasnotyetbeenwrittenandprobablywon’t be for many years (ifever). For the most part,academics identify risk asuncertainty or variability ofreturns. This concept isn’tperfectly transferable into the
practitionersworldoftrading.First, practitioners are not
so concerned that a trademightbemoreprofitablethanwhat they expected. Forexample, if a trader thinksthere is a 95% chance that atradewillmake$100,000anda 5% chance that the tradewill make $1 million, riskwould not be much of aconcern for the practitioner.Give the same trader a trade
that had a 95% chance ofmaking $100,000 and a 5%chance of losing $800,000,however, and risk becomesmuchmore of a concern. Tothe academic, both of thesetrades have about the samevariability and, thus, aboutthe same risk. Academicsdon’t distinguish muchbetween upside risk anddownside risk; the unknown,orvariability, is risk.For thetrader, the possibility of loss
isamuchgreaterriskthanthepossibility of an extremelyhighgain.Second, academics have
focused on howdiversificationminimizesriskby eliminating unsystematicrisk. Although it is true thatdiversification curbs hugelossesbyspreadingyoureggsacross a number of differentbaskets, it does nothing, asthelastdecadehastaughtus,
to protect investorswhen theentire market is in adownturn.Practitioners generally
define risk as the chance oflosingcapital.Thiscanbeanentirely different mindsetthan the academic view ofrisk.Anumberof alternativemeasureshavebeenputforthtotrytoaddressthenotionofriskinatradingenvironment.These includemeasures such
as maximum amount of lossper trade and maximumdrawdown. None of themeasures developed so farperfectlymeettheneedsofalltraders.Obviously, measures of
risk are complicated andcontroversial. Thus,throughoutthisbook,theonlyadjustments made arecontrollingforoverallmarketconditions. Individual traders
need to be aware of whatmeasures of risk are mostappropriate given their owndefinitionofrisk.Why adjust for overall
market conditions?Remember Daniel from thebeginningof thechapter?Hemade20%inABC,25%,andDEF, and 35% in GHI lastmonth. When analyzingDaniel’s strategy, economistswill be quick to ask, “What
wastheopportunitycost?”Inother words, if Daniel hadplaced his money in anotherstock, what would his returnhave been? If the averagestock in the market went up35% last month, Daniel’sstrategydoesn’tlooksogoodanymore.HisGHI pickwassimply an “average” pick.Even though he made apositive return in ABC andDEF, he would have mademore money purchasing the
averagestockinthemarket.Therefore, you need to
consider the overallbackground of the marketwhen considering how wellan investment does. Youdon’t want to brag about a25%returnwhentheaveragereturn is 35%; in this case,you did 10% worse than ifyou just randomly pickedstocks. Under some marketconditions, it is just easier to
make money in the stockmarket thanit isduringothertime periods. Having a 25%returnduringastrongmarketuptrend is much easier thanhavinga25%returnwhenthemarket is in a sidewaystradingrange.
MarketAdjustedReturnsHow can you control for
marketconditions?Youdoso
by calculating market-adjusted returns. As mostthings in investments, thisadjustment is not asstraightforward as it sounds.As a measure of underlyingmarket conditions, you canuse the S&P500 as youradjustment. Trading in SPY,an ETF that tracks theS&P500, began in 1993,which enables you to useSPYreturnsforadjustmentasfollows.
N-daymarket-adjustedreturn=N-dayreturn–N-day
returnforSPYThis adjustment is not
perfect. Theoretically, youwant to adjust the return foryour strategy by the returnyou would have received ifyou invested in the averagestock that has the same risk.Wescreenedcompaniesusingminimum volume andminimum dollar volume
criteria (as described inChapter 3, “The Occurrenceof Gaps”) to avoid thinlytraded, illiquid stocks.Although we removedextremely small and illiquidcompanies from the sample,stocks that have a smallermarketcapitalizationthanthestocks in theS&PSmall-Cap600 remain in the sample.Thus, the sample containsstocks with a wide range ofmarket capitalizations.
Academics will be quick topointoutthattheriskmetricsofapoolofstockswithsucha wide range of marketcapitalizationarenotidenticalto those of SPY; thus, theadjustmentmadeinthisbookfor market returns is notperfect.Use extra care when
interpreting market-adjustedreturns during a marketdownturn. The market-
adjusted return is an attemptto tell how much better astrategydid than investing instocks randomly does. If themarket falls 20% and youfollow a strategy that loses5%, you have outperformedthe market. Your marketadjustedreturnwouldby–5%–(–20%)or15%!Ofcourse,an investorwould rather lose5% than 20%, but a 5% lossisanegativereturn.Don’tgetmisled by positive market-
adjusted returns in a marketdownturn; any negativereturns result in a loss ofcapital, something you wanttoavoid.Theseissuesarementioned
in the interest of fulldisclosure.Themarket returnadjustmentmadeinthisstudywas simple and has itsproblems,but itdoesprovidesome additional, usefulinformation.
Table 4.2 shows themarket-adjusted returns forthe data presented in Table4.1. Although the 1-dayreturn for down gaps was –0.0204, the market-adjusted1-dayreturn is–0.0507.Thatthe market-adjusted return islower than the nonadjustedreturn indicates the overallmarket was moving higherthe day after the down gap.Thus, purchasing the stockthat down gapped not only
resulted in a negative 1-dayreturn, but it also meant anopportunity cost of notreceiving the positive returnthat would have resulted ifthatmoneyhadbeeninvestedinthemarketportfolio.
Table4.2.AverageMarket-AdjustedReturnsforStockswithGaps,1995–
2011
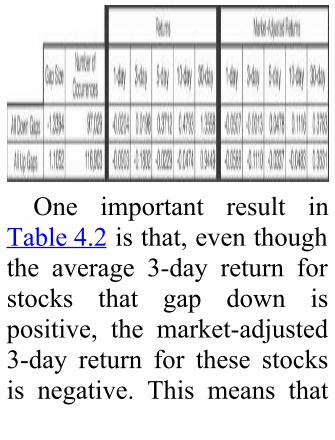
One important result inTable4.2isthat,eventhoughthe average 3-day return forstocks that gap down ispositive, the market-adjusted3-day return for these stocksis negative. This means that
purchasing a stock that gapsdown at the open on Day 1andholding it for 3 days, onaverage, results in a profit,but the profit is smaller thanwhatwouldhavebeenearnedif you had invested in themarketportfolio.The numbers presented in
Table 4.2 are averages ofmanyobservationsovera17-year time frame. The overallmarket conditions in the late

1990swereradicallydifferentthantheyhavebeensincetheturnofthecentury.Chapter3noted that gaps had becomemore common in recentyears. This leads to thequestion of whether theaveragingofsomuchdata inTable 4.2 masks someunderlying, important trends.To better understand howstabletheseresultshavebeenover time, the returns arebroken down by year. Table
4.3presents returns fordowngaps by year from 1995through 2011. Negativenumbersarelightlyshadedtodiscernpatternsmoreeasily.
Table4.3.ReturnsforDownGapsbyYear,1995–
2011
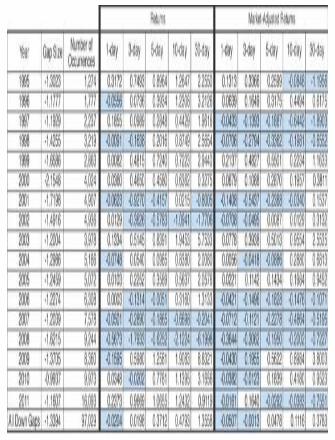
The results in Table 4.3highlight some of thedifferences in consideringnominal returns versusconsidering market-adjustedreturns. Look at 1997. Thenominal returns forpurchasingastockattheopenthe day after it gaps arepositive for all the holdingperiods, yet the market-adjusted returns for allholding periods are negative.
The market, as measured bytheS&P500, roseby33.36%in 1997. Although the pricesof stocks that gapped downreversedbythenextday,theytendednot toriseasmuchasother stocksover thenext30tradingdays.Asimilar resultoccurredin2011.In2011,theS&P500 roseonly2.05%, soa bull market cannot be theexplanation for the negativemarket-adjusted returns. Asyoucanseewhenyoulookat
market conditions moreclosely in Chapter 8, “Gapsand the Market,” 2011 wascharacterized by someextremepricemoveswithinatrading range without muchdirectional movement.Interestingly, although thesize has changed, the 1-daymarket-adjusted return fordowngapshasbeennegativeeachofthelast6years.Theresultsforupgapsare
brokendownbyyearinTable4.4. The nominal returns forall holding periods werenegativeforfouroftheyears:2002, 2007, 2008, and 2011.The market-adjusted returnsfor all holding periods werenegative for 5 years: 1995,1996, 2006, 2007, and 2011.The nominal returns for allholdingperiodswerepositivefor three of the years: 1995,2009,and2010;theonlyyearinwhich themarket-adjusted
returns were all positive was2009.
Table4.4.ReturnsforUpGapsbyYear,1995–2011
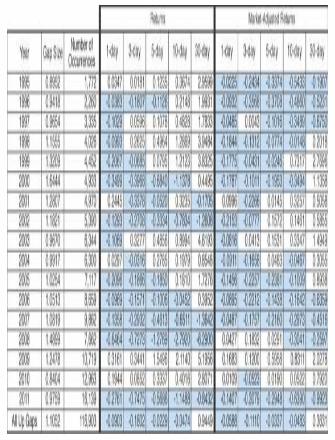
Theupgapresultsfor1995are particularly striking; allthe nominal results arepositive, but all the market-adjusted returns for that yearwere negative. The average30-day nominal return forpurchasingastockonthedayafteritgappedupwas2.9599,whichisabout27.52%onanannualized basis. However,theS&P500gained37.8% in1995. Thus, even though
stocks that gapped up sawcontinuation in upward pricemovement, theydidnot rallyas much as the broadermarket. When the gainsearned from investing in thestocks that gapped up arecompared to the opportunitycost of not being invested inthe broader market in 1995,the market-adjusted returnsarenegative.Another year that is
particularly interesting is2009 in which nominalreturns and market-adjustedreturnswereallpositive.Thenominalreturnsin2009wereremarkably high. The 5-dayreturn of 1.5496 translatedinto an annualized rate of115.73%. The 10-day returnof 2.114 is equivalent to anannualizedrateof68.7%;the30-dayreturnof2.8071isanannualized rate of 52.51%.Investors purchasing a broad
portfolio of stocks, asmeasured by the S&P500,earned 26.46% that year.Thus, aportionof theprofitsearned by an investorpurchasing stocks after theygapped up were attributed tothe bull market, but thisaccountedforonlyabouthalfof the profits. It appears thatgap ups signaled whichstocks would outperform themarketin2009.Althoughnotasstrong,youcanseesimilar
resultsfor2010.
ExtremeValuesExtreme values in any set
ofdataarealwaysinteresting.From an investing standpointthe extreme values areespecially intriguing. Whattrades would have been themost profitable?What tradeswould have been the leastprofitable? Would itreasonably have been
possible to spot theseopportunities beforehand?What can be learned forfuturereference?The extreme cases
presented in this chapter arefrom2011.Thisisdoneforacouple of reasons. First, it isthe last year in the sampleand therefore is of particularinterest as the most currentyear in the study. Second, inChapter 3 you saw that the
frequency of gaps has beenincreasing over the years; inTable 3.1 you saw that with32,232 gaps, 2011 had morethan any other year in thesample.Withthatmanygaps,surely some interestingextremeexamplesexist.First, consider the stocks
thatwereextremeintermsofthe number of gaps. Twostocks tied for the highestnumber of down gaps in
2011; both Resmed Inc.(RMD) and Unisys Corp.(UIS) had 25 down gaps in2011. With approximately250 trading days in a year,that means that RMD andUIS were experiencing adown gap on about 10% ofthe trading days. RMD,shown in Figure 4.2, makesmedical equipment related torespiratory ailments. UIS,shown in Figure 4.3, is aninformation technology
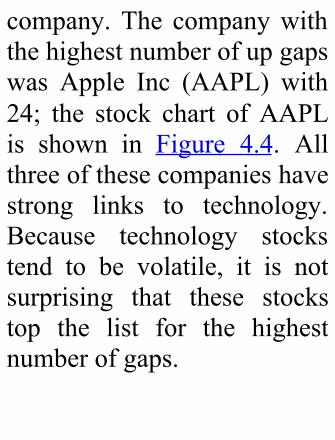
company.The companywiththehighestnumberofupgapswas Apple Inc (AAPL) with24; the stock chart of AAPLis shown in Figure 4.4. Allthreeofthesecompanieshavestrong links to technology.Because technology stockstend to be volatile, it is notsurprising that these stockstop the list for the highestnumberofgaps.
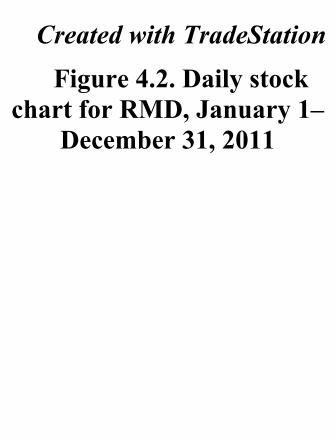
CreatedwithTradeStationFigure4.2.Dailystock
chartforRMD,January1–December31,2011
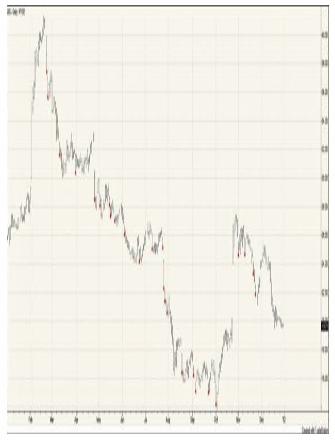
CreatedwithTradeStationFigure4.3.Dailystock
chartforUIS,January1–December31,2011
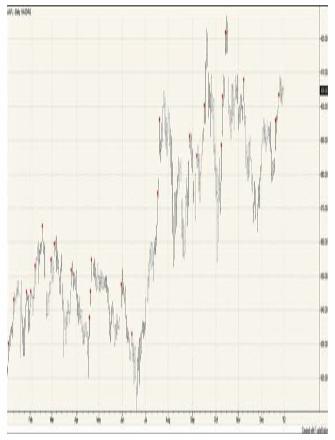
CreatedwithTradeStationFigure4.4.Dailystock
chartforAAPL,January1—December31,2011Stock charts for the three
stockssharesomesimilaritiesbut are quite different. Thehigh number of gaps makesall three charts looksomewhat choppy. The chartfor RMD is especiallyirregular. The gaps create
several large gaps in price.Overall, the stock trendeddown in price over the year,fallingalmost30%,butdidsoin fits and starts. AlthoughRMD experienced at leastonegapdowneverymonthin2011, the stock experiencedan unusually high number ofdown gaps in September. Inthe first 15 trading days ofSeptember, RMD had fivedown gaps. Surprisingly, thestock also had two up gaps
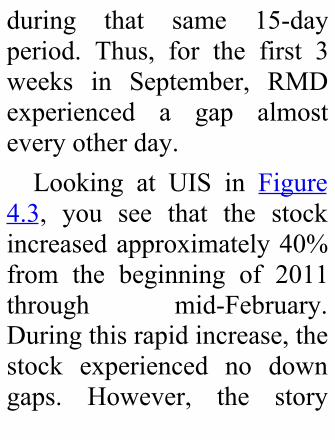
during that same 15-dayperiod. Thus, for the first 3weeks in September, RMDexperienced a gap almosteveryotherday.Looking at UIS in Figure
4.3, you see that the stockincreasedapproximately40%from the beginning of 2011through mid-February.Duringthisrapidincrease,thestock experienced no downgaps. However, the story
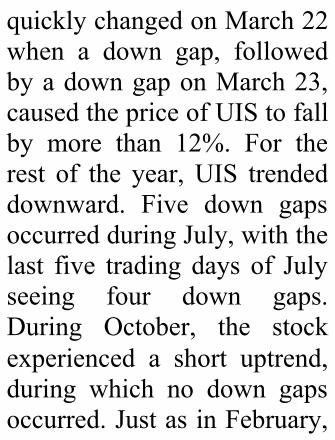
quicklychangedonMarch22when a down gap, followedbyadowngaponMarch23,causedthepriceofUIStofallby more than 12%. For therest of the year,UIS trendeddownward. Five down gapsoccurredduringJuly,withthelast five trading days of Julyseeing four down gaps.During October, the stockexperienced a short uptrend,during which no down gapsoccurred.JustasinFebruary,
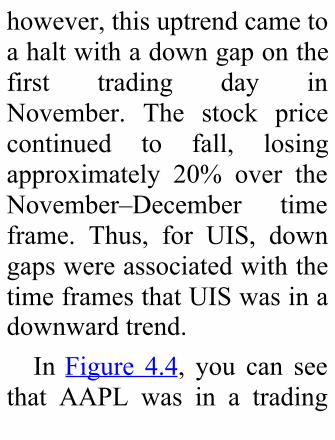
however,thisuptrendcametoahaltwithadowngaponthefirst trading day inNovember. The stock pricecontinued to fall, losingapproximately 20% over theNovember–December timeframe. Thus, for UIS, downgapswereassociatedwiththetimeframesthatUISwasinadownwardtrend.InFigure 4.4, you can see
that AAPL was in a trading
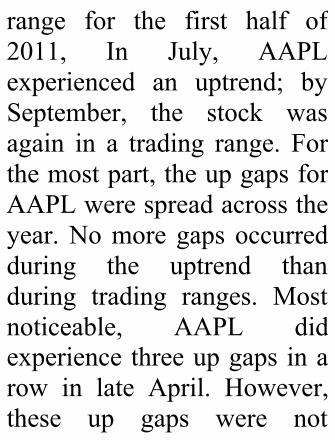
range for the first half of2011, In July, AAPLexperienced an uptrend; bySeptember, the stock wasagain in a trading range. Forthemostpart,theupgapsforAAPLwerespreadacrosstheyear.Nomoregapsoccurredduring the uptrend thanduring trading ranges. Mostnoticeable, AAPL didexperiencethreeupgapsinarow in late April. However,these up gaps were not
enough topush the stockoutofthetradingrange.
ProfitableTradingExamplesNow consider some
particular gap trades thatwould have been highlyprofitable. In particular,which trades were the besttrades in 2011? The singlebest 10-day trade after adowngapwouldhavebeento
buy Clearwire Corporation(CLWR) after its August 8down gap. Clearwire is aninteresting company. It has a4G mobile broadbandnetwork that extends acrossmuchoftheUnitedStatesandreachesaboutone-thirdoftheU.S.population.Itsserviceisbranded CLEAR in most ofits markets. CLWR wentpublic with its March 2007IPOatapriceof$25.Bytheend of 2008, the price was
hovering around $4. InSeptember 2009, its pricerecovered to more than $9.For the next year CLWRtraded in a $6–8 range. InOctober2010,thepricebegana steady descent from about$8, dipping below $2 for thefirsttimeinAugust2011.Asshown in Figure 4.5, onAugust 8, 2011, the stockgapped down closing at$1.52. However, there was adramatic turnaround at that
point.The10-dayreturnfromtheopenonAugust9wasanamazing94%.
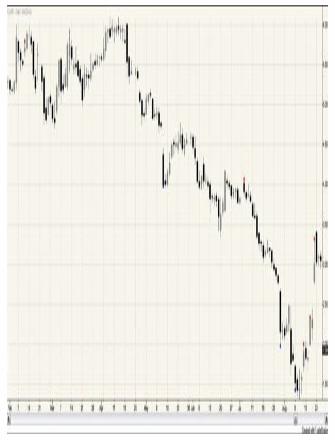
CreatedwithTradeStationFigure4.5.Stockchart
forCLWR,January31—August24,2011
Hindsight is always 20/20.Nowit iseasyto identify theAugust 8 down gap as anexhaustion gap. But, werethere clues that might havepointed someone to a buydecision around that timeperiod?Thestockhadgapped
down three times in thepreceding 3 months—onApril 27, May 12, and July28. In the 25 trading daysbetweenJuly5andAugust8,the stock had black candleson all but 5 days. It wasdefinitelyonabadroll.What was happening with
CLWR? Revenue had gonefrom $20 million in 2008 to$557 million in 2010. In2011, the companywas on a
pathtopushrevenuetomorethan$1billion.However, thecompany was still incurringdramatic losses. Thecompany had been makinglarge investments in plant,property, and equipment. Italso had more than $800million in cash at the end ofJune.At the time, the company
was receiving some mentionin the press due to Raj
Rajaratnam’s insider tradingtrial. On May 11, a Forbesarticle titled “I KnewRajaratnam Was a CrookAfter He Tried to Sell MeInsider Info” contained thisparagraph:
Clearwire(CLWR)wasoftenmentionedinthereportingonthistrialasanotherentityaboutwhich
Intel’sinvestmentwasmadeknowntoRajbeforeitwasmadeknowntothegeneralpublic.TheClearwireconnectionconcernedthebuildingofanationwideWi-Finetworkwhichatthismomentremainsthefastestnetworkextant.
Evenifyouownanew4Gphone(Iboughtonelastweek),theywilltellyouinthephonestoretouseWi-Fiifitisavailablebecauseitissomuchfasterthananycellularconnection.2
The company was gettingattention for its fast Wi-Fi
networkbut in thecontextofan insider trading trial. Theformer was clearly goodpress.However,thelatterwasnot. No company, regardlessofthefactsofthecase,wantsto be mentioned inconnection with insidertrading. This may have beenan additional factor draggingthe stock price down. OnMay12,thecompany’sstockdroppedby15.6%.
Couldastuteinvestorshaveput all this informationtogether and bought at theopen on August 9? If theyhaddonethat,theymightnothave kept their positionthrough theday. It openedat1.56, reached a high of 1.62,hit a lowof 1.35, and closedat1.42.Thetrademighthavebeen stopped out. The stockwasalsoquitevolatileonthe10th,with a range from1.32to 1.68, closing at 1.44. But,
here’swhere thingsgetmoreinteresting. On the 11th thestock closed at 1.59. On the12th it gapped up, closing at1.91.With its secondup gapin 4 days on the 17th, itclosedat2.33.Twodayslateritgappedupagainandclosedat3.01.Evenifinvestorshadwaited to buy until after the2ndgapupduringthisperiod,they could have caught themove from the open on the18th at 2.21 to the close on
the 19th at 3.01; that wouldhavebeena36%gain.Buying on the 9th would
have been betting on areversal. Going long afterobserving a gap up on eitherAugust 12 or August 17would have been pursuing acontinuationstrategy.Sohowdoyoureconcilethiswiththeobservation that a reversalapproach generally seems tobe more profitable? This
book is about trading gaps.Although the authors presentevidence that points towardthe advantage of a reversalapproach in general, it isn’tappropriate in every case. Inthis particular case CLWRhad continued its downwardmarch after the three downgaps on April 27, May 12,and July 28. It also closeddownon theAugust 10 afterthe down gap on the 8th.After the up gap on the
August12,thepricewentup.Therewascertainlyacase tobemadetouseacontinuationapproachoneitherAugust12or the August 17. If youthrow in the other factors(rapidly rising revenue,building a leading edgenetwork, lots of cash on thebalance sheet, and someunfortunate linkage to aninsider trading case), therewere some good reasons tosuspect that perhaps it was
about time for the 4-monthmarch from $6 to $2 toreverse course. There waseven one more factor; onAugust 10 the companyannounced that the chiefoperating officer waspromoted to president andCEO and that the company’schairman and interim CEOwas becoming the executivechairman of the board ofdirectors. There were someimportantchangesoccurring.
Trading the August 18down gap for UniversalDisplay Corporation (PANL)had the highest 5-day returnfor any down gap in 2011.PANL engages in theresearch, development, andcommercialization of OLEDtechnologiesandmaterialsforuse in flat panel display.Figure4.6illustratesthepricemovement of PANL fromDecember 2010 throughSeptember 2011. Over a 4-
monthtimeperiod,December2010 through March 2011,PANL doubled in price.Following this 4-monthuptrend, a 4-monthdowntrend ensued. Thisdowntrendwas just as strongas the uptrend, and PANLlost more than half of itsvalue. On August 8, PANLclosed below $25 per share,ending the downtrend. ByAugust 15, PANL hadreached $36, representing
more thana40%gainovera1-week time period. Thisprice increaseappeared tobefueledbybetterthanexpectedsales and profit numbers.However,theenthusiasmwasshort-lived, within 3 daysPANL dropped back downbelow $28 a share. At thetime, someone watching thestock and seeing the downgaponAugust18wouldhaveeasilythoughtthatPANLwasstill in a downtrend. In
hindsight, thatdowngapwasa great buying opportunity.Enthusiasm for PANLquickly returned as alicensing agreement withSamsung was announced onAugust 23. Buying PANL atthe open on August 19, theday following the gap, andholding the stock for 5 dayswould have resulted in a69.5% return; holding thestockfor10dayswouldhaveresultedina77.7%return.
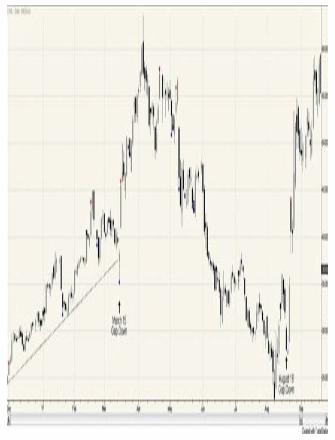
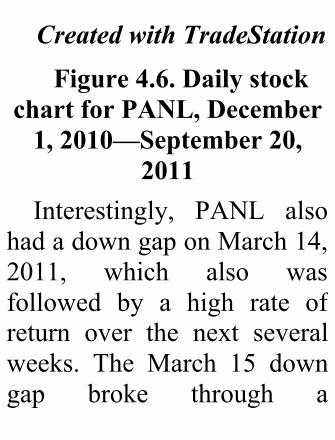
CreatedwithTradeStationFigure4.6.Dailystock
chartforPANL,December1,2010—September20,
2011Interestingly, PANL also
hadadowngaponMarch14,2011, which also wasfollowed by a high rate ofreturn over the next severalweeks. The March 15 downgap broke through a
significant trend line,suggesting an end to theuptrend. However, thefollowingday,PANLgappedup and continued in an evensteeperuptrend.Thus,bothofthese profitable tradingopportunitieswerearesultofadowngap,whichatthetimesuggested a change in trend,but in hindsight were afabulousbuyingopportunity.You looked at several of
the most profitableopportunities for going longafter a down gap in 2011.These were basicallyopportunities in which thedown gap price movementquickly reversed after thedown gap. Now considersome of the most profitabletrading opportunitieswith upgaps.On October 17, 2011,
Cheniere Energy Inc. (LNG)
experienced a gap up. AninvestorwhopurchasedLNGthefollowingdaywouldhavemade a 91.6% gain in 10days. LNG builds andoperates liquefiednaturalgasterminals and pipelines. AsFigure4.7shows,theOctober17 gap was not spectacular,and nothing much happenedto the stock price over thenext week. The storychanged, however, onOctober 26, when the stock
gappedupagain, this time ina spectacular move. Themarket stock price openedapproximately 75% higher,and even though it moveddown somewhat during theday,agapofmore than$2ashareremained.Thepricedidcontinuetoriseover thenextfew days, contributing to the91.6% 10-day return, but thesubstantial price move onOctober26accountedfor themajorityofthegain.Whydid
the big price jump occur onOctober26?LNGannounceda major deal with a Britishenergy firm to exportliquefied natural gas out oftheUnitedStates.
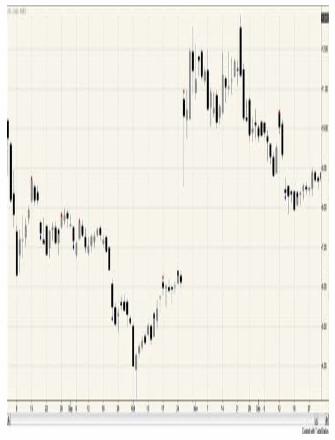
CreatedwithTradeStationFigure4.7.Dailystock
chartforLNG,August3—December31,2011
Figure4.8containsastockchart for OptimerPharmaceutical,Inc.(OPTR).The stockenteredanuptrendinmid-August. As this trendcontinued,anupgapoccurredon September 7. Pricecontinued to move up,
resulting in a 21% 5-dayreturn and a 53% 10-dayreturn for investors whobought the stock at the openon September 8. From atechnicalstandpoint,thisisaninteresting gap. Althoughmany of the stocks that sawincredibly high returns afteran up gap were buyouttargets, OPTR does not fitinto this category.Therewasan increasing interest inOPTR. The company
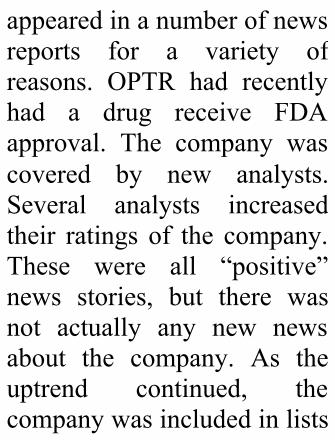
appearedinanumberofnewsreports for a variety ofreasons. OPTR had recentlyhad a drug receive FDAapproval. The company wascovered by new analysts.Several analysts increasedtheir ratings of the company.These were all “positive”news stories, but there wasnot actually any new newsabout the company. As theuptrend continued, thecompanywasincludedinlists
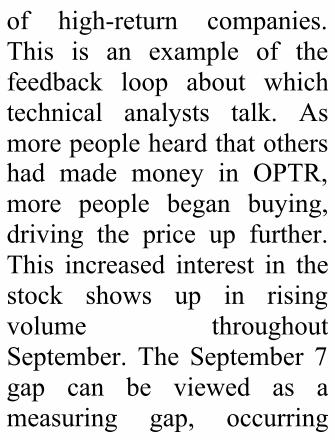
of high-return companies.This is an example of thefeedback loop about whichtechnical analysts talk. Asmorepeopleheardthatothershad made money in OPTR,more people began buying,driving the price up further.This increased interest in thestock shows up in risingvolume throughoutSeptember. The September 7gap can be viewed as ameasuring gap, occurring
about halfway up the priceincrease.
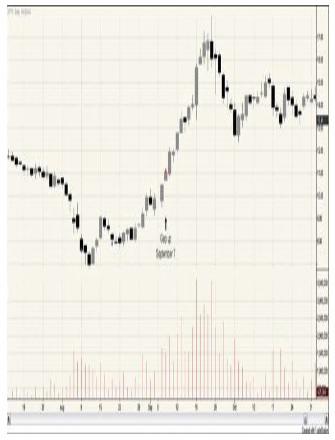
CreatedwithTradeStationFigure4.8.Dailystock
chartforOPTR,August12—November1,2011
SummaryThis chapter explained a
methodology for calculatingthe returns for gap tradingstrategies. You saw thatimmediately after a gapoccurs, whether it is a down
gaporanupgap,price tendstomove lower. These resultshold whether looking atnominal returns or market-adjusted returns and suggestfollowing a shorting strategyimmediately after a gap.However, price movementquickly reverses, especiallyfor gap down stocks,suggesting that a longstrategy is more likely to beprofitableoverlongerholdingperiods. As you continue
through this book, you willlookathowtheconsiderationof additional variables, suchas volume, price movementprior to the gap, and overallmarket measures, mightincrease the profitability oftradingwhenagapoccurs.
Endnotes1.Thechanceofflippingaheadonasinglecointossis
1/2.Thechanceofflippingtwoheadsinarowis1/4;sooutoffourpeople,onepersonwill,onaverage,fliptwoheadsinarow.2.Lapping,Joan.IKnewRajaratnamWasaCrookAfterHeTriedtoSellMeInsiderInformation,”

ForbesOnline,www.forbes.com/sites/joanlappin/2011/05/11/i-knew-rajaratnam-was-crooked-after-he-tried-to-sell-me-insider-info/.
Chapter5.GapsandPreviousPriceMovement
For a gap to occur,obviouslytheremustbepricemovement from one day tothe next. A gap up occurswhen today’s low is higherthanyesterday’shigh.Soonagap up there had been anupward jump in price at theopen. But what happened
during the day of the gap?Did the stockclosehigherorlower than the open? If theclosing price is higher thantheopeningprice,youwouldchartitonacandlestickchartwith a white candle body. Ifthe close is lower than theopen, the candle body isshaded black. This chapterexamines the significance ofthecandlecoloronthedayofthe gap, which is referred toasDay0,andthecandlecolor
thedaybeforethegap,whichisreferredtoasDay–1.Chapter 2, “Windows on
Candlestick Charts,” focusedon traditional candlestickpatterns that contained gaps,orwindows.Theseshort-termpatterns often considered thecolorofthecandleonthedayof thegapandthecolorsandpositionsofthecandles1or2days after the gap. Theanalysis in this chapter is
different in that the pricemovement leading up to thegapandonthedayofthegap,rather than after the gapoccurs,isexamined.
GapDayCandleColorTherearesixbasicgapday
cases to consider—threedown gap possibilities andthreeupgappossibilities:
1.Ifastockgaps
down,andthepricecontinuestofallthroughouttheday,thecandleforthegapday,Day0,isblack.Inthiscase,thepriceseemstobetumblingdown.2.Astockgapsdownandthepricemovesupduringtheday,butnotenoughtofillthe
initialvoidonthechart.Inthiscase,thecandleonDay0iswhite—perhapsindicatingthatthedownwardfallseenattheopenhasreversed.3.Astockgapsdownwiththeopeningandclosingpricebeingidentical,resulting
inadojionDay0.4.Astockgapsup,butthepricemovesbelowtheopenthroughouttheday,closingatapricehigherthanthepreviousday’shighbutlowerthanthatday’sopen.Thispriceactionresultsinanupgapwithablackcandleonthe
dayofthegap.5.Astockgapsupwithawhitecandle.Whenthisoccurs,thepricejumpsupattheopenandcontinuestomovehigherduringtheday.6.Thestockgapsupwiththeopeningandclosingpricebeingidentical,
resultinginadojionDay0.
Table 5.1 summarizesresults for each of these sixcombinations. Eighty-one-and-one-half percent of gapdowns are associated with ablackcandleonthedayofthegap. Although these downgaps aremore common, theytend to be small in size,1.24%, relative to the whitecandle down gaps that
average1.84%.Thedayof adowngapisadojionly1.3%of the time; although theseare rare, they are the onlygaps that have a positive 1-day return. The nominal andmarket-adjusted returns forbuyingastockattheopentheday after a downwardgapping doji occurs are allpositive. Another interestingresultabout thedowngapsisthat the 1-day and 3-daynominal returns for thewhite
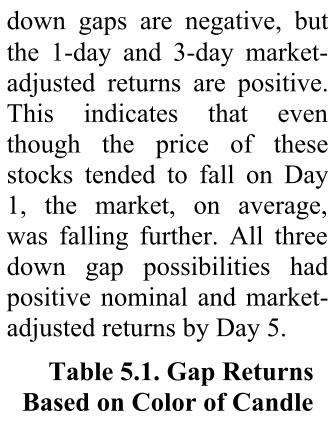
down gaps are negative, butthe 1-day and 3-day market-adjusted returns are positive.This indicates that eventhough the price of thesestocks tended to fall on Day1, the market, on average,was falling further. All threedown gap possibilities hadpositivenominal andmarket-adjustedreturnsbyDay5.
Table5.1.GapReturnsBasedonColorofCandle
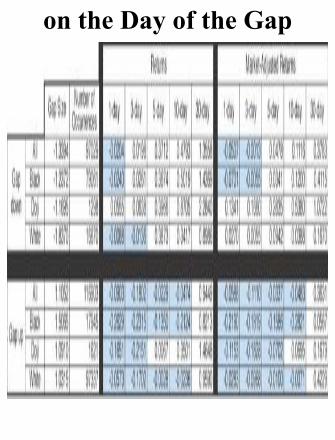
ontheDayoftheGap
Unlike the gap downs,which are primarily blackcandle gaps, gap ups tend tooccur on white candles.Eighty-three percent of thegap up candles were white.However, at an average sizeof 1.03%, these gap upstended tobe smaller than theblack candle gap ups thataveraged1.51%.Itisrareforthecandleonthedayofagapuptobeadoji;lessthan1.4%ofthegapupsoccurasadoji.
The black candle and thewhite candle gap ups werealike in that they both hadnegative returns through the10-day holding period andpositive returns for the 30-dayholdingperiod.Thewhitecandlegapups,however,didnotreversedirectionasmuchonDay 1 and had larger 30-dayreturns.
PreviousDayCandle
ColorIf you also consider the
candlecoloronDay–1,thereare18possiblecases.Eachofthe6casesjustdiscussedcanbeprecededbyeitherawhite,black, or doji candle day.Table 5.2 reports the resultsfor the 9 possible cases thatcan occur when the gap isdown, and Table 5.3 reportsthe results for the 9 possiblecasesthancanoccurwhenthe
gapisup.AdesignationsuchasBUW is the notation usedfor Black-Up-White andmeans that Day –1 was ablack candle, andDay0wasa gap up white candle day.The other 17 cases aredesignated in a similarmanner.
Table5.2.GapReturnsBasedonColorofCandleonDay–1andDay0for
DownGaps
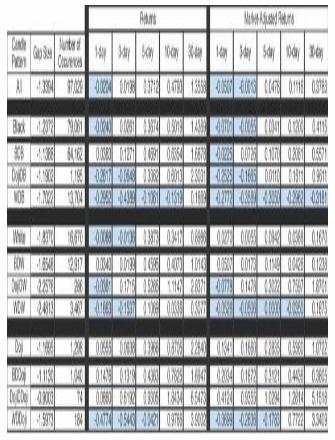
When looking at the 18possible 2-day patterns,which occurs most often?Thirty-seven percent of allgaps follow the White-Up-White pattern. Thus, overone-third of all gaps seen inthe market occur on strongupwardpricemovement.ThepricemovesupwardonDay–1, jumps up at the open onDay 0, and then continuesupward to close higher for
Day 0. These gaps average,however, a smaller size thanfor any of the other 17combinations except for theextremely rare Doji-Down-Dojipattern.The second most
commonly occurring 2-daypattern is the Black-Down-Black pattern. Twenty-ninepercent of the gaps followthis pattern. Like the White-Up-White pattern, theBlack-
Down-Black pattern alsoindicates strong pricemovement, just in adownward direction. Theprice moves lower duringDay–1,thepricejumpslowerat the open on Day 0, andthenthepricecontinueslowerduringtradingonDay0.Together, the White-Up-
White and Black-Down-White patterns account fortwo-thirdsofthegapsseenin
the stock market. What arethe rarest patterns to see?GapsthathaveadojionDay–1 or Day 0 rarely occur.Only 3% of the gaps have adoji on either of these days.Of those patterns that do notincludeadoji, theBlack-Up-Black and the White-Down-White patterns are the leastcommon. Less than 2% ofgaps follow the Black-Up-Black pattern, but these rareup gaps provide the largest
sized up gaps. Slightly rarer,the White-Down-Whitepattern has the largest gapsize, 2.48, of any patterncombination.Now look more closely at
the returns for down gapspresented in Table 5.2. Asyou saw earlier, down gapsthatoccurwithablackcandleaverage a 1-day return of –0.0240. Looking moreclosely,however,youcansee
that this negative return isgreatly influenced by thoseblack candle down gapspreceded by a white candleon Day –1. Only 17% ofblack candle down gaps arepreceded by a white candle,but the White-Down-Blackpatternhasa1-dayreturnof–0.2952, the lowest of any ofthe 2-day candle down gapcombinations, except theWhite-Down-Doji pattern.The gap down black candles
preceded by a black candleactuallyhaveapositive1-dayreturn of 0.0383. The Black-Down-Black pattern occurswhen the price moves lowerduring the day on Day –1,jumps down at the open onDay 0, and then continuesdown further during the dayto form the second blackcandle. This pattern seesimmediate reversal, withpositive 1-day returns. Thisupward price continues,
resulting in theBlack-Down-Black having the highest 5-day, 10-day, and 30-dayreturns of any of the nondojigap patterns considered. Theresults for the White-Down-Black pattern are muchdifferent; positive returns donot occur until the 30-dayholdingperiod;eventhen,the30-dayreturnof0.1869isthesmallest of any of the gappatterns, and the market-adjusted return is still
negative.Interestingly, you can see
similar results for the gapdownwhitecandlepatternsasyou did for the gap downblack candle patterns. Onaverage, when a stock gapsdown on a white candle, the1-day and 3-day returns arenegative. This remains truewhen the day before the gapis a white candle day,resulting in theWhite-Down-
Whitepatternhavingnegative1-dayand3-dayreturns.Thisisnotthecase,however,withthe much more frequentlyoccurringBlack-Down-Whitepattern.FortheBlack-Down-Whitepattern,thereturnsandmarket-adjusted returns forallholdingperiodsconsideredarepositive.Table 5.3 presents results
forupgaps.Whenallupgapsare lumped together, when
black candle up gaps areconsidered as a group, andwhen white candle up gapsare grouped together, the 1-day,3-day,5-day,and10-dayreturns are all negative.AddingthecoloroftheDay–1 candle refines the results abit. If Day –1 is a whitecandleday,theresultsdonotchange, but if Day –1 is ablack candle day, you see aslightly different story. Forthe Black-Up-White, the 1-
day return is 0.0810, thehighestforanyofthenondojipatternsconsidered.
Table5.3.GapReturnsBasedonColorofCandleonDay–1andDay0forUp
Gaps
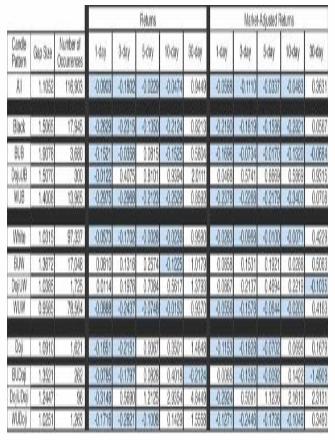
Thus, Day –1 color doesseem to matter. The generalresultssuggestthatshortingastock the day after it gapscould be a profitable tradingstrategy.However, if thedaybefore the gap were a blackcandle, the results in Tables5.2 and 5.3 suggestconsideringalongposition.
DramaticPriceMoveExamples
Now consider somespecificexamplesofdramaticprice movements that followcommon Black-Down-Blackand White-Up-Whitepatterns. By September 15,2008,American InternationalGroup (AIG) was alreadyspinning wildly out ofcontrol. In December 2000,AIG peaked at more than2000. By the beginning of2002, AIG had fallen below1500. For about the next 5
years,AIG traded in a rangeroughly between 1000 and1500. AIG closed February2008below1000forthefirsttimesinceFebruary2003.Bymid-May, AIG had fallenbelow 800. AIG’s steadydecline throughout thesummer of 2008 is shown inFigure5.1.
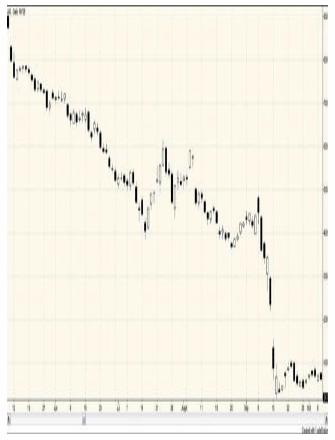
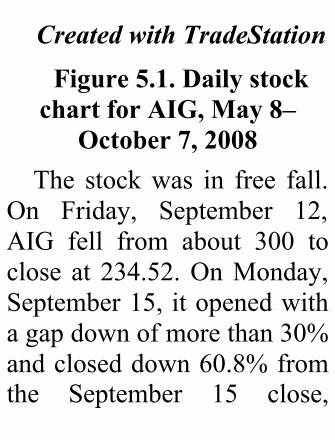
CreatedwithTradeStationFigure5.1.DailystockchartforAIG,May8–
October7,2008The stockwas in free fall.
On Friday, September 12,AIG fell from about 300 toclose at 234.52.OnMonday,September15, itopenedwithagapdownofmorethan30%andcloseddown60.8%fromthe September 15 close,
forming a Black-Down-Black. On September 16,AIG opened at 37, downdramatically from thepreviousday’scloseof95.20.But,September16turnedouttobeadramaticreversalwiththestockclosingat75—morethan a 100% increase in oneday!People who say that the
stock market is boring justhaven’t looked closely
enough. Take Jammin JavaCorporation (JAMN) inMay2011, for instance. If thecompany’s name and tickersymbol make you think ofBob Marley and reggaemusic, there’sagoodreason.JamminJavawasfoundedbyRohanMarley,sonofthelateBob Marley and a starlinebacker at the Universityof Miami in the early ’90s.OnJanuary10,2011JAMN’stotalvolumewasawhopping
500 shares and thepricewas51 cents. On May 12, thestock gapped up with theprice hitting a high of 6.35per share and closing at 5.42on volume of more than 20million shares (see Figure5.2). The rise was meteoricgoingfromabout1pershareinMarch to the high of 6.35inlessthan2months.
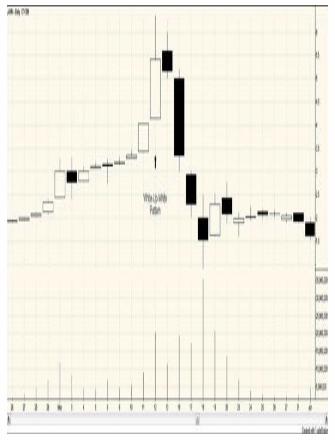
CreatedwithTradeStationFigure5.2.Dailystock
chartforJAMN,May26–June1,2011
But, on May 13, thingsbegan to unravel with fourconsecutive black candledays. The stock fell from anopening price of 5.59 on the13th to a close of 1.52 onMay 18, experiencing anintraday low of 92 cents on
the 18th. JAMN’s pricemovement provides anexampleofwhattheresultsinthis chapter suggest is atypical price movement aftera White-Up-White patternoccurs. Investors whopurchasedJAMNat theopenthe day after the gap wouldexperiencenegative1-day,3-day, 5-day, and 10-dayreturns.On June 14, 2011, JAMN
fell below 2; it closed theyear at 27 cents per share.What caused this wild ride?Theanswerisn’tclear,butinSeptember there were newsreports that the SEC wasinvestigating a possibleillegalonlinepumpanddumpscheme.Thecompany issueda statement on September 9saying that they had becomeaware of some unauthorizedInternet stock promotion inMay and that Rohan Marley
strongly condemned suchactions.Thecompanyvowedto cooperate fully with theSECinvestigation.JAMN wasn’t the only
coffee company with a wildride in 2011.CoffeeHoldingCompany, Inc. (JVA) begantheyearat3.85andendedtheyear at 7.84, an increase ofmore than 100%. However,thatwasnothingcomparedtowhat happened in between
thosedates.OnJuly11,2011,the stock hit a high for theyearof30.98,gappingupona White-Up-White pattern(see Figure 5.3).An investorwho saw this pattern mighthavereasonedthatthestock’striplinginpriceoverthepriormonth was an unsustainableuptrend.Thinkingthiswasanexhaustion gap, the investormight have shorted the stockat the open on July 12 at29.54 and enjoyed the fall
that same day to a close of22.37. The next 2 days werealso black candle days withthe stock closing at 18.89 onJuly14.
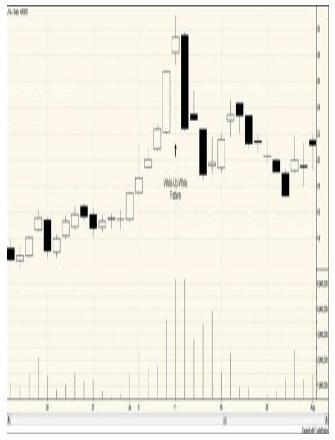
CreatedwithTradeStationFigure5.3.Dailystock
chartforJVA,May14–August1,2011
SummaryGaps have generally been
thought of as signaling astrongdirectionalpricemove.Traditionally, traders havelookedforbreakawaygapsasa signal that a new trend in
the direction of the gap hasoccurred. In addition,measuring gaps signal thatthetrendisgoingtocontinuein the direction of the gap.Among those who practiceJapanesecandlestickcharting,the adage is “go in thedirectionofthewindow.”Theresultsshowthatprice
movement does tend tocontinue downward when adowngapoccurs,butonlyfor
aboutaday.Youmightthinkthat spotting a black candlefollowed by another blackcandle thatgapsdownwouldbe an ominous sign; thismight mean that downwardprice movement is gainingmomentum. However, theresults show that when ablack candle on Day –1 isfollowedbyagaponDay0,price movement tends toreverse to an upwarddirection on Day 1, and this
upward movement continuesfor at least 30 days. Thissuggests that the downwardgap was an overreaction andthepricefelltoofar.Likewise, you might think
that an up gap, especiallywhen it occurs in a White-Up-White pattern, suggestsstrong upward pricemomentum.Again,theresultsbring this traditionalreasoning into question.
Stocks tend to reversedirection and have negativereturnsforacoupleofweeksfollowinganupgap.
Chapter6.GapsandVolume
The previous chapterfocused solely on pricemovement. Price is alwaysthe most important variablestudiedbyatechnicalanalyst.After all, it is a change inprice that enables a trader toprofit. This chapter addsanother variable, volume, tothe analysis. Volume is
simply the number of sharestraded over a specific timeperiod,usuallyaday.Volume is the oldest
confirming indicator used bytechnical analysts. In 1935,H.M. Gartley providedgeneral rules regarding howto interpret volume.1Basically, Gartley suggestedthat price change on highvolume tends to occur in thedirection of the trend, and
price change on low volumetends to occur on correctiveprice moves. During anuptrend, higher volume istaken as a sign of active andaggressive interest in owningthe stock.However, during aprice decline, volume mightbe light due to a lack ofinterestinthestock;alackofpotential buyers results inlower trading volume and afallingprice.
A number of indexes andoscillators incorporatevolume. The most well-known volume-related indexis probably On-Balance-Volume (OBV), developedby Joseph Granville in his1976book,ANewStrategyofDaily Stock Market TimingforMaximumProfit.2ChaikinMoney Flow, the MoneyFlow Index, and the ElderForce Index are a few
examples of volume-relatedoscillators.Analystsusetheseindicators to confirm pricetrends.Volumeisasecondaryindicator to price analysis;volume cannot be used as asubstituteforpriceanalysis.When using volume
statistics, volume-relatedsignals are usually notderived from the volumeitselfbutfromachangeinthevolume. Raw volume
numbers measure theliquidity of securities. On atypical day near the end of2011, the volume for Applestock was more than 13million shares. At the sametime, the volume for IBMwas less than 5 millionshares. That Apple had avolume of 13million shares,more than two-and-one-halftimes that of IBM, is notmeaningful by itself.Knowing that IBM had a
volume of 10 million shareson a particular daywould behelpfulinformationbecauseitwouldrepresentadoublinginvolume. If this happened asthe price gapped up, youwould say that the increasedvolume confirmed the pricemovement. The major focusin this chapter addresses thequestion,“Doesvolumeserveto confirm price movementwhenstocksgap?”
For example, look at thegap shown in Figure 6.1,which occurred on April 21,2005, for NYSE Euronext(NYX). Price movedsignificantlyhigherontheupgapof almost40%,butwhatis so striking is the highvolume that occurred thatday. More than 14 millionshares of NYX traded handsthat day. The volume onApril 21 was more than 110timeshigherthantheaverage
volume for the previous 10days. In the authors’ study,NYXhadthehighestjumpinvolumerelativetothe10-dayaveragevolumeforanystock.
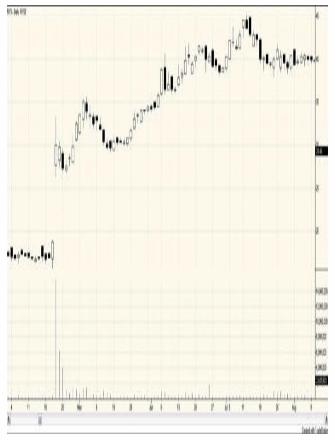
CreatedwithTradeStationFigure6.1.Dailystock
chartforNYX,April1–August9,2005
Gapsandajumpinvolumeare often associated withmajor news, such as theannouncementofamerger,asin the case of NYX. Thesecond highest jump involume relative to a 10-daymoving average of volume
occurred on December 17,1997, when CincinnatiFinancial Corp (CINF)gapped up more than 12%.The reason for this gap upwas not due to specificfinancial considerations forthe company, such as anannouncement of better-than-expected earnings. In late1995, thinking that thecompany was not receivingthe attention of industryanalysts it deserved given its
strong history of financialperformance, CINF beganaggressively marketing itselfto Wall Street. CINF wassuccessful at increasinganalysts’ awareness of thecompany, and in December,1997, was added as acomponent to the S&P500index. The high-volumeDecember 17 gap is a resultof the publicity surroundingthe stock’s inclusion in theS&P500 index and the
purchases of CINF by thosewho manage portfoliosdesigned to mimic theS&P500.Figure 6.2 shows that the
volume for CINF onDecember 17 wasmore than100 times higher than thevolumehadaveragedovertheprevious 10 days. To put thevolume of CINF forDecember 17 in perspective,approximately 50% more
CINF traded hands that daythan IBM shares. Due to theincreasedinterestinthestock,the volume continued to beextremely high for the nextseveraldays.Withinacoupleofweeks, however, the dailyvolume dropped to wellbelow one million. TheincreasedactivityinthestockcausedthestocktogapuponDecember 17, but this wasnot the beginning of anuptrend. The price was back
in itspregaprangeof$35byJune;inlessthan6monthsallthe price movement of thegaphadbeenlost.Thiswasacase in which a reversalstrategy, shorting the stockafter the up gap,would havebeentheprofitabletactic.
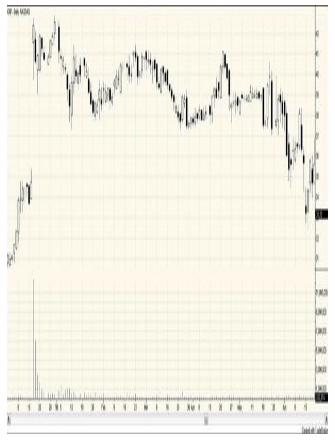
CreatedwithTradeStationFigure6.2.Dailystock
chartforCINF,December1,1997–June19,1998Extraordinarily high
volumecanoccuronadowngap,also,asshowninFigure6.3. On January 5, 2007,Herbalife (HLF) gappeddown on extremely highvolume. The gapwas not anunusually large gap
(approximately 2%), but theprice move that day wassignificant in that HLF lostabout 25% of its value. Thevolume for the day, morethan 22 million shares, wasapproximately 65 timeshigher than the average 10-day volume.What caused somuch selling ofHLF on thatday? The companyannounced that it had lowerthan expected sales growthduring the fourth quarter of
2006 in Mexico, its largestmarket, and that it expectedsalesinMexicotoremainflatin 2007. Volume tapered offover the next few tradingdays, and price remainedbetween 15 and 16 for amonth. Because of thepositive price movement onJanuary8,atraderpurchasingHLFattheopenthedayafterthegapwouldhaveapositive1-day return of 6.07% and amarket-adjusted 1-day return
of 5.80%. On February 5,anothergapoccurredonhighvolume. This time the gapwas up, bringing price up tothe level it was at thebeginning of January. Whatcausedthissecondgap?HLFreceived a buyout offer fromWhitneyVLP,whichownedapproximately 27% of thecompany. Perhaps Whitneywanted to take advantage ofthe price decline of thepreviousmonth,thinkingthat
investors overreacted to thereports in January of lowersalesinMexico.Thisledtoa19.08% 30-day adjustedmarket return for investorswho purchased HLF at theopenonJanuary8.
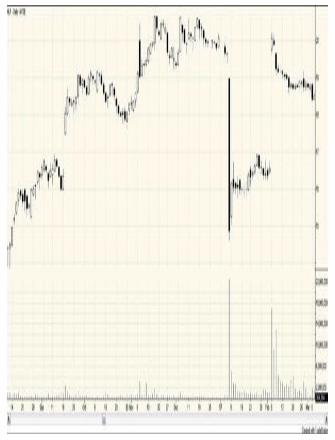
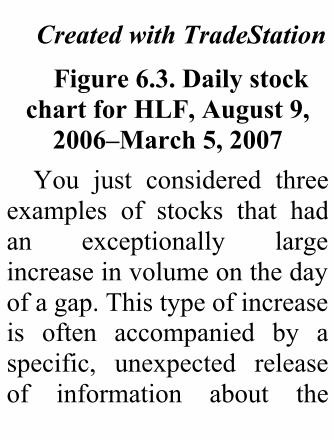
CreatedwithTradeStationFigure6.3.Dailystock
chartforHLF,August9,2006–March5,2007
You just considered threeexamples of stocks that hadan exceptionally largeincreaseinvolumeonthedayofagap.Thistypeofincreaseis often accompanied by aspecific, unexpected releaseof information about the
company, such as FDAapproval for a new drug,concerns about accountingirregularities, or acquisitionpossibilities. Sometimes,however, the increase involume is not so dramatic.News may trickle in over afew days, resulting inincreased volume before theentire story is known. Forexample, rumors of mergertalks may result in increasedinterest in a company over
several dayswith some pricemovement; then, when therumors are confirmed, theprice jumps further on heavyvolume. Or an energycompany’s stock begins tofall as the result of an oilspill; more selling leads tohighervolume.Asmorenewsis released, investors realizethat the spill is worse thanoriginally thought, causingvolume to rise and the pricetofallasmoreinvestorssell.
You need to considerwhether volume is heavierthan normal on the day astock gaps. The questionbecomes, “How do youmeasurenormal?”Youdonotwant to compare the gapday’svolume to thepreviousday’s volume. First, theprevious day’s volume mayalsobehigher thannormal ifinformation is trickling in.Second, the previous day’svolume may not be a good
measure if there is reason tobelieve that it isunrepresentatively low. Insome instances, investorsexpect the release ofinformationaboutacompanyon a particular day. Forexample purposes, supposeMerck is scheduled toannounce its fourth-quarterearnings on Tuesday.Monday, the market forMerck’s stock may be fairlyquiet as investors sit on the
sidelines waiting for thenews. Or the previous day’svolumemaybeunusuallylowdue to shortened holidayhours on the exchange. So,you know that you wouldwant to compare volume onthe day of the gap with the“average” volume for thestock. You can do this bycomparingaday’svolume toamovingaverageofvolume.The shorter the movingaverage to which you
compare the gap day’svolume, the more you canlook for discrete jumps involume.Table 6.1 divides gap
downs by volume relative tothe 3-, 10-, and 30-daymoving averages. As mightbeexpected,moredowngapsoccur on above averagevolume than on belowaverage volume. About two-thirds of the gaps occur on
above average volume.Furthermore, down gaps thatoccur on above averagevolumetendtobelargergapsthandowngapsthatoccuronbelow average volume. Theaveragesizeofadowngapis1.34%;downgaps thatoccuron relatively low volumeaverage only approximately0.6%, whereas down gapsoccurring on relatively highvolume averageapproximately1.7%.
Table6.1.ReturnsforDownGapsOccurringatAboveAverageandBelowAverageVolumeLevels
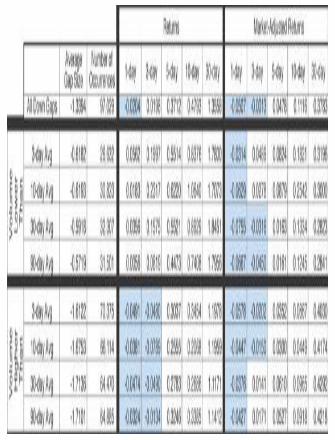
You have seen thetendency for down gaps toreverse. Generally, you haveseen that a reversal strategy,in this case going long, ismore profitable following adowngapthanacontinuationstrategy.ThereturnsinTable6.1 suggest that this occurseven more quickly for downgaps that occur on lowvolume. Down gaps thatoccuron lowvolume tend to
besmallgaps,andpricetendstorisethefollowingday.Thereturns for low-volumedowngaps are positive at all thereturnperiodsconsidered.Down gaps that occur on
higher than average volumetend not to reverse until aweek out. The 1-day and 3-day returns for the fourmeasures of high-volumegaps are all negative. Thesedown gaps appear to have
more initial power behindthem;volumeishighandtheinitialpricemovementontheday of the gap is significant.The momentum behind thatgap tends to stay with thestock for a couple of days.However,byDay5 the storyhas changed and returns arepositive. Interestingly, at the30-daymark,nominalreturnsfor low-volume down gapsexceedthoseforhigh-volumegaps,but themarket-adjusted
returns for the high-volumegapsarehigher.Now look at how volume
impacts the profitability oftrading up gaps. Table 6.2contains information aboutvolume for up gaps. Themajority of the 116,903 upgapsoccuron relativelyhighvolume. When using the 3-day average volume as thecriterion for determininghigh-volumegaps,71%ofthe
up gaps are high-volumegaps.Likethedowngaps,upgaps that occur on highvolumetendtobelargerthanup gaps that occur on lowvolume.Theaveragegapsizefor an up gap is 1.11%; upgaps on low volume tend tobe 0.6% or less, whereas upgaps on high volume tend tobemorethan1.3%.
Table6.2.ReturnsforUpGapsOccurringatAbove
AverageandBelowAverageVolumeLevels
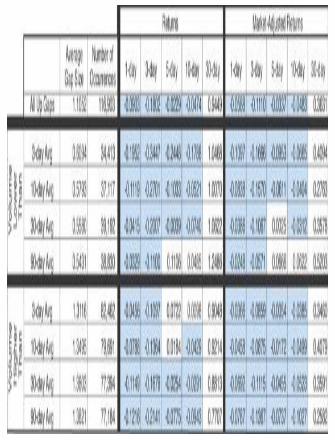
As you have seen before,stocks that gap up tend toreverse direction. Investorswho go long at the open theday after an up gap have anegativereturnuptoDay10.Table 6.2 shows this is trueforstocksthatgapuponbothhigh and low volume.However, the statistics inFigure6.2indicatethatstocksthat gap up on low volumetendtooutperformstocksthat
gapuponhighvolumebythe30-day time frame. Thismight seem counterintuitive;you might think that stocksthathaveabiggapuponhighvolume have many eagerbuyers and momentum willpushthesestockshigher.Thecounterargument that mightexplain the results in Table6.2isthatalargegaponhighvolume means that all thebuyerscameinquicklyonthesame day, and there isn’t
anything to keeppushing thestockhigher.Smallerupgapson lighter volume mayindicate thatnewinformationis trickling out to investorsand that, as interest in thestock grows, the price willcontinuetorise.Sofar,youhavecompared
sets of stocks that gap onabove average volume withthose that gap on belowaverage volume. Now break
those groups down a bitmore,refiningyourdefinitionof above average and belowaveragevolume.InTable6.3down gaps are groupedaccording to the volume onthedayof thegap relative tothe previous volume for thatparticular security. Fivecategoriesofvolumesizeareconsidered:
•Extremelylowvolume:Stocksthathad
avolumeonthedayofthegapthatwaslessthan25%oftheaveragevolumeforthesecurity•Belowaveragevolume:Stocksthathadavolumeonthedayofthegapthatwasbetween25%and75%oftheaveragevolumeforthesecurity•Averagevolume:Stocksthathadavolume
onthedayofthegapthatwaswithin25%aboveorbelowtheaveragevolumeforthesecurity•Aboveaveragevolume:Stocksthathadavolumeonthedayofthegapthatwasbetween125%and175%oftheaveragevolumeforthesecurity•Extremelyhigh
volume:Stocksthathadavolumeonthedayofthegapthatwasmorethan175%oftheaveragevolumeforthesecurity
Table6.3.ReturnsforGapDownStocksSortedby
RelativeVolume
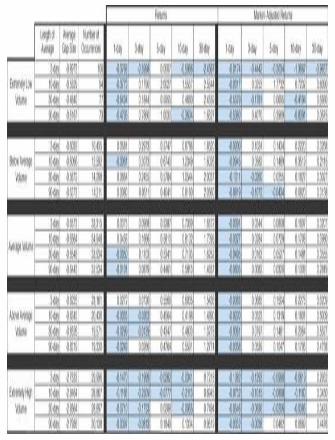
For each of the fivecategories, we measure theaverage volume in fourdifferentways:3-day,10-day,30-day, and 90-day averagevolume. About one-third ofthe down gaps occur onaveragevolume.Atleast29%of down gaps occur onwhatwe categorize as extremelyhighvolume.Veryfewofthedown gaps, less than 0.1%,occur on extremely low
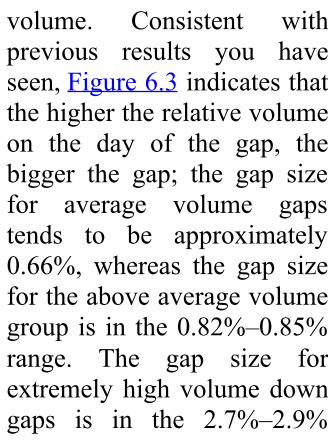
volume. Consistent withprevious results you haveseen,Figure6.3indicatesthatthehighertherelativevolumeon the day of the gap, thebigger the gap; the gap sizefor average volume gapstends to be approximately0.66%, whereas the gap sizefortheaboveaveragevolumegroup is in the0.82%–0.85%range. The gap size forextremelyhighvolumedowngaps is in the 2.7%–2.9%
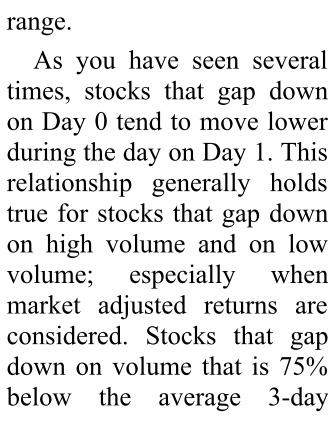
range.As you have seen several
times, stocks that gap downonDay0tendtomovelowerduringthedayonDay1.Thisrelationship generally holdstrueforstocksthatgapdownon high volume and on lowvolume; especially whenmarket adjusted returns areconsidered. Stocks that gapdownonvolume that is 75%below the average 3-day
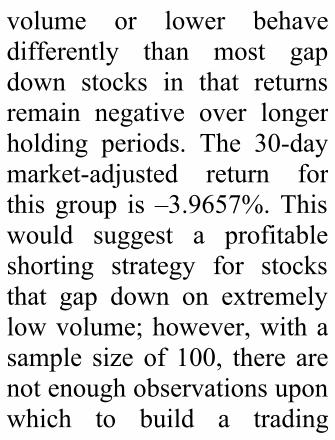
volume or lower behavedifferently than most gapdown stocks in that returnsremain negative over longerholding periods. The 30-daymarket-adjusted return forthis group is –3.9657%.Thiswould suggest a profitableshorting strategy for stocksthat gap down on extremelylowvolume;however,withasample size of 100, there arenotenoughobservationsuponwhich to build a trading
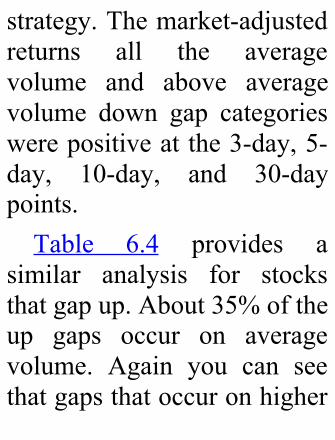
strategy.Themarket-adjustedreturns all the averagevolume and above averagevolume down gap categorieswerepositiveatthe3-day,5-day, 10-day, and 30-daypoints.Table 6.4 provides a
similar analysis for stocksthatgapup.About35%oftheup gaps occur on averagevolume. Again you can seethatgapsthatoccuronhigher
volume tend to be largergaps. The up gaps occurringonaveragevolumetendtobeapproximately 0.64%,whereas the up gaps thatoccur at extremely high-volumelevelsaverageatleast2.08%.
Table6.4.ReturnsforGapUpStocksSortedby
RelativeVolume
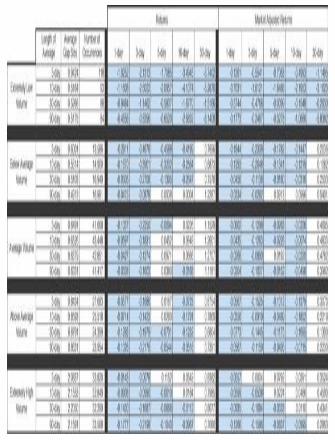
Table 6.4 contains a highnumber of negative returns.Whenyouconsideralltheupgaps lumped together, youfindthat1-,3-,5-,and10-daynominal returns and market-adjusted returns werenegative.Thispatternappearsto hold true regardless ofvolumeonthedayofthegap.The additional informationthatTable6.4providesisthatif a stock gaps up on
extremely low volume, pricereverses and continuesdownward over the next 30days. Stocks that gap up onaverage volume do not seepositive market-adjustedreturnsuntilafter10days,butthese are the strongestperformers at the 30-daymark.
SummaryThis chapter considered a
classic variable used bytechnical analysts to confirmprice movements: volume.Traditional analysis suggeststhat price movements,especially upwardmovements, on high volumeare more meaningful thanwhen they occur on lowvolume. However, theanalysis in this chaptersuggeststhatvolumedoesnotprovideagreatdealofusefulinformation or added value.
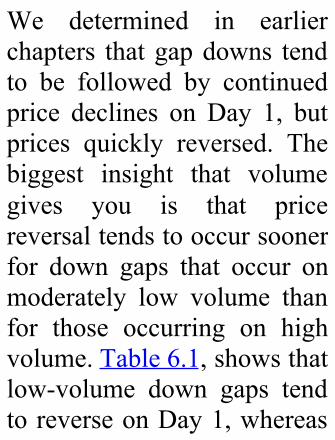
We determined in earlierchapters thatgapdowns tendto be followed by continuedprice declines on Day 1, butprices quickly reversed. Thebiggest insight that volumegives you is that pricereversaltendstooccursoonerfor down gaps that occur onmoderately low volume thanfor those occurring on highvolume.Table6.1,showsthatlow-volume down gaps tendtoreverseonDay1,whereas
high-volume down gaps tendnot to reverseuntil afterDay3.
Endnotes1.Gartley,H.M.ProfitsintheStockMarket,3rded.(1981).Pomeroy,WA:Lambert-GannPublishingCo.,1935.2.Granville,
Joseph.ANewStrategyofDailyStockMarketTimingforMaximumProfit.EnglewoodCliffs,NJ:Prentice-Hall,Inc.,1976.
Chapter7.GapsandMovingAverages
Chapter 5, “Gaps andPrevious Price Movement,”examined the relationshipbetween gaps and pricemovements immediatelyaround the time of the gap.Specifically, you looked atcandle colors on the daybeforethegapandthedayofthegap.You saw thatnoting
the color of the candle thedaybeforeagapoccurreddidhelp determine profitabletrading strategies. When yousawablackcandleonDay–1and a gap on Day 0, thereturnsonDay1tendedtobepositive. This was especiallytrue for down gaps,suggesting that whendownward price movementon Day –1 is followed by adowngaponDay0,muchofthe downward pressure on
price is exhausted and areversalislikely.This chapter takes a
slightly longer-term view.What if the stock’s price isabove (or below) its 10-daymovingaverageonthedayofthe gap? How is that relatedto pricemovements after theday of the gap? Similarly,what is the impact of thestock’s10-day,30-day,or90-day moving average price?
Basically, this chapterconsidershowgapsthatoccurat relatively high pricescomparetogapsthatoccuratrelativelylowprices.
CalculationofaMovingAverage
Technical analystshave used movingaverages for manydecades to smootherraticdataand tomake
it easier to viewunderlying trends. Amoving average issimply an average oversome past window oftime calculated insuccessive time periods.For example, supposethe closing prices for astock each day over aweekarethefollowing:
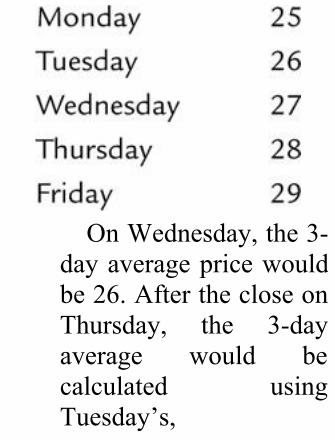
OnWednesday,the3-dayaveragepricewouldbe26.AfterthecloseonThursday, the 3-dayaverage would becalculated usingTuesday’s,
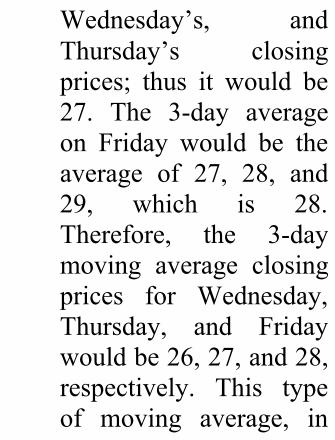
Wednesday’s, andThursday’s closingprices; thus it would be27. The 3-day averageon Friday would be theaverage of 27, 28, and29, which is 28.Therefore, the 3-daymoving average closingprices for Wednesday,Thursday, and Fridaywouldbe26,27,and28,respectively. This typeof moving average, in
which each time periodis equally weighted, isreferred to as a simplemoving average. Attimes, technical analystsuse more sophisticatedmoving averages, suchas a linearly weightedmoving average or anexponentially smoothedmoving average. Formore detailedinformation on thecalculation of various
types of movingaverages, see thediscussion provided byCharles Kirkpatrick andJulie Dahlquist in theirbook, TechnicalAnalysis: The CompleteResource for FinancialMarketTechnicians.1
To do this, we calculate10-day, 30-day, and 90-daysimplemoving averages. For
the 10-day moving average,we computed a simplemoving average of theclosing prices from Day –10through Day –1. We thenexamined the relationshipbetween thepriceon thedayof the gap and the movingaverage of price in severalways.Toexplain,saythatthe10-daymovingaverageasofDay –1 was 13 and that theclosing price on Day 0 (theday of the gap) was 10. In
this instance, theDay0pricewould be below the 10-daymoving average of 13, andthegapwouldbeclassifiedasoccurring below the movingaverage.2
Table 7.1 shows theaverage returns for holdingperiodsof1,3,5,10,and30days following the day of adown gap when the gapoccursbelowandabovepricemoving average. When all
97,029 down gaps areconsidered, the 1-day returnthedayofthegapisnegative.As you have seen before,whenadowngapoccurs, theprice usually continuesdownward on Day 1 butquickly reverses and beginsrising.What is strikingabouttheresultsinTable7.1isthisholdstruefordowngapsthatoccurbelowthepricemovingaverage but not for downgaps that occur above the
pricemovingaverage.
Table7.1.ReturnsforDownGapsOccurringBelowandAbovePrice
MovingAverage
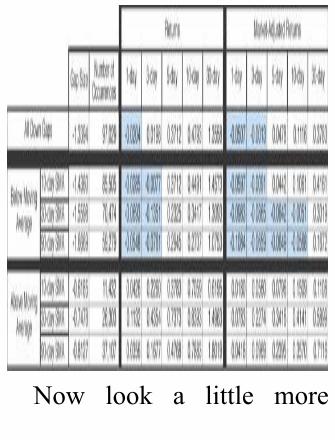
Now look a little more
closelyat thedowngaps thatoccur at prices below themoving averages. Eighty-eight percent of down gapsoccuratapricebelowthe10-day moving average; 73%and 61% fall below the 30-day and the 90-day movingaverage, respectively. Thus,most down gaps occur at abelow average price. Also,noticethatthedowngapsthatoccuratbelowaveragepricestend to be larger than the
down gaps that occur ataboveaverageprices.Forthedowngapsoccurringatbelowaverage prices, the 3-dayreturnisalsonegative.Fewer stocks tend to gap
down at an above averageprice. Only 12%, 27%, and38% of the stocks gappeddownatapriceabovethe10-day, 30-day, and 90-daymovingaverage,respectively.The stocks that gap down at
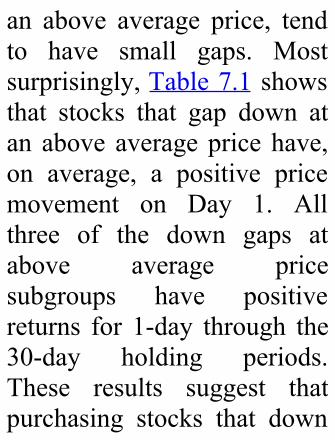
an above average price, tendto have small gaps. Mostsurprisingly,Table7.1showsthat stocks that gap down atan above averageprice have,on average, a positive pricemovement on Day 1. Allthree of the down gaps atabove average pricesubgroups have positivereturns for 1-day through the30-day holding periods.These results suggest thatpurchasing stocks that down
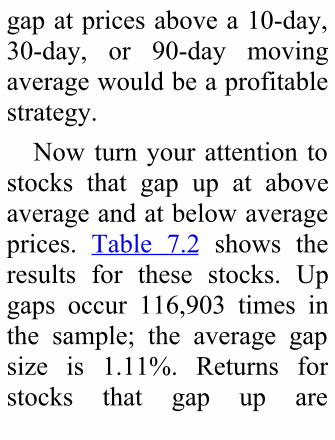
gapatpricesabovea10-day,30-day, or 90-day movingaveragewouldbeaprofitablestrategy.Nowturnyourattention to
stocks that gap up at aboveaverageandatbelowaverageprices. Table 7.2 shows theresults for these stocks. Upgaps occur 116,903 times inthe sample; the average gapsize is 1.11%. Returns forstocks that gap up are
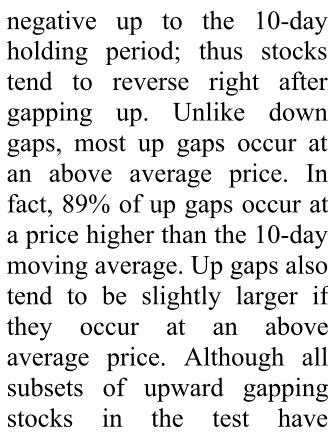
negative up to the 10-dayholding period; thus stockstend to reverse right aftergapping up. Unlike downgaps, most up gaps occur atan above average price. Infact,89%ofupgapsoccuratapricehigherthanthe10-daymovingaverage.Upgapsalsotend to be slightly larger ifthey occur at an aboveaverage price. Although allsubsets of upward gappingstocks in the test have
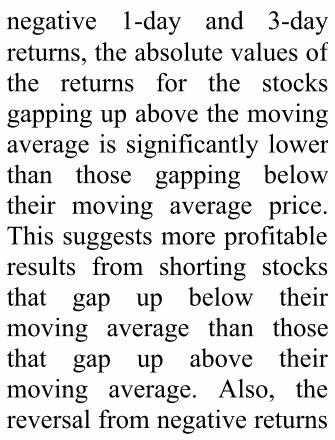
negative 1-day and 3-dayreturns,theabsolutevaluesofthe returns for the stocksgappingupabovethemovingaverage issignificantly lowerthan those gapping belowtheir moving average price.Thissuggestsmoreprofitableresults from shorting stocksthat gap up below theirmoving average than thosethat gap up above theirmoving average. Also, thereversalfromnegativereturns
to positive returns comesmuch sooner for the stocksthat gap up at above averageprices. For example, stocksthat gap up at a price abovetheir 30-day or 90-daymovingaveragehavepositivereturns by the 5-day holdingperiod.
Table7.2.ReturnsforUpGapsOccurringBelowand
AbovePriceMovingAverage
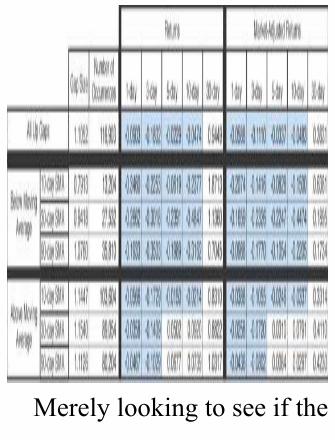
Merelylookingtoseeifthe
price is above or below itsmovingaverage, asyouhavejustdone,ignorestheamountbywhichthatpriceisgreateror less than its average.Tables 7.1 and 7.2 lumpstocksthatgapatapriceonecentabovetheirpricemovingaveragewiththosethatgapatapricethatistwicetheirpricemoving average. To refinethiscategorizationabitmore,webreakthegroupsintofivecategories. If a gap occurs
within 75% to 125% of itsmoving average, it is placedin the gap at an “averageprice” category. If a gapoccurs at aprice level that is125%to175%ofthemovingaverage, it is categorized asan“aboveaverageprice”gap.Gaps that occur at a pricelevel that ismore than175%of the moving average areclassified as “extremely highprice” gaps.Likewise, stocksthat gap at a price that is
between25%and75%ofthemovingaverageareclassifiedas “below average price”gaps; gaps occurring at aprice less than 25% of themoving average are referredto as “extremely low price”gaps.Table 7.3 contains the
results for these fivecategories fordowngaps.Asyoucansee,mostgapsoccurwithin 75% to 125% of the
movingaverageforthestock.Gap downs at above averageand below average pricestend to be larger gaps, withthe largest gap sizesoccurring at the extremeprices.Lookingattheaveragepricegaps,youcanseethatadowngap onDay 0 is likelyto be followed by downwardprice movement on Day 1;however,thesestocksquicklyreverse, leading to positive10- and 30-day market-
adjusted returns for thesestocks.
Table7.3.ReturnsforGapDownsSortedbyRelativePriceLevel
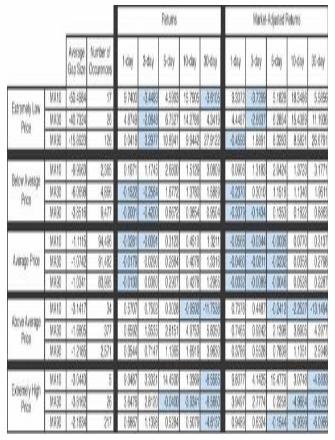
Remember that in Table7.1 you saw that down gapsthat occurred above movingaverages had positive returnsout to the 30-day holdingperiod. Tweaking thedefinitionof“aboveaverage”a bit in Table 7.3 providessomeusefulinformation.The1-day and the 3-day returnsfor stocks in the aboveaverage price and theextremely high price
categories are positive,consistent with the resultsfrom Table 7.1. However,Table 7.3 warns that whilethese positive returnscontinue on average forstocks that gap down at ahighprice,positivereturnsdonot continue to the 30-dayholding period for all thesubgroups. Stocks that gapdown at extremely highprices tend to have large,negative returns by the 30-
day holding period. The datain Table 7.3 suggests thattradersshouldcarefullywatchstocks that have large gapdowns at relatively highprices.Table 7.4 presents the
results for up gaps brokendownintothefivecategories.Thevastmajorityofupgapsoccurwithin75%to125%ofthe moving average. Gapsthat occur further away from
themoving average,whetherabove or below, tend to belargergaps.LookingatTable7.4, it is striking how manynegative return numbers arein the table. These resultssuggest that taking a longposition immediately after agap up in the price is notprudent, regardless of theprice level at which the gapoccurs. The one exception tothisisthegroupofstocksthatgappedupatapricelessthan
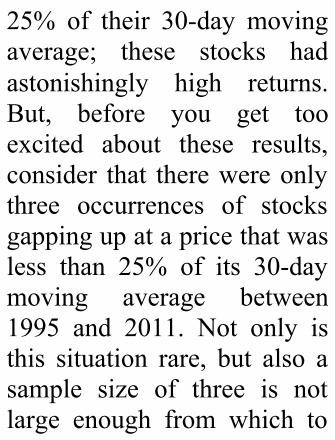
25% of their 30-day movingaverage; these stocks hadastonishingly high returns.But, before you get tooexcited about these results,consider that therewereonlythree occurrences of stocksgappingupatapricethatwasless than 25% of its 30-daymoving average between1995 and 2011. Not only isthis situation rare, but also asample size of three is notlarge enough from which to
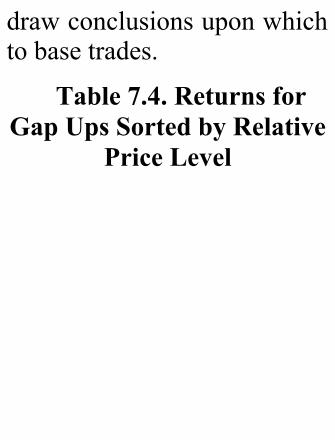
drawconclusionsuponwhichtobasetrades.
Table7.4.ReturnsforGapUpsSortedbyRelative
PriceLevel
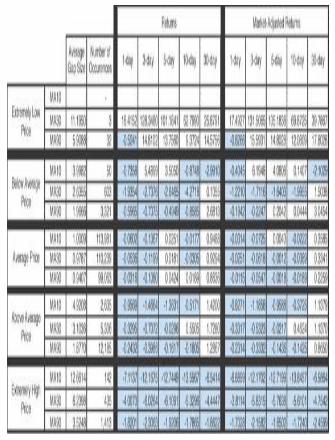
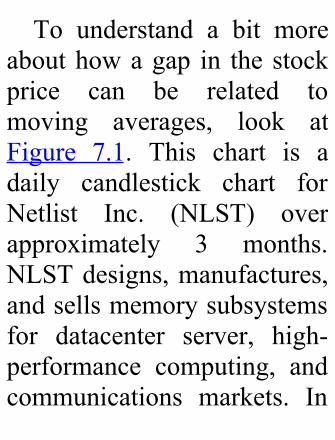
To understand a bit moreabouthowagap in thestockprice can be related tomoving averages, look atFigure 7.1. This chart is adaily candlestick chart forNetlist Inc. (NLST) overapproximately 3 months.NLSTdesigns,manufactures,andsellsmemorysubsystemsfor datacenter server, high-performance computing, andcommunications markets. In
mid-November 2009, thestock suddenly becamemoreheavily traded. The dailyvolume, which had averagedbelow 400,000, jumped tomore than 10 million onFriday,November 13, and tomore than 25 million onMonday, November 16. Thisheavy volume can beattributed to new interest inthe stock as the companyannouncedtheintroductionofa new computer memory
module.Notonlydidvolumerise significantly, but pricerose significantly.NLST hadbeentradingunder$1asharefor months but reachedalmost $5 a share on Friday,November 13. Figure 7.1showsthreemovingaverages,a10-day,a30-day,anda90-day simple moving average.The rapidly rising price ofNLST started pulling themovingaveragesup.The10-day moving average (MA)
moved up the most, closelytracking thepricemovement.Therise in the30-dayMAismuchmoresubtle.
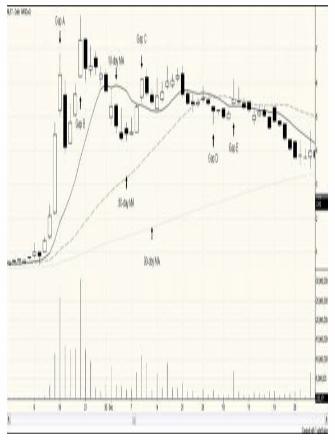
CreatedwithTradeStationFigure7.1.Dailystock
chartforNLST,November2,2009–January28,2010OnMonday,December16,
NLST gapped up. This gap,labeledGapA in Figure7.1,occurred above all threemoving averages. This gapfalls into the gap at an“extremely high price”category. Of the entire
sample, this gap tops the listas the highest percentageabove the 30-day movingaverage. It is the secondhighest above the 10-daymovingaverageandthethirdhighest above the 90-daymovingaverage.Asyouhaveseenoftenhappens, thepricemoves down the followingday.After twowhite candlesonDays2and3,NLSTgapsup again on Day 4, Friday,December20.Thisisanother
gap at an extremely highprice relative to the movingaverages;itranksfifthonthelistofgapsrelativetothe30-day moving average and onthe 90-day moving averagelist. The following tradingday, you can see anotherblack candle. At this pointNLST’s uptrend has lost itssteam. ByNovember 30, the10-dayMA has flattened outand the price falls below themoving average. On
December 9, the stock gapsup again. This gap, labeledGap C in Figure 7.1 crossesabovethe10-dayMA.GapCis clearly above the 30-dayand90-daymovingaverages.The candle on December 9crossed above the 10-daymoving average, and NLSTclosed above the movingaverage; thus, you canclassify thisgapasoccurringabovethe10-dayMA.NLSTtrades at approximately 6 for
the next couple of weeks.Then, on December 30, GapD occurs. This down gap isan example of a situation inwhich a gap is classifieddifferently depending onwhich moving average isused. Gap D occurs at abelowaveragepricewhenthe10-dayor the30-daymovingaverage is considered; itoccurs at an above averagepricewhentheslower90-daymoving average is the
criterion. Four days lateranother gap, labeled Gap E,occurs. This gap up occursabove the30-day and90-daymoving averages but belowthe faster 10-day movingaverage.So far, the analysis of
trading strategies hasconsidered the location of agap relative to one movingaverage. If considering onemovingaverageaddsvalueto
the decision, wouldconsidering two or three beeven better? In other words,what if the price is not justbelow the 10-day movingaverage but is also below its30-day moving average?RememberthegapsinNLSTyou justconsidered inFigure7.1. Three of the gapspictured, Gaps A, B, and C,areclassifiedasabovethe10-day, above the 30-day, andabove the 90-day moving
average.GapDisincludedinthe above 90-day movingaverage grouping but in thebelow 10-day movingaverage and 30-day movingaverage categories. Gap E isabove the10-dayand90-daymoving average but belowthe30-daymovingaverage.Lookingatcombinationsof
moving averages does seemto make a difference.Considertheresultspresented
in Table 7.5. Of the 97,029down gaps, 85,505 occurbelow the 10-day movingaverage and 70,474 occurbelow the 30-day movingaverage. However, only68,203 down gaps occurbelow both the 10-day andthe 30-day moving averages.Thus, youmust consider thatthe gaps occurring below the30-day moving average arenot simply a subset of thoseoccurring below the 10-day
moving average; clearly,somedowngapsoccurbelowthe 30-day moving averagebutabovethe10-daymovingaverage.GapE inFigure7.1is an example of such a gap.Almost one-fourth of thedowngaps that liebelow the10-day and 30-day movingaveragesoccurabove the90-daymovingaverage.
Table7.5.ReturnsforDownGapsOccurring

BelowandAboveMultiplePriceMovingAverages
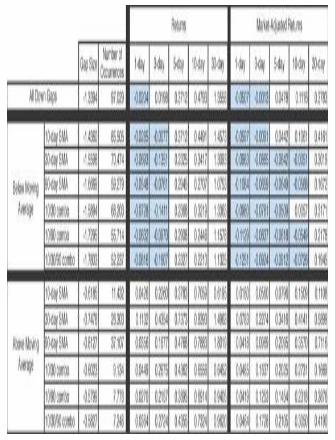
The most stringentrequirements for categorizingagapasoccurringatabelowaverage price is therequirement that the gap liebelow the 10-day, 30-day,and90-daymovingaverages.Over half of all down gapsfall into this category. Oneinterestingresultpresented inTable7.5isthatthegapsthatmeet this stringentrequirement have the largest
negative 1-day return;actually,thenegativereturnisfour times larger than thenegative return for the entireset of down gaps. Theseresults reinforce the idea thatdown gaps that occur atbelow average prices shouldbe sold short at the open ofthe next trading day for ashort-runreturn.Remember that gap downs
that occur at above average
prices tend to experienceprice reversal the next day,suggesting a long positionstrategy.Aminorityofstocksthatgapdowndosoataboveaverageprices.Theresults inTable7.5indicatethataddingmore stringent requirements,such as that the gap mustoccuraboveall threemovingaverages, does not add anyvalue. Those down gapsoccurring above the 30-daymoving average remain the
most profitable group inwhichtotakealongposition.Now consider up gaps by
looking at the resultspresented in Table 7.6. Thesample contains 116,903 upgaps with the vast majorityoccurring above the averageprice. Eighty-nine percent ofthe up gaps occur above the10-daymovingaverage.Even61% of the gaps meet themorestringentrequirementof
occurring above all threemoving averages. Thirty-onepercent of up gaps occurbelow the 90-day movingaverage, but of these gaps,approximately79%occuratapricethatisabovethe10-dayand the 30-day movingaverages.
Table7.6.ReturnsforUpGapsOccurringBelowand
AboveMultiplePriceMovingAverages
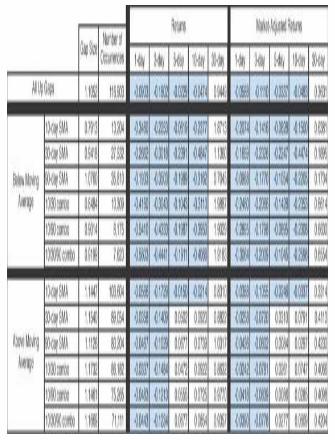
Although Table 7.6 givessome additional informationof the incidence of up gapsoccurring at relatively highand low prices, itunfortunately does not givemuch additional informationregarding the profitability ofpotential trading strategies.Youhaverepeatedlyseenthatup gaps are followed bynegative 1-day and 3-dayreturns. Refining the
classification a bit moredoesn’t alter those results.You also don’t see a patternof a different magnitude ofreturns when you combinetwo or three movingaverages.
SummaryThischapterfocusedonthe
impact the price at which agap occurs relative to theaverage price for the stock
has on the profitability oftrading strategies. Most upgaps occur at above averageprices, and most down gapsoccur at below averageprices. The vast majority ofgaps occur within a 75% to125% range of the stock’sprice moving average. Somegaps, however, do occur atextremelyhighandextremelylowpricelevels.A consistent result
throughout this chapter hasbeen that stocks that gapdownataboveaveragepricestendtoreversepricedirectionimmediately. This suggeststhat purchasing a stock thatgappeddownonDay0atanabove average price at theopening the following day,Day1,will,onaverage,beaprofitabletradingstrategy.Stocks that gap up tend to
have negative returns
immediately following thegap. These negative returnstend to occur for a longerperiod of time for the stocksthat gap up at relatively lowprices.Stocksthatgapupatapricebelow their10-day,30-day, or 90-day movingaverage still have negativereturns at the 10-day holdingperiod. By the 30-day mark,these returns have becomepositive.
Endnotes1.Kirkpatrick,CharlesandJulieDahlquist.TechnicalAnalysis:TheCompleteResourceforFinancialMarketTechnicians.UpperSaddleRiver,NJ:PearsonEducation,Inc.,2011.2.Ontherare
occasionthatthecurrentpricewasexactlyequaltothemovingaverage,thecurrentpricewasclassifiedasabovethemovingaverage.Thishappenedoccasionallywhenusinga10-daymovingaveragebutwasmuchlessfrequentwhen
usingthelonger30-dayand90-daymovingaverages.Thenumberofobservationsgappingaboveandbelowagivenlengthmovingaveragedoesnotalwayssumtothetotalnumberofgapsobservedbecausesomegapsoccurredwhena
stockwasnewlyincludedinthedatabaseanddidnothaveenoughpreviouspricedatatocalculateamovingaverage.
Chapter8.GapsandtheMarket
This chapter analyzesgapsin relation to overall marketmovement. Some days haveanextremelyhighnumberofgaps.Thegapson thesehighgapdaysaretippedheavilyinone direction. For example,there might be 599 gaps onone day, with all but 3 ofthembeingupgaps.Doesthis
situation point you towardcertain trading strategies?Does itgiveyouaclueas towhich direction the marketmightbeheaded?Adifferentquestion related to marketmovements is: Should priormarketmovements alteryourinterpretation of individualstock gaps? For example, isthereadifferenceinhowyoumight interpret a gap downfor a stock if the market isalreadytrendingdown?These
aresomeofthequestionsthischapterexplores.
HighGapDaysFirst consider the issue of
the total number of gapsoccurring in themarket on agiven day. The total numberof gaps in a given day canvarygreatly.Thedistributionis not uniform across time.Onsomedays,morethan500stocks gap.Of those 500, all
might be down gaps. Or thevast majority may be downgaps.Thesameistrueforupgaps. Do these dominantdirection high gap days giveyou any clue about futuremarketdirection?Table 8.1 shows the 25
daysinourstudythathadthemost total gaps. The tableshowsthedate,totalgaps,thebreakdownofdownversusupgaps, and the average sizeof
the gaps. As can be seen,therewere25daysonwhich553 or more gaps occurred.Nine of those days had gapsonly in one direction. Theremaining 16 days had lessthan 10 gaps in the oppositedirection from the majority.Youmightexpecttoseesucha one-sided split if theaverage gap size were quitelarge,butthatisnotthecase.Forexample,onDecember1,2010,theaveragegapupsize
was only 0.576%, but therewere 617 up gaps and onlysix stocks that gapped down.The largest average gap inthis list for themajority sidewas –1.781% on September22,2011.
Table8.1.DayswiththeGreatestNumberofGaps
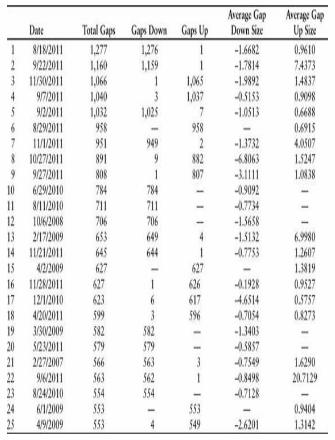
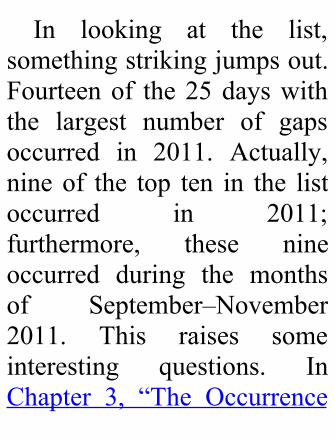
In looking at the list,somethingstrikingjumpsout.Fourteenof the25dayswiththe largest number of gapsoccurred in 2011. Actually,nineof the top ten in the listoccurred in 2011;furthermore, these nineoccurred during the monthsof September–November2011. This raises someinteresting questions. InChapter 3, “The Occurrence
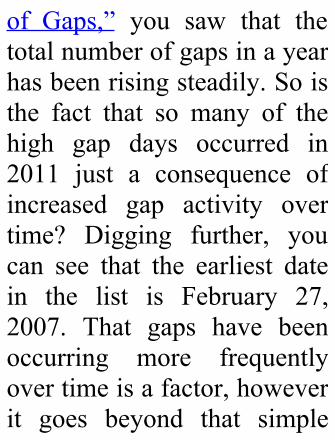
of Gaps,” you saw that thetotalnumberofgapsinayearhasbeenrisingsteadily.Soisthe fact that so many of thehigh gap days occurred in2011 just a consequence ofincreased gap activity overtime? Digging further, youcan see that the earliest datein the list is February 27,2007. That gaps have beenoccurring more frequentlyovertimeisafactor,howeverit goes beyond that simple
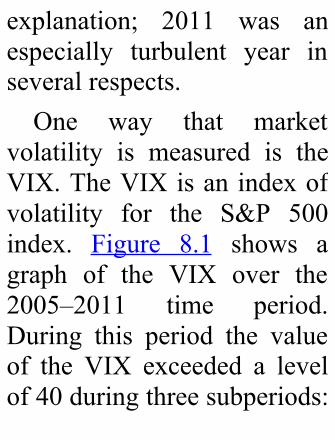
explanation; 2011 was anespecially turbulent year inseveralrespects.One way that market
volatility is measured is theVIX.TheVIXisanindexofvolatility for the S&P 500index. Figure 8.1 shows agraph of the VIX over the2005–2011 time period.During this period the valueof the VIX exceeded a levelof40duringthreesubperiods:
October 2008–April 2009,May–July2010,andAugust–October 2011.Twelve of the25 days with the largestnumber of gaps in Table 8.1occurred during these threesubperiods; 7 of those days(about one-third of the highgapdays)occurredduringtheAugust– October 2011period.
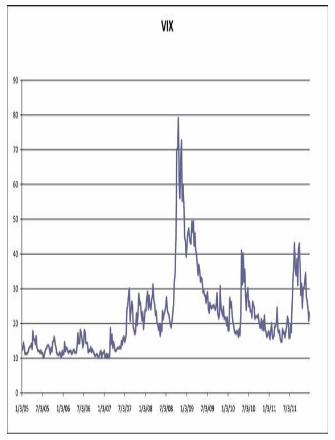
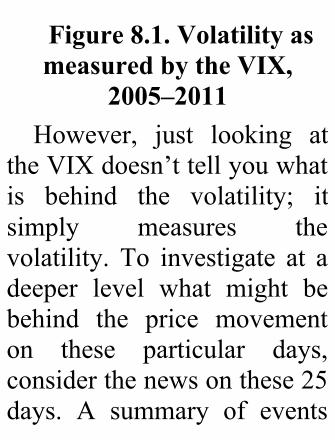
Figure8.1.VolatilityasmeasuredbytheVIX,
2005–2011However, just looking at
theVIXdoesn’ttellyouwhatis behind the volatility; itsimply measures thevolatility. To investigate at adeeper level what might bebehind the price movementon these particular days,considerthenewsonthese25days. A summary of events
occurring on those days isprovided on the followingpages.
MajorNewsEventsonHighGapDays
What was occurringthatmayhavecausedsomany gaps to occur onparticular days?Rememberthatitisnew,unexpected news andinformation that market
participants receive thatcan cause a jump inprice. In addition, forgaps to occur, this newsis usually informationthat becomes availableafter the close of onetrading session butbefore the open of thenext session. Tohighlight thedevelopment of newsandeventsonthesedayswith a high number of
gaps, the newssummaries are inchronologicalorder:
Tuesday, February 27,2007 (563 down gaps/3 upgaps)
The U.S. marketsopened on the heels ofthe Chinese (Shanghai)market dropping 8.8%overnight, the largestdrop in a decade, onworries that theChinese
government was goingtotakeactionstoreducethe amount of stockspeculation. In additiontothenegativeimpactofthe news from China, adecline indurablegoodsorders raised concernsabouttheU.S.economy.Investors were alsomulling over commentsmade on the previousday by former FederalReserve Board
Chairman AlanGreenspan that hethought the U.S.economy might enter arecession at the end ofthe year. And if thosefactorswere not enoughtocreateaturbulentday,Vice-President DickCheney had been theapparent target that dayof a Taliban suicidemission in Afghanistanthat killed 23 people.
(Cheneywasunhurt.)Monday,October6,2008
(706downgaps/0upgaps)Concerns over bank
bailout plans in theUnited States andproblems in EuropeanbankscausedtheDowtodrop as much as 800points during the day.Interestingly, JimCramer (ofMad Moneyfame) was interviewed
on the Today show andadvised people to takeallthemoneytheymightneedforthenext5yearsoutofthestockmarket.
Tuesday, February 17,2009 (649 down gaps/4 upgaps)
Obama signed the$787 billion AmericanRecovery andReinvestment Act intolaw. The market
continuedtoworryaboutU.S. banks, problemswith GM and Chrysler,and a worseningrecessioninJapan.
Monday,March 30, 2009(582downgaps/0upgaps)
The market fell onconcerns over GM,Chrysler, and bankstocks. The Obamaadministration said thatGM and Chrysler had
one more attempt atrestructuring. Inaddition, many bankswere probably going toneed substantial federalaid.
Thursday, April 2, 2009(0downgaps/627upgaps)
Themarketjumpedupwith news of acoordinated effortamong central banks toprop up financial
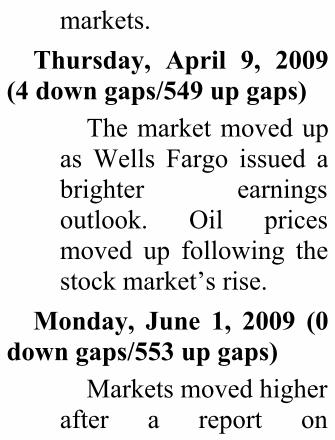
markets.Thursday, April 9, 2009
(4downgaps/549upgaps)Themarketmovedup
asWells Fargo issued abrighter earningsoutlook. Oil pricesmoved up following thestockmarket’srise.
Monday, June 1, 2009 (0downgaps/553upgaps)
Marketsmovedhigherafter a report on
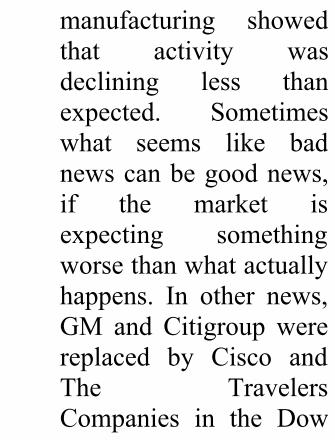
manufacturing showedthat activity wasdeclining less thanexpected. Sometimeswhat seems like badnewscanbegoodnews,if the market isexpecting somethingworsethanwhatactuallyhappens. In other news,GM and Citigroup werereplaced by Cisco andThe TravelersCompanies in the Dow
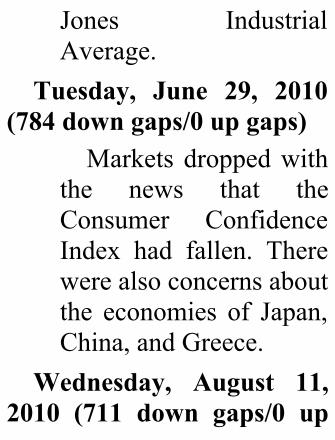
Jones IndustrialAverage.
Tuesday, June 29, 2010(784downgaps/0upgaps)
Markets droppedwiththe news that theConsumer ConfidenceIndex had fallen. Therewerealsoconcernsaboutthe economies of Japan,China,andGreece.
Wednesday, August 11,2010 (711 down gaps/0 up
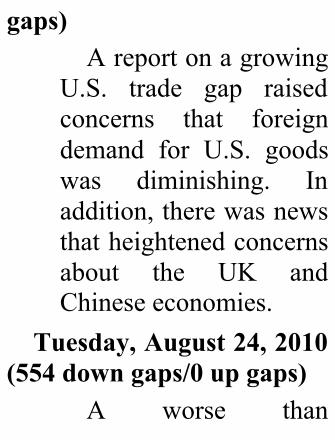
gaps)Areportonagrowing
U.S. trade gap raisedconcerns that foreigndemand for U.S. goodswas diminishing. Inaddition,therewasnewsthatheightenedconcernsabout the UK andChineseeconomies.
Tuesday,August24,2010(554downgaps/0upgaps)
A worse than
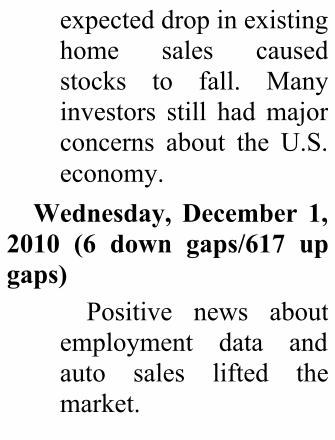
expecteddropinexistinghome sales causedstocks to fall. Manyinvestors still hadmajorconcerns about the U.S.economy.
Wednesday,December 1,2010 (6 down gaps/617 upgaps)
Positive news aboutemployment data andauto sales lifted themarket.
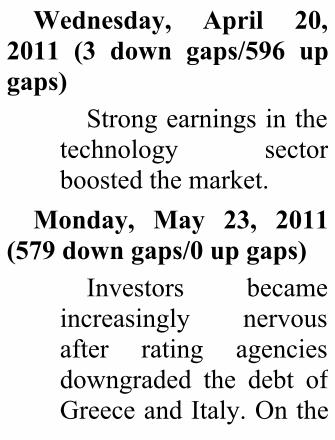
Wednesday, April 20,2011 (3 down gaps/596 upgaps)
Strongearningsinthetechnology sectorboostedthemarket.
Monday, May 23, 2011(579downgaps/0upgaps)
Investors becameincreasingly nervousafter rating agenciesdowngraded the debt ofGreeceandItaly.Onthe
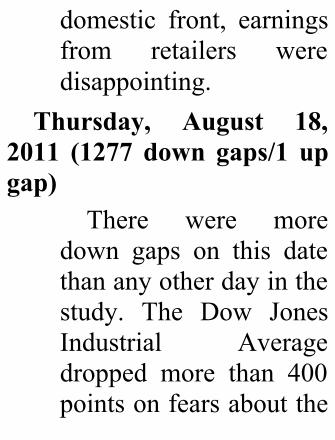
domestic front, earningsfrom retailers weredisappointing.
Thursday, August 18,2011 (1277 down gaps/1 upgap)
There were moredown gaps on this datethananyotherdayinthestudy. The Dow JonesIndustrial Averagedropped more than 400pointsonfearsaboutthe
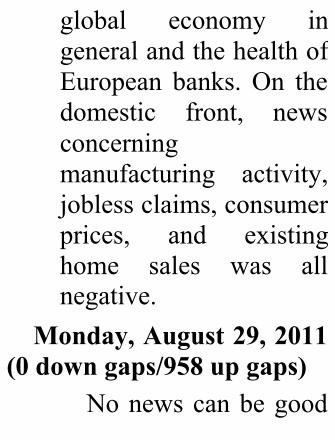
global economy ingeneralandthehealthofEuropean banks.On thedomestic front, newsconcerningmanufacturing activity,joblessclaims,consumerprices, and existinghome sales was allnegative.
Monday,August29,2011(0downgaps/958upgaps)
Nonewscanbegood
news. The northeasternUnited States had beenbracing for HurricaneIrene, but damage wasfar less than had beenfeared.
Friday, September 2,2011 (1025 down gaps/7 upgaps)
Fear that the U.S.economywoulddipbackinto recession grew asthe Labor Department
reported a zero rate ofjob growth for August.TheDJIA fell 2.2%andthe S&P500 index fell2.5%,leadingintothe3-dayLaborDayweekend.
Tuesday, September 6,2011 (562 down gaps/1 upgap)
DuetoLaborDay,themarket was closed onMonday,adayofmajorselling inEurope.When
U.S. markets opened onTuesday, the 6th, thesell-off hit the UnitedStates. With theworsening situation inGreece and Italyinvestorswerebecomingincreasingly worriedabout the economies ofmany Europeancountries.
Wednesday,September7,2011 (3 down gaps/1037 up
gaps)A major court ruling
in Germany buoyedoptimism that AngelaMerkel could helpengineer a Europeanbailout for Europe’sstruggling economies.After 2 consecutivetrading days with anunusually large numberof down gaps, themarket reversedwith an
unusually high numberofupgapsoccurring.
Thursday, September 22,2011 (1159 down gaps/1 upgap)
The market reactednegatively to a 2-daypolicy meeting of theFed.Concernsabout theU.S. economy and thesituation in Europeremained high. Inaddition, growth in
China appeared to beslowing.
Tuesday, September 27,2011 (1 down gap/807 upgaps)
The market rallied asEuropean officials werereported to be workingon a detailed plan toshore up the stability ofEuropeanbanks.
Thursday, October 27,2011 (9 down gaps/882 up
gaps)Investors reacted
positively to the newsthat the EU wasincreasing its bailoutfund andwas willing totake major losses onGreekbonds.
Tuesday, November 1,2011 (949 down gaps/2 upgaps)
Markets were joltedby Greece’s surprising
decision to hold areferendum on aEuropean rescuepackage.
Monday, November 21,2011 (644 down gaps/1 upgap)
Political inaction onbothsidesoftheAtlanticworried investors. Theywere frustrated with thelack of progress inEurope concerning the
Eurozonecrisisandwiththe failure of theCongressional “super-committee” to reach adeal over budget deficitcuts.
Monday, November 28,2011 (1 down gap/626 upgaps)
Stronger thanexpected Black Fridaysales by retailers and anincrease in new home
sales boosted optimisminthemarket.
Wednesday, November30, 2011 (1 down gap/1065upgaps)
Stocksralliedonnewsthat the world’s topcentral banks werecoordinating efforts tohelp the globaleconomy.
Thereisanoldmaximthat
says “what goes aroundcomesaround.”TheAustrianstatesman Prince Metternichonce said “When Parissneezes, Europe catches acold”—or at least somethingquite similar. (There is somedispute about the exactquote.) This quote was lateralteredbymanytobe“Whenthe U.S. sneezes, the worldcatches a cold.” However,looking at the precedinginternational relationships,
something such as “WhenEurope or Asia sneezes, theUnitedStatescatchesacold”may now be moreappropriate.Looking at the high gap
days chronologicallyhighlights the clustering ofthese dayswithin theAugustthroughNovember2011timeperiod.Figure8.3shows thatfour of these high gap daysoccurred within the 7-day
tradingperiodofAugust29–September 7, 2011.Monday,August29,wasahighupgapday and the S&P500 indexrose. On each of thefollowing2days,theS&P500index rose slightly.Thursday’s decline in theS&P500 erased those gains.Then, on Friday, September2, a high gap down dayoccurred. The S&P500dropped, more than erasingMonday’s gains, leaving the
S&P500downslightlyfortheweek. The next 3 days wereLabor Day weekend, soTuesday, September 6, wasthe next trading day. OnTuesday the S&P500experienced another downmove and562 stocksgappeddown. After 2 consecutivehighdowngaptradingdays,ahigh up gap day occurred onWednesday,September7.You might think that 4
high gap trading daysclustered so close togetherwould indicate some majormovement in the market.However, Figure 8.1 tells adifferent story. The S&P500dropped approximately 14%over the July 25–August 8timeframeandthenenteredacongestionarea.Thefrequenthigh gap days wererepresentative of marketindecision and the battlebetween buyers and sellers
wasmore than a push of themarket in a particulardirection.On days with a large
number of gaps, it wouldseem reasonable that theremightalsohavebeengaps insome of the major marketindexes.However, that isnotnecessarily the case. Figure8.2showsthebehavioroftheS&P500IndexandSPYoverthe latter part of 2011. The
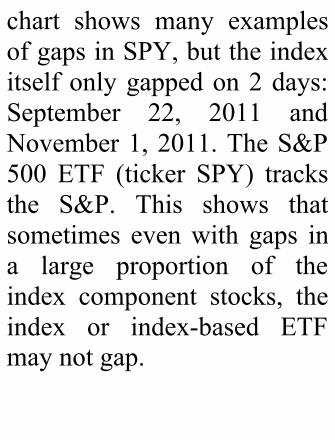
chart shows many examplesofgapsinSPY,buttheindexitselfonlygappedon2days:September 22, 2011 andNovember1,2011.TheS&P500 ETF (ticker SPY) tracksthe S&P. This shows thatsometimes evenwith gaps ina large proportion of theindex component stocks, theindex or index-based ETFmaynotgap.
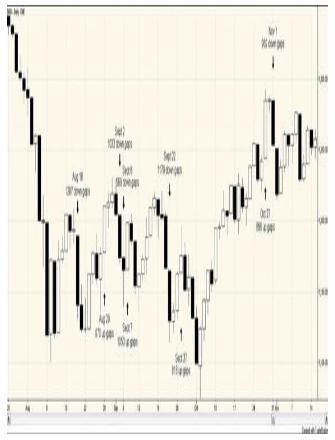
CreatedwithTradeStationFigure8.2.Dailychart
fortheS&P500Index,July25–November15,2011
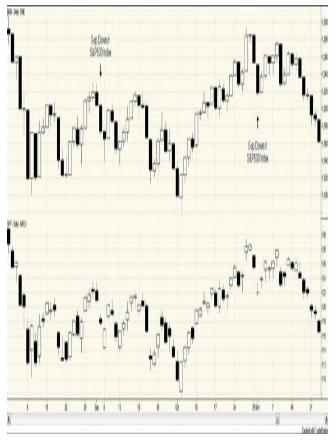
CreatedwithTradeStationFigure8.3.DailychartfortheS&P500Index
($INX)andSPY,August1–November23,2011
TradingHighGapDaysWhat types of trading
opportunities might theselargegapdayspresent?Threepossible approaches are
discussed. First, high gapdaysmightprovidesometypeof market timing signal. Forexample, if an investorobserved a large number ofup gaps on a given day, hemight buy shares of SPY,with the hope that the S&P500 Index was headed up.This would be taking acontinuation approach.Alternatively, he could sellSPY, counting on a reversal.With either approach the
investorwould be looking tothelargenumberofgapsasasignal regarding futuremarket direction. A secondapproachwouldbe tobuyorsell some of the stocks thatwere part of the group ofstocks gapping in the samedirection.Thiscouldbedoneeitherwithacontinuationorareversaloutlook,so itwouldbe similar to the firstapproach, but trading theindividual stocks rather than
an index-based ETF. A thirdapproachwouldbe tobuyorsell the few stocks thatgapped in the oppositedirection from the pack. If562 stocksgappeddownandonly one gapped up, surelythere is something unusualwith that stock that may ormay not present a tradingopportunity.Nowexamineallthreepossibleapproaches.Begin by examining the
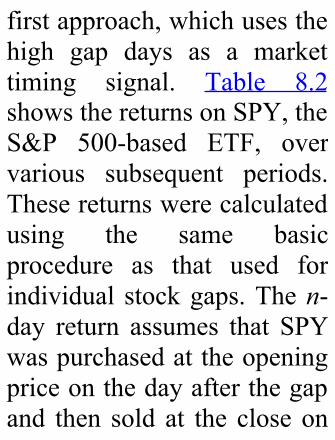
firstapproach,whichusesthehigh gap days as a markettiming signal. Table 8.2showsthereturnsonSPY,theS&P 500-based ETF, overvarious subsequent periods.Thesereturnswerecalculatedusing the same basicprocedure as that used forindividual stockgaps.Then-day return assumes that SPYwaspurchasedattheopeningpriceonthedayafterthegapand then sold at the closeon
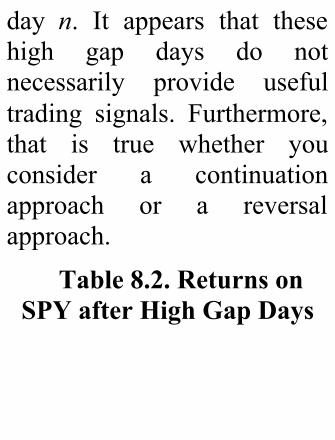
day n. It appears that thesehigh gap days do notnecessarily provide usefultrading signals. Furthermore,that is true whether youconsider a continuationapproach or a reversalapproach.
Table8.2.ReturnsonSPYafterHighGapDays
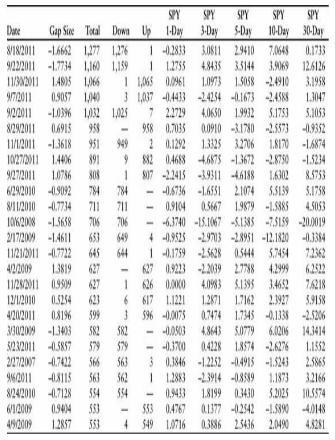
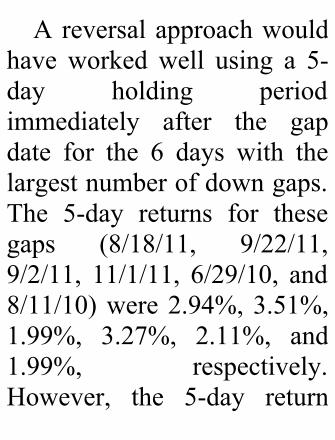
Areversalapproachwouldhaveworkedwell using a 5-day holding periodimmediately after the gapdate for the 6 days with thelargestnumberofdowngaps.The 5-day returns for thesegaps (8/18/11, 9/22/11,9/2/11, 11/1/11, 6/29/10, and8/11/10)were2.94%,3.51%,1.99%, 3.27%, 2.11%, and1.99%, respectively.However, the 5-day return
following the 10/6/08 gap,which was the day with thenext highest numberof gaps,was–5.14%(the3-dayreturnwas–15.11%).Therewere14highdowngapdays inTable8.2.Theaverage5-dayreturnfor a reversal strategyfollowing these 14 days was1.02%, which is quite good.In addition, the return waspositive for 10 of the 14instances.Theseresultsmightlead you to the idea that a
reversal strategy followingthe high gap days would bethewaytoapproachthings.However,lookingatthe11
days with a high number ofup gaps might make youpause. The average 5-dayreturn for a reversal strategyin this casewouldhavebeen–0.53%. A reversal strategy(using a 5-day holdingperiod) would have beenprofitable for only 4 out of
the11instances.Whatifyoutook a long position afterevery high gap day,regardless of gap direction?Theaverage5-dayreturnwas0.80%, which annualized ismore than 40%. However,ignoring the gap directionseems rather odd. Twenty-fiveobservations isnotabigsample and the variability intheresultsisquitehigh.Is there any reliable
strategy for using these highgap days to time the marketas a whole? If there is, theauthorsdidn’tseeit.But,thatcertainly doesn’t mean thatit’s not there. The high gapdaysaredefinitelyintriguing.Intuitively you would thinkthat they must contain somevaluable information aboutfuturemarketdirection.A second approach would
be tobuyorsellsomeof the
individualstocksthatarepartof the large group of stocksgappinginthesamedirection.Table 8.3 addresses thisapproach. First consider thedays with a high number ofdown gaps. The 1-day return(bothunadjustedandmarket-adjusted) is negative for thestocksthatgappeddown.But,the 3, 5, 10, and 30 returnsare all positive. The tradingidea would be to perhaps goshort on the down-gapping
stocks on the day after thegap, looking for a downwardcontinuation.But,afterDay1it appears that it would bebettertobelong,hopingforareversal. The magnitude ofthe returns is quite high,whichiscertainlyintriguing.
Table8.3.ReturnsforStocksThatGaponHigh
DownGapDays
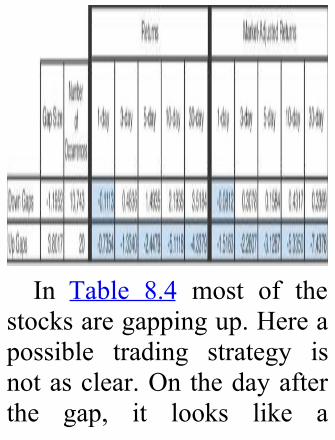
In Table 8.4 most of thestocksaregappingup.Hereapossible trading strategy isnotasclear.Onthedayafterthe gap, it looks like a
continuation strategy wouldbe best because the 1-dayreturns on the up-gappingstocksarepositive.But,afterDay1thestocks,onaverage,reverse direction, whichwould mean switching to areversal strategy. For thedown gap strategy, all thereturns after Day 1 were thesamesign,positive.However,that is not true for the upgaps.Someofthe5-,10-,and30-day returns are positive
and some are negative. Thereversal approach looksattractivebetweenDays1and3, but past that it’s hard tosay.
Table8.4.ReturnsforStocksThatGaponHigh
UpGapDays
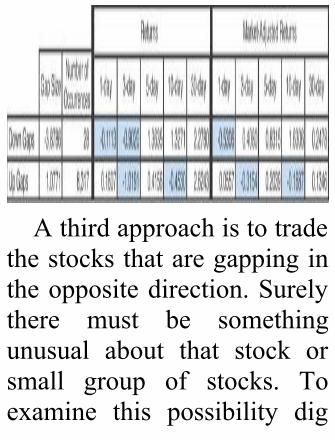
Athirdapproachistotradethestocksthataregappingintheoppositedirection.Surelythere must be somethingunusual about that stock orsmall group of stocks. Toexamine this possibility dig
into the details of the stocksin Table 8.3 that fought theherd. The returns for thestocks that gapped up whenalmost all the rest weregapping down are quiteintriguing. All ten returnnumbers across the row arenegative and the returnsincrease in magnitude as theholding period increases. Areversal strategy, going shorton the stocks that gap, looksattractive.Butthesamplesize
is small; there are only 20observations.Looking at the down-
gapping stocks, when largenumbers are gapping up, thereturns(refertoTable8.4)forthe first few days arenegative.AfterDay3though,theyturnpositive.Thiswouldsuggest that initially acontinuation strategy mightbe best, but that price mayreverse direction fairly soon.
The sample size here is stillsmall,only28.The number of stocks
buckingthetrendonthehighgap days is small, but thestocks appear to presentinteresting tradingopportunities when they dooccur.Itcanbeworthwhiletodrill down to a deeper level,trying to understand whathappens in these situations.Therefore, consider some of
the specific circumstancesconcerning the stocks thatmove counter to the rest ofthepackonhighgapdays.Only one stock gapped up
onAugust 18, 2011whereas1,276 gapped down: CentralGoldTrust(GTU),whichisaCanadian company thatinvests primarily in goldbullion.Asyou just saw,notonly did a record number ofstocks gap down on August
18,butalsotheDJIAdroppedmore than 400 points amidglobal economic concerns.Because many investors turnto gold—wanting hard assetsrather than financial assets—when they are nervous, itmakes sense that this stockhadagooddayonAugust18.AsshowninFigure8.4,GTUcontinued moving up duringpartofthedayonthe19thbutcloseddownon the19th andthe following 3 trading days
(August 22, 23, and 24). Aspart of its downward move,GTU had a large down gapon August 23. How didGTU’smove compare to theoverallmarketthosenextfewdays?SPYcontinuedmovingdown on August 19 and 22but turned up fairly stronglyonthe23rd,closinghigheronthe23rdand24th.
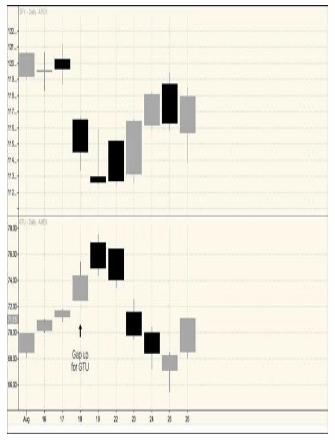
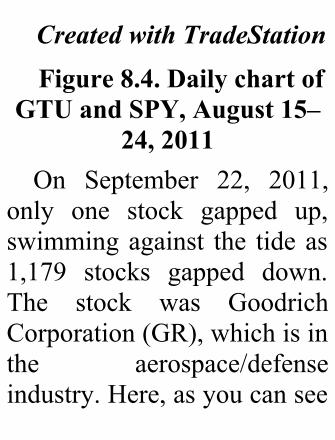
CreatedwithTradeStationFigure8.4.Dailychartof
GTUandSPY,August15–24,2011
On September 22, 2011,only one stock gapped up,swimmingagainst the tideas1,179 stocks gapped down.The stock was GoodrichCorporation(GR),whichisinthe aerospace/defenseindustry.Here,asyoucansee
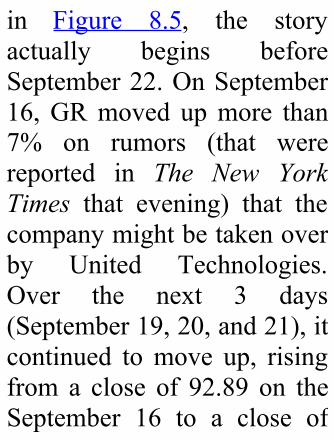
in Figure 8.5, the storyactually begins beforeSeptember22.OnSeptember16,GRmoved upmore than7% on rumors (that werereported in The New YorkTimes that evening) that thecompanymightbetakenoverby United Technologies.Over the next 3 days(September19,20,and21),itcontinued tomove up, risingfrom a close of 92.89 on theSeptember 16 to a close of
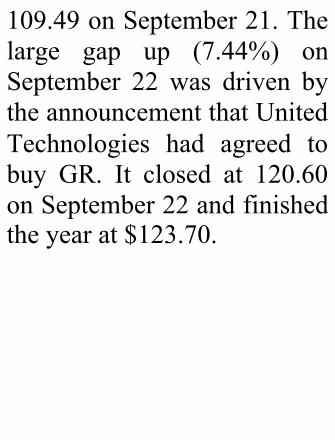
109.49onSeptember21.Thelarge gap up (7.44%) onSeptember 22 was driven bytheannouncementthatUnitedTechnologies had agreed tobuy GR. It closed at 120.60onSeptember22andfinishedtheyearat$123.70.
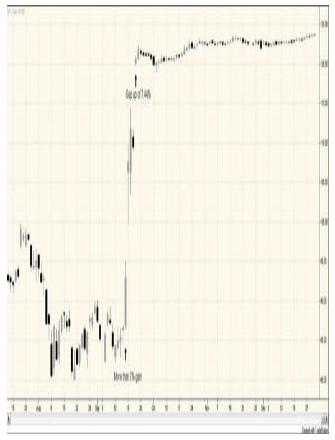
CreatedwithTradeStationFigure8.5.Dailystock
chartforGR,August13–December31,2011
Omnivision Technologies,Inc. (OVTI) was the onlystock that gapped down onNovember 30, 2011. Thedrop followed the release ofits latest quarterly financials,which the market founddisappointing. The same
thing had happened theprevious quarter when thestock gapped down onAugust 26, resulting in apricedropof30%inoneday.YoucanseeinFigure8.6thatOVTI’s high was slightlymore than 35 on July 1. OnNovember30,thelowforthedaywas10.15,quiteadropinjust five months. The 5-dayreturnafterNovember30was18.4%. There was a goodopportunity to make money
by betting on a short-termreversalandgoinglongOVTIat the open on Thursday,December 1, but theopportunity probably wouldhavebeendifficulttoforesee.
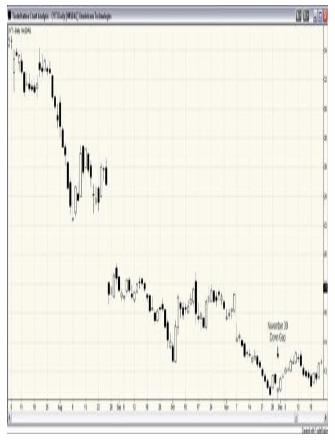
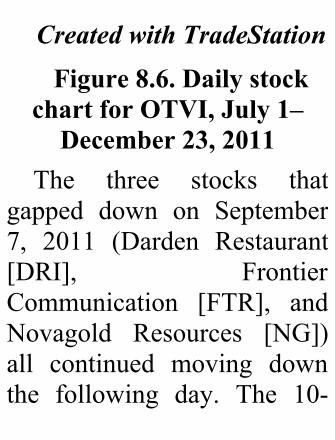
CreatedwithTradeStationFigure8.6.Dailystock
chartforOTVI,July1–December23,2011
The three stocks thatgapped down on September7, 2011 (Darden Restaurant[DRI], FrontierCommunication [FTR], andNovagold Resources [NG])all continued moving downthe following day. The 10-
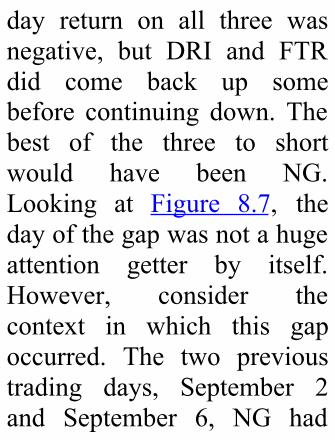
day return on all three wasnegative, but DRI and FTRdid come back up somebefore continuing down. Thebest of the three to shortwould have been NG.Looking at Figure 8.7, thedayofthegapwasnotahugeattention getter by itself.However, consider thecontext in which this gapoccurred. The two previoustrading days, September 2and September 6, NG had
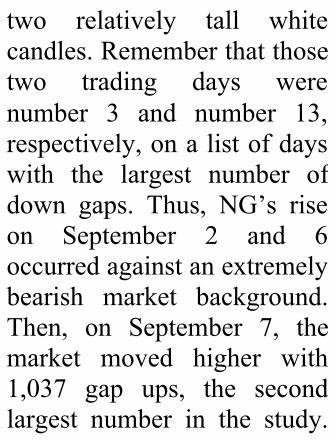
two relatively tall whitecandles.Rememberthatthosetwo trading days werenumber 3 and number 13,respectively,onalistofdayswith the largest number ofdown gaps. Thus, NG’s riseon September 2 and 6occurredagainstanextremelybearish market background.Then, on September 7, themarket moved higher with1,037 gap ups, the secondlargest number in the study.
As one of only three stocksthat gapped down that day,NGwasdefinitelyswimmingagainstthetide.
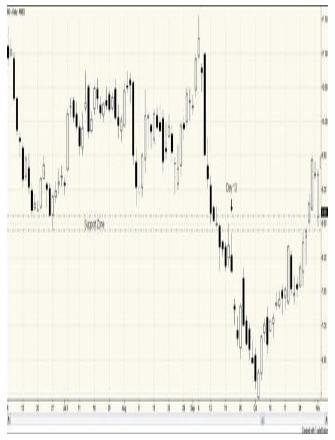
CreatedwithTradeStationFigure8.7.DailystockchartforNG,June6–November1,2011
AtradershortingNGattheopen on September 8 wouldhaveenjoyedaniceprofit asthe stock continued down,punching through support atabout8.60.The10-dayreturnwouldhavebeen28.77%.OnDay 11, another gap down
occurred,andashortpositionwould have continued to beprofitable as the stockdropped steadily, finallybottoming just below 6 onOctober4.Unlike NG, FTR fell on
September2andSeptember6along with the broadermarket.Insteadofreboundingon September 7 as much ofthe rest of the market did,however, FTR gapped down.
An investor who, thinkingthis downtrend wouldcontinue, went short at theopen on September 8,wouldhavehadaprofitbyDay10.AsshowninFigure8.8,FTRcontinued in a downtrendthroughtheendof2011.
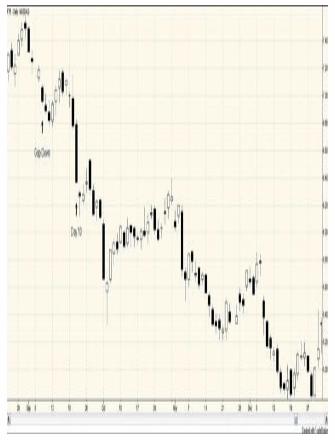
CreatedwithTradeStationFigure8.8.Dailystock
chartforFTR,September24–December31,2011The third stock to gap
down on September 7, DRI(see Figure 8.9), had alsofallen the two previous daysalong with the broadermarket. DRI was one of the1,025 stocks that gappeddownonSeptember2.Unlike
the broader market, DRI didnot recover on September 7;insteaditgappeddownagain.InvestorswhoshortedDRIatthe open on September 8wouldhavepositive1-,3-,5-,and 10-day returns, althoughthe stock was in a tradingrangefortherestof2011.
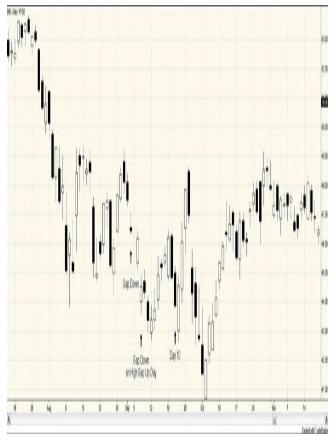
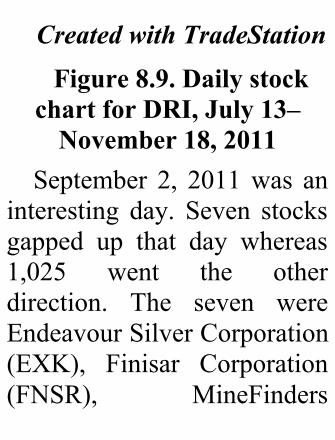
CreatedwithTradeStationFigure8.9.Dailystock
chartforDRI,July13–November18,2011
September 2, 2011was aninteresting day. Seven stocksgapped up that day whereas1,025 went the otherdirection. The seven wereEndeavourSilverCorporation(EXK), Finisar Corporation(FNSR), MineFinders
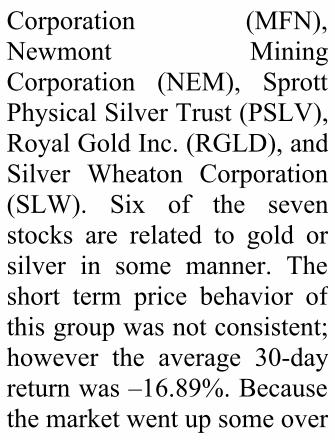
Corporation (MFN),Newmont MiningCorporation (NEM), SprottPhysicalSilverTrust(PSLV),RoyalGoldInc.(RGLD),andSilver Wheaton Corporation(SLW). Six of the sevenstocks are related to gold orsilver in some manner. Theshort term price behavior ofthisgroupwasnotconsistent;however the average 30-dayreturnwas–16.89%.Becausethemarketwentupsomeover
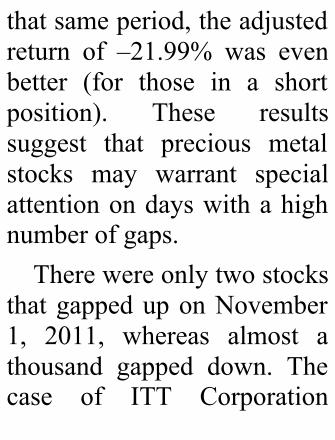
thatsameperiod,theadjustedreturn of –21.99% was evenbetter (for those in a shortposition). These resultssuggest that precious metalstocks may warrant specialattentionondayswithahighnumberofgaps.Therewereonlytwostocks
thatgappeduponNovember1, 2011, whereas almost athousand gapped down. Thecase of ITT Corporation
(ITT) on that day wasunusual. Reverse splits arenot too common, but ITTunderwent a 1:2 reverse splitonthatday.Inadditiontothesplit, ITT shareholders ofrecord as of October 17 alsoreceived one share of ExelisInc. (XLS) and one share ofXylem Inc. (XLY) onOctober 31. The ex-distribution date for thedistribution and the reversesplit was November 1. The
two other stocks that gappedup on the November 1 wereLeap Wireless InternationalInc.(LEAP)and(VRUS).We have discussed the
specific stocks that for theseven days with the highestnumberofgapsweregappingcounter to the crowd, goingthrough things day by day.What are some of thecommon factors that causedstocks to go in the opposite
direction from the rest of thecrowd?One common cause for
gaps is reaction to earningsreports.OnOctober27,2011,only 9 stocks gapped downwhereas 882 gapped up. Ofthe9stocksgappingdown,8of the gaps were negativereactions to earnings reports.Similarly, onApril 20, 2011,only 3 stocks gapped down,all on disappointing earnings
reports.Many gaps are related to
merger and acquisitionactivity, as previouslydiscussed in Chapter 3. Agood example of how astock’s price may exhibitsomewildgyrationsaroundahostile takeover bid occurredduring June–September,2011, with Temple-Inland(TIN).OnSeptember6,2011,while 562 stocks gapped
down that day, Temple-Inland (TIN) was the lonestock to gap up. News thatInternational Paper hadfinally reached an agreementwith Temple-Inland afterincreasing its previous bid to$32per share sent the sharesupbyabout25%toacloseof30.85. However, thefireworks had started earlier.TIN had previously gappedup by approximately 40% tonear$30onJune7.Thenews
that drove that upward pricejump was unusual. TIN hadadoptedapoisonpilldefensein an attempt to fend off ahostile takeover byInternational Paper. OnAugust18,TINgappeddownalongwith1,286otherstocks,losing approximately 7% ofitsvalue.Thatmovetooktheprice back down below $26.But another big down gapwas still just slightly upahead. On August 23, TIN
droppedanother14%,closingat21.33.Thepriceevenwentas low as 19.03 at one pointduring that day.This drop inprice came from anotherdirection.TINwas suedoverthe 2009 failure of a Texasbank that it had spun off in2007.Sointhespaceofjust3months,TINhadexperiencedtwoup gaps, eachmore than25%, and two down gaps,eachmorethan7%.
Thereisplentyofevidencethat themarketusuallyreactsnegatively whenever acompany issues more stock.On September 27, 2011,Coffee Holding Company(JVA) gapped down andclosed down by 15.6%whereas 807 other stocksgapped up. JVA had moveddown in response to anannouncement that thecompany had entered into anagreement with some
institutional investors to sell890,000 units that consistedofoneshareofcommonstockperunit and three-tenthsofawarrant for one share ofcommon stock. Similarly, onApril 9, 2009, the marketreacted negatively to EquityOne’s (EQY) announcementthat it was selling additionalstock to raise cash. Themarket also did not likeOmnicare’s (OCR)announcement on December
1, 2010, that it was raisingmoney by issuing someConvertible Senior SecuredNotes. This caused the stocktogapdown,closingdownby3.6% (issuing notes is lessdistasteful to investors),whereas 617 other stocksgappedup.Most of the events that
caused some stocks to moveoppositetothepackonthe25dayswith the largest number
of gaps have been discussed.As you saw, there is usuallysome significant piece ofnews that is the cause. Nowreturn to the question: Dostocksthatgoagainsttherestof the herd offer tradableopportunities? In general,probably not.Although thereare certain common causes(earnings announcements,takeovers, issuance ofsecurities, and so on) eachcase is unique. Price moves
subsequenttothegapscanbelarge.TheoverallaveragesinTables 8.3 and 8.4 lookintriguing, but approachwithcaution. These types of gapsprobably warrantinvestigation on a case bycasebasis.
MarketMovementsandGapTradingNext turn to a different
question: Should market
movements influence yourindividual stock gap-basedtrading decisions? Forexample, assume that themarket has been in a stronguptrend and you areconsidering whether to golongorshortwithstocksthathave gapped up. Do you golong,stayingwiththestock’supward movement and themarket’s upward movement,or doyouperhaps look for areversal?
UsingthesameSPDRS&P500(SPY)pricedataweusedto calculate market-adjustedreturns,wecalculate1-,3-,5-,10-,30-,and90-dayreturnsfor each trading day fromJanuary1,1995,toDecember31,2011.Tocalculate the3-dayreturn,wefirstsubtractedtheclosingpricefromDay–3price for Day 0 and thendivided that result by theclosing price from Day –3.Similar calculations were
done for the other timeintervals.Also,we used datafromthelast90daysin1994to calculate the 90-day (andother intervals) returns as ofJanuary 1, 1995. So for eachdayinoursampleperiod,wehad market returns for sixdifferent time periods endingonthedayinquestion.We then transformed the
percentage returns intodiscrete categories somewhat
alongthelinesofwhatwedidwith volume using twodifferent approaches, whichwas discussed in Chapter 6,“Gaps and Volume.” In thefirstapproach,wecategorizedthemarketdirectionaseither“up” or “down.” Forexample, if the 5-daymarketreturn was positive (or zero,which occurs with very lowfrequency)themarketwasupfor that period. If the returnwasnegative, themarketwas
down. So this variableassociated with the 5-dayreturn had only two possiblevalues: up or down. Nowconsider the results from thisapproach before moving tothesecondapproach.Table8.5recapstheresults
fordowngaps,whereasTable8.6 recaps the results for theupgaps.Theupperhalfofthetable deals with the marketmoving down, whereas the
lower half is for when themarket moves up. Thenegative returns are shaded.At the simplest level ofanalysis, you can ask thesamequestionforbothtables:Does the pattern of shadinglook similar between theupperhalfofthetableandthelower half? If prior marketmovement has an importantimpactonreturns,youshouldseedifferentpatterns.
Table8.5.ReturnsforDownGapsWhenthe
MarketDirectionIsDownandUp
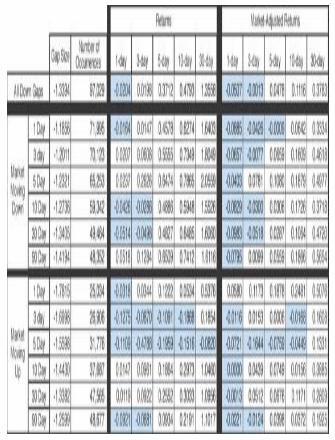
Table8.6.ReturnsforUpGapsWhentheMarketDirectionIsDownandUp
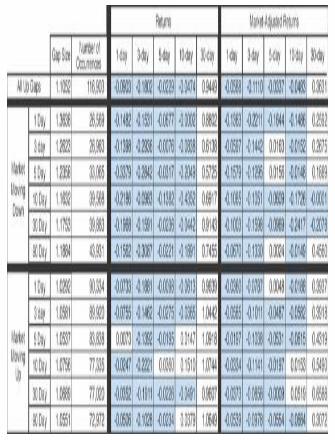
Theshadingpatternsintheupper half of the table looksimilartotheshadingpatternsin the lower half for bothtables. The shading patternbetween the two tables isdifferent; one table is fordown gaps and the other isfor up gaps. Therefore, gapdirectiondoesseemtomakeadifference. But, within eachtable separately, the top halfappears to be similar to the
bottomhalf.Thatwouldpointtoward the conclusion thatprior market movement isirrelevant.Butthereisalittlemoreto
the story, at least concerningdown gaps. Look at thedifferences in the valuesbetween the upper half andlower half of each table. Forthe up gaps (Table 8.6) youdon’t see any particularpatterntothedifferences.But
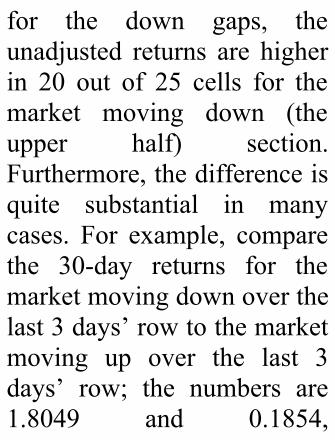
for the down gaps, theunadjusted returns are higherin 20 out of 25 cells for themarket moving down (theupper half) section.Furthermore,thedifferenceisquite substantial in manycases. For example, comparethe 30-day returns for themarketmovingdownoverthelast3days’rowtothemarketmoving up over the last 3days’ row; the numbers are1.8049 and 0.1854,
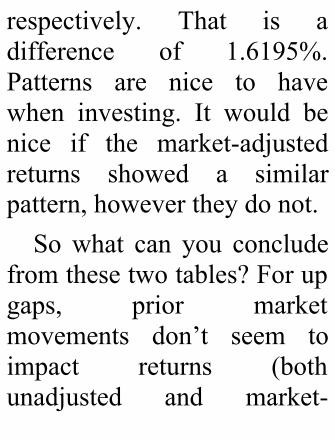
respectively. That is adifference of 1.6195%.Patterns are nice to havewhen investing. It would benice if the market-adjustedreturns showed a similarpattern,howevertheydonot.Sowhat can you conclude
fromthesetwotables?Forupgaps, prior marketmovements don’t seem toimpact returns (bothunadjusted and market-
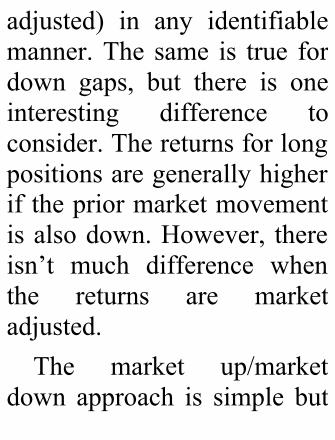
adjusted) in any identifiablemanner.The same is true fordown gaps, but there is oneinteresting difference toconsider.Thereturnsforlongpositionsaregenerallyhigherifthepriormarketmovementisalsodown.However, thereisn’t much difference whenthe returns are marketadjusted.The market up/market
down approach is simple but
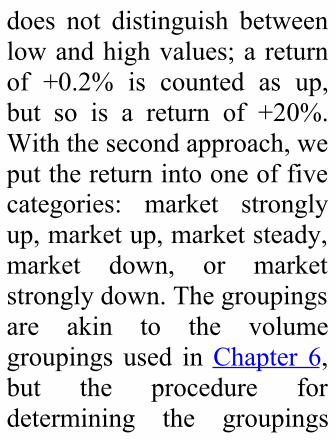
does not distinguish betweenlowandhighvalues;areturnof +0.2% is counted as up,but so is a return of +20%.Withthesecondapproach,weputthereturnintooneoffivecategories: market stronglyup,marketup,marketsteady,market down, or marketstronglydown.Thegroupingsare akin to the volumegroupings used inChapter 6,but the procedure fordetermining the groupings
wasquitedifferent.Thesameprocedurewasusedforthe1-, 3-, 5-, 10-, 30-, and60-daymarket returns, but we usedthe 1-day returns to describethe process. We took all the1-day market returns for all17 years in the study andsorted them from lowest tohighest. Then we identifiedthebottom10%,bottom25%,top25%,and top10%of thereturns. If the return was inthebottom10%,welabeledit
as“marketstronglydown.”Ifitwasinthebottom25%,welabeled it as “market down.”Wedesignatedthetopreturnssimilarly.All returns that fellinthemiddlewerelabeledas“marketsteady.”This approach does have
some problems with it. Datais used in later periods todetermine a value forsomethingthatoccurredinanearlier period.An investor in
1995wouldhavehadnowayto know whether, forexample, the 5-day marketreturn thatwas just observedwould have been a case thatcould be considered “marketstrongly down” relative tomarketreturnsoverthe1995–2011 time period. Therefore,the analysis using thisapproach merits somecaution.Tables 8.7 and 8.8 show
the results from this secondapproach. Again, focus onwhether market movementsshouldhaveabearingonhowyou analyze gaps. Considertheextremecasesfirst.Focuson the “market stronglydown” versus the “marketstronglyup”sectionsinTable8.7. Do you see much of adifference?Yesandno.Thereare 60 data cells in theunadjusted and market-adjusted entries in the
“market strongly up” sectionof the table.All but 4 of the60 have positive values. Ifyou look at the “marketstronglydown”section, thereare 42 cells with positivevalues, about two-thirds ofthe values. So overall theresults are somewhat similar.However, most of thenegative values in the“market strongly down”section are in the upper-leftcornerofthetwosubsections
(“Returns” and “Market-Adjusted Returns”). Whatdoes this tell you concerninganinvestmentstrategy?
Table8.7.ReturnsforDownGapsinVariousMarketConditions
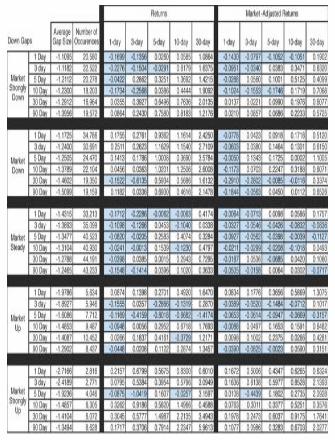
Table8.8.ReturnsforUpGapsinVariousMarket
Conditions
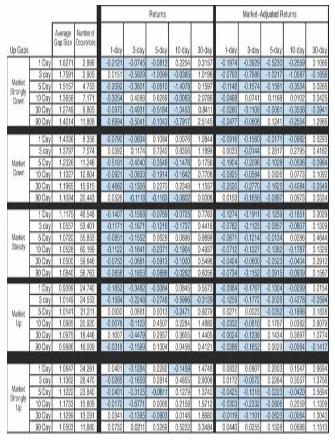
You generally want to golongonadowngapexpectinga reversal regardless of thepriormarket direction.But ifthemarket has been stronglydownoverjustthelast1,3,5,or 10 days, then thedownwardmoveof the stockmaycontinueforthenext1to5days.Another difference
between the two strongmovement scenarios is that
the returns are larger in 54out of the 60 cells for themarket strongly up sectioncompared to the marketstronglydownsection.Soanyreversal that may occur isprobablygoingtobestrongerifthemarketisupstrongly.Comparing the market
down to the market upsections, thepicture is not asclear.Themoststrikingthingtoobserveincomparingthose
sections is that the returns(but not the market-adjustedreturns) are lower for themarket down section in allbut2ofthe30cells.For up gaps the prior
marketconditionsdon’tseemtomattertoomuch.DoingthesametypesofcomparisonsinTable 8.7 that you did inTable 8.6, you can see thereisn’t a marked differencebetween returns when the
prior market movement wasupversusdown.Thiswasthesame conclusion reachedwhenanalyzingTable8.5.So,concluding thissection
of thechapter,shouldmarketmovements influence yourindividual stock gap-basedtrading decisions? For upgapstheansweris“no”basedon the analysis ofTables 8.5and8.6.Downgapsareabitmorecomplicated.Ingeneral,
returns are higher for longpositions when the priormarket movement has beendown.Generally,youwanttogo long on a down gapexpecting a reversalregardlessofthepriormarketdirection. But if the markethas been strongly down overjust the last 1, 3, 5, or 10days, then the downwardmove of the stock maycontinue for the next 1 to 5days.
SummaryThis is the longest chapter
and there has been much todigest.Youbeganbylookingat the 25 days with thehighestnumber(553ormore)ofgaps.All25haveoccurredsince 2007 and 14 were in2011. This is anotherway inwhich market volatility hasbeen manifested. Theunderlying causes behindthese high gap days was
discussed;manywereheavilyinfluenced by events outsidetheUnitedStates.From an investing
perspective, you looked athigh gap days to see if theygave you any clue aboutfuture market direction. Forexample, ifahighnumberofstocks gapped up on aparticularday,isthatasignalthat the market is headed upor headed down? It did not
appear that high gap daysdominated by gaps in aparticular direction givereliable market timingsignals.You considered two other
ideastomakeuseofthehighgap day list. One idea is tolook to the dominant groupforguidance.Forexample, ifmanystocksgappedand99%of them gapped up, do thosestocks that gapped up
represent some type oftradingopportunity?Fordayswith a high number of downgaps, the best idea seems tobe to go short on the down-gapping stocks on the dayafter the gap, looking for adownward continuation. But,afterDay 1 it appears that itwould be better to be long,hoping for a reversal. AfterDay 1 it appeared that beinglong is a solid idea. Themagnitude of the returns is
quitehigh,which is certainlyintriguing.Thedatasuggestasimilar approach to tradinggap up stocks on a daywithmany up gaps. For Day 1prices are likely to continuemoving up; a continuationapproach looks best. AfterDay 1 a reversal strategylooksbetter,but theevidencehere was not as strong as itwasforthedowngaps.A second way to use the
highgapdaylistwouldbetofocusonthesmallnumberofstocksmovingoppositetotheherd. The returns here seemto offer some nice potential.But given the small samplesize you dug into the detailsto see what was causing thisgrouptomoveinanoppositedirection from the majority.What you saw is that somedramatic company-specificevent was the cause.Although there appears to be
somepotentialinfocusingonthis group of stocks, eachcase needs to be consideredseparately.You also examined
whether prior marketmovements should influencegap-based trades. Forexample, assume that themarket has been in a stronguptrend and you areconsidering whether to golongorshortwithstocksthat
have gapped up. Do you golong,stayingwiththestock’supward movement and themarket’s upward movement,or doyouperhaps look for areversal? For up gaps, youfound that prior marketmovements had little impact.For down gaps it does havesome impact. Generally golongonadowngapexpectinga reversal regardless of thepriormarketdirection.But,ifthemarket has been strongly
downoverjustthelast1,3,5,or 10 days, the downwardmove of the stock maycontinue for the next 1 to 5days.
Chapter9.ClosingtheGap
Thegapmustbeclosed”isan often-heard saying amongtraders.Thissaying,however,seems to be based on lorerather thanonhardevidence.Theideais thatagapcreatesavoidinthepriceonastockchart, and there is a naturaltendency for marketparticipants to want to “fill
the gap” so that no visualvoid appears on the chart.Even those who claim that agap must be closed differwidely in theirinterpretations. Some thinkthat the gap will closequickly,within a few tradingdays; others talk about thisoccurringoveramuchlongertime period, perhaps evenyears.The criterion used
throughout this book todefineagapisthatoneday’spriceactionliestotallyoutofthe range of the previousday’s price action. Thus, foran up gap, the Day 0 lowmustbehigherthantheDay–1 high. For a down gap, theDay 0 high must be lowerthan the Day –1 low. Incandlestickterms,thecandlescannotoverlap—noteven thewicks of the candles. Thischapter considers the closing
ofgaps.What does it mean for a
gap to close? Say a stockgaps up. For a gap up toclose, the low of somesubsequent day needs to belower than the Day 0 high.Some gaps close quickly,whereasothersmaynotcloseforverylongperiodsoftime.
TimingofClosingGaps
As we considered howlong it takes for a gap toclose, some timing issuesbecamecritical, leadingus toconsider gaps from a shorterperiod of time than we hadearlier in this book.Throughout this book, weconsideredgapsthatoccurredthrough December 2011.Lookingatgapsthatoccurredlate in the time horizon—inDecember 2011, for example—it is quite possible that
somegapswouldnotclosebythe time of this writing butwould close soon afterward.We knew that we needed toprovide plenty of time afterthegapsoccurredtoallowforclosures.We wanted to examine
how long it takes forgaps toclose.Many of the gaps thatoccurred in December 2011,for example,would not havebeen closed by the end of
December2011.Weknewweneeded to consider gaps thatoccurred long enough ago toallow more time for gaps toclose. This, by itself, wouldencourage us to focus on anearly period of our dataset,perhaps the earliest year of1995.But,wewantedtostayasclosetotheendof2011aspossible. As we have seen,the incidence of gaps hasincreased dramatically inrecent years, suggesting that
gapping behavior itself maybe fundamentally changing.General market conditionsalsocanhaveaninfluenceonthe closing of gaps. It iseasierfordowngaps toclosethan for up gaps to closewhen the market is trendingup. Thus, looking at a fairlyrecent time period that wasnot too biased as far as anuptrendoradowntrendinthemarket, but which was farenough back to provide time
for gaps to close, wasessential.As a compromise between
the various considerations,wechoseto lookatgapsthatoccurred between January 1,2010, and June 30, 2010.Asshown in Figure 9.1, themarket had several up anddown moves over that timeperiod, so it wasn’t undulybiased toward the closing ofgaps in a certain direction.
Westoppedourcomputationsconcerningwhetherornotthegap closed at the end ofDecember 2011. This gaveevery gap in the period atleast a year-and-a-half toclose.
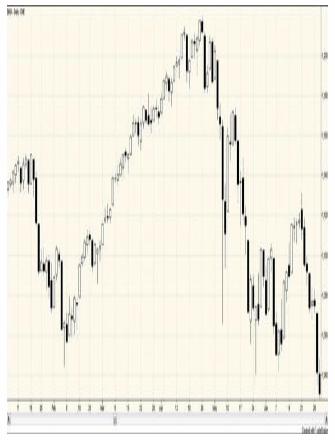
CreatedwithTradeStationFigure9.1.DailychartfortheS&P500Index,January5–June30,2010DuringtheJanuarythrough
June2010 timeperiod,1,702unique stocks experienced atleast one gap. For thosestocks, 10,766 gaps that mettheliquiditycriteriaoccurred.Of these 10,766 gaps, 5,373wereupgapsand5,393were
down gaps. For up gaps, themedian time to close was 5days.For thedowngaps, themedian time to close was 6days. Therefore, it appearsthat about half of the timegaps will close in about aweek(5tradingdays).Nowlookat theclosingof
upgaps a littlemore closely.Figure9.2 shows thenumberofupgaps thatclosedwithin25 days of gapping. About
22.6% of the up gaps closethedayafterthegap.Another11%of the up gaps close onDay 2. Thus, over one-thirdof theupgapsclosewithin2days.Overhalf(53.6%)ofupgaps closed by Day 5. ByDay 8, two-thirds of the upgapsclosed.
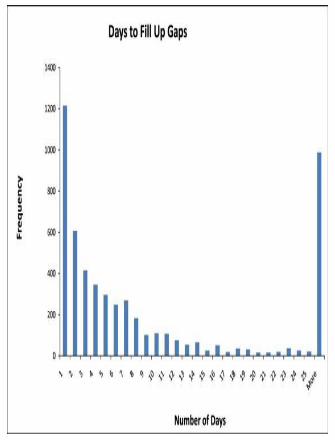
Figure9.2.Numberofupgapsclosedbydays
followinggapAfter trading on Day 25,
only 988 of the 5,373 upgaps, or 18%, had not beenfilled. As mentionedpreviously, December 30,2011 was the cutoff date forthe gaps to close. Every gapin the sample had at leastone-and-a-half years to closebefore this cut-off date; gaps
that occurred earlier in 2010had even longer. By the endof 2011, 216 of the up gapshad still not closed. Thus,about4%of theupgapshadnot closed within at least 18months. For example, theCrocsInc.(CROX)upgaponJanuary 4, 2010 atapproximately$5asharehadstill not closedby the endof2011.Theclosingpriceattheend of the year was $14.77,which meant that it still
needed to drop almost $9more to close the gap thatoccurred almost 2 yearsbefore.InChapter2,“Windowson
Candlestick Charts,” youconsidered some of thewaysin which gaps were used bythose practicing traditionalJapanesecandlestickcharting.One of the rules of thumbfollowed by thesepractitionersisthatifagapis
not closedwithin 3 days, themarket probably has enoughpower to continue its trendfor 13 more sessions. HowdoesthismeshwithwhatyouseefortheclosingofupgapsinFigure9.2?Youdoindeedsee thatmany up gaps,morethan 40%, close within 3days. In the sample, 3,136gapsremainedunfilledafter3days.Did these up gaps tendto have enough power for atrend in the direction of the
gap to continue for 13 moretradingdays?Wesee thatbyDay 11 (8 days after thesuggested 3-day observationperiod), 1,657 of the 3,136gaps that remainedonDay3had been filled.Over half ofthe gaps that had not beenclosed by Day 3 had beenfilledbyDay11.Becausethisis only 8 days after thesuggested 3-day watchperiod, the idea that theunclosed up gap has the
momentum to continue in anuptrend for 13more sessionsisnotsupported.1
You must also be carefulnottoconcludethatbecauseagap has not closed that atrend in the direction of thegapiscontinuing.Lookatthetwo up gaps shown for HotTopic,Inc.(HOTT)inFigure9.3. HOTT gapped up onApril13,2011,andagainthefollowing day. The April 13
gap, labeled Gap A in thefigure, did not close until 17days later.TheApril 14gap,labeledGapB,closed9daysafteritoccurred.GapAisanexampleofagapthatdidnotclosein3daysandcontinuedto be open for 13 moretrading days. However, pricewas not trending upward inthedirectionofthegap;pricewas slowly falling to closethegap.
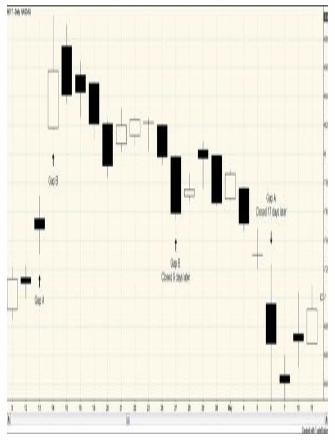
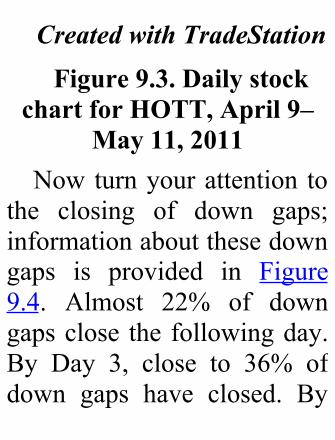
CreatedwithTradeStationFigure9.3.Dailystock
chartforHOTT,April9–May11,2011
Nowturnyourattention tothe closing of down gaps;informationaboutthesedowngaps is provided in Figure9.4. Almost 22% of downgapsclose thefollowingday.By Day 3, close to 36% ofdown gaps have closed. By
Day6,55%ofthedowngapshaveclosed.Two-thirdsofallthedowngapshaveclosedbyDay 11, and three-quartershavefilledbyDay20.
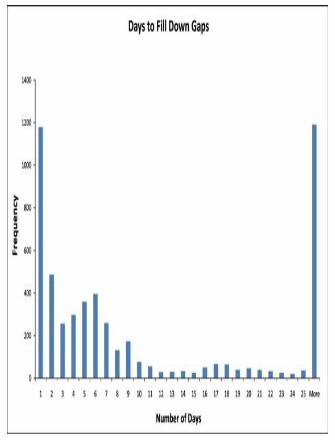
Figure9.4.Numberofdowngapsclosedbydays
followinggapOf the 5,393 down gaps,
1,191 remain open after 25days of trading. Of these1,191 gaps, 173 remainedunclosedby theendof2011.Thus,ofall thedowngaps,alittlemore than3%remainedunfilled over one-and-a-halfyearslater.Anexampleofanunfilled down gap would be
the gap occurring forMonsanto(MON)onJanuary12,2010at$83pershare.Atthe end of 2011, almost 2yearslater,MONwastradinginthe$72range,andthegapremainedunfilled.What about the rule of
thumb or waiting 3 days tosee if a gap remains unfilledto confirm a trend in price?After the closing on Day 3,3,472gapsremainedunfilled.
ByDay11,8dayslater,morethan half of those unfilledgaps were closed. Thus, if agap remains at Day 3,chances are it will be closedby Day 11. Again, thisevidencedoesnotsupportthenotion that the failure of agap to close within 3 dayssuggests that a trend in thedirection of the gap willcontinuefor13moredays.Figure 9.5 shows an
example of a gap that closedquickly. On February 23,2011, Atmos EnergyCorporation (ATO) gappeddown,butthegapclosedin4days, which is slightly fasterthanthemedianof5days.
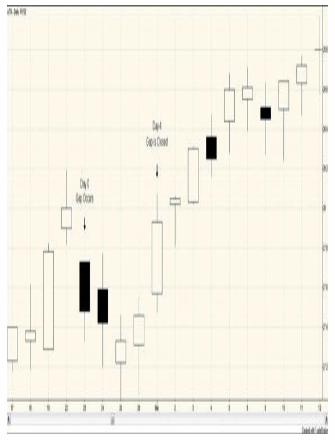
CreatedwithTradeStationFigure9.5.Dailystock
chartforATO,February17–March12,2010
For an example of a gapthat ismuch slower to close,lookattheFebruary28,2010gap for Jack in the Box(JACK) in Figure 9.6. Thisgapwas not filled until June24,83tradingdaylater.
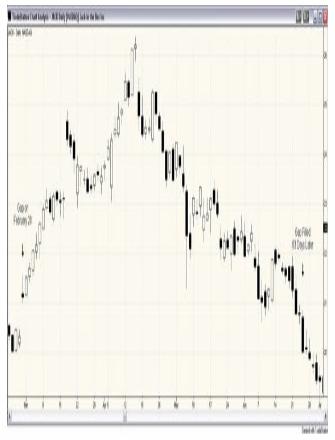
CreatedwithTradeStationFigure9.6.Dailystock
chartforJACK,February22–July2,2010
ConcludingCommentsaboutClosingtheGapAs we have talked to a
number of traders, the mostfrequent question about gapsis, “Doesn’t a gap always
close?” Based on thecalculations, it appears thatgaps may tend to close inroughly one trading week (5days). For the sample of10,766gapsduringtheperiodJanuary 1 to June 30, 2010,the median time to close forupgapswas5days,whereasthe median time for downgaps to close was 6 days.Some of the gaps observedhadstillnotclosedmorethan1½yearslater.
Throughoutthisbook,gapshave been discussed usingdailybars.Sometimesastockopens above the previousday’shighoropensbelowtheprevious day’s low, butsubsequent price movementduring the day causes thestock to notmeet the criteriaforagap.Thispricebehaviorcreates a gap on intradaycharts but not on daily barcharts. Often, this is referredto as an “opening gap”
becauseitcreatesagapattheopening of the trading day,butitisfilledwithintheday.We have not done an
exhaustive study of openinggaps. Because we havereceived so many questionsregarding these gaps, wethoughtitwouldbehelpfultomention something about thefrequencyoftheiroccurrence.Of the 1,702 stocksconsideredinthischapterthat
did gap during the January–June2010timeframe,52,616opening gaps occurred. Ofthese, 12,746 were not filledduring the day. Soapproximately 76% of theopening gaps closed on theday theyoccurred, and about24% became actual gaps.However,notallthose12,746met the liquidity criteria;10,779ofthesegapsdidmeettheliquiditycriteriaandwereincluded in the results in
previouschapters.Although this chapter
presents some interestinginformation about pricebehavior around gaps, ithasn’t led to any particulartrading recommendations. Adetailed study of this topicmightleadtosomeintriguingtrading possibilities, but it’salso something that is noteasilydone.Wemayexploreitinthefuture.
Endnotes1.AnimportantnoteisthattheJapanesecandlesticktraditionisbasedonthenotionthata“windowisclosed”ratherthantheauthor’sideaofagapclosing.AsexplainedinChapter2,inthe
Japanesetraditionawindowisclosedonlyiftherealbodyofacandleclosespastthewindow.Fortheauthors’analysis,ifpricefillsthevoidintraday,thegapisconsideredclosed.Therefore,abroaderdefinitionisusedfortheclosingofagapand
agapisconsideredclosedwhenaJapanesecandlestickanalystwouldstillconsiderthewindowopened.
Chapter10.PuttingItAllTogether
Discussions of gaps arefrequent in the technicalanalysisliterature.PickupanissueofTechnicalAnalysisofStocks and Commodities orActiveTraderandoftenthereis an article that mentionsgaps. Turn on the financialnews, and you will probablynothavetolistenlongbefore
you hear gaps mentioned.Pick up a book on technicalanalysis, and you can find adiscussion of gaps. Do anInternet search abouttechnical analysis, and youcan find a proliferation ofWeb sites that discuss gaps.Althoughthisinterestingapsis not new, there has beensurprisingly little systematicstudyofgaps.Technical analysis has
traditionally been a visualactivity. Although computertechnology has allowed foralgorithmically generatedtrading based on thetechniques of technicalanalysis without a humanlooking at a chart, thetechnology has also allowedformorecolorfulandvisuallyrichchartingtoreachtheeyesofmoreandmoretraders.Nolonger does a trader need toconstruct charts byhand, nor
doesatraderhavetowaitforyesterday’s data to beginconstructing charts.Data andcharts are availableinstantaneously. Althoughthishasallowedforthequickrecognitionofmoreandmorecomplicated patterns by agreaternumberoftraders,theinterest inbasictoolssuchasgapanalysisremains.When we started
systematically analyzing
gaps, a few traders said thatgaps were becoming anoutdated tool. Their analysiswasthatgapswerebecominglessandlessfrequent.Justasthe move to decimalizationcaused the statistics for thenumber of stocks that wereunchanged for a day todecrease, they reasoned thatgaps would become lessfrequent.With price changestrackedatsmallerincrements,theyreasoned,gapswouldbe
less likely. They also citedincreasedmarketactivityasareason to postulate that gapswere becoming less frequentin the market. Thinly tradedstocks tend to gap at a highrate because of discretemarket activity. Thus, theyreasoned, as more and moretraders have instantaneousaccess to news and marketinformation and tradingvolume increases, gaps willbecome less frequent. Thus,
they would conclude, gapsare an interesting historicalphenomenon in the markets,but they are becoming lessandlessusefultotraders.Surprisingly, we have
foundthatthisisnotthecase.In fact, we have found anincreasingnumberofgaps inthepastfewyears.Andthesegapsarenot limitedtosmall,lower volume companies. Anumberofgapsexistforhigh
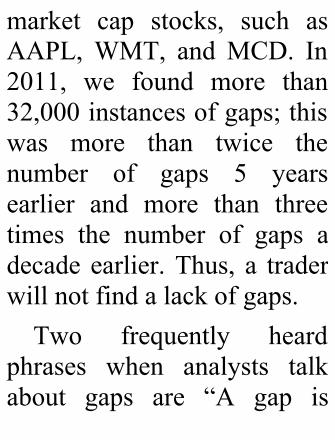
market cap stocks, such asAAPL,WMT, andMCD. In2011, we found more than32,000instancesofgaps;thiswas more than twice thenumber of gaps 5 yearsearlier and more than threetimes the number of gaps adecade earlier.Thus, a traderwillnotfindalackofgaps.Two frequently heard
phrases when analysts talkabout gaps are “A gap is
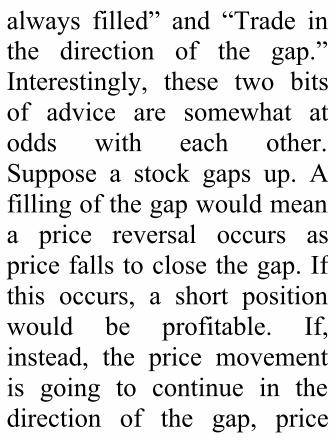
always filled” and “Trade inthe direction of the gap.”Interestingly, these two bitsof advice are somewhat atodds with each other.Suppose a stock gaps up. Afillingofthegapwouldmeana price reversal occurs aspricefallstoclosethegap.Ifthis occurs, a short positionwould be profitable. If,instead, the price movementis going to continue in thedirection of the gap, price
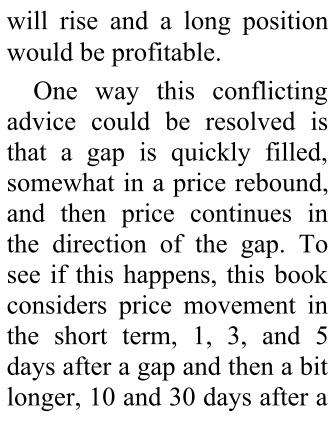
will rise and a long positionwouldbeprofitable.One way this conflicting
advice could be resolved isthat a gap is quickly filled,somewhatinapricerebound,and then price continues inthe direction of the gap. Tosee if thishappens, thisbookconsiders price movement inthe short term, 1, 3, and 5daysafteragapandthenabitlonger,10and30daysaftera
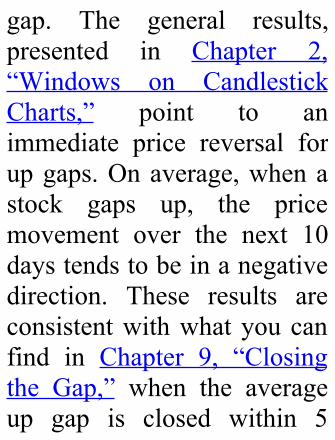
gap. The general results,presented in Chapter 2,“Windows on CandlestickCharts,” point to animmediate price reversal forupgaps.Onaverage,whenastock gaps up, the pricemovement over the next 10daystendstobeinanegativedirection. These results areconsistentwithwhatyoucanfind in Chapter 9, “Closingthe Gap,” when the averageup gap is closed within 5
days. However, by 30 days,the upwardmovement in thedirection of the gap has, onaverage,returned.What about down gaps?
Chapter 2 discusses that thenegative price movementtendstocontinuethedayaftera down gap. However, byDay 3 the price trendsupward. Stocks thatexperience down gaps have,on average, positive 3-, 5-,
10-, and 30-day returns.These results are consistentwith what you learned inChapter9about thefillingofdown gaps. The averagedown gap is filled within 6tradingdays.Of course, looking at
averages over a large samplesize can mask someunderlying tendencies ofsome particular groups ofstocks. Chapters 5, 6, and 7
examine the impact of othervariables.Chapter 5, “Gaps and
Previous Price Movement,”examines the impact of pricemovement on Day 0 (day ofthe gap) and Day –1. Incandlestick terms, youstudied the importance ofwhiteversusblackcandlesonthose2days.You might think that
spotting a black candle
followed by another blackcandle thatgapsdownwouldbe an ominous sign thatdownwardpricemovementisgaining momentum.However, the results showthat when a black candle onDay –1 is followed by a gapon Day 0, price movementtendstoreversetoanupwarddirection on Day 1, and thisupward movement continuesfor at least 30 days. Thissuggests that the downward
gap was an overreaction andthe price fell too far.Likewise, you might thinkthat an up gap, especiallywhen it occurs in a White-Up-White pattern, suggestsstrong upward pricemomentum.Again,theresultsbring this traditionalreasoning into question.Stocks tend to reversedirection and have negativereturnsforacoupleofweeksfollowinganupgap.
Chapter 6, “Gaps andVolume,” considers a classicvariable used by technicalanalysts to confirm pricemovements: volume.Traditional analysis suggeststhat price movements,especially upwardmovements, on high volumeare more meaningful thanwhen they occur on lowvolume. However, theanalysis of volume, as itrelates to gaps, does not
provideagreatdealofusefulinformation or added value.You saw in earlier chaptersthat gap downs tend to befollowed by continued pricedecline on Day 1, but theprice quickly shows reversal.The biggest insight thatvolumegivesyouisthatpricereversaltendstooccursoonerfor down gaps that occur onmoderately low volumecompared to those occurringonhighvolume.Forexample,
low-volume down gaps tendtoreverseonDay1,whereashighvolumedowngaps tendnot to reverseuntil afterDay3.Chapter 7, “Relative Price
of Gap Occurrence,” focuseson the impact the price atwhichagapoccursrelativetotheaveragepriceforthestockhas on the profitability oftrading strategies. Most upgaps occur at above average
prices and most down gapsoccur at below averageprices. The vast majority ofgaps occur within a 75% to125% range of the stock’sprice moving average. Somegaps, however, do occur atextremely high or extremelylowpricelevels.Aconsistentresult is that stocks that gapdownataboveaveragepricestendtoreversepricedirectionimmediately. This suggeststhat purchasing a stock that
gaps down on Day 0 at anabove average price at theopening the following day,Day 1, can, on average, be aprofitabletradingstrategy.Stocks that gap up tend to
have negative returnsimmediately following thegap. These negative returnstend to occur for a longerperiod of time for the stocksthat gap up at relatively lowprices.Stocksthatgapupata
pricebelow their10-day,30-day, or 90-day movingaverage still have negativereturns at the 10-day holdingperiod. By the 30-day mark,these returns have becomepositive.ThefirstpartofChapter8,
“Gaps and the Market,”studied the 25 days (from1995–2011) with the highestnumber (553 or more) ofgaps. All 25 have occurred
since 2007 and 14 were in2011. Investors know that2011 was extremely volatile.The high gap activity wasanotherway inwhichmarketvolatility was manifested.Also discussed are theunderlying causes behindthese high gap days. Manywere heavily influenced byevents outside the UnitedStates.From an investing
perspective, you looked athigh gap days to see if theygave any clue about futuremarket direction. Forexample, ifahighnumberofstocks gapped up on aparticularday,isthatasignalthat the market is headed upor headed down? It did notappear that high gap daysdominated by gaps in aparticular direction givereliable market timingsignals.
Two other ideas wereconsideredformakinguseofthe high gap day list. Oneidea is to look to thedominantgroupforguidance.For example, if many stocksgapped and 99% of themgapped up, do those stocksthat gapped up representsome type of tradingopportunity? For dayswith ahigh number of down gaps,the best idea seems to be togoshortonthedown-gapping
stocks on the day after thegap, looking for a downwardcontinuation.But,afterDay1it appears that it would bebettertobelong,hopingforareversal. After Day 1 itappears that being long is asolid idea. Themagnitude ofthe returns is quite high,which is certainly intriguing.The data suggest a similarapproach to trading gap upstocksonadaywithmanyupgaps. For Day 1 prices are
likelytocontinuemovingup;acontinuationapproachlooksbest. After Day 1 a reversalstrategy looks better, but theevidence here was not asstrongas itwasfor thedowngaps.A second way to use the
highgapdaylistwouldbetofocusonthesmallnumberofstocksmovingoppositetotheherd. The returns here seemto offer some nice potential.
But given the small samplesize, you dug into the detailsto see what was causing thisgrouptomoveinanoppositedirection from the majority.What you saw is that somedramatic company-specificevent was the cause.Although there appears to besomepotentialinfocusingonthis group of stocks, eachcase needs to be consideredseparately.
You also examinedwhether prior marketmovements should influenceyour gap-based trades. Forexample, assume that themarket has been in a stronguptrend and you areconsidering whether to golongorshortwithstocksthathave gapped up. Do you golong,stayingwiththestock’supward movement and themarket’s upward movement,or doyouperhaps look for a
reversal? For up gaps, priormarket movements had littleimpact.Fordowngapsitdoeshave some impact.Generallyyou want to go long on adown gap expecting areversal regardless of thepriormarketdirection.But,ifthemarket has been stronglydownoverjustthelast1,3,5,or 10 days, then thedownwardmoveof the stockmaycontinueforthenext1to5days.
Itwouldbenicetosaythatwe found theHolyGrailvis-à-visgaptrading,butwehavenot. However, we think thatthis book provided someuseful information to helpguide gap-based trading. Wethoughtthattheconsiderationof some variables, such asvolume, might greatlyimprove results, but weredisappointed to find thevariable studied didn’t havemore impact on returns.
However, that a particularvariable doesn’t providemuchhelpis,initself,useful.Consider an analogy.Supposeyouareabouttostartsearching for diamonds in asquare 4-acre field. Ifsomeone says, “I’ve lookedhard in the northwest,northeast, and southeastquadrants and haven’t foundanything,” is that valuableinformation? It is, assumingyou trust the person who is
makingthestatement.For now, gaps seem to be
here to stay. If the recenttrendcontinues,youmayseeevenmoregaps.Inthesearchfor higher returns, this bookprovided somegood clues ofwhere to focus your effortsand some guidanceconcerning things that areprobablyawasteoftime.Theauthors began this bookplanning to produce an in-
depth study that would saymosteverythingthatcouldbesaid about gaps. However,gaps have proved to be evenmore interesting thanimagined. Stay tuned. Thestudy of gaps will probablycontinue. At least, after wetakeashortbreak.
Index
Symbols9/11,gaps,49
Aabandoned baby bottom,
39abandonedbabytop,37ActiveTrader,219AIG, price movements,
114-116
annualizedreturns,76Apple
exhaustiongaps,6extremevalue,89,92-
94runawaygaps,4
AT&T,breakawaygaps,4Atmos Energy
Corporation, closing gaps,214averages,movingaverages
calculating,140-144categorizing,144
downgaps,147gaps,149-157upgaps,144
AvonProducts,50
BBeta,80BioSantePharmaInc.,50blackcandles,222Black-Down-Blackpattern,
112Black-Down-White
pattern,112Black-Up-Black pattern,
112Black-Up-White,109breakawaygaps,4Bulkowski,Thomas,40
Ccalculating
movingaverages,140-144returns,71-76
candlestickcharting,basicsof,19-20
closingthewindow,20
candlestickcharts,17windowsassupport
andresistance,20,23-25candlestickpatterns,26
abandonedbabybottom,39abandonedbabytop,
37collapsingdojistar,
34color,107downwardgaptasuki,
27gappingdoji,32gappingside-by-side
whitelines,30-31tasuki,27,29twoblackgapping
candles,32upwardgapping
tasuki,27categorizing moving
averages,144CentralGoldTrust,trading
onhighgapdays,181CheniereEnergyInc.,101Chrysler,166Cincinnati Financial Corp,
124Clark,FrankHoward,78ClearwireCorporation,94-
98closing
gaps,217timingof,206-
207,211,214windows,candlestick
charting,20Coffee Holding Company,
193collapsingdojistar,34commongaps,8companies
AIG,pricemovements,114-116Apple
exhaustiongaps,6
extremevalue,89,92-94
runawaygaps,4AT&T,breakaway
gaps,4AtmosEnergy
Corporation,closinggaps,214AvonProducts,50BioSantePharmaInc.,
50CentralGoldTrust,
tradingonhighgap
days,181CheniereEnergyInc.,
101Chrysler,166CincinnatiFinancial
Corp,124Clearwire
Corporation,94-98CoffeeHolding
Company,193CrocsInc.,closing
gaps,210DardenRestaurant,
185,187,190ElectronicArts,64EndeavourSilver
Corporation,191EquityOne,193Ericsson,collapsing
dojistar,35ExelisInc,191FinisarCorporation,
191Frontier
Communication,185GlaxoSmithKline,59
GM,166Goodrich
Corporation,182,184Hasbro,37-38Herbalife(HLF),125HotTopic,Inc.,211HumanGenome
SciencesInc.,59IBM
gaps,65volume,122
ITTCorporation,191
JackintheBox,closinggaps,214JamminJava
Corporation,pricemovements,116-118Johnson&Johnson,
candlestickcharts,17KrispyKremedonuts,
25-26LehmanBrothers
HoldingCompany,59McDonald’s,opening
gaps,8
Merck,volumeandgaps,128MineFinders
Corporation,191Monsanto,closing
gaps,211NetlistInc.,149
movingaverages,151-152NewmontMining
Corporation,191NewsCorpLtd.,63NovagoldResources,
185,187-188Omnicare,193Optimer
Pharmaceutical,Inc.,103Pearson,downward
gaptasuki,27PremiumData,43,65RBS,34-36ResmedInc.,extreme
values,89RoyalGoldInc.,191SeagateTechnology
PLC,64SilverWheaton
Corporation,191TaroPharmaceutical,
50TempleInland,192TravelZoo,61UnisysCorp.,extreme
values,89UniversalDisplay
Corporation,98-101Wal-Mart,61XylemInc.,191
company-specific events,gaps,50continuationapproach,173continuation strategies,
gaps,13Cramer,Jim,166Crocs Inc., closing gaps,
210
Ddailyreturns,76Darden Restaurant, 185,
190
data,43-45Day0,10Day–1,10Day1,10disjointedcandles,17downgaps,221
movingaverages,147volumeand,125,129
downgap side-by-sidewhitelines,30
E
ElderForceIndex,122elections,gaps,49ElectronicArts,64Endeavour Silver
Corporation,191EquityOne,193Ericsson, collapsing doji
star,35ex-dividendgaps,8ExelisInc,191exhaustiongaps,6extremevalues,89,93-94
Ffallingwindows,19FinisarCorporation,191frequency of gaps, 46-50,
54Frontier Communication,
185
Ggapdaycandlecolor,108-
109gapdown,3
gap trading, marketmovements,194-202gapup,3gappingdoji,32gapping side-by-sidewhite
lines,30-31gaps,1,4,10,122
9/11,49breakawaygaps,4byindustry,65-66closing,205
timingof,206-207,211,214
commongaps,8company-specific
events,50continuation
strategies,13downgaps,221elections,49ex-dividendgaps,8exhaustiongaps,6frequencyof,46-47,
49-50,54futureof,220gapdaycandlecolor,
108-109highgapdays,159-
160,163,171-174,224newssummaries,
165-171trading,174-176,
179-182,185-187,191-195indexmembership,
61-63liquidity,45-46measuringgaps,4movingaverages,
149-157openinggaps,8-10previousdaycandle
color,109,112-114representing,10reversalstrategies,13runawaygaps,4-6sizeof,56-61suspensiongaps,8trading,13-14upgaps,88,221,223volumeand,124-125,
128-129downgaps,125,
129measuring,135upgaps,131-
132,136Gartley,H.M.,121GlaxoSmithKline,59GM,166Goodrich Corporation,
182,184Granville,Joseph,122
HHasbro,37-38Herbalife(HLF),125high gap days, 159-160,
163,171-174,224newssummaries,165-
171trading,174-176,179-
182,185-187,191-195HotTopic,Inc.,211Human Genome Sciences
Inc.,59
Huntington Bancshares,gaps,1
IIBM
gaps,65volume,122
index membership, gaps,61-63industry,gaps,65-66ITTCorporation,191
J–K
Jack in the Box, closinggaps,214Jammin Java Corporation,
pricemovements,116-118Japanese candlestick
charts,17Johnson & Johnson,
candlestickcharts,17Kristy Kreme Donuts, 25-
26
LLehman Brothers Holding
Company,59liquidity,gaps,45-46luck,77-79
Mmarket-adjusted returns,
82-89marketcaps,61market movements, gap
trading,194-202markets, high gap days,
159-160,163,171-174newssummaries,165-
171trading,174-176,179-
182,185-187,191-195Markowitz,Harry,80Marley,Rohan,116McDonald’s,openinggaps,
8measuring
gaps,4volume,135
Merck, volume and gaps,128MineFinders Corporation,
191Modern Portfolio Theory,
80MoneyFlowIndex,122Monsanto, closing gaps,
211movingaverages
calculating,140-144categorizing,144downgaps,147gaps,149-157upgaps,144
NNetlistInc.,149
movingaverages,151-152
Newmont MiningCorporation,191NewsCorpLtd.,63news summaries, high gap
days,165-171Nison,Steve,19Norgate Investor Services,
43
Novagold Resources, 187,191
OObama, President Barak,
166Omnicare,193Omnivision Technologies,
185On-Balance-Volume
(OBV),122openinggaps,8-10Optimer Pharmaceutical,
Inc.,103
Ppatterns
Black-Down-Black,112Black-Down-White,
112Black-Up-Black,112candlestickpatterns,
26abandonedbaby
bottom,39
abandonedbabytop,37
collapsingdojistar,34
downwardgaptasuki,27
gappingdoji,32gappingside-by-
sidewhitelines,30-31tasuki,27,29twoblack
gappingcandles,32upwardgapping
tasuki,27Down-White-Down,
112White-Down-Doji,
113White-Up-White,112
Pearson, downward gaptasuki,27PremiumData,43,65previous day candle color,
gaps,109,112-114price,121priceadjustments,44
pricemovements,77examplesof,114-118
profitable tradingexamples,94-105
RRBS,34-36Resmed Inc., extreme
values,89returns
annualizedreturns,76calculating,71-76
dailyreturns,76luck,77-79marketadjusted
returns,82-89profitabletrading
examples,94-104risk,79-82
reversalstrategies,gaps,13reversals,173risingwindows,19risk,impactof,79-82RoyalGoldInc.,191
runawaygaps,4,6runningwindows,19
SSeagate Technology PLC,
64September2,2011,191Sharpe,William,80Silver Wheaton
Corporation,191simple moving averages,
140sizeofgaps,56-61
software,43-45Sprott Physical Silver
Trust,192suspensiongaps,8
TTaroPharmaceutical,50tasuki,27-29technicalanalysis,219TempleInland,192timing of closing gaps,
206-216
total gaps, high gap days,159-160,163,171-174trading
highgapdays,174-176,179-182,185-187,191-195howtousegaps,13-
14withwindows,39-41
TravelZoo,61twoblackgappingcandles,
32
UUnisys Corp., extreme
values,89-91Universal Display
Corporation,98-101upgaps,88,131-132,136,
221-223movingaverages,144
upgap side-by-side whitelines,30upwardgappingtasuki,27
Vvalues,extremevalues,89,
93-94VIX,163volatility,VIX,163volume,121-122
gapsand,124-125,128-129
downgaps,125,129
measuring,135upgaps,131-
132,136volumesize,132
WWal-Mart,61White-Down-Doji pattern,
113White-Down-White
pattern,112White-Up-White pattern,
112windows,17-19
assupportand
resistance,candlestickcharts,20,23-25candlestickpatterns,
26abandonedbaby
bottom,39abandonedbaby
top,37collapsingdoji
star,34downwardgap
tasuki,27gappingdoji,32
gappingside-by-sidewhitelines,30-31
tasuki,27,29twoblack
gappingcandles,32upwardgapping
tasuki,27closingcandlestick
charting,20trading,39-41
X-Y-ZXylemInc,191

Inanincreasinglycompetitiveworld,itis
qualityofthinkingthatgivesanedge—anideathatopensnew
doors,atechniquethatsolvesaproblem,oraninsight
thatsimplyhelpsmakesenseofitall.
Weworkwithleadingauthorsinthevariousarenas

ofbusinessandfinancetobringcutting-edgethinkingandbest-learningpracticesto
aglobalmarket.Itisourgoaltocreate
world-classprintpublicationsandelectronicproductsthat
givereadersknowledgeandunderstanding
thatcanthenbeapplied,whetherstudyingor
atwork.Tofindoutmoreaboutour