Embed Size (px)
Citation preview
7/24/2019 Taylor Chap 3
http://slidepdf.com/reader/full/taylor-chap-3 1/2
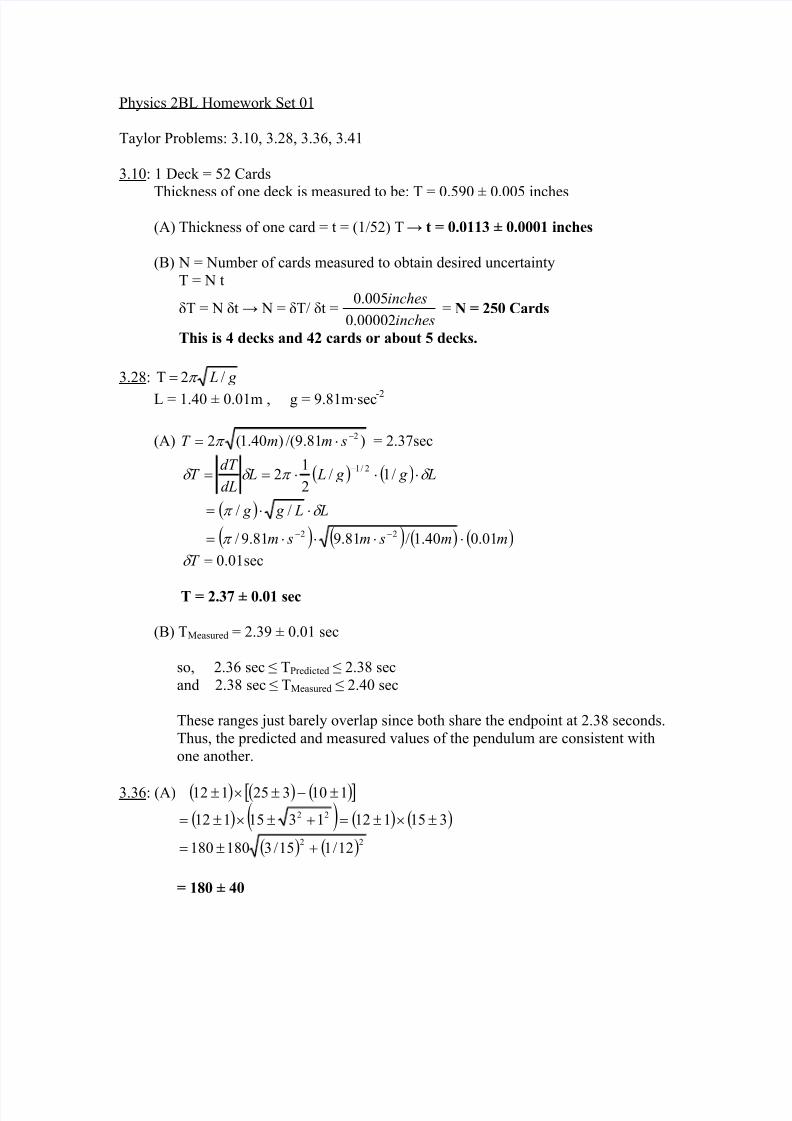
Physics 2BL Homework Set 01
Taylor Problems: 3.10, 3.28, 3.36, 3.41
3.10: 1 Deck = 52 Cards
Thickness of one deck is measured to be: T = 0.590 ± 0.005 inches
(A) Thickness of one card = t = (1/52) T → t = 0.0113 ± 0.0001 inches
(B) N = Number of cards measured to obtain desired uncertainty
T = N t
δT = N δt → N = δT/ δt =inches
inches
00002.0
005.0 = N = 250 Cards
This is 4 decks and 42 cards or about 5 decks.
3.28: g L /2T π =
L = 1.40 ± 0.01m , g = 9.81m·sec-2
(A) )81.9/()40.1(2 2−⋅= smmT π = 2.37sec
( ) ( ) L g g L LdL
dT T δ π δ δ ⋅⋅⋅==
−/1/
2
12
2/1
( ) L L g g δ π ⋅⋅= //
( ) ( ) ( ) ( )mm sm sm 01.040.1/81.981.9/ 22 ⋅⋅⋅⋅= −−π
sec01.0=T δ
T = 2.37 ± 0.01 sec
(B) TMeasured = 2.39 ± 0.01 sec
so, 2.36 sec ≤ TPredicted ≤ 2.38 sec
and 2.38 sec ≤ TMeasured ≤ 2.40 sec
These ranges just barely overlap since both share the endpoint at 2.38 seconds.
Thus, the predicted and measured values of the pendulum are consistent with
one another.
3.36: (A) ( ) ( ) ( )[ ]110325112 ±−±×±
( ) ( ) ( ) ( )3151121315112 22 ±×±=+±×±=
( ) ( )2212/115/3180180 +±=
= 180 ± 40
7/24/2019 Taylor Chap 3
http://slidepdf.com/reader/full/taylor-chap-3 2/2
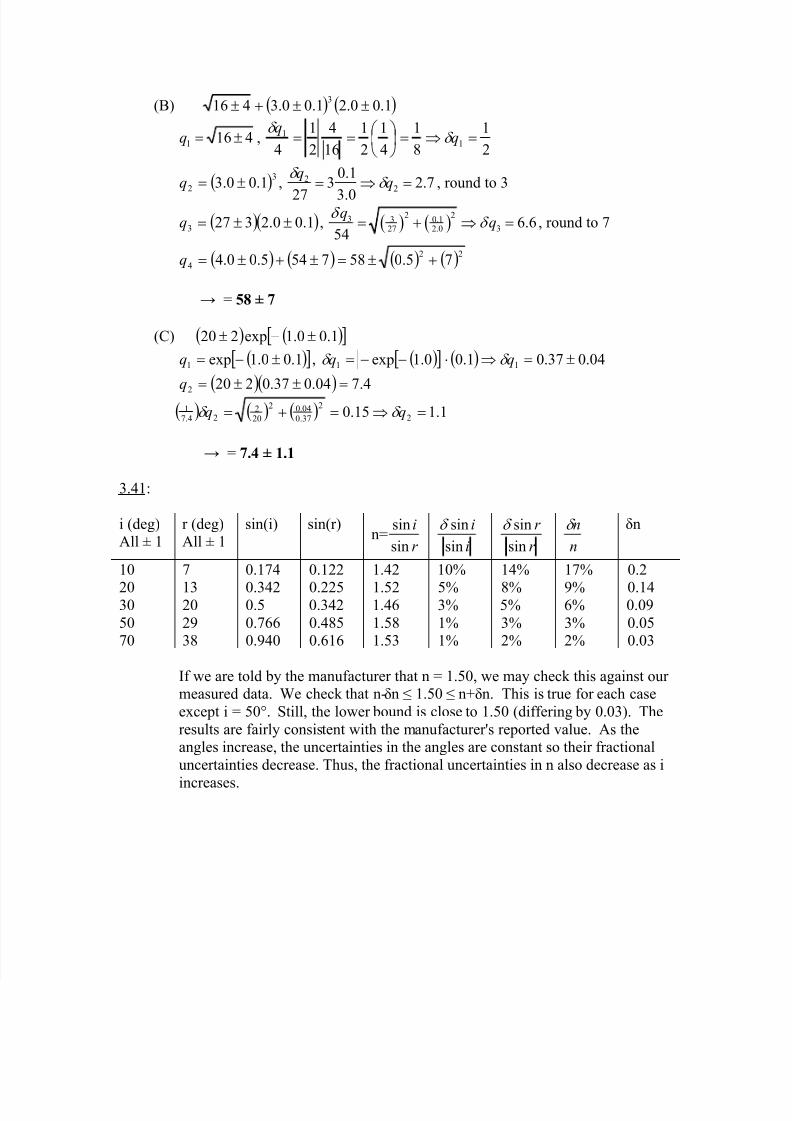
(B) ( ) ( )1.00.21.00.34163
±±+±
4161 ±=q ,2
1
8
1
4
1
2
1
16
4
2
1
41
1 =⇒=⎟ ⎠
⎞⎜⎝
⎛ == q
qδ
δ
( )3
2 1.00.3 ±=q , 7.2
0.3
1.03
272
2 =⇒= qq
δ δ
, round to 3
( )( )1.00.23273 ±±=q , ( ) ( )2 23 3 0.1
327 2.06.6
54
δ δ = + ⇒ = , round to 7
( ) ( ) ( ) ( )22
4 75.0587545.00.4 +±=±+±=q
→ = 58 ± 7
(C) ( ) ( )[ ]1.00.1exp220 ±−±
( )[ ]1.00.1exp1 ±−=q , ( )[ ] ( ) 04.037.01.00.1exp 11 ±=⇒⋅−−= qq δ δ
( )( )4.704.037.0220
2
=±±=q
( ) ( ) ( ) 1.115.0 2
2
37.004.02
202
24.71 =⇒=+= qq δ δ
→ = 7.4 ± 1.1
3.41:
i (deg)All ± 1
r (deg)All ± 1
sin(i) sin(r)n=
r
i
sin
sin
i
i
sin
sinδ
r
r
sin
sinδ
n
nδ
δn
10 7 0.174 0.122 1.42 10% 14% 17% 0.2
20 13 0.342 0.225 1.52 5% 8% 9% 0.1430 20 0.5 0.342 1.46 3% 5% 6% 0.09
50 29 0.766 0.485 1.58 1% 3% 3% 0.0570 38 0.940 0.616 1.53 1% 2% 2% 0.03
If we are told by the manufacturer that n = 1.50, we may check this against ourmeasured data. We check that n-δn ≤ 1.50 ≤ n+δn. This is true for each case
except i = 50°. Still, the lower bound is close to 1.50 (differing by 0.03). The
results are fairly consistent with the manufacturer's reported value. As theangles increase, the uncertainties in the angles are constant so their fractional
uncertainties decrease. Thus, the fractional uncertainties in n also decrease as i
increases.