Embed Size (px)
Citation preview
(2004) vol. 52, no 3 ■ 709
Tax Incidence, Progressivity, andInequality in Canada
Jonathan R. Kesselman and Ron Cheung*
P R É C I S
La connaissance de la répartition du fardeau fiscal — tel qu’elle est mesurée par laprogressivité et l’inégalité de l’incidence des impôts et taxes — est fondamentale pourles choix en matière de politique fiscale. Pourtant, la pratique actuelle tant pour ce quiest de la formulation que de l’évaluation des politiques fiscales ne s’inspire guère desmeilleures recherches. Cette étude offre la première enquête critique exhaustive sur lesujet pour le Canada en près de 20 ans, une période marquée par l’amélioration généraleet l’élargissement de la portée des méthodes de recherche. Nous avons regroupé lechamp actuel de la recherche en trois grandes catégories. Les études sur l’inégalité(INEQ) mesurent la réduction inéquitable des taxes et impôts directement payés par lesparticuliers, principalement l’impôt sur le revenu des particuliers. Les études surl’équilibre général calculable (CGE) portent sur la répartition à vie du fardeau d’impôtset de taxes stylisés au moyen de modèles économiques et mathématiques complexes.Les études sur l’incidence fiscale (FINC) calculent le modèle de progressivité ou derégressivité pour chaque impôt et taxe et pour le régime fiscal dans son ensemble aumoyen de méthodes de microsimulation. Les auteurs évaluent les forces et faiblessesrelatives de chaque type d’étude et donnent un aperçu des mesures d’inégalité et deprogressivité de l’impôt utilisées dans les ouvrages théoriques, puis ils examinent lesproblèmes de méthodologie que pose la mesure du bien-être économique aux fins del’analyse de la répartition des impôts et taxes. Ils fournissent des preuves des effetsrelatifs de la péréquation des transferts et de l’impôt des particuliers au Canada etexaminent ensuite les conclusions et méthodes comparatives d’études représentativesde chaque catégorie en mettant l’accent sur les études qui portent sur les impôts ettaxes canadiens et les hypothèses sous-jacentes au sujet de leur incidence.
* Jonathan R. Kesselman is of the Public Policy Program, Simon Fraser University, and holdsthe Canada Research Chair in Public Finance. Ron Cheung is of the Department of Economics,University of British Columbia. This study was prepared as part of the Social Sciences andHumanities Research Council MCRI project “Equality, Security, and Community: Explainingand Improving the Distribution of Well-Being in Canada.” The authors thank the followingfor useful comments: Charles Beach, David Bradford, Don Fullerton, Peter Lambert, AlanMacnaughton, Kevin Milligan, Finn Poschmann, Jim Poterba, Joe Ruggeri, Andrew Sharpe,Mike Veall, and particularly the reviewers, Jim Davies and Bev Dahlby. Responsibility for theviews and any errors in this study lies fully with the authors.

710 ■ canadian tax journal / revue fiscale canadienne (2004) vol. 52, no 3
On estime que les transferts sont plus importants que l’impôt sur le revenu pourréduire l’inégalité des revenus des Canadiens pour toutes les périodes depuis 1971 etpour la plupart des types de ménages (à l’exception de ceux dont le revenu parhabitant est élevé). D’après les études sur l’inégalité (INEQ), pour ce qui est de laréduction de l’inégalité de l’impôt sur le revenu et compte tenu des mesures utilisées,le Canada occupe un rang intermédiaire parmi les autres pays; certaines étudesconcluent que l’impôt sur le revenu des particuliers au Canada est moins égalisateurque l’impôt américain. Les études sur l’équilibre général (CGE) ont été préparées enmajeure partie aux fins de l’analyse du régime fiscal américain et comportent peud’éléments de comparaison avec le régime fiscal canadien, même si les résultats sontrévélateurs de la situation canadienne. Sur la base des fourchettes de revenu à viedans l’équilibre à long terme, seul l’impôt sur le revenu des particuliers est fortementprogressif. Les taxes sur la masse salariale sont fortement régressives : la taxe devente, la taxe d’accise et l’impôt foncier sont nettement régressifs sauf pour les deuxdéciles supérieurs des fourchettes de revenu à vie. Même l’impôt sur le revenu dessociétés est quelque peu régressif pour les fourchettes de revenu à vie, à l’exceptiondes deux déciles supérieurs. Tous les impôts et taxes combinés sont généralementproportionnels pour les neuf déciles inférieurs et fortement progressifs pour le décilesupérieur. Les études sur l’incidence fiscale (FINC) qui reposent sur des donnéesannuelles, le plus fréquemment utilisées pour les impôts et taxes canadiens, concluentà une progressivité légère ou substantielle pour le régime fiscal dans son ensemble.Une étude sur les impôts à vie conclut à une progressivité quelque peu inférieure àcelle de résultats comparables fondés sur les données annuelles. Comme pour lesétudes sur l’équilibre général, les études sur l’incidence fiscale attribuent un rôle clé àl’impôt sur le revenu des particuliers dans toute progressivité nette de l’ensemble durégime fiscal total, compte tenu de la régressivité de nombreux autres types d’impôt etde taxe.
L’analyse s’intéresse particulièrement au fondement économique des hypothèsesau sujet de l’incidence de principaux impôts et taxes utilisées dans les trois catégoriesd’études. L’incidence fiscale et le déplacement possible du fardeau fiscal descontribuables vers d’autres parties joue un rôle fondamental dans l’analyse de larépartition du fardeau fiscal. La recherche théorique et empirique à multiples facettesjette le doute sur l’hypothèse de base selon laquelle l’impôt sur le revenu desparticuliers est entièrement assumé par ceux-ci. La recherche montre que le fardeau del’impôt sur le revenu des particuliers à revenu élevé est au moins déplacé en partie versd’autres personnes, ce qui en réduit la progressivité réelle. Compte tenu du rôle clé dela progressivité de l’impôt sur le revenu des particuliers dans les conclusions denombreuses études sur la progressivité générale de l’impôt, la question mérite d’êtrepoussée plus loin. Si l’on devait utiliser des hypothèses sur l’incidence pluscompatibles avec la recherche citée pour l’impôt sur le revenu, même ces conclusionsmodérées sur la progressivité pourraient être réfutées. La plupart des étudescanadiennes dont il est question dans l’article sont déjà dépassées et mériteraientd’être mises à jour pour tenir compte des importants changements de politique fiscaleapportés depuis 1988. De plus, l’utilisation de données permettant les inférences ausujet des effets permanents permettrait de meilleures évaluations des impôts et taxescalculés sur le revenu par rapport aux impôts et taxes indirects. La recherche à venirdevrait quand même insister sur une meilleure compréhension de l’incidence desimpôts et taxes personnels.
tax incidence, progressivity, and inequality in canada ■ 711
A B S T R A C T
Knowledge about the distribution of the burden of taxes—as measured by theirprogressivity and their inequality impacts—is crucial for tax policy choices. Yet actualpractice for both the formulation and assessment of tax policy does not draw on muchof the best research knowledge. This study offers the first comprehensive criticalsurvey of the field for Canada in nearly 20 years, a period of wide-ranging refinementand extension of research methods. We group the existing field of research into threeprincipal genres. Inequality (INEQ) studies measure the inequality reduction from taxesborne directly by individuals, principally the personal income tax. Computable generalequilibrium (CGE) studies examine the distribution of lifetime utility burdens of stylizedtaxes using complex mathematical economic models. Fiscal incidence (FINC) studiescompute the pattern of progressivity or regressivity for each tax and the entire tax systemusing microsimulation methods. We assess the relative strengths and weaknesses ofeach type of study. We offer a compact overview of the measures of inequality and taxprogressivity used in the empirical literature, followed by a review of the methodologicalissues that arise in measuring economic well-being for tax distributional analysis. Weprovide some evidence on the relative equalizing effects of transfers and personal taxesin Canada. Then we examine the comparative findings and methods of representativestudies of each type, with emphasis on studies that include Canadian taxes and with afocus on the underlying assumptions about tax incidence.
Transfers are found to be more important than income taxes in reducing inequalityof Canadian incomes for all periods since 1971 and for most types of households(except those with high per capita incomes). INEQ studies find that Canada’s ranking ininequality reduction from personal income taxes is intermediate among countries anddependent upon the measure of inequality; some studies find Canadian personal taxesto be less equalizing than the US counterparts. CGE studies have been developed mostfor analysis of the US tax system, with little comparable available for the Canadian taxsystem though the US results are suggestive of the Canadian situation. Based on lifetimeincome groups in the long-run equilibrium, only the personal income tax is found to bestrongly progressive. Payroll taxes are strongly regressive; sales, excise, and propertytaxes are significantly regressive except for the top two deciles of lifetime incomes; andeven the corporate income tax is somewhat regressive over lifetime income groupsexcept for the top decile. All taxes taken together are found to be roughly proportionalfor the bottom nine deciles and highly progressive for the top decile. FINC studies usingannual data, which have been most frequently applied for Canadian taxes, find eitherslight or substantial progressivity for the tax system overall; a lifetime study findssomewhat less progressivity than comparable results based on annual data. As withCGE findings, the FINC studies assign a key role to personal income taxes in any netprogressivity of the total tax system, given the regressivity of many other tax types.
Our analysis gives special attention to the economic basis for assumptions aboutthe incidence of the major tax types used in the three types of studies. Tax incidence,and the possible shifting of tax burdens from the taxpayer to other parties, plays acritical role in analysis of the distribution of the tax burden. Multifaceted theoreticaland empirical research casts doubt on the standard assumption that the personalincome tax is borne fully by individual taxpayers. This evidence suggests that personaltaxes on higher earners are at least partially shifted onto other parties, thus reducingthe effective progressivity of the tax. Given the key role of personal tax progressivity inmany studies’ findings of overall tax progressivity, this issue warrants further research.
712 ■ canadian tax journal / revue fiscale canadienne (2004) vol. 52, no 3
If one were to use incidence assumptions more consistent with the cited evidence forthe personal income tax, even these mildly progressive findings might be overturned.Most of the Canadian studies reviewed here are already quite dated in their periodscovered and would benefit by updating to include the important tax policy changessince 1988. Also, the use of data sets permitting inferences about lifetime effects wouldpermit better assessments of income-based versus consumption-based taxes. Still,priority in future research should be given to improved understanding of the incidenceof personal taxes.
KEYWORDS: TAX BURDEN ■ TAX INCIDENCE ■ INCOME DISTRIBUTION ■ TAX EQUITY ■ EQUALITY ■
PROGRESSIVE TAXES
C O N T E N T S
Introduction 713Issues, Concepts, and Analytical Frameworks 714
Types of Analytical Frameworks 714Budgetary Measures of Tax Distribution 719Measures of Inequality and Progressivity 721
Measures of Inequality 722Measures of Tax Progressivity 728Measures of Horizontal Inequity 732
The Measurement of Economic Well-Being 733Unit of Observation: Individual or Household 733Income Measure: Pre-Fisc, Broad Income, or Post-Fisc 735Period of Observation: Annual or Lifetime 737
Range of Tax Policies and Tax Incidence 738Primer on Tax and Expenditure Progressivity and Inequality 740
INEQ Studies of Taxes 741Taxes, Transfers, and the Pattern of Inequality in Canada 742Personal Taxes and Cross-Country Inequality 748Decomposing Personal Tax Policies and Cross-Country Inequality 754
CGE Studies of Taxes 756FINC Studies of Taxes 759
Overview of Canadian Findings 760Incidence by Type of Tax 766
PITs and Labour Earnings 766Payroll Taxes 771Taxes on Goods and Services 773Property Taxes 775Corporate and Capital Income Taxes 776Tax Expenditures 779
Additional Issues and Research Priorities 779Theoretical and Empirical Analysis of Tax Shifting 780Annual Versus Lifetime Measures and Data Needs 781Horizontal Equity, Differential Tax Treatment, and Inequality 782Tax Evasion and Distributional Effects 783Tax Avoidance and High Earners 784
Tax Policy Inferences 786
tax incidence, progressivity, and inequality in canada ■ 713
I N T R O D U C T I O N
The modern state plays an important role in moulding the distribution of incomeand well-being across its citizens and thus in moderating inequalities generated bythe market economy. It achieves this goal through a variety of policy tools—setting thelegal framework for business, regulating labour markets, supplying public goodsand services, providing cash transfers, and collecting the taxes needed to finance itsactivities. With contemporary welfare states typically taking from one-third toone-half of national income in taxes, their distributional pattern is of paramountimportance. Additionally, the tax system is often used as a vehicle for redistributionthrough explicit and implicit transfer provisions such as tax credits and benefitclawbacks. Moreover, the state’s interventions (including taxes) to moderate inequal-ity exert their own influence on distributional outcomes through market responses.Yet there remains much dispute over the distribution of the tax burden and theeffects of taxes on inequality in Canada. These issues are at the core of public debateover the size and scope of the welfare state, how to finance its activities, and how tomitigate inequality.
Improved understanding of how taxes are distributed across the population andhow to measure these impacts is vital in formulating and assessing taxation policies.For example, does greater progressivity in the rate schedule for personal taxescontribute to increases in effective progressivity and inequality reduction, and if so,to what extent? Does the answer to this question differ depending upon whetherone is considering tax policy at the national versus the subnational level? How doindirect taxes on consumption affect distributional outcomes, and does the answerhinge on whether one takes an annual versus a lifetime perspective? Similarly, whatare the short-run and long-run distributional impacts of shifting the personal taxbase further from income and toward consumption? And how should one assess theprogressivity or inequality impacts of changes in the corporate tax system, payrolltaxes, and property taxes or shifts in the overall tax mix among these tax types andpersonal and indirect taxes? While tax economists tend to focus on the efficiencyand growth aspects of tax policies, politicians and the public are almost entirelyfixated on the distributional dimension. As observed by a leading tax economist whohas served in a top advisory capacity, “Tax policy debates among policy makers aregrounded in no small part in their perceptions of the effects of policy changes onthe distribution of well-being.”1
There exists a large body of research investigating the distribution of the taxburden, with some studies focusing on the inequality impacts and others on theprogressivity of taxes. The studies cover a wide range of methodologies and arewidely dispersed. Despite their diverse methods, a key issue in all of the studies ishow to deal with the economic incidence of each tax—what parties actually bear itsburden. It has been noted that “[t]he study of incidence is an active area of research
1 R. Glenn Hubbard, “Distributional Tables and Tax Policy,” in David F. Bradford, ed.,Distributional Analysis of Tax Policy (Washington, DC: AEI Press, 1995), 81-95, at 81.
714 ■ canadian tax journal / revue fiscale canadienne (2004) vol. 52, no 3
among economists, though the contributions of recent research are not alwaysintegrated in the distributional assessments presented to policy makers.”2 In thispaper we critically assess the state of knowledge about the distributional impacts ofthe tax system, reviewing both foreign and available Canadian research.3 We exam-ine the conceptual and methodological issues involved in the research as well as thesubstantive findings. The distributional impacts are gauged in terms of inequalityand progressivity, and we review the relevant measures and their interrelations. Anoverarching theme across the three classes of studies examined here is the impliedor explicit approach to treating the incidence of various taxes. Previous work on taxincidence has sometimes been casual in describing the progressivity of taxes and inmaking comparisons. By bringing together the analysis of tax incidence with for-mal measurement of progressivity and inequality, we improve the rigour of thediscussion. We examine these issues in a selective synopsis of research on the distri-butional impact of taxes, both in Canada and cross-nationally, along with thecomparative impact of cash transfers. Finally, we offer suggestions about prioritiesfor future research and thoughts about tax policy inferences that can be drawnbased on the current state of knowledge.
I S S U E S , C O N C E P TS , A N D A N A LY T I C A L
F R A M E W O R K S
Types of Analytical Frameworks
Studies of the distributional impacts of taxation can generally be classified intothree types based on their analytical frameworks and methodologies.4 They vary inthe range of taxes considered, their treatment of the incidence of the taxes, their
2 Ibid.
3 The last comprehensive survey of Canadian tax incidence and inequality impacts is now quitedated, and much research has appeared subsequently; see B.G. Dahlby, “The Incidence ofGovernment Expenditures and Taxes in Canada: A Survey,” in François Vaillancourt, researchcoordinator, Income Distribution and Economic Security in Canada, Collected Research Studies ofthe Royal Commission on the Economic Union and Development Prospects for Canada, vol. 1(Toronto: University of Toronto Press, 1985), 111-51. A similarly dated survey of the technicaleconomics of tax incidence was provided in Laurence J. Kotlikoff and Lawrence J. Summers,“Tax Incidence,” in Alan J. Auerbach and Martin Feldstein, eds., Handbook of Public Economics,vol. 2 (Amsterdam: North-Holland, 1987), 1043-92, and recently updated in Don Fullertonand Gilbert E. Metcalf, “Tax Incidence,” in Alan J. Auerbach and Martin Feldstein, eds.,Handbook of Public Economics, vol. 4 (Amsterdam: North-Holland, 2002), chapter 26.
4 The more conventional economic way of classifying these approaches would refer to “partialequilibrium” versus “general equilibrium” models. In that context, the studies designated hereas INEQ are partial equilibrium; the CGE studies are clearly general equilibrium; and theFINC studies incorporate the results of both partial and general equilibrium analyses. Thispaper does not include the macro literature on taxes, growth, and inequality, which is mostlydynamic economic modelling; for example, see Roland Bénabou, “Tax and Education Policy ina Heterogeneous-Agent Economy: What Levels of Redistribution Maximize Growth andEfficiency?” (2002) vol. 70, no. 2 Econometrica 481-517.
tax incidence, progressivity, and inequality in canada ■ 715
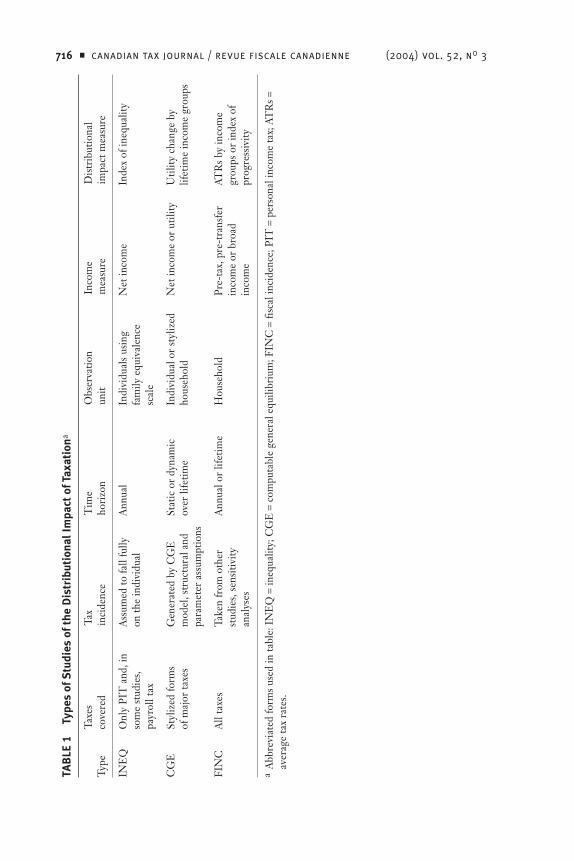
measure of economic well-being, the unit and time span of observation, the extentto which they incorporate economic modelling of behaviour, and their use ofinequality or progressivity to measure distributional impacts. Hence, the studiesvary in the types of social science and public policy questions that they can be usedto address. Table 1 summarizes several characteristics that distinguish the three typesof studies, which are denoted “inequality” (INEQ), “computable general equilib-rium” (CGE), and “fiscal incidence” (FINC). Each type of study presents advantagesas well as weaknesses relative to the alternatives.
INEQ studies are an offshoot of recent research to track income inequality bothin changes over time and differences across countries. These studies estimate thedifference in inequality measures between gross (or market) income and net (ordisposable) income of households. Typically they make adjustments using familyequivalence scales to gauge the well-being of individuals in households of differingsizes. Many INEQ studies do not distinguish between the impacts of taxes and theimpacts of cash-type transfers; they simply compare the pre-tax, pre-transfer distri-bution with the post-tax, post-transfer distribution. Identifying the taxation effectson inequality requires abstracting from the effects of the cash-transfer system. Sincethey examine primarily the difference between gross and net incomes, INEQ studiesusually consider only personal income taxes (PITs) and, in some cases, payroll taxesfor social security programs. These types of taxes are assumed to be borne fully bythe individual, thus obviating any incidence analysis.
INEQ studies have the principal advantage of using data sets that are constructedto allow tolerably consistent comparisons across countries both at a point in timeand across years. They can also decompose households into individuals using familyequivalence scales, and they can decompose inequality impacts into within-groupand across-group effects. INEQ studies can additionally support the analysis of howvarious components of a PIT affect inequality outcomes. They allow for variationsin the inequality parameter to examine the effects of different degrees of inequalityaversion. However, INEQ studies are severely limited in considering only directpersonal taxes, thereby omitting the full range of indirect taxes and business taxes.These studies further assume that the personal taxes are fully borne by taxpayers,thus missing any economic shifting of the tax burdens and most likely overstatingthe redistributive effects of progressive personal taxes. INEQ studies are also limitedto annual data and therefore do not capture the lifetime impacts, which again likelyoverstates the long-run inequality reduction from tax policy.
A second class of studies uses CGE economic models rather than drawing theirtax incidence assumptions from other studies; the assumed structure and parametersof the model dictate the incidence outcomes. CGE studies attempt to deal with thelong-run distributional effects of taxation via the impacts on employment, wages,profits, prices, and economic growth. These studies can report distributional out-comes by both income class and summary inequality measures, and the outcomes canbe computed in utility as well as net income terms. Utility or its monetary equiva-lent may be more informative than net income when comparing alternative taxregimes that affect patterns of leisure and consumption. Typically CGE studies are
716 ■ canadian tax journal / revue fiscale canadienne (2004) vol. 52, no 3T
AB
LE
1Ty
pes
of S
tudi
es o
f the
Dis
trib
utio
nal I
mpa
ct o
f Tax
atio
na
Taxe
sTa
xT
ime
Obs
erva
tion
Inco
me
Dis
trib
utio
nal
Type
cove
red
inci
denc
eho
rizo
nun
itm
easu
reim
pact
mea
sure
INE
QO
nly
PIT
and
, in
som
e st
udie
s,pa
yrol
l tax
CG
ESt
yliz
ed fo
rms
of m
ajor
taxe
s
Ass
umed
to fa
ll fu
llyon
the
indi
vidu
alA
nnua
lIn
divi
dual
s us
ing
fam
ily e
quiv
alen
cesc
ale
Indi
vidu
al o
r st
yliz
edho
useh
old
Net
inco
me
Inde
x of
ineq
ualit
y
Gen
erat
ed b
y C
GE
mod
el, s
truc
tura
l and
para
met
er a
ssum
ptio
ns
Take
n fr
om o
ther
stud
ies,
sens
itivi
tyan
alys
es
FIN
CA
ll ta
xes
Stat
ic o
r dy
nam
icov
er li
fetim
e
Ann
ual o
r lif
etim
eH
ouse
hold
Net
inco
me
or u
tility
Pre-
tax,
pre
-tra
nsfe
rin
com
e or
bro
adin
com
e
Util
ity c
hang
e by
lifet
ime
inco
me
grou
ps
ATR
s by
inco
me
grou
ps o
r in
dex
ofpr
ogre
ssiv
ity
aA
bbre
viat
ed fo
rms u
sed
in ta
ble:
INE
Q =
ineq
ualit
y; C
GE
= c
ompu
tabl
e ge
nera
l equ
ilibr
ium
; FIN
C =
fisc
al in
cide
nce;
PIT
= p
erso
nal i
ncom
e ta
x; A
TR
s =av
erag
e ta
x ra
tes.
tax incidence, progressivity, and inequality in canada ■ 717
highly stylized in their treatment of individuals (as against households) and the rangeof taxes considered (often cast as labour income, capital income, and consump-tion), and they do not always distinguish between taxes imposed at the businessversus the individual level. Most CGE studies are geared to consider the lifetime as wellas the transitional and intergenerational distributional impacts of taxes.5
The methods used by CGE studies offer several advantages over the other typesof studies.6 A dynamic CGE model can reveal the time path of the distribution ofgains or losses from tax changes; static analysis ignores the impact of tax changeseither on future generations or on transitional generations during the economy’sadjustment. A CGE model generates the incidence of all taxes in an economicallylogically consistent framework rather than making various assumptions about taxincidence. The implied incidence of taxes can be related to key behavioural param-eters in the model—the elasticities of substitution between capital and labour andbetween current and future consumption—where empirical evidence can be used.The CGE approach also can simultaneously assess the distributional and efficiencyeffects of taxes within the same model. In a policy context with competing goals,both of these effects are germane to public decision making; a more progressive taxsystem may entail greater inefficiencies. Finally, the lifetime view of individualwell-being in this approach accords with empirical evidence about the consump-tion behaviour of individuals, which is tied more closely to longer-term incomeflows than current income. The lifetime view may also conform to ethical viewsabout how society should gauge the impact of public policies.
CGE studies also suffer significant limitations relative to alternatives.7 CGE mod-els require specific functional forms, structural assumptions, and parameter valuesfor which good empirical estimates are lacking. They employ highly aggregatedmodelling and data, so that they cannot capture the effects of detailed tax policychanges. Data for lifetime incomes and their composition between capital andlabour sources are not directly available, so that they need to be simulated, withmany associated uncertainties and limited guidance from longitudinal data sets.
5 Earlier-generation CGE tax models were static and did not incorporate dynamic orintertemporal effects; see the review of early CGE studies in John B. Shoven and John Whalley,“Applied General-Equilibrium Models of Taxation and International Trade: An Introductionand Survey” (1984) vol. 22, no. 3 Journal of Economic Literature 1007-51.
6 This discussion draws heavily on Don Fullerton and Diane Lim Rogers, Who Bears the LifetimeTax Burden? (Washington, DC: Brookings Institution, 1993).
7 This discussion draws heavily on William G. Gale, Scott Houser, and John Karl Scholz,“Distributional Effects of Fundamental Tax Reform,” in Henry J. Aaron and William G. Gale, eds.,Economic Effects of Fundamental Tax Reform (Washington, DC: Brookings Institution, 1996),281-320; and Sheila Block and Richard Shillington, “Incidence of Taxes in Ontario in 1991,” inAllan M. Maslove, ed., Taxation and the Distribution of Income, Research Studies of the Fair TaxCommission of Ontario (Toronto: University of Toronto Press in cooperation with the FairTax Commission of Ontario, 1994), 3-39. Note that the cited drawbacks to the lifetimeperspective also apply to FINC studies that use lifetime incomes and taxes.
718 ■ canadian tax journal / revue fiscale canadienne (2004) vol. 52, no 3
The use of a common interest rate for borrowing and lending means that capitalincome is irrelevant in computing lifetime income, but this assumption is empiri-cally false and ignores the constraints on borrowing faced by many households.Hence, for those households, income over an annual period, or at least somethingshort of a lifetime, may be a better gauge of their behaviour and well-being. Anannual perspective may be more readily understood by policy makers than thelifetime perspective, given the political reality of frequent changes to the tax system.The complexity of CGE modelling also means that its distributional findings will beless comprehensible to policy makers and politicians than those from other types ofstudies.
A third class of studies focuses on “fiscal incidence,” and this includes the earliestresearch undertaken on this topic as well as substantial research of more recentvintage. FINC studies typically present their results by income classes of taxpayers,so that the findings are reported in terms of progressivity (the pattern of average taxrates or ATRs) rather than inequality measures. They usually consider the house-hold rather than the individual as the unit of observation. Most of these studiesutilize annual data, but the method has been extended using simulated lifetimedata. FINC studies can be pursued either with relatively aggregated data by incomeclass (for the distributions of income receipts of various types and savings patterns)or with micro data sets.
FINC studies, while being the earliest employed, have notable strengths thataccount for their continued widespread use. They can include a large number of taxtypes and can consider a wide range of assumptions about the incidence of each tax.Sensitivity analyses can then be undertaken to explore the implications of thealternative incidence assumptions. Our extended discussion of tax incidence assump-tions is reserved for the review of FINC studies. Because they build on micro datasets that often contain details about particular tax provisions, some FINC studiescan examine the distributional effects of those provisions. This class also includesstudies that cover the distributional impacts of the expenditure as well as the revenueside of public budgets. The methodology of FINC studies forms the framework formost distributional analyses undertaken by governments in Canada and elsewherefor marginal changes in tax policy.8
Several comparative weaknesses of FINC studies also warrant noting. There iscontroversy among researchers over the appropriate income base to use in com-puting the ATRs; this choice can significantly affect the appearance of progressivityor regressivity of taxes. And ATRs measure the departure of the tax system fromproportionality, which does not directly reveal the extent of inequality reduction,unlike the use of inequality indices in INEQ studies. Moreover, ATRs are computedfor households and expressed across household income groups, in some studies
8 These can use either “static” or “dynamic” assumptions about behavioural responses (see thestudies in Distributional Analysis of Tax Policy, supra note 1) but still do not attempt to capturethe deadweight efficiency costs of taxes.
tax incidence, progressivity, and inequality in canada ■ 719
without adjustment (or equivalizing) for the numbers or ages of individuals in eachhousehold. The use of households may be questioned for Canadian studies, sincethe single largest tax—the PIT—is normally applied on the basis of individualrather than family incomes.9 Finally, the unlimited f lexibility of choice of shiftingassumptions for each tax in FINC studies may lead to economically inconsistentchoices for groups of taxes. Even though undertaken within a simplified andrestrictive economic model, CGE studies at least enforce consistency in the under-lying economics of tax incidence.
Budgetary Measures of Tax Distribution
In most real-world decisions about tax policy, the distributional impacts are paramountand dominate considerations of economic efficiency and operational simplicity.Public discourse on tax policy also focuses on the distribution of gainers and losers.Hence, the manner in which government officials assemble and present theirinformation on the distributional effects of proposed or budgetary tax changes iscritical, since this is the format most readily accessible to the public. Two methodsare most commonly employed by governments to generate a picture of these taximpacts—the “typical taxpayer” approach and the use of “distribution tables,” eachof which is described below. Canadian budget documents at both the federal andprovincial levels contain only typical taxpayer figures and rarely present any distri-bution tables. In contrast, US official tax proposals and tax expenditure accountshave traditionally contained tax distribution tables, although in the last severalyears the published materials have been much more limited.10 Nevertheless, bothof these official methods of presenting information about tax distribution will beseen to fall short of the best practice in the economic literature on tax incidenceand tax distribution. Thus, the effects of tax policies on inequality or progressivityare not reliably captured in official documents.
Budgets often present typical taxpayer examples of tax impacts for illustrativehouseholds by level of income and demographic traits. This method is almostalways restricted to assessing types of taxes with incidence assumed to fall fully onthe individual taxpayer—such as PIT, sales and excise taxes, employee payroll taxes,and property tax. However, as will be shown in our critical review of tax incidencefor FINC studies, these simple incidence assumptions are not all well settled in theliterature. They likely overstate, for example, the impacts (positive or negative) ofPIT changes on the highest income groups. The typical taxpayer method alsoneglects to distribute the burdens of taxes imposed on businesses, whose incidence
9 Couples file a “joint” return in Canada only when one partner has income below the taxablethreshold (about Cdn$8,000). In fact, most countries tax on an individual basis (the UnitedStates and France being among the exceptions), and this may make little difference ifhousehold members pool their incomes.
10 Martin A. Sullivan, “The Decline and Fall of Distribution Analysis” (2003) vol. 99, no. 13 TaxNotes 1869-73.
720 ■ canadian tax journal / revue fiscale canadienne (2004) vol. 52, no 3
is more disputed. Moreover, this method of presenting information about tax distri-bution is susceptible to politically driven manipulation. Atypical taxpayer situationscan be chosen to make a government’s tax policies look better, and other taxpayersituations that would make the policies look worse can be selectively omitted.11
Rarely are taxpayers with incomes above $100,000 presented in these examples oftax impacts, despite the fact that this group accounts for a disproportionately largeshare of all the personal tax revenues.
A second method for presenting budgetary information on tax impacts isthrough distribution tables, which summarize the results of microsimulations usinglarge data sets of taxpayers. These tables allow the impacts to be differentiated bycharacteristics such as income class, family type and/or size, and age. This methodis implemented very much like FINC studies except that discrete tax rate and basechanges are assessed rather than the entire tax system. Still, the application of thismethod for budgetary purposes shares most of the same potential weaknesses asFINC studies. Foremost are uncertainties about the incidence of some taxes, the useof annual rather than lifetime data, and (unlike CGE studies) the failure to considerthe dynamic path of the tax impacts over time and various generations. The proce-dures used by finance officials in Canada are not well documented,12 but there hasbeen informed review of the differing methods employed by various US agenciesinvolved in the formulation of tax policy.13 For example, the incidence of the corpo-rate income tax has been controversial, and until 1992 the Joint Committee onTaxation did not even attempt to distribute the associated burden. As noted by oneobserver, “JCT’s refusal to distribute corporate tax changes had enormous practicalconsequences for policy makers relying on distributional tables as a basis for theirpolitical decisions.”14 Similarly, any particular choice of incidence or other ap-proaches in constructing distribution tables could sharply alter the course of taxpolicy decisions.
11 For example, Ontario’s 2000 budget documents provided many typical taxpayer examples butnone with capital gains that would have benefited greatly from the proposed tax cuts in thatarea. See Hugh MacKenzie, “Ontario’s Little Capital Gains Game,” Toronto Star, May 9, 2000.
12 The microsimulation models and data sets are proprietary to the federal Department of Financeand the provincial finance ministries. A widely used system in the public domain is StatisticsCanada’s Social Policy Simulation Dataset/Model, whose construction, use, and limitations aredocumented in Michael Bordt, Grant J. Cameron, Stephen F. Gribble, Brian B. Murphy, GeoffT. Rowe, and Michael C. Wolfson, “The Social Policy Simulation Database and Model: AnIntegrated Tool for Tax/Transfer Policy Analysis” (1990) vol. 38, no. 1 Canadian Tax Journal 48-65.
13 See the studies in Distributional Analysis of Tax Policy, supra note 1, including discussion of themethods used by the US Treasury Department’s Office of Tax Analysis, the CongressionalBudget Office, and the Joint Committee on Taxation of the US Congress.
14 Michael J. Graetz, “Distributional Tables, Tax Legislation, and the Illusion of Precision,” inDistributional Analysis of Tax Policy, supra note 1, 15-78, at 47.
tax incidence, progressivity, and inequality in canada ■ 721
Measures of Inequality and Progressivity15
While it is easy for budgetary officials and tax policy protagonists to select ways ofpresenting distributional impacts that cast their preferred tax policies in a favourablelight,16 the research literature offers more rigorous types of measures. Comparingthe results of various studies, and making sense of them individually, requires aclear understanding of inequality and progressivity indices. Although the two kindsof measures can be interrelated, they are also quite distinct. Inequality is definedover the entire income distribution, while progressivity is defined over the tax systemas it applies at different income levels. Inequality measurement involves taking thedistribution of incomes (whether pre-tax or post-tax) and transforming it into anindex. As long as it satisfies some plausible assumptions, an inequality index iscomparable across different income distributions. That is, we can say whether oneincome distribution is “more equal” than another and by how much. For presentpurposes, the application would be to compare inequality either pre-tax versuspost-tax or before and after certain tax changes. Inequality indices can also be usedto compare the distributional impacts of taxes across countries, despite dramaticdifferences in their tax systems.
Progressivity measures, in contrast, focus on the relative ATRs faced by variousincome groups. These measures can be either local (that is, showing the ATR for eachof many such income groups) or global (that is, summarizing the overall pattern oftax progressivity). Local progressivity measures allow for a more detailed view ofthe relative impacts of taxes on each of many income groups than a summary index.However, local measures of progressivity do not allow for easy comparability of taxpolicies across countries or over time for a given country. As will be shown, globalprogressivity measures can be constructed so that they correspond directly to coun-terpart inequality measures of the impact of taxes. More brief ly we also considermeasures of the horizontal inequity dimension of taxes; this is closely related toboth inequality and progressivity measures.
15 This section draws heavily on the comprehensive analysis by Peter J. Lambert, The Distributionand Redistribution of Income, 3d ed. (Manchester: Manchester University Press, 2001) and thecompact exposition by Julie A. Litchfield, “Inequality: Methods and Tools,” available online onthe World Bank Web site on Inequality, Poverty, and Socio-Economic Performance at http://www.worldbank.org/poverty/inequal/index.htm. For analysis of the relations between local andglobal progressivity measures and inequality reduction, see Nripesh Podder, “Tax Elasticity,Income Redistribution and the Measurement of Tax Progressivity” (1997) vol. 7 Research onEconomic Inequality 39-60; and Jean-Yves Duclos, “Measuring Progressivity and Inequality”(1997) vol. 7 Research on Economic Inequality 19-37.
16 For a striking example of the divergent ways in which the distributional impacts of a specifictax policy change can be characterized, see Jane G. Gravelle, “Economic Issues AffectingAcross-the-Board Tax Cuts” (2001) vol. 90, no. 3 Tax Notes 367-82, at 370, table 4.
722 ■ canadian tax journal / revue fiscale canadienne (2004) vol. 52, no 3
Measures of InequalityThe characteristic common to all inequality indices is that they measure the disper-sion, or spread, of income across the population. Inequality indices offer bothbenefits and challenges for assessing the distributional impacts of taxes. We mustfirst clearly define what we want to measure and then find an appropriate index tomeasure it. The difficulty is that researchers are not in complete agreement aboutwhat constitutes an appropriate and informative measure. A second issue concernsthe relationship between inequality measures and social welfare functions. Someanalyses seek to determine the types of social welfare functions implied whenincome distributions are ranked in terms of a particular index of inequality.17 Sincean index by definition summarizes an entire income distribution in one number,some judgment is required in formulating the index. This judgment, in turn, isbased on how the observer values inequality, which is in effect the choice of thesocial welfare function. For example, should the index use equal weights for the fullpopulation, or should lower-income households be given a greater weight? Theo-retical analysis finds that, in order to obtain indices that satisfy some plausiblecriteria, the social welfare functions underlying them may have to be very restric-tive. We review the principal methods used to measure inequality in studies of taxincidence and then brief ly consider other indices. We also note the formulation,merits, and drawbacks of the various indices.
The Lorenz Curve and the Gini Coefficient
A simple way of illustrating inequality is the Lorenz curve. It is not a numericalindex per se, but it clearly motivates how such indices are created. The Lorenz curveis drawn graphically in a square of length of 1 (for 100 percent), as in figure 1. Thehorizontal axis represents the proportion of the population, ordered by incomefrom lowest to highest. The vertical axis plots the cumulative proportion of incomeheld by that part of the population. In a completely equal society, where everybodyhas identical incomes, the Lorenz curve will be the straight line connecting thepoints along the diagonal labeled D. That is, the bottom 10 per cent of the incomedistribution has 10 per cent of the income, and so forth. If there is any inequality inthe society, the Lorenz curve will lie below this diagonal because the poorer half ofthe population must have less than half of total income. This deviation from the45-degree diagonal allows some income distributions to be ranked. If the Lorenzcurve of a distribution B lies entirely below that of distribution A, we say thatdistribution A “Lorenz-dominates” B, or that distribution A is more equal than B. Ineffect, this means that it is possible to go from distribution A to B (assuming theirmeans to be equal) by transferring income from the poor to the rich. However, thisranking criterion is not complete. If the Lorenz curves of two income distributions
17 Charles Blackorby and David Donaldson, “Measures of Relative Inequality and Their Meaningin Terms of Social Welfare” (1978) vol. 18, no. 1 Journal of Economic Theory 59-80.
tax incidence, progressivity, and inequality in canada ■ 723
cross, neither can be said to dominate the other, and hence we cannot claim thatone distribution is more equal than the other without further assumptions abouthow one values equality at various points in the income distribution.
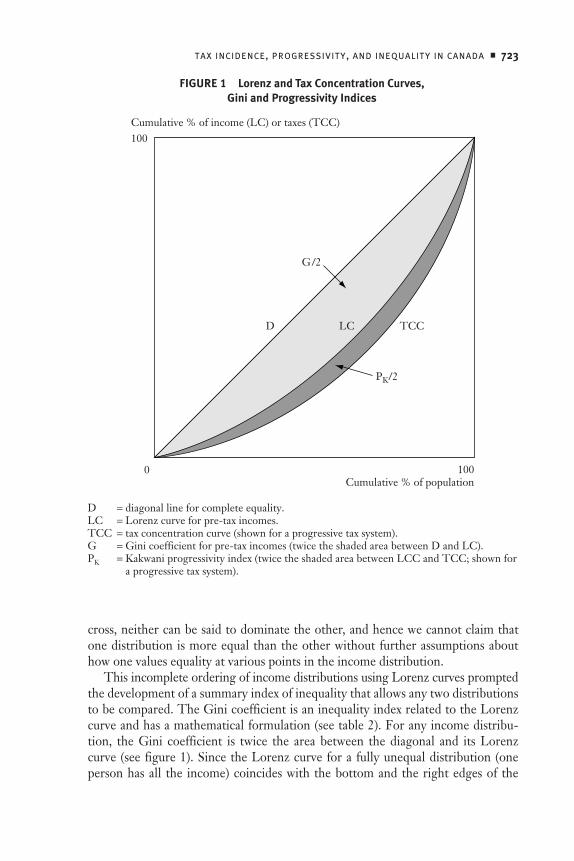
This incomplete ordering of income distributions using Lorenz curves promptedthe development of a summary index of inequality that allows any two distributionsto be compared. The Gini coefficient is an inequality index related to the Lorenzcurve and has a mathematical formulation (see table 2). For any income distribu-tion, the Gini coefficient is twice the area between the diagonal and its Lorenzcurve (see figure 1). Since the Lorenz curve for a fully unequal distribution (oneperson has all the income) coincides with the bottom and the right edges of the
Cumulative % of income (LC) or taxes (TCC)100
0 100Cumulative % of population
D TCCLC
G/2
PK/2
FIGURE 1 Lorenz and Tax Concentration Curves, Gini and Progressivity Indices
D = diagonal line for complete equality.LC = Lorenz curve for pre-tax incomes.TCC = tax concentration curve (shown for a progressive tax system).G = Gini coefficient for pre-tax incomes (twice the shaded area between D and LC).PK = Kakwani progressivity index (twice the shaded area between LCC and TCC; shown for
a progressive tax system).

724 ■ canadian tax journal / revue fiscale canadienne (2004) vol. 52, no 3
TABLE 2 Major Inequality Indices and Their Progressivity Indicesa
Inequality index Progressivity index
Gini
Gn x
x xi j
j
n
i
n
= -==
ÂÂ1
2 211
Kakwani
P C t G xKg= -( ) ( )
Musgrave-Thin
P G x G xMTn g= - -( )[ ] ( )[ ]1 1
Reynolds-Smolensky
P G x G xRSg n= -( ) ( )
P E E xE cnx g
c= -( ) ( )Generalized entropy (for c π 0, 1)
Enc cc
i
xxi
c
=-( )
ÏÌÓ
¸˝˛
ÊËÁ
ˆ¯̃
-È
ÎÍÍ
˘
˚˙˙Â1
11
Mean logarithmic deviation (c = 0)
En
x
xii
01
= Â ln
Theil (c = 1)
En
x
x
x
xi
i
i1
1= Â ln
Squared coefficient of variation (c = 2)
Enx
x xi
i
2 2
21= -( )Â
Atkinson (for 0 < e π 1)
In
x
xei
e
i
e
= - ÊËÁ
ˆ¯̃
È
ÎÍÍ
˘
˚˙˙
- -
Â( )
11
1 1 1
Atkinson (for e = 1) yields mean logarithmicdeviation (as with generalized entropy forc = 0)
Kiefer
P I x I xI eg
en= -( ) ( )
Blackorby-Donaldson
P I x I x I xI eg
en
eg* = - -( ) ( )[ ] ( )[ ]1
a There are n individuals; xi = income of individual i; xg = vector of pre-tax (gross) incomes; xn =vector of post-tax (net) incomes; xEDE = equally distributed equivalent income (see text); C(t) =tax concentration coefficient; and x = the mean value of x (incomes).
tax incidence, progressivity, and inequality in canada ■ 725
box, the maximum value of the Gini coefficient is 1, twice the area of the triangleunder the diagonal. The smallest value of the Gini is 0, which occurs with com-plete equality when the Lorenz curve coincides with the 45-degree line. The Ginicoefficient has some desirable properties that make it the most commonly usedinequality index.18 The Gini is independent of scale, so that a proportional changein everyone’s income will not alter its value. It satisfies the Pigou-Dalton principleof transfers, which states that any transfer from a poorer household to a richerhousehold must increase inequality. The Gini coefficient also can be defined overnegative income observations, which frequently occur in empirical data.
Generalized Entropy Class of Indices
A “generalized entropy” class of inequality indices based on information theoryincludes as special cases the often-used Theil,19 squared coefficient of variation,and mean log deviation indices. Formulas for the generalized entropy index and itssubcases appear in table 2. All members of this class of indices share several usefulproperties—scale independence, Lorenz domination, the principle of transfers,and decomposability (defined below). However, some forms of the index involvetaking the natural logarithm of income and thus are not defined over zero ornegative values of income. These indices assume values ranging from 0 (completeequality) to unboundedly large (extreme inequality). A major benefit of this class ofindices is their ability to decompose overall inequality into within-group and cross-group inequality, which can be useful in assessing the effects of tax policies. Forexample, assume that we have defined subgroups of households with and withoutearners; and further that an entropy index of before-tax incomes is stable but theindex of after-tax incomes is falling over time, which indicates that net incomes arebecoming more equal owing to tax changes. We can then decompose this fall in theindex into a between-groups component and a within-groups component to seehow changes in the tax system have exercised their equalizing inf luence.
Generalized entropy indices contain a parameter (c) to reflect the weight assignedto distances between incomes at different parts of the distribution; this parametercan assume any real value. Choosing lower values for c makes the index moresensitive to changes in the lower tail, while choosing higher values for c makes theindex more sensitive to changes in the upper tail. Certain values of the parameteryield the special subcases of the index shown in the table. A value of c = 0 producesthe mean logarithmic deviation, which weights by population shares, while a valueof c = 1 produces the Theil index, which weights by income shares. The Theilindex is more bottom-sensitive than the Gini, thus giving more weight to changesat the lower end of the income distribution. Choosing c = 2 yields another commonmeasure of inequality, the squared coefficient of variation (CV 2), which is moresensitive to income changes at higher incomes.
18 Gareth D. Myles, Public Economics (Cambridge, UK: Cambridge University Press, 1995).
19 Henri Theil, Economics and Information Theory (Amsterdam: North-Holland, 1967).
726 ■ canadian tax journal / revue fiscale canadienne (2004) vol. 52, no 3
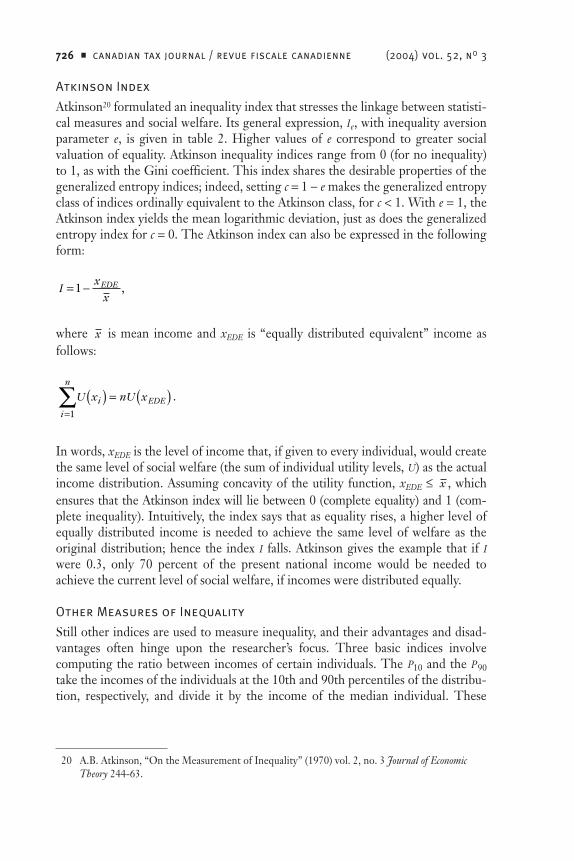
Atkinson Index
Atkinson20 formulated an inequality index that stresses the linkage between statisti-cal measures and social welfare. Its general expression, Ie, with inequality aversionparameter e, is given in table 2. Higher values of e correspond to greater socialvaluation of equality. Atkinson inequality indices range from 0 (for no inequality)to 1, as with the Gini coefficient. This index shares the desirable properties of thegeneralized entropy indices; indeed, setting c = 1 - e makes the generalized entropyclass of indices ordinally equivalent to the Atkinson class, for c < 1. With e = 1, theAtkinson index yields the mean logarithmic deviation, just as does the generalizedentropy index for c = 0. The Atkinson index can also be expressed in the followingform:
Ix
xEDE= -1 ,
where x is mean income and xEDE is “equally distributed equivalent” income asfollows:
U Ui
n
ix n xEDE
=Â ( ) = ( )
1
.
In words, xEDE is the level of income that, if given to every individual, would createthe same level of social welfare (the sum of individual utility levels, U) as the actualincome distribution. Assuming concavity of the utility function, xEDE £ x , whichensures that the Atkinson index will lie between 0 (complete equality) and 1 (com-plete inequality). Intuitively, the index says that as equality rises, a higher level ofequally distributed income is needed to achieve the same level of welfare as theoriginal distribution; hence the index I falls. Atkinson gives the example that if Iwere 0.3, only 70 percent of the present national income would be needed toachieve the current level of social welfare, if incomes were distributed equally.
Other Measures of Inequality
Still other indices are used to measure inequality, and their advantages and disad-vantages often hinge upon the researcher’s focus. Three basic indices involvecomputing the ratio between incomes of certain individuals. The P10 and the P90take the incomes of the individuals at the 10th and 90th percentiles of the distribu-tion, respectively, and divide it by the income of the median individual. These
20 A.B. Atkinson, “On the Measurement of Inequality” (1970) vol. 2, no. 3 Journal of EconomicTheory 244-63.
tax incidence, progressivity, and inequality in canada ■ 727
indicate the state of the poor and the rich relative to the median in the population.Dividing the P90 by the P10 yields the “decile ratio” or “social distance.” Thesethree measures can serve as a quick standard of comparison in cross-country ortime-based studies of inequality. However, because they do not make use of theentire income distribution, they lose much of the information present in the morecomplex indices discussed above. Some studies, such as Gottschalk and Smeeding,21
report the P10, P90, and P90/P10 alongside the Gini coefficient. Indeed, it is commonfor empirical studies of tax incidence to report more than one index of inequality.Jäntti,22 for instance, works primarily with the CV 2 because he is interested indecomposing the between-group and within-group elements of inequality, but healso reports the Gini coefficient and the mean logarithmic deviation. Zandvakili23
computes inequality using both the generalized entropy and Atkinson indices, eachfor a range of parameter values.
Axiomatic View of Inequality Indices
Many authors have outlined axioms that an inequality index should meet; it isinformative to check if the measures cited above satisfy these axioms.24 The Pigou-Dalton principle of transfers, noted earlier, is satisfied by the Gini, generalizedentropy, and Atkinson indices. Scale independence is satisfied by most indices, withthe exception of the variance. Anonymity or symmetry requires that the inequalitymeasure not be affected by the order in which households are labelled; that is,inequality depends solely on the distribution of income, not on which individualshold it. Again, the Gini, the generalized entropy, and Atkinson indices satisfy this.Finally, decomposability is a desirable attribute for applying an index to study thechannels of redistribution by the tax system.25 As noted above, the Theil, squaredcoefficient of variation, and other entropy indices are decomposable. The Atkinsonindex is also decomposable, although this has to be implemented in a specialmanner.26 However, the Gini coefficient is decomposable only if the subgroups do
21 Peter Gottschalk and Timothy M. Smeeding, “Empirical Evidence on Income Inequality inIndustrialized Countries,” in Anthony B. Atkinson and François Bourguignon, eds., Handbookof Income Distribution, vol. 1 (New York: Elsevier Science, 2000), 261-307.
22 Markus Jäntti, “Inequality in Five Countries in the 1980s: The Role of Demographic Shifts,Markets and Government Policies” (1997) vol. 64, no. 255 Economica 415-40.
23 Sourushe Zandvakili, “Income Distribution and Redistribution Through Taxation: AnInternational Comparison” (1994) vol. 19, no. 3 Empirical Economics 473-91.
24 See, for example, Myles, supra note 18 and Litchfield, supra note 15.
25 Litchfield, supra note 15, offers a summary of decomposition techniques for assessing thesources of inequality.
26 See Charles Blackorby, David Donaldson, and Maria Auersperg, “A New Procedure for theMeasurement of Inequality Within and Among Population Subgroups” (1981) vol. 14, no. 4Canadian Journal of Economics 665-85.
728 ■ canadian tax journal / revue fiscale canadienne (2004) vol. 52, no 3
not overlap in the income distribution.27 Hence, our example above involving theinequality effects of taxes on households with and without earners could not bedecomposed using the Gini coefficient because there is clearly overlap in incomesbetween these groups.
Measures of Tax ProgressivityAnother way to gauge the distributional impacts of taxes is by assessing theirprogressivity and/or regressivity—that is, the pattern of effective ATRs across in-comes. The ATR for an income group is computed as its tax liability divided by arelevant measure of its income (an issue discussed later). An ATR that rises over a rangeof income is said to be progressive in that range, an ATR that declines is regressive,and an ATR that is steady is proportional. Local indices of progressivity can rank agiven type of tax or the total tax system over a given range of income, but becauseprogressivity can vary with income level, a global progressivity index is needed tocharacterize the tax or tax system across the entire income scale. Hence, a globalindex is usually needed to compare the progressivity of taxes across time, countries,or policy changes. Global progressivity indices have been constructed to matchcorresponding inequality indices, such that a more progressive tax is associatedwith a more equal after-tax distribution (and conversely). Local progressivity canbe thought of as how much the tax system deviates from proportionality at a specificpoint in the income distribution. A tax or tax system can be progressive at the lowertail of the distribution but regressive at the upper tail, or vice versa. Local progres-sivity measures can reveal patterns of ATRs such as an inverted U, whereas globalmeasures cannot. Thus, estimates of the pattern of local progressivity can add infor-mation to that of a global index.
Local Indices of Progressivity
The simplest way of displaying local tax progressivity is to chart the pattern ofATRs computed by income level, where income is shown either by dollar intervalsor by groups such as percentiles or deciles. This approach was standard in earlyFINC studies and remains popular in recent studies of that type.28 A closely relatedlocal index is called the “relative share adjustment” (RSA), developed in Baum29 and
27 If the subgroups do have overlapping incomes, there is a “residual” that measures overlap andthat has been used in tax studies to capture re-ranking. See J. Richard Aronson, Paul Johnson,and Peter J. Lambert, “Redistributive Effects and Unequal Income Tax Treatment” (1994) vol. 104,no. 423 Economic Journal 262-70; and Adam Wagstaff et al., “Redistributive Effect, Progressivityand Differential Tax Treatment: Personal Income Taxes in Twelve OECD Countries” (1999)vol. 72, no. 1 Journal of Public Economics 73-98.
28 A CGE study could also chart the pattern of lifetime ATRs with respect to lifetime incomes,but the typical approach is to focus on the pattern of gains and losses to lifetime utility bylifetime incomes.
29 Sandra R. Baum, “On the Measurement of Tax Progressivity: Relative Share Adjustment”(1987) vol. 15, no. 2 Public Finance Quarterly 166-87.
tax incidence, progressivity, and inequality in canada ■ 729
used in the empirical work of Ruggeri and Bluck30 and Ruggeri et al.31 It measuresthe local redistributional impact of a given tax compared with a proportional tax:
RSA ATR ATRi i= -( ) -( )1 1 ,
where ATRi is the average tax rate paid by the ith income group, and ATR is the totaltax collected divided by aggregate income. Clearly, if the ith income group’s taxeswere at the overall average rate, RSAi = 1. An RSAi > 1 indicates that this incomegroup pays a locally progressive tax, and an RSAi < 1 indicates a locally regressivetax. The RSA index can be used to calculate the gain or loss to a specific incomegroup of switching to a fully proportional tax. For example, an RSAi of 1.03 impliesthat the ith taxpayer would suffer an income loss of about 3 per cent if the existingtax system were replaced by a proportional tax. Charting the RSAi against incomeproduces a virtual mirror image of the chart of ATRs by income, since the numera-tor of RSAi is 1 – ATRi and the denominator is constant across incomes.
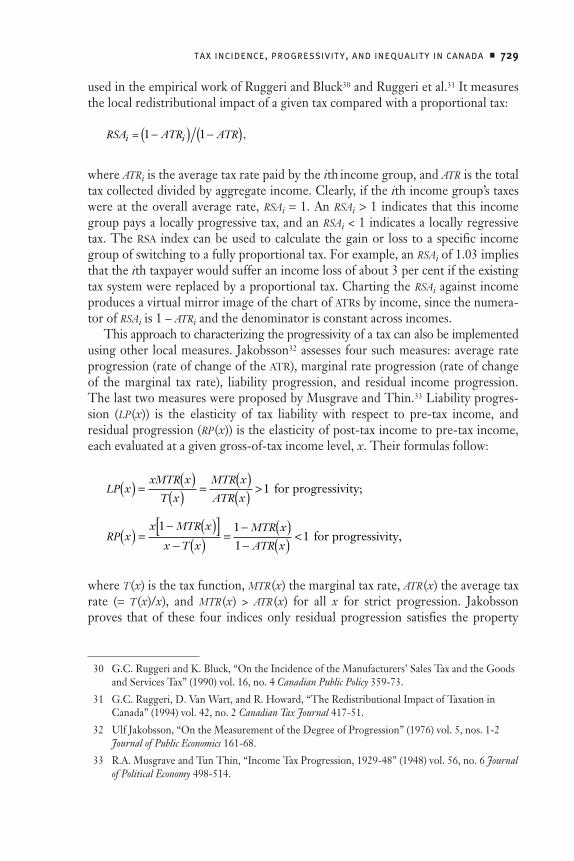
This approach to characterizing the progressivity of a tax can also be implementedusing other local measures. Jakobsson32 assesses four such measures: average rateprogression (rate of change of the ATR), marginal rate progression (rate of changeof the marginal tax rate), liability progression, and residual income progression.The last two measures were proposed by Musgrave and Thin.33 Liability progres-sion (LP (x)) is the elasticity of tax liability with respect to pre-tax income, andresidual progression (RP (x)) is the elasticity of post-tax income to pre-tax income,each evaluated at a given gross-of-tax income level, x. Their formulas follow:
LPMTR
T
MTR
ATRx
x xx
xx
( ) =( )
( ) =( )( ) > 1 for progressivity;
RPMTR
T
MTR
ATRx
x x
x xxx
( ) =- ( )[ ]
- ( ) =- ( )- ( ) <
1 11
1 for progressivity,
where T (x) is the tax function, MTR (x) the marginal tax rate, ATR (x) the average taxrate (= T (x)/x), and MTR (x) > ATR (x) for all x for strict progression. Jakobssonproves that of these four indices only residual progression satisfies the property
30 G.C. Ruggeri and K. Bluck, “On the Incidence of the Manufacturers’ Sales Tax and the Goodsand Services Tax” (1990) vol. 16, no. 4 Canadian Public Policy 359-73.
31 G.C. Ruggeri, D. Van Wart, and R. Howard, “The Redistributional Impact of Taxation inCanada” (1994) vol. 42, no. 2 Canadian Tax Journal 417-51.
32 Ulf Jakobsson, “On the Measurement of the Degree of Progression” (1976) vol. 5, nos. 1-2Journal of Public Economics 161-68.
33 R.A. Musgrave and Tun Thin, “Income Tax Progression, 1929-48” (1948) vol. 56, no. 6 Journalof Political Economy 498-514.
730 ■ canadian tax journal / revue fiscale canadienne (2004) vol. 52, no 3
that, if it is increased at every income level, then the Lorenz curve shifts upward.Graphically, this “Lorenz criterion” states that if the tax system is everywhereprogressive, then the post-tax Lorenz curve should lie above the pre-tax Lorenzcurve at all incomes and without crossing.
Global Indices of Progressivity
Global indices of progressivity offer a compact and informative way to measure theimpacts of taxes on the distribution of incomes. They are especially useful in trackingprogressivity over time or in comparing progressivity across countries. Note thatglobal progressivity indices can be constructed to focus on departures from pro-portionality or on the redistributive effects of taxes. As articulated by Musgraveand Thin, “effective progression . . . measures the extent to which a given taxstructure results in a shift in the distribution of income toward equality.”34 Computing aglobal progressivity index requires knowledge of the income distribution to whicha tax or tax system is applied. Hence, a change in the pre-tax income distributionwill usually affect the measured global progressivity of an unchanged tax or taxsystem. The less equal is the pre-tax income distribution, the greater will be theequalizing effects and hence the global index of progressivity of a given progressivetax structure. Thus, comparisons of global tax progressivity measures across coun-tries or over time for a given country may ref lect changes or differences in pre-taxdistributions along with changes or differences in the taxes under study. There isno similar impact of the pre-tax income distribution on local measures of taxprogressivity.
One global index builds on the local index of RSA described above. The globalindex of redistribution is a weighted sum of the RSAis taken over each income class:35
RSA RSAG w w y y yii
n
i i i i jj i
n
= = += = +
 Â1 1
2 where ( ),
and yi is the ith taxpayer’s share of post-fisc income (see later discussion). The indexis designed so that it places greater weight on lower income classes. The interpre-tation of the index is similar to the local index: an RSAG > 1 indicates that the overalltax system is progressive, RSAG = 1 for proportional, and RSAG < 1 for regressive.The value of the index ranges from 0 to 2. We next review global indices of taxprogressivity that have been proposed as companions for the inequality indicessummarized in table 2.
34 Ibid., at 510 (emphasis in original).
35 K. Cassady, G.C. Ruggeri, and D. Van Wart, “On the Classification and Interpretation ofGlobal Progressivity Measures” (1996) vol. 51, no. 1 Public Finance 1-22.
tax incidence, progressivity, and inequality in canada ■ 731
Several global progressivity indices have been proposed based on the Gini indexof inequality. The Kakwani36 progressivity index ref lects the extent to which a taxsystem departs from proportionality and can be derived graphically. On the sameaxes used for the Lorenz curve, one plots the tax concentration curve, which is thecumulative proportion of taxes versus position in the pre-tax income distribution(see figure 1). If the tax system is proportional, then the tax concentration curvecoincides with the Lorenz curve for pre-tax incomes. A progressive system impliesthat the tax concentration curve lies outside the Lorenz curve, and conversely for aregressive tax. The Kakwani index is twice the difference in area between the Lorenzcurve and the tax concentration curve, defined so that the index is positive if the taxis progressive, zero if proportional, and negative if regressive. Table 2 shows themathematical expression for the Kakwani index, PK. It is the difference between thetax concentration coefficient (the Gini for taxes using the ranking by pre-taxincomes) and the Gini for pre-tax incomes (x g).37
Two other global tax progressivity indices based on the Gini inequality indexfocus on the redistributive effect rather than departures from proportionality. Anindex attributed to Musgrave and Thin38 uses the Gini coefficients of the distribu-tions of pre-tax and post-tax (xn) incomes (see table 2).39 Another Gini-relatedprogressivity index is that of Reynolds and Smolensky,40 PRS; it reduces to simplythe difference between the Gini coefficients computed for the pre-tax and post-taxincome distributions. A useful relationship between Kakwani’s disproportionalityindex of progressivity and the Reynolds-Smolensky redistributive index ofprogressivity is41
P PRS Kg
g=
-1,
36 Nanak C. Kakwani, “Measurement of Tax Progressivity: An International Comparison” (1977)vol. 87, no. 345 The Economic Journal 71-80.
37 Note that the Kakwani progressivity index has a range that depends on pre-tax income inequality,G(xg); maximum regressivity is - (1 + G (xg)) and maximum progressivity is (1-G (xg)). Arelated tax progressivity index of Suits (Daniel B. Suits, “Measurement of Tax Progressivity”(1977) vol. 67, no. 4 The American Economic Review 747-52) uses relative concentration curves togauge disproportionality; conveniently, it ranges between -1 and +1.
38 Supra note 33.
39 This formulation was suggested by Charles Blackorby and David Donaldson, “Ethical SocialIndex Numbers and the Measurement of Effective Tax/Benefit Progressivity” (1984) vol. 17,no. 4 Canadian Journal of Economics 683-94, at 688, but it is consistent with the original view ofMusgrave and Thin, supra note 33, at 510, that effective progression can be expressed as theratios of the coefficients of equality of distributions of post-tax to pre-tax incomes.
40 Morgan O. Reynolds and Eugene Smolensky, Public Expenditures, Taxes, and the Distribution ofIncome: The United States, 1950, 1961, 1970 (New York: Academic Press, 1977).
41 If the ranking of units by pre-tax incomes differs from their ranking by taxes, a correction termfor re-ranking needs to be introduced to the relationship. See Nanak C. Kakwani, “On the
732 ■ canadian tax journal / revue fiscale canadienne (2004) vol. 52, no 3
where g is the aggregate ATR. Intuitively, a tax that is highly progressive (in the senseof departure from proportionality) can exert a large redistributive effect only to theextent that the tax system is applied heavily, with a high overall ATR.42 A countrywith only moderate progressivity of rate schedules but a high ATR can redistributemore than another with rates that are more steeply graduated but lower.
Global progressivity indices can also be constructed for the generalized entropyand Atkinson inequality indices. These measure the redistributive effect of taxesrather than departures from proportionality per se. For the generalized entropyindices, Zandvakili43 offers a progressivity index that is simply the difference be-tween the entropy measure of pre-tax incomes and the entropy measure of post-taxincomes. A positive difference indicates a progressive tax, a negative difference aregressive tax, and equality a proportional tax. The decomposability of the general-ized entropy index extends to the index of progressivity, so that one can analyze theprogressivity of taxes between and within subgroups of the population. Two globalprogressivity measures have also been advanced for the Atkinson inequality index.Kiefer44 proposes the simple difference between the Atkinson index computed forpre-tax and post-tax incomes, while Blackorby and Donaldson45 suggest a progres-sivity index that is the proportionate increase in equality relative to the initial level ofequality (see table 2). Hence, the Kiefer version would rate two tax regimes as equallyprogressive if they reduced the Atkinson index by identical amounts; Blackorby-Donaldson would rank as more progressive the regime that is applied to a lessequal pre-tax income distribution.
Measures of Horizontal InequityReal-world tax systems redistribute incomes not only vertically but also inevitablyapply different tax burdens to units with the same incomes. Traditionally this“unequal treatment of equals” has been called the horizontal inequity of the taxsystem. However, more recently analysts have distinguished between the tax sys-tem’s horizontal inequity and its “re-ranking” units from their pre-tax to theirpost-tax rankings even when their pre-tax incomes are unequal. The totalredistributive effect (RE ) of taxes can thus be decomposed into three components:vertical redistribution (V ) if there were no differential tax treatment of equals, the
Measurement of Tax Progressivity and Redistributive Effect of Taxes with Applications toHorizontal and Vertical Equity” (1984) vol. 3 Advances in Econometrics 149-68.
42 This point was also recognized by Musgrave and Thin, supra note 33, at 510: “effectiveprogression depends upon the general level of rates as well as upon the steepness of the ratestructure as such.”
43 Supra note 23.
44 Donald W. Kiefer, “Distributional Tax Progressivity Indexes” (1984) vol. 37, no. 4 National TaxJournal 497-513.
45 Supra note 39.
tax incidence, progressivity, and inequality in canada ■ 733
loss of redistributive effect owing to horizontal inequity (H), and the further lossdue to re-ranking (R):46
RE G V H Rxn= ( ) = - - .
The total redistributive effect is measured as the difference between the pre-tax(and post-transfer) Gini coefficient G(xg) and the post-tax Gini G(xn).
The inequality reduction from the vertical redistribution component is V = PRS,the Reynolds-Smolensky progressivity index; as defined earlier, this index is pro-portional to the Kakwani tax progressivity index (PK) and the aggregate tax rate. Aslong as the income tax rate schedule is progressive, PK will be positive, and the totalredistributive effect has an inequality-reducing vertical component offset in part bythe inequality-increasing effects of horizontal inequity and re-ranking.47 Horizontalinequity (H) is measured as a weighted sum of the post-tax-income Gini coeffi-cients of households with given pre-tax incomes; these Ginis are zero only with nodifferential tax treatment of equals. Re-ranking (R) is measured as the differencebetween the post-tax Gini coefficient and the post-tax concentration coefficient.Re-ranking can arise only with differential tax treatment, so that positive values ofR imply positive values of H. However, horizontal inequity need not imply re-ranking. Since H and R must be non-negative, these effects reduce the tax system’sredistributive effect.
The Measurement of Economic Well-Being
Unit of Observation: Individual or HouseholdThe studies are based on data (usually micro data) for families and unattachedpersons, and in INEQ and some CGE and FINC studies they are converted into“equivalized” individuals (or adult equivalents) to ref lect the scale economies ofshared consumption.48 This conversion can be done by using the equivalence scales
46 See Wagstaff et al., supra note 27, or J. Richard Aronson and Peter J. Lambert, “Decomposingthe Gini Coefficient To Reveal the Vertical, Horizontal, and Reranking Effects of IncomeTaxation” (1994) vol. 47, no. 2 National Tax Journal 273-94, for more detailed discussion of thisdecomposition. See Peter J. Lambert and Xavier Ramos, “Horizontal Inequity and Reranking:A Review and Simulation Study” (1997) vol. 7 Research on Income Inequality 1-18 for a criticalreview of measures of horizontal inequity.
47 This approach assumes that pre-tax incomes are a good measure of “ability to pay” and hencedefine “equals” among taxpayers. Yet many special provisions (credits, exemptions, deductions,etc.) of the PIT are intended to refine the measure of ability to pay (such as recognizingmedical care costs as different from ordinary consumption), so that one need not agree with themeasures of H or R.
48 United States, Congressional Budget Office, Effective Federal Tax Rates, 1979-1997 (Washington,DC: Congressional Budget Office, 2001), 19-20, discusses the relative merits of using thehousehold or family as the unit of analysis and opts for the household.
734 ■ canadian tax journal / revue fiscale canadienne (2004) vol. 52, no 3
implicit in poverty thresholds or those derived from budget studies, or by applyinga formula for the number of adult equivalents in a household:49
N A Ka ab= +( ) £ £ £ 0 1 0 1, ,
where the unit contains A adults and K children. Each child’s needs can be countedas proportion a of an adult’s needs, and scale economies are shown by b less thanone. Total money income of the family is def lated by the equivalence scale factor toobtain equivalized individual income, and a similar deflation is applied to the family’stotal taxes to obtain equivalized individual taxes. The equivalized data are thenweighted by the number of adult equivalents in each family based on its composition.This procedure assumes that all persons in each family enjoy equal shares of thefamily’s total income; it ignores the possible presence of differential shares by ageor sex of the family members. Another complication is that equivalence scales may beincome-dependent because the consumption bundles differ across income levels.50
Various equivalence scales have been employed in this kind of research. Jäntti51
uses the scales implied by the US poverty lines (the poverty line for a family of fourpersons equals twice that of a single person); Fritzell52 uses the so-called OECD(Organisation for Economic Co-operation and Development) equivalence scale (afactor of 1.0 for a one-person household, 0.7 for each other adult, and 0.5 for eachchild); and Wagstaff et al.53 use the formula given above with the parameters a andb both set equal to 0.5.54 Another method is simply to take the square root of thetotal number of persons in the household; this is equivalent to setting a at 1 and bat 0.5.55 Inequality measures—whether Lorenz curves, Gini coefficients, quintiledistributions, decile distributions, or 90/10 decile ratios—are then based on theweighted equivalized individuals. A few INEQ studies do not convert their house-hold income data into equivalized individuals. For example, Zandvakili asserts that
49 See David M. Cutler and Lawrence F. Katz, “Rising Inequality? Changes in the Distribution ofIncome and Consumption in the 1980s” (1992) vol. 82, no. 2 The American Economic Review546-51, at 548-49.
50 Krishna Pendakur, “Taking Prices Seriously in the Measurement of Inequality” (2002) vol. 86,no. 1 Journal of Public Economics 47-69.
51 Supra note 22.
52 Johan Fritzell, “Income Inequality Trends in the 1980s: A Five-Country Comparison” (1993)vol. 36, no. 1 Acta Sociologica 47-62.
53 Wagstaff et al., supra note 27.
54 Aronson et al., supra note 27, found that these parameter values minimized the measure ofhorizontal inequity for the United Kingdom’s PIT.
55 See, for example, Anthony Atkinson, Lee Rainwater, and Timothy Smeeding, Income Distributionin OECD Countries: Evidence from the Luxembourg Income Study, Social Policy Studies no. 18 (Paris:Organisation for Economic Co-operation and Development, 1995) and the US CongressionalBudget Office, supra note 48, at 24. On occasion this has been called the OECD method.
tax incidence, progressivity, and inequality in canada ■ 735
“at this time, complete sets of equivalence scales are not available”56 and thus simplyuses household income. Taking the household as the unit of observation withoutequivalizing is also common in FINC studies.57 This creates some confounding oflarger households with higher incomes—since FINC studies present their results asATRs in relation to household income levels—and a less accurate measure of thewell-being of individuals. An exception is a FINC study by Ruggeri et al.,58 whichuses the scales of Statistics Canada’s low-income measure (1.0 for the first member,0.4 for the second, and 0.3 per additional member). Fullerton and Rogers59 under-take a CGE study that ignores children per se and assigns half of the parents’combined income to each without any accounting for scale economies.
Income Measure: Pre-Fisc, Broad Income, or Post-FiscTo assess the distributional impact of taxes, a measure of individual well-being isneeded. This measure is required both for ranking individuals and for expressing agroup’s tax burden relative to its economic resources. An ideal measure could bebased on lifetime levels of utility, but problems of measurement restrict mostanalyses to annual data and some form of income. The definition of income can benarrower or broader, ref lecting either less or more of the impacts of public poli-cies. The principal choices for the income measure are as follows:
■ actual market income including (often) imputations for in-kind forms such asemployee fringe benefits and owner-occupied housing;
■ money income including transfer payments along with actual market income;■ “pre-fisc income” based on what market income (plus any imputations) would
be in the absence of taxes and public expenditures; this measure adds back thetaxes that are assumed to be borne by lower gross payments to capital andlabour;
■ “broad income,” which is “pre-fisc income” plus public transfer payments andcash-like subsidies (such as food stamps or rent subsidies) but not the benefitsfrom publicly supplied goods and services;
■ after-tax or disposable income, which subtracts taxes from broad income andhence includes cash transfers but not the benefits from other public spend-ing; and
56 Supra note 23, at 480.
57 However, the US Congressional Budget Office undertakes FINC estimates of ATRs usingequivalized incomes for ranking of households by percentile groups; but it presents its resultsbased on total household incomes unadjusted by household size (supra note 48, at 24, 30, and 36).
58 See Ruggeri et al., supra note 31 and G.C. Ruggeri, R. Howard, and D. Van Wart, TheGovernment as Robin Hood: Exploring the Myth (Kingston, ON and Ottawa: Queen’s University,School of Policy Studies, and the Caledon Institute of Social Policy, 1996).
59 Supra note 6.
736 ■ canadian tax journal / revue fiscale canadienne (2004) vol. 52, no 3
■ “post-fisc income,” which reflects the addition of benefits from publicly sup-plied goods and services as well as transfers and nets out the taxes borne, toobtain a measure of material well-being after all government fiscal actions.
Broad income has often been used in FINC studies that examine only tax inci-dence, whereas studies that also examine the incidence of public expenditurestypically employ the post-fisc income measure. In order to implement the post-fiscincome measure, one has to allocate the benefits of publicly supplied goods andservices across the population. This exercise is subject to arbitrary choices—whetherthe benefits of a particular program should be allocated on a per-head basis,proportionate to income, or in some other manner—giving much uncertainty tothe resulting income figures. A study that examines only tax incidence can sidestepthese complexities and uncertainties by considering pre-fisc income or broad in-come. However, these measures omit the benefits of certain public outlays, andbroad income is sensitive to policy shifts between delivering a particular benefit viacash transfers and in-kind services. For that reason, some analysts argue that onlypre-fisc or post-fisc income offers a consistent measure of fiscal incidence.60 Inresponse, proponents of the broad-income measure argue that it avoids the vagar-ies of allocating non-cash public expenditures and that it also accords more closelywith measuring taxes as a proportion of the income that individuals directly con-trol—namely, their market plus transfer receipts.61 Regardless of which measure ischosen, comparisons of results from different studies need to recognize that a post-fisc income base will make taxes look more progressive (or less regressive) than abroad-income base, since the former adds equalizing program benefits to incomes.The use of pre-fisc income will make taxes appear most regressive for low-incomehouseholds, since it excludes the cash transfers that make up a large part of theirtotal resources.
CGE studies can most closely approximate a lifetime utility measure, because theyare based on dynamic CGE models that include individual utility functions. INEQstudies of tax incidence typically compare the distribution of disposable incomewith that of broad income. Because most such studies consider only the PIT andassume that its full incidence falls on the individual, they do not need to use a pre-fisc adjustment to find what market incomes would have been in the absence of thetax. One INEQ study that includes payroll taxes does make such an adjustment byadding the employer’s portion of the tax to market incomes, which then enters broadincome.62 This adjustment reflects the assumption that workers bear the full economic
60 Ruggeri et al., supra note 31, at 422; and W. Irwin Gillespie, The Incidence of Taxes and PublicExpenditures in the Canadian Economy, Studies of the Royal Commission on Taxation no. 2(Ottawa: Queen’s Printer, 1966), 6-11.
61 Frank Vermaeten, W. Irwin Gillespie, and Arndt Vermaeten, “Tax Incidence in Canada” (1994)vol. 42, no. 2 Canadian Tax Journal 348-416, at 353-54.
62 See Jäntti, supra note 22.
tax incidence, progressivity, and inequality in canada ■ 737
incidence of the employer’s share of payroll taxes, so that their gross compensationwould be that much higher in the absence of the tax. Otherwise, INEQ studiesgenerally are not concerned with adjustments for the benefits of non-transfer publicexpenditures. One study found that adding the benefits of public spending for healthcare and education reduced income inequality in 1979-81 for most countries, espe-cially so in West Germany and Canada, but was slightly favourable for upper earnersin Sweden.63 If a tax incidence study were to be performed using this broadermeasure of income, it likely would find less redistributive effects of taxes since thepre-tax income distribution would already be more equalized.
Period of Observation: Annual or LifetimeAlmost all income and tax data for studying distributional issues are available on anannual basis, and most personal tax systems use an annual accounting period forapplying their progressive rates (though some countries have provisions to allowfor cross-year tax averaging). Nevertheless, it is an open question whether the yearor a longer period, such as the individual’s lifetime, is preferable for measuringinequality and the distributional pattern of taxes.64 Advocates of the lifetime per-spective cite the fact that annual income is highly variable, both year to year andover the various stages of life, whereas annual consumption has a much smootherpattern both across years and over the lifetime. From these observations they inferthat consumption levels are a better index of well-being of the individual and thatlifetime-discounted income is superior to annual income. Moreover, they refer tothe permanent income and life-cycle income theories as demonstrating how transi-tory deviations from the individual’s average income will provide exaggeratedmeasures of the regressivity or progressivity of various taxes when measured annu-ally. It has been estimated that lifetime labour endowments display about one-thirdto one-half less inequality than annual labour endowments.65 The lifetime perspec-tive has been used in a couple of FINC studies by simulating lifetime incomes,ranking individuals by their lifetime incomes, and assessing lifetime taxes on thatbasis. Most recent CGE studies are constructed to answer questions about the lifetime
63 Timothy M. Smeeding, Peter Saunders, John Coder, Stephen Jenkins, John Fritzell, Aldi J.M.Hagenaars, Richard Hauser, and Michael Wolfson, “Poverty, Inequality, and Family LivingStandards Impacts Across Seven Nations: The Effect of Noncash Subsidies for Health,Education and Housing” (1993) vol. 39, no. 3 The Review of Income and Wealth 229-56.
64 For proponents of the lifetime view, see James B. Davies, France St-Hilaire, and John Whalley,“Some Calculations of Lifetime Tax Incidence” (1984) vol. 74, no. 4 The American EconomicReview 633-49, and Fullerton and Rogers, supra note 6, at 17-21; for proponents of the annualview, see Richard Goode, “The Superiority of the Income Tax,” in Joseph A. Pechman, ed.,What Should Be Taxed: Income or Expenditure? (Washington, DC: Brookings Institution, 1980),49-73, and Vermaeten et al., supra note 61, at 355.
65 Jacob Mincer, Schooling, Experience and Earnings (New York: Columbia University Press, 1974),119; and Nils S. Blomquist, “A Comparison of Distributions of Annual and Lifetime Income:Sweden Around 1970” (1981) vol. 27, no. 3 The Review of Income and Wealth 243-64, at 255.
738 ■ canadian tax journal / revue fiscale canadienne (2004) vol. 52, no 3
incidence of taxes, both in the transition following tax rate changes or reforms andin the economy’s steady-state outcome.
Advocates of the annual perspective argue that the need to simulate lifetimeincome series leads to much uncertainty. They query the strong assumption ofready borrowing and lending at a common interest rate required in lifetime models.And they assert that both individual taxpayers and policy makers are most inter-ested in the pattern of taxes over a much shorter period than a lifetime. They furthercite the frequency of changes in tax policies as a reason to focus on annual inci-dence. All INEQ studies and the great majority of FINC studies take an annualperspective for observing incomes and the associated tax burdens. The use of anannual period for assessing the effects of transfers and taxes on inequality, or theprogressivity of transfers or taxes, combines two kinds of redistribution. Since asubstantial part of transfers and public spending is aimed at smoothing year-to-year income variability (unemployment insurance, social assistance, and workers’compensation) or smoothing incomes over different life stages (public pensionplans, educational subsidies, and public health care), it is engaging in horizontalredistribution; the same individuals are receiving benefits in some years and payingfor them through taxes in other years. Much of the high ATRs of “progressive”personal taxes for individuals with unusually high income in a given year or thehigh ATRs of “regressive” sales taxes for individuals with unusually low income in agiven year would be smoothed away if they were observed over more years. Amulti-year or lifetime perspective can much better distinguish the vertical compo-nent of redistribution.
Range of Tax Policies and Tax Incidence
Studies of distributional impact must draw a line between tax policy and transferpolicy. In many countries, the tax system is used to deliver transfer-like programs,often via refundable tax credits.66 Canada has been a leader in this area, first withrefundable child tax credits in 1978, sales tax credits in the 1980s, and goods andservices tax (GST) credits and the child tax benefit in the 1990s. The latter was thenexpanded into the national child benefit with a supplementary payment for lower-income families that replaced part of social assistance benefits. If such provisionsare counted as part of the tax system, this raises issues of cross-country comparabil-ity (since other countries may deliver their benefits through direct cash transfers)and of temporal comparability for a given country (such as when Canada convertedfamily allowance cash benefits into the tax-based child tax benefit in 1993). Yet, whena refundable tax credit is used to offset the burden of a particular tax on lower-income families, this might be regarded as an offset to that tax and therefore part
66 The tax system is commonly used for delivering transfers in both Canada and the UnitedStates, although the approaches differ; see Jonathan R. Kesselman, “Income Security Via theTax System: Canadian and American Reforms,” in John B. Shoven and John Whalley, eds.,Canada-U.S. Tax Comparisons (Chicago: University of Chicago Press, 1992), 97-150.
tax incidence, progressivity, and inequality in canada ■ 739
of the tax system. For example, Canada’s GST tax credit serves as an alternative tooffering more relief for necessities in the coverage of the GST itself. Moreover,many tax expenditure provisions are motivated by relief for those at lower incomesor in special circumstances, and thus they substitute for more explicit cash-transferprograms. Further issues arise when the PIT is used to claw back cash-transfer benefitsfrom higher-income earners; without any adjustment to the data, these clawbacksmake the personal tax appear more progressive over certain income ranges, whereasin other times or countries the income targeting is achieved within the benefitprogram. Careful choices must be made to ensure maximal comparability over timeor across countries, but an arbitrary element will inevitably remain.
This body of research varies widely with respect to the range of taxes consid-ered and the economic incidence assumed for each tax. INEQ studies consider onlythe difference between post-transfer, pre-tax incomes and post-transfer, post-taxincomes—or essentially the PIT and payroll taxes for social insurance. In practice,many of these studies ignore the payroll taxes and examine only the income tax.Thus, INEQ studies ignore the impact of a wide range of indirect, property, andbusiness taxes on both market incomes and on the real value of disposable incomes.Virtually all studies of the distributional impact of taxes, of all three types, assumethat the full burden of PITs falls on the individual taxpayer. If, in fact, the tax ispartially shifted forward into higher remuneration for the individual, then themeasure of distributional impact will be distorted. It is most likely that highlyskilled, mobile, well-paid workers (such as the professions, top management, andcreative and technical workers) are able to shift part of increased personal taxes totheir clients or employers. In that case, the reported pre-tax distribution will notaccurately measure the distribution of market incomes that would arise in theabsence of the personal tax; market incomes of higher earners would in fact belower without the tax shifting. Hence, this method may overstate the efficacy ofnominally progressive personal taxes in reducing inequality.
Studies of the CGE and FINC types consider a wider range of tax policies andsome alternatives for the incidence of each tax.67 CGE studies examine several stylizedforms of tax within a CGE model; these stylized taxes cover the great majority oftotal tax revenues but do omit a few of the smaller taxes. Incidence in this frame-work is generated by the structure and parameters chosen for the CGE model.Typically, the parameters are chosen so that the model generates equilibriumoutcomes that benchmark aggregate measures for the economy. Sensitivity analysiscan be undertaken to see how variations in parameter values and/or structuralfeatures affect the incidence of the taxes. FINC studies allow for the widest range oftax types and shifting patterns for the various taxes. In these studies the incidence
67 Shantayanan Devarajan, Don Fullerton, and Richard A. Musgrave, “Estimating the Distributionof Tax Burdens: A Comparison of Different Approaches” (1980) vol. 13, no. 2 Journal of PublicEconomics 155-82, compare earlier forms of studies of the CGE and FINC types and findpatterns of incidence that are generally similar but substantially different in magnitudes; theearly CGE studies assumed fixed supplies of capital and labour.
740 ■ canadian tax journal / revue fiscale canadienne (2004) vol. 52, no 3
of each tax type must be specified by the researcher, drawing on information fromboth theoretical and empirical studies. Alternative shifting assumptions are easilyintroduced to examine the effects on the distribution of the tax across income groupsas well as the incidence of the total tax system. In our later review of FINC studies,we critically examine the standard incidence assumptions used for the PIT as well asfor other taxes.
Primer on Tax and Expenditure Progressivity and Inequality
Both taxes and the public expenditures that they finance affect the inequality ofincomes or economic resources of individuals. In assessing the effects of taxes oninequality, it is essential to bear in mind the expenditure side of the equation.Public expenditures include both cash transfers and outlays for public goods andservices, each of which has its distinct distributional pattern. Note that most studiesof inequality, including almost all of the INEQ type, count the impacts of cash transfersbut completely neglect the distribution of benefits from in-kind benefits and gen-eral public services. For a given level and composition of public expenditures, and agiven total of tax revenues, the mix and structure of taxes will affect the inequalityof after-tax incomes. Shifting the tax system toward greater progressivity will, bymost measures, reduce the inequality of after-tax incomes. Moving the tax systemto lesser progressivity or to regressivity, conversely, will increase the inequality ofafter-tax incomes. Changes in the tax system that increase progressivity (or reduceregressivity) in some income ranges while lowering progressivity (or raising regres-sivity) for other incomes will have a net impact on inequality that depends on theindex employed (and the inequality aversion parameter).
Many issues of public policy involve raising (or lowering) the scale of publicspending along with total tax revenues; this perspective is also relevant when makingcomparisons across countries with differing relative sizes of their public sectors.Then the net impact on inequality will hinge upon the progressivity of taxes (Pt)relative to the progressivity of expenditures (Pe).68 We later show that cash transfersare highly progressive in Canada; they decline sharply as a percentage of moneyincome as one moves up the income quintiles. The progressivity of total publicexpenditures—including in-kind benefits and general public outlays as well as cashtransfers—has been addressed in several studies.69 The benefits of non-cash pro-grams can be distributed in various ways; the choices range from lump sums per
68 The present discussion addresses the general conceptual issue and not exact definitions ofprogressivity; assume simply that progressivity for both taxes and expenditures is measuredwith respect to the same money income base. Moreover, we apply the term “progressive” toexpenditures that decline as a proportion of income with higher incomes; some studies havecalled this pattern “regressive” for parallelism with the term’s use for taxes (for example,Dahlby, supra note 3, at 116; and Lambert, supra note 15, at 269).
69 For example, see David A. Dodge, “Impact of Tax, Transfer, and Expenditure Policies ofGovernment on the Distribution of Personal Income in Canada” (1975) vol. 21, no. 1 TheReview of Income and Wealth 1-52; W. Irwin Gillespie, The Redistribution of Income in Canada
tax incidence, progressivity, and inequality in canada ■ 741
head to proportionate with income to rising as a percentage of income. Clearly, thetype of program will affect its distributional pattern, with the benefits of healthcare being closer to per capita sums (and thus highly progressive) and those ofpublic opera houses rising more than proportionately with incomes. Since cashtransfers include some income-targeted programs, they are more progressive thanoverall public spending, but total public spending is still found to be significantlyprogressive.
For purposes of illustration, let us first assume that the entire tax system isstrictly proportional. In itself, a proportional tax system will not affect the level ofinequality nor will changes in the proportional rate of tax, so long as the extrarevenues are disregarded. But raising overall taxes will finance larger public out-lays, and with Pe > Pt, this will reduce measured inequality. By extension, even if thetax system is regressive, raising more taxes and spending them in a progressive waycan also reduce economic inequality, so long as the progressive effects of spendingoutweigh the regressive effects of the taxes.70 This inequality-reducing effect oflarger government will be even stronger if the tax system is proportional or pro-gressive, but progressivity of taxes is not required. Hence, the size of governmentmay be even more important to reducing inequality than the progressivity of taxesper se. Of course, the progressivity of public expenditures also affects the degree ofinequality mitigation. According to Ruggeri et al., almost all Canadian studiesprior to 1994
found that the redistribution of income generated by the fiscal system results largelyfrom the progressive (pro-poor) distribution of government transfers to persons.Taxation was found to be roughly proportional or mildly regressive and governmentspending on social goods was found to be mildly progressive.71
I N E Q S T U D I E S O F T A X E S
The inequality impacts of PITs have been studied as an offshoot of research thatmeasures trends in inequality for a given country over time and differences ininequality across countries. The basic methodology of INEQ studies is simple—take the difference between the pre-tax and post-tax measures of inequality (usu-ally the Gini). Typically the only tax considered is the PIT, although social securitytaxes are occasionally included as well. As noted above, the income tax is assumed
(Ottawa and Agincourt, ON: Carleton University, Institute of Canadian Studies and GagePublishing, 1980); and Ruggeri et al., The Government as Robin Hood, supra note 58.
70 Exactly this outcome was reported in a study of Quebec for 1981. Taxes were found to beregressive, while transfers and government spending on goods and services were progressive,yielding a slightly progressive net outcome. See Micheline Payette and François Vaillancourt,“L’incidence des recettes et dépenses gouvernementales au Québec en 1981” (1986) vol. 62, no. 3L’Actualité Économique 409-41.
71 Ruggeri et al., The Government as Robin Hood, supra note 58, at 9.
742 ■ canadian tax journal / revue fiscale canadienne (2004) vol. 52, no 3
to be borne fully by the taxpayer, which likely overstates the efficacy of the tax inreducing inequality. Moreover, in ignoring all other taxes, INEQ studies focus onthe most redistributive element of the tax system and neglect other major taxes thatare much less progressive and often regressive. Consequently, they provide a mis-leading view if one is interested in the equalizing effects of the tax system as awhole. Two studies of this type have gone a step further by exploring componentsof the personal tax structure that contribute to the equalization of incomes.
Taxes, Transfers, and the Pattern of Inequality in Canada
To set the stage for the redistributive effects of PITs, it is useful to compare theirmagnitude with those of cash transfers for various income groups.72 Table 3 presents,by income quintile (separately for unattached persons, families, and all units), byfive-year periods from 1971 through 2000, the proportion of total money incomesreceived from cash transfers and paid in PITs. Transfer-like programs that are deliv-ered through the personal tax system (provincial tax credits, the child tax benefit,and GST credits) have been classified as transfer receipts rather than offsets againstincome taxes. Several points emerge clearly from the table. First, over the periodcovered, there have been continual upward trends in the total percentages of moneyincome received from transfers (except for the latest five years; and resulting fromthe rising share of seniors in the population) and paid in income taxes (except aplateau for the top two quintiles in the latest five years), and these trends appearacross all quintiles and household types. Second, the transfer receipts percentagehas increased much more for quintiles 1 through 3 than for quintile 5, while theaverage income tax rate has increased much more for quintiles 4 and 5 than forquintiles 1 and 2 (except in the latest five years).73 Hence, the redistributive tilt ofboth cash transfers and personal taxes has increased over the period. Third, trans-fer programs exert a proportionately much larger impact in raising the moneyincomes of the lowest two quintiles than PIT in reducing the net incomes of the toptwo quintiles.74 Fourth, the PIT is strongly progressive for all household types andtime periods.
Using the same data, Statistics Canada has computed annual Gini coefficientsfrom 1971 through 2000 for income before transfers, total money income, and
72 For a somewhat similar analysis for the period 1971-1992, see Charles M. Beach and GeorgeA. Slotsve, Are We Becoming Two Societies? Income Polarization and the Myth of the Declining MiddleClass in Canada, The Social Policy Challenge no. 12 (Toronto: C.D. Howe Institute, 1996), 98-108.
73 The notable jump in the latest five years in the average income tax rate faced by the bottomquintile is likely the result of both rising nominal incomes and an income tax system withdeficient indexation.
74 Somewhat curiously, for unattached individuals, in most periods transfers play an even largerrole in money incomes of the second quintile than the first quintile. This may be a result of thegrowing numbers of retirees whose transfers plus pensions place them above the lowest quintile.Further disaggregation of the data by age would be useful.

tax incidence, progressivity, and inequality in canada ■ 743
income after tax.75 Hence, one can observe the patterns of inequality over time,both pre-tax, pre-transfer and post-tax, post-transfer, as well as the separate effectson inequality of the cash transfers and the income taxes. One must keep in mindthat this analysis completely omits all other types of taxes (which on balance areregressive in an annual view) but also neglects in-kind transfer programs, such aspublic provision of health care and education (which are progressive in the sensethat they raise real incomes by larger proportions for those at lower than higherincomes). Table 4 presents the resulting measures of inequality for unattachedindividuals, families, and all households, for five-year intervals. Taking market in-comes (or income before transfers), one can see that inequality as measured by the
TABLE 3 Transfers and Income Taxes as a Percentage of MoneyIncome, Canada, 1971-2000a
Transfer receipts per quintile
Family type and time period 1 2 3 4 5 Total
Unattached1971-75 . . . . . . . . . . . . . . . . . . 58.1 66.0 17.9 5.0 1.6 12.31976-80 . . . . . . . . . . . . . . . . . . 66.8 61.4 18.4 6.1 1.6 13.31981-85 . . . . . . . . . . . . . . . . . . 61.9 64.5 23.8 7.2 2.2 15.71986-90 . . . . . . . . . . . . . . . . . . 59.5 63.6 24.5 8.4 2.9 16.91991-95 . . . . . . . . . . . . . . . . . . 61.9 70.2 34.2 12.4 3.5 20.51996-2000 . . . . . . . . . . . . . . . . 58.3 65.1 32.9 12.3 3.6 19.3
Families1971-75 . . . . . . . . . . . . . . . . . . 43.8 11.6 6.0 4.1 2.5 7.21976-80 . . . . . . . . . . . . . . . . . . 47.6 13.4 6.9 4.4 2.7 8.01981-85 . . . . . . . . . . . . . . . . . . 52.1 18.9 9.3 5.5 2.8 9.81986-90 . . . . . . . . . . . . . . . . . . 53.2 20.0 9.6 5.7 2.8 10.11991-95 . . . . . . . . . . . . . . . . . . 60.0 26.7 13.0 7.1 3.4 12.41996-2000 . . . . . . . . . . . . . . . . 53.6 23.9 11.6 6.2 3.0 10.9
All units1971-75 . . . . . . . . . . . . . . . . . . 55.9 20.0 7.3 4.5 2.7 7.91976-80 . . . . . . . . . . . . . . . . . . 57.9 22.5 8.6 5.1 2.8 8.71981-85 . . . . . . . . . . . . . . . . . . 59.6 28.8 11.7 6.4 3.1 10.71986-90 . . . . . . . . . . . . . . . . . . 59.2 30.4 12.8 6.8 3.2 11.21991-95 . . . . . . . . . . . . . . . . . . 65.5 38.7 17.1 9.0 3.9 13.81996-2000 . . . . . . . . . . . . . . . . 61.4 34.3 16.1 8.1 3.5 12.3
(Table 3 is concluded on the next page.)
75 Marc Frechette, David Green, and Garnett Picot, “Rising Income Inequality Amid the EconomicRecovery of the 1990s” (mimeograph, Statistics Canada and the University of British ColumbiaDepartment of Economics, 2003) report that the surveys that underlie these Gini coefficients(Statistics Canada’s Survey of Consumer Finances to 1996 and thereafter the Survey of Labour andIncome Dynamics) may understate levels and trends in inequality. They base this view oncomparative analysis with more comprehensive tax-based and census data sets and suggest thatthe survey coverage may be missing growing numbers of the lowest income households.
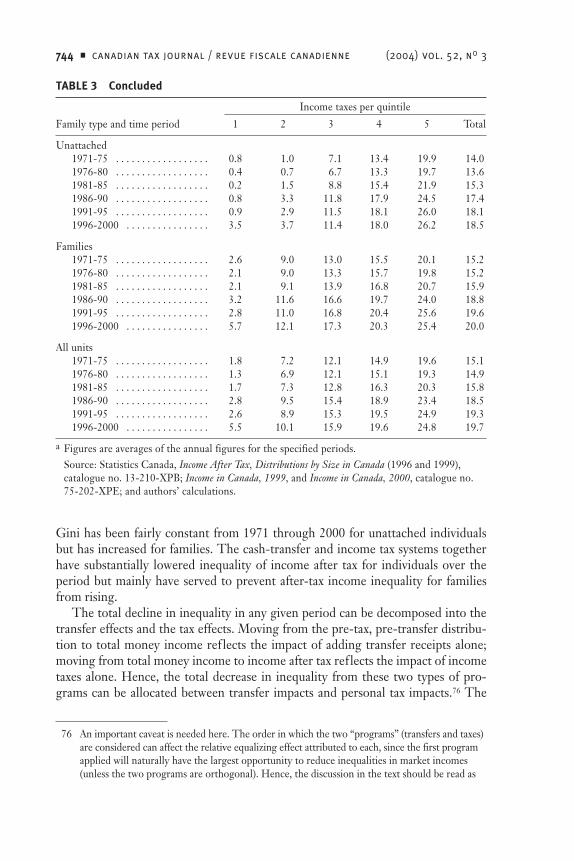
744 ■ canadian tax journal / revue fiscale canadienne (2004) vol. 52, no 3
Gini has been fairly constant from 1971 through 2000 for unattached individualsbut has increased for families. The cash-transfer and income tax systems togetherhave substantially lowered inequality of income after tax for individuals over theperiod but mainly have served to prevent after-tax income inequality for familiesfrom rising.
The total decline in inequality in any given period can be decomposed into thetransfer effects and the tax effects. Moving from the pre-tax, pre-transfer distribu-tion to total money income ref lects the impact of adding transfer receipts alone;moving from total money income to income after tax ref lects the impact of incometaxes alone. Hence, the total decrease in inequality from these two types of pro-grams can be allocated between transfer impacts and personal tax impacts.76 The
Income taxes per quintile
Family type and time period 1 2 3 4 5 Total
Unattached1971-75 . . . . . . . . . . . . . . . . . . 0.8 1.0 7.1 13.4 19.9 14.01976-80 . . . . . . . . . . . . . . . . . . 0.4 0.7 6.7 13.3 19.7 13.61981-85 . . . . . . . . . . . . . . . . . . 0.2 1.5 8.8 15.4 21.9 15.31986-90 . . . . . . . . . . . . . . . . . . 0.8 3.3 11.8 17.9 24.5 17.41991-95 . . . . . . . . . . . . . . . . . . 0.9 2.9 11.5 18.1 26.0 18.11996-2000 . . . . . . . . . . . . . . . . 3.5 3.7 11.4 18.0 26.2 18.5
Families1971-75 . . . . . . . . . . . . . . . . . . 2.6 9.0 13.0 15.5 20.1 15.21976-80 . . . . . . . . . . . . . . . . . . 2.1 9.0 13.3 15.7 19.8 15.21981-85 . . . . . . . . . . . . . . . . . . 2.1 9.1 13.9 16.8 20.7 15.91986-90 . . . . . . . . . . . . . . . . . . 3.2 11.6 16.6 19.7 24.0 18.81991-95 . . . . . . . . . . . . . . . . . . 2.8 11.0 16.8 20.4 25.6 19.61996-2000 . . . . . . . . . . . . . . . . 5.7 12.1 17.3 20.3 25.4 20.0
All units1971-75 . . . . . . . . . . . . . . . . . . 1.8 7.2 12.1 14.9 19.6 15.11976-80 . . . . . . . . . . . . . . . . . . 1.3 6.9 12.1 15.1 19.3 14.91981-85 . . . . . . . . . . . . . . . . . . 1.7 7.3 12.8 16.3 20.3 15.81986-90 . . . . . . . . . . . . . . . . . . 2.8 9.5 15.4 18.9 23.4 18.51991-95 . . . . . . . . . . . . . . . . . . 2.6 8.9 15.3 19.5 24.9 19.31996-2000 . . . . . . . . . . . . . . . . 5.5 10.1 15.9 19.6 24.8 19.7
a Figures are averages of the annual figures for the specified periods.Source: Statistics Canada, Income After Tax, Distributions by Size in Canada (1996 and 1999),catalogue no. 13-210-XPB; Income in Canada, 1999, and Income in Canada, 2000, catalogue no.75-202-XPE; and authors’ calculations.
TABLE 3 Concluded
76 An important caveat is needed here. The order in which the two “programs” (transfers and taxes)are considered can affect the relative equalizing effect attributed to each, since the first programapplied will naturally have the largest opportunity to reduce inequalities in market incomes(unless the two programs are orthogonal). Hence, the discussion in the text should be read as
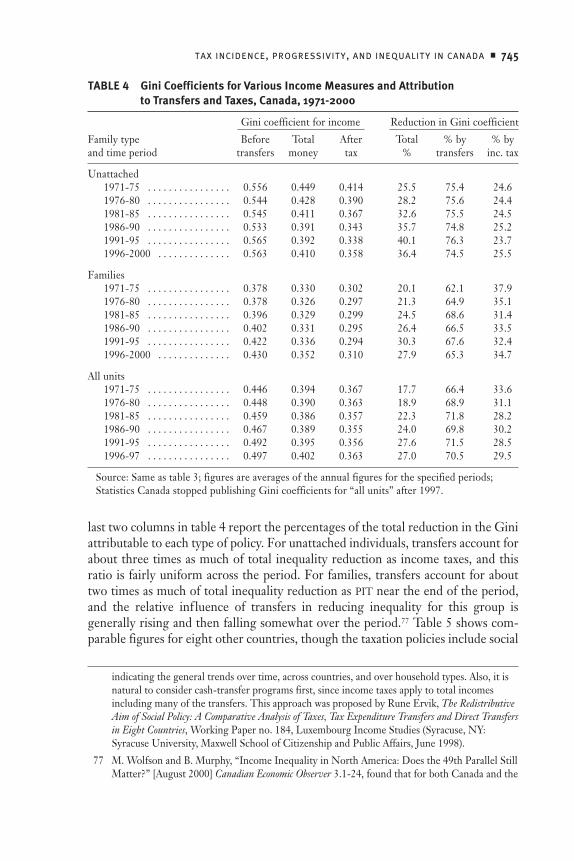
tax incidence, progressivity, and inequality in canada ■ 745
last two columns in table 4 report the percentages of the total reduction in the Giniattributable to each type of policy. For unattached individuals, transfers account forabout three times as much of total inequality reduction as income taxes, and thisratio is fairly uniform across the period. For families, transfers account for abouttwo times as much of total inequality reduction as PIT near the end of the period,and the relative inf luence of transfers in reducing inequality for this group isgenerally rising and then falling somewhat over the period.77 Table 5 shows com-parable figures for eight other countries, though the taxation policies include social
TABLE 4 Gini Coefficients for Various Income Measures and Attributionto Transfers and Taxes, Canada, 1971-2000
Gini coefficient for income Reduction in Gini coefficient
Family type Before Total After Total % by % byand time period transfers money tax % transfers inc. tax
Unattached1971-75 . . . . . . . . . . . . . . . . 0.556 0.449 0.414 25.5 75.4 24.61976-80 . . . . . . . . . . . . . . . . 0.544 0.428 0.390 28.2 75.6 24.41981-85 . . . . . . . . . . . . . . . . 0.545 0.411 0.367 32.6 75.5 24.51986-90 . . . . . . . . . . . . . . . . 0.533 0.391 0.343 35.7 74.8 25.21991-95 . . . . . . . . . . . . . . . . 0.565 0.392 0.338 40.1 76.3 23.71996-2000 . . . . . . . . . . . . . . 0.563 0.410 0.358 36.4 74.5 25.5
Families1971-75 . . . . . . . . . . . . . . . . 0.378 0.330 0.302 20.1 62.1 37.91976-80 . . . . . . . . . . . . . . . . 0.378 0.326 0.297 21.3 64.9 35.11981-85 . . . . . . . . . . . . . . . . 0.396 0.329 0.299 24.5 68.6 31.41986-90 . . . . . . . . . . . . . . . . 0.402 0.331 0.295 26.4 66.5 33.51991-95 . . . . . . . . . . . . . . . . 0.422 0.336 0.294 30.3 67.6 32.41996-2000 . . . . . . . . . . . . . . 0.430 0.352 0.310 27.9 65.3 34.7
All units1971-75 . . . . . . . . . . . . . . . . 0.446 0.394 0.367 17.7 66.4 33.61976-80 . . . . . . . . . . . . . . . . 0.448 0.390 0.363 18.9 68.9 31.11981-85 . . . . . . . . . . . . . . . . 0.459 0.386 0.357 22.3 71.8 28.21986-90 . . . . . . . . . . . . . . . . 0.467 0.389 0.355 24.0 69.8 30.21991-95 . . . . . . . . . . . . . . . . 0.492 0.395 0.356 27.6 71.5 28.51996-97 . . . . . . . . . . . . . . . . 0.497 0.402 0.363 27.0 70.5 29.5
Source: Same as table 3; figures are averages of the annual figures for the specified periods;Statistics Canada stopped publishing Gini coefficients for “all units” after 1997.
indicating the general trends over time, across countries, and over household types. Also, it isnatural to consider cash-transfer programs first, since income taxes apply to total incomesincluding many of the transfers. This approach was proposed by Rune Ervik, The RedistributiveAim of Social Policy: A Comparative Analysis of Taxes, Tax Expenditure Transfers and Direct Transfersin Eight Countries, Working Paper no. 184, Luxembourg Income Studies (Syracuse, NY:Syracuse University, Maxwell School of Citizenship and Public Affairs, June 1998).
77 M. Wolfson and B. Murphy, “Income Inequality in North America: Does the 49th Parallel StillMatter?” [August 2000] Canadian Economic Observer 3.1-24, found that for both Canada and the
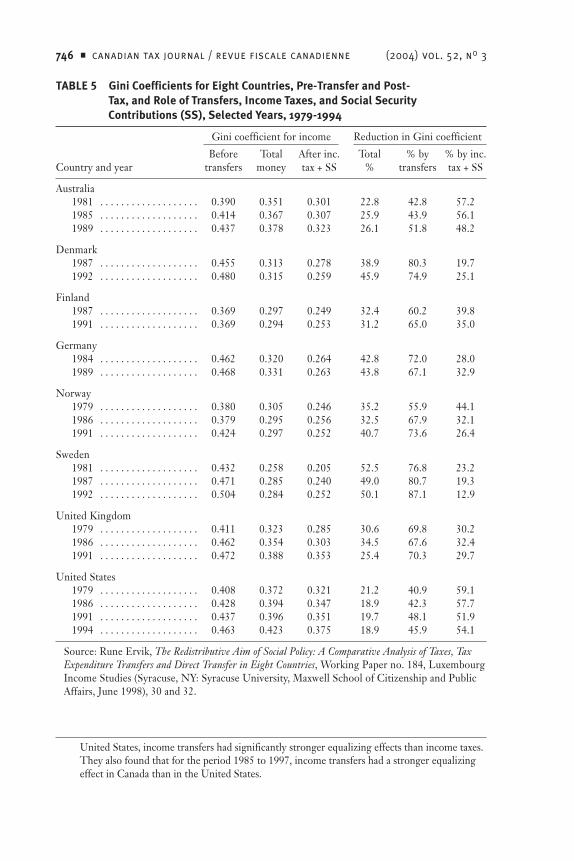
746 ■ canadian tax journal / revue fiscale canadienne (2004) vol. 52, no 3
TABLE 5 Gini Coefficients for Eight Countries, Pre-Transfer and Post-Tax, and Role of Transfers, Income Taxes, and Social SecurityContributions (SS), Selected Years, 1979-1994
Gini coefficient for income Reduction in Gini coefficient
Before Total After inc. Total % by % by inc.Country and year transfers money tax + SS % transfers tax + SS
Australia1981 . . . . . . . . . . . . . . . . . . . 0.390 0.351 0.301 22.8 42.8 57.21985 . . . . . . . . . . . . . . . . . . . 0.414 0.367 0.307 25.9 43.9 56.11989 . . . . . . . . . . . . . . . . . . . 0.437 0.378 0.323 26.1 51.8 48.2
Denmark1987 . . . . . . . . . . . . . . . . . . . 0.455 0.313 0.278 38.9 80.3 19.71992 . . . . . . . . . . . . . . . . . . . 0.480 0.315 0.259 45.9 74.9 25.1
Finland1987 . . . . . . . . . . . . . . . . . . . 0.369 0.297 0.249 32.4 60.2 39.81991 . . . . . . . . . . . . . . . . . . . 0.369 0.294 0.253 31.2 65.0 35.0
Germany1984 . . . . . . . . . . . . . . . . . . . 0.462 0.320 0.264 42.8 72.0 28.01989 . . . . . . . . . . . . . . . . . . . 0.468 0.331 0.263 43.8 67.1 32.9
Norway1979 . . . . . . . . . . . . . . . . . . . 0.380 0.305 0.246 35.2 55.9 44.11986 . . . . . . . . . . . . . . . . . . . 0.379 0.295 0.256 32.5 67.9 32.11991 . . . . . . . . . . . . . . . . . . . 0.424 0.297 0.252 40.7 73.6 26.4
Sweden1981 . . . . . . . . . . . . . . . . . . . 0.432 0.258 0.205 52.5 76.8 23.21987 . . . . . . . . . . . . . . . . . . . 0.471 0.285 0.240 49.0 80.7 19.31992 . . . . . . . . . . . . . . . . . . . 0.504 0.284 0.252 50.1 87.1 12.9
United Kingdom1979 . . . . . . . . . . . . . . . . . . . 0.411 0.323 0.285 30.6 69.8 30.21986 . . . . . . . . . . . . . . . . . . . 0.462 0.354 0.303 34.5 67.6 32.41991 . . . . . . . . . . . . . . . . . . . 0.472 0.388 0.353 25.4 70.3 29.7
United States1979 . . . . . . . . . . . . . . . . . . . 0.408 0.372 0.321 21.2 40.9 59.11986 . . . . . . . . . . . . . . . . . . . 0.428 0.394 0.347 18.9 42.3 57.71991 . . . . . . . . . . . . . . . . . . . 0.437 0.396 0.351 19.7 48.1 51.91994 . . . . . . . . . . . . . . . . . . . 0.463 0.423 0.375 18.9 45.9 54.1
Source: Rune Ervik, The Redistributive Aim of Social Policy: A Comparative Analysis of Taxes, TaxExpenditure Transfers and Direct Transfer in Eight Countries, Working Paper no. 184, LuxembourgIncome Studies (Syracuse, NY: Syracuse University, Maxwell School of Citizenship and PublicAffairs, June 1998), 30 and 32.
United States, income transfers had significantly stronger equalizing effects than income taxes.They also found that for the period 1985 to 1997, income transfers had a stronger equalizingeffect in Canada than in the United States.
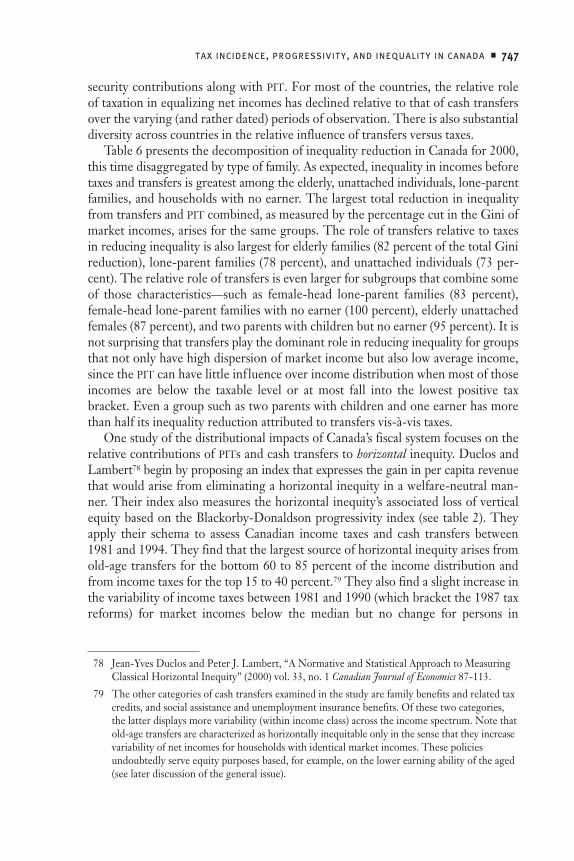
tax incidence, progressivity, and inequality in canada ■ 747
security contributions along with PIT. For most of the countries, the relative roleof taxation in equalizing net incomes has declined relative to that of cash transfersover the varying (and rather dated) periods of observation. There is also substantialdiversity across countries in the relative influence of transfers versus taxes.
Table 6 presents the decomposition of inequality reduction in Canada for 2000,this time disaggregated by type of family. As expected, inequality in incomes beforetaxes and transfers is greatest among the elderly, unattached individuals, lone-parentfamilies, and households with no earner. The largest total reduction in inequalityfrom transfers and PIT combined, as measured by the percentage cut in the Gini ofmarket incomes, arises for the same groups. The role of transfers relative to taxesin reducing inequality is also largest for elderly families (82 percent of the total Ginireduction), lone-parent families (78 percent), and unattached individuals (73 per-cent). The relative role of transfers is even larger for subgroups that combine someof those characteristics—such as female-head lone-parent families (83 percent),female-head lone-parent families with no earner (100 percent), elderly unattachedfemales (87 percent), and two parents with children but no earner (95 percent). It isnot surprising that transfers play the dominant role in reducing inequality for groupsthat not only have high dispersion of market income but also low average income,since the PIT can have little inf luence over income distribution when most of thoseincomes are below the taxable level or at most fall into the lowest positive taxbracket. Even a group such as two parents with children and one earner has morethan half its inequality reduction attributed to transfers vis-à-vis taxes.
One study of the distributional impacts of Canada’s fiscal system focuses on therelative contributions of PITs and cash transfers to horizontal inequity. Duclos andLambert78 begin by proposing an index that expresses the gain in per capita revenuethat would arise from eliminating a horizontal inequity in a welfare-neutral man-ner. Their index also measures the horizontal inequity’s associated loss of verticalequity based on the Blackorby-Donaldson progressivity index (see table 2). Theyapply their schema to assess Canadian income taxes and cash transfers between1981 and 1994. They find that the largest source of horizontal inequity arises fromold-age transfers for the bottom 60 to 85 percent of the income distribution andfrom income taxes for the top 15 to 40 percent.79 They also find a slight increase inthe variability of income taxes between 1981 and 1990 (which bracket the 1987 taxreforms) for market incomes below the median but no change for persons in
78 Jean-Yves Duclos and Peter J. Lambert, “A Normative and Statistical Approach to MeasuringClassical Horizontal Inequity” (2000) vol. 33, no. 1 Canadian Journal of Economics 87-113.
79 The other categories of cash transfers examined in the study are family benefits and related taxcredits, and social assistance and unemployment insurance benefits. Of these two categories,the latter displays more variability (within income class) across the income spectrum. Note thatold-age transfers are characterized as horizontally inequitable only in the sense that they increasevariability of net incomes for households with identical market incomes. These policiesundoubtedly serve equity purposes based, for example, on the lower earning ability of the aged(see later discussion of the general issue).
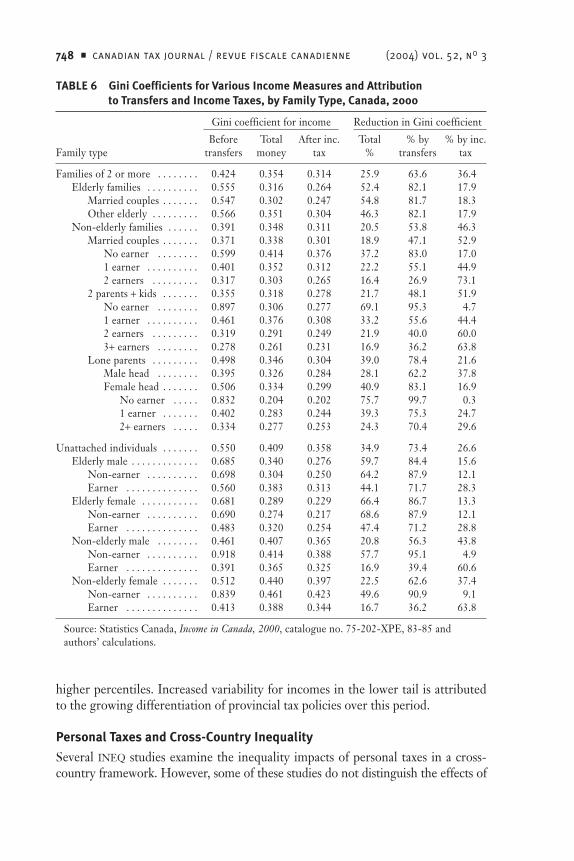
748 ■ canadian tax journal / revue fiscale canadienne (2004) vol. 52, no 3
higher percentiles. Increased variability for incomes in the lower tail is attributedto the growing differentiation of provincial tax policies over this period.
Personal Taxes and Cross-Country Inequality
Several INEQ studies examine the inequality impacts of personal taxes in a cross-country framework. However, some of these studies do not distinguish the effects of
TABLE 6 Gini Coefficients for Various Income Measures and Attributionto Transfers and Income Taxes, by Family Type, Canada, 2000
Gini coefficient for income Reduction in Gini coefficient
Before Total After inc. Total % by % by inc.Family type transfers money tax % transfers tax
Families of 2 or more . . . . . . . . 0.424 0.354 0.314 25.9 63.6 36.4Elderly families . . . . . . . . . . 0.555 0.316 0.264 52.4 82.1 17.9
Married couples . . . . . . . 0.547 0.302 0.247 54.8 81.7 18.3Other elderly . . . . . . . . . 0.566 0.351 0.304 46.3 82.1 17.9
Non-elderly families . . . . . . 0.391 0.348 0.311 20.5 53.8 46.3Married couples . . . . . . . 0.371 0.338 0.301 18.9 47.1 52.9
No earner . . . . . . . . 0.599 0.414 0.376 37.2 83.0 17.01 earner . . . . . . . . . . 0.401 0.352 0.312 22.2 55.1 44.92 earners . . . . . . . . . 0.317 0.303 0.265 16.4 26.9 73.1
2 parents + kids . . . . . . . 0.355 0.318 0.278 21.7 48.1 51.9No earner . . . . . . . . 0.897 0.306 0.277 69.1 95.3 4.71 earner . . . . . . . . . . 0.461 0.376 0.308 33.2 55.6 44.42 earners . . . . . . . . . 0.319 0.291 0.249 21.9 40.0 60.03+ earners . . . . . . . . 0.278 0.261 0.231 16.9 36.2 63.8
Lone parents . . . . . . . . . 0.498 0.346 0.304 39.0 78.4 21.6Male head . . . . . . . . 0.395 0.326 0.284 28.1 62.2 37.8Female head . . . . . . . 0.506 0.334 0.299 40.9 83.1 16.9
No earner . . . . . 0.832 0.204 0.202 75.7 99.7 0.31 earner . . . . . . . 0.402 0.283 0.244 39.3 75.3 24.72+ earners . . . . . 0.334 0.277 0.253 24.3 70.4 29.6
Unattached individuals . . . . . . . 0.550 0.409 0.358 34.9 73.4 26.6Elderly male . . . . . . . . . . . . . 0.685 0.340 0.276 59.7 84.4 15.6
Non-earner . . . . . . . . . . 0.698 0.304 0.250 64.2 87.9 12.1Earner . . . . . . . . . . . . . . 0.560 0.383 0.313 44.1 71.7 28.3
Elderly female . . . . . . . . . . . 0.681 0.289 0.229 66.4 86.7 13.3Non-earner . . . . . . . . . . 0.690 0.274 0.217 68.6 87.9 12.1Earner . . . . . . . . . . . . . . 0.483 0.320 0.254 47.4 71.2 28.8
Non-elderly male . . . . . . . . 0.461 0.407 0.365 20.8 56.3 43.8Non-earner . . . . . . . . . . 0.918 0.414 0.388 57.7 95.1 4.9Earner . . . . . . . . . . . . . . 0.391 0.365 0.325 16.9 39.4 60.6
Non-elderly female . . . . . . . 0.512 0.440 0.397 22.5 62.6 37.4Non-earner . . . . . . . . . . 0.839 0.461 0.423 49.6 90.9 9.1Earner . . . . . . . . . . . . . . 0.413 0.388 0.344 16.7 36.2 63.8
Source: Statistics Canada, Income in Canada, 2000, catalogue no. 75-202-XPE, 83-85 andauthors’ calculations.
tax incidence, progressivity, and inequality in canada ■ 749
taxes from those of transfers;80 that is, they compare pre-tax, pre-transfer inequalitywith post-tax, post-transfer inequality. Other studies distinguish the separate effectsof income taxes (and employee social security premiums in some studies) on inequalitybut do not include Canada in their sample of countries.81 Moreover, the exclusionfrom these studies of indirect, property, and business taxes affects not only themeasured impact of taxation on inequality but also distorts the comparisons acrosscountries. Most of the excluded types of taxes are relatively regressive, so thatdifferences in tax mix across countries can substantially bias the cross-country meas-ure of inequality reduction from the tax system in its entirety.82 In concept, manyof the excluded taxes could be incorporated into the analysis via tax effects on theconsumer price index. However, as shown in Pendakur,83 the relevant price indicesmay differ across income groups, and this point is especially relevant for retail salestaxes and value-added taxes that use exempt or zero-rated classes of goods fordistributional purposes. Some of the excluded taxes may exert their effects bybackward shifting from business into lower employee compensation, and this wouldbe very difficult to include in INEQ studies.
Most studies of this type use the Luxembourg Income Study (LIS) data set, whichwas carefully designed for cross-country comparability over time. Nevertheless,several issues of comparability remain with the LIS, as discussed by Gottschalk andSmeeding.84 Some forms of measurement error—such as those that are independentof decile rank, common across countries, or time-invariant—do not affect cross-country comparisons of inequality. The data are annual and therefore have all thedeficiencies of short-term observations of the income experience of individuals.Furthermore, the studies cited in this and the next subsection are all now relativelydated in the periods they cover. They all predate the personal tax hikes in theUnited States in the early 1990s and the Canadian personal tax cuts in the later1990s (at the provincial level) and in 2000 and later (at the federal level). Moreover,most also miss the major Canadian tax reforms of 1988 and some even miss themajor US tax cuts of 1981 and reforms of 1986. Hence, it could be useful to repeatsimilar analyses to explore the inequality effects of tax reforms and rate cuts inCanada and other countries in more recent years.
80 For example, Fritzell, supra note 52; and Anthony B. Atkinson, Increased Income Inequality inOECD Countries and the Redistributive Impact of the Government Budget, Working Paper no. 202(Helsinki: United Nations University, World Institute for Development Economics Research,October 2000).
81 For example, Ervik, supra note 76.
82 However, Canada and the United States have very similar tax mixes at least with respect to theshare of PITs in total tax revenues including social security contributions—38 percent for Canadaand 42 percent for the United States in 2000. The other major tax types are also closelymatched in weighting for the two countries, if one considers social security (payroll) taxesjointly with indirect taxes on goods and services.
83 Supra note 50.
84 Supra note 21.
750 ■ canadian tax journal / revue fiscale canadienne (2004) vol. 52, no 3
One relatively simple research strategy is to test for Lorenz dominance of taxprogression curves in comparing tax systems either over time or across countries.Bishop et al.85 pursue this method using the PITs plus payroll taxes of six countries,including Canada, for two points in the late 1970s and the 1980s. These taxprogression curves can be constructed based on either the residual-progression orthe liability-progression concept, as defined earlier. Those concepts apply at a givenpoint in the tax schedule or distribution of pre-tax incomes, and a correspondingtax progression curve can be constructed similar to that of a Lorenz curve.86 Thenthe tax progression curves can be compared either across countries or over time toassess whether one curve “Lorenz dominates” the other (meaning the former is moreprogressive), whether the two are Lorenz equivalent, or whether there is “Lorenzcrossing” (where no conclusive ranking is possible). Using the liability-progressionconcept, Bishop et al. find for systems around 1980 that Canadian direct taxes weremore progressive than those in Sweden and the United Kingdom, less progressivethan West Germany, equivalent with Australia, and Lorenz-crossing with US taxes.87
Using the same concept, they find for observations around 1986 that Canadian directtaxes were more progressive than those of Australia, Sweden, the United Kingdom,and the United States and less progressive than those of West Germany. Between1981 and 1987, Canadian direct taxes exhibited no change in liability progression.
Zandvakili88 assesses the impacts of PITs in nine countries, including Canada,using the LIS and inequality measures of the generalized entropy and Atkinsontypes. His method is to compute the inequality measure for each country based ongross income (xg) and net income (xn); then the two inequality measures can becompared to gauge the impact of income taxes. Income tax progressivity is gaugedby the index PE, which is the difference between pre-tax and post-tax generalizedentropy measures of inequality. Table 7 presents Zandvakili’s findings based ongeneralized entropy indices for a range of values of the parameter c (his rankings ofcountries using the Atkinson indices are very similar and are not replicated here).As shown, the choice of parameter c affects the ranking of countries. For highinequality aversion at lower incomes (c = -1), Canada ranked near the middle of thenine countries on pre- and post-tax income inequality and tax progressivity but last
85 John A. Bishop, K. Victor Chow, and John P. Formby, “The Redistributive Effect of DirectTaxes: A Comparison of Six Luxembourg Income Study Countries” (1995) vol. 5, no. 1 Journalof Income Distribution 65-90.
86 The residual progression curve is constructed by adding values of LC (xn) – LC (xg) at eachquantile point to the ordinate of the 45-degree line, where LC is the Lorenz curve of post- orpre-tax income distributions. Similarly, the liability progression curve is constructed based onLC(t) – LC (xg), where LC (t) is the Lorenz curve of taxes paid.
87 Supra note 85. The authors do not report their results using the residual progression curvesbut note that of the 30 possible cross-country comparisons, only two cases were significantlydifferent at the 10 percent level.
88 Supra note 23.
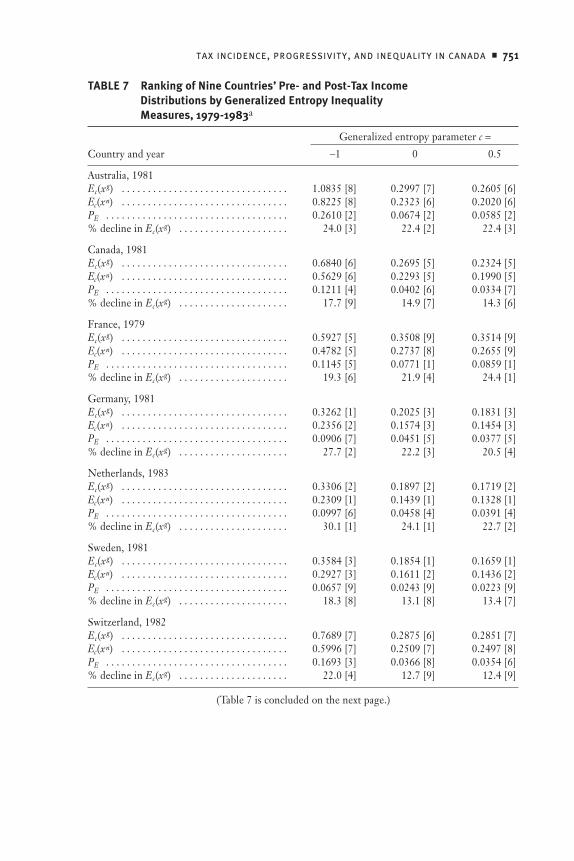
tax incidence, progressivity, and inequality in canada ■ 751
TABLE 7 Ranking of Nine Countries’ Pre- and Post-Tax IncomeDistributions by Generalized Entropy InequalityMeasures, 1979-1983a
Generalized entropy parameter c =Country and year -1 0 0.5
Australia, 1981Ec(xg) . . . . . . . . . . . . . . . . . . . . . . . . . . . . . . . . 1.0835 [8] 0.2997 [7] 0.2605 [6]Ec(xn) . . . . . . . . . . . . . . . . . . . . . . . . . . . . . . . . 0.8225 [8] 0.2323 [6] 0.2020 [6]PE . . . . . . . . . . . . . . . . . . . . . . . . . . . . . . . . . . . 0.2610 [2] 0.0674 [2] 0.0585 [2]% decline in Ec(xg) . . . . . . . . . . . . . . . . . . . . . 24.0 [3] 22.4 [2] 22.4 [3]
Canada, 1981Ec(xg) . . . . . . . . . . . . . . . . . . . . . . . . . . . . . . . . 0.6840 [6] 0.2695 [5] 0.2324 [5]Ec(xn) . . . . . . . . . . . . . . . . . . . . . . . . . . . . . . . . 0.5629 [6] 0.2293 [5] 0.1990 [5]PE . . . . . . . . . . . . . . . . . . . . . . . . . . . . . . . . . . . 0.1211 [4] 0.0402 [6] 0.0334 [7]% decline in Ec(xg) . . . . . . . . . . . . . . . . . . . . . 17.7 [9] 14.9 [7] 14.3 [6]
France, 1979Ec(xg) . . . . . . . . . . . . . . . . . . . . . . . . . . . . . . . . 0.5927 [5] 0.3508 [9] 0.3514 [9]Ec(xn) . . . . . . . . . . . . . . . . . . . . . . . . . . . . . . . . 0.4782 [5] 0.2737 [8] 0.2655 [9]PE . . . . . . . . . . . . . . . . . . . . . . . . . . . . . . . . . . . 0.1145 [5] 0.0771 [1] 0.0859 [1]% decline in Ec(xg) . . . . . . . . . . . . . . . . . . . . . 19.3 [6] 21.9 [4] 24.4 [1]
Germany, 1981Ec(xg) . . . . . . . . . . . . . . . . . . . . . . . . . . . . . . . . 0.3262 [1] 0.2025 [3] 0.1831 [3]Ec(xn) . . . . . . . . . . . . . . . . . . . . . . . . . . . . . . . . 0.2356 [2] 0.1574 [3] 0.1454 [3]PE . . . . . . . . . . . . . . . . . . . . . . . . . . . . . . . . . . . 0.0906 [7] 0.0451 [5] 0.0377 [5]% decline in Ec(xg) . . . . . . . . . . . . . . . . . . . . . 27.7 [2] 22.2 [3] 20.5 [4]
Netherlands, 1983Ec(xg) . . . . . . . . . . . . . . . . . . . . . . . . . . . . . . . . 0.3306 [2] 0.1897 [2] 0.1719 [2]Ec(xn) . . . . . . . . . . . . . . . . . . . . . . . . . . . . . . . . 0.2309 [1] 0.1439 [1] 0.1328 [1]PE . . . . . . . . . . . . . . . . . . . . . . . . . . . . . . . . . . . 0.0997 [6] 0.0458 [4] 0.0391 [4]% decline in Ec(xg) . . . . . . . . . . . . . . . . . . . . . 30.1 [1] 24.1 [1] 22.7 [2]
Sweden, 1981Ec(xg) . . . . . . . . . . . . . . . . . . . . . . . . . . . . . . . . 0.3584 [3] 0.1854 [1] 0.1659 [1]Ec(xn) . . . . . . . . . . . . . . . . . . . . . . . . . . . . . . . . 0.2927 [3] 0.1611 [2] 0.1436 [2]PE . . . . . . . . . . . . . . . . . . . . . . . . . . . . . . . . . . . 0.0657 [9] 0.0243 [9] 0.0223 [9]% decline in Ec(xg) . . . . . . . . . . . . . . . . . . . . . 18.3 [8] 13.1 [8] 13.4 [7]
Switzerland, 1982Ec(xg) . . . . . . . . . . . . . . . . . . . . . . . . . . . . . . . . 0.7689 [7] 0.2875 [6] 0.2851 [7]Ec(xn) . . . . . . . . . . . . . . . . . . . . . . . . . . . . . . . . 0.5996 [7] 0.2509 [7] 0.2497 [8]PE . . . . . . . . . . . . . . . . . . . . . . . . . . . . . . . . . . . 0.1693 [3] 0.0366 [8] 0.0354 [6]% decline in Ec(xg) . . . . . . . . . . . . . . . . . . . . . 22.0 [4] 12.7 [9] 12.4 [9]
(Table 7 is concluded on the next page.)
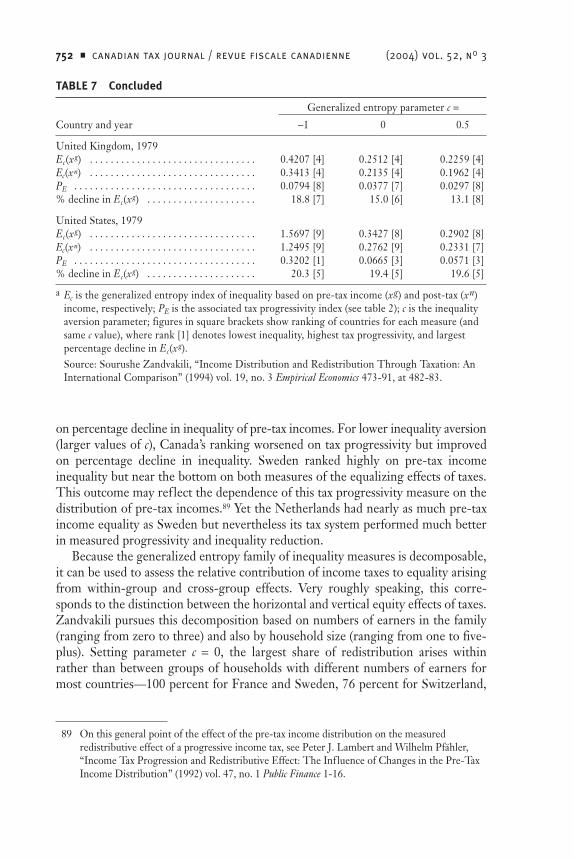
752 ■ canadian tax journal / revue fiscale canadienne (2004) vol. 52, no 3
on percentage decline in inequality of pre-tax incomes. For lower inequality aversion(larger values of c), Canada’s ranking worsened on tax progressivity but improvedon percentage decline in inequality. Sweden ranked highly on pre-tax incomeinequality but near the bottom on both measures of the equalizing effects of taxes.This outcome may ref lect the dependence of this tax progressivity measure on thedistribution of pre-tax incomes.89 Yet the Netherlands had nearly as much pre-taxincome equality as Sweden but nevertheless its tax system performed much betterin measured progressivity and inequality reduction.
Because the generalized entropy family of inequality measures is decomposable,it can be used to assess the relative contribution of income taxes to equality arisingfrom within-group and cross-group effects. Very roughly speaking, this corre-sponds to the distinction between the horizontal and vertical equity effects of taxes.Zandvakili pursues this decomposition based on numbers of earners in the family(ranging from zero to three) and also by household size (ranging from one to five-plus). Setting parameter c = 0, the largest share of redistribution arises withinrather than between groups of households with different numbers of earners formost countries—100 percent for France and Sweden, 76 percent for Switzerland,
United Kingdom, 1979Ec(xg) . . . . . . . . . . . . . . . . . . . . . . . . . . . . . . . . 0.4207 [4] 0.2512 [4] 0.2259 [4]Ec(xn) . . . . . . . . . . . . . . . . . . . . . . . . . . . . . . . . 0.3413 [4] 0.2135 [4] 0.1962 [4]PE . . . . . . . . . . . . . . . . . . . . . . . . . . . . . . . . . . . 0.0794 [8] 0.0377 [7] 0.0297 [8]% decline in Ec(xg) . . . . . . . . . . . . . . . . . . . . . 18.8 [7] 15.0 [6] 13.1 [8]
United States, 1979Ec(xg) . . . . . . . . . . . . . . . . . . . . . . . . . . . . . . . . 1.5697 [9] 0.3427 [8] 0.2902 [8]Ec(xn) . . . . . . . . . . . . . . . . . . . . . . . . . . . . . . . . 1.2495 [9] 0.2762 [9] 0.2331 [7]PE . . . . . . . . . . . . . . . . . . . . . . . . . . . . . . . . . . . 0.3202 [1] 0.0665 [3] 0.0571 [3]% decline in Ec(xg) . . . . . . . . . . . . . . . . . . . . . 20.3 [5] 19.4 [5] 19.6 [5]
a Ec is the generalized entropy index of inequality based on pre-tax income (xg) and post-tax (xn)income, respectively; PE is the associated tax progressivity index (see table 2); c is the inequalityaversion parameter; figures in square brackets show ranking of countries for each measure (andsame c value), where rank [1] denotes lowest inequality, highest tax progressivity, and largestpercentage decline in Ec(xg).Source: Sourushe Zandvakili, “Income Distribution and Redistribution Through Taxation: AnInternational Comparison” (1994) vol. 19, no. 3 Empirical Economics 473-91, at 482-83.
TABLE 7 Concluded
Generalized entropy parameter c =Country and year -1 0 0.5
89 On this general point of the effect of the pre-tax income distribution on the measuredredistributive effect of a progressive income tax, see Peter J. Lambert and Wilhelm Pfähler,“Income Tax Progression and Redistributive Effect: The Influence of Changes in the Pre-TaxIncome Distribution” (1992) vol. 47, no. 1 Public Finance 1-16.
tax incidence, progressivity, and inequality in canada ■ 753
71 percent for Canada, 69 percent for the Netherlands, and 65 percent for theUnited States. For two countries most of the redistribution arises between groups—99 percent for Germany and 60 percent for the United Kingdom. When the data aredecomposed by household size, the great bulk of tax redistribution is found to arisewithin rather than between groups—88 percent in Switzerland and the Netherlandsand more than 90 percent in all other countries, except for 68 percent in Germany.
Jäntti90 similarly uses the LIS to explore the role of income taxes in reducinginequality in five countries including Canada. This study distinguishes the equaliz-ing contributions of PIT and payroll taxes as well as the separate effects of socialinsurance benefits and income-tested benefits. Income-tested transfers would beexpected to contribute much more to equalization (in the vertical equity sense)than social insurance transfers (which aim more at horizontal redistribution). Socialinsurance programs could even raise inequality, insofar as their benefits are posi-tively linked to earnings and many of the lowest income households have no earnedincome. However, with annual data social insurance benefits could appear as equal-izing in that they tend to buffer earnings during temporary dips such as joblessnessor illness. These benefits also are typically capped in dollar terms even if they areearnings-linked, and those at the highest incomes have a higher proportion ofunearned income.
Jäntti’s study decomposes income inequality, measured by the squared coeffi-cient of variation, by income source, type of tax, and type of transfer. Two years areobserved for each country, but none of the years is more recent than 1987. Inabsolute contribution to reducing inequality, income taxes are most effective in theUnited States and least effective in the United Kingdom, with Canada and theothers intermediate. In their relative contribution to equality, income taxes aremost equalizing in Sweden and the Netherlands; they become more important inrelative terms for those countries because of their initially lower levels of marketincome inequality. Additionally, the relative contribution of income taxes to reduc-ing inequality declined only in Sweden and the United States, which were the onlycountries undertaking major tax reforms to reduce rate progressivity between thetwo years. Payroll taxes are also significantly equalizing in all the countries (exceptCanada, which lacks these data), actually rivalling or exceeding the impact of incometaxes in Sweden, the Netherlands, and the United Kingdom. Means-tested trans-fers are found to be equalizing in almost all cases, though the size of the effect isquite small. Social insurance transfers are slightly equalizing in Canada and theUnited Kingdom but disequalizing in the other three countries. The small estimatedrole of transfers relative to taxes in equalizing incomes contrasts with the evidencegiven earlier in tables 4 and 6 for Canada. This may be explained by the differinginequality indices; Jäntti’s squared coefficient of variation is much less sensitive tothe lower tail than the Gini used in our tabulations.
90 Supra note 22.

754 ■ canadian tax journal / revue fiscale canadienne (2004) vol. 52, no 3
Decomposing Personal Tax Policies andCross-Country Inequality
Some research has attempted to distinguish among the redistributive dimensionsof the PIT in a cross-country setting. Wagstaff et al.91 apply a methodology devel-oped in Aronson and Lambert92 to purse this issue for 11 European countries plusthe United States; Canada is not among the countries covered. The study decom-poses the redistributive effects into the three components noted earlier—verticalredistribution (V ), horizontal inequity (H), and a re-ranking effect (R). Table 8presents the results of the decomposition, with each of the components expressedas a percent of the total redistributive effect in each country, and thus they sum to100 percent (with negative signs attached to H and R). Horizontal inequity is rela-tively small in all countries, and differential taxation manifested as re-ranking issubstantial only in Denmark, France, and Switzerland.93 The personal tax is found tobe most progressive in France, Ireland, and Spain and least progressive in Swedenand Denmark; despite their rate-reducing reforms of the 1980s, the UK and USincome taxes remained relatively progressive. Note the relatively low tax progres-sivity found in Scandinavian countries (in this study and in Jäntti); this results fromthe combination of a progressive national tax combined with larger f lat-rate incometaxes applied by localities.
At least one study has taken the decomposition a step further to explore how thestructure of the PIT affects inequality in a cross-country comparison. Wagstaff andVan Doorslaer94 distinguish among allowances (or personal exemptions in NorthAmerican jargon), deductions (such as those for medical costs), non-refundable taxcredits, and the statutory rate schedule. The progressivity of net taxes dependsupon both the mix of these components and the progressivity of each. For exam-ple, one country may allow deductions that decline as a percentage of income,while another may allow the most generous deductions at the highest incomes.The study covers 15 OECD countries, but unfortunately the year for Canada is1986, which predates the 1988 reforms that converted personal exemptions andseveral deductions (for medical expenses, tuition fees, and employee premiums forsocial insurance) into non-refundable credits. The data used in the study are decileaverages, exclude all non-filers, exclude subnational taxes in some countries, andtake as the unit of observation the tax unit, the definition of which varies acrosscountries. Moreover, interpolation problems arising from the data cause the sum
91 Supra note 27.
92 Supra note 46.
93 The authors concede that the division between H and R is sensitive to the size of the incomegroups used to define “equals,” so that a more reliable approach may be to view the sum of Hand R as the differential tax treatment.
94 Adam Wagstaff and Eddy Van Doorslaer, “What Makes the Personal Income Tax Progressive?A Comparative Analysis for Fifteen OECD Countries” (2001) vol. 8, no. 3 International Tax andPublic Finance 299-315.
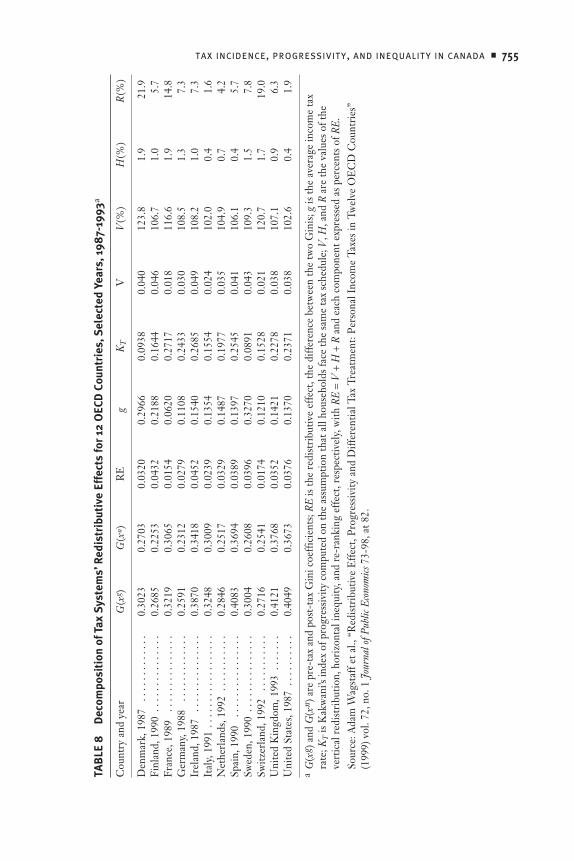
tax incidence, progressivity, and inequality in canada ■ 755
TA
BL
E 8
Dec
ompo
siti
on o
f Tax
Sys
tem
s’ R
edis
trib
utiv
e Ef
fect
s fo
r 12
OEC
D C
ount
ries
, Sel
ecte
d Ye
ars,
198
7-19
93a
Cou
ntry
and
yea
rG
(xg )
G(x
n )R
Eg
KT
VV
(%)
H(%
)R
(%)
Den
mar
k, 1
987
. . .
. . .
. . .
. . .
.0.
3023
0.27
030.
0320
0.29
660.
0938
0.04
012
3.8
1.9
21.9
Finl
and,
199
0 .
. . .
. . .
. . .
. . .
. .0.
2685
0.22
530.
0432
0.21
880.
1644
0.04
610
6.7
1.0
5.7
Fran
ce, 1
989
. . .
. . .
. . .
. . .
. . .
0.32
190.
3065
0.01
540.
0620
0.27
170.
018
116.
61.
914
.8G
erm
any,
198
8 .
. . .
. . .
. . .
. . .
0.25
910.
2312
0.02
790.
1108
0.24
330.
030
108.
51.
37.
3Ir
elan
d, 1
987
. . .
. . .
. . .
. . .
. . .
0.38
700.
3418
0.04
520.
1540
0.26
850.
049
108.
21.
07.
3It
aly,
199
1 . .
. . .
. . .
. . .
. . .
. . .
.0.
3248
0.30
090.
0239
0.13
540.
1554
0.02
410
2.0
0.4
1.6
Net
herl
ands
, 199
2 .
. . .
. . .
. . .
.0.
2846
0.25
170.
0329
0.14
870.
1977
0.03
510
4.9
0.7
4.2
Spai
n, 1
990
. . .
. . .
. . .
. . .
. . .
.0.
4083
0.36
940.
0389
0.13
970.
2545
0.04
110
6.1
0.4
5.7
Swed
en, 1
990
. . .
. . .
. . .
. . .
. . .
0.30
040.
2608
0.03
960.
3270
0.08
910.
043
109.
31.
57.
8Sw
itzer
land
, 199
2 .
. . .
. . .
. . .
.0.
2716
0.25
410.
0174
0.12
100.
1528
0.02
112
0.7
1.7
19.0
Uni
ted
Kin
gdom
, 199
3 .
. . .
. . .
0.41
210.
3768
0.03
520.
1421
0.22
780.
038
107.
10.
96.
3U
nite
d St
ates
, 198
7 .
. . .
. . .
. . .
0.40
490.
3673
0.03
760.
1370
0.23
710.
038
102.
60.
41.
9
aG
(xg )
and
G(x
n ) a
re p
re-t
ax a
nd p
ost-
tax
Gin
i coe
ffici
ents
; RE
is th
e re
dist
ribu
tive
effe
ct, t
he d
iffer
ence
bet
wee
n th
e tw
o G
inis
; g is
the
aver
age
inco
me
tax
rate
; KT is
Kak
wan
i’s in
dex
of p
rogr
essi
vity
com
pute
d on
the
assu
mpt
ion
that
all
hous
ehol
ds fa
ce th
e sa
me
tax
sche
dule
; V, H
, and
R a
re th
e va
lues
of t
heve
rtic
al r
edis
trib
utio
n, h
oriz
onta
l ine
quity
, and
re-
rank
ing
effe
ct, r
espe
ctiv
ely,
with
RE
= V
+ H
+ R
and
eac
h co
mpo
nent
exp
ress
ed a
s per
cent
s of R
E.So
urce
: Ada
m W
agst
aff e
t al.,
“R
edis
trib
utiv
e E
ffect
, Pro
gres
sivi
ty a
nd D
iffer
entia
l Tax
Tre
atm
ent:
Pers
onal
Inco
me
Taxe
s in
Twel
ve O
EC
D C
ount
ries
”(1
999)
vol
. 72,
no.
1 J
ourn
al o
f Pub
lic E
cono
mics
73-
98, a
t 82.
756 ■ canadian tax journal / revue fiscale canadienne (2004) vol. 52, no 3
of the estimated contributions of the four components to depart in some casesfrom the total estimated progressivity. This divergence is particularly severe for theUnited States and Canada.
Keeping in mind the study’s limitations, we note some general findings of Wagstaffand Van Doorslaer. Net tax liabilities are found to be least progressive with respectto income subject to tax (before deductions and allowances) in the Scandinaviancountries (again because of their f lat local income taxes) and most progressive inFrance, the Netherlands, Spain, Canada, and Australia. The tax credit’s contribu-tion to progressivity is relatively small, with the exceptions of Denmark and Italy;in Australia and France, tax credits reduce the progressivity of net tax liabilities.Deductions reduce progressivity in most countries but increase progressivity inAustralia, Finland, France, and Germany. Tax progressivity is attributable almostentirely to the rate structure in Italy, the Netherlands, and Spain. In contrast,allowances account for almost all progressivity in Canada, Ireland, the UnitedKingdom, and the United States. It would be useful to undertake this analysis witha better data set and for a more recent year, after Canada’s 1988 conversion of allallowances and some major deductions into tax credits. Since those provisions wereconverted into credits at the bottom bracket tax rate, this change should haveincreased effective progressivity. However, the 1988 Canadian reforms also f lat-tened the tax rate schedule and lowered the top rate, thus offsetting the increase inprogressivity.95
C G E S T U D I E S O F T A X E S
CGE models offer another approach to assessing the distributional impact of taxesand the tax system. Recent CGE studies build on the dynamic framework developedby Auerbach and Kotlikoff.96 These analyses can evaluate the efficiency and distri-butional effects of taxes jointly. Because these models ref lect the labour supply andsavings responses to tax policies, the distributional impacts can be measured interms of impacts on households’ lifetime utilities (or the equivalent money sums).Net income does not measure all of the induced effects on household well-being,once the tax system alters work-leisure and intertemporal consumption choices.The Auerbach-Kotlikoff model includes multiple overlapping generations but notmultiple households in each generation, so that its distributional analysis is limitedto intergenerational issues but cannot consider intragenerational impacts (acrosshouseholds of the same cohort but with differing lifetime incomes). Later analystshave extended the framework to encompass within-generation distributional impactsof taxes as well as multiple generations; we call these CGE studies. Most of these
95 See A. Pierre Cloutier and Bernard Fortin, “Converting Exemptions and Deductions intoCredits: An Economic Assessment,” in Jack Mintz and John Whalley, eds., The Economic Impactsof Tax Reform, Canadian Tax Paper no. 84 (Toronto: Canadian Tax Foundation, 1989), 45-73.
96 Alan J. Auerbach and Laurence J. Kotlikoff, Dynamic Fiscal Policy (New York: CambridgeUniversity Press, 1987).
tax incidence, progressivity, and inequality in canada ■ 757
studies have been applied to assess the distributional impacts of tax reforms—suchas changing the personal tax base to consumption or to comprehensive income orflattening the personal tax rate schedule—rather than the impacts of existing taxes.97
Fullerton and Rogers98 offer one of the few CGE studies to assess the distributionof the existing tax system and its components. While the study is applied to theUnited States, the similarities of its economy and tax mix to those of Canada makethe findings of interest.99 Table 9 summarizes the study’s key distributional find-ings. The upper part of the table displays the impacts of replacing each of the fivemain types of taxes with a proportional tax on each household’s labour endowment(present value of all years’ fixed leisure hours valued at its wage rate each year).Households are arrayed by lifetime income decile, with the bottom and top decileseach further subdivided into the lowest and highest two percentiles and the bal-ance. The impacts are stated in terms of a dollar measure of utility, equivalentvariation100 (EV), as a percentage of that income group’s lifetime income. Forexample, replacing a tax might increase the net income while decreasing the leisuretime of a particular group; because leisure affects utility, the net income impactalone would overstate the utility gain to that group. The figures in the upper partof the table reflect the EV gains as a percent of lifetime income to the “steady-state” generation, which is the cohort after all economic adjustments to the taxchange have taken place. For the steady-state generation, only the PIT is found tobe strongly and consistently progressive; payroll tax is regressive; sales and excisetaxes are regressive except slightly progressive for the top decile; corporate taxesdisplay a shallow U-shaped incidence pattern; and property tax has a highly vari-able pattern with its heaviest incidence on the top and bottom two percentiles. Alltaxes taken together display a variable pattern, but the top decile bears the heaviestrelative tax burden.101
97 David Altig, Alan J. Auerbach, Laurence J. Kotlikoff, Kent A. Smetters, and Jan Walliser,“Simulating Fundamental Tax Reform in the United States” (2001) vol. 91, no. 3 The AmericanEconomic Review 574-95, introduce intragenerational distribution into the Auerbach-Kotlikoffmodel and have the further property of perfect-foresight behaviour along the transition pathvis-à-vis Fullerton-Rogers’ use of myopic expectations. However, Altig et al. examine fundamentaltax reforms (including variants that protect lower-earning households) and not the impacts ofthe existing mix and structure of taxes. Similarly, Don Fullerton and Diane Lim Rogers, “LifetimeEffects of Fundamental Tax Reform,” in Economic Effects of Fundamental Tax Reform, supra note 7,321-52, apply their CGE model to distributional aspects of fundamental tax reforms.
98 Supra note 6.
99 One caveat here is that the Canadian economy is much smaller and more open to internationalf lows of capital and labour, which can affect the economic modelling and implied tax incidence.Also, Canada applies indirect consumption taxes more heavily than the United States, which inturn applies payroll taxes more heavily than Canada.
100 EV, a standard measure of efficiency costs, is the maximum amount of income that anindividual would pay to forgo the tax or tax change.
101 Recall that all of the tabulated impacts are relative to a proportional tax on lifetime labourendowments, which rise with the wage rate of each lifetime income group. This is an example
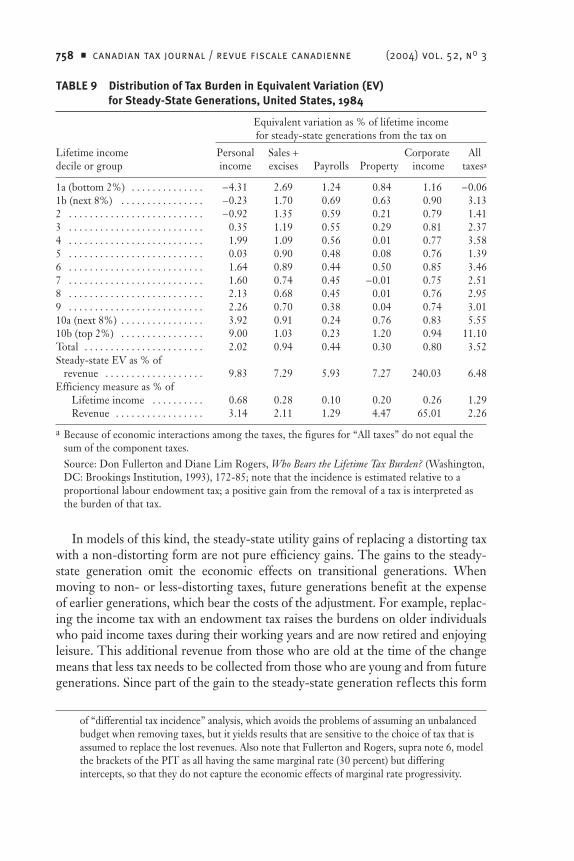
758 ■ canadian tax journal / revue fiscale canadienne (2004) vol. 52, no 3
In models of this kind, the steady-state utility gains of replacing a distorting taxwith a non-distorting form are not pure efficiency gains. The gains to the steady-state generation omit the economic effects on transitional generations. Whenmoving to non- or less-distorting taxes, future generations benefit at the expenseof earlier generations, which bear the costs of the adjustment. For example, replac-ing the income tax with an endowment tax raises the burdens on older individualswho paid income taxes during their working years and are now retired and enjoyingleisure. This additional revenue from those who are old at the time of the changemeans that less tax needs to be collected from those who are young and from futuregenerations. Since part of the gain to the steady-state generation ref lects this form
TABLE 9 Distribution of Tax Burden in Equivalent Variation (EV)for Steady-State Generations, United States, 1984
Equivalent variation as % of lifetime incomefor steady-state generations from the tax on
Lifetime income Personal Sales + Corporate Alldecile or group income excises Payrolls Property income taxesa
1a (bottom 2%) . . . . . . . . . . . . . . -4.31 2.69 1.24 0.84 1.16 -0.061b (next 8%) . . . . . . . . . . . . . . . . -0.23 1.70 0.69 0.63 0.90 3.132 . . . . . . . . . . . . . . . . . . . . . . . . . . -0.92 1.35 0.59 0.21 0.79 1.413 . . . . . . . . . . . . . . . . . . . . . . . . . . 0.35 1.19 0.55 0.29 0.81 2.374 . . . . . . . . . . . . . . . . . . . . . . . . . . 1.99 1.09 0.56 0.01 0.77 3.585 . . . . . . . . . . . . . . . . . . . . . . . . . . 0.03 0.90 0.48 0.08 0.76 1.396 . . . . . . . . . . . . . . . . . . . . . . . . . . 1.64 0.89 0.44 0.50 0.85 3.467 . . . . . . . . . . . . . . . . . . . . . . . . . . 1.60 0.74 0.45 -0.01 0.75 2.518 . . . . . . . . . . . . . . . . . . . . . . . . . . 2.13 0.68 0.45 0.01 0.76 2.959 . . . . . . . . . . . . . . . . . . . . . . . . . . 2.26 0.70 0.38 0.04 0.74 3.0110a (next 8%) . . . . . . . . . . . . . . . . 3.92 0.91 0.24 0.76 0.83 5.5510b (top 2%) . . . . . . . . . . . . . . . . 9.00 1.03 0.23 1.20 0.94 11.10Total . . . . . . . . . . . . . . . . . . . . . . . 2.02 0.94 0.44 0.30 0.80 3.52Steady-state EV as % of
revenue . . . . . . . . . . . . . . . . . . . 9.83 7.29 5.93 7.27 240.03 6.48Efficiency measure as % of
Lifetime income . . . . . . . . . . 0.68 0.28 0.10 0.20 0.26 1.29Revenue . . . . . . . . . . . . . . . . . 3.14 2.11 1.29 4.47 65.01 2.26
a Because of economic interactions among the taxes, the figures for “All taxes” do not equal thesum of the component taxes.Source: Don Fullerton and Diane Lim Rogers, Who Bears the Lifetime Tax Burden? (Washington,DC: Brookings Institution, 1993), 172-85; note that the incidence is estimated relative to aproportional labour endowment tax; a positive gain from the removal of a tax is interpreted asthe burden of that tax.
of “differential tax incidence” analysis, which avoids the problems of assuming an unbalancedbudget when removing taxes, but it yields results that are sensitive to the choice of tax that isassumed to replace the lost revenues. Also note that Fullerton and Rogers, supra note 6, modelthe brackets of the PIT as all having the same marginal rate (30 percent) but differingintercepts, so that they do not capture the economic effects of marginal rate progressivity.
tax incidence, progressivity, and inequality in canada ■ 759
of redistribution, a true efficiency measure needs to sum the present value of EVimpacts for all annual cohorts. The last two rows of table 9 show these efficiencycosts of the various taxes, expressed as percentages of lifetime income and revenue,respectively. Relative to revenues generated, the most costly tax in efficiency is thaton corporate (or capital) income, followed by property tax and PIT. Sales and excisetaxes (or a broad tax on consumption) is the second least costly tax in efficiencyterms, and payroll tax the least costly.102
Little research using the CGE approach has been undertaken for the Canadiantax system, and what has been done uses static CGE models that do not account forthe full intertemporal dynamics or the tax system’s lifetime effects on individuals.Moreover, the Canadian research has been applied to investigate the efficiency anddistributional effects of switching the PIT to a f lat tax rather than the effects of theexisting set of taxes. One such study, Beauséjour et al.,103 finds that a simple f lat taxwould benefit two-earner couples and singles; adding a $500 credit to the schemeincreases the gains for singles and also benefits seniors.104 The losers under theseschemes are found to be single parents and one-earner families. Using an Atkinsonindex with a moderate degree of inequality aversion (parameter e = 1.5), the studyfinds that the simple flat tax would raise inequality of after-tax incomes by 10 percent;adding the credit reduces this increase in inequality to 6 percent. This adverse effecton inequality could be mitigated by, for example, providing large additional creditsfor single parents and for non-working spouses, as has been done under Alberta’sprovincial f lat tax scheme.
F I N C S T U D I E S O F T A X E S
The earliest and still most popular method of assessing the distribution of the taxburden is denoted as fiscal incidence. FINC studies combine assumptions about theincidence of each type of tax with data sets on the distribution of incomes bysources and uses to derive the income profile of ATRs.105 Typically the analysis isperformed on household units using annual data, though there are exceptions.
102 This ranking of taxes by their efficiency costs accords roughly with that found in several othereconomic studies. For a review of this literature, see Jonathan R. Kesselman, General PayrollTaxes: Economics, Politics, and Design, Canadian Tax Paper no. 101 (Toronto: Canadian TaxFoundation, 1997), 42-49. Auerbach and Kotlikoff, supra note 96, for example, rank theirstylized taxes (from highest to lowest efficiency costs) as follows: capital income, labourincome, total income, consumption; most other studies have a similar ranking except that thelabour income base has lower efficiency costs than the total income base.
103 Louis Beauséjour, G.C. Ruggeri, and Baxter Williams, “Efficiency and Distributional Effects ofFlat Tax Proposals,” paper presented at the 1996 conference of the Canadian EconomicAssociation, St. Catharines, Ontario, May 30-June 2, 1996.
104 This study is unpublished, but a detailed account of it, as well as another unpublished CanadianCGE study that focuses more on methodological issues, is provided in G.C. Ruggeri and CaroleVincent, An Economic Analysis of Income Tax Reforms (Aldershot, UK: Ashgate, 1998), chapter 5.
105 Many of these studies consider jointly the fiscal incidence on the expenditures side of publicbudgets, but we focus here on their methods and findings with respect to taxation.
760 ■ canadian tax journal / revue fiscale canadienne (2004) vol. 52, no 3
This approach seeks to capture the effects of taxes, via demand and supply, onprices in the economy—chief ly the prices of factors of production (wage rates andthe return to capital) and the prices of consumption goods at various times and ofvarious types. When the tax impact falls on the prices of factors, it is said to operateon the “sources” side of households’ incomes, which are decomposed into thecategories of labour, capital, and transfer incomes. When the tax impact falls onprices of consumption goods, it is said to operate on the “uses” side of income,which is decomposed into consumption and savings and may distinguish betweenforms of consumption taxed at lower and higher rates (such as food versus alcohol).Assumptions about the incidence or “shifting” of each type of tax are taken frompartial and general equilibrium models and empirical studies. Then a micro dataset distributive series of each type of income source and use by household incomecan be applied to each of the taxes, using a specified set of shifting assumptions, tocompute the distributional burden of each tax and of total taxes.
FINC studies were pioneered in the United States by Musgrave et al.106 and byPechman and associates107 at the Brookings Institution and in Canada by Goffman108
and in Gillespie’s research for the Carter commission109 and his later work.110 Thismethod also underlies the distributional tables produced for tax policy changes inthe budgets of Canada and many other countries. A series of periodically updatedstudies by the Fraser Institute, now in its 13th version,111 uses this method. Thissection begins with the findings of a few of the more recent Canadian studies ofthis type, including both annual and lifetime perspectives. It then examines in detailthe incidence or shifting assumptions that these studies employ for each type of taxand the related economic evidence.
Overview of Canadian Findings
Before turning to the findings of the more recent Canadian FINC studies, it isuseful to review an earlier analysis that highlights the critical role of tax-shiftingassumptions. Table 10 shows the pattern of estimated total ATRs by householdincome group for 1972 using the researcher’s “central case” view of the most
106 Richard A. Musgrave, J.J. Caroll, L.D. Cook, and L. Frane, “Distribution of Tax Payments byIncome Groups: A Case Study for 1948” (1951) vol. 4, no. 1 National Tax Journal 1-53.
107 Joseph A. Pechman and Benjamin A. Okner, Who Bears the Tax Burden? (Washington, DC:Brookings Institution, 1974); and Joseph A. Pechman, Who Paid the Taxes, 1966-85?(Washington, DC: Brookings Institution, 1985).
108 Irving Jay Goffman, The Burden of Canadian Taxation: Allocation of the Federal, Provincial and LocalTaxes Among Income Classes, Canadian Tax Paper no. 29 (Toronto: Canadian Tax Foundation, 1962).
109 Gillespie, supra note 60.
110 Gillespie, supra note 69. For references to and reviews of these and other FINC studies inthese two countries and others, see Dahlby, supra note 3; Vermaeten et al., supra note 61, at348-355; and Ruggeri et al., The Government as Robin Hood, supra note 58, at 6-11.
111 Joel Emes, Niels Veldhuis, and Michael Walker, Tax Facts 13 (Vancouver: Fraser Institute, 2004).
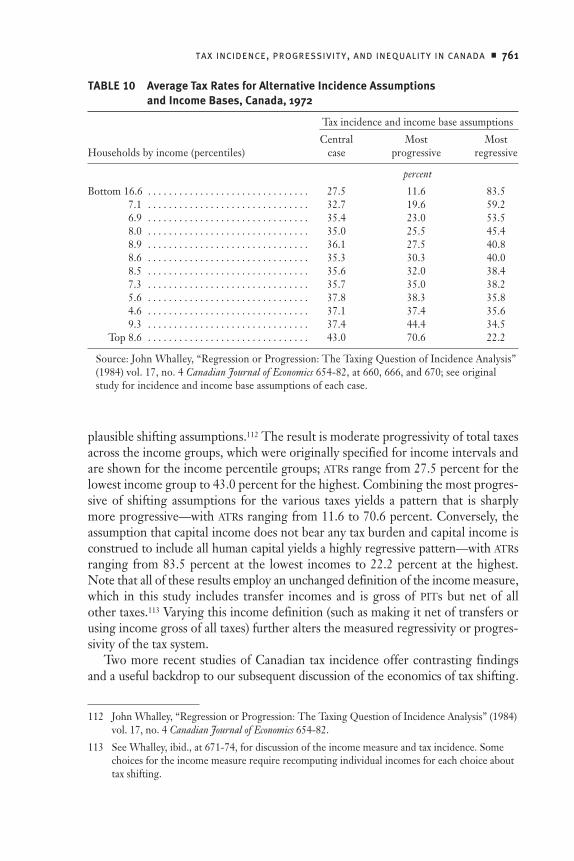
tax incidence, progressivity, and inequality in canada ■ 761
plausible shifting assumptions.112 The result is moderate progressivity of total taxesacross the income groups, which were originally specified for income intervals andare shown for the income percentile groups; ATRs range from 27.5 percent for thelowest income group to 43.0 percent for the highest. Combining the most progres-sive of shifting assumptions for the various taxes yields a pattern that is sharplymore progressive—with ATRs ranging from 11.6 to 70.6 percent. Conversely, theassumption that capital income does not bear any tax burden and capital income isconstrued to include all human capital yields a highly regressive pattern—with ATRsranging from 83.5 percent at the lowest incomes to 22.2 percent at the highest.Note that all of these results employ an unchanged definition of the income measure,which in this study includes transfer incomes and is gross of PITs but net of allother taxes.113 Varying this income definition (such as making it net of transfers orusing income gross of all taxes) further alters the measured regressivity or progres-sivity of the tax system.
Two more recent studies of Canadian tax incidence offer contrasting findingsand a useful backdrop to our subsequent discussion of the economics of tax shifting.
TABLE 10 Average Tax Rates for Alternative Incidence Assumptionsand Income Bases, Canada, 1972
Tax incidence and income base assumptions
Central Most MostHouseholds by income (percentiles) case progressive regressive
percent
Bottom 16.6 . . . . . . . . . . . . . . . . . . . . . . . . . . . . . . . 27.5 11.6 83.57.1 . . . . . . . . . . . . . . . . . . . . . . . . . . . . . . . 32.7 19.6 59.26.9 . . . . . . . . . . . . . . . . . . . . . . . . . . . . . . . 35.4 23.0 53.58.0 . . . . . . . . . . . . . . . . . . . . . . . . . . . . . . . 35.0 25.5 45.48.9 . . . . . . . . . . . . . . . . . . . . . . . . . . . . . . . 36.1 27.5 40.88.6 . . . . . . . . . . . . . . . . . . . . . . . . . . . . . . . 35.3 30.3 40.08.5 . . . . . . . . . . . . . . . . . . . . . . . . . . . . . . . 35.6 32.0 38.47.3 . . . . . . . . . . . . . . . . . . . . . . . . . . . . . . . 35.7 35.0 38.25.6 . . . . . . . . . . . . . . . . . . . . . . . . . . . . . . . 37.8 38.3 35.84.6 . . . . . . . . . . . . . . . . . . . . . . . . . . . . . . . 37.1 37.4 35.69.3 . . . . . . . . . . . . . . . . . . . . . . . . . . . . . . . 37.4 44.4 34.5
Top 8.6 . . . . . . . . . . . . . . . . . . . . . . . . . . . . . . . 43.0 70.6 22.2
Source: John Whalley, “Regression or Progression: The Taxing Question of Incidence Analysis”(1984) vol. 17, no. 4 Canadian Journal of Economics 654-82, at 660, 666, and 670; see originalstudy for incidence and income base assumptions of each case.
112 John Whalley, “Regression or Progression: The Taxing Question of Incidence Analysis” (1984)vol. 17, no. 4 Canadian Journal of Economics 654-82.
113 See Whalley, ibid., at 671-74, for discussion of the income measure and tax incidence. Somechoices for the income measure require recomputing individual incomes for each choice abouttax shifting.
762 ■ canadian tax journal / revue fiscale canadienne (2004) vol. 52, no 3
Both of these studies utilize Statistics Canada’s Social Policy Simulation Dataset/Model (SPSD/M) with various adjustments to the data. First are the findings for1988 of Vermaeten, Gillespie, and Vermaeten (VGV),114 as summarized in table 11.115
This study uses both the pre-fisc and broad-income concepts, but we presentmainly their findings for the latter. In this study’s “standard case” shifting assump-tions, both the PIT and corporate income tax are sharply progressive; commoditytaxes (including both excises and broad-based forms) and property taxes are highlyregressive; and the ATRs for payroll taxes display an inverted-U shape, with theirheaviest relative burden at middle incomes. Grouping taxes by level of government,federal taxes overall are quite progressive, provincial taxes are roughly propor-tional, and local taxes are regressive. The table also presents variants of VGV’sresults for “progressive” and “regressive” shifting assumptions as well as the standardshifting case using a pre-fisc income base. The latter makes the overall tax systemvery regressive at low incomes and otherwise roughly proportional.
A second FINC study applies a similar database and methodology to that of VGVbut uses a post-fisc income base and partially differing tax-shifting assumptions(especially with respect to the incidence of commodity taxes, as discussed later). Thisresearch for the year 1986 by Ruggeri, Van Wart, and Howard (RVH)116 is reportedin two different forms with differing emphases. Table 12 shows their computedglobal RSA indices both by type of tax and level of government; a base case as wellas variants with more progressive and more regressive shifting assumptions areshown. As with VGV, PIT is found to be the most progressive tax by RVH, but owingto different shifting assumptions the corporate income tax is much less progressive.Also mainly owing to a different shifting assumption, RVH find general sales taxesto be progressive, although liquor and tobacco taxes are examined separately andfound to be regressive. RVH’s ranking of tax progressivity by level of governmentturns out the same as VGV’s, with federal taxes the most progressive, but unlike VGV,RVH also find provincial taxes to be progressive and local taxes to be about propor-tional rather than regressive. Table 13 presents RVH’s findings for effective ATRs byincome group and household type, with PIT and all other taxes shown separately.117
The income tax remains progressive with income for all household types, but allother taxes display ATR patterns across incomes that vary with household type. Incomparing the findings of VGV and RVH, we recall that the income base used by thelatter should make taxes appear more progressive. The 1988 year used by VGV
114 Supra note 61.
115 The same authors also provide findings from a useful extension of this analysis to show changesin tax incidence in Canada over the period 1951 to 1988 (Arndt Vermaeten, W. Irwin Gillespie,and Frank Vermaeten, “Who Paid the Taxes in Canada, 1951-1988?” (1995) vol. 21, no. 3Canadian Public Policy 317-43).
116 Ruggeri et al., supra note 31, and Ruggeri et al., The Government as Robin Hood, supra note 58.
117 Ruggeri et al., supra note 31, at 440-43, also present the ATRs by income class for each type oftax, but it is in graphical rather than tabular form and hence not replicated here.
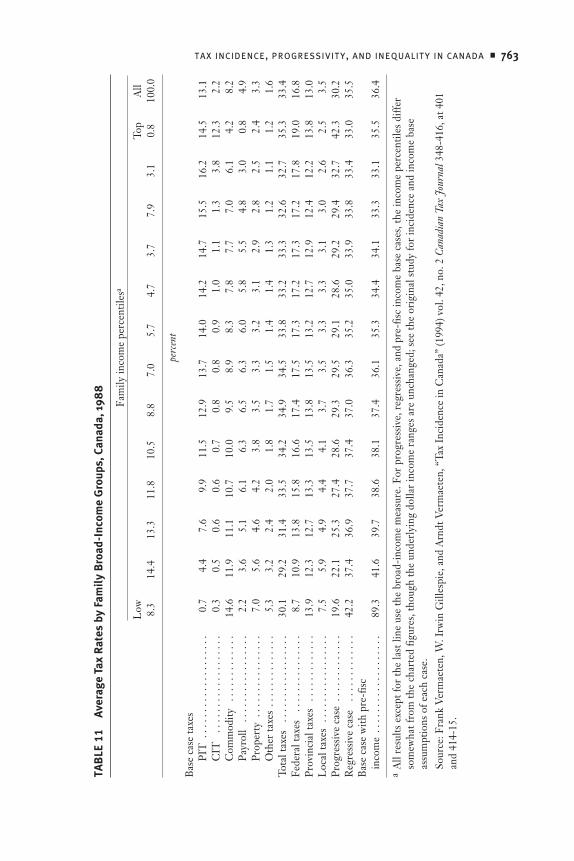
tax incidence, progressivity, and inequality in canada ■ 763
TA
BL
E 1
1A
vera
ge T
ax R
ates
by
Fam
ily
Bro
ad-I
ncom
e G
roup
s, C
anad
a, 1
988
Fam
ily in
com
e pe
rcen
tiles
a
Low
Top
All
8.3
14.4
13.3
11.8
10.5
8.8
7.0
5.7
4.7
3.7
7.9
3.1
0.8
100.
0
perc
ent
Base
cas
e ta
xes
PIT
. . .
. . .
. . .
. . .
. . .
. . .
. .
0.7
4.4
7.6
9.9
11.5
12.9
13.7
14.0
14.2
14.7
15.5
16.2
14.5
13.1
CIT
. . .
. . .
. . .
. . .
. . .
. . .
.0.
30.
50.
60.
60.
70.
80.
80.
91.
01.
11.
33.
812
.32.
2C
omm
odity
. . .
. . .
. . .
. . .
.14
.611
.911
.110
.710
.09.
58.
98.
37.
87.
77.
06.
14.
28.
2Pa
yrol
l .
. . .
. . .
. . .
. . .
. . .
.2.
23.
65.
16.
16.
36.
56.
36.
05.
85.
54.
83.
00.
84.
9Pr
oper
ty .
. . .
. . .
. . .
. . .
. . .
7.0
5.6
4.6
4.2
3.8
3.5
3.3
3.2
3.1
2.9
2.8
2.5
2.4
3.3
Oth
er ta
xes
. . .
. . .
. . .
. . .
. .5.
33.
22.
42.
01.
81.
71.
51.
41.
41.
31.
21.
11.
21.
6To
tal t
axes
. . .
. . .
. . .
. . .
. . .
. .
30.1
29.2
31.4
33.5
34.2
34.9
34.5
33.8
33.2
33.3
32.6
32.7
35.3
33.4
Fede
ral t
axes
. . .
. . .
. . .
. . .
. . .
8.7
10.9
13.8
15.8
16.6
17.4
17.5
17.3
17.2
17.3
17.2
17.8
19.0
16.8
Prov
inci
al ta
xes
. . .
. . .
. . .
. . .
.13
.912
.312
.713
.313
.513
.813
.513
.212
.712
.912
.412
.213
.813
.0L
ocal
taxe
s .
. . .
. . .
. . .
. . .
. . .
.7.
55.
94.
94.
44.
13.
73.
53.
33.
33.
13.
02.
62.
53.
5Pr
ogre
ssiv
e ca
se .
. . .
. . .
. . .
. . .
19.6
22.1
25.3
27.4
28.6
29.3
29.5
29.1
28.6
29.2
29.4
32.7
42.3
30.2
Reg
ress
ive
case
. . .
. . .
. . .
. . .
.42
.237
.436
.937
.737
.437
.036
.335
.235
.033
.933
.833
.433
.035
.5Ba
se c
ase
with
pre
-fis
cin
com
e . .
. . .
. . .
. . .
. . .
. . .
. .
89.3
41.6
39.7
38.6
38.1
37.4
36.1
35.3
34.4
34.1
33.3
33.1
35.5
36.4
aA
ll re
sults
exc
ept f
or th
e la
st li
ne u
se th
e br
oad-
inco
me
mea
sure
. For
pro
gres
sive
, reg
ress
ive,
and
pre
-fis
c in
com
e ba
se c
ases
, the
inco
me
perc
entil
es d
iffer
som
ewha
t fro
m th
e ch
arte
d fig
ures
, tho
ugh
the
unde
rlyi
ng d
olla
r in
com
e ra
nges
are
unc
hang
ed; s
ee th
e or
igin
al st
udy
for
inci
denc
e an
d in
com
e ba
seas
sum
ptio
ns o
f eac
h ca
se.
Sour
ce: F
rank
Ver
mae
ten,
W. I
rwin
Gill
espi
e, a
nd A
rndt
Ver
mae
ten,
“Ta
x In
cide
nce
in C
anad
a” (1
994)
vol
. 42,
no.
2 C
anad
ian
Tax
Jour
nal 3
48-4
16, a
t 401
and
414-
15.
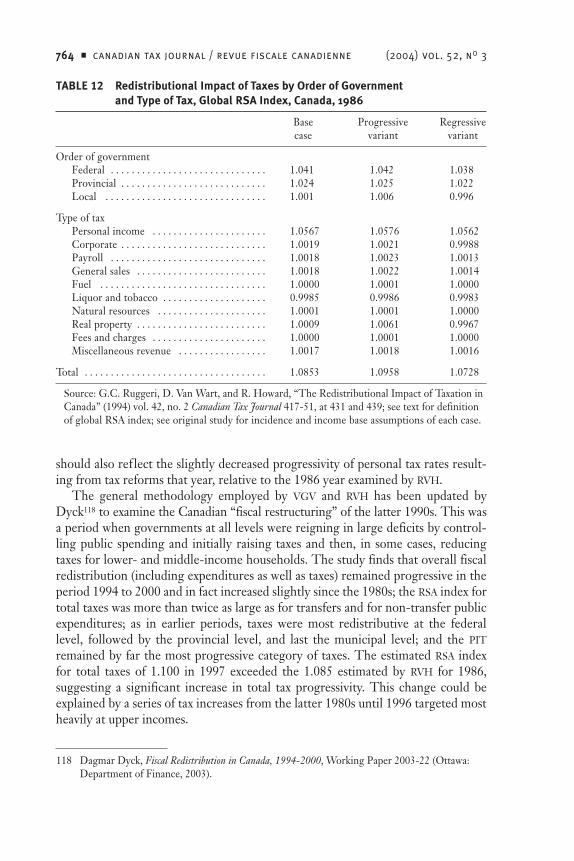
764 ■ canadian tax journal / revue fiscale canadienne (2004) vol. 52, no 3
should also ref lect the slightly decreased progressivity of personal tax rates result-ing from tax reforms that year, relative to the 1986 year examined by RVH.
The general methodology employed by VGV and RVH has been updated byDyck118 to examine the Canadian “fiscal restructuring” of the latter 1990s. This wasa period when governments at all levels were reigning in large deficits by control-ling public spending and initially raising taxes and then, in some cases, reducingtaxes for lower- and middle-income households. The study finds that overall fiscalredistribution (including expenditures as well as taxes) remained progressive in theperiod 1994 to 2000 and in fact increased slightly since the 1980s; the RSA index fortotal taxes was more than twice as large as for transfers and for non-transfer publicexpenditures; as in earlier periods, taxes were most redistributive at the federallevel, followed by the provincial level, and last the municipal level; and the PITremained by far the most progressive category of taxes. The estimated RSA indexfor total taxes of 1.100 in 1997 exceeded the 1.085 estimated by RVH for 1986,suggesting a significant increase in total tax progressivity. This change could beexplained by a series of tax increases from the latter 1980s until 1996 targeted mostheavily at upper incomes.
TABLE 12 Redistributional Impact of Taxes by Order of Governmentand Type of Tax, Global RSA Index, Canada, 1986
Base Progressive Regressivecase variant variant
Order of governmentFederal . . . . . . . . . . . . . . . . . . . . . . . . . . . . . . 1.041 1.042 1.038Provincial . . . . . . . . . . . . . . . . . . . . . . . . . . . . 1.024 1.025 1.022Local . . . . . . . . . . . . . . . . . . . . . . . . . . . . . . . 1.001 1.006 0.996
Type of taxPersonal income . . . . . . . . . . . . . . . . . . . . . . 1.0567 1.0576 1.0562Corporate . . . . . . . . . . . . . . . . . . . . . . . . . . . . 1.0019 1.0021 0.9988Payroll . . . . . . . . . . . . . . . . . . . . . . . . . . . . . . 1.0018 1.0023 1.0013General sales . . . . . . . . . . . . . . . . . . . . . . . . . 1.0018 1.0022 1.0014Fuel . . . . . . . . . . . . . . . . . . . . . . . . . . . . . . . . 1.0000 1.0001 1.0000Liquor and tobacco . . . . . . . . . . . . . . . . . . . . 0.9985 0.9986 0.9983Natural resources . . . . . . . . . . . . . . . . . . . . . 1.0001 1.0001 1.0000Real property . . . . . . . . . . . . . . . . . . . . . . . . . 1.0009 1.0061 0.9967Fees and charges . . . . . . . . . . . . . . . . . . . . . . 1.0000 1.0001 1.0000Miscellaneous revenue . . . . . . . . . . . . . . . . . 1.0017 1.0018 1.0016
Total . . . . . . . . . . . . . . . . . . . . . . . . . . . . . . . . . . . 1.0853 1.0958 1.0728
Source: G.C. Ruggeri, D. Van Wart, and R. Howard, “The Redistributional Impact of Taxation inCanada” (1994) vol. 42, no. 2 Canadian Tax Journal 417-51, at 431 and 439; see text for definitionof global RSA index; see original study for incidence and income base assumptions of each case.
118 Dagmar Dyck, Fiscal Redistribution in Canada, 1994-2000, Working Paper 2003-22 (Ottawa:Department of Finance, 2003).
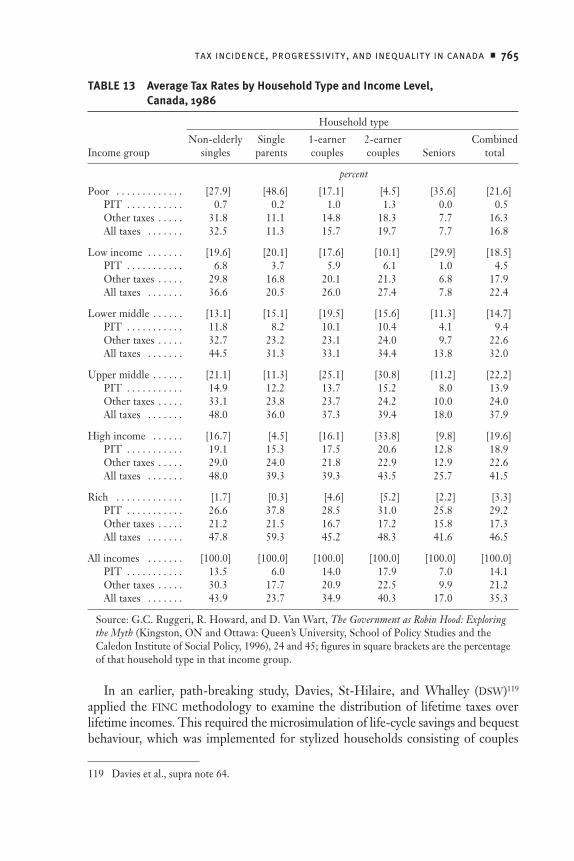
tax incidence, progressivity, and inequality in canada ■ 765
In an earlier, path-breaking study, Davies, St-Hilaire, and Whalley (DSW)119
applied the FINC methodology to examine the distribution of lifetime taxes overlifetime incomes. This required the microsimulation of life-cycle savings and bequestbehaviour, which was implemented for stylized households consisting of couples
TABLE 13 Average Tax Rates by Household Type and Income Level,Canada, 1986
Household type
Non-elderly Single 1-earner 2-earner CombinedIncome group singles parents couples couples Seniors total
percent
Poor . . . . . . . . . . . . . [27.9] [48.6] [17.1] [4.5] [35.6] [21.6]PIT . . . . . . . . . . . 0.7 0.2 1.0 1.3 0.0 0.5Other taxes . . . . . 31.8 11.1 14.8 18.3 7.7 16.3All taxes . . . . . . . 32.5 11.3 15.7 19.7 7.7 16.8
Low income . . . . . . . [19.6] [20.1] [17.6] [10.1] [29.9] [18.5]PIT . . . . . . . . . . . 6.8 3.7 5.9 6.1 1.0 4.5Other taxes . . . . . 29.8 16.8 20.1 21.3 6.8 17.9All taxes . . . . . . . 36.6 20.5 26.0 27.4 7.8 22.4
Lower middle . . . . . . [13.1] [15.1] [19.5] [15.6] [11.3] [14.7]PIT . . . . . . . . . . . 11.8 8.2 10.1 10.4 4.1 9.4Other taxes . . . . . 32.7 23.2 23.1 24.0 9.7 22.6All taxes . . . . . . . 44.5 31.3 33.1 34.4 13.8 32.0
Upper middle . . . . . . [21.1] [11.3] [25.1] [30.8] [11.2] [22.2]PIT . . . . . . . . . . . 14.9 12.2 13.7 15.2 8.0 13.9Other taxes . . . . . 33.1 23.8 23.7 24.2 10.0 24.0All taxes . . . . . . . 48.0 36.0 37.3 39.4 18.0 37.9
High income . . . . . . [16.7] [4.5] [16.1] [33.8] [9.8] [19.6]PIT . . . . . . . . . . . 19.1 15.3 17.5 20.6 12.8 18.9Other taxes . . . . . 29.0 24.0 21.8 22.9 12.9 22.6All taxes . . . . . . . 48.0 39.3 39.3 43.5 25.7 41.5
Rich . . . . . . . . . . . . . [1.7] [0.3] [4.6] [5.2] [2.2] [3.3]PIT . . . . . . . . . . . 26.6 37.8 28.5 31.0 25.8 29.2Other taxes . . . . . 21.2 21.5 16.7 17.2 15.8 17.3All taxes . . . . . . . 47.8 59.3 45.2 48.3 41.6 46.5
All incomes . . . . . . . [100.0] [100.0] [100.0] [100.0] [100.0] [100.0]PIT . . . . . . . . . . . 13.5 6.0 14.0 17.9 7.0 14.1Other taxes . . . . . 30.3 17.7 20.9 22.5 9.9 21.2All taxes . . . . . . . 43.9 23.7 34.9 40.3 17.0 35.3
Source: G.C. Ruggeri, R. Howard, and D. Van Wart, The Government as Robin Hood: Exploringthe Myth (Kingston, ON and Ottawa: Queen’s University, School of Policy Studies and theCaledon Institute of Social Policy, 1996), 24 and 45; figures in square brackets are the percentageof that household type in that income group.
119 Davies et al., supra note 64.
766 ■ canadian tax journal / revue fiscale canadienne (2004) vol. 52, no 3
with children during part of their lives. DSW generated lifetime distributive serieson income, consumption, transfers, and taxes, each of which displayed much lessdispersion than annual data because it removed both year-to-year and life-cyclevariations. This approach allowed for the comparison of lifetime and annual taxincidence patterns using a common data set, which they drew from Canadian datafor 1970. Table 14 presents the DSW findings by major type of tax for both the annualand lifetime bases and for a couple of variants of tax shifting for the lifetime results.Both the annual and life-cycle views yield moderate progressivity in total taxes acrossthe household income deciles, though progressivity is reduced in the lifetime view(except for the bottom decile). While the PIT is less progressive in the lifetime thanthe annual view, this is offset by the fact that most other taxes are less regressive. Thelifetime incidence results are also much less sensitive to alternative tax-shiftingassumptions than the annual results, because of the lesser lifetime dispersion of theunderlying economic series.
Incidence by Type of Tax
PITs and Labour EarningsAll distributional studies of the FINC type, as well as those of the INEQ type, assumethat the economic burden of PITs falls fully on the individuals who nominally paythem. This approach was endorsed in an official US analysis of the distribution offederal taxes as follows: “employees bear the full individual income tax on theirearnings. . . . That assumption . . . is accepted by virtually all economists.”120 Thisis a critical assumption for tax distribution studies on account of the relative sizeand progressivity of the PIT. The PIT is the largest single source of tax revenue inCanada. For all levels of government taken jointly in 2000, the PIT was 43 percent(38 percent) of tax revenues excluding (including) social security contributions.121
Corresponding figures for the PIT broken down by level of government are asfollows: federal, 57 percent (46 percent); provincial, 37 percent (35 percent); andlocal, 0 percent. Because of its dominance in revenues, the extent to which the PITis effectively progressive is pivotal in the cited findings that the overall federal taxsystem is substantially progressive and provincial taxes somewhat progressive. Ifthe PIT were found to be less progressive in its economic incidence than conven-tionally assumed, then these findings might also be considerably altered, sincemost other major taxes are proportional or regressive.
Despite this standard assumption in tax distribution studies, there exist severalforms of evidence that individual taxpayers do not bear the full incidence of thePIT. More worrisome for the validity of results from existing studies, there is
120 US Congressional Budget Office, supra note 48, at 25.
121 These figures were derived by the authors from the Organisation for Economic Co-operationand Development, Revenue Statistics, 1965-2001 (Paris: OECD, 2002), tables 45 and 142. Federalsocial security funds include all contributions to the Canada Pension Plan and employmentinsurance; provincial social security funds include all contributions to the Quebec Pension Planand hospital insurance premiums; provincial payroll taxes are classified along with tax revenues.
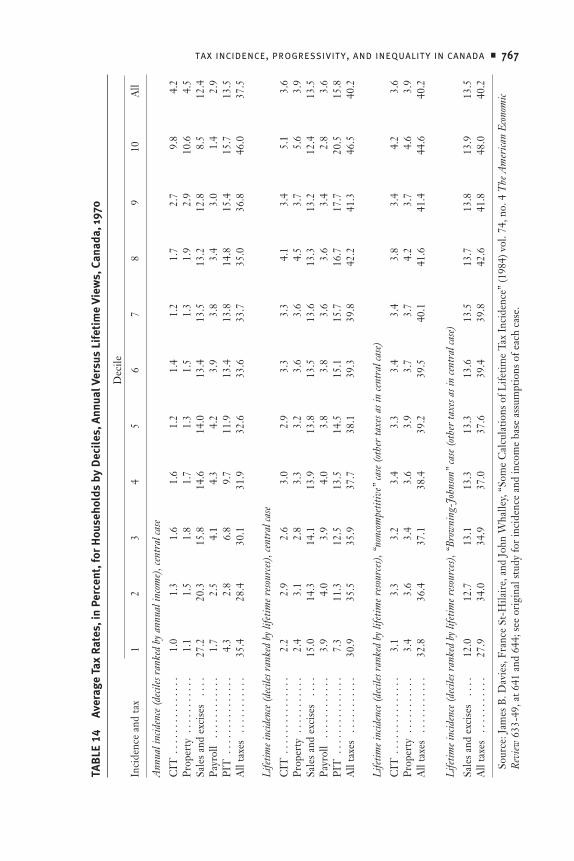
tax incidence, progressivity, and inequality in canada ■ 767
TA
BL
E 1
4A
vera
ge T
ax R
ates
, in
Perc
ent,
for
Hou
seho
lds
by D
ecil
es, A
nnua
l Ver
sus
Life
tim
e V
iew
s, C
anad
a, 1
970
Dec
ile
Inci
denc
e an
d ta
x1
23
45
67
89
10A
ll
Ann
ual i
ncid
ence
(dec
iles r
anke
d by
ann
ual i
ncom
e), c
entr
al ca
se
CIT
. . .
. . .
. . .
. . .
. . .
1.0
1.3
1.6
1.6
1.2
1.4
1.2
1.7
2.7
9.8
4.2
Prop
erty
. . .
. . .
. . .
. .
1.1
1.5
1.8
1.7
1.3
1.5
1.3
1.9
2.9
10.6
4.5
Sale
s and
exc
ises
. . .
.27
.220
.315
.814
.614
.013
.413
.513
.212
.88.
512
.4Pa
yrol
l .
. . .
. . .
. . .
. .1.
72.
54.
14.
34.
23.
93.
83.
43.
01.
42.
9PI
T .
. . .
. . .
. . .
. . .
. .4.
32.
86.
89.
711
.913
.413
.814
.815
.415
.713
.5A
ll ta
xes
. . .
. . .
. . .
. .
35.4
28.4
30.1
31.9
32.6
33.6
33.7
35.0
36.8
46.0
37.5
Life
time i
ncid
ence
(dec
iles r
anke
d by
life
time
r eso
urce
s), ce
ntra
l cas
e
CIT
. . .
. . .
. . .
. . .
. . .
2.2
2.9
2.6
3.0
2.9
3.3
3.3
4.1
3.4
5.1
3.6
Prop
erty
. . .
. . .
. . .
. .
2.4
3.1
2.8
3.3
3.2
3.6
3.6
4.5
3.7
5.6
3.9
Sale
s and
exc
ises
. . .
.15
.014
.314
.113
.913
.813
.513
.613
.313
.212
.413
.5Pa
yrol
l .
. . .
. . .
. . .
. .3.
94.
03.
94.
03.
83.
83.
63.
63.
42.
83.
6PI
T .
. . .
. . .
. . .
. . .
. .7.
311
.312
.513
.514
.515
.115
.716
.717
.720
.515
.8A
ll ta
xes
. . .
. . .
. . .
. .
30.9
35.5
35.9
37.7
38.1
39.3
39.8
42.2
41.3
46.5
40.2
Life
time i
ncid
ence
(dec
iles r
anke
d by
life
time r
esou
rces
), “n
onco
mpe
titiv
e” ca
se (o
ther
taxe
s as i
n ce
ntra
l cas
e)
CIT
. . .
. . .
. . .
. . .
. . .
3.1
3.3
3.2
3.4
3.3
3.4
3.4
3.8
3.4
4.2
3.6
Prop
erty
. . .
. . .
. . .
. .
3.4
3.6
3.4
3.6
3.9
3.7
3.7
4.2
3.7
4.6
3.9
All
taxe
s .
. . .
. . .
. . .
.32
.836
.437
.138
.439
.239
.540
.141
.641
.444
.640
.2
Life
time i
ncid
ence
(dec
iles r
anke
d by
life
time r
esou
rces
), “B
row
ning
-Joh
nson
” ca
se (o
ther
taxe
s as i
n ce
ntra
l cas
e)
Sale
s and
exc
ises
. . .
.12
.012
.713
.113
.313
.313
.613
.513
.713
.813
.913
.5A
ll ta
xes
. . .
. . .
. . .
. .
27.9
34.0
34.9
37.0
37.6
39.4
39.8
42.6
41.8
48.0
40.2
Sour
ce: J
ames
B. D
avie
s, Fr
ance
St-
Hila
ire,
and
John
Wha
lley,
“So
me
Cal
cula
tions
of L
ifetim
e Ta
x In
cide
nce”
(198
4) v
ol. 7
4, n
o. 4
The
Am
erica
n Ec
onom
icRe
view
633
-49,
at 6
41 a
nd 6
44; s
ee o
rigi
nal s
tudy
for
inci
denc
e an
d in
com
e ba
se a
ssum
ptio
ns o
f eac
h ca
se.
768 ■ canadian tax journal / revue fiscale canadienne (2004) vol. 52, no 3
evidence of a distributional twist in the incidence of the PIT that reduces effectiveprogressivity. One study noted this phenomenon: “at the upper end of the incomedistribution, after-tax income is the basis for negotiations on remuneration,” whichsuggests some shifting of the PIT by higher earners.122 A similar result arises withthe “tax equalization” provisions offered by many multinational corporations whenthey relocate top managers to Canada. Their salaries are increased to offset theamount by which their Canadian income taxes exceed those in their home country.By a process of emulation or competition, similar salary premiums may spread totop managers of domestic origin. In a dual labour market model with imperfectcompetition and bargaining, it was found that diminished progressivity of the PITreduced the gross wages of skilled labour, and this was empirically confirmed forDenmark.123 Thus, the shifting of PIT works to undo at least part of its progressivity.This result is also common to long-run models of human capital formation andoccupational choices. If one uses the pure “schooling” variant of the human capitalmodel and assumes that there are no ability or quality differences across individuals,tax progressivity will be completely undone in the long run by occupational choicesand related schooling investments.124 Individuals will choose their schooling tomaximize lifetime earnings net of tax, which makes tax progressivity useless forreducing inequality of net incomes; the PIT progressivity is simply shifted intocorrespondingly higher gross wages.125 In a more realistic model with ability differ-ences across individuals, the effective progressivity of a PIT would still be reducedbut not eliminated.
An intriguing analysis by Lockwood and Manning relates the progressivity ofthe PIT and other labour taxes to wage formation via a bargaining model.126 Theysuggest that their model extends beyond unionized workers to include the bargainingpower that high earners may exercise over their employers through their firm-specific skills. In a fairly general model of firm-union wage setting, they reach severalconclusions when the firm profit and union utility functions are iso-elastic.127 First,an increase in the marginal tax rate (MTR), while holding constant the ATR, will
122 Block and Shillington, supra note 7, at 37.
123 Claus Thustrup Hansen, Lars Haagen Pedersen, and Torsten Sloek, Progressive Taxation, Wagesand Activity in a Small Open Economy, EPRU Working Paper 95-21 (Copenhagen: University ofCopenhagen, Economic Policy Research Unit, 1995).
124 Claude Montmarquette, “A Note on Income (Labor) Inequality: Income Tax Systems andHuman Capital Theory” (1974) vol. 82, no. 3 Journal of Political Economy 620-25.
125 The extreme regressive findings illustrated by Whalley, supra note 112, as shown in the right-hand column of table 10, reflect a similar economic assumption that human capital does notbear any of the tax burden.
126 Ben Lockwood and Alan Manning, “Wage Setting and the Tax System: Theory and Evidencefor the United Kingdom” (1993) vol. 52, no. 1 Journal of Public Economics 1-29. If this kind ofbargaining power exists, it would undermine the validity of the perfect competition assumptionsthat underlie the models of CGE studies.
127 Their analytical result on the tax determinants of wage pressure involve the coefficient ofresidual progression, RP(x) as defined earlier, and hence the ATR and MTR are relevant factors.
tax incidence, progressivity, and inequality in canada ■ 769
decrease the pre-tax real wage rate. Second, an increase in the ATR, while holdingconstant the MTR, will raise the pre-tax real wage by more than the tax increase—hence backward shifting over 100 percent. Third, it is the ratio of the ATR to the MTRthat affects the wage rate. As a result, the number of tax brackets affects the pre-taxincome distribution; a strongly progressive PIT, with many rising MTRs, yields theflattest pattern of pre-tax wages and the most progressive distribution of net in-comes. And a linear tax system would worsen the distribution of pre-tax labourincomes. The authors find that their model can explain the increase in gross wagesof high earners in the United Kingdom in the 1980s following large cuts in theirMTRs, and this outcome has nothing to do with improved incentives for hard work.They also find that the UK tax system, which has a basic MTR covering the bulk ofworkers, acts to redistribute gross wages toward higher earners within the basicbracket. Their empirical tests provide support for the role of the wedge betweenATRs and MTRs as a determinant of pressure on gross wages.
Additional evidence stems from research that relates PIT rates to labour supplyor migration responses that affect gross wages, particularly for skilled workers.These studies find partial or complete shifting of the PIT into higher wages thatreduces the effective progressivity of the tax. Bingley and Lanot128 examined theimpact of income taxes on labour supply and gross wages simultaneously; if the taxreduces the amount of labour supplied at a given wage, it will raise the equilibriumpre-tax wage rate, thus shifting part of the burden onto employers. They found thatmore of the adjustment was in gross wages than hours, which would be consistentwith a model where aggregate labour supply was more elastic than labour demand.129
However, that study did not distinguish between tax shifting for high- versus low-wage labour and thus does not directly address the progressivity issue. Feldsteinand Wrobel130 attacked this problem by examining differential progressivity (includ-ing PIT, sales taxes, and property taxes) across states in the United States and byasking whether state taxes can redistribute income. Using cross-state and cross-timedata, their answer is no; interstate migration in response to tax rate differentialscauses gross wages to adjust so that net-of-tax wages are equalized across states.This wage adjustment, with full incidence falling on employers rather than indi-viduals paying the PIT, means that a more progressive state tax system raises thecost to firms of hiring more highly skilled workers.131 The adjustment, which wasfound to occur within just a few years, does not require extensive migration. There
128 Paul Bingley and Gauthier Lanot, “The Incidence of Income Tax on Wages and Labour Supply”(2002) vol. 83, no. 2 Journal of Public Economics 173-94.
129 See Bingley and Lanot, ibid., at 174-75, for a review of recent literature on PIT shifting.
130 Martin Feldstein and Marian Vaillant Wrobel, “Can State Taxes Redistribute Income?” (1998)vol. 68, no. 3 Journal of Public Economics 369-96.
131 Hence, it is the differential progressivity of subnational PIT systems that gives rise to the migration.If all lower jurisdictions had the same degree of progressivity, there would be no migration, andthe taxes would remain effectively progressive with full incidence of the higher rates falling on theworkers.
770 ■ canadian tax journal / revue fiscale canadienne (2004) vol. 52, no 3
needs to be enough movement of more heavily taxed workers to raise their mar-ginal product relative to that of less heavily taxed workers to offset the tax ratedifferential.132 Day and Winer133 provide a review of Canadian studies of interpro-vincial migration in response to fiscal policies, suggesting that this process is atleast partially operative in Canada.
Also relevant is empirical research on international migration, principally theasserted “brain drain” from Canada to the United States. The fact that emigrationfrom Canada has been concentrated in a few highly paid occupational categorieshas been cited as evidence that Canada’s tax rates are too high and too progressive.134
The economic adjustment process here would be similar to that across subnationaljurisdictions with differing degrees of progressivity. That is, within the limits ofallowed immigration, the outf low would continue until the gross wage differentialsacross countries offset the tax rate differentials. That would constrain the ability ofCanada to implement greater PIT progressivity than the United States.135 However,while Canadian PIT rates overall are higher than in the United States, they are lessprogressive at the federal level (with higher bottom and lower top rates, and thetop rate incurred at lower incomes) but more progressive at the subnational level.136
For that reason, any tax-motivated emigration from Canada might better be ascribedto the level rather than to the progressivity of Canadian taxes.137 Most likely, non-tax
132 Also see David E. Wildasin, “State Income Taxation with Mobile Labor” (1993) vol. 12, no. 1Journal of Policy Analysis and Management 51-75, for a related analysis of this issue. However,Wildasin assumes that the supply of high-skilled workers to each state is perfectly elastic andthat low-skilled workers and capital are completely immobile. Discussant Roger H. Gordonroundly critiques the study for this and other implicit assumptions (Roger H. Gordon, “Commenton ‘State Income Taxation with Mobile Labor’” (1993) vol. 12, no. 1 Journal of Policy Analysisand Management 76-80).
133 Kathleen M. Day and Stanley L. Winer, “Internal Migration and Public Policy: An Introductionto the Issues and a Review of Empirical Research on Canada,” in Allan M. Maslove, ed., Issuesin the Taxation of Individuals, Research Studies of the Fair Tax Commission of Ontario(Toronto: University of Toronto Press in cooperation with the Fair Tax Commission ofOntario, 1994), 3-61.
134 For a review of studies and critique see Ross Finnie, “The Brain Drain: Myth and Reality”(2001) vol. 7, no. 6 Choices 1-66.
135 The overall process is somewhat more complex, because individuals consider the publicservices and civic values that they enjoy in each country as well as the taxes they pay, and thosetaxes in turn inf luence the level of public services and civic values; see Jonathan R. Kesselman,“Policies To Stem the Brain Drain—Without Americanizing Canada” (2001) vol. 27, no. 1Canadian Public Policy 77-93.
136 Jonathan Kesselman, “Flat Taxes, Dual Taxes, Smart Taxes: Making the Best Choices” (2000)vol. 1, no. 7 Policy Matters 1-101; and Jonathan R. Kesselman, “Tax Design for a NorthernTiger” (2004) vol. 10, no. 1 Choices 1-44.
137 The sole empirical study of the relationship between Canada-US tax differentials and migration,by Donald Mark Wagner, “Do Tax Differences Contribute Toward the Brain Drain fromCanada to the U.S.?” (PhD thesis, University of British Columbia, Faculty of Commerce andBusiness Administration, 2000), 77-112, found that only about 10 to 15 percent of f lows to theUnited States could be explained by taxes.
tax incidence, progressivity, and inequality in canada ■ 771
factors such as higher gross wage rates (unrelated to tax factors) and unique workopportunities in the United States are the predominant explanation.
Payroll TaxesThe most common incidence assumption for payroll taxes in FINC (and INEQ) taxdistribution studies is that the full burden of both employer and employee portionsfalls on employees via lower gross wages and salaries. This is the benchmark assump-tion in the VGV, RVH, and DSW studies cited above as well as the methodology ofthe US Congressional Budget Office.138 However, variations on the assumed inci-dence of payroll taxes, particularly for the employer share, are used for sensitivityanalysis in a number of FINC studies. For example, VGV139 adopt the standard payrollincidence view as consistent with a small open economy model where capital is moremobile than labour and product markets are highly competitive. In a “progressive”variant, they consider a small open economy with less capital mobility than in theirstandard model, full mobility of consumer outlays, and labour market imperfec-tions that inhibit the backward shifting of business taxes (such as unions bargainingon an after-tax basis with respect to payroll taxes). In that case they assume that theemployer portion of payroll taxes is borne by capital, while the employee portion isborne by labour.140 In a “regressive” variant, VGV consider an economy with fullymobile capital but imperfectly competitive product markets with oligopolistic ele-ments that allow for forward shifting of taxes to consumers. In that case theyassume that the employer portion of payroll taxes is shifted onto consumers viahigher product prices, while the employee portion remains a burden on labour.
One needs to distinguish between payroll taxes that have a strong benefitlinkage and “general” payroll taxes. A general payroll tax is one whose revenues gointo the consolidated budget or one with no linkage between the taxes paid by oron behalf of workers and their benefit entitlements. The incidence of such taxes isdiscussed below. A benefit-linked payroll tax has more the character of a usercharge for a publicly supplied service, where the tax ref lects the value of associatedbenefits. Rather than the wedge imposed between the buyer’s and seller’s price by aconventional tax, the labour supply curve is shifted down by the prospective ben-efits just as the labour demand curve is shifted down by the payroll tax. If a workervalues the benefits at their full cost, these shifts are equal, and the full incidence ofthe tax will fall on the employee without any decline in equilibrium work hours.141
Yet one might ask whether benefit-linked payroll taxes should even be included intax incidence studies, any more than the charges for publicly supplied water or
138 Congressional Budget Office, supra note 48, at 25.
139 Vermaeten et al., supra note 61, at 368-69.
140 It is somewhat curious that VGV do not consistently argue that part or all of employee payrolltaxes and/or PIT is also shifted back onto capital.
141 Lawrence A. Summers, “Some Simple Economics of Mandated Benefits” (1989) vol. 79, no. 2The American Economic Review 177-83.
772 ■ canadian tax journal / revue fiscale canadienne (2004) vol. 52, no 3
electricity.142 Tax distribution studies for Canada and the United States typically findthat payroll taxes are progressive from low to middle incomes and regressive overhigher income ranges. However, this ref lects the dominance of benefit-linked formsof payroll tax and their use of annual ceilings on taxed earnings of each worker; itfails to ref lect the fact that the associated benefit entitlements are similarly cappedby annual maximums. Canadian employment insurance premiums have an elementof both benefit-linked and general payroll taxes. The Quebec and Canada PensionPlans have a close linkage between premiums and future benefits except for theportion needed to finance shortfalls arising from early cohorts of retirees.
The incidence of general payroll taxes, sometimes not distinguished from benefit-linked payroll taxes, has been subject to intensive research along with their employ-ment effects.143 When a general payroll tax is applied to all employment incomeacross a national economy, the incidence is determined by the interplay of aggregatelabour demand and labour supply curves. Although there is some divergence ofestimates, most research finds that a general payroll tax on employees is fully andimmediately borne by workers and that a tax on employers is shifted fully or almostfully to workers via lower wages and salaries over several years. Hence, the standardassumption used for payroll taxes in most tax incidence studies appears to be supportedfor both benefit-linked and general payroll taxes of broad application. It is a well-established proposition in tax economics that the ultimate incidence of a tax does notdepend on whether the tax is nominally levied on buyers and sellers, if markets arecompetitive, and this result is upheld for payroll taxes after an adjustment period.
The employer payroll levies of four Canadian provinces have no linkage betweenpayments (all by employers) and individual worker health care benefits, for whichthey are nominally applied, so they are entirely general payroll taxes. In addition,all provinces apply employer payroll taxes to finance schemes of workers’ compen-sation, with the rates often varying by industry and at times by firms (so-calledexperience rating). General payroll taxes applied at differential rates across prov-inces, industries, and/or firms raise further questions about economic incidence.To the extent that a payroll tax is applied at a differentially high rate on certainfirms, they will bear the burden (reducing the return to owners or capital), whilethe base rate of tax applying to all firms will be borne by labour.144 If the tax is
142 A payroll tax for social insurance is a mandatory payment, unlike a user charge for a publicutility, but it does have an associated benefit. This along with political reasons may explain whygovernments, and the OECD, often describe social security contributions as something otherthan taxes. Also see Kesselman, supra note 102, at 38-39, for discussion of the economicdistinctions between benefit-linked and general payroll taxes.
143 See Kesselman, ibid., at 55-81, for review.
144 François Vaillancourt and Nicolas Marceau, “Do General and Firm-Specific Employer PayrollTaxes Have the Same Incidence? Theory and Evidence” (1990) vol. 34, no. 2 Economics Letters175-81. Yet another consideration is that, if the premiums are experience-rated by firm, they mayref lect benefits that are valued by firms at the same rate. For example, workers’ compensationrelieves firms of legal liability for civil suits related to worker injuries, so that they may have nochange in their demand curve for labour as a result of the combined premiums and benefits.
tax incidence, progressivity, and inequality in canada ■ 773
applied at a differentially high rate on a particular industry, it is likely to be shiftedto output prices and thereby borne by consumers of that industry’s product. Mostinteresting is the question of incidence of a provincially differentiated payroll taxrate, such as those applied by four provinces. To the extent that the findings onincidence of subnational PITs, cited earlier, are applicable to the Canadian prov-inces, these provincial payroll taxes will be borne by business (and thus fall oncapital and/or consumption) rather than by labour owing to its high interprovincialmobility. This result is contrary to the shifting assumption commonly used in taxincidence studies.
Taxes on Goods and ServicesIndirect taxes on goods and services are the second largest source of tax revenuesfor the Canadian federal and most provincial governments. These take the form ofa multi-stage GST for the federal and four provincial governments; single-stageretail sales taxes for five provinces; excise taxes on alcohol, gasoline, and tobaccoproducts at both levels; and federal import duties.145 Although the various indirecttaxes have differences that can affect their incidence, the key issue in tax distribu-tion studies is whether the burdens should be allocated based on the “uses” or the“sources” side of households’ budgets. The traditional view was that these taxes areborne by households in proportion to their outlays on taxable items. That is,consumers who pay the tax also bear its full economic incidence. Intuitively, whenone goes from an income tax to a consumption tax, the prices of the taxed consumergoods increase relative to untaxed capital goods. There is no change in relativefactor prices, so the price increase falls on consumers and not savers. Because inannual data the savings rate rises with household incomes, the traditional viewleads to a finding that indirect taxes are very regressive.146 The higher proportionof outlays on the highly taxed excise products by lower-income households accen-tuates the regressive pattern. The traditional incidence assumption is adopted asthe standard case in VGV. Revealingly, when DSW use this incidence assumptionand move from an annual to a lifetime view, sales and excise taxes change fromhighly regressive to only slightly regressive (“central case” in table 14).
An alternative view about the incidence of indirect taxes was proposed byBrowning and by Browning and Johnson (BJ).147 This view asserts that the burden
145 Canadian duties are low or non-existent on most goods. However, import quotas andmarketing board restrictions raise the prices on goods that rank relatively large for the budgetsof lower-income households (eggs, chicken, dairy products, and low-priced clothing) and thushave a regressive impact. See Emes et al., supra note 111, at 21-22.
146 Note that the regressivity of indirect taxes is accentuated by the progressivity of the PIT, sincehouseholds can spend only out of their after-PIT incomes, which are eroded byproportionately larger amounts of PIT at higher incomes.
147 Edgar K. Browning, “The Burden of Taxation” (1978) vol. 86, no. 4 Journal of Political Economy649-71; and Edgar K. Browning and William R. Johnson, The Distribution of the Tax Burden(Washington, DC: American Enterprise Institute, 1979).
774 ■ canadian tax journal / revue fiscale canadienne (2004) vol. 52, no 3
of indirect taxes should be distributed by the sources side, or factor incomes, ratherthan the uses of income.148 BJ observe that the traditional incidence view was basedon only two types of income—labour and capital—and ignored transfer incomes.Transfer payments make up a larger proportion of lower household incomes (as intable 3) and are often indexed for changes in the price level. Hence, when anindirect tax rate is raised, the recipients of transfer income are insulated from theprice level impact via an adjustment of their transfer payments. To the extent thattransfer recipients are compensated for the impact, the indirect taxes can be borneonly by the recipients of market incomes and in particular labour incomes. The BJview thus renders indirect taxes progressive from low to middle incomes, propor-tional for upper-middle incomes, and regressive for high incomes, as seen in RVH’sstandard case results.149 When the BJ assumption is combined with lifetime incomemeasures, DSW find that indirect taxes have a slightly progressive distributionalpattern across all incomes. The BJ view can be critiqued on several grounds.150
Transfer benefits are not the only source of income that is partially indexed; manywage contracts are indexed, as are some pensions, and interest incomes also respondto higher inf lation rates induced by indirect tax rate hikes. Moreover, the fact thatsome transfer benefits (such as Canada Pension Plan, guaranteed income supple-ment, and old age security) are indexed ignores the fact that benefit levels aresubject to periodic legislative review, and any discretionary raises are likely to bediminished if there is indexation.
Another issue arising with the distributional analysis of indirect taxes relates togoods and services other than the final consumption of households. Some forms ofindirect taxes, such as provincial retail sales taxes (RSTs), fuel excises, and the federalmanufacturers’ sales tax that preceded the GST, apply to business intermediateinputs and investment goods. It has been estimated that more than one-third of thetotal revenues collected from RSTs arises from such business inputs. Value-addedtaxes such as the GST offer firms credits for their taxes paid on these inputs and arethus designed to apply solely to households’ final consumption. The burden of
148 Browning later applied differential tax incidence to argue that indirect taxes should be assignedto factor incomes and not transfer incomes, even abstracting from any indexation of transferpayments (see Edgar K. Browning, “Tax Incidence, Indirect Taxes, and Transfers” (1985) vol. 38,no. 4 National Tax Journal 525-33). This result followed from the standard assumption indifferential analysis that transfers and other public outlays should be held constant in real termswhen assessing the substitution of a sales tax for some other tax.
149 RVH use a middle-ground approach developed in Giuseppe C. Ruggeri, “On the Measurementof Sales Tax Incidence in the Presence of Transfers” (1993) vol. 48, no. 1 Public Finance 132-37,which assigns most of the indirect tax burden based on consumption, following the traditionalview, but subtracts the estimated compensation to recipients of indexed transfers. The BJapproach assumes that all transfer payments are fully indexed.
150 For further critique, see Dahlby, supra note 3, at 137; Vermaeten et al., supra note 61, at 365;and James B. Davies, “Tax Incidence: Annual and Lifetime Perspectives in the United States andCanada,” in Canada-U.S. Tax Comparisons, supra note 66, 151-88, at 180.
tax incidence, progressivity, and inequality in canada ■ 775
RSTs and some excises on business is typically assigned to the factors of production,based on the assumption that both exporters and import-competing firms are pricetakers at world prices.151 However, there are variants on how to proceed in assign-ing this burden. RVH split the burden equally between labour and capital, whileVGV take a more regressive view by assigning the indirect taxes paid by business tolabour, the more immobile factor of production. Most Canadian studies of taxdistribution take periods prior to the 1991 replacement of the federal manufactur-ers’ sales tax with the GST. There is some debate over how to allocate the shiftingburden of taxes on business investment arising with this policy change.152
A final issue for the incidence of indirect taxes is how to treat any associatedcompensation provisions for lower-income households. It is common for indirecttaxes to be structured to offer relief for households at lower incomes via differentialrates on various goods and services. For example, RSTs typically exempt items suchas groceries and residential rents; the GST offers zero-rating for groceries andexempts residential rents. These provisions are fully recognized in standard taxdistribution studies by allocating the actual indirect taxes paid by income class.However, additional compensation for indirect tax burdens is provided by the federalGST refundable tax credits for lower-income households (and credits for the preced-ing federal sales tax) and by the sales tax credits of some provinces. The question iswhether provisions of these kinds should be treated as transfer payments, andtherefore ignored in tax distribution studies, or whether they should be counted asoffsets to indirect taxes paid by households receiving the credits.153 Statistics Canadaclassifies such tax credits as part of the transfer system rather than the tax system(as in our tables 3, 4, and 6). In RVH’s study of the distribution of taxes and publicbenefits, they also classify the federal and provincial sales tax credits as transfers. Incontrast, VGV net out federal and provincial tax credits for sales tax from the indirecttax burdens of the beneficiaries; they similarly net out provincial property tax creditsagainst the property tax liabilities of the credit recipients. This approach seemspreferable, because the relief for lower-income payers of a tax can be providedthrough either an income-targeted tax credit or a relieving provision in the tax.
Property TaxesProperty taxes are the overwhelming source of tax revenues for municipal govern-ments, and two alternative views about their economic incidence have commonly
151 See Ruggeri and Bluck, supra note 30.
152 See Patrick Grady, “An Analysis of the Distributional Impact of the Goods and Services Tax”(1990) vol. 38, no. 3 Canadian Tax Journal 632-43; and W. Irwin Gillespie, “How To Create aTax Burden Where No Tax Burden Exists: A Critical Examination of Grady’s ‘An Analysis ofthe Distributional Impact of the Goods and Services Tax’” (1991) vol. 39, no. 4 Canadian TaxJournal 925-36.
153 Ruggeri and Bluck, supra note 30, at 371, assert that “[t]reating transfers as if they were anintegral component of the tax structure would yield misleading results for tax incidence because itwould assign to the tax structure effects which result from changes exogenous to the tax.”

776 ■ canadian tax journal / revue fiscale canadienne (2004) vol. 52, no 3
been used in tax distribution studies.154 Property taxes are levied on land andstructural improvements, whether residential, industrial, or commercial. Both ofthe views about property tax incidence agree that landowners bear the property taxon land owing to its immobility. Where the “traditional” and “new” views divergerelates to the incidence of property tax on structures, which are a form of capitaland thus subject to behavioural responses. In the traditional view, the property taxhas “excise” effects that shift the tax burden from the owners of structures to theconsumers of the structures’ services. The combined assumptions of a small openeconomy, internationally mobile capital, and immobile renters and consumers meansthat this part of the property tax operates like an excise tax on structures. The taxon structures is then borne by owner-occupants and owner-operators as well asrenters of housing; this part of the tax for commercial and industrial properties ispassed forward to consumers via higher product prices. Thus, the traditional viewyields a relatively regressive pattern of property tax incidence. This view is adoptedin the standard case of VGV and the “regressive” variant of RVH.
In the new view of property tax incidence, the tax on structures falls entirely onthe profits of capital owners. The underlying model for the new view assumes thatlabour and consumers are more mobile than structural capital, so that property taxchanges are ref lected in changes in the value of capital. Hence, the property tax onstructures is borne by the owners and falls on capital income. Because capital owner-ship is correlated with household income, the new view implies that the propertytax is progressive, contrary to the regressive pattern resulting in the traditional view.However, the “factor return” effects of the new view can also be considered jointlywith the excise effects of the traditional view, with the latter applying to tax ratedifferentials in nearby municipalities. The new view is adopted for property taxincidence in the “progressive” variants of VGV and RVH as well as the standard caseof DSW. In addition, the base case of RVH and a “regressive” variant of DSW useshifting assumptions intermediate between the new and traditional views; the taxon structures is borne half by renters and consumers and half by capital owners.
Corporate and Capital Income TaxesTaxes on capital income can be distinguished by who pays the bill: corporate incometax (CIT), paid directly by corporations; and PIT, paid by individuals on their capitalincomes, including dividends, interest, rents, capital gains, and profits from unin-corporated business.155 However, studies of tax incidence tend to make the sameincidence assumptions about both kinds of tax. Most analyses of capital income
154 For analysis of the alternative views on property tax incidence, see Peter Mieszkowksi, “TheProperty Tax: An Excise Tax or a Profits Tax?” (1972) vol. 1, no. 1 Journal of Public Economics73-96; Henry J. Aaron, Who Pays the Property Tax? A New View (Washington, DC: BrookingsInstitution, 1975); and Harry M. Kitchen, Property Taxation in Canada, Canadian Tax Paper no. 92(Toronto: Canadian Tax Foundation, 1992).
155 Property taxes also impinge on capital incomes from structures, plant, and equipment, but theirincidence analysis is treated separately.
tax incidence, progressivity, and inequality in canada ■ 777
tax incidence for Canada use a small open economy model in which capital movesfreely between countries. Hence, some of the tax can be shifted from the owners ofcapital to more immobile taxpayers and factors of production. In contrast, for themuch larger US economy, the Congressional Budget Office assumes that the CIT(like the PIT) falls entirely on households, allocated in proportion to their incomefrom interest, dividends, rents, and capital gains.156 For Canada, the portion of theCIT that cannot be shifted is the common world capital tax rate, which VGV assumeis the US tax rate; this portion is fully borne by owners of corporate income. VGVargue that the burden of the rest of the CIT is shifted either to immobile factors, suchas labour, or forward to consumers. VGV suggest that effective tax rates and averagecorporate tax burdens are similar for the two countries, so that the differential shiftedportion is zero. Thus VGV assume that the entire CIT is borne by owners of capitalincome, which makes the tax look progressive overall because of the income patternof capital income receipts. In contrast, RVH employ a less progressive approach,assuming that half of the CIT and PIT on capital income is borne by owners of capital,while the other half gets shifted forward to consumers. In both of these studies, theportion of capital that is held by foreign households is deducted from the incomebase; this accounts for 31 percent of the CIT. RVH also deduct the foreign tax creditfrom the domestic tax on capital.
One complication arising for CIT incidence is the degree of integration betweenthe CIT and the personal tax system. VGV argue that unless the Canadian CIT is fullyintegrated with the PIT, the theoretical shifting assumptions may be called intoquestion. A fully integrated CIT is one that results in all earnings generated throughcorporations being taxed at the PIT rate of the individual shareholder. Under a fullyintegrated CIT, a change in the CIT (and hence the PIT) rate will not cause movementof capital between the corporate and unincorporated sectors; this means that thecapital tax will be fully borne by capital owners, the standard assumption. However,if the CIT is not fully integrated, then a rise in the CIT rate will drive capital fromthe corporate to the unincorporated sector. The unincorporated sector will see itsafter-tax rate of return fall, thus bearing some of the CIT burden. The Canadian PITand CIT are less than fully integrated with dividend tax credits that are inadequateexcept for small Canadian-controlled corporations. VGV note that this differential ismore than offset by PIT provisions such as preferential tax on capital gains, resultingin a slight advantage for the corporate sector vis-à-vis the unincorporated sector.Indeed, VGV assume the difference to be zero in their incidence analysis, whichcould be a small potential source of error in their study.
The difference between annual and lifetime incidence calculations also affectsthe treatment of corporate and capital income taxes. DSW note that capital income,
156 The US Congressional Budget Office, supra note 48, at 25, notes that “Economists disagree onwhether people bear the [corporate] tax as shareholders in corporations, owners of all capitalassets, employees, or consumers.” Nevertheless it regards its assumption of full incidence on allowners of capital as the “dominant view.”
778 ■ canadian tax journal / revue fiscale canadienne (2004) vol. 52, no 3
although important in annual incidence calculations, is not part of a household’sdiscounted lifetime income. Capital income simply ref lects a choice between con-suming now and consuming later in life. Hence, if capital income does not belongin a lifetime income base, how does the researcher assign the burden of capitalincome taxes? Rather than focusing on capital-owning households, DSW assign theburden of these taxes to families that defer consumption—namely, savers. This isdistributed via the discounted value of all investment income received over thelifetime. Their justification is that capital taxes have a sources-side impact and auses-side impact. On the uses side, capital taxes reduce the net interest rate to savers,which increases the price of future consumption. The taxes thus hurt savers andbenefit consumers. On the sources side, the lower after-tax interest rate lowers therelative discounted incomes of those who receive income later in life, again hurtingsavers. (In contrast, annual incidence calculations assume only a sources-side impactof capital taxes.) Because the amount of consumption that a family forgoes as a resultof capital taxes equals the reduction in current investment income, discountedlifetime investment income is the appropriate distributive series.157 Estimates of life-time incidence of the CIT show less progressivity than annual calculations, which isconsistent with DSW’s other findings. DSW also consider alternative shifting assump-tions, such as a “regressive” variant that shifts half of the CIT to consumer outlays,and they find a less progressive lifetime incidence, as expected.
Another difference in the treatment of capital income between studies usingannual and lifetime incidence arises from life-cycle effects. As Fullerton and Rogers158
find, the ratio of capital income to income is U-shaped when households are catego-rized by annual income. This result stems from the large number of retirees whohave low annual income predominantly coming from savings. Thus annual inci-dence analyses may find some regressivity of the capital tax across lower incomeranges, although the capital income tax’s putative goal is to redistribute from morewealthy to less wealthy households. On the other hand, Fullerton and Rogers findthat lifetime incidence calculations do not exhibit this result; lifetime-rich house-holds tend to have higher lifetime capital-labour income ratios, so that they do endup bearing more of the burden of the capital tax. Whether this is a significantproblem in the PIT is unclear because of the age and capital income exemptionsthat may relieve the burden faced by these low-income groups. Because of the desireto smooth consumption over their lifetimes, households whose peak incomes ariseearlier in life have to save more and thus bear more of the capital tax burden.Fullerton and Rogers estimate lifetime wage profiles separately by lifetime incomegroups and find that those at high lifetime earnings peak relatively early in life. Forthat reason, those with high lifetime incomes will be subject to more capitalincome taxation.
157 Of course, this assumes that tax rates are strictly proportional.
158 Supra note 6.
tax incidence, progressivity, and inequality in canada ■ 779
Tax ExpendituresVarious features in each type of tax—such as deductions, exclusions, credits, anddeferrals—represent departures from a broad base taxed at a consistent rate. Theserelief and incentive provisions are commonly designated as “tax expenditures.”Their effects on the distributional pattern of taxes are of obvious interest and havebeen examined for Canada159 and other countries.160 Some provisions operate toreduce the effective progressivity of the PIT or to reduce the regressivity of indirecttaxes.161 However, most research to date has assumed that the full benefit of eachtax expenditure provision is reaped by the individual tax filer making the claim.162
In fact, market responses may work to shift some or all of the benefit of a taxexpenditure provision to parties other than the direct taxpayer. For example, a PITdeduction or exclusion related to the costs of or return from owner-occupiedhousing will increase households’ demand for housing and may thereby raise itsmarket price. The benefits of the tax expenditure are thereby shifted from thetaxpayers who use the provision in the first instance to owners of capital or landmore generally. Similarly, an exemption of food or other “necessities” from a salestax may raise the equilibrium market price in that product market, thereby partiallyoffsetting the gains to taxpayers and shifting them to capital owners or workers inthe producer industries. A tax exemption for particular goods that is restricted tosome households could leave them with a net benefit but impose burdens on otherconsumers of the goods not eligible for exempt purchases.
A D D I T I O N A L I S S U E S A N D
R E S E A R C H P R I O R I T I E S
Our review of studies on the distributional impacts of taxes, which has focused onmethodological issues and findings relevant to Canada, suggests directions forfuture research. First, almost all studies of the Canadian tax system are now quitedated, relying on data sets from the 1970s and 1980s. Few capture the major PITreforms in Canada of 1988, the adoption of the GST in 1991, or the increasing use
159 See Jonathan R. Kesselman, “Non-Business Deductions and Tax Expenditures in Canada:Aggregates and Distributions” (1977) vol. 25, no. 2 Canadian Tax Journal 160-79; and FranceSt-Hilaire, “For Whom the Tax Breaks” (1996) vol. 2, no. 2 Choices 1-47. The Department ofFinance publishes periodic tax expenditure accounts that report the estimated aggregaterevenue loss from each provision, but no distributional breakdowns are reported: Canada,Department of Finance, Tax Expenditures and Evaluations 2003 (Ottawa: Department ofFinance, 2003).
160 Ervik, supra note 76.
161 The earlier cited INEQ study by Wagstaff and Van Doorslaer, supra note 94, examined theextent to which total deductions in the PIT of several countries worked to increase or decreasethe redistributive effect.
162 One exception is Stabile’s analysis of incidence of tax expenditures for health insurance: MarkStabile, “The Role of Tax Subsidies in the Market for Health Insurance” (2002) vol. 9, no. 1International Tax and Public Finance 33-50.
780 ■ canadian tax journal / revue fiscale canadienne (2004) vol. 52, no 3
of payroll taxes since 1990. None capture the move of provincial PITs to a tax-on-income basis and the associated f lattening of rate schedules beginning in 2001, northe federal and provincial PIT and CIT rate cuts in 2000 and beyond. Even withunchanged research methods, these tax changes are likely to affect the findingsbecause of how they alter the tax mix and the bases and rate structures of compo-nent taxes.163 Moreover, changes in our understanding of the economic incidenceof some taxes, such as the PIT and indirect taxes, and the possible change inincidence of taxes for the Canadian economy need to be incorporated in futureresearch. We examine those and several other issues in this section.
Theoretical and Empirical Analysis of Tax Shifting
The shifting or incidence of component taxes is a crucial underpinning of INEQand FINC studies.164 Even if we assume a closed national economy, the incidence ofa national PIT and subnational PITs and payroll taxes is not fully resolved. Giventhe relative magnitude of the PIT and its role as the leading progressive componentof the entire revenue system, the distributional burden of this tax warrants highpriority for further theoretical and empirical research. Our preceding review indi-cated several lines of inquiry that could be pursued further, and it would be usefulto employ Canadian data and tax institutions. Moreover, a vital item of research isthe distributional effects of subnational taxes, because study has been limited for theUnited States and absent for Canada. One might expect that linguistic and culturalbarriers to internal migration would enter the analysis, since Quebec traditionallyhas had the highest provincial tax burden and the Atlantic provinces the highestsales and income tax rates. Moreover, the shift by the provinces from PIT based onfederal tax to a tax-on-income approach beginning in 2001 has greatly relieved theconstraints for provincial tax progressivity to mirror federal progressivity. Someprovinces have f lattened their tax rate schedules, with Alberta’s single-rate taxbeing the polar case. Based on the analysis in Feldstein and Wrobel,165 it is differ-ences in subnational tax progressivity (not the degree of rate progressivity per se)that undermine effective progressivity of taxes applied at that level.166
163 Davies, supra note 150, uses these three dimensions of tax policy to compare Canadian and UStax incidence. He also assumes that the incidence of each tax is similar in Canada and theUnited States because of their similar overall tax mixes, despite the greater openness and muchsmaller size of the Canadian economy.
164 In CGE studies the incidence of taxes is determined by the modelling structure and parametervalues, but the related economic assumptions are still open to debate.
165 Supra note 130.
166 One can imagine a nation with perfect labour mobility between its two states, changing fromidentical state PIT rate schedules with moderate progressivity to one slightly reducing itsprogressivity and the other sharply increasing its progressivity. Naïvely measured, aggregatetax progressivity will increase, but effective progressivity (after shifting of the tax) will decreaseowing to the out-migration of skilled workers from and resultant rise in their gross wages inthe sharply progressive state.
tax incidence, progressivity, and inequality in canada ■ 781
Recognizing that Canada is a small open economy with international mobilitythat is high for capital, significant for highly skilled labour, and limited for mostoccupations adds further insights to the incidence analysis. The effective progres-sivity of the PIT may be attenuated for Canada, especially with respect to the highestearnings brackets, in a way that does not arise for a larger economy. Although thisissue has been addressed in a few studies on Canada-US migration and the determi-nants of “brain drain,” it is still unknown how far this process undermines theeffective progressivity of Canada’s federal PIT. The numbers migrating to the UnitedStates have been estimated as quite moderate, but as noted before in the provincialtax context, it may not require large-scale movement of workers to induce signifi-cant tax shifting. Nevertheless, informal observations of relative gross pay forprofessional, skilled, and managerial workers in the two countries suggests that anydiminution of effective progressivity of the Canadian PIT has been limited. Care-fully designed research may provide more definitive conclusions. Moreover, theincidence of taxes on corporate and capital incomes will be affected by provisionsfor foreign tax credits, bilateral tax treaties, the definitions of tax residence, andmobility of capital owners as well as legal structures for moving assets outside theircountry of tax residence. Studies of the integrating European economies and theo-retical analyses of the impacts on redistributive tax and transfer policies of factormobility across borders167 may provide useful insights for Canada.
Another aspect of tax incidence that has been neglected in research to daterelates to the upper tail of the income distribution—the top few percentiles. PITsand (likely) CITs are paid disproportionately by very high earners, and having asound economic understanding of their behaviour is a prerequisite for assessing theshifting of their taxes. Many top earners derive their income as proprietors, owners,or entrepreneurs of very successful businesses, which combine their labour, abili-ties, and financial capital. Standard economic analysis of this phenomenon dividestheir returns into capital and labour components; the analysis relates capital-basedtaxes to the capital component and labour-based taxes to the implicit labour return.However, a highly prosperous business involves the application of labour-like skillsto give capital a rate of return far above the normal rate. Although the excessreturn could be attributed entirely to the labour, the labour alone without access tofinancial capital (or retained earnings of the business) would not generate theextraordinary return. Hence, the underlying economic behaviour needs to be prop-erly modelled in order to provide a basis for estimating the incidence of personal orcorporate taxes on the combined return to labour and capital.
Annual Versus Lifetime Measures and Data Needs
Lifetime measures of tax incidence or progressivity offer advantages over annualmeasures in that they avoid the confounding effects of life-cycle and annual income
167 See David E. Wildasin “Factor Mobility and Fiscal Policy in the EU: Issues and AnalyticalApproaches” (2000) vol. 15, no. 31 Economic Policy 337-78, and sources therein.
782 ■ canadian tax journal / revue fiscale canadienne (2004) vol. 52, no 3
f luctuations. However, the simulation of lifetime incomes and taxes undertaken byCGE and a few FINC studies has significant limitations in terms of the underlyingmodels. It would be useful to undertake tax incidence research using methods thatavoid these hazards and are better grounded in actual data sets. One such methodwould be to pursue FINC studies on groups disaggregated by life-cycle cohorts andthen to apply adjustments based on aggregate data to ref lect characteristic savingsand spending patterns of each cohort. Another method would minimize the impactof year-to-year variations in individual incomes by taking multi-year averages. Thedevelopment over the past decade of a Canadian longitudinal data set, from theSurvey of Labour and Income Dynamics (SLID), should facilitate this exercise. Eachpanel of respondents is included in the survey for a six-year period, with the firstintake in 1993, a period sufficiently long to smooth the effects of temporary shocksto labour, business, and investment incomes.168 Hence, a measure of the tax unit’spermanent income can be obtained for use in the tax incidence analysis. It mightalso be feasible to combine the two methods sketched here, so as to remove theeffects of both inter-year and life-cycle income variations.
Horizontal Equity, Differential Tax Treatment, and Inequality
Existing tax distribution studies use a measure of market, pre-fisc, or post-fiscincome, in some cases with various imputations, as the index of well-being forindividuals or households. Thus, tax provisions that differentiate the tax liabilitiesfor units with the same measured level of taxpaying ability typically reduce the esti-mated equalizing effects of the tax system. A few of the studies169 attempt to estimateseparately such horizontal inequity and re-ranking effects to see how they offsetthe vertical redistribution effects of taxes. However, many tax provisions that applydifferential treatment for units with the same measured taxpaying ability are in factdesigned to augment horizontal equity.170 These provisions recognize characteristicsof taxpayers—such as disabilities, medical costs, high living costs in remote locales,moving costs, age, or dependants—that affect well-being or taxpaying ability for agiven level of measured income. For these reasons, such tax provisions actually work to
168 To the extent that the samples underrepresent households with very low or temporarily verylow incomes, there may be hazards in using the SLID data set, as suggested by Frechette et al.,supra note 75.
169 For example, Wagstaff et al., supra note 27.
170 Robert I. Lerman and Shlomo Yitzhaki, “Changing Ranks and the Inequality Impacts of Taxesand Transfers” (1995) vol. 48, no. 1 National Tax Journal 45-59, recognize that re-ranking mayimprove equity by unscrambling an “unfair” pre-tax ranking of households to reflect othercharacteristics relevant to well-being. For the analytics of dealing with differences in characteristicsand measuring horizontal inequities, see Lambert, supra note 15, at 183-86; Aronson andLambert, supra note 46; and Aronson et al., supra note 27. See Julian Le Grand, “Equity, Well-Being, and Economic Choice: A Review of Horizontal Equity, Uncertainty and EconomicWell-Being” (1987) vol. 22, no. 3 The Journal of Human Resources 429-40, for careful discussionof the broader issues around the horizontal equity concept.
tax incidence, progressivity, and inequality in canada ■ 783
improve the horizontally equitable treatment of taxpayers, whereas they are meas-ured in these studies as muting the vertical redistribution of the tax system and insome studies as creating horizontal inequities. Future studies should take care torecognize this fact and make adjustments in the index of well-being that parallelthe tax provisions aimed at this goal.
Tax Evasion and Distributional Effects
Research on distribution of the tax burden surveyed here has implicitly assumedfull compliance to all taxes and full reporting of all incomes. There is a muchsmaller body of research on the distributional effects of non-compliance to taxes.171
Neither theoretical nor empirical work to date offers strong conclusions as to whethernon-compliance exerts a progressive or regressive impact on tax incidence.172 Thelimited evidence focuses on evasion of the PIT, using data from the US TaxpayerCompliance Measurement Program, which applies intensive audits to a sample oftaxpayers to uncover unreported incomes and unjustified deductions. In this way itis possible to distinguish among the PIT’s “apparent progressivity,” its “actualprogressivity,” and its “post-audit progressivity.” Apparent progressivity is thatmeasured using standard tax or survey data as reported by individual tax filers, similarto the studies covered here. Actual progressivity is what can be computed based ontax liabilities reported on unaudited returns and on actual incomes, including thosereported plus those discovered on audit. Post-audit progressivity ref lects the totaltaxes due based on the levels of income established by audit; hence it captures theintended progressivity of the PIT.173 The discrepancy between actual and apparentprogressivity ref lects the bias arising from measures that fail to account for taxnon-compliance. Using measures of residual and liability progression, Bishop et al.estimate that non-compliance exerted little effect on vertical equity in the UnitedStates from 1979 to 1985.174
Another aspect of non-compliance relates to the economic incidence of taxevasion behaviour. Those who benefit from such activity may differ from those
171 See John A. Bishop, K. Victor Chow, John P. Formby, and Chih-Chih Ho, “The RedistributiveEffects of Non-Compliance and Tax Evasion in the US,” in John Creedy, ed., Taxation, Povertyand Income Distribution (Aldershot, UK: Edward Elgar, 1994), 17-27 for sources.
172 Herb J. Schuetze, “Profiles of Tax Non-Compliance Among the Self-Employed in Canada:1969 to 1992” (2002) vol. 28, no. 2 Canadian Public Policy 219-38, estimates rates of tax non-compliance for the self-employed in Canada differentiated by head’s education and occupationbut does not examine how non-compliance varies across income levels.
173 Of course, even the intensive audits of the Taxpayer Compliance Measurement Program willnot uncover all evasion by filers, and so-called ghosts who evade taxes by non-filing andconcealing their existence will also be omitted.
174 Supra note 171. The only exception was for the bottom decile in 1985 with liability progression,where actual progression exceeded apparent progression; the difference was statisticallysignificant but very small.
784 ■ canadian tax journal / revue fiscale canadienne (2004) vol. 52, no 3
who engage in it. Kesselman175 develops a general equilibrium model of income taxevasion involving separate markets for the production of tax-compliant and tax-evading goods and services. The extent to which the benefits of evasion accrue tothe evading workers vis-à-vis their consumers hinges upon two key behaviouralparameters—the elasticity of substitution in consumption between the two types ofproducts and workers’ elasticity of movement between the two sectors.176 If bothelasticities are infinite, thus removing all frictions to the f low of resources betweenthe two sectors, all the benefits of evasion accrue to consumers of output from theevading sector and none to the evaders themselves. Where sales taxes are being evaded,the benefits may similarly be captured by the evading producer or seller (collectinga tax-inclusive price but remitting nothing to the government) or shifted in part orfully to the purchaser. By offering the customer a transaction free of sales tax, thevendor may induce a cash payment that then eases the task of evading income taxon the activity. Moreover, successfully evading the PIT may require consistentlyevading any associated sales tax.177
Tax Avoidance and High Earners
For legal avoidance of taxes using preferentially taxed or tax-free assets, the taxbenefits may be shifted to parties other than the tax avoider. If the tax-preferredasset is in short supply, it will be held solely by top-bracket taxpayers, and its grossrate of return will fall to yield a net rate of return equalized with that of taxableassets held by that group. In equilibrium the tax avoiders will gain nothing fromholding the tax-preferred asset, but both their taxes and reported capital incomeswill be reduced such that measured tax progressivity will be understated. If the tax-preferred asset is in greater supply, it will be held by taxpayers in lower marginalbrackets as well, and its gross rate of return will fall less, yielding a gain for top-bracket holders of the asset. This case reduces the effective progressivity of the PIT;it has been said that “[f ]or the rich . . . the best tax shelters are those that arepatronized by the poor.”178 There has been limited economic modelling of thedistributional effects of tax avoidance arising through capital market adjustments179
and growing research on the tax-induced portfolio patterns of various income
175 Jonathan R. Kesselman, “Income Tax Evasion: An Intersectoral Analysis” (1989) vol. 38, no. 2Journal of Public Economics 137-82.
176 The original analysis is framed in terms of the elasticity of evasion costs for the marginal entrantto the evading sector rather than workers’ elasticity of movement between the two sectors.
177 See Jonathan R. Kesselman, “Evasion Effects of Changing the Tax Mix” (1993) vol. 69, no. 205The Economic Record 131-48.
178 Boris I. Bittker, “Equity, Efficiency, and Income Tax Theory: Do Misallocations Drive OutInequities?” in Henry J. Aaron and Michael J. Boskin, eds., The Economics of Taxation(Washington, DC: Brookings Institution, 1980), 19-31, at 28.
179 See the studies in Martin S. Feldstein, ed., Behavioral Simulation Methods in Tax Policy Analysis(Chicago: University of Chicago Press for the National Bureau of Economic Research, 1983).
tax incidence, progressivity, and inequality in canada ■ 785
groups.180 However, these lines of analysis have not been linked to distributionstudies of the types surveyed here. This phenomenon is central in understandingtax progressivity for top income groups, which generate a disproportionate shareof PIT revenues. Some analysis has been undertaken for top taxpayers in the UnitedStates,181 but there has been nothing comparable for Canada.182
Yet another body of tax avoidance research carries implications for incomedistribution. Studies of the response of taxable income to tax rate changes ref lectboth “real” responses (such as labour supply) and income reporting responses(various forms of tax planning such as the timing or form of income). Even if theimposition of higher tax rates simply transforms some income to non-taxed forms,it may distort the measure of total income. If the response of taxable income variesby the income level of taxpayers, the measures of tax progressivity will be biased.Two Canadian studies of this genre have found a strong income tilt to the taxableincome response. Gagné et al.183 examined 1972 to 1996 and subperiods withprovincially grouped data for three middle- to high-income groups. They foundlarge responses of total reported income to tax rates for high earners ($100,000 to$150,000 in 1995 dollars), especially for 1988-1996. For their top income group(above $150,000) the estimated absolute elasticity exceeded unity, suggesting thattax rate cuts at the top end would increase revenues. However, given their researchdesign, this result may ref lect interprovincial shifting of tax revenues rather thanan increase for the nation as a whole.184 Sillamaa and Veall185 studied Canada’s 1988tax-rate-f lattening reforms using a micro-level national panel data set. They esti-mated the overall tax-price elasticity of taxable income to be a comparatively smallminus 0.25. They obtained larger elasticity estimates for self-employment income
180 See John Karl Scholtz, “Tax Progessivity and Household Portfolios: Descriptive Evidence fromthe Surveys of Consumer Finances,” in Joel B. Slemrod, ed., Tax Progressivity and IncomeInequality (Cambridge, UK: Cambridge University Press, 1994), 219-67, and sources therein.
181 See the studies in Tax Progressivity and Income Inequality, supra note 180; and Joel B. Slemrod,ed., Does Atlas Shrug? The Economic Consequences of Taxing the Rich (Cambridge, MA and NewYork: Harvard University Press and the Russell Sage Foundation, 2000).
182 A recent study by Emmanuel Saez and Michael R. Veall, The Evolution of High Incomes inCanada, 1920-2000, NBER Working Paper no. 9607 (Cambridge, MA: National Bureau ofEconomic Research, April 2003), uses Canadian income tax return data to produce a longhistorical series on the concentration of incomes in the very highest fractiles. Although they donot directly assess tax avoidance, the authors infer by comparison with US experience thatincreasing Canadian income concentration at the top cannot be explained by tax cuts.
183 Robert Gagné, Jean-François Nadeau, and François Vaillancourt, Taxpayers’ Response to Tax RateChanges: A Canadian Panel Study, CIRANO Scientific Series 2000s-59 (Montreal: Centre forInteruniversity Research and Analysis on Organizations, 2000).
184 This situation could parallel the earlier-cited Feldstein-Wrobel (supra note 130) finding of tax-induced interstate mobility of workers and tax bases.
185 Mary-Anne Sillamaa and Michael R. Veall, “The Effect of Marginal Tax Rates on TaxableIncome: A Panel Study of the 1988 Tax Flattening in Canada” (2001) vol. 80, no. 3 Journal ofPublic Economics 341-56.
786 ■ canadian tax journal / revue fiscale canadienne (2004) vol. 52, no 3
and for the labour income of seniors. When restricting the sample to higherincomes (above $60,000 in 1986 dollars), they estimated absolute elasticity values ofunity or larger. This finding suggests that the true economic incomes of high incomegroups are substantially understated in tax data and perhaps also in survey data.186
T A X P O L I C Y I N F E R E N C E S
The research literature on the distributional effects of taxes is large, diverse, andinconclusive in many ways. Any inferences that can be drawn for the direction ofCanadian tax policies to reduce inequality must be highly qualified.187 The mostsalient finding is that the PIT plays a key role in the progressivity of the overall taxsystem, which contains many taxes that are more nearly proportional or outrightregressive. This result is robust to the use of annual or lifetime perspectives.However, this finding is subject to challenge by several lines of economic analysisconcerning the incidence of personal taxes. At best the personal tax is less progressivethan the most commonly used naïve assumption of no shifting, and this reductionin effective progressivity is likely more pronounced at the level of provincial thanfederal taxes. If the personal tax is less progressive than commonly assumed andmeasured, this can be interpreted in two alternative ways. For those desiring moreinequality reduction, regardless of any attendant economic costs, the statutory rateprogressivity of the personal tax would need to be further steepened or its baseexpanded in progressive fashion. For those more concerned about economic effi-ciency and growth, this finding would counsel moderating the steepness of rateschedules, since society is achieving less effective tax progressivity for a giveneconomic cost than previously believed.188
A common theme in the prescriptions of tax economists is a call for shifting thetax system away from income bases and further toward consumption-type bases.The main objective of this change is to improve the economy’s efficiency and growthrate by making the tax system more neutral vis-à-vis savings, investment, andcapital. If one is also concerned about the distributional dimension, this has furtherpolicy implications since this change would affect most heavily individuals withhigh earnings and wealth.189 First, any move toward a consumption base should be
186 One common example of how this effect can arise is the deferral of sale on assets that havesubstantial accruing gains, which should be counted as part of income.
187 The discussion in this section mirrors some of the policy prescriptions in Kesselman, “TaxDesign for a Northern Tiger,” supra note 136.
188 An earlier version of this study ( Jonathan R. Kesselman and Ron Cheung, Taxation, Progressivity,and Inequality in Canada, Department of Economics Working Paper (Vancouver: University ofBritish Columbia, Department of Economics, July 2003)) provides a brief review of the evidencethat finds more progressive tax rate schedules to be economically costly.
189 The great majority of Canadian taxpayers are already treated on a consumption basis by thepersonal tax owing to provisions for registered savings and the non-taxation of capital gains onhomes.
tax incidence, progressivity, and inequality in canada ■ 787
pursued through changing the personal tax base, since progressive rates can beapplied in the personal tax, rather than by shifting the tax mix toward greater relianceon indirect consumption taxes. The evidence is that indirect taxes are regressive,albeit more so in an annual than in a lifetime perspective. Second, in reforming thepersonal tax toward a consumption base, it is important to use transitional methodsthat do not provide a windfall for holders of savings and wealth at the time of thechange, but rather to shelter incremental savings generated from labour earningsafter the change.190 Regardless, a shift of the tax base toward consumption wouldcarry some unavoidable reduction in effective tax progressivity, even in a lifetimeview, unless rate schedules were steepened.
A related question is how tax policies that shift the base toward consumption topromote economic growth would affect the distribution of pre-tax earnings. Accord-ing to conventional economic findings, increasing the economy’s capital stock wouldtend to increase inequalities between skilled and unskilled labour.191 This effectcould arise either through the complementarity between capital and skilled labouror through skill-biased technology embodied in new capital. Thus the increasedinequality of market incomes would compound with the reduced equalization fromthe reformed tax system to increase the inequality of net incomes. However, a recentdevelopment in modelling and estimating the causes of inequality suggests a verydifferent conclusion.192 If an increased capital stock affects the choice of techniquesby industry, it may push disproportionately more capital into the sectors that employless-skilled labour intensively. This effect will raise the productivity of labour andwages in both sectors but will be relatively more favourable to unskilled labour,thus reducing the inequality of market earnings. Consequently, tax policies thatshift toward consumption could in the long run reduce pre-tax earnings, perhapsto a sufficient extent to offset any initial diminution in tax progressivity. This strategycould also mitigate inequality by reducing the long-run returns to capital owners,though this effect would be muted for the open Canadian economy with highinternational mobility of capital.
Another tax policy implication of this literature is a need to differentiate betweenfederal and provincial policies in terms of their effective progressivity. Because ofthe much greater interregional than international mobility of labour, one would
190 This design issue is discussed in Kesselman, “Tax Design for a Northern Tiger,” supra note 136;and Jonathan R. Kesselman and Finn Poschmann, “Expanding the Recognition of PersonalSavings in the Canadian Tax System” (2001) vol. 49, no. 1 Canadian Tax Journal 40-101.
191 For example, Kevin M. Murphy, W. Craig Riddell, and Paul M. Romer, “Wages, Skills, andTechnology in the United States and Canada,” in Elhanan Helpman, ed., General PurposeTechnologies and Economic Growth (Cambridge, MA: MIT Press, 1998), 283-309.
192 See Paul Beaudry and David A. Green, What Is Driving US and Canadian Wages: ExogenousTechnical Change or Endogenous Choice of Technique? NBER Working Paper no. 6853(Cambridge, MA: National Bureau of Economic Research, December 1998); and Paul Beaudryand David A. Green, “Wages and Employment in the United States and Germany: WhatExplains the Differences?” (2003) vol. 93, no. 3 The American Economic Review 573-602.
788 ■ canadian tax journal / revue fiscale canadienne (2004) vol. 52, no 3
expect redistributive policies to be weakened much more at the provincial than thefederal level. Provinces that seek to have more progressive tax policies than else-where will lose some of their higher earners and thereby push up the gross wagesof skilled labour. Thus, the effective burden of those higher taxes gets shifted to theindustries that employ them, in turn shrinking the high-value-added sectors of theprovinces seeking more progressive policies. These observations apply with respectto both the progressivity of personal taxes and the overall tax burden (includingpayroll, sales, and property taxes) relative to the value of public services supplied.In the Canadian context, this effect may be restrained by factors that inhibitmobility of skilled labour even when heavily taxed: Quebec’s linguistic distinctness,Ontario’s economic rents for top earners in certain industries, and Atlantic Canadi-ans’ regional preferences. Nevertheless, any remaining restraint on redistributionat the provincial level may warrant more progressive tax and expenditure policies atthe federal level.
Taxes on corporate income and capital as well as other business taxes such asproperty taxes on land, structures, and equipment are popular on account of thebelief that they are paid by the owners of capital. In fact the incidence of thesetaxes is disputed among economists, with some assigning their burden entirely tocapital owners, some splitting it between capital and consumption, and others seeinga part of it shifted to labour. With Canada’s highly open economy and capitalmobility, it is reasonable to assume that business taxes at rates that equal foreignrates will be borne by capital but that any higher rates will be shifted onto rela-tively immobile factors such as workers and consumers. Because of these effects,corporate and business taxes are better viewed as instruments for promoting growthof the economy, productivity, jobs, and real wages than as direct instruments forinequality reduction. Additionally, one needs to recognize that CITs on many smalland medium-sized businesses bear on both capital incomes and labour earnings ofowner-proprietors who do not take their returns in the form of salaries. Hence, taxprovisions that favour smaller businesses, including lower corporate tax rates andthe lifetime capital gains exemption, may exert significantly regressive effects withrespect to some of the highest earners.
A final important implication of the research literature for the inequality effectsof taxes is that the size of the tax bite matters as much as its progressivity.193 Even ifthe tax system ref lects a pattern of tax rates that is only moderately progressive, itcan be substantially redistributive if the overall tax level is high.194 Moreover, the
193 This point was encapsulated in the Reynolds-Smolensky (supra note 40) redistributive index ofprogressivity, which is the product of the Kakwani (supra note 36) progressivity index (the degreeto which the tax system departs from proportionality) and a term ref lecting the aggregate ATR.
194 Economic research has produced mixed but generally weak findings as to whether higher overalltax rates are adverse to economic growth, but it is widely agreed that a tax mix that bears heavilyon capital income, savings, and investment is much more adverse than a base of consumptionand labour incomes. See the assessment of the literature in Kesselman, “Flat Taxes, Dual Taxes,Smart Taxes,” supra note 136; and Kesselman, “Tax Design for a Northern Tiger,” ibid.

tax incidence, progressivity, and inequality in canada ■ 789
larger the tax revenues, the more potential this offers for redistributive policies onthe expenditure side of public budgets. Our examination of the inequality reductionfrom cash transfers found them to be more important than PITs for most groupsother than the highest earners. Public spending through in-kind goods and servicescan also play a major redistributive role, especially in areas such as health care andeducation. One can point to the experience of northern European countries, whichhave tax systems of relatively low progressivity—with heavy weights on regressivepayroll and sales taxes and with Scandinavian income taxes that have a progressivenational component combined with larger flat-rate local levies. Yet these countriesapply very high overall rates of taxation that enable them to finance generous socialprograms that are highly redistributive. Any assessment of the potential for usingtax policy to mitigate inequality in Canada must take a similarly holistic view of theproblem.