Embed Size (px)
Citation preview
RESEARCH ARTICLE Open Access
Dental expenditure, progressivity andhorizontal inequality in Chinese adults:based on the 4th National Oral HealthEpidemiology SurveyMeng Lin Cheng1†, Chun Xiao Wang2†, Xing Wang3, Xi Ping Feng4, Bao Jun Tai5, Yu De Hu6, Huan Cai Lin7,8,Bo Wang3, Shu Guo Zheng9, Xue Nan Liu9, Wen Sheng Rong9, Wei Jian Wang9, Yan Si9* and Tao Xu8*
Abstract
Background: The financial burden of oral diseases is a growing concern as the medical expenses rise worldwide. Theaim of this study was to investigate the dental expenditure, analyze its progressivity and horizontal inequality under thegeneral health finance and insurance system, and identify the key social determinants of the inequality for Chinese adults.
Methods: A secondary analysis used the data of 13,464 adults from the 4th National Oral Health Epidemiological Survey(NOHES) in China was undertaken. The dental expenditure was collected and divided into out-of-pocket and healthinsurance payments. Horizontal inequality index and Kakwani index were used to analyze the horizontal inequality andprogressivity, respectively. The decomposition model of the concentration index was set up to explore the associatedsocioeconomic determinants.
Results: The results showed that a mean dental expenditure per capita of Chinese adults was $20.55 (95% ConfidenceInterval-CI: 18.83,22.26). Among those who actually used dental service, the cost was $100.95 (95%CI: 93.22,108.68). Over90% of dental spending was due to out-of-pocket expenses. For self-reported oral health, the horizontal inequality indexwas − 0.1391 and for the decayed tooth (DT), it was − 0.2252. For out-of-pocket payment, the Kakwani index was − 0.3154and for health insurance payment it was − 0.1598. Income, residential location, educational attainment, oral hygienepractice, self-reported oral health, age difference were the main contributors to the inequality of dental expenditure.
(Continued on next page)
© The Author(s). 2020 Open Access This article is licensed under a Creative Commons Attribution 4.0 International License,which permits use, sharing, adaptation, distribution and reproduction in any medium or format, as long as you giveappropriate credit to the original author(s) and the source, provide a link to the Creative Commons licence, and indicate ifchanges were made. The images or other third party material in this article are included in the article's Creative Commonslicence, unless indicated otherwise in a credit line to the material. If material is not included in the article's Creative Commonslicence and your intended use is not permitted by statutory regulation or exceeds the permitted use, you will need to obtainpermission directly from the copyright holder. To view a copy of this licence, visit http://creativecommons.org/licenses/by/4.0/.The Creative Commons Public Domain Dedication waiver (http://creativecommons.org/publicdomain/zero/1.0/) applies to thedata made available in this article, unless otherwise stated in a credit line to the data.
* Correspondence: [email protected]; [email protected]†Meng Lin CHENG and Chun Xiao WANG co-first authors9Department of Preventive Dentistry, Peking University School and Hospitalof Stomatology, National Engineering Laboratory for Digital and MaterialTechnology of Stomatology, Beijing Key Laboratory of Digital Stomatology,Beijing, China8Guangdong Provincial Key Laboratory of Stomatology, Guangzhou, ChinaFull list of author information is available at the end of the article
Cheng et al. BMC Oral Health (2020) 20:137 https://doi.org/10.1186/s12903-020-01128-0
(Continued from previous page)
Conclusion: Dental expenditure for Chinese adults was at a lower level due to underutilization. The ratio of payments ofdental expenditure and utilization was disproportional, whether it was out-of-pocket or insurance payment. Individualswho were more in need of oral care showed less demand for service or not required service in time. For future policymaking on oral health, it is worth the effort to further promote the awareness of the importance of oral health andutilization of dental service.
Keywords: Dental expenditure, Horizontal inequality, Kakwani index, Decomposition of concentration index,Socioeconomic determinants
BackgroundThe financial burden of oral diseases is a growing con-cern as the medical fee rise worldwide. The WorldHealth Organization (WHO) reported that the treatmentof oral diseases was the 4th expense in most industrialcountries [1]. In the latest research on the global burdenof diseases, oral diseases affect the lives of 3.5 billionpeople worldwide and become a global public challenge[2, 3]. An up-to-date economic estimation claimed thatdirect treatment costs due to dental diseases worldwidewere estimated at 298 billion US dollars (USD) yearly,corresponding to an average of 4.6% of global health ex-penditure [4]. Another study demonstrated that severeteeth loss was found to imply 67% of losses of globalproductivity, followed by severe periodontitis (21%) anduntreated caries (12%) [5].Significant inequalities exist in oral health, such as oral
health condition, utilization of services and unbalancedexpenditures distribution among populations. Low socio-economic status was found associated with severe cariesand less utilization of dental services [6, 7]. Social anddemographic factors affect the use of dental services, bothdirectly and through insurance participation [8]. Incomeinequality is a potential influence in both social status andutilization of oral health [9]. Dentistry is often unafford-able and/or unavailable, particularly for those in the poorrural areas in the low- or middle-income countries [10].From 2009, the Chinese government deepened the
reform of the medical health care system in whichthe basic medical health insurance structurally cov-ered 90% of people [11]. However, most of them arenot covered for oral diseases and over 85% of dentalexpenditure are out-of-pocket payments [12]. It is im-perative to further analyze and improve the currentsituation in order to provide equality in health careincluding oral health.In the previous NOHES in China, the income-related
inequality in oral health was not evaluated [13]. The 4thNOHES conducted in 2015–2016 firstly surveyed thissubject to provide information for the future develop-ment of oral health-related policies.This study mainly used the data from the 4th
NOHES for secondary analysis aiming to describe the
dental expenditure, analyze its progressivity and hori-zontal inequality, and identify the relevant social de-terminants for oral health for Chinese adults such asincome or health insurance.
MethodsData sourcesThe 4th NOHES in China was a pathfinding survey used amultistage, random, stratified, equal volume samplingmethod. Groups of 35–44 years old and 65–74 years oldadults were selected representing young adults and the eld-erly under the WHO guideline. A 55–65 years old groupwas additionally investigated to know more about themiddle-aged. All 13,464 participants were included as a rep-resentative sample of Chinese adults. The detailed samplingmethods can be found in the series of publications [14].Based on the 5th edition of the WHO Oral Health Survey[15], oral health examination and oral health-related ques-tionnaires were conducted. The 6th Census statistics datafrom the National Bureau of Statistics online [16] was usedto computed the weight based on the sample’s province,residential location (urban or rural area), age and gender inorder to obtain an unbiased estimation [17, 18].Ethical approval (Approval No: 2014–003) for the
study was received from the Ethics Committee ofChinese Stomatological Association and informed con-sent was obtained.
Expenditure estimation and distribution of healthinsuranceThe questions for dental expenditure and out-of-pocketpayment were given as “How much have you paid for adental visit last year?” and “What was the self-paid ratioin the above dental expenditure?” The health insurancepayment was calculated as the difference between totalexpenditure and out-of-pocket payment. Informationlike household income and expenditure was avoided be-cause of privacy concerns, the demographic and socio-economic characteristics of these 15.5% participants whodid not report the two key information were unbalancedwith the total population, missing values of key variableswere filled by medians. Dental expenditure incurredwhen participants used dental service. Only 2740 people
Cheng et al. BMC Oral Health (2020) 20:137 Page 2 of 10
of the total 13,464 participants used dental services in thepast year and the expenditures of these two populationswere both estimated. The expenditure was converted ac-cording to the 2016 Chinese Yuan (RMB) to the USD ex-change rate that 100USD was equivalent to 664.23RMB.According to the data from the National Bureau of Statis-tics, the medical expenditure per capita was equivalent to504.61USD (http://data.stats.gov.cn/easyquery.htm?cn=C01&zb=A0O0K&sj=2016) and the dental expenditure percapita as a proportion of it was roughly calculated.The basic medical insurance consists of urban employee
basic medical insurance (UEBMI), urban resident basicmedical insurance (URBMI) and new rural cooperativemedical care (NRCMC). Other health insurances includegovernment medical insurance for government officialsand private commercial health insurance, accounting for asmall proportion. The UEBMI is covered by urban em-ployees and has the highest reimbursement ratio and thehighest paid premiums. The URBMI and the NRCMC arecovered by urban and rural residents based on householdregistration, respectively. The URBMI has higher reim-bursement in hospitalization and outpatient treatment forsevere diseases than NRCMC. Among the public healthinsurance, many basic oral therapeutic services have beenincluded or adjusted in the catalog of basic medical insur-ance. However, the thresholds and reimbursement for dif-ferent types of insurance are different.
Horizontal inequality and progressivityThe inequality can be assessed through variation in in-teresting variables such as health needs, medical servicesand expenditure across quintiles of income [19]. In thehousehold income quintiles figure, participants aresorted by household income from poor to rich and di-vided evenly into five groups. As income increase, thechange of expenditure, oral health need, and dental ser-vice indicated whether inequality exists. And this figurewill give an intuitive, qualitative description of inequal-ity. Besides, a complete picture can be drawn by concen-tration curves. And the associated horizontal inequalityindex and Kakwani index are described as follows:The horizontal equality indicates that people with equal
health need to obtain equal medical care [20]. When theindex is negative and the concentration curve of medicalneed is above the concentration curve of medical care, theinequality is in favor of the rich [21]. In this case, poorpeople with more medical needs receive less medical care.The formula of horizontal inequality is:
HI ¼ CM−CN
The CM and the CN are the concentration indices formedical care and need, respectively. The formula ofthem are:
CM ¼ 1−2Z 1
0Lu xð Þdx
CN ¼ 1−2Z 1
0Ln xð Þdx
When people are sorted by the variable of ability to pay(ATP) from poor to rich, the cumulative proportion ofutilization graphs the concentration curve of medical care(Lu). As the utilization of dental service is treatment-oriented in China [22] d based on the behavior model ofAnderson [23], an evaluated health variable for objectiveneeds and the other subjective ones which reflect the de-mand for dental care should be considered at the evalu-ation of CN. Consider DT (Decayed teeth) reflected theunsatisfied primary dental need, it is used to be an evalu-ated need variable. Correspondingly, the self-reported oralhealth status represented the subjective medical need. Theself-reported oral health was an ordered five categoricalvariables in the questionnaire and higher ratings indicateworse self-perceived oral health. The two variables formtwo concentration curves for medical needs (Ln). The HIis twice the area of curves between the Lu and the Ln andrank from − 1 to 1.The vertical equality refers to a balanced proportion of
medical expenses against people’s ATP. A progressivepayment route means the extent to which medical ex-penditure rise as a proportion of people’s ATP when hisor her ATP rises. If it is converse, the payment is regres-sive. If people with different income levels have the sameratio of their medical expenses to their ATP, it is be-lieved that the funding is balanced [21].The Kakwani index is used most widely for progressiv-
ity research [24]. The Kakwani index is defined as thedifference between concentration index (Cp) and Ginicoefficient(G), in other words, it is twice the area be-tween the concentration curve of payment route (Lp)and the Lorenz curve of ATP (Lg). In this study, house-hold income was used to represent the ATP.The formulas of Cp, G and Kakwani index (πk) are as
follow:
Cp ¼ 1−2Z 1
0Lp xð Þdx
G ¼ 1−2Z 1
0Lg xð Þdx
πk ¼ Cp−G
Similar to the HI, people are sorted by household in-come from low to high and the cumulative proportionof dental expenditure in different payment routes orhousehold income is graphed. Cp ranks from − 1 to 1and the value of Gini coefficient ranges from 0 to 1 [25].
Cheng et al. BMC Oral Health (2020) 20:137 Page 3 of 10
As the dental expenditure concentrated in the popula-tion who used dental service in the past year, based onthe consideration of different socioeconomic characteris-tics distribution, the Kakwani indices of total partici-pants and those who used dental service in the past yearwere calculated and compared to strengthen the validityof results. For HI or Kakwani index, the positive ornegative of the index indicates that the inequality is con-centrated in the rich or the poor, and the magnitude ofthe value reflects the degree of such inequality.
Decomposition of concentration indicesTwo models were constructed to decompose the contri-butions of the dental expenditure concentration indexand the first of them enrolled all participants while thesecond one enrolled only participants used dental servicein the past year. It was decomposed into four sources: (i)socioeconomic characteristics which consist of house-hold income, region, residential location, education at-tainment and the coverage of different types of healthinsurance;(ii) the need variables which include evaluatedneed (DT) and subjective need (the level of self-reportedoral health status), and oral health behavior (teethbrushing habit); (iii) socio-demographic characteristicswhich include age groups, gender, nationality;(iv) med-ical care variable which refers specifically to theutilization of dental service in the past year only in the
first model. According to the nonlinear model, the con-centration index for dental expenditure (Cp) can bedecomposed as:
Cp ¼X
βkxk=μ� �
Ck þ GCε=μ
Where μ is the mean of dental expenditure, Ck is theconcentration index for xk variable and xk is the mean ofxk, GCε is the generalized concentration index for theerror term(ε). The Cp is equal to a weighted sum of theconcentration indices of the k variables, where the β kxk/μ indicates elasticity of for xk.SPSS 22.0 was used to be the data processing software
to deal with the distribution of dental expenditure andhealth insurance. STATA 14.0 was used to drew the fig-ures of inequalities and set up the decompositionmodels. The code for decomposition was referenced inthe guide of health equity analysis [24].
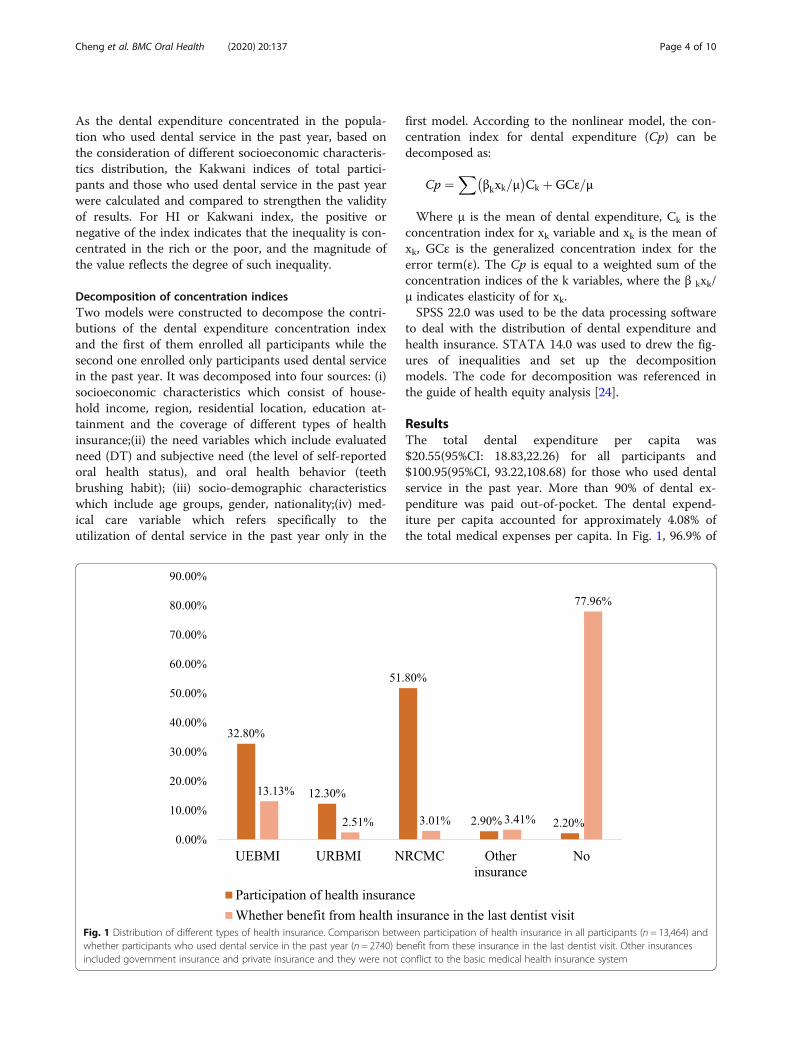
ResultsThe total dental expenditure per capita was$20.55(95%CI: 18.83,22.26) for all participants and$100.95(95%CI, 93.22,108.68) for those who used dentalservice in the past year. More than 90% of dental ex-penditure was paid out-of-pocket. The dental expend-iture per capita accounted for approximately 4.08% ofthe total medical expenses per capita. In Fig. 1, 96.9% of
Fig. 1 Distribution of different types of health insurance. Comparison between participation of health insurance in all participants (n = 13,464) andwhether participants who used dental service in the past year (n = 2740) benefit from these insurance in the last dentist visit. Other insurancesincluded government insurance and private insurance and they were not conflict to the basic medical health insurance system
Cheng et al. BMC Oral Health (2020) 20:137 Page 4 of 10
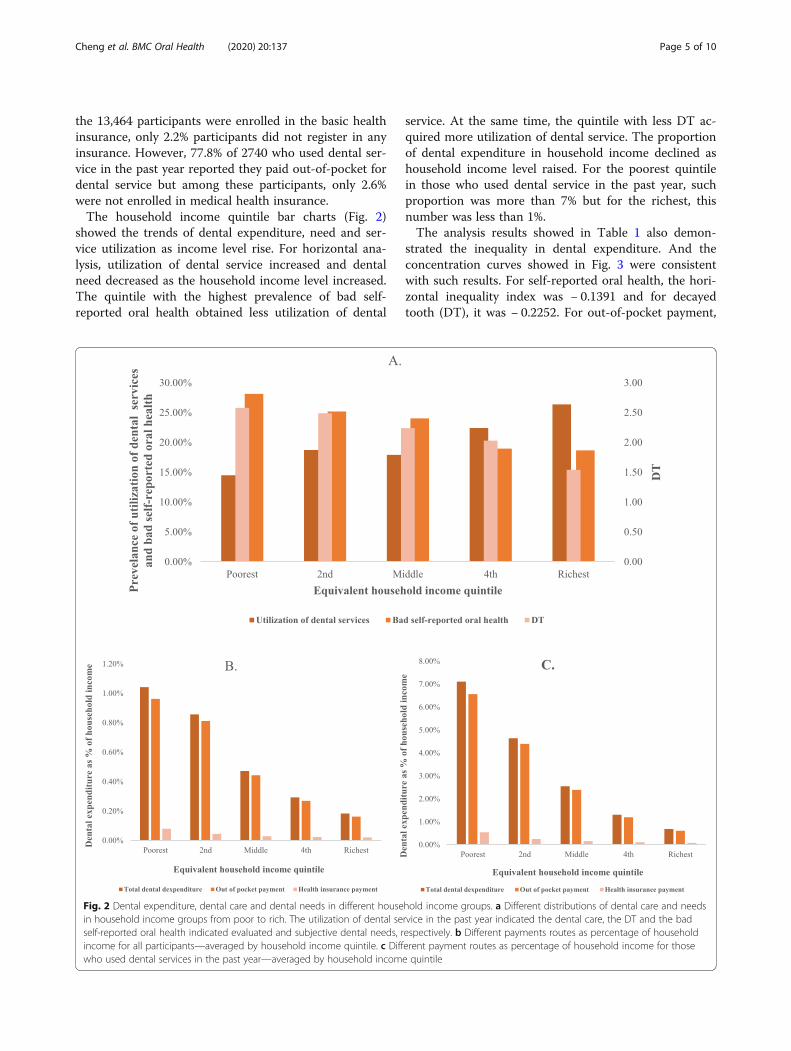
the 13,464 participants were enrolled in the basic healthinsurance, only 2.2% participants did not register in anyinsurance. However, 77.8% of 2740 who used dental ser-vice in the past year reported they paid out-of-pocket fordental service but among these participants, only 2.6%were not enrolled in medical health insurance.The household income quintile bar charts (Fig. 2)
showed the trends of dental expenditure, need and ser-vice utilization as income level rise. For horizontal ana-lysis, utilization of dental service increased and dentalneed decreased as the household income level increased.The quintile with the highest prevalence of bad self-reported oral health obtained less utilization of dental
service. At the same time, the quintile with less DT ac-quired more utilization of dental service. The proportionof dental expenditure in household income declined ashousehold income level raised. For the poorest quintilein those who used dental service in the past year, suchproportion was more than 7% but for the richest, thisnumber was less than 1%.The analysis results showed in Table 1 also demon-
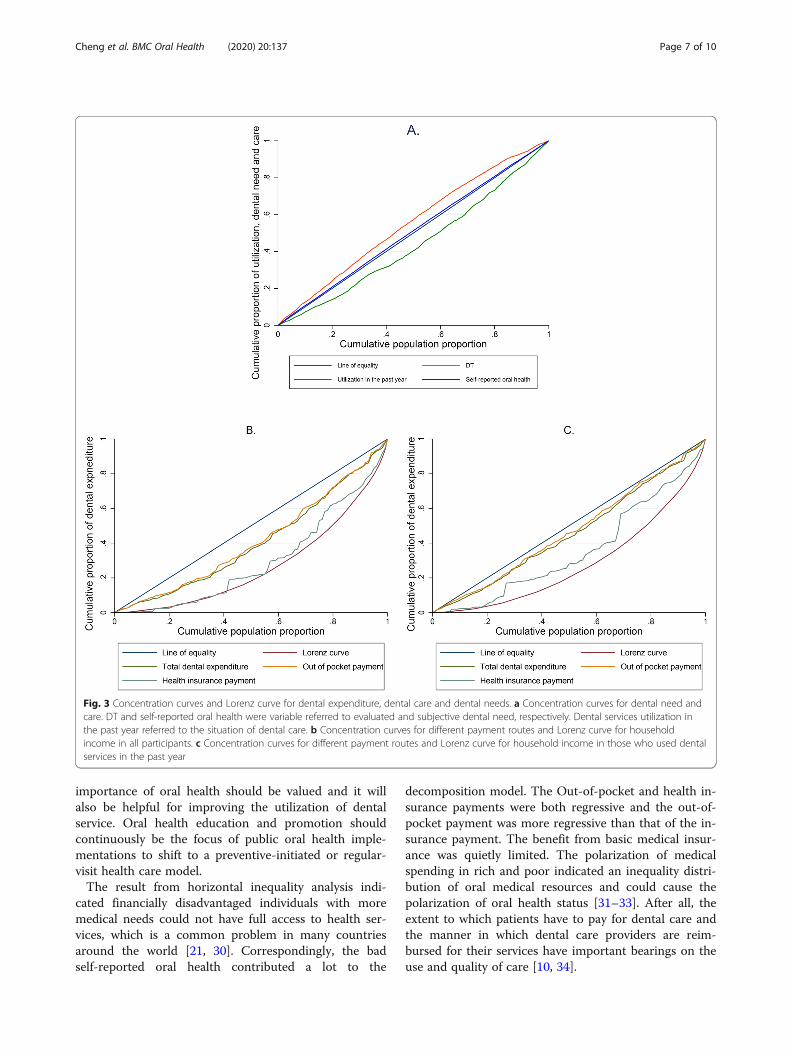
strated the inequality in dental expenditure. And theconcentration curves showed in Fig. 3 were consistentwith such results. For self-reported oral health, the hori-zontal inequality index was − 0.1391 and for decayedtooth (DT), it was − 0.2252. For out-of-pocket payment,
Fig. 2 Dental expenditure, dental care and dental needs in different household income groups. a Different distributions of dental care and needsin household income groups from poor to rich. The utilization of dental service in the past year indicated the dental care, the DT and the badself-reported oral health indicated evaluated and subjective dental needs, respectively. b Different payments routes as percentage of householdincome for all participants—averaged by household income quintile. c Different payment routes as percentage of household income for thosewho used dental services in the past year—averaged by household income quintile
Cheng et al. BMC Oral Health (2020) 20:137 Page 5 of 10
the Kakwani index was − 0.3154 and for health insurancepayment it was − 0.1598. The Kakwani indices and Hori-zontal inequality indices were negative and statistically sig-nificant. Medical care was in favor of the rich but medicalneed was concentrated in the poor. However, the distribu-tion of self-reported oral health trended to be more bal-anced. People’s assessment to their oral health was moreoptimistic. Out-of-pocket payments and health insurancepayments both benefit the rich, but the former is moreconcentrated among the rich. In Fig. 3, the distribution ofthe total dental expenditures in both all participants andthose who used dental service in the past year were similarto the out-of-pocket payment. The difference was that in-equality appeared to be expanding among the populationwho used dental services.The results of the two decomposition models were con-
sistent in Table 2, which showed the reliability of the in-clusion factors. Undoubtedly, utilization was the mostimportant contributor. Socioeconomic characteristics, in-cluding household income, residential location and educa-tion attainment, gave most contribution to the disparity ofdental expenditure. Besides, good oral hygiene practicecontributed a lot to this inequality. People with good oralhygiene was more concentrated in the rich. As for age,dental expenditure was more in favor of old people. Otherdemographic characteristics like gender or nationality didnot contribute a lot. Compared to the evaluated need(DT), the subjective need (self-reported oral health) con-tributed more. The contribution of dental need was nega-tive as bad self-reported oral health were concentrated inthe poor. Health insurance except the URBMI did not givedefinite contributions in Model 1 but the NRCMC gave alarger opposite contribution in Model 2.
DiscussionIn comparison to Japan, the dental expenditure percapita was $203 under public health insurance whichcovered approximately 70% and it accounted for 6.7% oftotal medical expenditure [26]. As for Italy, the dentalexpenditure per capita was nearly 250EUR and the pub-lic health care system only provided 5% of oral care [27].In Australia, the mean total dental expenditure was 702USD and mean out-of-pocket expenditure was 489 USD[28]. Dental expenditure for Chinese adults was at alower level. The basic medical insurance for oral healthdid not change significantly compared to the previousstudy [8].Two possible reasons could explain why nearly 80% of
people used dental service but they did not get reim-bursed from the insurance. One was that the reimburs-able payment for dental service did not reach thethreshold. One of the feedbacks of why not seeing a den-tist, from a series of other studies in the 4th NOHES,was “financial difficulty” [29] . The threshold could bemore than most people’s willingness to pay for dentalservices. The second was that the non-reimbursable por-tion was too much. People who might need prosthodon-tic, aesthetic and cosmetic dental services are not usuallycovered by insurance and the cost of service is expen-sive. Those were generally optimistic about their oralhealth, and the utilization of dental services istreatment-oriented. Preventive or regular dental visitswill help solve the problem.It is worth noticing that there is approximately 20% of
utilization of dental service and there might be a hugespace for growth in dental expenditure followed by eco-nomic advancement. Raising individual awareness of the
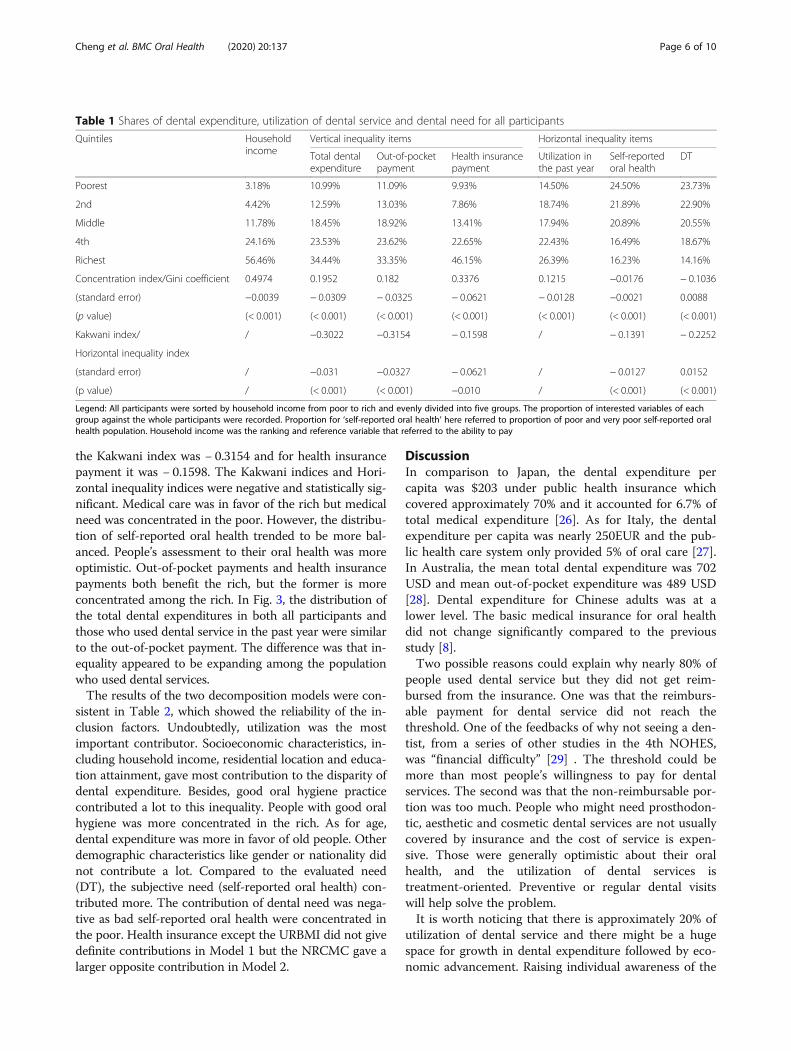
Table 1 Shares of dental expenditure, utilization of dental service and dental need for all participants
Quintiles Householdincome
Vertical inequality items Horizontal inequality items
Total dentalexpenditure
Out-of-pocketpayment
Health insurancepayment
Utilization inthe past year
Self-reportedoral health
DT
Poorest 3.18% 10.99% 11.09% 9.93% 14.50% 24.50% 23.73%
2nd 4.42% 12.59% 13.03% 7.86% 18.74% 21.89% 22.90%
Middle 11.78% 18.45% 18.92% 13.41% 17.94% 20.89% 20.55%
4th 24.16% 23.53% 23.62% 22.65% 22.43% 16.49% 18.67%
Richest 56.46% 34.44% 33.35% 46.15% 26.39% 16.23% 14.16%
Concentration index/Gini coefficient 0.4974 0.1952 0.182 0.3376 0.1215 −0.0176 − 0.1036
(standard error) −0.0039 − 0.0309 − 0.0325 − 0.0621 − 0.0128 −0.0021 0.0088
(p value) (< 0.001) (< 0.001) (< 0.001) (< 0.001) (< 0.001) (< 0.001) (< 0.001)
Kakwani index/ / −0.3022 −0.3154 − 0.1598 / − 0.1391 − 0.2252
Horizontal inequality index
(standard error) / −0.031 −0.0327 − 0.0621 / − 0.0127 0.0152
(p value) / (< 0.001) (< 0.001) −0.010 / (< 0.001) (< 0.001)
Legend: All participants were sorted by household income from poor to rich and evenly divided into five groups. The proportion of interested variables of eachgroup against the whole participants were recorded. Proportion for ‘self-reported oral health’ here referred to proportion of poor and very poor self-reported oralhealth population. Household income was the ranking and reference variable that referred to the ability to pay
Cheng et al. BMC Oral Health (2020) 20:137 Page 6 of 10
importance of oral health should be valued and it willalso be helpful for improving the utilization of dentalservice. Oral health education and promotion shouldcontinuously be the focus of public oral health imple-mentations to shift to a preventive-initiated or regular-visit health care model.The result from horizontal inequality analysis indi-
cated financially disadvantaged individuals with moremedical needs could not have full access to health ser-vices, which is a common problem in many countriesaround the world [21, 30]. Correspondingly, the badself-reported oral health contributed a lot to the
decomposition model. The Out-of-pocket and health in-surance payments were both regressive and the out-of-pocket payment was more regressive than that of the in-surance payment. The benefit from basic medical insur-ance was quietly limited. The polarization of medicalspending in rich and poor indicated an inequality distri-bution of oral medical resources and could cause thepolarization of oral health status [31–33]. After all, theextent to which patients have to pay for dental care andthe manner in which dental care providers are reim-bursed for their services have important bearings on theuse and quality of care [10, 34].
Fig. 3 Concentration curves and Lorenz curve for dental expenditure, dental care and dental needs. a Concentration curves for dental need andcare. DT and self-reported oral health were variable referred to evaluated and subjective dental need, respectively. Dental services utilization inthe past year referred to the situation of dental care. b Concentration curves for different payment routes and Lorenz curve for householdincome in all participants. c Concentration curves for different payment routes and Lorenz curve for household income in those who used dentalservices in the past year
Cheng et al. BMC Oral Health (2020) 20:137 Page 7 of 10
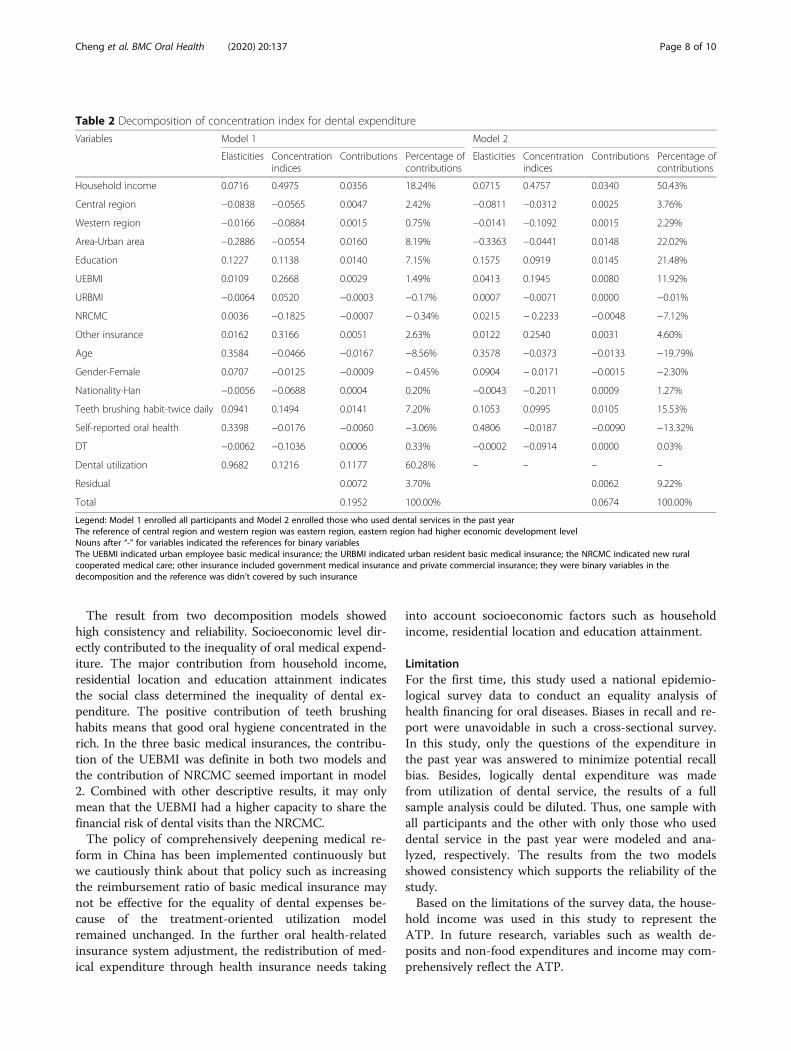
The result from two decomposition models showedhigh consistency and reliability. Socioeconomic level dir-ectly contributed to the inequality of oral medical expend-iture. The major contribution from household income,residential location and education attainment indicatesthe social class determined the inequality of dental ex-penditure. The positive contribution of teeth brushinghabits means that good oral hygiene concentrated in therich. In the three basic medical insurances, the contribu-tion of the UEBMI was definite in both two models andthe contribution of NRCMC seemed important in model2. Combined with other descriptive results, it may onlymean that the UEBMI had a higher capacity to share thefinancial risk of dental visits than the NRCMC.The policy of comprehensively deepening medical re-
form in China has been implemented continuously butwe cautiously think about that policy such as increasingthe reimbursement ratio of basic medical insurance maynot be effective for the equality of dental expenses be-cause of the treatment-oriented utilization modelremained unchanged. In the further oral health-relatedinsurance system adjustment, the redistribution of med-ical expenditure through health insurance needs taking
into account socioeconomic factors such as householdincome, residential location and education attainment.
LimitationFor the first time, this study used a national epidemio-logical survey data to conduct an equality analysis ofhealth financing for oral diseases. Biases in recall and re-port were unavoidable in such a cross-sectional survey.In this study, only the questions of the expenditure inthe past year was answered to minimize potential recallbias. Besides, logically dental expenditure was madefrom utilization of dental service, the results of a fullsample analysis could be diluted. Thus, one sample withall participants and the other with only those who useddental service in the past year were modeled and ana-lyzed, respectively. The results from the two modelsshowed consistency which supports the reliability of thestudy.Based on the limitations of the survey data, the house-
hold income was used in this study to represent theATP. In future research, variables such as wealth de-posits and non-food expenditures and income may com-prehensively reflect the ATP.
Table 2 Decomposition of concentration index for dental expenditure
Variables Model 1 Model 2
Elasticities Concentrationindices
Contributions Percentage ofcontributions
Elasticities Concentrationindices
Contributions Percentage ofcontributions
Household income 0.0716 0.4975 0.0356 18.24% 0.0715 0.4757 0.0340 50.43%
Central region −0.0838 −0.0565 0.0047 2.42% −0.0811 −0.0312 0.0025 3.76%
Western region −0.0166 −0.0884 0.0015 0.75% −0.0141 −0.1092 0.0015 2.29%
Area-Urban area −0.2886 −0.0554 0.0160 8.19% −0.3363 −0.0441 0.0148 22.02%
Education 0.1227 0.1138 0.0140 7.15% 0.1575 0.0919 0.0145 21.48%
UEBMI 0.0109 0.2668 0.0029 1.49% 0.0413 0.1945 0.0080 11.92%
URBMI −0.0064 0.0520 −0.0003 −0.17% 0.0007 −0.0071 0.0000 −0.01%
NRCMC 0.0036 −0.1825 −0.0007 − 0.34% 0.0215 − 0.2233 −0.0048 −7.12%
Other insurance 0.0162 0.3166 0.0051 2.63% 0.0122 0.2540 0.0031 4.60%
Age 0.3584 −0.0466 −0.0167 −8.56% 0.3578 −0.0373 −0.0133 −19.79%
Gender-Female 0.0707 −0.0125 −0.0009 − 0.45% 0.0904 − 0.0171 −0.0015 −2.30%
Nationality-Han −0.0056 −0.0688 0.0004 0.20% −0.0043 −0.2011 0.0009 1.27%
Teeth brushing habit-twice daily 0.0941 0.1494 0.0141 7.20% 0.1053 0.0995 0.0105 15.53%
Self-reported oral health 0.3398 −0.0176 −0.0060 −3.06% 0.4806 −0.0187 −0.0090 −13.32%
DT −0.0062 −0.1036 0.0006 0.33% −0.0002 −0.0914 0.0000 0.03%
Dental utilization 0.9682 0.1216 0.1177 60.28% – – – –
Residual 0.0072 3.70% 0.0062 9.22%
Total 0.1952 100.00% 0.0674 100.00%
Legend: Model 1 enrolled all participants and Model 2 enrolled those who used dental services in the past yearThe reference of central region and western region was eastern region, eastern region had higher economic development levelNouns after “-” for variables indicated the references for binary variablesThe UEBMI indicated urban employee basic medical insurance; the URBMI indicated urban resident basic medical insurance; the NRCMC indicated new ruralcooperated medical care; other insurance included government medical insurance and private commercial insurance; they were binary variables in thedecomposition and the reference was didn’t covered by such insurance
Cheng et al. BMC Oral Health (2020) 20:137 Page 8 of 10
ConclusionDental expenditure for Chinese adults was at a lowerlevel due to the underutilization of dental service. Theratio of payments of dental expenditure and utilizationwas disproportional, regardless it was from out-of-pocket or insurance payment. Individuals who weremore in need of oral care showed less demand for ser-vice or received dental services untimely. The service in-equality was not in favor of low incomes. For futurepolicy making, it is worth the effort to raise the publicawareness of the importance of oral health and changethe oral care model from treatment-oriented topreventive-initiated, and aid to set a habit for regulardental visits. If an oral health-related insurance systemcould be adjusted, socioeconomic status should be takeninto account as it appears to be the main determinant ofdental expenditure.
AbbreviationsATP: Ability to pay; CI: Confidence Interval; DT: Decayed teeth; HI: horizontalinequality; NOHES: National Oral Health Epidemiology Survey; NRCMC: NewRural Cooperative Medical Care; RMB: Chinese Yuan; USD: US Dollar;UEBMI: Urban Employee Basic Medical Insurance; URBMI: Urban ResidentsBasic Medical Insurance; WHO: World Health Organization
AcknowledgmentsThe study was one of the series of articles on the results of the 4th NOHESand thanks to all the colleagues who worked hard throughout the study.
Authors’ contributionsMC: Contributed to data analysis, drafted and critically revised themanuscript. CW: Contributed to the conception, design and data acquisition.XW, XF, BT, DH, HL, BW, WW, SZ, WR, XL: They were members of the expertgroup of the NOHES and were contributed to the design, quality control ofthe survey and data acquisition. YS: Contributed to the design of theresearch content and critically revised the manuscript. TX: Contributed torevised the manuscript. All authors have read and approved the manuscript.
FundingThe NOHES was funded by the “Scientific Research Fund of National HealthCommission of the People’s Republic of China (201502002)”. The funder gavefinancial support in design, implementation and data acquisition for thewhole epidemiology survey.
Availability of data and materialsThe database of the 4th NOHES should not be shared publicly as it is anational database and the copyright does not allow. More relevantinformation about the NOHES can be provided in the official report [29]. TheCensus data is shared online as a reference [16].
Ethics approval and consent to participateEthical approval (Approval No: 2014–003) for the study was received fromthe Ethics Committee of the Chinese Stomatological Association and writteninformed consent was obtained from each participant.
Consent for publicationNot Applicable.
Competing interestsWe declare no competing interests.
Author details1Department of Stomatology, Beijing Friendship Hospital, Capital MedicalUniversity, Beijing, China. 2Center for Chronic and Non-communicableDisease Control and Prevention, Chinese Center for Disease Control andPrevention, Beijing, China. 3National Engineering Laboratory for Digital and
Material Technology of Stomatology, Beijing Key Laboratory of DigitalStomatology, Chinese Stomatological Association, Peking University Schooland Hospital of Stomatology, Beijing, China. 4Department of PreventiveDentistry, Shanghai Ninth People’s Hospital, Shanghai Jiao Tong UniversitySchool of Medicine, Shanghai, China. 5Department of Preventive Dentistry,the State Key Laboratory Breeding Base of Basic Science of Stomatology(Hubei-MOST) & Key Laboratory of Oral Biomedicine Ministry of Education,School & Hospital of Stomatology, Wuhan University, Wuhan, China.6Department of Preventive Dentistry, West China School of Stomatology,Sichuan University, Chengdu, China. 7Department of Preventive Dentistry,Guanghua School of Stomatology, Hospital of Stomatology, Sun Yet-senUniversity, Guangzhou, China. 8Guangdong Provincial Key Laboratory ofStomatology, Guangzhou, China. 9Department of Preventive Dentistry,Peking University School and Hospital of Stomatology, National EngineeringLaboratory for Digital and Material Technology of Stomatology, Beijing KeyLaboratory of Digital Stomatology, Beijing, China.
Received: 9 January 2020 Accepted: 29 April 2020
References1. Petersen PE. The World Oral Health Report 2003: Continuous
improvement of oral health in the 21st century--the approach of theWHO global Oral health Programme. Community Dent Oral Epidemiol.2003;31(Suppl 1):3–23.
2. Kassebaum NJ, Smith AGC, Bernabe E, Fleming TD, Reynolds AE, Vos T,Murray CJL, Marcenes W, Collaborators GBDOH. Global, regional, andNational Prevalence, incidence, and disability-adjusted life years for Oralconditions for 195 countries, 1990-2015: a systematic analysis for the globalburden of diseases, injuries, and risk factors. J Dent Res. 2017;96(4):380–7.
3. Peres MA, Macpherson LMD, Weyant RJ, Daly B, Venturelli R, Mathur MR,Listl S, Celeste RK, Guarnizo-Herreno CC, Kearns C, et al. Oral diseases: aglobal public health challenge. Lancet. 2019;394(10194):249–60.
4. Listl S, Galloway J, Mossey PA, Marcenes W. Global economic impact ofdental diseases. J Dent Res. 2015;94(10):1355–61.
5. Righolt AJ, Jevdjevic M, Marcenes W, Listl S. Global-, regional-, and country-level economic impacts of dental diseases in 2015. J Dent Res. 2018;97(5):501–7.
6. Schwendicke F, Dorfer CE, Schlattmann P, Foster Page L, Thomson WM,Paris S. Socioeconomic inequality and caries: a systematic review and meta-analysis. J Dent Res. 2015;94(1):10–8.
7. Singh A, Peres MA, Watt RG. The relationship between income and Oralhealth: a critical review. J Dent Res. 2019;98(8):853–60.
8. Srivastava P, Chen G, Harris A. Oral health, dental insurance and dentalservice use in Australia. Health Econ. 2017;26(1):35–53.
9. Moeller J, Starkel R, Quinonez C, Vujicic M. Income inequality in the UnitedStates and its potential effect on oral health. J Am Dent Assoc. 2017;148(6):361–8.
10. Watt RG, Daly B, Allison P, Macpherson LMD, Venturelli R, Listl S, Weyant RJ,Mathur MR, Guarnizo-Herreno CC, Celeste RK, et al. Ending the neglect ofglobal oral health: time for radical action. Lancet. 2019;394(10194):261–72.
11. Li C, Yao NA, Yin A. Disparities in dental healthcare utilization in China.Community Dent Oral Epidemiol. 2018;46(6):576–85.
12. Hu DY, Hong X, Li X. Oral health in China--trends and challenges. Int J OralSci. 2011;3(1):7–12.
13. Qi XQ. Investigation report of the third national oral health survey in China.Beijing: People's Medical Publishing House; 2008.
14. Lu HX, Tao DY, Lo ECM, Li R, Wang X, Tai BJ, Hu Y, Lin HC, Wang B, Si Y,et al. The 4th National Oral Health Survey in the mainland of China:background and methodology. Chin J Dent Res. 2018;21(3):161–5.
15. World Health Organization. Oral health surveys: basic methods. 5th ed.Geneva: World Health Organization; 2013.
16. Ma J. Tabulation on the population cencus of the People's Republic ofChina. Beijing: National Bureau of Statistics; 2011. http://www.stats.gov.cn/tjsj/pcsj/rkpc/6rp/indexch.htm.
17. Caplan DJ, Slade GD, Gansky SA. Complex sampling: implications for dataanalysis. J Public Health Dent. 1999;59(1):52–9.
18. He S, Thomson WM. An oral epidemiological comparison of Chinese andNew Zealand adults in 2 key age groups. Community Dent Oral Epidemiol.2018;46(2):154–60.
Cheng et al. BMC Oral Health (2020) 20:137 Page 9 of 10
19. Owen O'Donnell, Eddy van Doorslaer, Adam Wagstaff, Lindelow M.Analyzing health equity using household survey data: a guide to techniquesand their implementation. Washington, DC: The World Bank; 2007.
20. Wagstaff A, van Doorslaer E, Paci P. On the measurement of horizontalinequity in the delivery of health care. J Health Econ. 1991;10(2):169–205discussion 247–169, 251–166.
21. Cisse B, Luchini S, Moatti JP. Progressivity and horizontal equity in health carefinance and delivery: what about Africa? Health Policy. 2007;80(1):51–68.
22. Xu M, Cheng M, Gao X, Wu H, Ding M, Zhang C, Wang X, Feng X, Tai B, HuD, et al. Factors associated with oral health service utilization among adultsand older adults in China, 2015-2016. Community Dent Oral Epidemiol.2020;48(1):32–41.
23. Andersen RM. Revisiting the behavioral model and access to medical care:does it matter? J Health Soc Behav. 1995;36(1):1–10.
24. O’Donnell O vDE, Wagstaff A, Lindelow M: Analysing health equity usinghousehold survey data: a guide to techniques and their implementation.Washington, DC: World Bank.; 2008.
25. Shen J, Listl S. Investigating social inequalities in older adults’ dentition andthe role of dental service use in 14 European countries. Eur J Health Econ.2018;19(1):45–57.
26. Zaitsu T, Saito T, Kawaguchi Y. The Oral Healthcare System in Japan.Healthcare (Basel). 2018;6(3):1–17.
27. Bindi M, Paganelli C, Eaton KA, Widstrom E. The healthcare system and theprovision of oral healthcare in European Union member states. Part 8: Italy.Br Dent J. 2017;222(10):809–17.
28. Teusner DN, Brennan DS, Gnanamanickam ES. Individual dental expenditureby Australian adults. Aust Dent J. 2013;58(4):498–506.
29. Wang X. The fourth National Oral Health Epidemiological Survey Report.Beijing: People's Health Publishing House; 2018.
30. Bilger M. Progressivity, horizontal inequality and reranking caused by healthsystem financing: a decomposition analysis for Switzerland. J Health Econ.2008;27(6):1582–93.
31. Ravaghi V, Quinonez C, Allison PJ. The magnitude of oral health inequalitiesin Canada: findings of the Canadian health measures survey. CommunityDent Oral Epidemiol. 2013;41(6):490–8.
32. Fisher J, Selikowitz HS, Mathur M, Varenne B. Strengthening oral health foruniversal health coverage. Lancet. 2018;392(10151):899–901.
33. Niederman R, Huang SS, Trescher AL, Listl S. Getting the incentives right:improving Oral health equity with universal school-based caries prevention.Am J Public Health. 2017;107(S1):S50–5.
34. Birch S, Listl S. The economics of Oral health and health care. Soc Sci. 2015;7:1–28.
Publisher’s NoteSpringer Nature remains neutral with regard to jurisdictional claims inpublished maps and institutional affiliations.
Cheng et al. BMC Oral Health (2020) 20:137 Page 10 of 10