Embed Size (px)
Citation preview

1
Targeting histone deacetylase activity to arrest cell growth
and promote neural differentiation in Ewing sarcoma
Bárbara Kunzler Souza 1,2 • Patrícia Luciana da Costa Lopez 3 • Pâmela Rossi
Menegotto 1,2 • Igor Araujo Vieira 4 • Nathalia Kersting 1 • Ana Lúcia Abujamra 1,5
• André T. Brunetto 1,5 • Algemir L. Brunetto 1,5 • Lauro Gregianin 1,6,7 • Caroline
Brunetto de Farias 1,5 • Carol J. Thiele 8 • Rafael Roesler 1,2
1 Cancer and Neurobiology Laboratory, Experimental Research Center, Clinical
Hospital (CPE-HCPA), Federal University of Rio Grande do Sul, 90035-003
Porto Alegre, RS, Brazil
2 Department of Pharmacology, Institute for Basic Health Sciences, Federal
University of Rio Grande do Sul, 90050-170 Porto Alegre,RS, Brazil
3 Graduate Program in Gastroenterology and Hepatology, School of Medicine,
Federal University of Rio Grande do Sul, 90035-003 Porto Alegre, RS, Brazil
4 Laboratory of Genomic Medicine, Experimental Research Center, Clinical
Hospital (CPE-HCPA), Federal University of Rio Grande do Sul, 90035-003
Porto Alegre, RS, Brazil
5 Rafael Koff Acordi Research Center, Children’s Cancer Institute, 90620-110
Porto Alegre, RS, Brazil
.CC-BY-NC-ND 4.0 International licenseIt is made available under a (which was not peer-reviewed) is the author/funder, who has granted bioRxiv a license to display the preprint in perpetuity.
The copyright holder for this preprint. http://dx.doi.org/10.1101/191700doi: bioRxiv preprint first posted online Sep. 20, 2017;
2
6 Department of Pediatrics, School of Medicine, Federal University of Rio Grande
do Sul, 90035-003 Porto Alegre, RS, Brazil
7 Pediatric Oncology Service, Clinical Hospital, Federal University of Rio Grande
do Sul, 90035-003 Porto Alegre, RS, Brazil
8 Cell & Molecular Biology Section, Pediatric Oncology Branch, National Cancer
Institute, National Institutes of Health, Bethesda, 20892, MD, USA
Correspondence: Rafael Roesler
Department of Pharmacology, Institute for Basic Health Sciences, Federal University of
Rio Grande do Sul, Rua Sarmento Leite, 500 (ICBS, Campus Centro/UFRGS), 90050-
170 Porto Alegre, RS, Brazil.
Telephone: +5551 33083183; fax: +5551 33083121.
E-mail: [email protected]
Keywords: histone deacetylase, epigenetics, cell differentiation, Ewing sarcoma,
pediatric cancer
.CC-BY-NC-ND 4.0 International licenseIt is made available under a (which was not peer-reviewed) is the author/funder, who has granted bioRxiv a license to display the preprint in perpetuity.
The copyright holder for this preprint. http://dx.doi.org/10.1101/191700doi: bioRxiv preprint first posted online Sep. 20, 2017;

3
Abstract
There is an urgent need for advances in the treatment of Ewing sarcoma (EWS), an
aggressive childhood tumor with possible neuroectodermal origin. Inhibition of histone
deacetylases (HDAC) can revert aberrant epigenetic states and reduce growth in
different experimental cancer types. Here, we investigated whether the potent HDAC
inhibitor, sodium butyrate (NaB) has the ability to reprogram EWS cells towards a more
differentiated state and affect their growth and survival. Exposure of two EWS cell lines
to NaB resulted in rapid and potent inhibition of HDAC activity (1 h, IC50 1.5 mM) and
a significant arrest of cell cycle progression (72 h, IC50 0.68-0.76 mM), marked by
G0/G1 accumulation. Delayed cell proliferation and reduced colony formation ability
were observed in EWS cells after long-term culture. NaB-induced effects included
suppression of cell proliferation accompanied by reduced transcriptional expression of
the EWS-FLI1 fusion oncogene, decreased expression of key survival and pluripotency-
associated genes, and re-expression of the differentiation neuronal marker βIII-tubulin.
Finally, NaB reduced c-MYC levels and impaired survival in putative EWS cancer stem
cells. Our findings support the use of HDAC inhibition as a strategy to impair cell
growth and survival and to reprogram EWS tumors towards differentiation. These
results are consistent with our previous studies indicating that HDis can inhibit the
growth and modulate differentiation of cells from other types of childhood pediatric
tumors possibly originating from neural stem cells.
Keywords Histone deacetylase ● Epigenetics ● Neural differentiation ● Ewing sarcoma
● Pediatric cancer
.CC-BY-NC-ND 4.0 International licenseIt is made available under a (which was not peer-reviewed) is the author/funder, who has granted bioRxiv a license to display the preprint in perpetuity.
The copyright holder for this preprint. http://dx.doi.org/10.1101/191700doi: bioRxiv preprint first posted online Sep. 20, 2017;

4
Introduction
Ewing sarcoma (EWS), a highly aggressive bone and soft tissue cancer, is the
second most common primary solid bone malignancy in children and young adults [1].
Despite advances in multimodal therapy, patients with the disease have a poor
prognosis, with a survival rate of 50 – 65% at 5 years and less than 30% for metastatic
or refractory tumors [2]. EWS tumors typically harbor a specific genetic alteration
characterized by a chromosomal translocation resulting in fusions between the EWS
RNA Binding Protein 1 (EWSR1) gene and one of the several ETS family genes (most
frequently FLI-1) which is present in 85% of cases [1,3]. EWS tumors are poorly
differentiated and their cell of origin remains elusive. Evidence indicates that EWS
shares genetic features and may arise from developing neural crest cells, and has
potential for neural differentiation [4-7]. It is also possible that EWS derives from
mesenchymal stem cells [8-11]. Experiments investigating clear cell sarcoma, a cancer
type defined by EWS-ATF1, the fusion product of a balanced chromosomal
translocation between chromosomes 22 and 12, have shown that the differentiation state
of cells of origin impacts tumor characteristics [12].
EWS is a relatively genetically stable, fusion oncogene-driven cancer, harboring
few somatic mutations [13]. However, as with other solid tumors of childhood, many
epigenetic alterations are likely crucial for EWS tumorigenesis [14]. EWSR1-FLI-1 acts
as an aberrant transcription factor that induces epigenomic reprogramming involving
changes in chromatin remodeling through acetylation and methylation, resulting in
repression of tumor suppressors and oncogene activation [15, 16]. The chromatin state
in EWS is strikingly similar to that found in bone-marrow-derived mesenchymal stem
.CC-BY-NC-ND 4.0 International licenseIt is made available under a (which was not peer-reviewed) is the author/funder, who has granted bioRxiv a license to display the preprint in perpetuity.
The copyright holder for this preprint. http://dx.doi.org/10.1101/191700doi: bioRxiv preprint first posted online Sep. 20, 2017;
5
cells. Increased chromatin accessibility in stem cells may lead to a state that facilitates
oncogenic alterations induced by EWSR1-FLI-1, suggesting a stem cell origin for EWS
[17].
A balance between the opposing activities of histone acetyltransferases (HATs)
and deacetylases (HDACs) is key in regulating gene expression. Histone
acetyltransferases (HATs) control histone acetylation activity through the transfer of
acetyl groups to the amino-terminal lysine residues of histones, thus increasing
transcriptional activity. In contrast, histone deacetylases (HDACs) remove acetyl
groups, favoring chromatin condensation and repressing gene expression [18]. HDAC
inhibitors (HDi) represent a class of experimental antineoplastic agents that target
aberrant epigenetic alterations found in cancer [19, 20]. Sodium butyrate (NaB) is an
HDi widely used as an experimental tool in cellular studies. It is short fatty acid that
acts as a potent class I and IIa HDAC inhibitor inducing arrest in proliferation of cancer
cells by increasing histone acetylation. In mammalian cells, NaB promotes
hyperacetylation of the histones H3 and H4, resulting in chromatin decondensation and
increased transcriptional activity [21]. In EWS cells, we have previously shown a
synergistic antitumor effect of NaB combined with commonly chemotherapeutic drugs
[22]. Moreover, the HDi suberoylanilide hydroxamic acid (SAHA) showed a
synergistically enhanced antitumor activity upon combination with etoposide [23], and
HDis NaB, SAHA or entinostat or MS-275 as monotherapies or combined with TRAIL
display an additive cytotoxic effect in EWS cells [24].
Here, we show that inhibition of global HDAC activity by NaB inhibits multiple
pathways involved in cell proliferation, survival and pluripotency. In addition, NaB
.CC-BY-NC-ND 4.0 International licenseIt is made available under a (which was not peer-reviewed) is the author/funder, who has granted bioRxiv a license to display the preprint in perpetuity.
The copyright holder for this preprint. http://dx.doi.org/10.1101/191700doi: bioRxiv preprint first posted online Sep. 20, 2017;

6
exposure stimulates some morphologic and biochemical changes that might be
consistent with neural differentiation in EWS cells.
Materials and Methods
Cell Lines and Cell Culture
Human EWS cell lines SK-ES-1 and RD-ES-1 obtained from American Type Culture
Collection (Rockville, MD, USA) were grown in RPMI-1640 medium (Gibco-BTL,
Carlsbad, CA, USA), containing 0.1% fungizone® (250 mg/kg; Invitrogen Life
Technologies, São Paulo, Brazil), 4 mg/ml gentamicin and 10% fetal bovine serum
(FBS, Gibco® by Thermo Fisher Scientific, Life Technologies, Brazil). Cells were
cultured at 37 °C in a humidified incubator under 5% CO2.
Drug Treatment
NaB (Sigma Aldrich - St. Louis, MO, USA) was diluted in sterile ultrapure water in a
stock solution of 100 mM. EWS cells (2x10⁴) were plated in 24-well plate and exposed
to NaB in concentrations ranging from 0.5 to 5 μM for 72 h. For calculation of IC50,
data were fitted in a dose response curve (Graphpad Prism v. 6.0) using the equation: y
= min + (max – min)/(1 + 10^((LogIC50 – x)*Hillslope + Log ((max – min)/(50-min) –
1))).
.CC-BY-NC-ND 4.0 International licenseIt is made available under a (which was not peer-reviewed) is the author/funder, who has granted bioRxiv a license to display the preprint in perpetuity.
The copyright holder for this preprint. http://dx.doi.org/10.1101/191700doi: bioRxiv preprint first posted online Sep. 20, 2017;

7
Cell Viability
Cells were exposed to NaB as described above. Both cells in the supernatant and
adhered cells were detached, collected, centrifuged and washed with PBS twice. To
assess viability, cells were incubated with 1 μg/ml propidium iodide (PI) (Sigma
Aldrich) in PBS at 4 °C in the dark. PI uptake was assessed by flow cytometry analysis
using an Attune Acoustic focusing cytometer (Applied Biosystems, Thermo Fisher
Scientific, USA). Data was analyzed using Attune Cytometric Software version 1.2.5.
Four individual replicates were performed.
Cell Cycle
To assess cell cycle, the EWS cells were cultured in 24-well plates under the same
conditions of described above, and then detached, centrifuged and washed with PBS
twice. After, the cells were ressuspended in 50 µg/ml propidium iodide (Sigma-Aldrich,
St. Louis, Mo., USA) in 0.1% Triton X-100 in 0.1% sodium citrate solution containing
5 µg/ml RNase A. One million cells were stained in 1.0 ml of the PI cell cycle solution
for 5 min. followed by assessment on an Attune Acoustic focusing cytometer by
Applied Biosystems (Thermo Fisher Scientific, USA) analysis. In each sample 20,000
cells were analysed. Data was analyzed using FlowJo Cytometric Software version
10.1. Three individual experiments were performed.
.CC-BY-NC-ND 4.0 International licenseIt is made available under a (which was not peer-reviewed) is the author/funder, who has granted bioRxiv a license to display the preprint in perpetuity.
The copyright holder for this preprint. http://dx.doi.org/10.1101/191700doi: bioRxiv preprint first posted online Sep. 20, 2017;
8
Cumulative Population Doubling
Cells were plated [2x10⁴ cell/mL] and exposed to NaB, in the same conditions
described above, in quadruplicates. Every 4 days, supernatant and adhered cells were
collected, quantified by PI uptake and re-plated. The Population Doubling (PD) level
was calculated to determine the proliferation potential of the cell lines SK-ES 1 and
RD-ES unexposed versus NaB exposed cells. The PD at each passage was calculated
using the equation PD = (log Xe – log Xb)/log2 and doubling time was calculated using
DT = T*ln2/ln(Xe/Xb). In both cases ‘Xe’ is the cell number at the end of the
incubation time, ‘Xb’ is the cell number at the beginning of the incubation time and T is
the number of days between time points, as described in the ATCC® Animal Cell
Culture Guide. Data is displayed as cumulative PD (CPD), calculated as the sum of all
previous PDLs.
All the CPD parameters were analyzed according to Silva and colleagues [25].
Briefly, Relative end CPD (RendCPD) quantifies the end point of cell proliferation
analysis, and is obtained by the ratio between the final CPD of cells exposed to drug and
control cells. To determine the global effect after the treatment intervention, the relative
Area Under Curve (rAUC) was calculated (Graphpad Prism v. 6.0 software) using the
lower CPD of the initial population to obtain the minimal threshold. RPR (Relative
Proliferation Rate) and RTCT (Relative Time to Cross a Threshold), linear regression
for both exposed and control groups was calculated using the higher angular coefficients
of the last two or more CPD intervals. RPR is the ratio of the angular coefficients of
.CC-BY-NC-ND 4.0 International licenseIt is made available under a (which was not peer-reviewed) is the author/funder, who has granted bioRxiv a license to display the preprint in perpetuity.
The copyright holder for this preprint. http://dx.doi.org/10.1101/191700doi: bioRxiv preprint first posted online Sep. 20, 2017;
9
exposed and control groups. RTCT was determined by the ratio of between the control
and exposed cells Time to Cross the Threshold (TCT), i.e., a threshold set on a CPD
value where both treatment and control conditions present the highest velocity of
proliferation. Long-term survival index (LSI) is calculated by the average of the four
parameters described above.
Colony Formation
Cells were exposed to NaB for 72h and 1 x 10² cells per well were re-plated in 6-well
plates and cultured for 10 days with the RPMI medium being changed every 3 days.
Cells were then fixed with methanol, followed by staining with 0.5% crystal violet. The
stained colonies images were scanned and analyzed using the cell counter plugin on
Image J software (NIH, Bethesda, MD, USA).
Tumorsphere Culture
Cells were dissociated with trypsin-EDTA into single cell suspension and seeded at 2 x
103 cells/well in 6-well plates. The cells were cultured in a serum-free tumorsphere
(TS)-inducing medium, containing DMEM-F12 (1:1) supplemented with 2% B27
supplement (Gibco, Invitrogen, CA, USA), 20 ng/mL recombinant human EGF (Sigma-
Aldrich, MO, USA), 20 ng/mL human leukemia inhibitor factor (Thermo Fisher
Scientific, Life Technologies), 10 IU/mL (5 mg/mL) heparin (Roche, Mannheim,
.CC-BY-NC-ND 4.0 International licenseIt is made available under a (which was not peer-reviewed) is the author/funder, who has granted bioRxiv a license to display the preprint in perpetuity.
The copyright holder for this preprint. http://dx.doi.org/10.1101/191700doi: bioRxiv preprint first posted online Sep. 20, 2017;

10
Germany) and antibiotics as described by Leuchte and colleagues [26]. The media was
changed every 4 days. After 8 – 9 days, tumorspheres were dissociated with a non-
enzymatic solution containing 1 mM EDTA, 40 mM Tris-HCl and 150 mM NaCl, and
re-plated in a 96-well plate to evaluate their capacity to self-renew through secondary
EWS tumorsphere formation. Tumorspheres with at least 80μm were analyzed and
quantified by inverted phase microscopy (Leica Microsystems, Mannheim Germany).
The effect of NaB on tumorsphere formation ability across 7 days was examined.
HDAC Activity
Cells (1 x 10⁴) were seeded in a 96-black well plate/clear flat-bottom (Greiner-bioone,
Frickenhausen, DE) and exposed to NaB, at the same concentrations described above,
for 1 or 3 h. HDAC enzymatic activity was measured by In Situ HDAC Activity
Fluorometric Assay kit (EPI003, Sigma-Aldrich, St. Louis, MO, USA) according to the
manufacturer’s instructions. Three individual experiments were performed. HDAC
enzyme activity was calculated across the groups as pmol/min and the percent of HDAC
activity was corrected by control (unexposed cells).
Immunofluorescence
For immunofluorescent staining, cells were plated on the glass coverslips, pre-coated
with 2 μg/ml of fibronectin. After 72 h of exposure to NaB, cells were fixed in 4% PFA
for 15 minutes at room temperature. After two additional washes, the fixed cells were
incubated with blocking buffer (1X PBS containing 3% BSA and 0.3% Triton X-100)
.CC-BY-NC-ND 4.0 International licenseIt is made available under a (which was not peer-reviewed) is the author/funder, who has granted bioRxiv a license to display the preprint in perpetuity.
The copyright holder for this preprint. http://dx.doi.org/10.1101/191700doi: bioRxiv preprint first posted online Sep. 20, 2017;

11
for 1 h at room temperature, followed by an overnight incubation at 4°C with the
following primary antibodies: Histone 3 phos-S10 (1:200, Cell Signaling), Trkb (1:100,
Santa Cruz). After washing with PBS twice, cells were incubated with secondary
antibodies conjugated with either Alexa fluor-488 (1:800; Invitrogen) or Rhodamine
(1:300, Invitrogen) at room temperature for two h. After three additional washes, DNA
was stained with 4 μg/ml of Hoechst 33342 (Invitrogen) for 15 minutes at room
temperature. After washing, slides were mounted with Prolong Gold anti-fade reagent.
Slides were viewed with Leica TCS SP5 Confocal Laser Scanning Microscope, using
Leica LAS AF Lite 2.0.2 software to acquire images. For quantitative analysis, was
calculated by the percent of mean intensity corrected by the control (unexposed cells).
For each group, at least five random images were taken, and the results were determined
from at least three independent experiments.
Real Time qPCR
Total RNA was extracted from EWS cells using TRIzol (Invitrogen, Carlsbad, CA,
USA). Prior to RT-PCR, the samples were treated with DNase I (Promega Corporation,
WI, USA). Total RNA was quantified with NanoDrop (Thermo Fisher Scientific, DE,
USA). SuperScriptTM First-Strand Synthesis System for RT-PCR (Invitrogen, Carlsbad,
CA, USA) enabled first strand synthesis. The mRNA expression levels of target genes
(EWS-FLI1, TrkB, OCT3/4) were quantified using KiCqStartTM SYBR Green qPCR
ReadyMixTM, with ROXTM (Sigma-Aldrich, St. Louis, MO, USA) and calculated using
the ΔCT method from triplicate reactions, with the levels of gene normalized to the
relative Ct value of Gapdh. Cycling parameters were as follows: 95 °C for 2 mins,
.CC-BY-NC-ND 4.0 International licenseIt is made available under a (which was not peer-reviewed) is the author/funder, who has granted bioRxiv a license to display the preprint in perpetuity.
The copyright holder for this preprint. http://dx.doi.org/10.1101/191700doi: bioRxiv preprint first posted online Sep. 20, 2017;

12
followed by 40 cycles of denaturation at 95 °C for 3 secs, annealing at 60 °C for 15
secs, and extension at 72 °C for 30 secs. The primer sequences used are shown in
Supplementary Table S1 online.
Western Blot
Proteins were separated using 8 – 14% SDS Tris-glycine gels and transferred onto a
polyvinylidene difluoride membranes. Membranes were blocked with 5% fat-free milk
and incubated with antibodies against BDNF (H117, SC-20981, Santa Cruz, CA, USA),
NGF (H-20, sc-548, Santa Cruz, CA, USA), pERK (E-4 sc-7383, Santa Cruz, CA,
USA), ERK1 (K-23, sc-94, Santa Cruz, CA, USA), pAKT (S473) (SAB4300042, Sigma
Aldrich, MO, USA), AKT (pan) (C67E7, #4691, Cell Signaling Technology, MA,
USA), OCT3/4 (sc-5279, Santa Cruz, CA, USA), NANOG (M-149, sc-33760, Santa
Cruz, CA, USA), c-MYC (D84C12 – Cell Signaling Technology, MA, USA), KLF4
(H-180, SC-20691, Santa Cruz, CA, USA), ALDH1A1 (ab23375, Abcam, Cambridge,
UK), BMI-1 (D20B7, #6964 – Cell Signaling Technology, MA,USA), Cyclin D1
(D71G9 – Cell Signaling Technology, MA, USA), βIII-Tubulin (D71G9 – Cell
Signaling Technology, MA,USA) and ACTB (A2228, Sigma Aldrich, MO, USA) used
as loading control. Incubation for 1 h with appropriate horsedish peroxidase-conjugated
secondary antibody (Santa Cruz) at RT was performed. Chemiluminescence was
detected using ECL Western Blotting substrate (EMD Millipore, DE) and analyzed by
ImageQuant LAS500 (GE Healthcare Life Sciences, UK). Densitometric analyses were
performed using Image J (NIH, MD, USA). Relative densitometric unit (RDU) was
calculated by the normalization of interest protein level to the housekeeping genes β-
.CC-BY-NC-ND 4.0 International licenseIt is made available under a (which was not peer-reviewed) is the author/funder, who has granted bioRxiv a license to display the preprint in perpetuity.
The copyright holder for this preprint. http://dx.doi.org/10.1101/191700doi: bioRxiv preprint first posted online Sep. 20, 2017;
13
actin (ACTB) or Histone 3 (H3), or ERK1 and AKT for pERK and pAKT (S473),
respectively. All treatment conditions were corrected by control groups (non-exposed
cells). Three individual replicates were performed.
Statistical Analysis
For statistical analysis, GraphPad Prism version 6.0 was used. Each assay was
performed at least three times in biologically independent assays. The significance of
differences in mean ± standard error values was analyzed by one-way ANOVA and
Tukey’s multiple comparison test or Student’s t-test; p values of less than 0.05 were
considered statistically significant.
Results
Inhibition of HDAC Activity Reduces EWS-FLI1 Fusion Oncogene
Transcriptional Expression and Induces Growth Arrest in EWS Cells
To examine the effect of NaB on HDAC activity in EWS cells, we exposed SK-ES1 and
RD-ES cells to NaB for 1 and 3 h. HDAC activity was significantly reduced after 1 h
when NaB doses higher than 1 mM were used, resulting in a target IC50 of
approximately 1.5 mM (Fig. 1a, 1d). HDAC activity in cells exposed to NaB for 3 h
was not as effectively reduced in comparison to 1 h treatments, and a significant
.CC-BY-NC-ND 4.0 International licenseIt is made available under a (which was not peer-reviewed) is the author/funder, who has granted bioRxiv a license to display the preprint in perpetuity.
The copyright holder for this preprint. http://dx.doi.org/10.1101/191700doi: bioRxiv preprint first posted online Sep. 20, 2017;

14
decrease was observed only in RD-ES cells exposed to 2 mM of NaB (Supplementary
Fig. S1), suggesting that NaB optimally inhibits HDAC activity in EWS cells at a
kinetic rate of 1 h.
In order to evaluate the biological effects of HDAC inhibition, we exposed EWS
cells to varying concentrations of NaB (0.5 – 5 mM) for 72 h. Cell viability was
potently reduced in both cell lines (Fig. 1b). Interestingly, cells exposed to NaB showed
a change in morphology accompanied by the appearance of short neurite-like extensions
(Fig. 1c). At 72 h, the biological IC50 of NaB was 0.76 and 0.68 mM for SK-ES 1 and
RD-ES EWS cell lines, respectively (Fig. 1d). Moreover, to examine whether HDAC
inhibition could alter the expression of the fusion oncogene, we designed primers
flanking the break point of EWS-FLI1 fusion (type 2) and evaluated its transcriptional
expression level after NaB exposure in comparison with untreated EWS cells. HDAC
inhibition in EWS cells resulted in an approximately 2-fold decrease of EWS-FLI1
transcriptional expression after treatment with 1.5 mM NaB at 1 and 3 hours for SK-ES
1 cells, and 3 hours for RD-ES cells (Fig. 1e).
Fig. 1 should be inserted here
Next, we verified whether inhibition of HDAC activity by NaB would change
cell cycle distribution. HDAC inhibition resulted in a significant alteration in EWS cell
cycle featuring an accumulation of cells in the G0/G1 phase 35 h after NaB exposure. In
the SK-ES1 EWS cell line, we also observed a significant decrease in the S and G2/M
.CC-BY-NC-ND 4.0 International licenseIt is made available under a (which was not peer-reviewed) is the author/funder, who has granted bioRxiv a license to display the preprint in perpetuity.
The copyright holder for this preprint. http://dx.doi.org/10.1101/191700doi: bioRxiv preprint first posted online Sep. 20, 2017;
15
phases of the cell cycle, whereas in the RD-ES cell line there was a significant reduction
in polyploidy (Fig. 2a). To determine whether HDAC inhibition disrupts histone 3 phos-
S10, a chromosome condensation marker during mitosis, we immunostained EWS cell
lines exposed to NaB for 72 h against anti-H3 phos-S10 plus anti-Alexa488, measured
by laser confocal microscopy. As expected, H3 phos-S10 immunolocalized to the
nucleus in both EWS cell lines (Fig. 2b). In addition, we observed that both EWS cell
lines exposed to higher doses of NaB (2 and 5 mM) showed a reduced level of H3 phos-
S10, whereas there was no significant change at lower doses (0.5 and 1 mM) compared
to untreated cells (Fig. 2c). Given that Cyclin D1 is a G1-phase regulator protein
overexpressed in EWS, we investigated whether HDAC could regulate Cyclin D1
expression after 72 h of NaB exposure. SK-ES 1 cells exposed to 0.5 or 1 mM of NaB
showed an approximately 1.5-fold change decrease in Cyclin D1 levels, and 1 mM NaB
also decreased Cyclin D1 levels also in RD-ES cells (Fig. 2d). The results suggest that
HDAC activity inhibition induces growth arrest in EWS cells.
Fig. 2 should be inserted here
HDAC Inhibition Abrogates Cell Proliferation and Survival Pathways in EWS
Cells
.CC-BY-NC-ND 4.0 International licenseIt is made available under a (which was not peer-reviewed) is the author/funder, who has granted bioRxiv a license to display the preprint in perpetuity.
The copyright holder for this preprint. http://dx.doi.org/10.1101/191700doi: bioRxiv preprint first posted online Sep. 20, 2017;

16
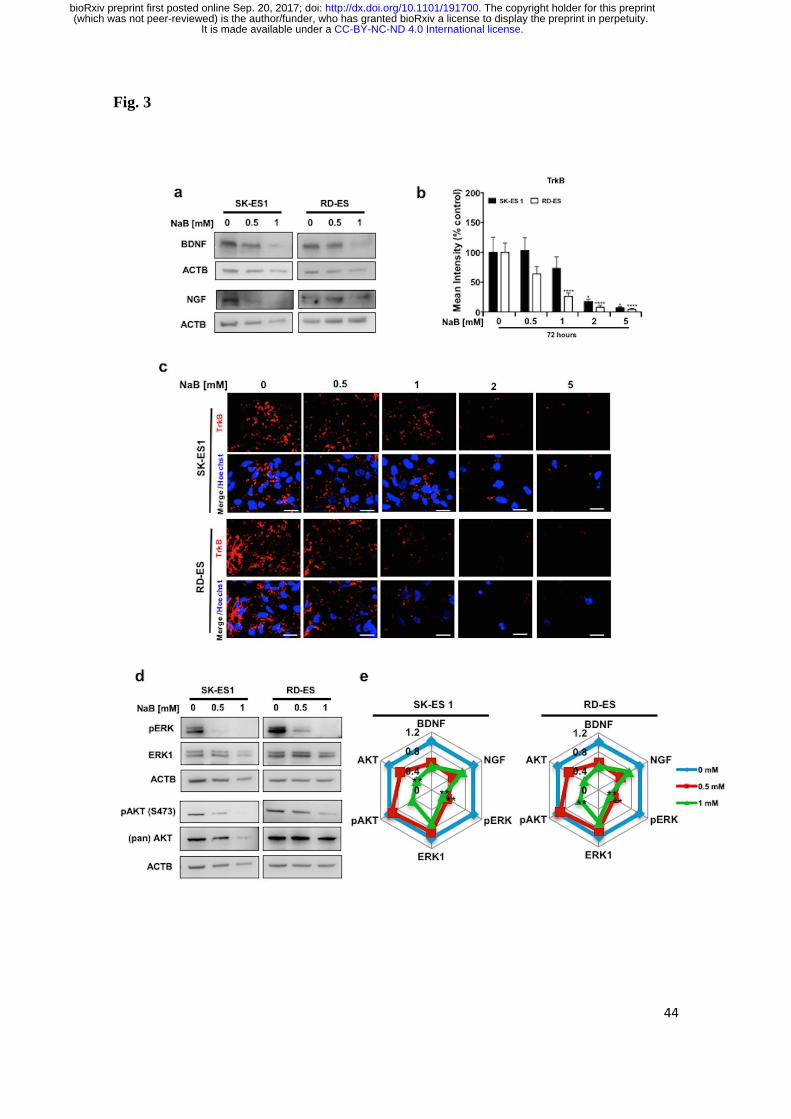
To investigate molecular mechanisms associated with the NaB-induced decrease in
EWS cell growth, we examined the expression of key proteins that control cell survival
and proliferation. After exposure to either 0.5 or 1.0 mM NaB, a decrease in the levels
of survival-promoting neurotrophins, brain-derived neurotrophic factor (BDNF) and
nerve growth factor (NGF) were observed (Fig. 3a). We also immunostained
tropomyosin receptor kinase B (TrkB) in EWS cell lines against anti-TrkB, plus anti-
Rhodamine. As expected, TrkB immunoreactivity was detected in the cytoplasm. In
addition, we observed that TrkB levels were reduced in a dose-dependent manner in
both cell lines after NaB exposure (Fig. 3b, 3c). Consistently with this finding, we also
observed a decrease in protein levels of downstream targets, phosphorylated
extracellular-regulated kinase (pERK), but not total ERK1 levels, pAKTS473, and total
AKT. A significant reduction of AKT was observed only in RD-ES cells treated with
1.0 mM NaB when pAKTS473 over total AKT levels were considered (Fig. 3d).
Essentially similar effects were observed in RD-ES cells, however only at the 1.0 mM
dose of NaB (Fig. 3d). Analysis of relative densitometric units related to the
immunoblots is depicted in Fig. 3e. These results support the possibility that signaling
mediated by neurotrophins, ERK and AKT are involved in mediating the inhibitory
effects of NaB in EWS cells.
Fig. 3 should be inserted here
.CC-BY-NC-ND 4.0 International licenseIt is made available under a (which was not peer-reviewed) is the author/funder, who has granted bioRxiv a license to display the preprint in perpetuity.
The copyright holder for this preprint. http://dx.doi.org/10.1101/191700doi: bioRxiv preprint first posted online Sep. 20, 2017;

17
Persistence of the Anti-Proliferative Effect Induced by HDAC Inhibition in EWS
Cells
We performed a cumulative population doubling (CPD) of EWS cells to examine the
persistence of the anti-proliferative effect of NaB. After 72 h of treatment, cells were
maintained for 16 days in drug free media, as shown in Fig. 4a. Significant delays in
cell proliferation rate were found with 2 and 5 mM of NaB (Fig. 4b). Because the
number of cells was too small, we modeled the growth from day 19 to day 35 using a
mathematical prediction as described by Silva et al. [25]. We were able to predict
whether EWS cells exposed to the higher doses of NaB over 35 days would have a
persistent reduction in the ability to proliferate. Lower doses (0.5 and 1 mM) of NaB
resulted in a gain in cell proliferation by day 20 which by 35 days was even higher than
our prediction (Fig. 4b). It is possible that only a resistant subset of EWS cells could
restore cell proliferative ability to an equal or higher degree compared to controls.
We then went on to perform a CPD profile analysis that examines long-term
changes in cell population size. On the basis of CPD graphs from cell counting we
calculated four different parameters: relative end CPD (RendCPD) to quantitatively
assess the end point of cell proliferation analysis; relative area under curve (rAUC) to
determine a global effect after treatment intervention; relative time to cross a threshold
(RTCT) to measure the delay of the cell population that recovers growth after treatment;
and relative proliferation rate (RPR) to quantify the relative regrowth velocity of the
cells which survived after treatment intervention. The average of all parameters
described above is termed the long-term survival index (LSI). HDAC activity inhibition
in both cell lines, particularly after treatment with 5 mM NaB, resulted in a robust
.CC-BY-NC-ND 4.0 International licenseIt is made available under a (which was not peer-reviewed) is the author/funder, who has granted bioRxiv a license to display the preprint in perpetuity.
The copyright holder for this preprint. http://dx.doi.org/10.1101/191700doi: bioRxiv preprint first posted online Sep. 20, 2017;

18
decrease in RPR and RTCT parameters (Fig. 4c), except the RPR parameter in which
there was no significant change in SK-ES 1 cells (data not shown). These findings
indicate that the effects of NaB can persist in the long-term to delay the regrowth of the
EWS cell population.
Finally, we performed a colony formation assay for 10 days in drug free media,
after a 72-h exposure to NaB. There was a significant reduction in the number of
colonies in both cell lines after exposure to NaB. Moreover, there was a significant
decrease in the size of the colonies in SK-ES 1 cells after exposure to 5 mM NaB (Fig.
4d). These results indicate that the decrease in cell growth is also associated with the
cells’ colony-forming capability.
Fig. 4 should be inserted here
HDAC inhibition reduces the expression of pluripotency-associated genes
Previous studies have shown that the EWSR1/FLI-1 oncoprotein stimulates the
pluripotency gene BMI-1, thus influencing EWS cell self-renewal [7]. We sought to
evaluate by immunoblot analysis whether the expression of key pluripotency
transcriptional regulators NANOG, c-MYC, OCT3/4, KLF4, BMI-1 and ALDH1A1
were altered because of HDAC inhibition by NaB. Both SK-ES 1 and RD-ES cells
showed a 2–3-fold reduction in the levels of pluripotency-associated genes OCT3/4, c-
.CC-BY-NC-ND 4.0 International licenseIt is made available under a (which was not peer-reviewed) is the author/funder, who has granted bioRxiv a license to display the preprint in perpetuity.
The copyright holder for this preprint. http://dx.doi.org/10.1101/191700doi: bioRxiv preprint first posted online Sep. 20, 2017;

19
MYC and BMI-1 compared to untreated control cells. The levels of KLF4, NANOG
and ALDH1A1 decreased in SK-ES 1 cells but were relatively unchanged or increased
in RD-ES cells (Fig. 5a, 5b; Supplementary Fig. S2, S3). Thus, SK-ES 1 cells show
higher sensitivity to NaB regarding inhibition of pluripotency-associated genes.
Given that we observed morphological changes in EWS cells after NaB
exposure, we asked whether the SSC-A parameter that measure complexity and
granularity in flow cytometry is altered in EWS cell population after the
pharmacological intervention by NaB. Interestingly, both EWS cell lines exposed to
NaB showed an approximately 2-fold increase in complexity or granularity measured by
the SSC-A mean parameter in flow cytometry (Fig. 6a, 6b). These data provide a
measurement parameter related to cell morphology alterations along EWS cell
population. In addition, this alteration was accompanied by cell morphology changes
with formation of neurite-like extensions (Fig. 6c). Furthermore, we assessed the
expression level of the neural differentiation marker β-III Tubulin (TUBB3) (Fig. 6d).
We observed an increase in TUBB3 in cells exposed to HDAC activity inhibition by
NaB, with a 2-fold enhancement in protein levels compared to controls. These findings
suggest that HDAC activity inhibition may act to reduce the expression of a set of genes
related to pluripotency in EWS cells.
Fig. 5 should be inserted here
.CC-BY-NC-ND 4.0 International licenseIt is made available under a (which was not peer-reviewed) is the author/funder, who has granted bioRxiv a license to display the preprint in perpetuity.
The copyright holder for this preprint. http://dx.doi.org/10.1101/191700doi: bioRxiv preprint first posted online Sep. 20, 2017;

20
Fig. 6 should be inserted here
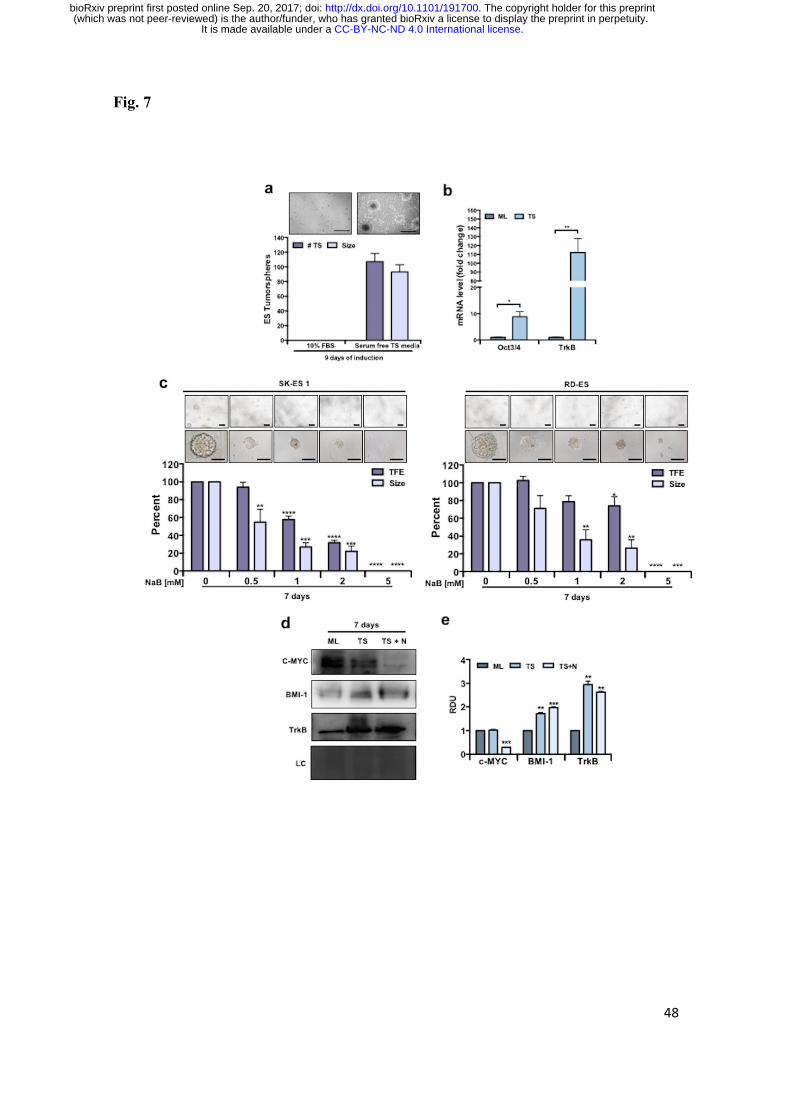
HDAC Inhibition Impairs EWS Tumorsphere Formation
Cancer stem cells displaying tumor-initiating properties and treatment resistance ability
have been identified and characterized in EWS [27]. Tumorsphere (TS)-forming assays
have been widely used as models to study cancer stem cell-enriched cultures [28]. To
verify whether HDAC inhibition altered TS-forming ability of EWS in vitro, we
measured TS-formation efficiency (TFE) and size through optical microscopy after
exposure of cells to NaB in a serum-free TS-inducing medium for 7 days (Fig. 7a). The
contents of the stem cell marker OCT3/4 and TrkB were increased in cells from TS
compared to ML (Fig. 7b, 7e). NaB significantly reduced TFE in both cell lines. In
addition, NaB reduced the size of EWS tumorspheres (Fig. 7c, 7d; Supplementary Fig.
S4). It is noteworthy that the higher dose of NaB (5 mM) fully impaired the cells’
ability to produce tumorspheres. Interestingly, the levels of BMI-1 were also increased
in TS compared to cells in the ML, and NaB significantly reduced the levels of c-MYC
in TS cells (Fig. 7d, 7e). These findings indicate that OCT3/4, TrkB, and BMI-1 are
increased in EWS TS cultures, and suggest that HDis can repress c-MYC expression in
EWS cancer stem cells and decrease their ability to expand and survive.
.CC-BY-NC-ND 4.0 International licenseIt is made available under a (which was not peer-reviewed) is the author/funder, who has granted bioRxiv a license to display the preprint in perpetuity.
The copyright holder for this preprint. http://dx.doi.org/10.1101/191700doi: bioRxiv preprint first posted online Sep. 20, 2017;

21
Fig. 7 should be inserted here
Discussion
Inhibition of HDAC activity has become an increasingly investigated experimental
approach, given its potential to ameliorate the aberrant epigenetic state that underlies a
variety of cancers and allow the expression of silenced genes that can promote cell
death or differentiation. We found that NaB efficiently inhibits HDAC global activity in
EWS cells and decreases EWS-FLI1 mRNA expression, cell growth, long-term
proliferation, and colony formation. Similar IC50 values for HDAC inhibition and cell
growth impairment were observed in both cell lines, leading to G1-phase accumulation.
These findings support previous reports of NaB arresting cell cycle, particularly at G1-
phase, and inducing cell differentiation and apoptosis in multiple cell lines [29-31].
SK-ES-1 and RD-ES cells are both derived from male patients of similar ages
(18 and 19 years, respectively), and both share features including the type of fusion to
the exons 7 from EWS and 5 from FLI1 (type 2), p53 missense mutation that result in a
nonfunctional p53 protein, lack of p21, and high p16INK4a expression [32, 33].
Overexpression of cyclins D (cyclin D1, D2, and D3) can drive aberrant cell cycle
regulation and signaling in many human malignant tumors, including EWS tumors and
RD-ES cells [34, 35]. Inhibition of HDAC by NaB resulted in a decrease of cyclin D1
.CC-BY-NC-ND 4.0 International licenseIt is made available under a (which was not peer-reviewed) is the author/funder, who has granted bioRxiv a license to display the preprint in perpetuity.
The copyright holder for this preprint. http://dx.doi.org/10.1101/191700doi: bioRxiv preprint first posted online Sep. 20, 2017;
22
protein levels in both cell lines, similarly to what was previously reported in
neuroblastoma [36]. Expression levels of cyclin D1, a G1- phase regulator protein, may
represent an important component that controls growth arrest prior to cell differentiation
in EWS cells.
Polyploidy induction is a proposed mechanism by which HDis control tumor cell
growth. For instance, SAHA induced polyploidy in human colon cancer and breast
cancer cells, leading to senescence, particularly in cells harboring defective p21WAF1
or p53 [37]. In contrast, we observed a significant reduction in the proportion of cells
showing polyploidy after NaB exposure. HDAC inhibition induced changes in pathways
related to cell proliferation and survival in EWS cells, including components of
neurotrophin signaling. In other types of pediatric and neuroendocrine cancers,
differential neurotrophin and Trk expression is associated with patient prognosis and
tumor properties including angiogenesis, metastasis, and chemosensitivity [38]. In
EWS, we have recently shown enhanced expression of Trk in tumors, and reduced cell
growth and increased chemosensitivity after Trk inhibition [39]. Here we show that
NaB exposure in EWS cells resulted in a decrease in NGF and BDNF protein levels,
accompanied by reductions in components of the ERK and AKT pathways. Given that
neurotrophins are known to mediate neuronal survival via activation of ERK,
phosphatidylinositol 3-kinase (PI3K) and phospholipase Cγ (PLC- γ) [40], the findings
are consistent with the possibility that inhibition of global HDAC activity suppresses
Trk-mediated survival pathways in EWS cells.
We also observed a NaB-induced decrease in the levels of the mitotic marker H3
phos-S10. During mitosis in late G2 and M phase of cell cycle, post-translational
modification phosphorylation on serine 10 of histone 3 (H3 phos-S10) is taken as a
.CC-BY-NC-ND 4.0 International licenseIt is made available under a (which was not peer-reviewed) is the author/funder, who has granted bioRxiv a license to display the preprint in perpetuity.
The copyright holder for this preprint. http://dx.doi.org/10.1101/191700doi: bioRxiv preprint first posted online Sep. 20, 2017;

23
hallmark of condensed chromatin [41]. High levels of H3 phos-S10 in oncogene-
transformed cells and human cancer cells are associated with amplified activation of the
Ras-mitogen-activated protein kinase (MAPK)-MSK1 pathway [42]. Moreover, H3
phos-S10 overexpression is associated with chromosome instability that plays a role in
the maintenance of ploidy [43] and carcinogenesis [44]. There is a crucial role of
phosphorylation on serine 10 of histone 3 at the p21 promoter to activate p21 gene
through HDAC inhibition by trichostatin A [45]. Moreover, the application of the
mathematical modeling from CPD data described by Silva et al. [26], to evaluate the
long-term effects of NaB in the EWS population size, provided a relevant information
about the behavior of EWS cells after HDAC inhibition by NaB cells, once we observed
a delay in the regrowth of the EWS cell population. In this sense, this mathematical
modeling not only contributed to understand the acute effect but also the dynamic of
growth kinetic of the surviving population that were not eliminated by the treatment,
representing an important tool to study anticancer activities of HDAC inhibitors [19, 20,
26].
Carcinogenesis mediated by cancer stem cells may be considered a sort of
epigenetic reprograming where there is loss of expression of specific genes that control
differentiation and reactivation of genes specifying stemness [46]. Consistent with this
rationale, our results indicated that HDAC inhibition can reduce the expression of
several pluripotency-associated genes and this is associated with neurite outgrowth and
expression of the neuronal differentiation marker β-III tubulin. Some of the genes which
had their expression reduced by NaB in our experiments, including c-MYC and BMI-1,
can be upregulated by transcriptional changes induced by EWS/FLI [7, 10, 13, 15, 16,
47-49]. A microarray analysis report revealed that HDAC inhibition by TSA suppresses
pluripotency genes including as Nanog, Klf4, Sox2 and Sall4 in embryonic stem cells
.CC-BY-NC-ND 4.0 International licenseIt is made available under a (which was not peer-reviewed) is the author/funder, who has granted bioRxiv a license to display the preprint in perpetuity.
The copyright holder for this preprint. http://dx.doi.org/10.1101/191700doi: bioRxiv preprint first posted online Sep. 20, 2017;
24
while activating differentiation-related genes [50]. β-III tubulin is a neuron-specific
marker and is expressed in early postmitotic and differentiated neurons [51], hence this
differentiation neuronal marker has been used to evaluate neural differentiation in EWS
[52, 53]. Our findings provide early evidence consistent with the possibility that HDis
can reprogram EWS cells towards neural differentiation, although further experiments
are required to characterize the possible neural phenotype of HDi-treated EWS cells.
Sphere formation in cancer cell cultures is a widely used platform for cancer
stem cell expansion. Cells from tumorspheres had higher levels of pluripotency-related
genes such as OCT3/4 and BMI-1, supporting a stem cell phenotype. In addition,
tumorspheres showed higher levels of TrkB compared to cells grown in monolayer,
suggesting a possible increase in neurotrophin signaling in EWS stem cells [54].
Importantly, NaB reduced sphere formation, indicating that it is capable of targeting
EWS stem cells.
Mechanisms other than histone acetylation may be involved in the effects of
NaB in cancer cells. Histone lysine butyrylation is another type of epigenetic post-
translational mark that can cooperate or compete with acetylation to promote gene
expression programs [55-57]. Increases in butyrylation in neuroblastoma cells after
exposure to SAHA have been reported [58]. It should also be noted that NaB has been
shown to enhance cAMP levels and stimulate the activation of multiple protein kinase
pathways through mechanisms at least partially mediated by effects independent of
epigenetic influences, through direct interactions with cAMP/PKA signaling in the
cytoplasm [59-61]. Thus, we cannot exclude the possibility that NaB-induced effects on
cell machinery components other than HDACs are involved in our findings.
This study has several limitations that will need to be addressed by further
experiments. For instance, the mechanistic relationship among the actions of NaB, the
.CC-BY-NC-ND 4.0 International licenseIt is made available under a (which was not peer-reviewed) is the author/funder, who has granted bioRxiv a license to display the preprint in perpetuity.
The copyright holder for this preprint. http://dx.doi.org/10.1101/191700doi: bioRxiv preprint first posted online Sep. 20, 2017;

25
reduction in EWS-FLI1 expression, and the reduced expression of the other target genes
remains highly speculative. In addition, histone acetylation changes after HDi treatment
should be measured. Furthermore, the effects of different HDis should be compared,
and confirmed in in vivo models.
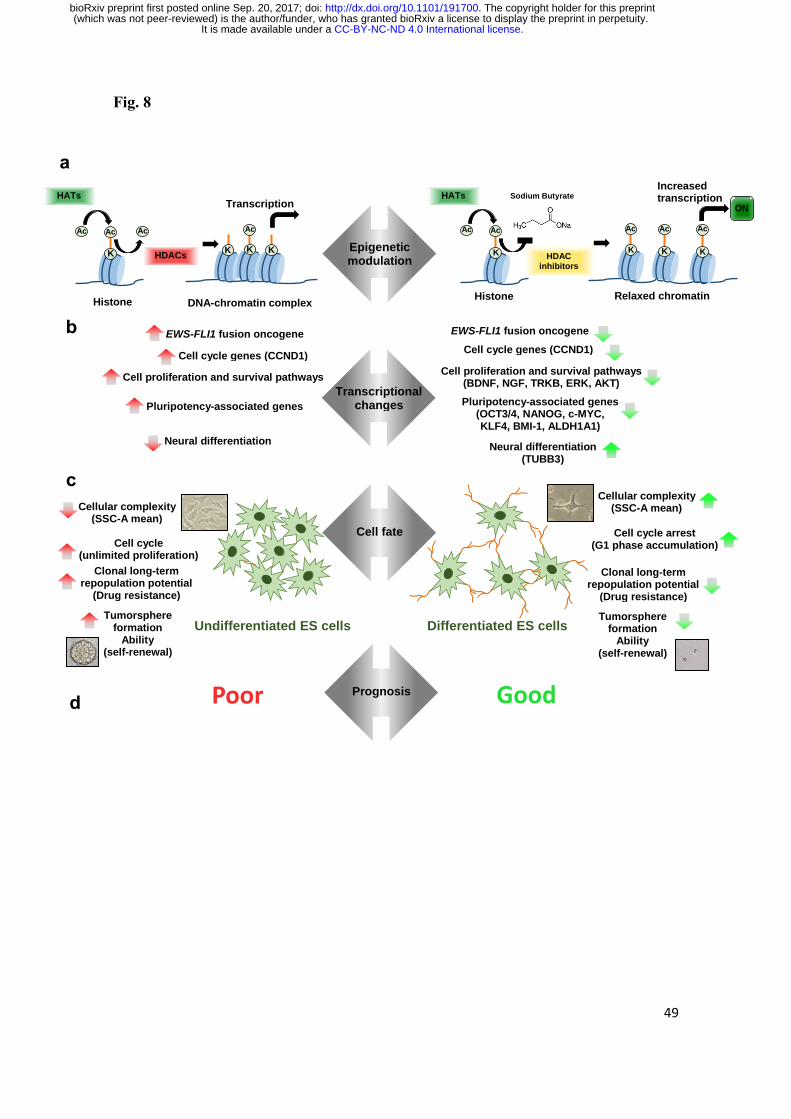
A schematic model of the biological actions of NaB in EWS is depicted in Fig.
8. This model proposes a mechanism by which NaB acts through HDAC inhibition on
transcriptional regulators to change the differentiation status of EWS cells. Together,
our results indicate that HDis can reduce EWS growth and survival and lead to a more
differentiated state. It is noteworthy that these data are consistent with our previous
findings indicating that HDis can impair cell growth and modulate differentiation of
cells from other types of childhood pediatric tumors possibly originating from neural
stem cells, medulloblastoma and neuroblastoma [62, 63].
Fig. 8 should be inserted here
Acknowledgements
This research was supported by PRONON/Ministry of Health, Brazil (number
25000.162.034/2014-21); the Children’s Cancer Institute (ICI); the National Council for
Scientific and Technological Development (CNPq; grant number 303276/2013-4 to
R.R.); the Rio Grande do Sul State Research Foundation (FAPERGS; grant number
.CC-BY-NC-ND 4.0 International licenseIt is made available under a (which was not peer-reviewed) is the author/funder, who has granted bioRxiv a license to display the preprint in perpetuity.
The copyright holder for this preprint. http://dx.doi.org/10.1101/191700doi: bioRxiv preprint first posted online Sep. 20, 2017;

26
17/2551-0001 to R.R.); the Coordination for the Improvement of Higher Education
Personnel (CAPES; to B.K.S.); the Clinical Hospital institutional research fund
(FIPE/HCPA); and the Center for Cancer Research, National Cancer Institute, National
Institutes of Health (C.J.T.).
.CC-BY-NC-ND 4.0 International licenseIt is made available under a (which was not peer-reviewed) is the author/funder, who has granted bioRxiv a license to display the preprint in perpetuity.
The copyright holder for this preprint. http://dx.doi.org/10.1101/191700doi: bioRxiv preprint first posted online Sep. 20, 2017;

27
REFERENCES
1. Balamuth NJ, Womer RB (2010) Ewing’s sarcoma. Lancet Oncol 11: 184–192.
2. Gaspar N, Hawkins DS, Dirksen U, Lewis IJ, Ferrari S, Le Deley MC, Kovar H,
Grimer R, Whelan J, Claude L, Delattre O, Paulussen M, Picci P, Sundby Hall K,
van den Berg H, Ladenstein R, Michon J, Hjorth L, Judson I, Luksch R,
Bernstein ML, Marec-Bérard P, Brennan B, Craft AW, Womer RB, Juergens H,
Oberlin O (2015) Ewing sarcoma: Current management and future approaches
through collaboration. J Clin Oncol 33: 3036–3046.
3. Ross KA, Smyth NA, Murawski CD, Kennedy JG (2013) The biology of Ewing
sarcoma. ISRN Oncol 2013:759725.
4. Cavazzana AO, Miser JS, Jefferson J, Triche TJ (1987) Experimental evidence
for a neural origin of Ewing’s sarcoma of bone. Am J Pathol 127: 507–518.
5. Parham DM, Hijazi Y, Steinberg SM, Meyer WH, Horowitz M, Tzen CY,
Wexler LH, Tsokos M (1999) Neuroectodermal differentiation in ewing’s
sarcoma family of tumors does not predict tumor behavior. Hum Pathol 30: 911–
918.
6. Staege MS, Hutter C, Neumann I, Foja S, Hattenhorst UE, Hansen G, Afar D,
Burdach SE (2004) DNA microarrays reveal relationship of Ewing family tumors
to both endothelial and fetal neural crest-derived cells and define novel targets.
Cancer Res 64: 8213–8221.
7. von Levetzow C, Jiang X, Gwye Y, von Levetzow G, Hung L, Cooper A, Hsu
.CC-BY-NC-ND 4.0 International licenseIt is made available under a (which was not peer-reviewed) is the author/funder, who has granted bioRxiv a license to display the preprint in perpetuity.
The copyright holder for this preprint. http://dx.doi.org/10.1101/191700doi: bioRxiv preprint first posted online Sep. 20, 2017;
28
JH, Lawlor ER (2011) Modeling initiation of ewing sarcoma in human neural
crest cells. PLoS One 6: 1–10.
8. Miyagawa Y, Okita H, Nakaijima H, Horiuchi Y, Sato B, Taguchi T, Toyoda M,
Katagiri YU, Fujimoto J, Hata J, Umezawa A, Kiyokawa N (2008) Inducible
expression of chimeric EWS/ETS proteins confers Ewing’s family tumor-like
phenotypes to human mesenchymal progenitor cells. Mol Cell Biol 28: 2125–
2137.
9. Riggi N, Cironi L, Provero P, Suvà ML, Kaloulis K, Garcia-Echeverria C,
Hoffmann F, Trumpp A, Stamenkovic I (2005) Development of Ewing’s sarcoma
from primary bone marrow-derived mesenchymal progenitor cells. Cancer Res
65: 11459–11468.
10. Riggi N, Suvà ML, Suvà D, Cironi L, Provero P, Tercier S, Joseph JM, Stehle
JC, Baumer K, Kindler V, Stamenkovic I (2008) EWS-FLI-1 expression triggers
a ewing’s sarcoma initiation program in primary human mesenchymal stem cells.
Cancer Res 68: 2176–2185.
11. Tirode F, Laud-Duval K, Prieur A, Delorme B, Charbord P, Delattre O (2007)
Mesenchymal stem cell features of Ewing tumors. Cancer Cell 11: 421–429.
12. Straessler KM, Jones KB, Hu H, Jin H, van de Rijn M, Capecchi MR (2013)
Modeling clear cell sarcomagenesis in the mouse: cell of origin differentiation
state impacts tumor characteristics. Cancer Cell 23: 215-227.
13. Crompton BD, Stewart C, Taylor-Weiner A, Alexe G, Kurek KC, Calicchio ML,
Kiezun A, Carter SL, Shukla SA, Mehta SS, Thorner AR, de Torres C, Lavarino
C (2014) The genomic landscape of pediatric Ewing sarcoma. Cancer Discov 4:
.CC-BY-NC-ND 4.0 International licenseIt is made available under a (which was not peer-reviewed) is the author/funder, who has granted bioRxiv a license to display the preprint in perpetuity.
The copyright holder for this preprint. http://dx.doi.org/10.1101/191700doi: bioRxiv preprint first posted online Sep. 20, 2017;

29
1326–1341.
14. Lawlor ER, Thiele CJ (2012) Epigenetic changes in pediatric solid tumors:
Promising new targets. Clin Cancer Res 18: 2768–2779.
15. Riggi N, Knoechel B, Gillespie SM, Rheinbay E, Boulay G, Suvà ML, Rossetti
NE, Boonseng WE, Oksuz O, Cook EB, Formey A, Patel A, Gymrek M, Thapar
V, Deshpande V, Ting DT, Hornicek FJ, Nielsen GP, Stamenkovic I, Aryee MJ,
Bernstein BE, Rivera MN (2014) EWS-FLI1 utilizes divergent chromatin
remodeling mechanisms to directly activate or repress enhancer elements in
Ewing sarcoma. Cancer Cell 26: 668-681.
16. Sheffield NC, Pierron G, Klughammer J, Datlinger P, Schönegger A, Schuster M,
Hadler J, Surdez D, Guillemot D, Lapouble E, Freneaux P, Champigneulle J,
Bouvier R , Walder D, Ambros IM, Hutter C, Sorz E, Amaral AT, de Álava E,
Schallmoser K, Strunk D, Rinner B, Liegl-Atzwanger B, Huppertz B, Leithner A,
de Pinieux G, Terrier P, Laurence V, Michon J, Ladenstein R, Holter W,
Windhager R, Dirksen U, Ambros PF, Delattre O, Kovar H, Bock C, Tomazou
EM (2017) DNA methylation heterogeneity defines a disease spectrum in Ewing
sarcoma. Nat Med 23: 386-395.
17. Gomez NC, Hepperla AJ, Dumitru R, Simon JM, Fang F, Davis IJ (2016)
Widespread chromatin accessibility at repetitive elements links stem cells with
human cancer. Cell Rep 17: 1607-1620.
18. Kouzarides T (2007) Chromatin modifications and their function. Cell 128: 693–
705.
19. Bolden JE, Peart MJ, Johnstone RW (2006) Anticancer activities of histone
.CC-BY-NC-ND 4.0 International licenseIt is made available under a (which was not peer-reviewed) is the author/funder, who has granted bioRxiv a license to display the preprint in perpetuity.
The copyright holder for this preprint. http://dx.doi.org/10.1101/191700doi: bioRxiv preprint first posted online Sep. 20, 2017;

30
deacetylase inhibitors. Nat Rev Drug Discov 5: 769–784.
20. Mottamal M, Zheng S, Huang TL, Wang G (2015) Histone deacetylase inhibitors
in clinical studies as templates for new anticancer agents. Molecules 20: 3898–
3941.
21. Candido EPM, Reeves R, Davie JR (1978) Sodium butyrate inhibits histone
deacetylation in cultured cells. Cell 14: 105–113.
22. dos Santos MP, de Farias CB, Roesler R, Brunetto AL, Abujamra AL (2014) In
vitro antitumor effect of sodium butyrate and zoledronic acid combined with
traditional chemotherapeutic drugs: A paradigm of synergistic molecular
targeting in the treatment of Ewing sarcoma. Oncol Rep 31: 955–968.
23. Unland R, Clemens D, Heinicke U, Potratz JC, Hotfilder M, Fulda S,
Wardelmann E, Frühwald MC, Dirksen U (2015) Suberoylanilide hydroxamic
acid synergistically enhances the antitumor activity of etoposide in Ewing
sarcoma cell lines. Anticancer Drugs 26: 843–851.
24. Sonnemann J, Dreyer L, Hartwig M, Palani CD, Hong le TT, Klier U, Bröker B,
Völker U, Beck JF (2007) Histone deacetylase inhibitors induce cell death and
enhance the apoptosis-inducing activity of TRAIL in Ewing’s sarcoma cells. J
Cancer Res Clin Oncol 133: 847–858.
25. Silva AO, Felipe KB, Villodre ES, Lopez PLC, Lenz G (2016) A guide for the
analysis of long-term population growth in cancer. Tumour Biol 37: 13743-
13749.
26. Leuchte K, Altvater B, Hoffschlag S, Potratz J, Meltzer J, Clemens D, Luecke A,
Hardes J, Dirksen U, Juergens H, Kailayangiri S, Rossig C (2014) Anchorage-
.CC-BY-NC-ND 4.0 International licenseIt is made available under a (which was not peer-reviewed) is the author/funder, who has granted bioRxiv a license to display the preprint in perpetuity.
The copyright holder for this preprint. http://dx.doi.org/10.1101/191700doi: bioRxiv preprint first posted online Sep. 20, 2017;

31
independent growth of ewing sarcoma cells under serum-free conditions is not
associated with stem-cell like phenotype and function. Oncol Rep 32: 845–852.
27. Suvà ML, Riggi N, Stehle JC, Baumer K, Tercier S, Joseph JM, Suvà D, Clément
V, Provero P, Cironi L, Osterheld MC, Guillou L, Stamenkovic I (2009)
Identification of cancer stem cells in Ewing's sarcoma. Cancer Res 69: 1776-
1781.
28. Pastrana E, Silva-Vargas V, Doetsch F (2011) Eyes wide open: a critical review
of sphere-formation as an assay for stem cells. Cell Stem Cell 8: 486-498.
29. Barnard JA, Warwick G (1993) Butyrate rapidly induces growth inhibition and
differentiation in HT-29 cells. Cell Growth Differ 4: 495–501.
30. Archer SY, Meng S, Shei A, Hodin RA. p21(WAF1) is required for butyrate-
mediated growth inhibition of human colon cancer cells (1998) Proc Natl Acad
Sci U S A 95: 6791–6796.
31. Jiang W, Guo Q, Wu J, Guo B, Wang Y, Zhao S, Lou H, Yu X, Mei X, Wu C,
Qiao S, Wu Y (2012) Dual effects of sodium butyrate on hepatocellular
carcinoma cells. Mol Biol Rep 39: 6235–6242.
32. Brohl AS, Solomon DA, Chang W, Wang J, Song Y, Sindiri S, Patidar R, Hurd
L, Chen L, Shern JF, Liao H, Wen X, Gerard J, Kim JS, Lopez Guerrero JA,
Machado I, Wai DH, Picci P, Triche T, Horvai AE, Miettinen M, Wei JS,
Catchpool D, Llombart-Bosch A, Waldman T, Khan J (2014) The genomic
landscape of the Ewing Sarcoma family of tumors reveals recurrent STAG2
mutation. PLoS Genet 10: e1004475.
33. Sakimura R, Tanaka K, Nakatani F, Matsunobu T, Li X, Hanada M, Okada T,
.CC-BY-NC-ND 4.0 International licenseIt is made available under a (which was not peer-reviewed) is the author/funder, who has granted bioRxiv a license to display the preprint in perpetuity.
The copyright holder for this preprint. http://dx.doi.org/10.1101/191700doi: bioRxiv preprint first posted online Sep. 20, 2017;

32
Nakamura T, Matsumoto Y, Iwamoto Y (2005) Antitumor effects of histone
deacetylase inhibitor on Ewing's family tumors. Int J Cancer 116: 784-792.
34. Hunter T, Pines J (1994) Cyclins and cancer. II: Cyclin D and CDK inhibitors
come of age. Cell 79: 573–582.
35. Zhang J, Hu S, Schofield DE, Sorensen PHB, Triche TJ (2004) Selective usage
of D-Type cyclins by Ewing’s tumors and rhabdomyosarcomas. Cancer Res 64:
6026–6034.
36. Lorenz V, Hessenkemper W, Rödiger J, Kyrylenko S, Kraft F, Baniahmad A
(2011) Sodium butyrate induces cellular senescence in neuroblastoma and
prostate cancer cells. Horm Mol Biol Clin Investig 7: 265–272.
37. Xu WS, Perez G, Ngo L, Gui CY, Marks PA (2005) Induction of polyploidy by
histone deacetylase inhibitor: a pathway for antitumor effects. Cancer Res 65:
7832-7839.
38. Thiele CJ, Li Z, McKee AE (2009) On Trk - the TrkB signal transduction
pathway is an increasingly important target in cancer biology. Clin Cancer Res
15: 5962–5967.
39. Heinen TE, Dos Santos RP, da Rocha A, Dos Santos MP, Lopez PL, Silva Filho
MA, Souza BK, Rivero LF, Becker RG, Gregianin LJ, Brunetto AL, Brunetto
AT, de Farias CB, Roesler R (2016) Trk inhibition reduces cell proliferation and
potentiates the effects of chemotherapeutic agents in Ewing sarcoma. Oncotarget
7: 34860-34880.
40. Reichardt LF (2006) Neurotrophin-regulated signalling pathways. Philos Trans R
Soc B Biol Sci 361: 1545–1564.
.CC-BY-NC-ND 4.0 International licenseIt is made available under a (which was not peer-reviewed) is the author/funder, who has granted bioRxiv a license to display the preprint in perpetuity.
The copyright holder for this preprint. http://dx.doi.org/10.1101/191700doi: bioRxiv preprint first posted online Sep. 20, 2017;

33
41. Hans F, Dimitrov S (2001) Histone H3 phosphorylation and cell division.
Oncogene 20: 3021–3027.
42. Strelkov IS, Davie JR (2002) Ser-10 phosphorylation of histone H3 and
immediate early gene expression in oncogene-transformed mouse fibroblasts.
Cancer Res 62: 75-78.
43. Ota T, Suto S, Katayama H, Han ZB, Suzuki F, Maeda M, Tanino M, Terada Y,
Tatsuka M (2002) Increased mitotic phosphorylation of histone H3 attributable to
AIM-1/Aurora-B overexpression contributes to chromosome number instability.
Cancer Res 62: 5168–5177.
44. Espino PS, Pritchard S, Heng HH, Davie JR (2009) Genomic instability and
histone H3 phosphorylation induction by the Ras-mitogen activated protein
kinase pathway in pancreatic cancer cells. Int J Cancer 124: 562–567.
45. Simboeck E, Sawicka A, Zupkovitz G, Senese S, Winter S, Dequiedt F, Ogris E,
Di Croce L, Chiocca S, Seiser C (2010) A phosphorylation switch regulates the
transcriptional activation of cell cycle regulator p21 by histone deacetylase
inhibitors. J Biol Chem 285: 41062–41073.
46. Shukla S, Meeran SM (2014) Epigenetics of cancer stem cells: Pathways and
therapeutics. Biochim Biophys Acta 1840: 3494–3502.
47. Sankar S, Bell R, Stephens B, Zhuo R, Sharma S, Bearss DJ, Lessnick SL (2013)
Mechanism and relevance of EWS/FLI-mediated transcriptional repression in
Ewing sarcoma. Oncogene 32: 5089-5100.
48. Svoboda LK, Harris A, Bailey NJ, Schwentner R, Tomazou E, von Levetzow C,
Magnuson B, Ljungman M, Kovar H, Lawlor ER (2014) Overexpression of HOX
.CC-BY-NC-ND 4.0 International licenseIt is made available under a (which was not peer-reviewed) is the author/funder, who has granted bioRxiv a license to display the preprint in perpetuity.
The copyright holder for this preprint. http://dx.doi.org/10.1101/191700doi: bioRxiv preprint first posted online Sep. 20, 2017;

34
genes is prevalent in Ewing sarcoma and is associated with altered epigenetic
regulation of developmental transcription programs. Epigenetics 9: 1613-1625.
49. Zwerner JP, Joo J, Warner KL, Christensen L, Hu-Lieskovan S, Triche TJ, May
WA (2008) The EWS/FLI1 oncogenic transcription factor deregulates GLI1.
Oncogene 27: 3282-3291.
50. Karantzali E, Schulz H, Hummel O, Hubner N, Hatzopoulos A, Kretsovali A
(2008) Histone deacetylase inhibition accelerates the early events of stem cell
differentiation: transcriptomic and epigenetic analysis. Genome Biol 9: R65.
51. Yang HK, Sundholm-Peters NL, Goings GE, Walker AS, Hyland K, Szele FG
(2004) Distribution of doublecortin expressing cells near the lateral ventricles in
the adult mouse brain. J Neurosci Res 76: 282–295.
52. Rocchi A, Manara M (2010) CD99 inhibits neural differentiation of human
Ewing sarcoma cells and thereby contributes to oncogenesis. J Clin Invest 120:
668–680.
53. Ventura S, Aryee DN, Felicetti F, De Feo A, Mancarella C, Manara MC, Picci P,
Colombo MP, Kovar H, Carè A, Scotlandi K (2016) CD99 regulates neural
differentiation of Ewing sarcoma cells through miR-34a-Notch-mediated control
of NF-κB signaling. Oncogene 35: 3944-3954.
54. Chopin V, Lagadec C, Toillon RA, Le Bourhis X (2016) Neurotrophin signaling
in cancer stem cells. Cell Mol Life Sci 73: 1859–1870.
55. Chen Y, Sprung R, Tang Y, Ball H, Sangras B, Kim SC, Falck JR, Peng J, Gu W,
Zhao Y (2007) Lysine propionylation and butyrylation are novel post-
translational modifications in histones. Mol Cell Proteomics 6: 812-819.
.CC-BY-NC-ND 4.0 International licenseIt is made available under a (which was not peer-reviewed) is the author/funder, who has granted bioRxiv a license to display the preprint in perpetuity.
The copyright holder for this preprint. http://dx.doi.org/10.1101/191700doi: bioRxiv preprint first posted online Sep. 20, 2017;
35
56. Choudhary C, Weinert BT, Nishida Y, Verdin E, Mann M (2014) The growing
landscape of lysine acetylation links metabolism and cell signalling. Nat Rev Mol
Cell Biol 15: 536-550.
57. Goudarzi A, Zhang D, Huang H, Barral S, Kwon OK, Qi S, Tang Z, Buchou T,
Vitte AL, He T, Cheng Z, Montellier E, Gaucher J, Curtet S, Debernardi A,
Charbonnier G, Puthier D, Petosa C, Panne D, Rousseaux S, Roeder RG, Zhao Y,
Khochbin S (2016) Dynamic competing histone H4 K5K8 acetylation and
butyrylation are hallmarks of highly active gene promoters. Mol Cell 62: 169-
180.
58. Xu G, Wang J, Wu Z, Qian L, Dai L, Wan X, Tan M, Zhao Y, Wu Y (2014)
SAHA regulates histone acetylation, butyrylation, and protein expression in
neuroblastoma. J Proteome Res 13: 4211-4219.
59. Prasad KN, Sinha PK (1976) Effect of sodium butyrate on mammalian cells in
culture: a review. In Vitro 12: 125-132.
60. Rivero JA, Adunyah SE (1996) Sodium butyrate induces tyrosine
phosphorylation and activation of MAP kinase (ERK-1) in human K562 cells.
Biochem Biophys Res Commun 224: 796-801.
61. Rivero JA, Adunyah SE (1998) Sodium butyrate stimulates PKC activation and
induces differential expression of certain PKC isoforms during erythroid
differentiation. Biochem Biophys Res Commun 248: 664-668.
62. Nör C, Sassi FA, de Farias CB, Schwartsmann G, Abujamra AL, Lenz G,
Brunetto AL, Roesler R (2013) The histone deacetylase inhibitor sodium butyrate
promotes cell death and differentiation and reduces neurosphere formation in
.CC-BY-NC-ND 4.0 International licenseIt is made available under a (which was not peer-reviewed) is the author/funder, who has granted bioRxiv a license to display the preprint in perpetuity.
The copyright holder for this preprint. http://dx.doi.org/10.1101/191700doi: bioRxiv preprint first posted online Sep. 20, 2017;

36
human medulloblastoma cells. Mol. Neurobiol 48: 533–543.
63. Almeida VR, Vieira IA, Buendia M, Brunetto AT, Gregianin LJ, Brunetto AL,
Klamt F, de Farias CB, Abujamra AL, Lopez PL, Roesler R (2017) Combined
treatments with a retinoid receptor agonist and epigenetic modulators in human
neuroblastoma cells. Mol Neurobiol 54: 7610-7619.
.CC-BY-NC-ND 4.0 International licenseIt is made available under a (which was not peer-reviewed) is the author/funder, who has granted bioRxiv a license to display the preprint in perpetuity.
The copyright holder for this preprint. http://dx.doi.org/10.1101/191700doi: bioRxiv preprint first posted online Sep. 20, 2017;

37
Figure Legends
Fig. 1 HDAC Inhibition by NaB hinders the growth of EWS cells. a HDAC activity
(%) in EWS cell lines SK-ES 1 and RD-ES after 1 h of exposure to NaB; N = 4
independent experiments. b Percent of viable SK-ES 1 and RD-ES cells after 72 h of
exposure to NaB; N = 4 independent experiments. c Morphology of EWS SK-ES 1
(upper panel) and RD-ES (lower panel) cells after 72 h of NaB exposure; black arrows
indicates neurite-like extensions (NE). Scale bar: 50 μm. d Heat map showing the target
IC50 calculated by the percentage of HDAC activity in cells exposed to NaB for 1 h, and
biological IC50 calculated by the percent of viable cells exposed to NaB for 72 h. e
EWS-FLI1 mRNA levels in EWS cell lines SK-ES 1 and RD-ES after 1.5 mM of NaB
exposure for 1 and 3 h. Gene expression levels were normalized by gapdh mRNA level
and corrected by untreated EWS cells; N = 3 independent experiments. Data in the
graphs are shown as mean ± SEM; * p < 0.05, ** p < 0.01, *** p < 0.001, **** p <
0.0001 vs. controls.
Fig. 2 Cell cycle changes induced by HDAC inhibition in EWS cells. a Cell cycle
distribution of EWS SK-ES 1 (upper panel) and RD-ES (lower panel) cells after 35 h of
NaB exposure; N = 3 independent experiments. c Representative images of H3 phos-
S10 level (immunofluorescence) from SK-ES 1 (upper panel) and RD-ES (lower panel)
cells exposed to NaB for 72 h. c Percent of H3 phos-S10 mean intensity
(immunofluorescence) from EWS cell lines exposed to NaB for 72 h; N = 3 independent
experiments. d Western blot (upper panel) of Cyclin D1 protein levels in EWS cells
.CC-BY-NC-ND 4.0 International licenseIt is made available under a (which was not peer-reviewed) is the author/funder, who has granted bioRxiv a license to display the preprint in perpetuity.
The copyright holder for this preprint. http://dx.doi.org/10.1101/191700doi: bioRxiv preprint first posted online Sep. 20, 2017;

38
exposed to NaB for 72 h, and Relative Densitometric Unit (RDU) analysis (lower panel)
normalized by ACTB, and corrected by control. Data in the graphs are shown as mean ±
SEM; * p < 0.05, ** p < 0.01, *** p < 0.001, **** p < 0.0001 vs. controls.
Fig. 3 HDAC activity inhibition decreases components of signaling pathways related to
proliferation and survival in EWS cells. a Western Blot of BDNF and NGF from SK-ES
1 (left) and RD-ES (right) cells exposed to NaB for 72 h. b Percent of TrkB mean
intensity (immunofluorescence). c Representative images of TrkB level
(immunofluorescence) from SK-ES 1 (upper panel) and RD-ES (lower panel) cells
exposed to NaB for 72 h. d Western Blot analysis of pERK, ERK1, pAKT(Ser473),
AKT in SK-ES 1 (left panel) and RD-ES (right panel) cells. e Radar graph showing
Relative Densitometric Unit (RDU) analysis were normalized by ACTB, except for
pERK and pAKT(Ser473), which were normalized by total ERK1 and AKT,
respectively, and corrected relative to control cells. Data in the graph are shown as mean
± SEM from three independent experiments; * p < 0.05, ** p < 0.01, **** p < 0.0001
vs. controls.
Fig. 4 Persistent inhibition of cell proliferation rate and colony formation ability in
EWS cells treated with NaB. a Cumulative Population Doubling (CPD) in vitro assay
schematic and timeline. b Cumulative CPD from SK-ES1 (upper panel) and RD-ES
(lower panel) EWS cells after 72 h of NaB treatment plus 16 days in a drug free media,
plus 19 days of a mathematical prediction (total 35 days); N = 3 independent
experiments. c CPD profile from SK-ES1 (upper) and RD-ES (lower) EWS cells after
72 h of NaB (5 mM). (Green square – RendCPD, Blue diamond – rAUC, yellow circle –
.CC-BY-NC-ND 4.0 International licenseIt is made available under a (which was not peer-reviewed) is the author/funder, who has granted bioRxiv a license to display the preprint in perpetuity.
The copyright holder for this preprint. http://dx.doi.org/10.1101/191700doi: bioRxiv preprint first posted online Sep. 20, 2017;

39
RPR, red triangle – RTCT, black line – LSI). d Colony formation in SK-ES1 (left panel)
and RD-ES (right panel) cells after 72h of NaB exposure plus 10 days in a drug free
media, measured by percent of colony number and size; N = 3 independent experiments.
Data in the graphs are shown as mean ± S.E.M; * p < 0.05, ** p < 0.01, *** p < 0.001,
**** p < 0.0001 vs. controls.
Fig. 5 Changes in the expression of pluripotency-associated genes induced by HDAC
inhibition in EWS cells. a Western Blot analysis of pluripotency-associated genes in
SK-ES 1 (left panel) and RD-ES (right panel) cells after 72 h of exposure to NaB. b
Radar graph showing Relative Densitometric Unit (RDU) analyses normalized by
ACTB level, and corrected by control; * p < 0.05, ** p < 0.01, *** p < 0.001 vs.
controls.
Fig. 6 Cell complexity and differentiation of EWS cells after HDAC inhibition. a
Representative scatter plot from SK-ES 1 (upper) and RD-ES (lower) exposed to NaB
for 72 h, measured by cytometric analysis. b Percent of SSC-A mean from EWS cells
exposed with the indicated concentrations of NaB for 72 h; N = 4 independent
experiments. c Morphology of SK-ES 1 (upper panel) and RD-ES cells (lower panel)
after 72 h of NaB exposure; black arrows indicate neurite-like extensions (NE). Scale
bar: 50μm. d Western Blot analysis of the differentiation neural marker TUBB3 (upper
panel); N = 3 independent experiments, and Relative Densitometric Unit (RDU)
analyses (lower panel) normalized by ACTB, and corrected by control. Data in the
graph are shown as mean ± SEM; * p < 0.05, ** p < 0.01 vs. controls.
.CC-BY-NC-ND 4.0 International licenseIt is made available under a (which was not peer-reviewed) is the author/funder, who has granted bioRxiv a license to display the preprint in perpetuity.
The copyright holder for this preprint. http://dx.doi.org/10.1101/191700doi: bioRxiv preprint first posted online Sep. 20, 2017;

40
Fig. 7 Reduced tumorsphere formation in EWS cells after HDAC inhibition. a Percent
of number and size of EWS tumorspheres from SK-ES 1 induced with a serum-free
tumorspheres medium compared with 10% FBS medium for 9 days; N = 3 independent
experiments. b OCT3/4 and TrkB mRNA levels in SK-ES 1 cells grown in monolayer
(10% FBS medium) and tumorspheres (serum-free tumorspheres medium) induced for 9
days. Gene expression levels were normalized by gapdh level and corrected by
monolayer; N = 3 independent experiments. c Representative images from EWS
tumorspheres from SK-ES1 (upper left panel) and RD-ES (upper right panel) cells after
7 days of NaB exposure. The percentage of EWS tumorsphere formation efficiency
(TFE; i.e., number of tumorspheres normalized by the number of plated single cells and
corrected by control – shown in the lower panel - and the size of EWS tumorspheres is
shown. Only tumorspheres ≥ 80 µm were analyzed. Scale bars: 200 μm (upper), 100 μm
(lower); N = 3 independent experiments. d Western blot of c-MYC, BMI-1 and TrkB in
SK-ES 1 cells in monolayer (ML), Tumospheres (TS) induced for 7 days, and
tumospheres exposed to 1 mM of NaB for 7 days (TS + N); N = 3 independent
experiments. e Relative Densitometric Unit (RDU) analyses were normalized by
coomassie loading control, and corrected by monolayer. Data in the graphs are shown as
mean ± SEM; * p < 0.05, ** p < 0.01, *** p < 0.001, **** p < 0.0001 vs. controls.
Fig. 8 Schematic model depicting biological actions HDAC inhibition by NaB in EWS.
a Unbalance between the activities of histone acetyltransferases (HATs) and histone
deacetylases (HDACs) results in an aberrant epigenetic state that occurs often in EWS
cells. HDAC inhibitors such as NaB have been employed to revert this setting by
.CC-BY-NC-ND 4.0 International licenseIt is made available under a (which was not peer-reviewed) is the author/funder, who has granted bioRxiv a license to display the preprint in perpetuity.
The copyright holder for this preprint. http://dx.doi.org/10.1101/191700doi: bioRxiv preprint first posted online Sep. 20, 2017;

41
increasing histone acetylation and gene transcription. b As a result of epigenetic
dysregulation, EWS cells present an aberrant expression of genes associated cell cycle,
proliferation, survival, and pluripotency pathways. HDAC inhibition by NaB leads to
transcriptional change by suppressing cell cycle, proliferation, survival, and
pluripotency-associated genes, whereas de-repressing expression of the neural
differentiation protein TUBB3. c A poor differentiated phenotype is a feature of EWS.
HDAC inhibition change cell fate towards increased cellular complexity, arrested cell
growth by G1-phase accumulation, decreased long-term clonal repopulation and
reduced tumorsphere formation. d Inhibiting HDAC might epigenetically reprogram
EWS cells from an undifferentiated to a more differentiated state associated with a
better prognosis.
.CC-BY-NC-ND 4.0 International licenseIt is made available under a (which was not peer-reviewed) is the author/funder, who has granted bioRxiv a license to display the preprint in perpetuity.
The copyright holder for this preprint. http://dx.doi.org/10.1101/191700doi: bioRxiv preprint first posted online Sep. 20, 2017;

42
Fig. 1
.CC-BY-NC-ND 4.0 International licenseIt is made available under a (which was not peer-reviewed) is the author/funder, who has granted bioRxiv a license to display the preprint in perpetuity.
The copyright holder for this preprint. http://dx.doi.org/10.1101/191700doi: bioRxiv preprint first posted online Sep. 20, 2017;

43
Fig. 2
.CC-BY-NC-ND 4.0 International licenseIt is made available under a (which was not peer-reviewed) is the author/funder, who has granted bioRxiv a license to display the preprint in perpetuity.
The copyright holder for this preprint. http://dx.doi.org/10.1101/191700doi: bioRxiv preprint first posted online Sep. 20, 2017;
44
Fig. 3
.CC-BY-NC-ND 4.0 International licenseIt is made available under a (which was not peer-reviewed) is the author/funder, who has granted bioRxiv a license to display the preprint in perpetuity.
The copyright holder for this preprint. http://dx.doi.org/10.1101/191700doi: bioRxiv preprint first posted online Sep. 20, 2017;

45
Fig. 4
.CC-BY-NC-ND 4.0 International licenseIt is made available under a (which was not peer-reviewed) is the author/funder, who has granted bioRxiv a license to display the preprint in perpetuity.
The copyright holder for this preprint. http://dx.doi.org/10.1101/191700doi: bioRxiv preprint first posted online Sep. 20, 2017;

46
Fig. 5
.CC-BY-NC-ND 4.0 International licenseIt is made available under a (which was not peer-reviewed) is the author/funder, who has granted bioRxiv a license to display the preprint in perpetuity.
The copyright holder for this preprint. http://dx.doi.org/10.1101/191700doi: bioRxiv preprint first posted online Sep. 20, 2017;

47
Fig. 6
.CC-BY-NC-ND 4.0 International licenseIt is made available under a (which was not peer-reviewed) is the author/funder, who has granted bioRxiv a license to display the preprint in perpetuity.
The copyright holder for this preprint. http://dx.doi.org/10.1101/191700doi: bioRxiv preprint first posted online Sep. 20, 2017;
48
Fig. 7
.CC-BY-NC-ND 4.0 International licenseIt is made available under a (which was not peer-reviewed) is the author/funder, who has granted bioRxiv a license to display the preprint in perpetuity.
The copyright holder for this preprint. http://dx.doi.org/10.1101/191700doi: bioRxiv preprint first posted online Sep. 20, 2017;
49
Fig. 8
HDAC inhibitors
Cell cycle genes (CCND1)
Tumorsphere formation
Ability (self-renewal)
Clonal long-term repopulation potential
(Drug resistance)
Good
Differentiated ES cells
Poor
a
ON
Pluripotency-associated genes (OCT3/4, NANOG, c-MYC, KLF4, BMI-1, ALDH1A1)
Cell cycle genes (CCND1)
Neural differentiation (TUBB3)
Cellular complexity (SSC-A mean)
Cell cycle arrest (G1 phase accumulation)
Cell proliferation and survival pathways (BDNF, NGF, TRKB, ERK, AKT)
HATs
K
Ac Ac
HDACs
Ac Ac
K K K K
Ac Ac Ac
K
Ac
K
Ac
K
Transcription
Histone DNA-chromatin complex
Increased transcription
Epigenetic modulation
Transcriptional changes
Cell fate
Prognosis
Pluripotency-associated genes
Neural differentiation
Cell proliferation and survival pathways
Cellular complexity (SSC-A mean)
Tumorsphere formation
Ability (self-renewal)
Cell cycle (unlimited proliferation)
Clonal long-term repopulation potential
(Drug resistance)
Undifferentiated ES cells
Histone Relaxed chromatin
Sodium Butyrate
b
c
d
HATs
EWS-FLI1 fusion oncogene EWS-FLI1 fusion oncogene
.CC-BY-NC-ND 4.0 International licenseIt is made available under a (which was not peer-reviewed) is the author/funder, who has granted bioRxiv a license to display the preprint in perpetuity.
The copyright holder for this preprint. http://dx.doi.org/10.1101/191700doi: bioRxiv preprint first posted online Sep. 20, 2017;