Embed Size (px)
Citation preview
TAP Update
June, 2016
Robin O’Hara Deputy Executive Officer, TAP Michelle Navarro, Director, OMB Marcelo Melicor, Deputy Executive Officer, TAP
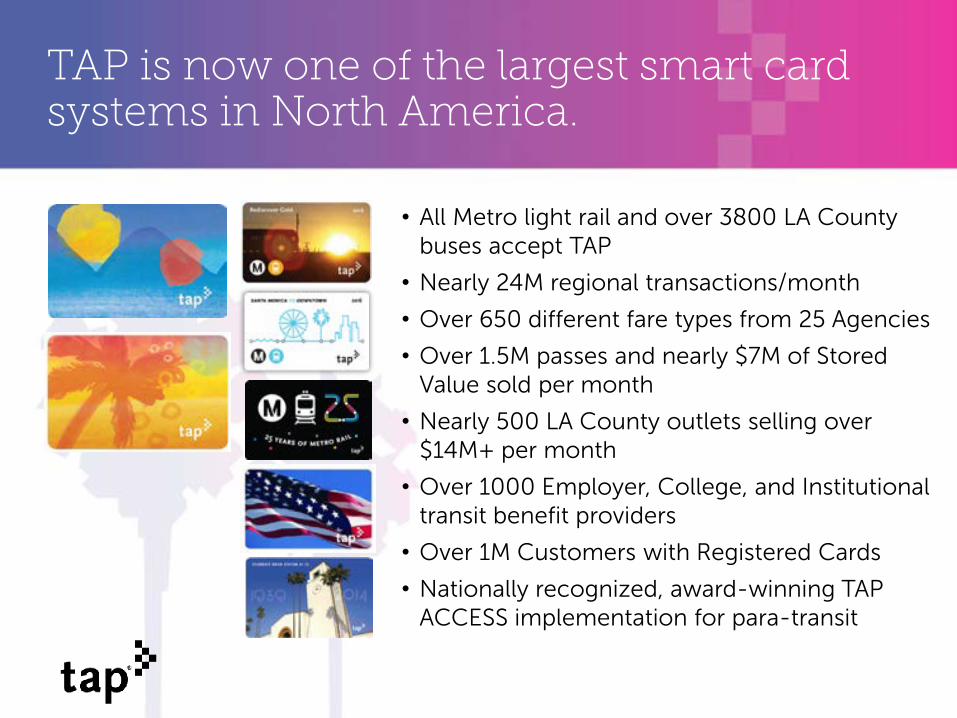
• All Metro light rail and over 3800 LA County buses accept TAP
• Nearly 24M regional transactions/month
• Over 650 different fare types from 25 Agencies
• Over 1.5M passes and nearly $7M of Stored Value sold per month
• Nearly 500 LA County outlets selling over $14M+ per month
• Over 1000 Employer, College, and Institutional transit benefit providers
• Over 1M Customers with Registered Cards
• Nationally recognized, award-winning TAP ACCESS implementation for para-transit
TAP is now one of the largest smart card systems in North America.
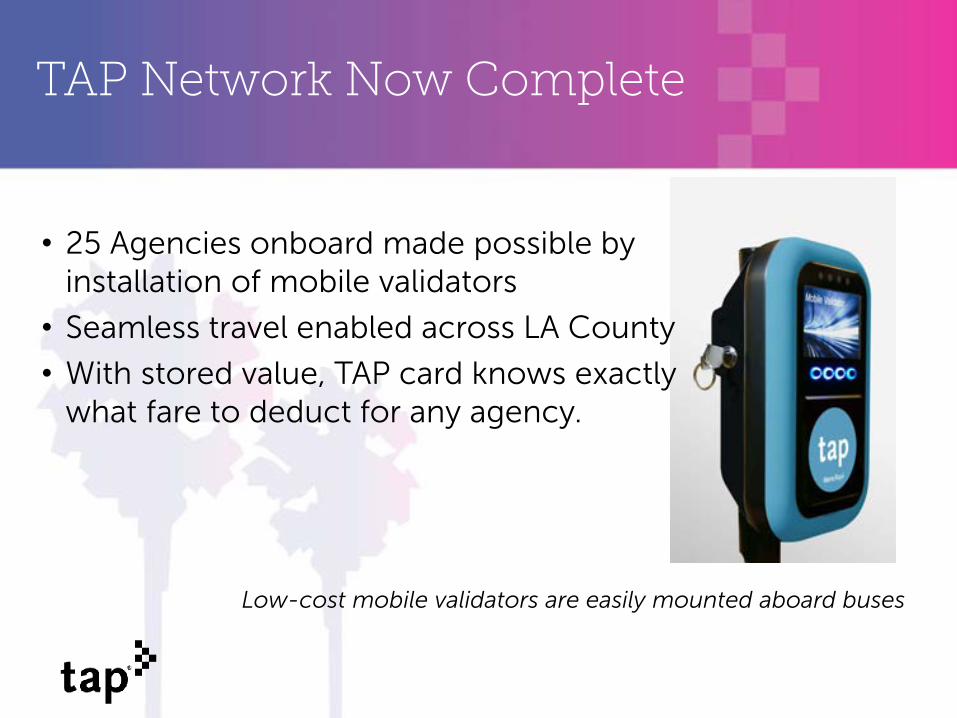
TAP Network Now Complete
• 25 Agencies onboard made possible by installation of mobile validators
• Seamless travel enabled across LA County
• With stored value, TAP card knows exactly what fare to deduct for any agency.
Low-cost mobile validators are easily mounted aboard buses
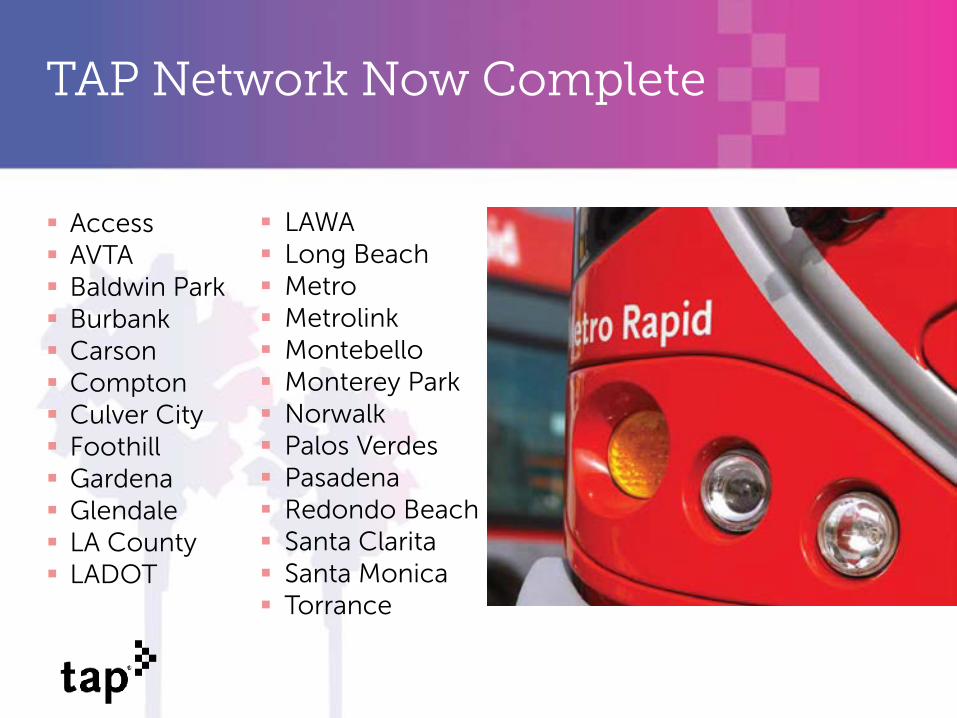
TAP Network Now Complete
LAWA Long Beach Metro Metrolink Montebello Monterey Park Norwalk Palos Verdes Pasadena Redondo Beach Santa Clarita Santa Monica Torrance
Access AVTA Baldwin Park Burbank Carson Compton Culver City Foothill Gardena Glendale LA County LADOT
• Limit engagement to their strengths
• Cubic: Devices & Nextfare transaction system
• TAP system accesses only the parts we need and combines into CRM system to complete our network
• TAP in-house work includes:
• Testing of fare tables and devices
• Fare system changes
• New product additions/deletions
• TVM screenflows
• Gate help phones
• Sheriffs’ fare checking devices
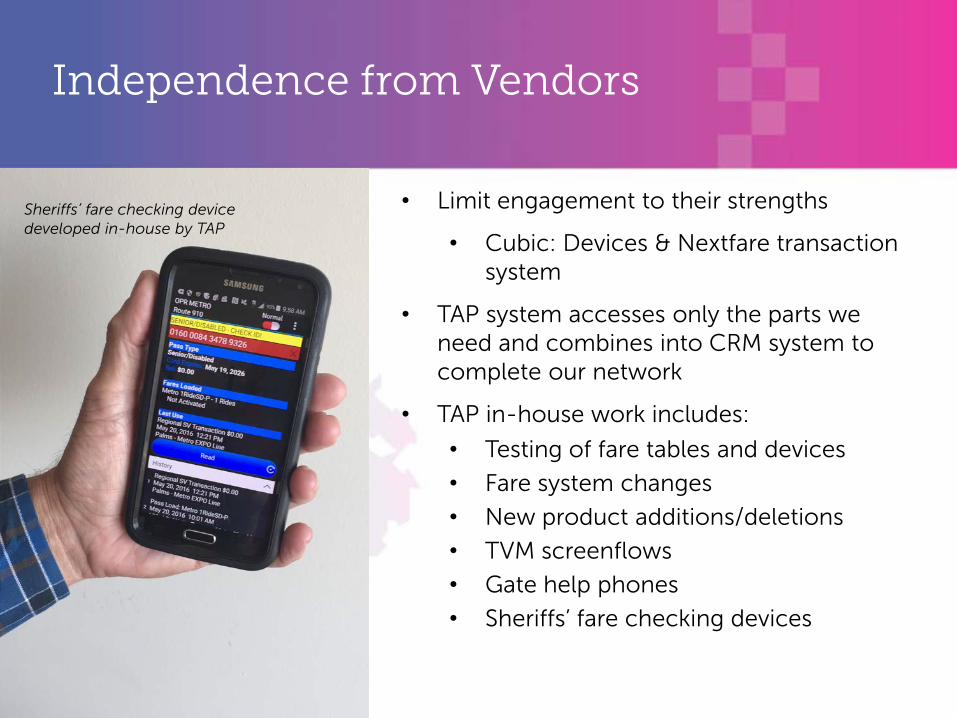
Independence from Vendors
Sheriffs’ fare checking device developed in-house by TAP
• 7 month implementation
• New, improved taptogo.net website
• Integration with
• Nextfare (fare equipment) system
• Card manufacturer (production & delivery of TAP)
• 8 departments at Metro for management of customer info
• Regional TAP Call Center
• Entry/tracking of Reduced Fare information
• Third party vendor sales network
New Customer Relationship Management (CRM) System: TAPforce
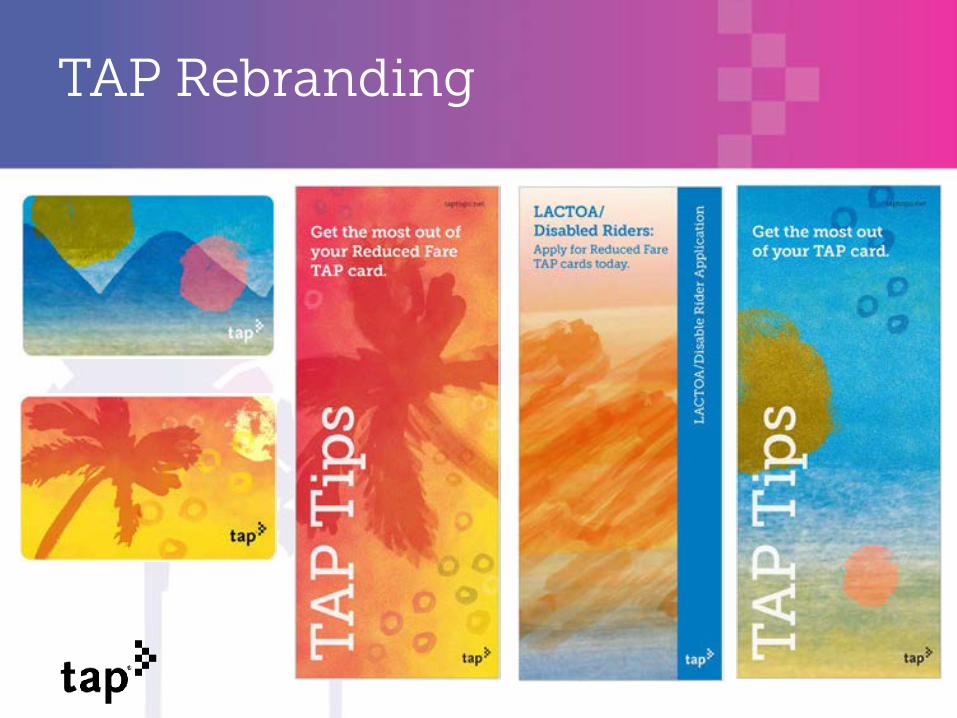
TAP Rebranding
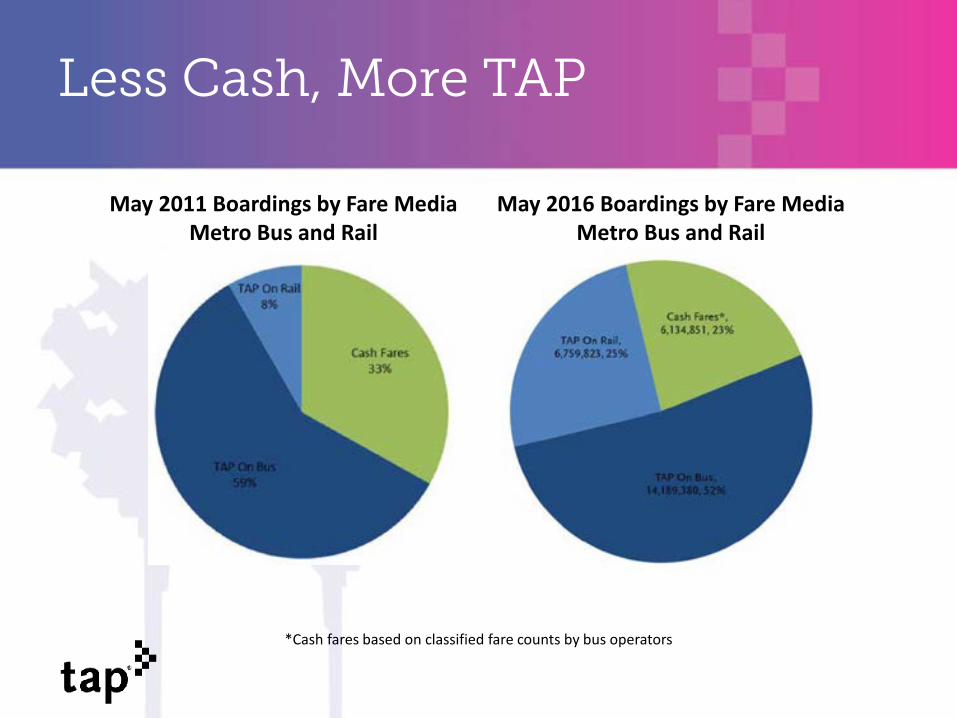
Less Cash, More TAP
May 2011 Boardings by Fare Media Metro Bus and Rail
May 2016 Boardings by Fare Media Metro Bus and Rail
*Cash fares based on classified fare counts by bus operators
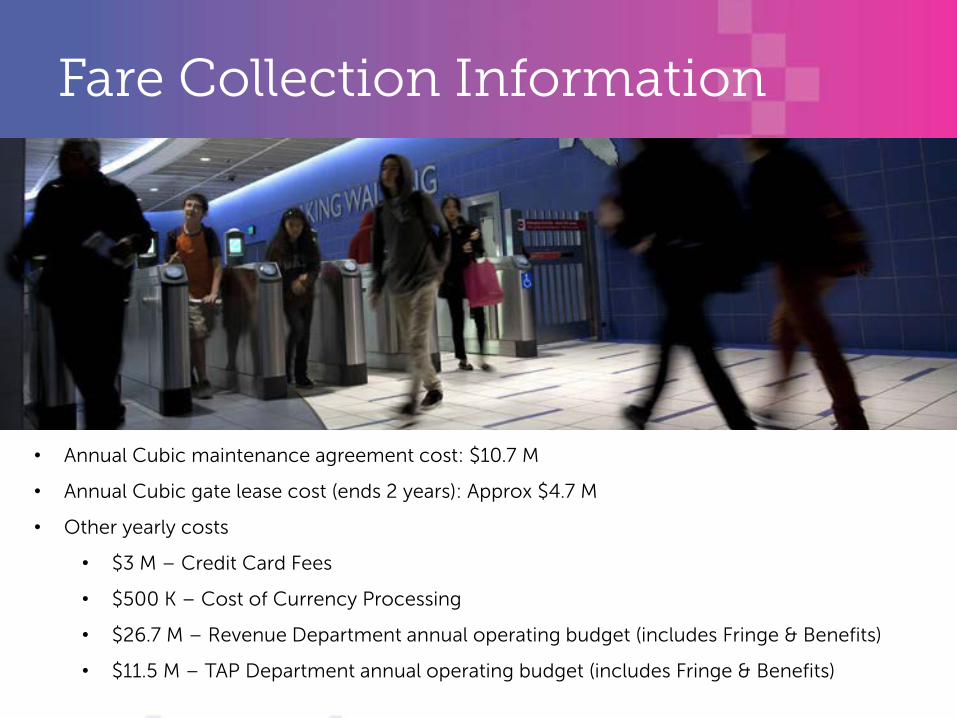
Fare Collection Information
• Annual Cubic maintenance agreement cost: $10.7 M
• Annual Cubic gate lease cost (ends 2 years): Approx $4.7 M
• Other yearly costs
• $3 M – Credit Card Fees
• $500 K – Cost of Currency Processing
• $26.7 M – Revenue Department annual operating budget (includes Fringe & Benefits)
• $11.5 M – TAP Department annual operating budget (includes Fringe & Benefits)
Future Plans
Bluetooth Pilot for ADA gates TAP Mobile App Regional Ticket Vending Machines TAP How-To Videos for Web Payment Card Industry Compliance Partnerships with Bikeshare, Parking, Uber,
EV Carshare, Mobility Hubs and more
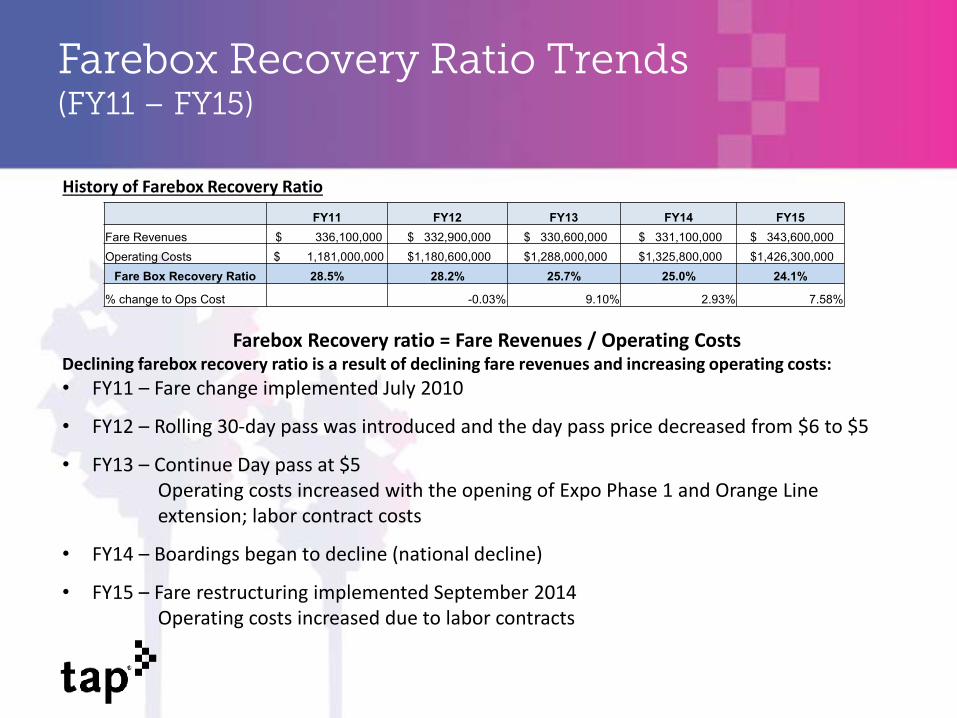
Farebox Recovery Ratio Trends (FY11 – FY15)
History of Farebox Recovery Ratio FY11 FY12 FY13 FY14 FY15
Fare Revenues $ 336,100,000 $ 332,900,000 $ 330,600,000 $ 331,100,000 $ 343,600,000 Operating Costs $ 1,181,000,000 $1,180,600,000 $1,288,000,000 $1,325,800,000 $1,426,300,000
Fare Box Recovery Ratio 28.5% 28.2% 25.7% 25.0% 24.1%
% change to Ops Cost -0.03% 9.10% 2.93% 7.58%
Farebox Recovery ratio = Fare Revenues / Operating Costs Declining farebox recovery ratio is a result of declining fare revenues and increasing operating costs: • FY11 – Fare change implemented July 2010
• FY12 – Rolling 30-day pass was introduced and the day pass price decreased from $6 to $5
• FY13 – Continue Day pass at $5 Operating costs increased with the opening of Expo Phase 1 and Orange Line extension; labor contract costs
• FY14 – Boardings began to decline (national decline)
• FY15 – Fare restructuring implemented September 2014 Operating costs increased due to labor contracts
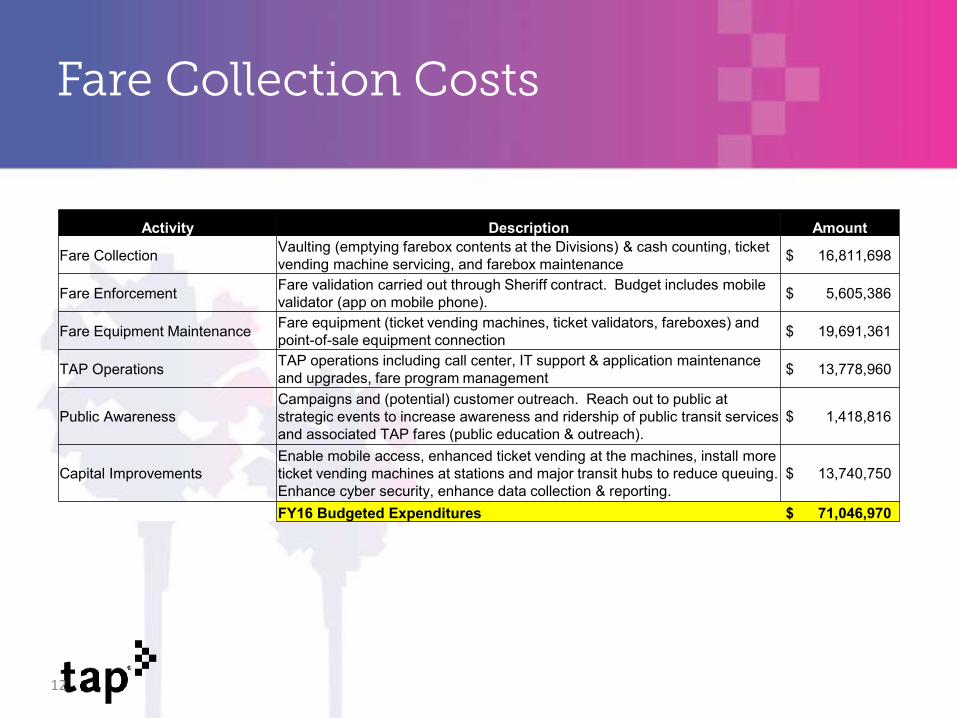
Fare Collection Costs
12
Activity Description Amount
Fare Collection Vaulting (emptying farebox contents at the Divisions) & cash counting, ticket vending machine servicing, and farebox maintenance $ 16,811,698
Fare Enforcement Fare validation carried out through Sheriff contract. Budget includes mobile validator (app on mobile phone). $ 5,605,386
Fare Equipment Maintenance Fare equipment (ticket vending machines, ticket validators, fareboxes) and point-of-sale equipment connection $ 19,691,361
TAP Operations TAP operations including call center, IT support & application maintenance and upgrades, fare program management $ 13,778,960
Public AwarenessCampaigns and (potential) customer outreach. Reach out to public at strategic events to increase awareness and ridership of public transit services and associated TAP fares (public education & outreach).
$ 1,418,816
Capital ImprovementsEnable mobile access, enhanced ticket vending at the machines, install more ticket vending machines at stations and major transit hubs to reduce queuing. Enhance cyber security, enhance data collection & reporting.
$ 13,740,750
FY16 Budgeted Expenditures $ 71,046,970
Citizens’ Advisory Council Presentation
Revenue Collection Cash Room Facts
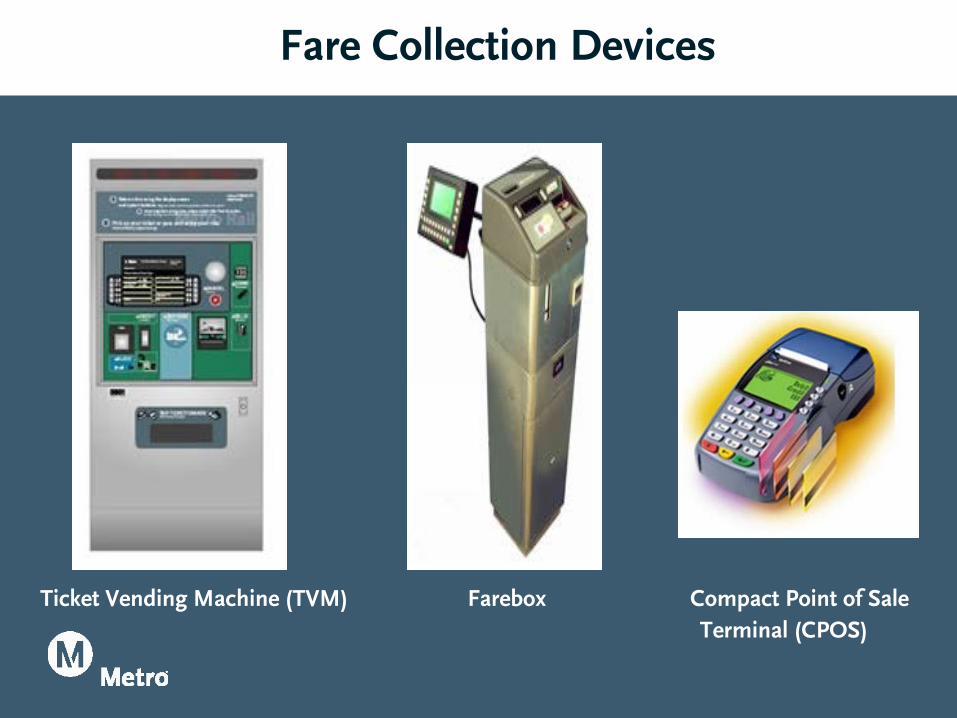
Fare Collection Devices
Ticket Vending Machine (TVM) Farebox Compact Point of Sale Terminal (CPOS)
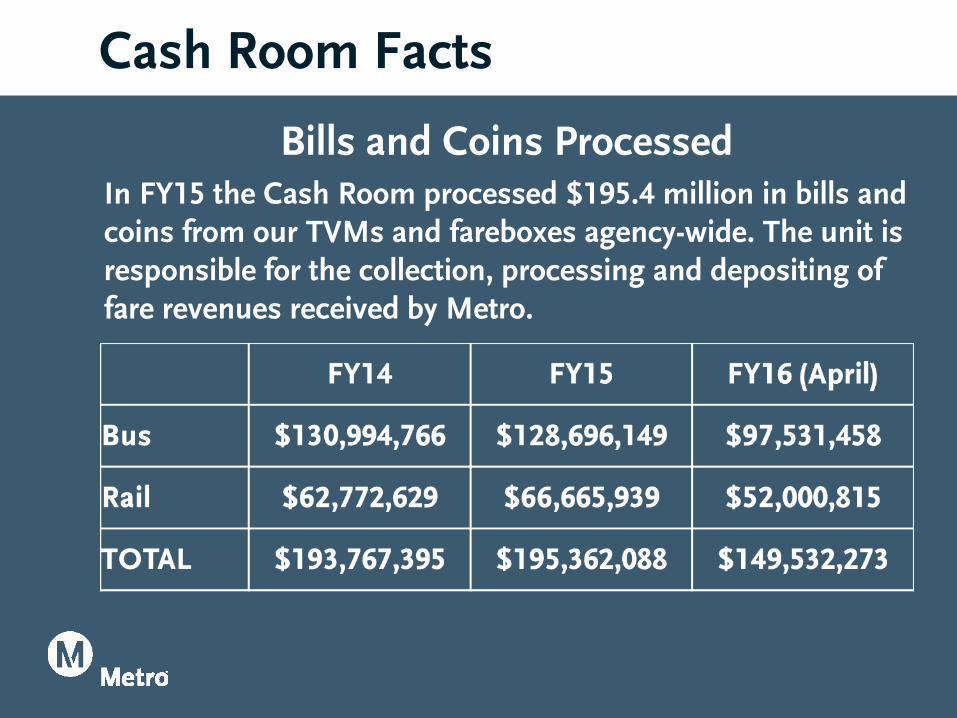
Cash Room Facts
Bills and Coins Processed In FY15 the Cash Room processed $195.4 million in bills and coins from our TVMs and fareboxes agency-wide. The unit is responsible for the collection, processing and depositing of fare revenues received by Metro.
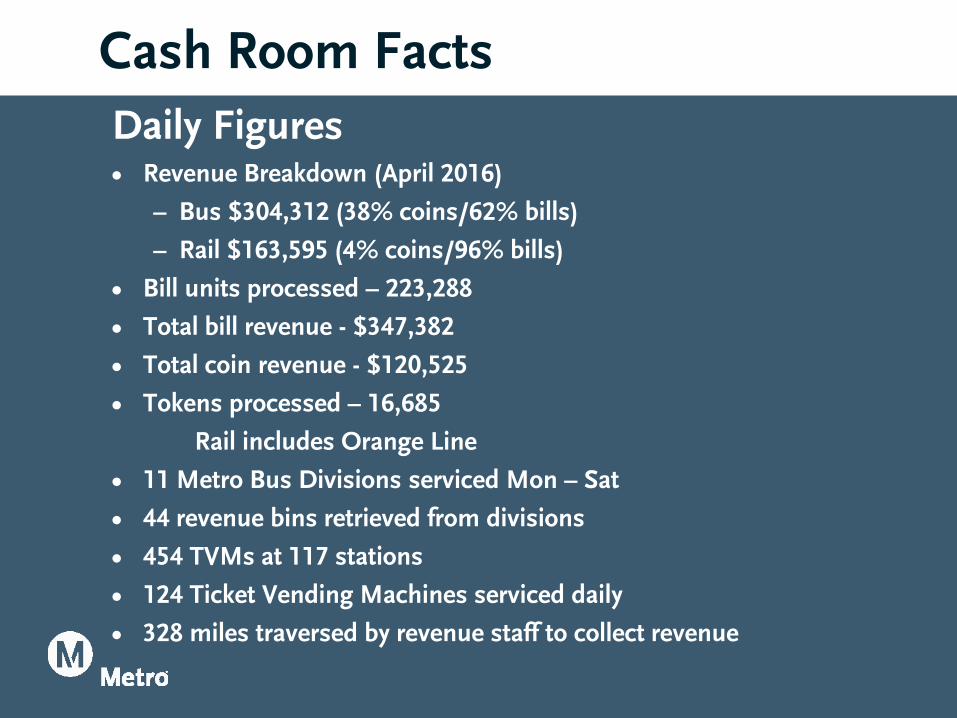
Cash Room Facts Daily Figures • Revenue Breakdown (April 2016)
– Bus $304,312 (38% coins/62% bills)
– Rail $163,595 (4% coins/96% bills)
• Bill units processed – 223,288
• Total bill revenue - $347,382
• Total coin revenue - $120,525
• Tokens processed – 16,685
Rail includes Orange Line
• 11 Metro Bus Divisions serviced Mon – Sat
• 44 revenue bins retrieved from divisions
• 454 TVMs at 117 stations
• 124 Ticket Vending Machines serviced daily
• 328 miles traversed by revenue staff to collect revenue
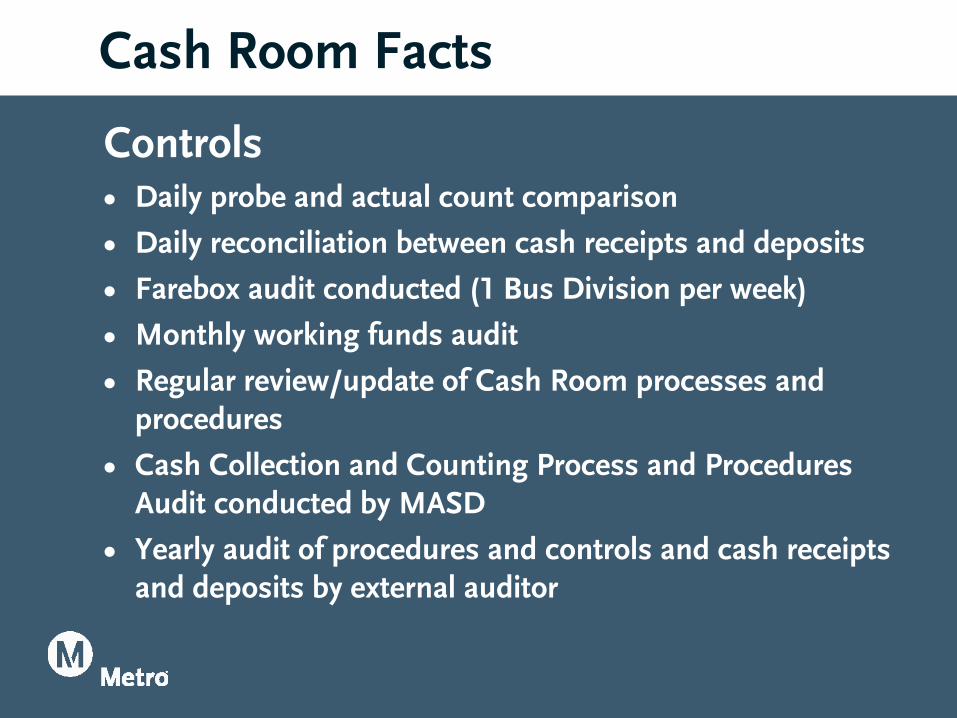
Cash Room Facts
Controls • Daily probe and actual count comparison
• Daily reconciliation between cash receipts and deposits
• Farebox audit conducted (1 Bus Division per week)
• Monthly working funds audit
• Regular review/update of Cash Room processes and procedures
• Cash Collection and Counting Process and Procedures Audit conducted by MASD
• Yearly audit of procedures and controls and cash receipts and deposits by external auditor
Bus Revenue Collection Process
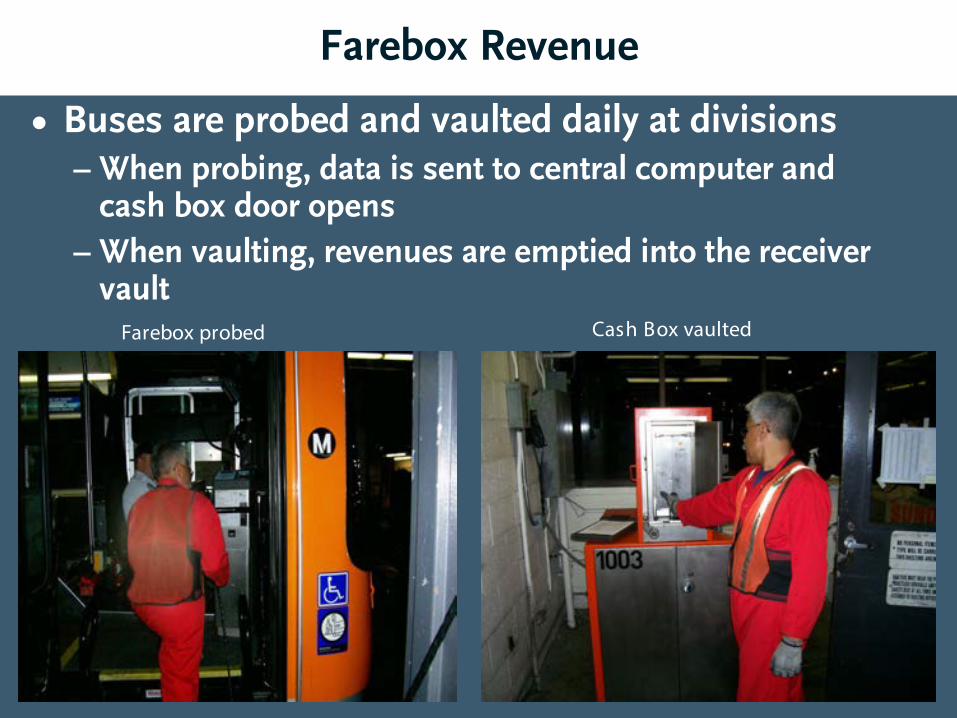
Farebox Revenue
• Buses are probed and vaulted daily at divisions – When probing, data is sent to central computer and
cash box door opens – When vaulting, revenues are emptied into the receiver
vault Farebox probed Cash Box vaulted
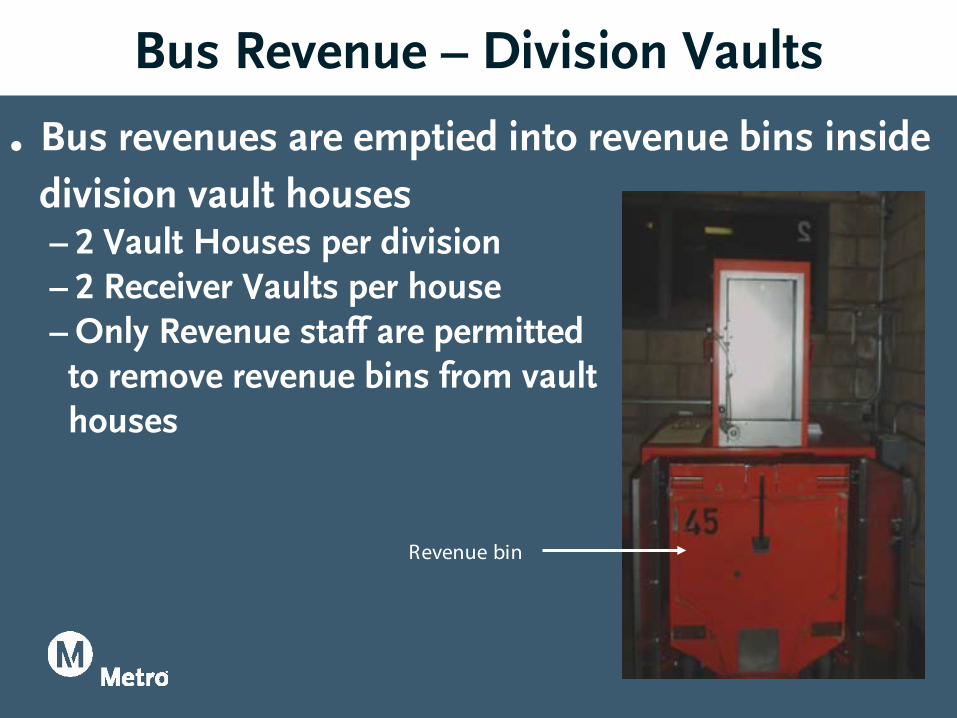
Bus Revenue – Division Vaults
. Bus revenues are emptied into revenue bins inside division vault houses – 2 Vault Houses per division – 2 Receiver Vaults per house – Only Revenue staff are permitted to remove revenue bins from vault houses
Revenue bin
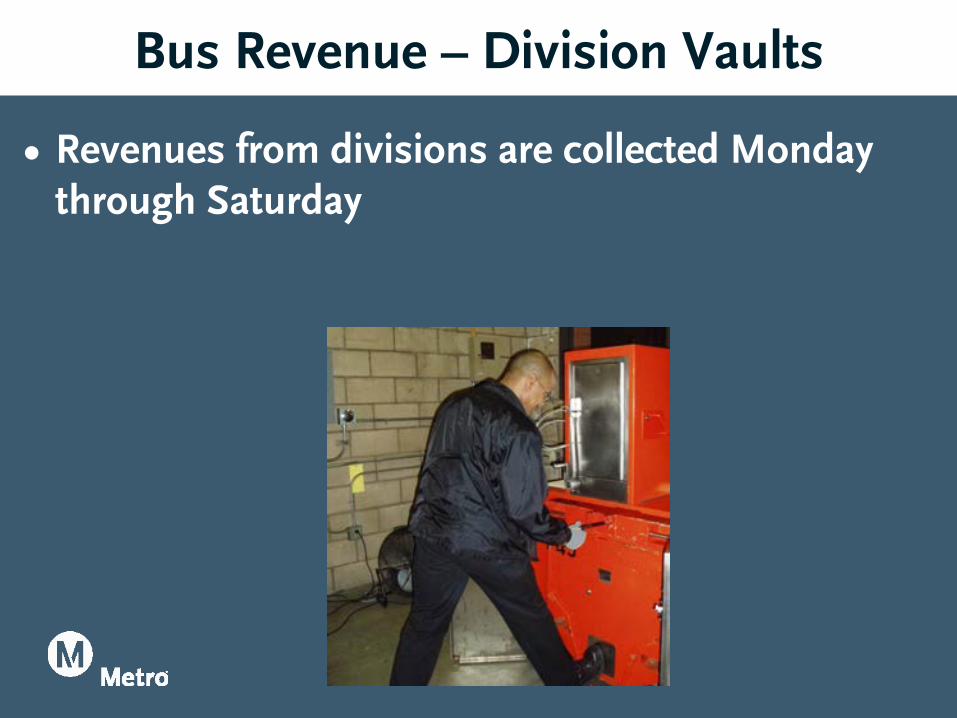
Bus Revenue – Division Vaults
• Revenues from divisions are collected Monday through Saturday
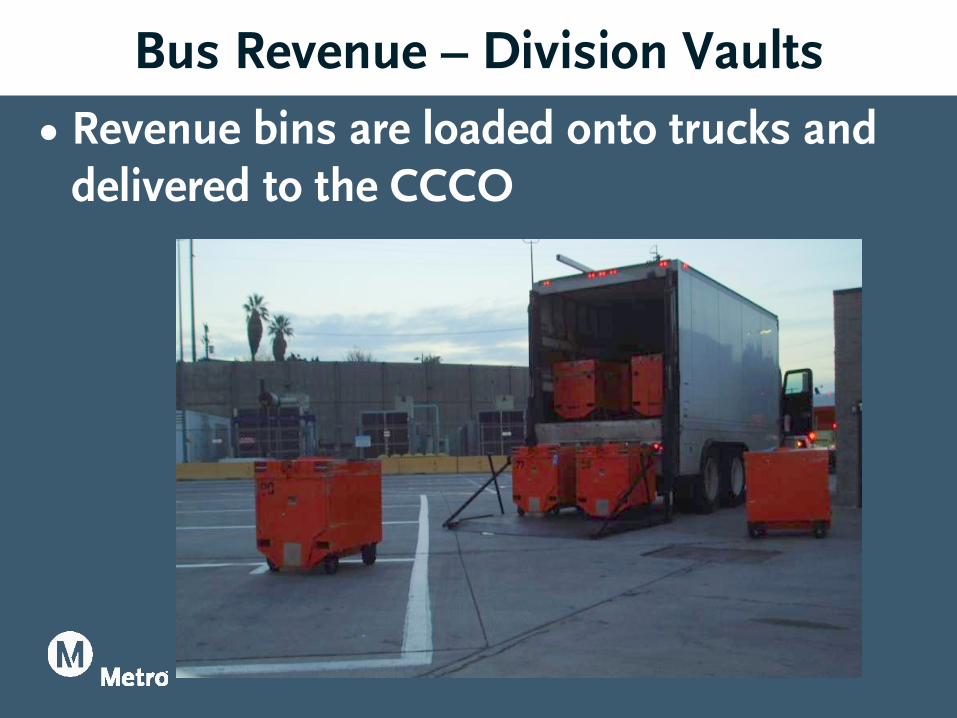
Bus Revenue – Division Vaults • Revenue bins are loaded onto trucks and
delivered to the CCCO
Rail Revenue Collection Process
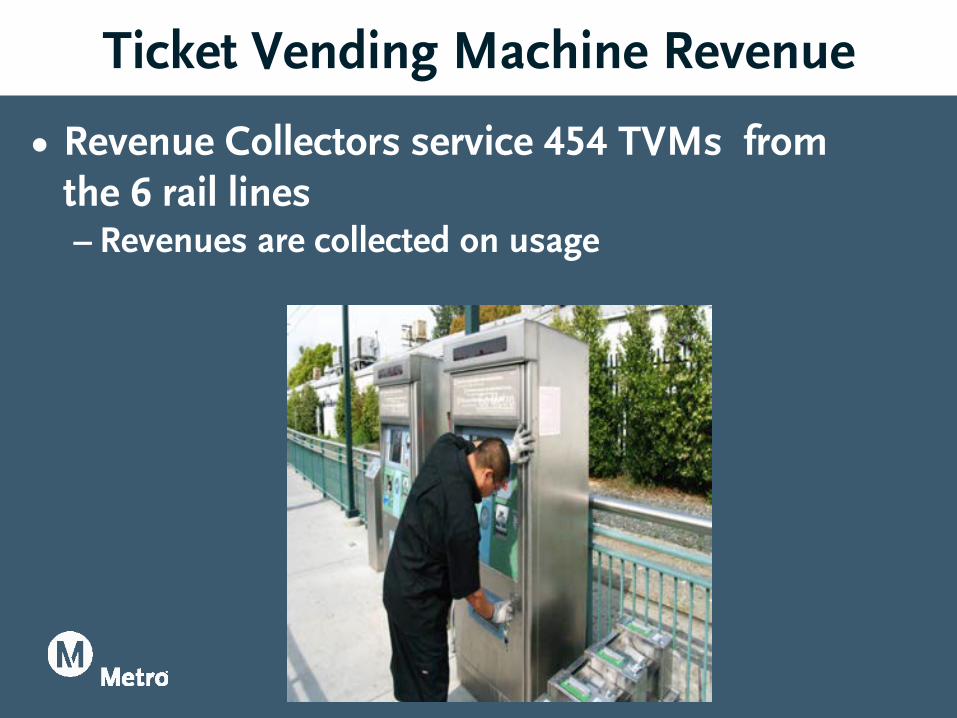
Ticket Vending Machine Revenue
• Revenue Collectors service 454 TVMs from the 6 rail lines – Revenues are collected on usage
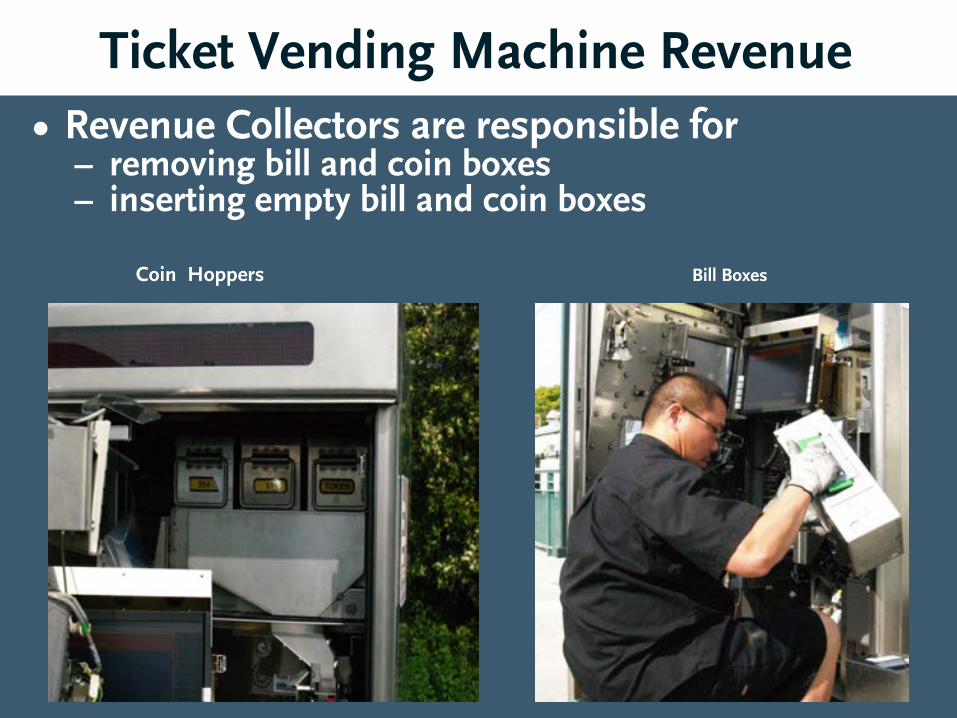
Ticket Vending Machine Revenue
Coin Hoppers Bill Boxes
• Revenue Collectors are responsible for – removing bill and coin boxes – inserting empty bill and coin boxes
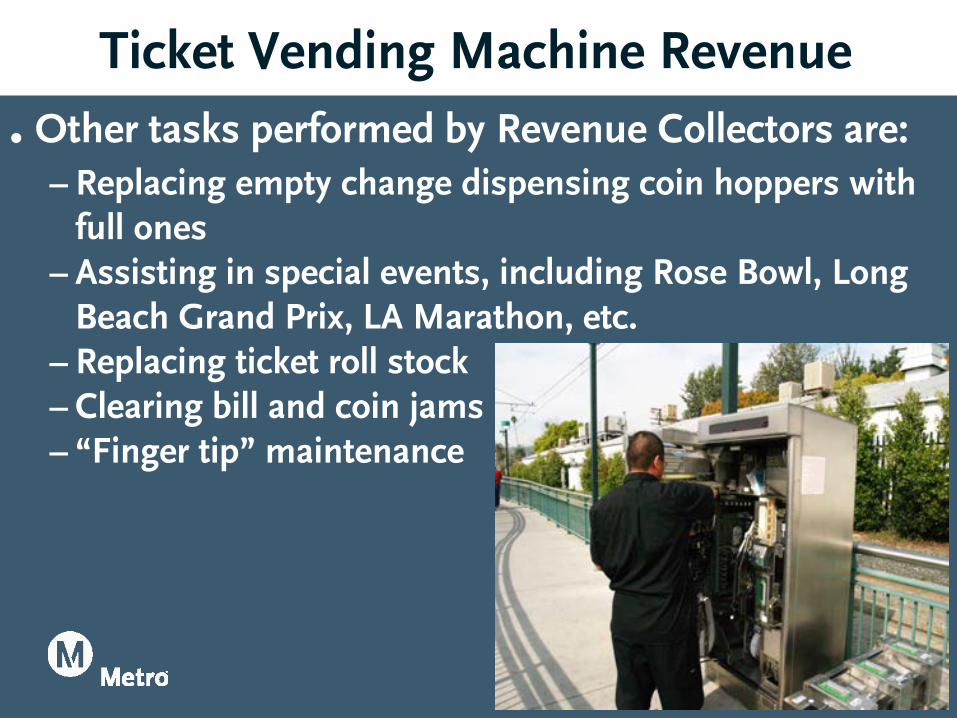
Ticket Vending Machine Revenue . Other tasks performed by Revenue Collectors are:
– Replacing empty change dispensing coin hoppers with full ones
– Assisting in special events, including Rose Bowl, Long Beach Grand Prix, LA Marathon, etc.
– Replacing ticket roll stock – Clearing bill and coin jams – “Finger tip” maintenance
Revenue Processing at
Central Cash Counting Office (CCCO)
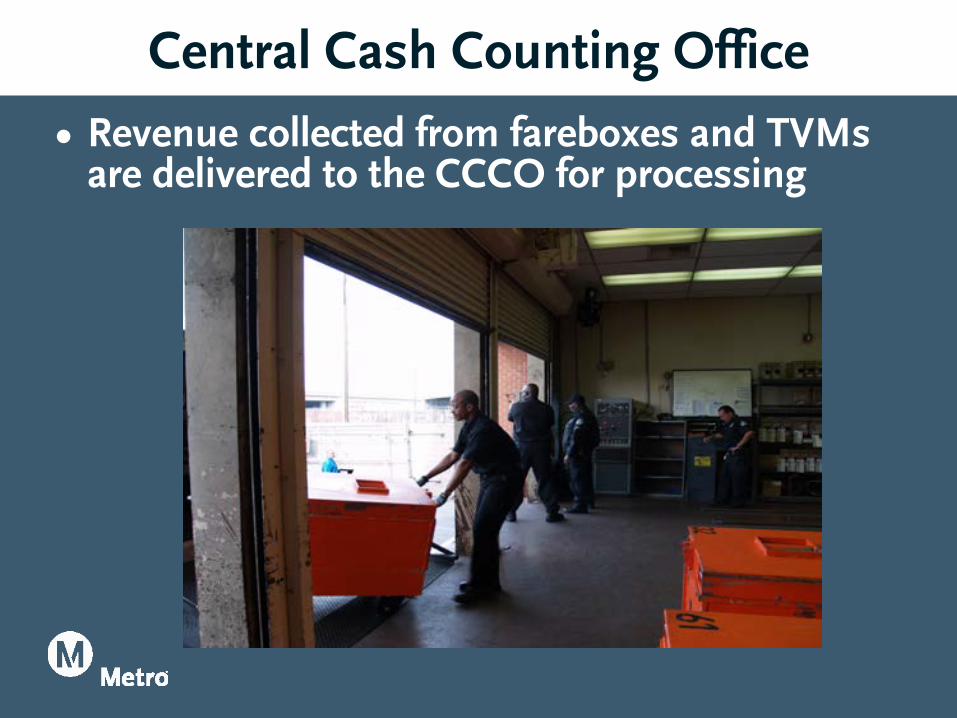
Central Cash Counting Office
• Revenue collected from fareboxes and TVMs are delivered to the CCCO for processing
Central Cash Counting Office
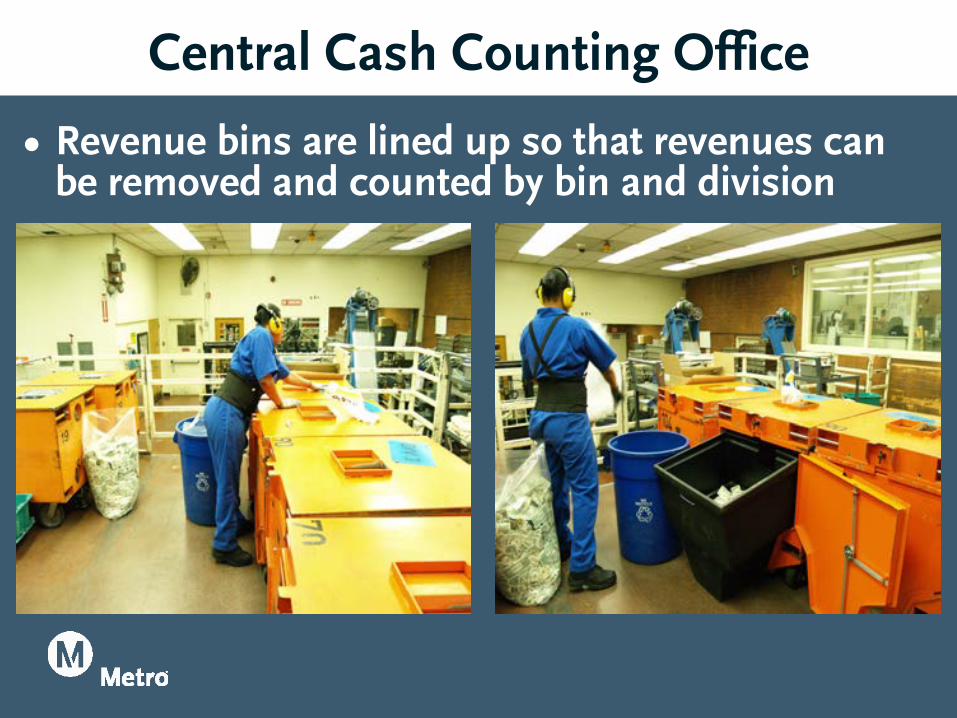
• Revenue bins are lined up so that revenues can be removed and counted by bin and division
Central Cash Counting Office
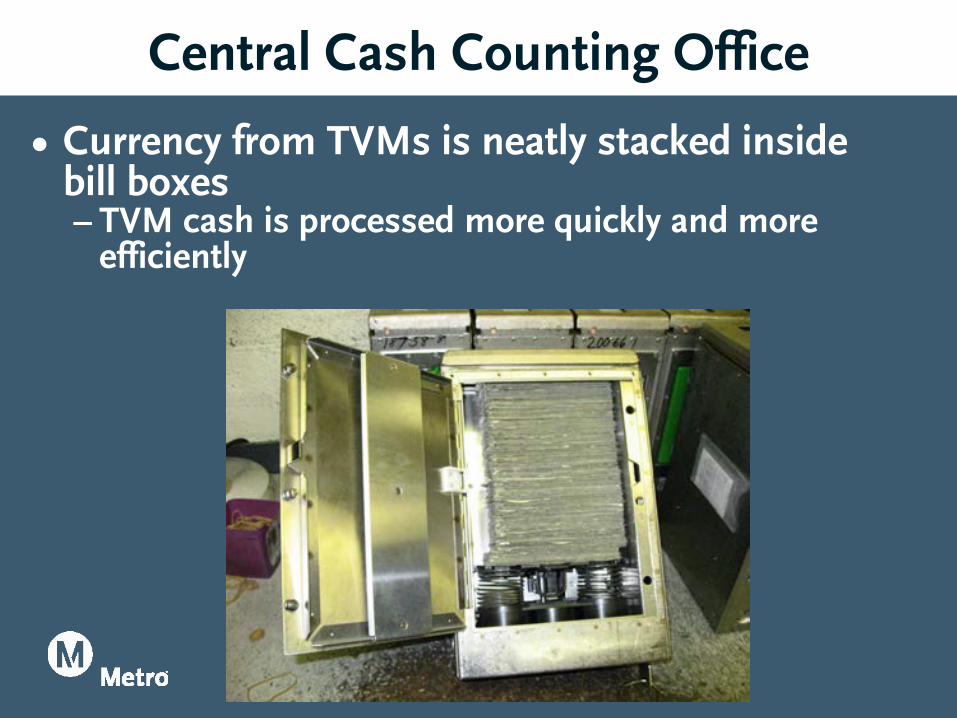
• Currency from TVMs is neatly stacked inside bill boxes – TVM cash is processed more quickly and more
efficiently
Central Cash Counting Office
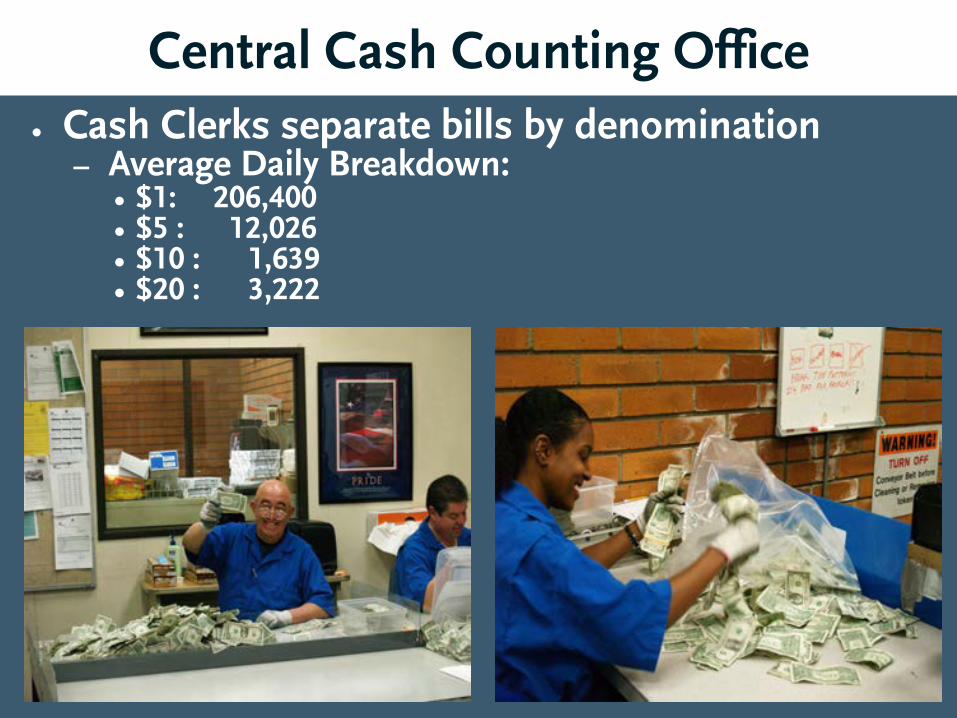
• Cash Clerks separate bills by denomination – Average Daily Breakdown:
• $1: 206,400 • $5 : 12,026 • $10 : 1,639 • $20 : 3,222
Central Cash Counting Office
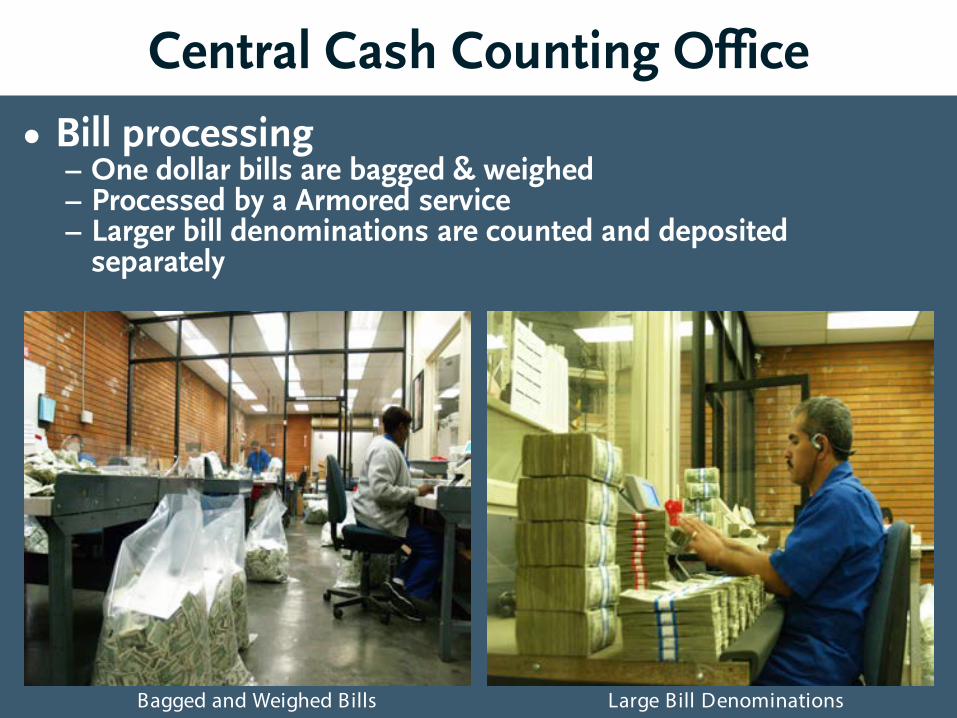
• Bill processing – One dollar bills are bagged & weighed – Processed by a Armored service – Larger bill denominations are counted and deposited
separately
Large Bill Denominations Bagged and Weighed Bills
Central Cash Counting Office
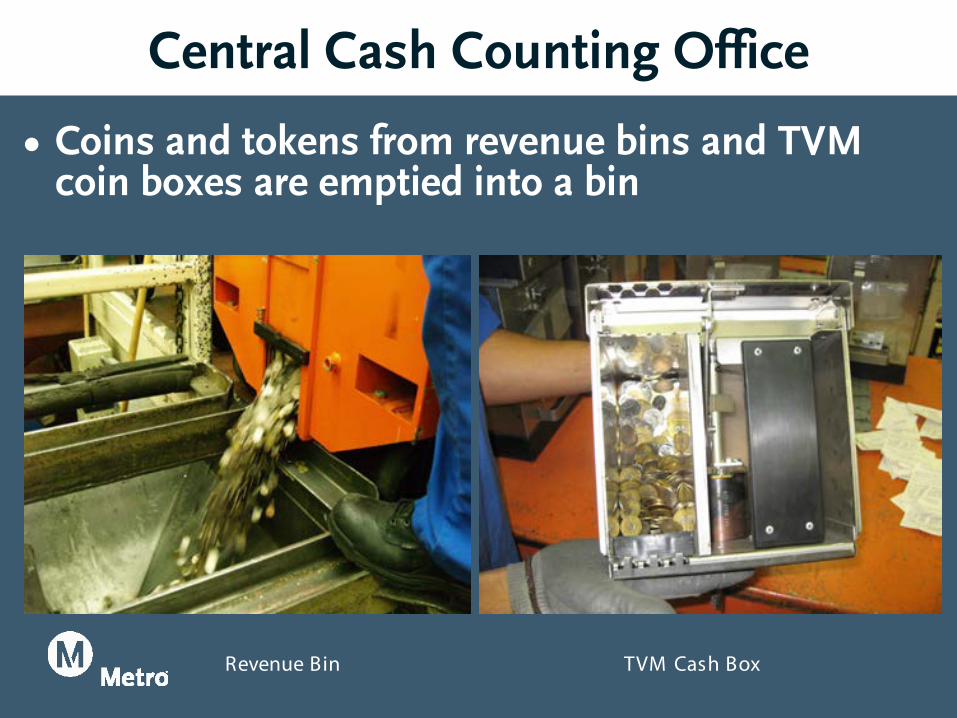
• Coins and tokens from revenue bins and TVM coin boxes are emptied into a bin
Revenue Bin TVM Cash Box
Central Cash Counting Office
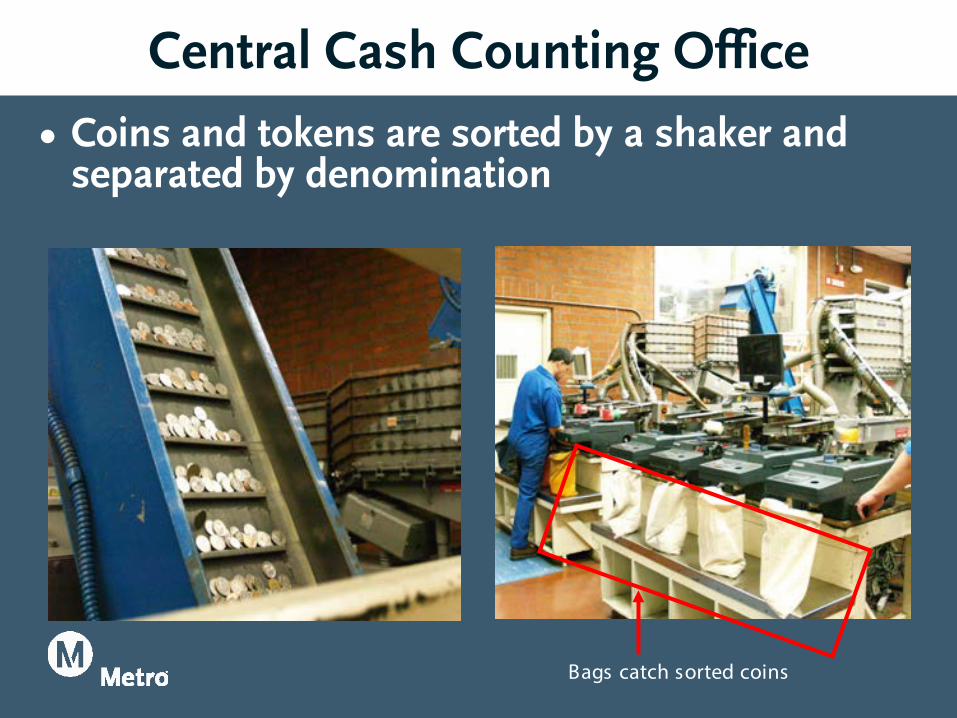
• Coins and tokens are sorted by a shaker and separated by denomination
Bags catch sorted coins
Central Cash Counting Office
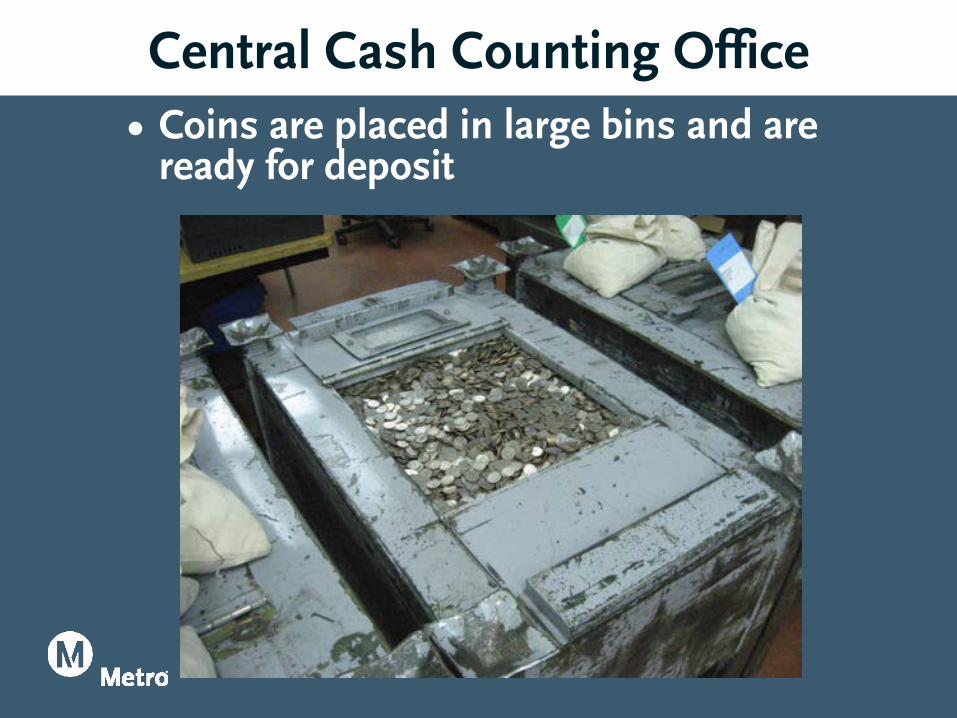
• Coins are placed in large bins and are ready for deposit
Central Cash Counting Office
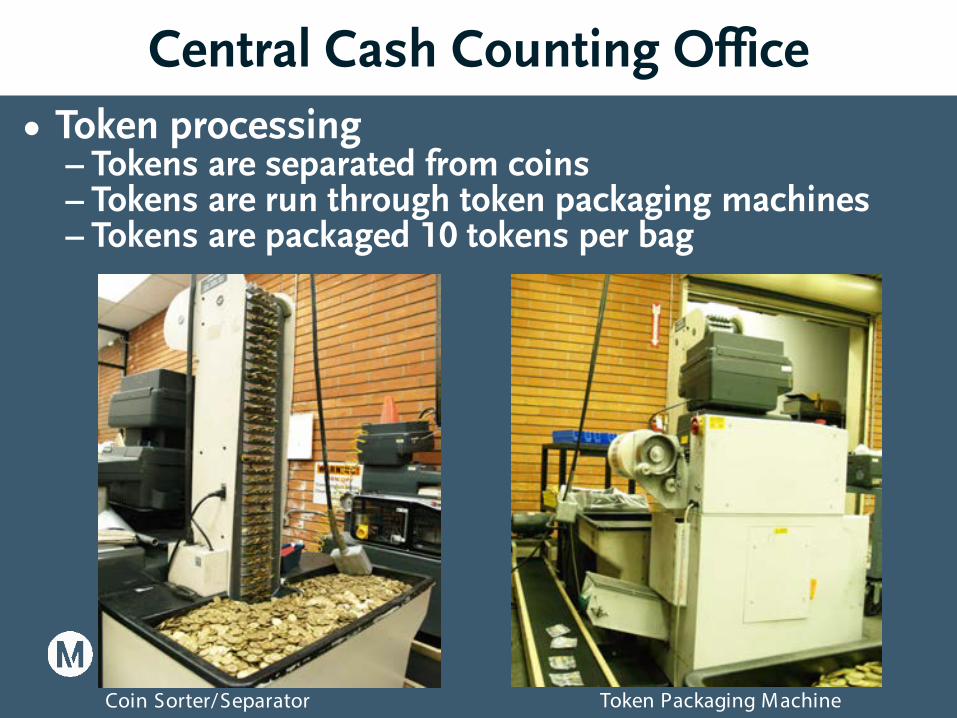
Token Packaging Machine Coin Sorter/Separator
• Token processing – Tokens are separated from coins – Tokens are run through token packaging machines – Tokens are packaged 10 tokens per bag
Central Cash Counting Office
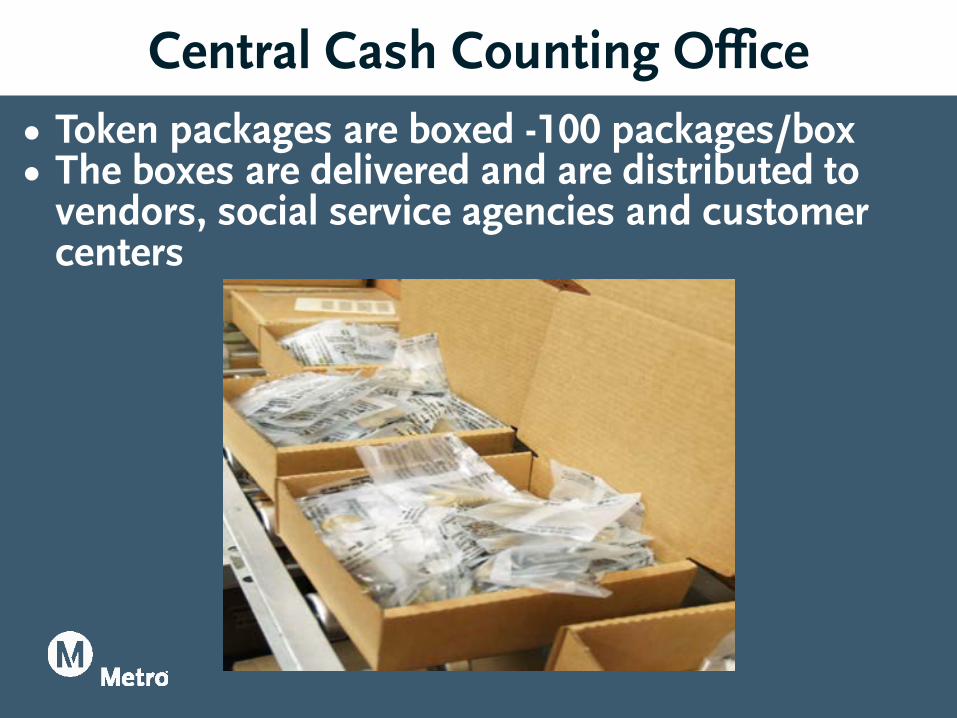
• Token packages are boxed -100 packages/box • The boxes are delivered and are distributed to
vendors, social service agencies and customer centers
Central Cash Counting Office
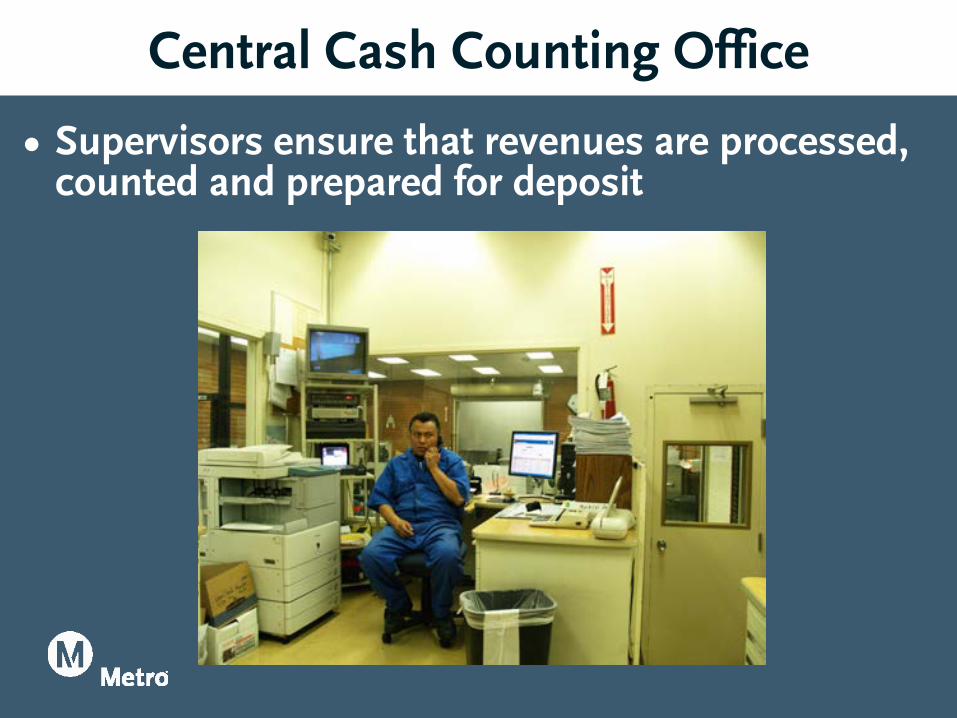
• Supervisors ensure that revenues are processed, counted and prepared for deposit
Pick Up of Processed Revenue
Central Cash Counting Office
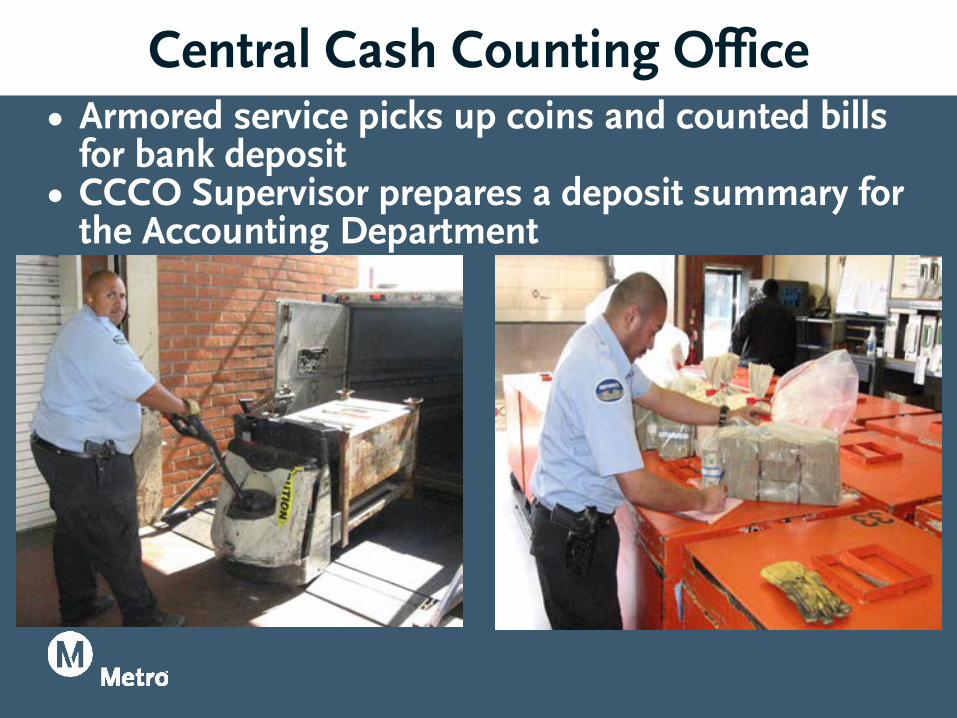
• Armored service picks up coins and counted bills for bank deposit
• CCCO Supervisor prepares a deposit summary for the Accounting Department
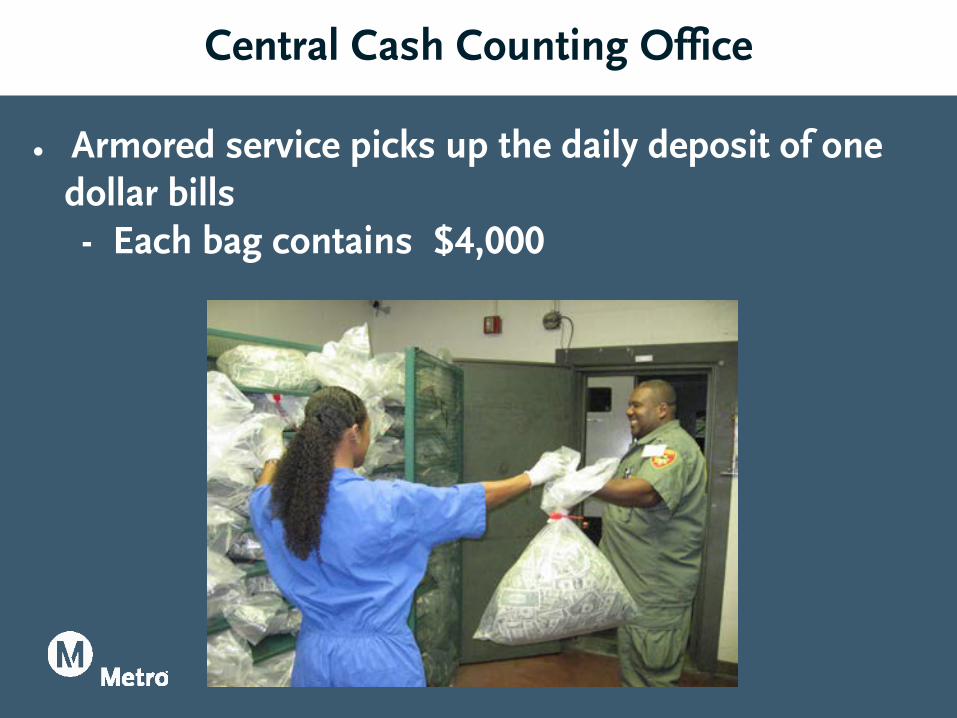
Central Cash Counting Office
• Armored service picks up the daily deposit of one dollar bills - Each bag contains $4,000
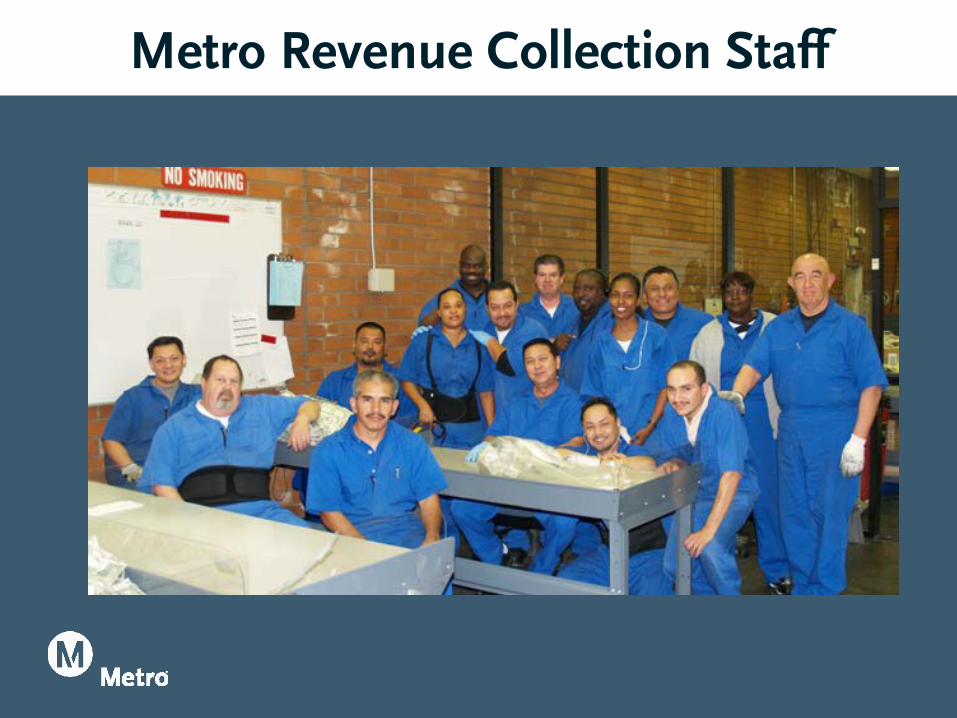
Metro Revenue Collection Staff