Embed Size (px)
Citation preview
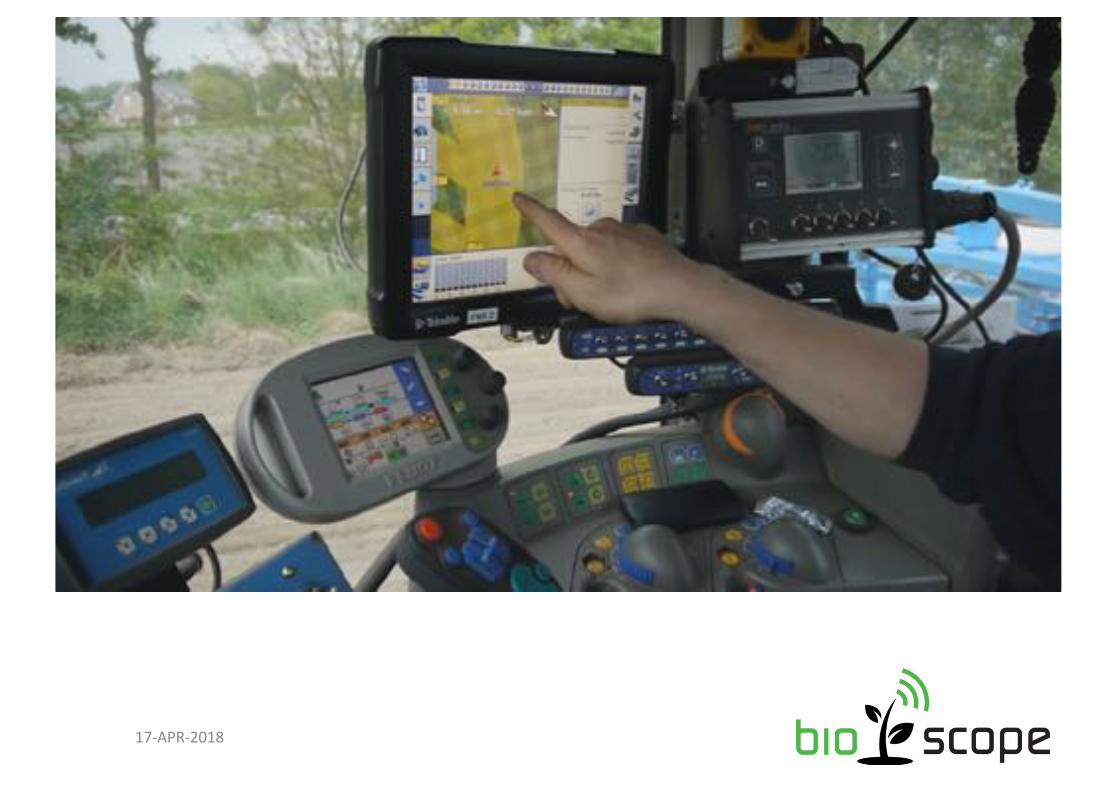
BIOSCOPE: A farmers’ perspective to remote sensing
Tamme van der WalBIOSCOPE Agri-Dataservices BV
Luxembourg Earth Observation and Integrated Applications Day19 APRIL 2018
17-APR-2018
17-APR-2018
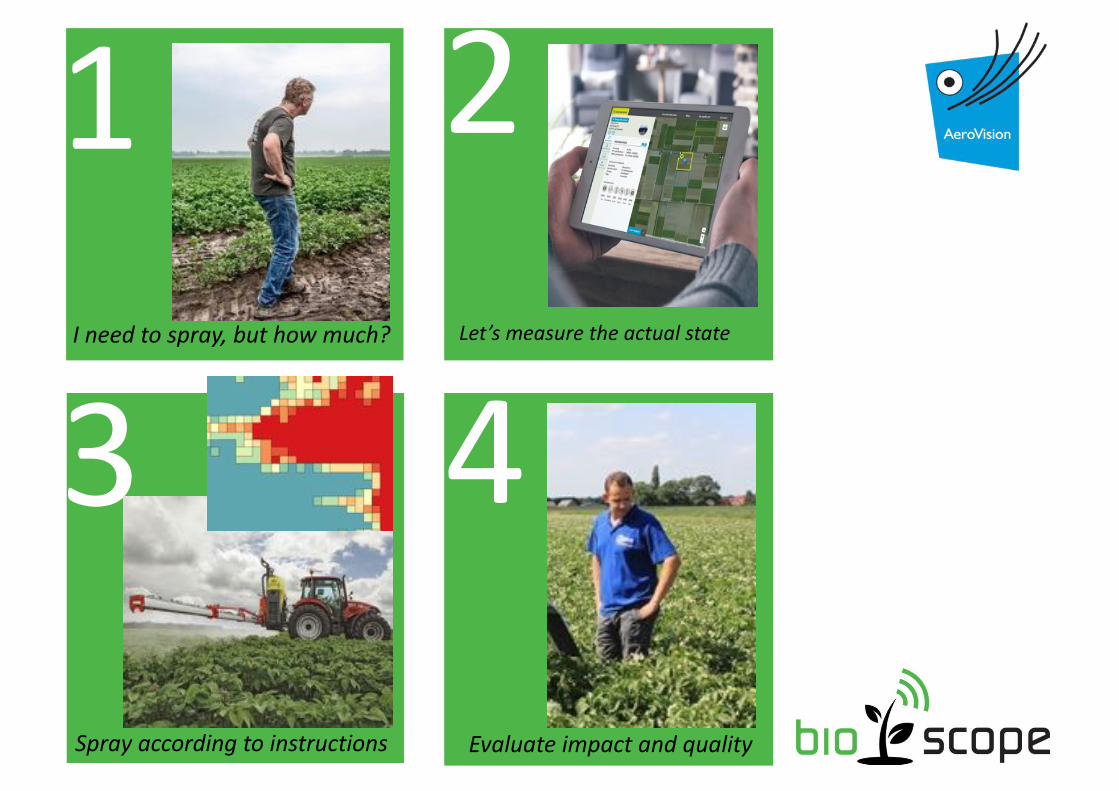
Let’s measure the actual state
2I need to spray, but how much?
1
Evaluate impact and quality
4Spray according to instructions
3
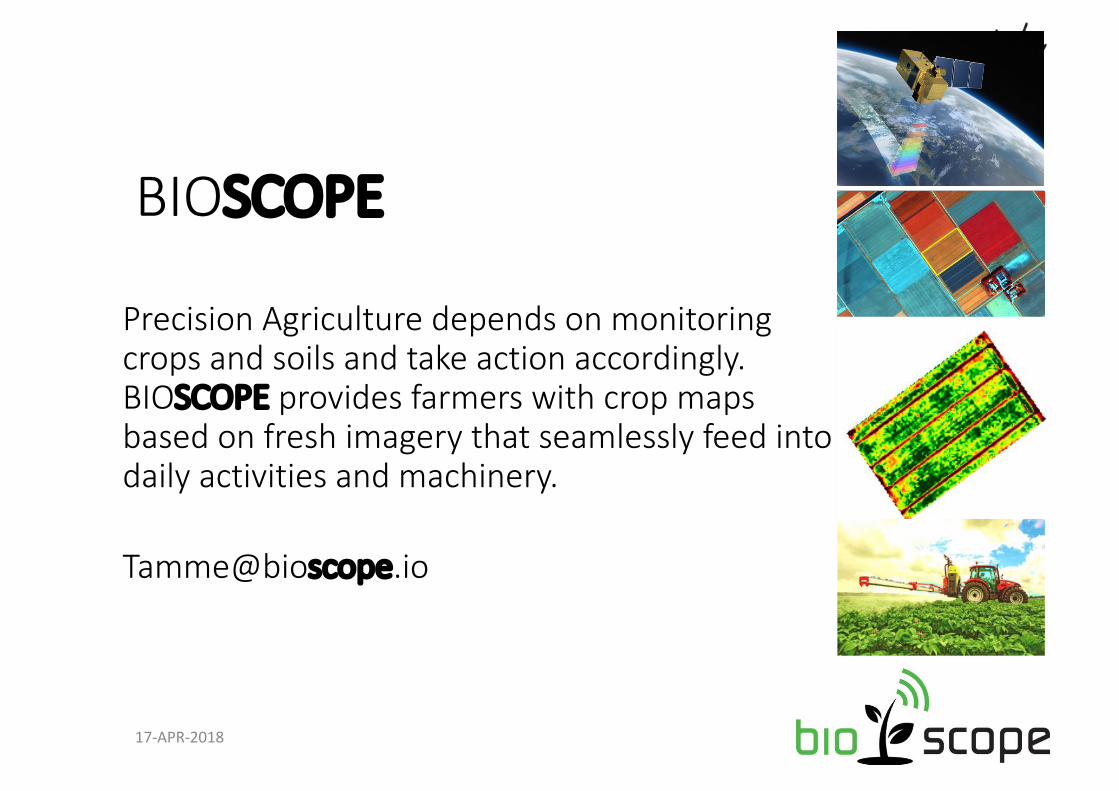
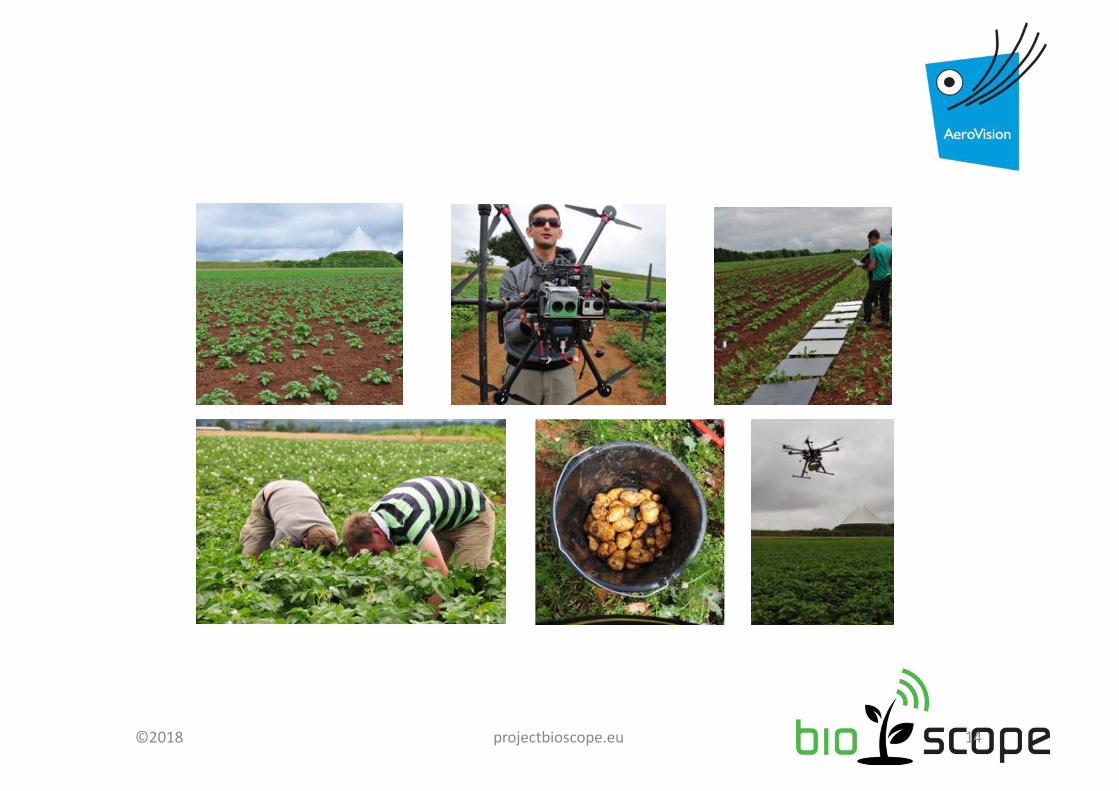
Precision Agriculture depends on monitoring crops and soils and take action accordingly. BIOSCOPE provides farmers with crop mapsbased on fresh imagery that seamlessly feed intodaily activities and machinery.
BIOSCOPE
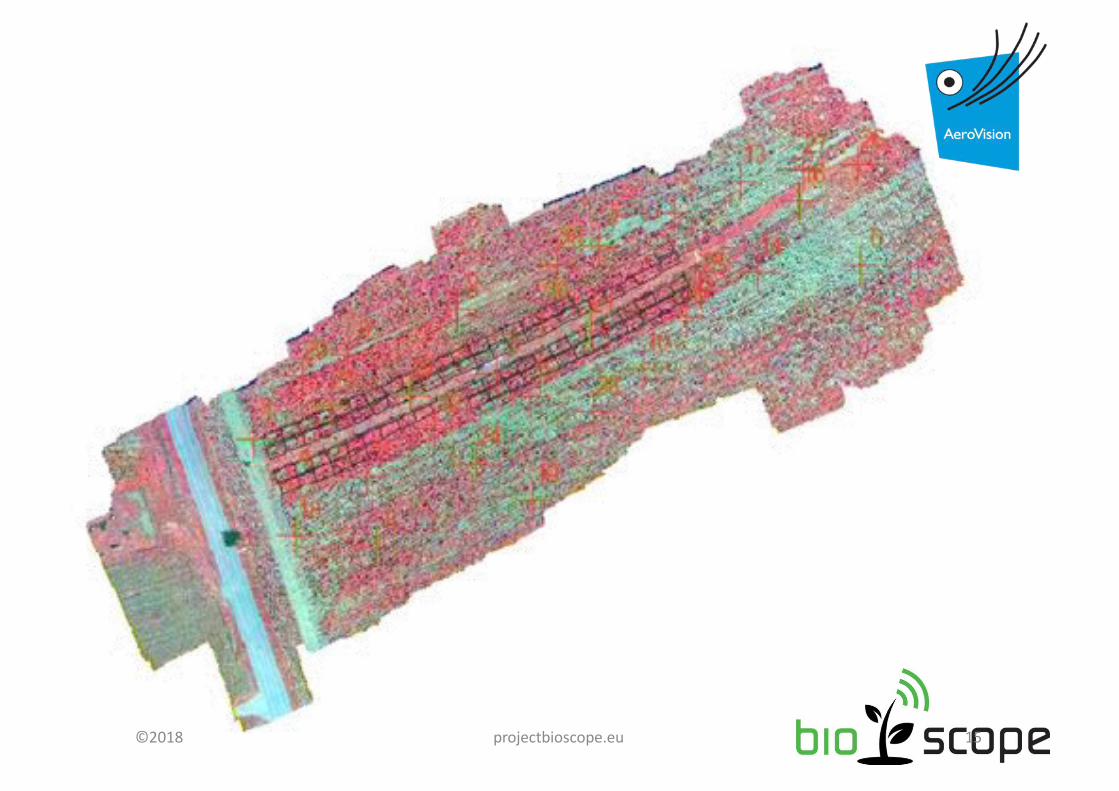
Figure x. Worldview-2 image, 15-08-2011, Flevoland. Test parcel for variable rate application in yellow outline (above). WDVI image of test parcel (lower-left). Reglone dose instruction map (lower-right)
17-APR-2018
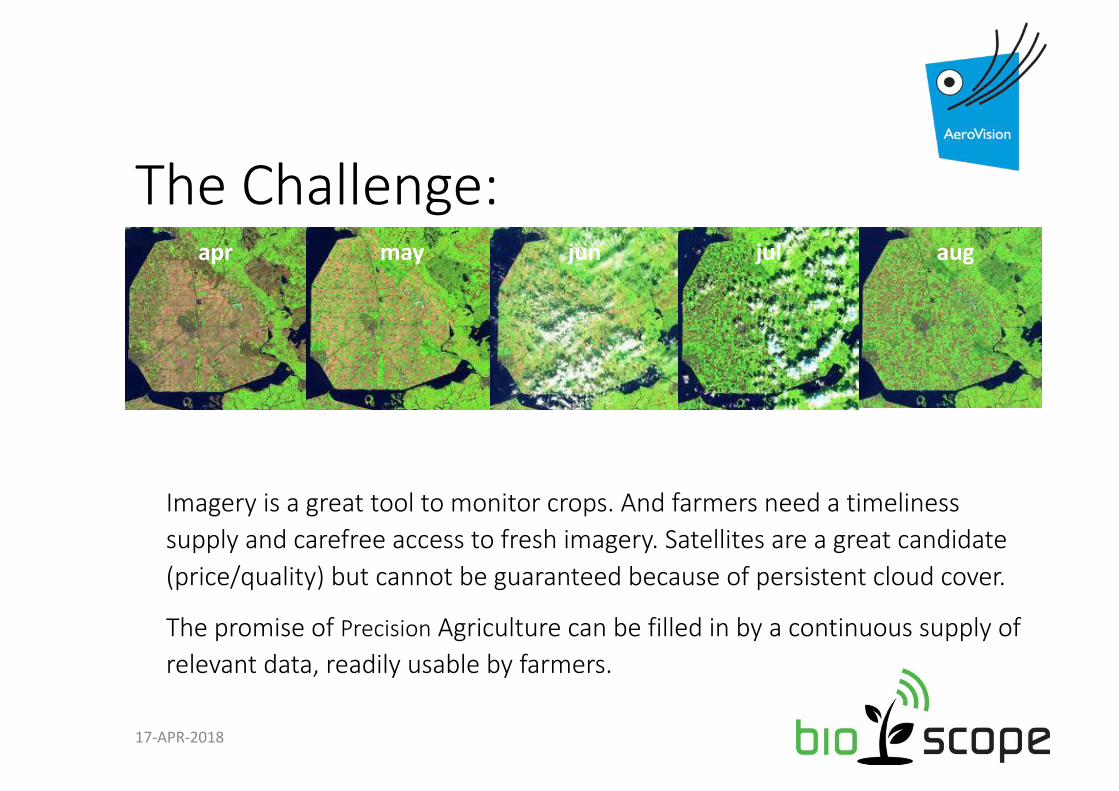
The Challenge:
Imagery is a great tool to monitor crops. And farmers need a timelinesssupply and carefree access to fresh imagery. Satellites are a great candidate(price/quality) but cannot be guaranteed because of persistent cloud cover.
The promise of Precision Agriculture can be filled in by a continuous supply of relevant data, readily usable by farmers.
apr may jun jul aug
17-APR-2018
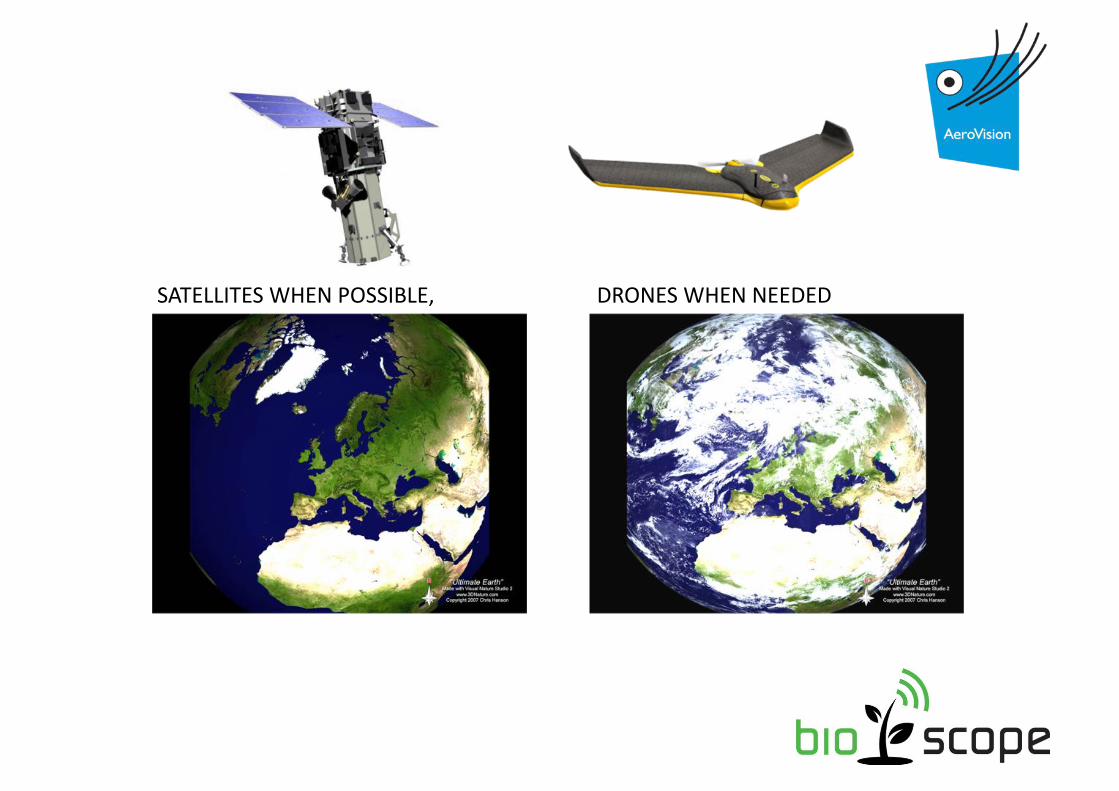
SATELLITES WHEN POSSIBLE, DRONES WHEN NEEDED
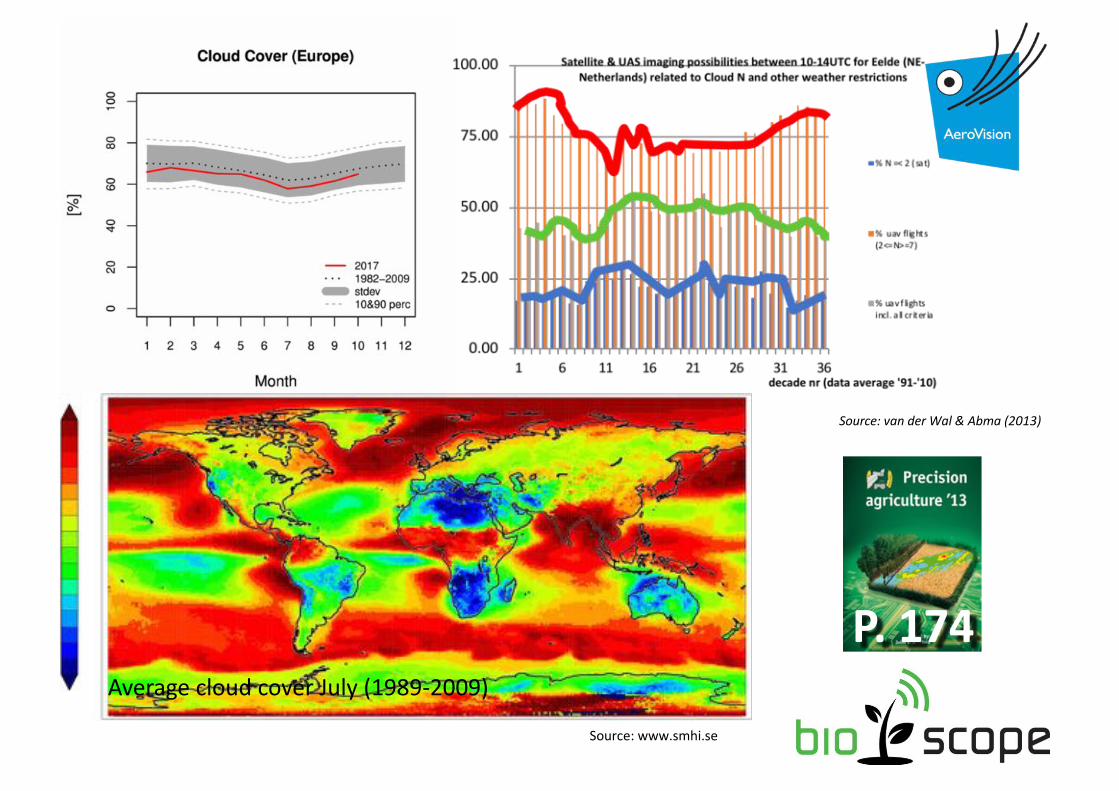
Source: www.smhi.se
Average cloud cover July (1989-2009)
Source: van der Wal & Abma (2013)
P. 174
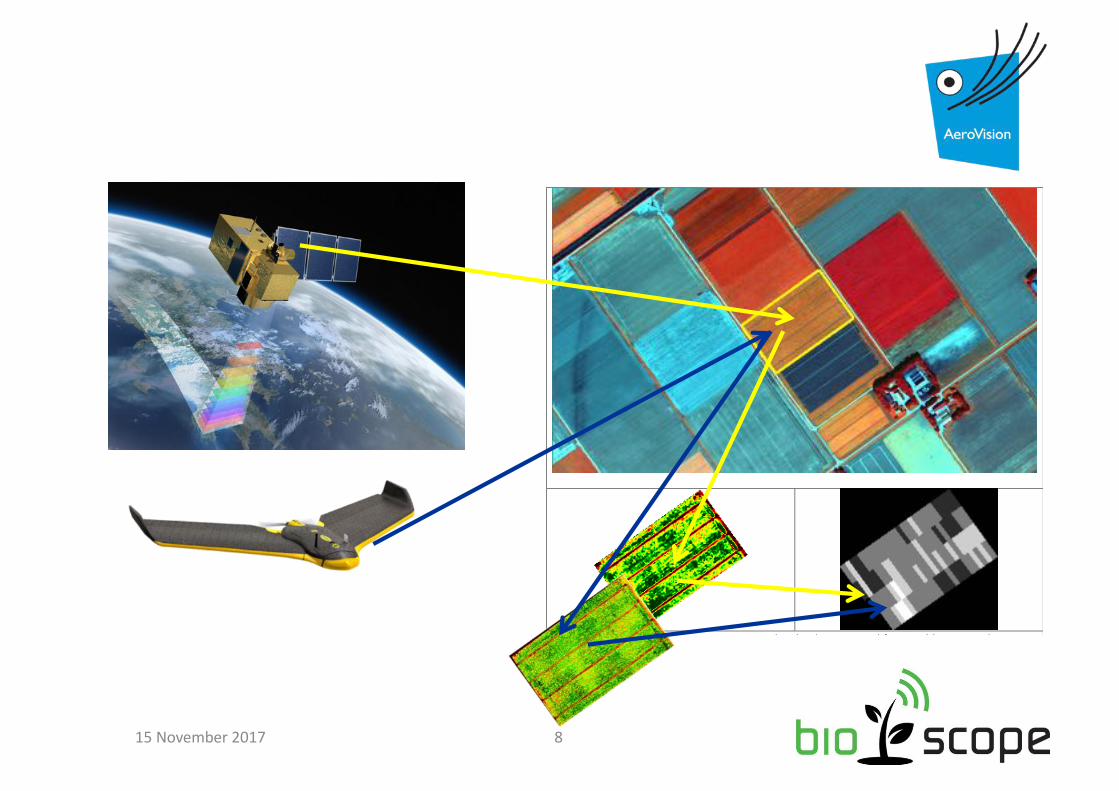
Figure x. Worldview-2 image, 15-08-2011, Flevoland. Test parcel for variable rate application in yellow outline (above). WDVI image of test parcel (lower-left). Reglone dose instruction map (lower-right)
15 November 2017 8
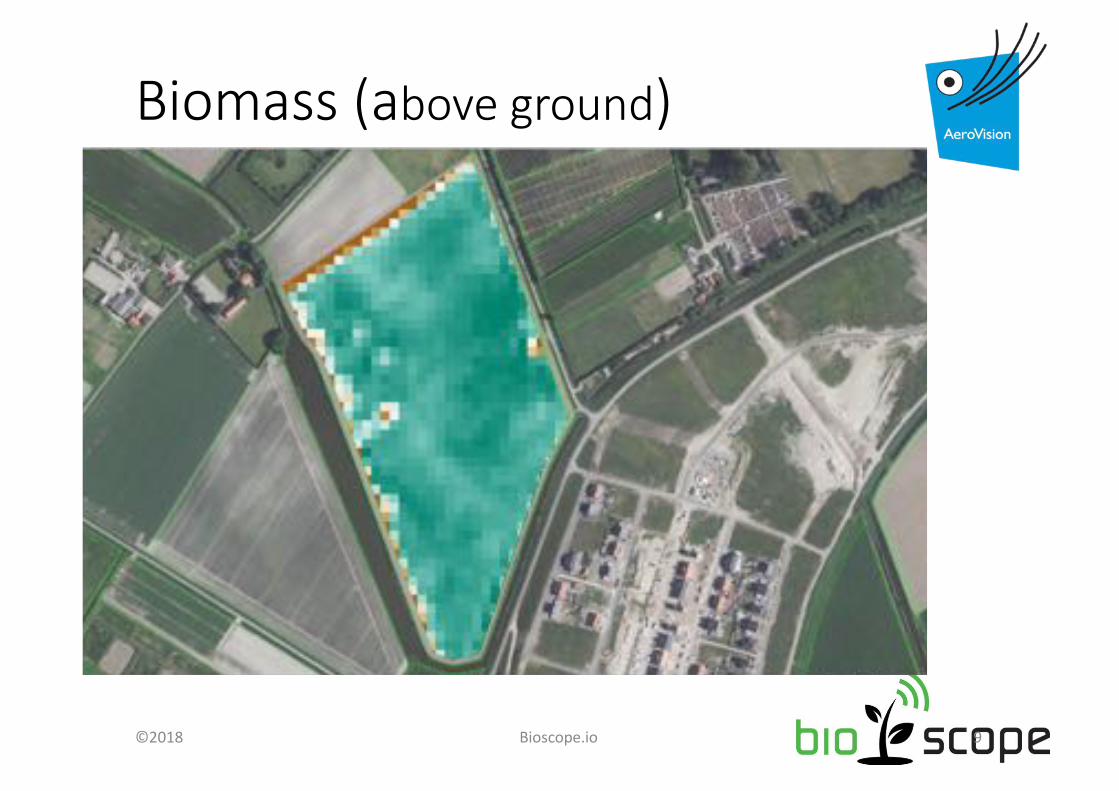
Biomass (above ground)
©2018 Bioscope.io 9
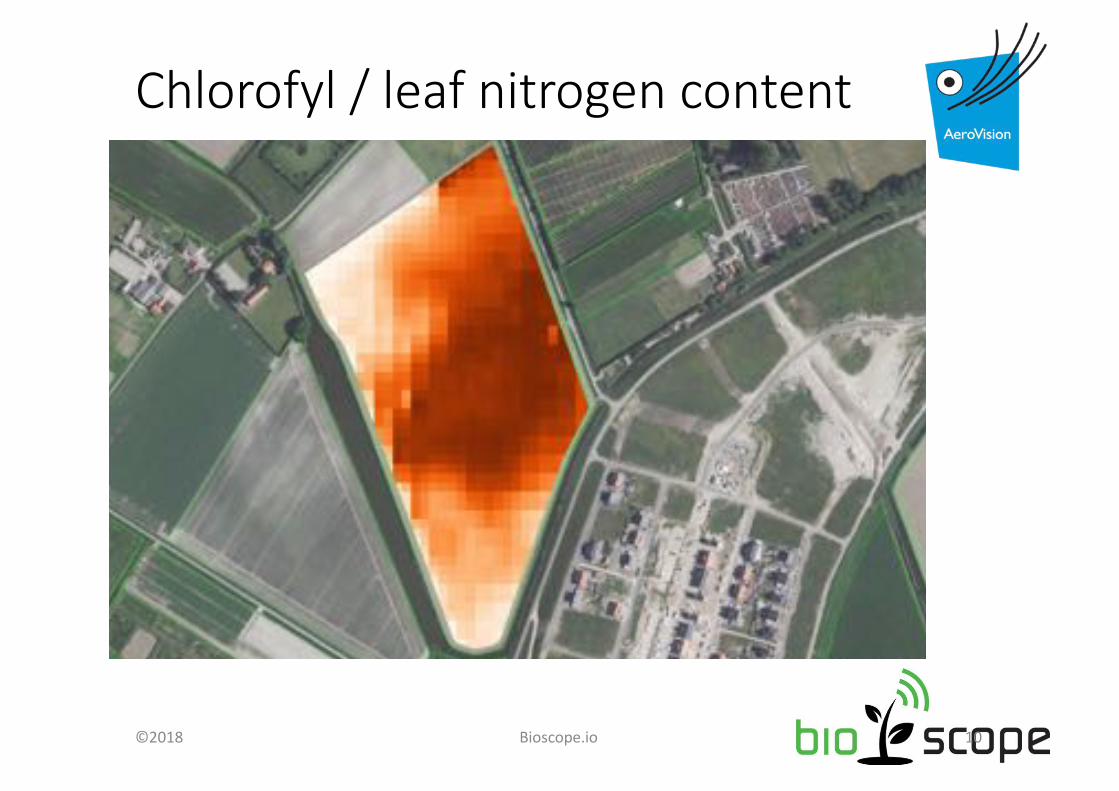
Chlorofyl / leaf nitrogen content
©2018 Bioscope.io 10
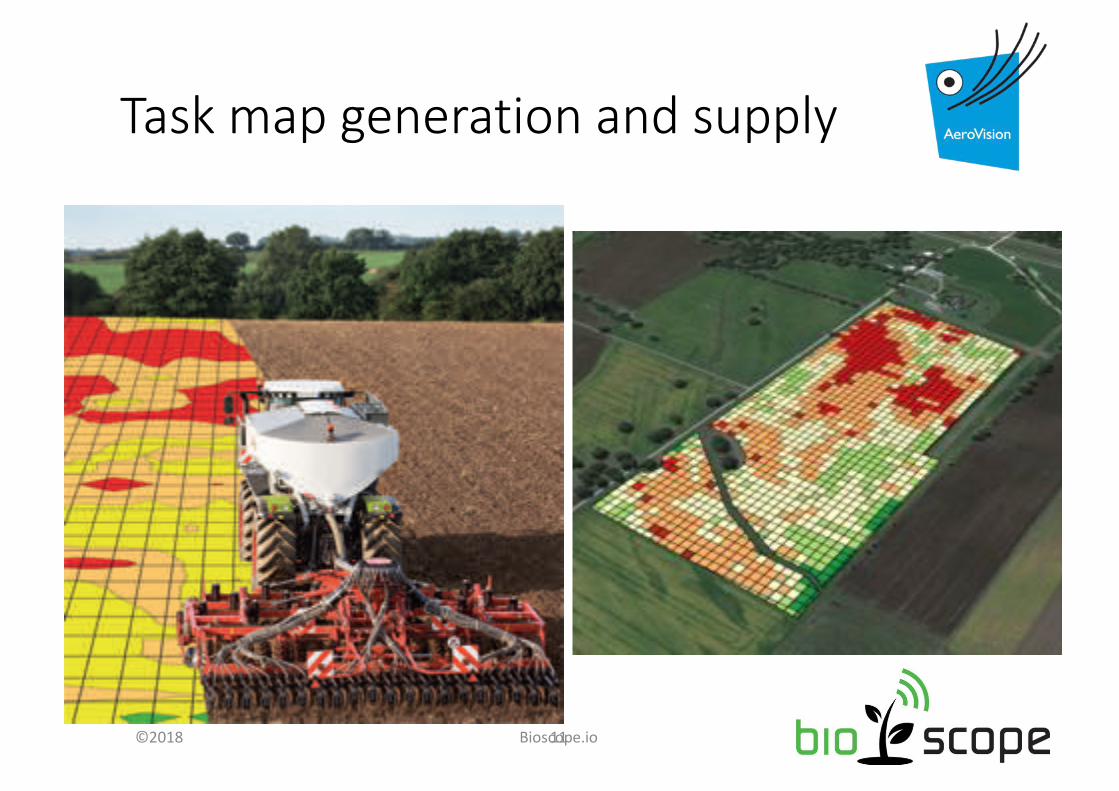
Task map generation and supply
11©2018 Bioscope.io
©2018 projectbioscope.eu 12
©2018 projectbioscope.eu 13
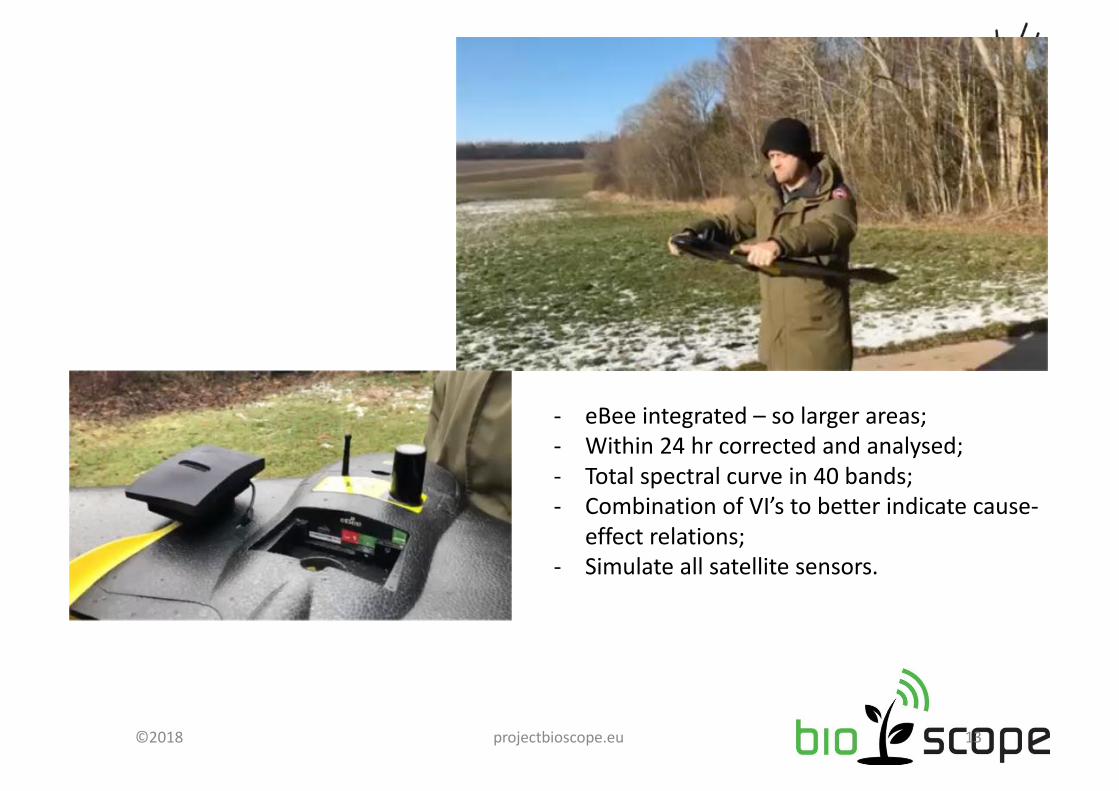
- eBee integrated – so larger areas;- Within 24 hr corrected and analysed;- Total spectral curve in 40 bands;- Combination of VI’s to better indicate cause-
effect relations; - Simulate all satellite sensors.
©2018 projectbioscope.eu 14
©2018 projectbioscope.eu 15
Benefits from a farmer’s perspective• We provide all imagery maps in 1 standard;• Demand driven, so no ‘one size fits all’;• As deep as possible in farmer’s workflow:
• Task map products;• Scouting products;• Soil and vegetation indices;
• Centralised repository – farmer is in control;• Always fresh. Always available. Always ready to use.
©2018 Bioscope.io 16