Embed Size (px)
Citation preview

FOOD SECURITY MONITORING, TAJIKISTAN February 2017 - ISSUE 18 1
Fig
hti
ng
Hu
ng
er W
orl
dw
ide
Highlights
The food security situation presents expected seasonal variation – better in December after the
harvest, worse in May at the end of the “lean season”.
The percentage of the food insecure groups appeared to be relatively stable across seasons and not
improving (1 out of 5 interviewed households), with a peak registered in May 2016 (1 out of 4 —food
insecure).
The difference in food insecurity between households headed by women and men was decreasing until
December 2015. However, following the economic shock in 2015, the increase in food insecurity in
December 2015 had a much greater impact on women headed households. In December 2016, food
insecurity prevalence was 33 percent for households headed by a woman, while it was 20 percent for
household headed by a man.
A record number of household reported that they had stock of wheat, potatoes, oil, fruit and rice in
December 2016. Overall, 73 percent of the surveyed household had some stocks, compared to 53
percent in May 2016 and 64 percent in December 2015.
Malnutrition rates among surveyed households remain stable, and at a level of concern. Among
surveyed children, over 8 percent children were wasted, 11 percent underweight and 33 percent
stunted.
Tajikistan Food Security Monitoring
BULLETIN February 2017 ISSUE 18
Methodology: Under Food Security Monitoring System, 1,300 households from 13 livelihood zones were
interviewed. As households are generally revisited, the sample size is sufficient to be representative for
trend analysis, but data are not representative for the entire population of the zone or other administrative
unit.
Indicators: The Food Security Index is based on the household’s current food security status (the food
consumption score) and their coping capacity, based on indicators of economic vulnerability (share of ex-
penditure used on food) and asset depletion.
[Figure 1] Seasonal Calendar
(Source: Integrated Context Analysis: Tajikistan, 2015)

FOOD SECURITY MONITORING, TAJIKISTAN February 2017 - ISSUE 18 2
Context and recent developments
Tajikistan is a landlocked, lower-middle income, food deficit country with a population of approximately
eight million, three quarters of whom live in rural areas. The mountainous landscape confines the arable
area to just seven percent of the country’s surface and poses enormous challenges to food security during
the winter period.
According to the 2016 Global Hunger Index (GHI) analysis and FAO statistics, 33 percent of Tajikistan’s
population is suffering from undernourishment. Malnutrition remains a serious challenge in Tajikistan. It is
the poorest in the Commonwealth of Independent States, and according to World Bank, its poverty head-
count ratio at national level was recorded at 31 percent in 2015.
Remittances constitute 43 percent of the GDP in Tajikistan1, mostly from migrants working in Russia, mak-
ing Tajikistan one of most remittance reliant country in the world. The contraction of the Russian economy
in 2015, and the devaluation of the Rouble caused a shock to the Tajikistan economy. In particular, accord-
ing to WB, lower remittances and terms of trade effects caused a deterioration in economic growth in Tajiki-
stan in 2015.
The inflation rate in 2016 is reported at 6 percent (National Bank of Tajikistan 2017). Economic forecasts for
Central Asian countries done by the Asian Development Bank foresee a 4 percent growth for the GDP in
2017, while the inflation rate may reach 7.5 percent in the same year.
Food Security in Tajikistan follows sea-
sonal variation with higher percentage of
food secure households in December and low-
er percentage in April/May. The prevalence
of food insecure group (moderately and
severely insecure households) remains
relatively stable.
In December 2016, 3 percent of the surveyed
households were severely food insecure, while
19 percent were moderately food insecure.
This is an improvement compared with May
2016, while it is about the same level as De-
cember 2015.
Overall Food Security Food Security Index:
1 IMF’s Annual 2015 Spillover Report, titled: “Spillovers from Russia’s Slowdown on Neighboring Countries.”
2 Food Security Index takes into account (1) food consumption score, (2) coping strategies and (3) food expenditure share.
https://resources.vam.wfp.org/sites/default/files/CARI%20Factsheet_0.pdf 3 Food Consumption Score takes into account (1) dietary diversity, (2) food frequency and (3) relative nutritional importance of various food groups.
The Food Consumption Score (FCS) shows that 23
percent of household experienced poor or borderline
food consumption in December 2016. The FCS tends
to be worse in the lean period, when less vegetables
and fruits are available and the diet is less diversi-
fied. Although households are in general better off in
April/May, figure 13 shows that a larger share of
households are using coping strategies to obtain an
acceptable diet. Following the economic shock in
2015, the share of households with poor or border-
line consumption in December 2016 increases by 7
percent compared to December 2014.
Food Consumption Score
[Figure 2] Food Consumption Score (FCS)3
[Figure 1] Food Security Index 2

FOOD SECURITY MONITORING, TAJIKISTAN February 2017 - ISSUE 18 3
Frequencies of Food Group Intake [Figure 3] Frequencies of Food Group Intake
Households classified as ‘poor’ have a diet that
consist of food groups with high amount of cal-
ories but low on macro- and micronutrients.
Further breakdown of the food consumption score
shows that households that are classified as ‘poor’
have, on average, a diet limited to only four food
groups: cereals, oil, sugar and vegetables. In addi-
tion, poor group eats vegetables only once a week,
and they do not consume meat, pulses or dairy, in
the week before the survey. Households with border-
line food consumption consumed all eight food
groups but pulses, dairy, meat and fruits were con-
sumed only one time per week. The low consump-
tion of fruit and vegetables is due to the higher pric-
es of these commodities in the winter season.
Income and remittances
Household Income and Food Security
Among the interviewed households, the primary income source was reported as salary/government jobs
(19 percent), followed by remittances (17 %) daily wage labour (17 %) and pension and other government
benefits (16 %).
Figure 5 shows the relationship between primary income source and food security. Households with remit-
tances and salary as primary income source appeared to be more food secure. On the other hand, those
households who primarily rely on daily wage labour and production and sales as income source are more
likely to be food insecure.
[Figure 4] Household Income Source Strategies [Figure 5] Household Primary Income Source and Food Insecurity

FOOD SECURITY MONITORING, TAJIKISTAN February 2017 - ISSUE 18 4
Remittances
32.5 percent of the interviewed households responded that they have at least one household member work-
ing outside the country to earn money to support the household. Among those, 27.5% of the interviewed
households said that only male members were working outside; 1.7 % said that only female members were
sending remittances and 2.4 % stated that both male and female members were working outside of the coun-
try.
The percentage of households that reported to have received remittance for the past three months was 26%
in December 2016. This is an increase of 5 percentage points since May 2016 and 2 percentage points com-
pared to December 2015.
Of the households receiving remittances, more than a third of the sampled households answered to have
been negatively affected by remittance reduction in the last three months. Although about half of the house-
holds have experienced less frequent or reduced volume of remittance received, the situation has improved
since April 2015. Due to the contraction in Russia’s economy in 2015, remittances from Russia fell by 32 per-
cent in the first six months of 2015 according to the National Bank of Tajikistan.
Of households receiving remittances, one third reports that it is their only source of income.
[Figure 6] Changes in Remittances received and Household Wellbeing
Remittances and Food Consumption Score
Households receiving remittances are less likely to
be food insecure (14 %) compared to households
who do not receive remittances (25 %). The re-
mittance receiving households can be divided by
those who are negatively affected by change in
remittances, and those who have not been affect-
ed by a change in the last three months. From the
first group, 22 percent of household had poor or
borderline food consumption score in comparison
with 15 percent of the households who said that
they were not negatively affected by the change.
The importance of remittance to households’
food security is underlined by the high percent-
age of household, 83 percent, reporting that re-
mittances is mainly used to buy food.
[Figure 7] Remittance Received and Food Con-sumption Score

FOOD SECURITY MONITORING, TAJIKISTAN February 2017 - ISSUE 18 5
Household Remittance by Livelihood Zones
There are significant differences in the level of reliance on remittances in different livelihood zones. The
share of households reporting that remittance was their primary income source was particularly high in
Eastern and Central Zeravshan (42 percent), Western Parmir Valley (32 percent), and North Sughd (29 per-
cent). These livelihood zones also have a higher reliance on remittances when compared to the average for
November 2012 to May 2016.
The majority of the livelihood zones have seen a fall in the percentage of households relying on remittances
as their primary income compared with previous rounds of the survey. Darvoz (Livelihood Zone 3) and Pan-
jakent experienced significant decline in the remittance reliance compared to that of average from Novem-
ber 2012 to May 2016.
[Figure 8] Household Remittance Reliance by Livelihood Zones
Expenditure and stocks
Household expenditure on food
A household’s share of food expenditure over total expenditure is used as an indicator of economic vulnera-
bility. Household with a high share of expenditure of food, are more vulnerable to economic shocks like
price increases or reduction in income. The average food expenditure share in Tajikistan is 61 percent.
Spending more than 75% of expenditure is considered very high, while 65-75% is considered high.
One quarter of the household in the survey spends more than 75 percent of their expenditure on food. The
share of food expenditure seems to have been increasing in both the winter and spring seasons in 2016,
while the food expenditure share is highest in the spring.
The percentage of households spending over 75 percent of their expenditure on food has decreased since
May 2016 following the typical seasonal pattern for this time of the year.
[Figure 9] Household Income Source and Food Insecurity
FOOD SECURITY MONITORING, TAJIKISTAN February 2017 - ISSUE 18 6
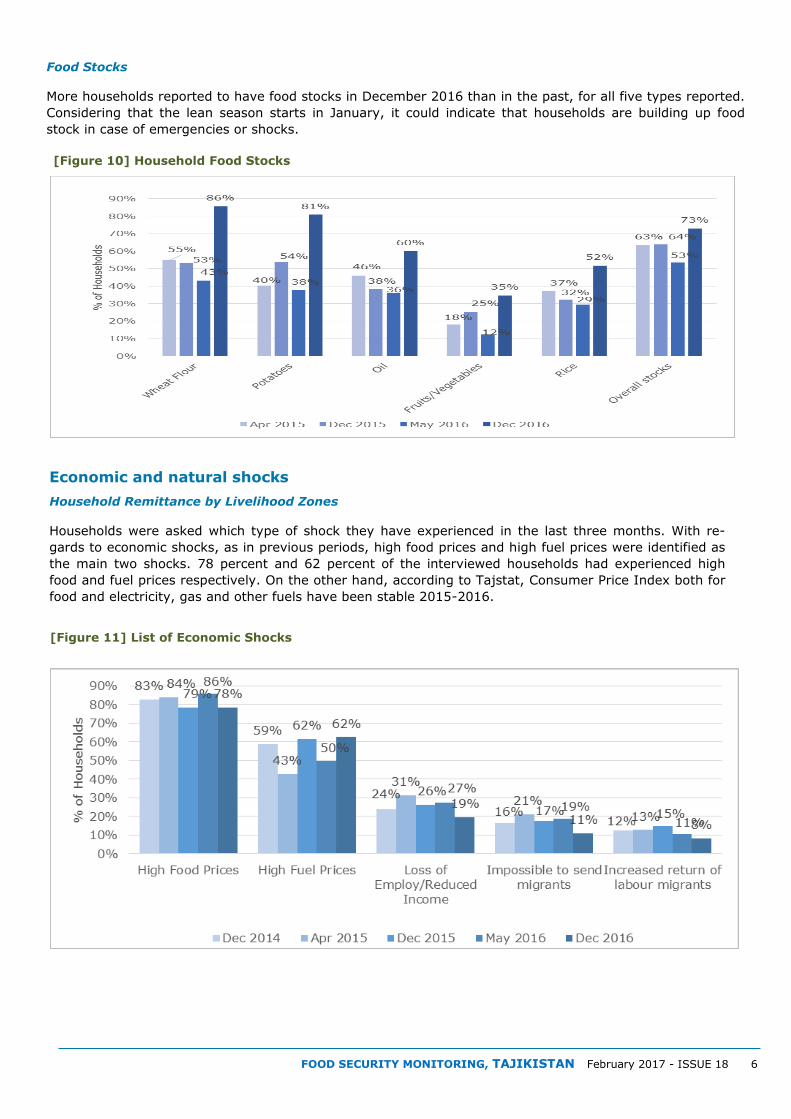
Food Stocks
More households reported to have food stocks in December 2016 than in the past, for all five types reported.
Considering that the lean season starts in January, it could indicate that households are building up food
stock in case of emergencies or shocks.
[Figure 10] Household Food Stocks
Economic and natural shocks
Household Remittance by Livelihood Zones
Households were asked which type of shock they have experienced in the last three months. With re-
gards to economic shocks, as in previous periods, high food prices and high fuel prices were identified as
the main two shocks. 78 percent and 62 percent of the interviewed households had experienced high
food and fuel prices respectively. On the other hand, according to Tajstat, Consumer Price Index both for
food and electricity, gas and other fuels have been stable 2015-2016.
[Figure 11] List of Economic Shocks

FOOD SECURITY MONITORING, TAJIKISTAN February 2017 - ISSUE 18 7
Natural Shock Experienced
In terms of natural shocks, the percentage households who reported having experienced natural shocks in
the last three months before December 2016 is significantly lower compared to May 2016. As of December
2016, 28 percent of the interviewed households responded to have experienced reduced agriculture water,
34 percent crop pest and diseases, 32 percent severe weather conditions, 3 percent landslides/flooding and
30 percent harvest failure.
Coping Strategies
Household Reduced Coping Strategy Index4
In spring 2016, many households experienced
natural shocks as seen in figure 12 above, in-
cluding failure of harvests, crop pests and dis-
ease, and bad weather conditions.
In response, many households used coping
strategies, which is reflected in the reduced
coping strategy index in figure 13. The rCPI
score reached its peak in May 2016, while it
appears to be back to similar level of the scores
from December 2015. Coping strategy index
score decreased from 22 per cent in May 2016
to 15 percent in December 2016. It may be due
to the more stabilized situation in terms of
shocks. Also, as mentioned above, the percent-
age of households with food stock increased
compared to December 2015.
[Figure 13] Household Reduced Coping Strategy Index
4 Reduced coping strategy index is based on the most common set of coping behaviours across countries, such as reduced number of meals, limit
portion size, and reflects the stress level of the household (the higher the score, the higher the stress level).
[Figure 12] Natural Shocks

FOOD SECURITY MONITORING, TAJIKISTAN February 2017 - ISSUE 18 8
Food Consumption Coping Strategies
In line with the decrease in the rCSI, less
households resorted to the use of food con-
sumption related coping strategies in Decem-
ber 2016, compared to previous rounds of
survey.
The coping strategies most commonly adopt-
ed by households involved modifying food
intake habits, such as buying less preferred
and less expensive food (36 percent), limiting
the portion sizes (13 percent) and reducing
the number of meals eaten in a day (10 per-
cent).
[Figure 14] Food Consumption Coping Strategies
Household Asset Depletion Strategies and Livelihood Diversification Strategies
The percentage of households resorting to asset depletion strategies and livelihood diversification strategies
was very high in May 2016, but for most strategies, the figures has declined significantly in December 2016.
Moreover, for strategies like sale of productive and domestic assets, the prevalence is at the lowest level
since May 2015, which could also reflect that the household has exhausted these coping strategies.
A third of the surveyed households are purchasing food on credit and a quarter are spending their savings
due to lack of money to buy food or other basic needs.
[Figure 15] Households’ Asset Depletion Strategies
[Figure 16] Households’ Livelihood Diver-sification Strategies

FOOD SECURITY MONITORING, TAJIKISTAN February 2017 - ISSUE 18 9
Gender5
The majority of the interviewed households are headed by men, 82 percent, versus 18 percent of household
headed by women.
Food Insecurity Prevalence in Trend
Women headed household exhibit a higher rate of food insecurity and less resilience to shock. 33
percent of women-headed households are food insecure while the rate is lower among the male-headed
households at 20 percent. The gap in the food insecurity prevalence by sex of head of household had been
narrowed down to 4 percentage point in December 2015, but it has widened in 2016. The overall percentage
of food insecure households peaked at 28 percent in May 2016. Figure 17 shows that the increase in food
insecurity in May 2016 was more severe among households headed by a woman, 33 percent, compared to
20 percent for households headed by a man.
[Figure 17] Food Insecurity Prevalence in Trend;Household Headship
The gap between household headed by wom-
en and men was largest for the moderately
food insecure group. While 29 percent of
households headed by a woman were moder-
ately food insecure, only 17 percent of the
households headed by a man were included
in this category.
[Figure 18] Food Insecurity Index by sex of head of household (December 2016)
Similar pattern is also observed both in food con-
sumption score and dietary diversity score analysis.
As shown below, a higher percentage of female head-
ed households are categorized into poor or borderline
food consumption score group than male headed
households. For the dietary diversity score, 33 per-
cent of the surveyed female headed households re-
sponded to have consumed four or less food groups,
compared to 21 percent of the surveyed male headed
households.
[Figure 20] Food Consumption Score by sex of head of households
[Figure 19] Dietary Diversity Score by sex of head of household
5 FSMS is an analytical monitoring tool for the food security trend of the relevant factors, rather than representative analytical tool. Among the
interviewed households 17.6% were female-headed while 82.4% male headed.

FOOD SECURITY MONITORING, TAJIKISTAN February 2017 - ISSUE 18 10
Coping strategy patterns by sex of head
of household show that a larger share of
female headed households tend to not
use coping strategies in response to eco-
nomic and natural shocks. However,
emergency coping strategies are used
more by household headed by women.
Given that a higher percentage of female
headed households fall into food insecure
group, this might imply that there is less
coping capacity in female headed house-
holds.
[Figure 21] Coping Strategies by sex of head of household
Child Nutrition Status
A total of 1,041 children under the age of five were covered in the second round of 2016 survey. The number
of boys and girls in the five age categories are similar, in total 51% boys and 49% girls were included.
[Figure 22] Number of children under 5 age by sex
In total 816 children in the age group 6-59 months took part in the anthropometric measurement during
this round. Because of the survey design and methods used for the FSMS, robust statement or representa-
tion cannot be made on child nutrition status. However, the results are indicative of the situation for the
children in the households included in the surveillance.
Aggregated results showed that as in the previous rounds malnutrition continues to be an issue among the
surveyed children and some deterioration is noted since the previous round. Specifically, 33 percent of chil-
dren had the issue of stunting, a slight increase of three percent since the previous round, a slight decrease
noted in the proportion of children underweight from 13% in previous round to 11% and a slight increase
from 6% to 8% in proportion of children experiencing the issue of wasting. Age wise comparison showed
stunting, as the major issue experienced across all the age categories. Details shown in chart below.
Stunting, wasting and underweight
[Figure 23] Acute and chronic malnutrition

FOOD SECURITY MONITORING, TAJIKISTAN February 2017 - ISSUE 18 11
In total 87% children reported receiving breast-
milk the day before the survey, which is a slight
increase compared to previous round (88%),
and a considerable increase compared to De-
cember 2015 (69%).
Age and sex disaggregation shows that a larger
percentage of boys received breastmilk com-
pared to girl within the same age groups. The
only exception was for children 9-11 month, in
which more girls got breastmilk compared to
boys.
[Figure 24] Percent of children breastfed the before the survey
Breastfeeding practices
Exclusive breastfeeding
The WHO guidelines recommends exclusive breastfeeding for children between 0-5 months. The FSMS found
that only 32% of children 0-5 months was exclusively breastfed. The results are the same as in May 2016.
Animal Milk Feeding
Aggregated results indicated that half of the children under age of five as reported by the respondents got
animal milk the day before the survey. Every fourth child under the age of six months has consumed animal
milk the day before the survey.
[Figure 25] Percent of children receiving animal milk the day before the survey
Children consumption of complementary feeding
Respondents were asked if their child got any solid, semi-solid or soft foods the day before the survey.
Aggregated results showed that 76% of children received solid, semi-solid or soft foods. Consumption of
complementary feeding grows with the age categories, i.e. the higher the age group, the larger the pro-
portion of children receiving complimentary feeding. It is worth noting that over 20% of children 0-5
months also got complementary feeding. It is recommended that introduction of complementary feeding
(giving solid or semi-solids to infants in addition to breast milk) starts at the age of 6 months, considering
breastmilk is no longer sufficient to maintain the child’s growth above six months.

FOOD SECURITY MONITORING, TAJIKISTAN February 2017 - ISSUE 18 12
[Figure 26] Proportion of children receiving any solid, semi-solid or soft food the day before the survey
The dietary diversity of children is very low, at a
similar level seen as in the previous rounds of the
FSMS. Only 34% of children under five, excluding 0
-5 months, received complimentary feeding from
four food groups out of the seven. Age-wise review
showed that the minimum dietary diversity is low
among children aged 6-8 months (11%) and is rel-
atively higher among 24-59 months (46%).
[Figure 27] Proportion of children receiving compli-mentary feeding from 4 or more food groups of the 7 the before survey
Analysis of minimum meal frequency was per-
formed for both breastfed and non-breastfed chil-
dren across the five age groups. Half of the breast-
fed children received complimentary feeding from
the seven food groups two or more time, while
80% of children under five got complimentary
feeding from the seven food groups four or more
times.
Age-wise comparison showed that minimum meal frequency among breastfed children is very low among
children 6-8 months (17%) and is highest in children 24-59 months (97%). Among non-breastfed children,
the lowest meal frequency is noted among children 9-11 months.
[Figure 28] Percent of breastfed children receiving complimentary feeding of the 7 food groups 2 or
[Figure 29] Percent of non-breastfed children recei-ving complimentary feeding from the 7 food groups four or more times
6 The seven food groups include: 1) wheat, bread, rice, pasta, biscuits, potatoes or other; 2) Beans, peas, lentils, any nuts; 3): Milk or milk
products; 4) Meat, chicken, fish, liver, kidney, heart or other organ meat; 5) Eggs, 6) Yellow or orange colored vegetables (pumpkin, carrots) &
fruits (yellow plum, apricots); 7) Other vegetables & fruits.
Generally, the nutrition status of children, both exclusive breastfeeding of children 0-5 months and compli-
mentary feeding in terms of dietary diversity remain of a serious concern and need further programmatic
interventions.

FOOD SECURITY MONITORING, TAJIKISTAN February 2017 - ISSUE 18 13
Outlook
Overall food security is expected to deteriorate slightly during the next six months (February—
July 2017), following the seasonal trend before harvest.
More vegetables and fruits will be available in the coming seasons—spring and summer. Also,
the recent increased food stock may also assist households for better food consumption.
According to the Asia Development Bank, Tajikistan’s economy is forecast to grow by 4 % in
2017. The food security situation is expected to improve in 2017.

FOOD SECURITY MONITORING, TAJIKISTAN February 2017 - ISSUE 18 14
For further information please contact:
Heejin Kim, WFP Tajikistan:
[email protected] Erkin Huseinov, WFP Tajikistan: [email protected] Analysis on child nutrition status and infant and young child feeding practices provided
by Shodmon Hojibekov, UNICEF Tajikistan: [email protected]
Food Insecurity Prevalence Map (December 2016)