Embed Size (px)
Citation preview
SSttrreennggtthheenniinngg EEmmeerrggeennccyy NNeeeeddss AAsssseessssmmeenntt CCaappaacciittyy ((SSEENNAACC))
SSuuddaann
Comprehensive Food Security and Vulnerability
Analysis ((CCFFSSVVAA))
DDaattaa ccoolllleecctteedd iinn MMaayy 22000066
Sudan: Comprehensive Food Security and Vulnerability Analysis (CFSVA)
Prepared by Jonathan Rivers, Cinzia Papavero, William Nall, Jan Delbaere, Peter Horjus, Daniel Molla, and Billy Mwinga.
December 2007
© World Food Programme, Vulnerability Analysis and Mapping Branch (ODAV)
Picture: ©2006 WFP/Emilia Casella
This study was prepared under the umbrella of the “Strengthening Emergency Needs Assessment Capacity” (SENAC). Financial support for this study was provided by European Union and the Citigroup Foundation. The views expressed herein can in no way be taken to reflect the official opinion of the European Union or the Citigroup Foundation.
For any queries on this document or the SENAC project, please contact [email protected] or visit www.wfp.org/odan/senac
For information about the VAM Unit, please visit: http://vam.wfp.org
United Nations World Food Programme
Headquarters: Via C.G. Viola 68, Parco de’ Medici, 00148, Rome, Italy
Acknowledgement
The Sudan Comprehensive Food Security and Vulnerability Analysis (CFSVA), is
primarily based on household and community level data obtained from the Sudan
Household Health Survey (SHHS) of the Government of National Unity of Sudan and
the Government of Southern Sudan. WFP provided funds and technical support for
the food security component of the SHHS.
WFP gratefully acknowledges the partnership on the SHHS with the Federal Ministry
of Health (FMoH) and the Central Bureau of Statistics (CBS) representing the
Government of National Unity (GoNU), and the Ministry of Health (MoH) together
with the Southern Sudan Commission for Census, Statistics and Evaluation
(SSCCSE), both representing the Government of Southern Sudan (GoSS).
This CFSVA report is prepared by (in alphabetical order) Jan Delbaere, Peter Horjus,
William Nall, Daniel Molla, Billy Mwinga, Cinzia Papavero and Jonathan Rivers.
Additional analysis and content was provided by Yukiyasu Sumi. Nada Ahmed and
Veronica Rammala prepared most of the maps in the report. Cédric Charpentier
formatted the document.
Useful comments and suggestions were made by colleagues in WFP Sudan and WFP
Headquarters.
GEOGRAPHIC DESIGNATIONS:
South Sudan refers to the following States: Northern Bahr El Ghazal, Western Bahr El Ghazal, Warrup, Lakses, Unity, Upper Nile, Jonglei, Western Equatoria, Central Equatoria and Eastern Equatoria.
Darfur/Greater Darfur refers to the three States in Darfur: North Darfur, South Darfur and West Darfur.
Rest of Sudan refers to the following States: Northern, River Nile, Red Sea, North Kordofan, South Kordofan, Abyei, Khartoum, White Nile, Al Gezira, Kassala, Gedaref, Sennar and Blue Nile.
“The Three Areas” (also known as the Protocol Areas or Transition Areas) refers to South Kordofan, Abyei and Blue Nile States. Their administration and final status will be determined according to specific protocols established under the 2005 Comprehensive Peace Agreement (CPA).
TABLE OF CONTENTS
ACKNOWLEDGEMENT .................................................................................. 3 LIST OF ACRONYMS .................................................................................. 11 EXECUTIVE SUMMARY ............................................................................... 12 INTRODUCTION .......................................................................................... 1 1. STUDY OBJECTIVES AND METHODOLOGY ................................................ 3
1.1 OBJECTIVES........................................................................................ 3 1.2 DEFINITIONS, TERMINOLOGY AND CONCEPTS .................................................. 3 1.3 SOURCES OF DATA ................................................................................ 4 1.4 SURVEY INSTRUMENTS............................................................................ 5 1.5 SAMPLING PROCEDURES .......................................................................... 6 1.5 ENUMERATOR TRAINING AND DATA COLLECTION............................................... 7 1.6 DATA ENTRY AND STATISTICAL ANALYSIS....................................................... 7 1.7 SURVEY LIMITATIONS ............................................................................. 8
2. POLITICAL, ECONOMICAL, INSTITUTIONAL ENVIRONMENT IN SUDAN .... 9 2.1 POLITICAL CONTEXT............................................................................... 9 2.2 ECONOMIC CONTEXT .............................................................................. 9 2.3 AGGREGATE AVAILABILITY AND MARKETS....................................................... 9
3. ASSET ENDOWMENTS ............................................................................ 23 3.1 NATURAL CAPITAL ....................................................................................23 3.2 HUMAN CAPITAL ..................................................................................24 3.3 PHYSICAL CAPITAL ...............................................................................27
4. ACTIVITIES AND LIVELIHOOD GROUPS................................................. 31 4.1 MAIN INCOME SOURCES AND LIVELIHOOD ACTIVITIES ............................................31 4.2 HOUSEHOLD LIVELIHOOD PROFILES............................................................33 4.3 LIVELIHOODS AND WEALTH STATUS.................................................................36 4.4 AGRICULTURAL SECTOR IN SUDAN .............................................................38 4.5 HOUSEHOLD EXPENDITURES ....................................................................40
5. FOOD CONSUMPTION ............................................................................ 43 5.1 FOOD CONSUMPTION PATTERNS .....................................................................43 5.2 SOURCES OF FOOD...............................................................................45 5.3 FOOD CONSUMPTION SCORING .................................................................47 5.4 HOUSEHOLD FOOD CONSUMPTION SCORE .....................................................49 5.5 VALIDATION OF THE FOOD CONSUMPTION SCORE WITH OTHER ACCESS INDICATORS.....49
6. FOOD SECURITY PROFILING ................................................................. 53 6.1 DISTRIBUTION OF HOUSEHOLD FOOD SECURITY STATUS.....................................53 6.2 FOOD SECURITY AND HOUSEHOLD DISPLACEMENT STATUS ..................................54 6.3 FOOD SECURITY AND WEALTH...................................................................54 6.4 EDUCATION OF HOUSEHOLD HEAD AND FOOD SECURITY STATUS ...........................56 6.5 LIVELIHOOD STRATEGIES AND FOOD SECURITY STATUS......................................56 6.6 DEPENDENCY RATIO AND FOOD SECURITY STATUS ...........................................57 6.7 SEX OF HOUSEHOLD HEAD AND FOOD SECURITY STATUS ....................................58 6.8 VEGETABLE GARDEN MAINTENANCE AND FOOD SECURITY STATUS ..........................58 6.9 DETERMINANTS OF FOOD SECURITY ............................................................59 7.1 CHILD HEALTH ....................................................................................60 7.2 CHILD FEEDING PRACTICES .....................................................................61 7.3 CHILD NUTRITIONAL STATUS....................................................................63 7.4 MICRONUTRIENT DEFICIENCIES.................................................................65
8. RISK ANALYSIS FOR SUDAN.................................................................. 67 8.1THE APPROACH.........................................................................................67 8.2 HOUSEHOLD’S CAPACITY TO COPE ..................................................................68 8.3 ANALYSIS OF THE RISK OF DROUGHT ...............................................................69 8.4 FUTURE VULNERABILITY TO CONFLICT ..............................................................72
9. REST OF SUDAN (ROS) .......................................................................... 74 9.1 SITUATIONAL ANALYSIS .........................................................................74 9.2 LIVELIHOOD STRATEGIES OF HOUSEHOLDS....................................................75 9.3 AGRICULTURAL PRODUCTION ........................................................................78 9.4 FOOD CONSUMPTION PATTERNS AND CURRENT HOUSEHOLD FOOD SECURITY .............81 9.5 MOST COMMON SHOCKS.........................................................................88 9.6 HOUSEHOLD VULNERABILITY TO SHOCKS ......................................................90 9.7 GENERAL HEALTH AND NUTRITION SITUATION ................................................91 9.8 CONCLUSIONS AND RECOMMENDATIONS ......................................................98
10. GREATER DARFUR ............................................................................. 101 10.1 SITUATIONAL ANALYSIS .......................................................................101 10.2 LIVELIHOOD STRATEGIES OF HOUSEHOLDS..................................................104 10.3 AGRICULTURAL PRODUCTION..................................................................107 10.4 CURRENT HOUSEHOLD FOOD SECURITY STATUS ...........................................108 10.5 MOST COMMON SHOCKS.......................................................................114 10.6 HOUSEHOLD VULNERABILITY TO SHOCKS ....................................................114 10.7 GENERAL HEALTH AND NUTRITION SITUATION ..............................................117
10.8 CONCLUSIONS AND RECOMMENDATIONS ....................................................121 11. SOUTHERN SUDAN ............................................................................ 125
11.1 SITUATIONAL ANALYSIS .......................................................................125 11.2 LIVELIHOOD STRATEGIES OF HOUSEHOLDS..................................................127 11.3 AGRICULTURAL PRODUCTION..................................................................131 11.4 FOOD CONSUMPTION PATTERNS AND CURRENT HOUSEHOLD FOOD SECURITY ...........134 11.5 MOST COMMON SHOCKS.......................................................................140 11.6 HOUSEHOLD VULNERABILITY TO SHOCKS ....................................................141 11.7 GENERAL HEALTH AND NUTRITION SITUATION ..............................................143 11.8 CONCLUSIONS AND RECOMMENDATIONS ....................................................150
LIST OF TABLES
TABLE 1. SUMMARY OF COMMUNITIES, HOUSEHOLDS, AND CHILDREN SAMPLED PER STATE .......... 6 TABLE 2. SUDAN: CEREAL BALANCE FOR 2006/07 (000 MT) .........................................10 TABLE 3. SUDAN: CEREAL SURPLUS (OR DEFICIT) BY STATE ............................................10 TABLE 4. INFLATION RATES – LOW INCOME GROUP – ROS AND GREATER DARFUR STATES ........13 TABLE 5. LAND TENURE AND USE, EXAMINED BY REGION.................................................24 TABLE 6. LIVESTOCK OWNERSHIP BY REGION (PERCENT) ................................................24 TABLE 7. GENDER COMPOSITION OF SUDANESE POPULATION (PERCENT) ..............................24 TABLE 8. HOUSEHOLDS SIZE AND AGE OF HOUSEHOLD HEAD AND CHARACTERISTICS OF VULNERABLE
HOUSEHOLDS............................................................................................25 TABLE 9. DISPLACEMENT STATUS OF HOUSEHOLDS IN SUDAN (PERCENT) .............................25 TABLE 10. LITERACY AND SCHOOLING OF ADULTS IN SUDAN (PERCENT)...............................26 TABLE 11. LITERACY AND SCHOOLING OF ADULT WOMEN IN SUDAN (PERCENT).......................26 TABLE 12. PERCENTAGE OF CHILDREN ATTENDING PRIMARY OR SECONDARY SCHOOL, SUDAN 2006
...........................................................................................................27 TABLE 13. ACCESS TO PRODUCTIVE ASSETS IN SUDAN (PERCENT) .....................................28 TABLE 14. ACCESS TO NON PRODUCTIVE ASSETS IN SUDAN.............................................28 TABLE 15. FIVE MOST COMMON LIVELIHOOD ACTIVITIES BY REGION (PERCENT) ......................32 TABLE 16. LIVELIHOOD PROFILES FOR SUDAN ............................................................34 TABLE 17. IMPORTANCE OF LIVELIHOOD PROFILES BY REGION ..........................................35 TABLE 18. CROPPING SEASON BY REGION IN SUDAN .....................................................38 TABLE 19. PERCENTAGE OF HOUSEHOLDS PRODUCING CROPS, NUMBER OF HARVESTS AND LENGTH OF
HUNGER SEASONS, BY REGION ........................................................................38 TABLE 20. PERCENTAGE OF HOUSEHOLDS THAT PRODUCE CROPS AND RATION OF AMOUNT CONSUMED
VERSUS SOLD/ EXCHANGED BY REGION ..............................................................39 TABLE 21. FOOD PURCHASES AND METHOD OF PAYMENT BY REGION (PERCENT) ......................41 TABLE 22. NON FOOD PURCHASES AND METHOD OF PAYMENT BY REGION (PERCENT) ................41 TABLE 23. PERCENTAGE OF HOUSEHOLDS THAT REPORT WORKING FOR PAY VERSUS FOOD (PERCENT)
...........................................................................................................42 TABLE 24. NUTRIENT DENSITY VALUES BY FOOD GROUPS/ CATEGORIES ...............................47 TABLE 25. CUTOFFS TO DETERMINE ‘GOOD’, ‘BORDERLINE’ AND ‘POOR’ FOOD CONSUMPTION
PATTERNS................................................................................................47 TABLE 26. ‘POOR’, ‘BORDERLINE’ AND ‘GOOD’ FOOD CONSUMPTION GROUPS.........................49 TABLE 27. FOOD CONSUMPTION PROFILES FOR SUDAN...................................................51 TABLE 28. FOOD CONSUMPTION PROFILES BY REGION....................................................52 TABLE 29. PERCENTAGE AND NUMBER OF FOOD INSECURE HOUSEHOLDS IN SUDAN ..................53 TABLE 30. PERCENTAGE OF POPULATION THAT ARE FOOD INSECURE BY REGION ......................53
TABLE 31. PREVALENCE OF DIARRHEA AND TYPES OF TREATMENT BY REGION (PERCENT) ............60 TABLE 32. PREVALENCE OF FEVER AND TYPES OF TREATMENTS BY REGION (PERCENT) ...............60 TABLE 33. PREVALENCE OF ARI AND TYPES OF TREATMENTS BY REGION (PERCENT) .................60 TABLE 34. CHILD FEEDING PRACTICES BY REGION ........................................................63 TABLE 35. PERCENTAGE OF HOUSEHOLDS WITH ACCESS TO PROPERLY IODIZED SALT (PERCENT)...65 TABLE 36. PERCENTAGE OF SALT OBTAINED FROM LOCAL MARKETS, FOOD AID AND NATURAL
RESOURCES (PERCENT) ................................................................................66 TABLE 37. PERCENTAGE OF CHILDREN RECEIVING VITAMIN A SUPPLEMENTATION AND SOURCE OF
LAST SUPPLEMENT (PERCENT) .........................................................................66 TABLE 38. NATURAL DISASTERS IN SUDAN FROM 1940-2006 .........................................67 TABLE 39. FIVE MOST COMMONLY REPORTED LIVELIHOODS BY STATE IN ROS (PERCENT) ...........76 TABLE 40. FREQUENCY AND DISTRIBUTION OF LIVELIHOOD PROFILES IN THE ROS REGION .........77 TABLE 41. CROPPING SEASON BY STATE AND TYPE OF CROP IN ROS...................................79 TABLE 42. LAND USE, LENGTH OF HARVEST, LENGTH OF HUNGER SEASON AND MAINTENANCE OF
VEGETABLE GARDENS...................................................................................80 TABLE 43. PERCENTAGE OF CROP PRODUCING HOUSEHOLDS AND PROPORTION OF HARVEST
CONSUMED, SOLD OR EXCHANGED IN ROS (PERCENT).............................................80 TABLE 44. FOOD SECURITY STATUS BY STATE IN ROS ...................................................83 TABLE 45. FOOD SECURITY STATUS, SHARE OF FOOD INSECURE AND SHARE OF BENEFICIARIES BY
STATE IN ROS ..........................................................................................85 TABLE 46. TOP THREE SHOCKS REPORTED BY HOUSEHOLDS IN EACH STATE IN ROS .................89 TABLE 47. VULNERABILITY TO DROUGHT BY STATE IN ROS .............................................90 TABLE 48. PREVALENCE OF DIARRHEA AND TYPES OF TREATMENTS BY STATE IN ROS (PERCENT) ..92 TABLE 49. PREVALENCE OF FEVER AND TYPES OF TREATMENTS BY STATE IN ROS (PERCENT) .......92 TABLE 50. PREVALENCE OF FEVER AND TYPES OF TREATMENTS BY STATE IN ROS (PERCENT) .......93 TABLE 51. CHILD FEEDING PRACTICES BY STATE IN ROS................................................93 TABLE 52. PERCENTAGE OF HOUSEHOLDS IN ROS WITH PROPERLY IODIZED SALT (PERCENT) ......96 TABLE 53. SOURCE OF HOUSEHOLD SALT IN ROS (PERCENT)...........................................97 TABLE 54. PERCENTAGE OF CHILDREN RECEIVING VITAMIN A SUPPLEMENT IN ROS AND SOURCE OF
LAST SUPPLEMENT (PERCENT) .........................................................................97 TABLE 55. THE STATES MOST VULNERABLE TO DROUGHT AND INSECURITY IN ROS ..................98 TABLE 56. THE TOP 5 MOST COMMONLY REPORTED LIVELIHOODS ACTIVITIES BY STATE IN GREATER
DARFUR (PERCENT)...................................................................................106 TABLE 57. FREQUENCY AND DISTRIBUTION OF LIVELIHOOD PROFILES IN GREATER DARFUR .......107 TABLE 58. CROPPING SEASON BY TYPE OF CROP AND STATE IN GREATER DARFUR..................107 TABLE 59. LAND USE, HARVEST MONTHS, LENGTH OF HUNGER SEASON AND MAINTENANCE OF
VEGETABLE PLOTS BY STATE IN GREATER DARFUR ................................................108 TABLE 60. PERCENTAGE OF CROP PRODUCING HOUSEHOLDS AND PROPORTION OF HARVEST
CONSUMED, SOLD OR EXCHANGED BY STATE IN GREATER DARFUR .............................108
TABLE 61. PERCENTAGE OF FOOD INSECURE HOUSEHOLDS BY STATE IN GREATER DARFUR........110 TABLE 62. FOOD SECURITY STATUS, SHARE OF FOOD INSECURE AND SHARE OF FOOD AID
BENEFICIARIES BY STATE IN GREATER DARFUR ...................................................111 TABLE 63. TOP THREE MOST COMMON SHOCKS BY STATE IN GREATER DARFUR .....................114 TABLE 64. PERCENTAGE OF HOUSEHOLD VULNERABLE TO DROUGHT BY STATE IN GREATER DARFUR
.........................................................................................................116 TABLE 65. PREVALENCE OF DIARRHEA AND TYPES OF TREATMENTS BY STATE IN GREATER DARFUR
(PERCENT).............................................................................................117 TABLE 66. PREVALENCE OF FEVER AND TYPES OF TREATMENTS BY STATE IN GREATER DARFUR
(PERCENT).............................................................................................117 TABLE 67. PREVALENCE OF ARI AND TYPES OF TREATMENTS BY STATE IN GREATER DARFUR
(PERCENT).............................................................................................118 TABLE 68. CHILD FEEDING PRACTICES BY STATE IN GREATER DARFUR...............................118 TABLE 69. PERCENTAGE OF HOUSEHOLDS WITH PROPERLY IODIZED SALT BY STATE IN GREATER
DARFUR (PERCENT)...................................................................................121 TABLE 70. SOURCE OF HOUSEHOLDS SALT BY STATE IN GREATER DARFUR (PERCENT).............121 TABLE 71. PERCENTAGE OF CHILDREN RECEIVING VITAMIN A SUPPLEMENTS AND SOURCE OF LAST
SUPPLEMENT...........................................................................................121 TABLE 72. TRADITIONAL LIVELIHOOD ZONES IN SOUTHERN SUDAN ..................................128 TABLE 73. TOP 5 MOST COMMONLY REPORTED LIVELIHOOD ACTIVITIES BY STATE IN SOUTHERN
SUDAN (PERCENT)....................................................................................129 TABLE 74. FREQUENCY AND DISTRIBUTION OF LIVELIHOODS PROFILES BY STATE IN SOUTHERN
SUDAN .................................................................................................130 TABLE 75. CROPPING SEASON BY TYPE OF CROP AND TRADITIONAL LIVELIHOOD ZONE IN SOUTHERN
SUDAN .................................................................................................131 TABLE 76. LAND USE, MONTHS HARVEST LAST, LENGTH OF HUNGER SEASON AND MAINTENANCE OF
VEGETABLE PLOTS BY STATE IN SOUTHERN SUDAN................................................132 TABLE 77. PERCENTAGE OF CROP PRODUCING HOUSEHOLDS AND PROPORTION OF HARVEST
CONSUMED, SOLD OR EXCHANGED BY STATE IN SOUTHERN SUDAN (PERCENT)................133 TABLE 78. PERCENTAGE OF FOOD INSECURE HOUSEHOLDS BY STATE IN SOUTHERN SUDAN .......136 TABLE 79. FOOD SECURITY STATUS, NUMBER OF FOOD INSECURE PEOPLE AND SHARE OF FOOD AID
BENEFICIARIES BY STATE IN SOUTHERN SUDAN ...................................................138 TABLE 80. TOP THREE MOST COMMON SHOCKS PER STATE IN SOUTHERN SUDAN ...................140 TABLE 81. PERCENTAGE OF HOUSEHOLDS VULNERABLE TO DROUGHT BY STATE IN SOUTHERN SUDAN
.........................................................................................................142 TABLE 82. PREVALENCE OF DIARRHEA AND TYPES OF TREATMENTS BY STATE IN SOUTHERN SUDAN
(PERCENT).............................................................................................143 TABLE 83. PREVALENCE OF FEVER AND TYPES OF TREATMENTS BY STATE IN SOUTHERN SUDAN
(PERCENT).............................................................................................143 TABLE 84. PREVALENCE OF COUGH AND TYPES OF TREATMENTS BY STATE IN SOUTHERN SUDAN
(PERCENT).............................................................................................144
TABLE 85. CHILD FEEDING PRACTICES BY STATE IN SOUTHERN SUDAN ..............................144 TABLE 86. PERCENTAGE OF HOUSEHOLDS WITH PROPERLY IODIZED SALT BY STATE IN SOUTHERN
SUDAN (PERCENT)....................................................................................149 TABLE 87. SOURCE OF HOUSEHOLD SALT BY STATE IN SOUTHERN SUDAN (PERCENT)..............150 TABLE 88. PERCENTAGE OF CHILDREN RECEIVING VITAMIN A SUPPLEMENTATION AND SOURCE OF
LAST SUPPLEMENT IN SOUTHERN SUDAN (PERCENT)..............................................150 TABLE 89. STATES MOST VULNERABLE TO INSECURITY, DROUGHT AND FLOODS.....................151
LIST OF FIGURES
FIGURE 1. LIVELIHOOD AND FOOD SECURITY FRAMEWORK ................................................ 4 FIGURE 2. SORGHUM PRICES IN ROS, JANUARY 2003 TO MAY 2007.................................11 FIGURE 3. SORGHUM PRICES, ADJUSTED FOR INFLATION, IN ROS JANUARY 2003 TO MAY 2007 .12 FIGURE 4. SORGHUM PRICES: DARFUR MARKETS COMPARED TO GEDARIF MARKETS, JANUARY 2003
TO MAY 2007...........................................................................................12 FIGURE 5. SORGHUM PRICES: SOUTHERN SUDAN MARKET COMPARED TO GEDARIF MARKET, JANUARY
2003 TO MAY 2007 ...................................................................................13 FIGURE 6. TERMS OF TRADE: LABOUR AND SORGHUM IN ROS, JANUARY 2005 TO MAY 2007 ....15 FIGURE 7. TERMS OF TRADE: LABOUR AND SORGHUM IN GREATER DARFUR, JANUARY 2005 TO MAY
2007 ....................................................................................................16 FIGURE 8. TERMS OF TRADE: LABOUR AND SORGHUM IN SOUTHERN SUDAN, JANUARY 2005 TO MAY
2007 ....................................................................................................16 FIGURE 9. TERMS OF TRADE: CHARCOAL AND SORGHUM IN ROS, JANUARY 2005 TO MAY 2007 .17 FIGURE 10. TERMS OF TRADE: CHARCOAL AND SORGHUM IN GREATER DARFUR, JANUARY 2005 TO
MAY 2007...............................................................................................17 FIGURE 11. TERMS OF TRADE: CHARCOAL AND SORGHUM IN SOUTHERN SUDAN, JANUARY 2005 TO
MAY 2007...............................................................................................18 FIGURE 12. TERMS OF TRADE: FIREWOOD AND SORGHUM IN ROS, JANUARY 2005 TO MAY 200718 FIGURE 13. TERMS OF TRADE: FIREWOOD AND SORGHUM IN GREATER DARFUR, JANUARY 2005 TO
MAY 2007...............................................................................................19 FIGURE 14. TERMS OF TRADE: FIREWOOD AND SORGHUM IN SOUTHERN SUDAN, JANUARY 2005 TO
MAY 2007...............................................................................................19 FIGURE 15. TERMS OF TRADE: MALE GOATS AND SORGHUM IN ROS, JANUARY 2005 TO MAY 2007
...........................................................................................................20 FIGURE 16. TERMS OF TRADE: MALE GOATS AND SORGHUM IN GREATER DARFUR, JANUARY 2005
TO MAY 2007...........................................................................................20 FIGURE 17. TERMS OF TRADE: MALE GOATS AND SORGHUM IN SOUTHERN SUDAN, JANUARY 2005
TO MAY 2007...........................................................................................21 FIGURE 18. SORGHUM PRICE IN GEDARIF MARKETS, 2003 TO 2007..................................21 FIGURE 19. WFP FOOD AID ASSISTANCE BY REGION, 2003 TO 2006.................................22 FIGURE 20. POPULATION PYRAMIDS FOR SUDAN ..........................................................25
FIGURE 21. PERCENTAGE OF HOUSEHOLDS IN EACH WEALTH QUINTILE OWNING VARIOUS (NON
PRODUCTIVE) ASSETS ..................................................................................29 FIGURE 22. PERCENTAGE OF HOUSEHOLDS IN EACH WEALTH QUINTILE OWNING VARIOUS ASSETS,
INCLUDING PRODUCTIVE ASSETS......................................................................29 FIGURE 23. CORRELATION BETWEEN WEALTH INDEX AND HOUSEHOLDS DISPLACEMENT STATUS ....30 FIGURE 24. CORRELATION BETWEEN WEALTH INDEX AND SEX OF HEAD OF HOUSEHOLD .............30 FIGURE 25. ASSET WEALTH BY REGION IN SUDAN ........................................................30 FIGURE 26. BASIC LIVELIHOODS ZONES SUDAN ..........................................................31 FIGURE 27. AVERAGE NUMBER OF HOUSEHOLD LIVELIHOODS BY REGION ..............................32 FIGURE 28. PERCENT OF HOUSEHOLDS IN EACH LIVELIHOOD PROFILE..................................34 FIGURE 29. DISTRIBUTION OF LIVELIHOOD PROFILE BY REGION ........................................35 FIGURE 30. DISTRIBUTION OF LIVELIHOOD PROFILES IN SUDAN........................................36 FIGURE 31. WEALTH STATUS OF LIVELIHOOD PROFILES ..................................................37 FIGURE 32. MEAN NUMBER OF TIMES FOOD ITEM CONSUMED IN GREATER DARFUR AND ROS ......43 FIGURE 33. MEAN NUMBER OF TIMES FOOD ITEM CONSUMED IN SOUTHERN SUDAN ..................43 FIGURE 34. MAIN SOURCES OF FOOD BY REGION .........................................................45 FIGURE 35. MAIN SOURCE OF FOOD (IN THE FOOD AID BASKET) BY REGION ..........................46 FIGURE 36. SOURCES OF FOOD IN FOOD INSECURE POPULATIONS ......................................46 FIGURE 37. RELATIVE CONTRIBUTION OF EACH FOOD ITEM TO INCREASING FOOD CONSUMPTION
SCORES, ASSESSED OVERALL AND BY REGION .......................................................48 FIGURE 38. CORRELATION BETWEEN FOOD CONSUMPTION SCORES AND WEALTH QUINTILES ........50 FIGURE 39. CORRELATION BETWEEN FOOD CONSUMPTION SCORES AND WEALTH QUINTILES,
ASSESSED BY REGION ..................................................................................50 FIGURE 40. CORRELATION BETWEEN WEALTH INDEX SCORES AND FOOD CONSUMPTION GROUPS,
ASSESSED BY REGION ..................................................................................51 FIGURE 41. FOOD CONSUMPTION PROFILES EXAMINED IN RELATION TO FOOD CONSUMPTION GROUPS
...........................................................................................................52 FIGURE 42. GEOGRAPHIC DISTRIBUTION OF FOOD INSECURITY BY STATE..............................53 FIGURE 43. CORRELATION BETWEEN FOOD SECURITY AND HOUSEHOLDS DISPLACEMENT STATUS...54 FIGURE 44. CORRELATION BETWEEN WEALTH QUINTILES AND FOOD SECURITY STATUS ..............55 FIGURE 45. WEALTH INDEX RANKING IN FOOD INSECURE POPULATIONS................................55 FIGURE 46. CORRELATION BETWEEN EDUCATION OF HOUSEHOLD HEAD AND FOOD SECURITY STATUS
...........................................................................................................56 FIGURE 47. CORRELATION BETWEEN LIVELIHOOD PROFILES AND FOOD SECURITY STATUS...........56 FIGURE 48. CORRELATION BETWEEN LIVELIHOODS AND FOOD SECURITY STATUS, EXAMINED BY
REGION ..................................................................................................57 FIGURE 49. CORRELATION BETWEEN HIGH DEPENDENCY RATIOS AND FOOD SECURITY STATUS IN
SUDAN ...................................................................................................58
FIGURE 50. CORRELATION BETWEEN SEX OF HOUSEHOLD HEAD AND FOOD SECURITY STATUS IN
SUDAN ...................................................................................................58 FIGURE 51. CORRELATION BETWEEN VEGETABLE PLOT MAINTAINENANCE AND FOOD SECURITY STATUS
...........................................................................................................59 FIGURE 52. CHILD FEEDING PATTERNS IN SUDAN (0-24 MONTHS OF AGE) ...........................62 FIGURE 53. CHILD FEEDING PATTERNS (0-24 MONTHS) BY REGION ...................................62 FIGURE 54: ASSOCIATION BETWEEN ASSET WEALTH AND COPING CAPACITY ..........................68 FIGURE 55: HOUSEHOLDS EXPERIENCING SHOCK AFFECTING THEIR ABILITY TO EAT AND/OR BUY
FOOD AND COPING STRATEGIES APPLIED.............................................................69 FIGURE 56 LIVING IN SOUTHERN SUDAN INCREASES THE PROBABILITY OF A FOOD SHOCK ..........69 FIGURE 57 VULNERABILITY TO BECOMING FOOD INSECURE FROM DROUGHT IN RELATION TO PRE-
SHOCK FOOD SECURITY ................................................................................70 FIGURE 58. DO VULNERABLE HOUSEHOLDS LIVE IN DROUGHT PRONE AREAS?.........................71 FIGURE 59 HOUSEHOLDS AT RISK FOR FOOD INSECURITY CAUSED BY DROUGHT ......................71 FIGURE 60. MAP OF HOUSEHOLDS AT RISK FOR DROUGHT...............................................72 FIGURE 61. HIGH RISK FLOOD AREAS IN SUDAN..........................................................73 FIGURE 62. NUMBER OF LIVELIHOODS ENGAGED IN BY STATE IN ROS.................................76 FIGURE 63: TOP FOUR LIVELIHOOD PROFILES BY STATE..................................................78 FIGURE 64. NUMBER OF TIMES FOOD GROUPS WERE CONSUMED PER WEEK BY STATE IN ROS ......82 FIGURE 65. SOURCE OF FOOD BY STATE IN ROS .........................................................82 FIGURE 66. SOURCES OF FOOD (ONLY FOOD FROM FOOD AID BASKET) BY STATE IN ROS...........83 FIGURE 67 . PREVALENCE OF FOOD INSECURITY AND POVERTY BY STATE...............................84 FIGURE 68. SHARE OF FOOD INSECURE HOUSEHOLDS EXAMINED IN RELATION TO SHARE OF
BENEFICIARIES BY STATE IN ROS.....................................................................85 FIGURE 69. NUMBER OF FOOD INSECURE HOUSEHOLDS EXAMINED IN RELATION TO NUMBER OF
BENEFICIARIES BY STATE IN ROS.....................................................................86 FIGURE 70. SIGNIFICANT PREDICTORS OF HOUSEHOLD FOOD SECURITY STATUS, TAKING ACCOUNT
OF POTENTIAL CONFOUNDERS .........................................................................88 FIGURE 71. HIGH RISK FLOOD AREAS IN ROS ............................................................91 FIGURE 72. ANNUAL FLUCTUATIONS IN GAM, SAM AND U5 MORTALITY RATES IN ROS ............95 FIGURE 73. ANNUAL FLUCTUATIONS IN GAM, SAM, U5 MORTALITY RATES AND NUMBERS OF FOOD
AID BENEFICIARIES IN ROS ...........................................................................96 FIGURE 74. DISTRIBUTION OF IDP AND REFUGEE CAMPS IN GREATER DARFUR.....................102 FIGURE 75. LIVELIHOOD ZONES IN GREATER DARFUR .................................................104 FIGURE 76. NUMBER OF LIVELIHOODS HOUSEHOLDS ENGAGE IN 5 MAIN ACTIVITIES BY STATE,
GREATER DARFUR ....................................................................................106 FIGURE 77. NUMBER OF TIMES FOOD GROUPS WERE CONSUMED PER WEEK BY STATE IN GREATER
DARFUR ................................................................................................109 FIGURE 78. SOURCE OF FOOD BY STATE IN GREATER DARFUR ........................................109
FIGURE 79. SOURCES OF FOOD (ONLY FOOD FROM FOOD AID BASKET) BY STATE IN GREATER
DARFUR ................................................................................................110 FIGURE 80. SHARE OF FOOD INSECURE HOUSEHOLDS EXAMINED IN RELATION TO SHARE OF
BENEFICIARIES BY STATE IN GREATER DARFUR ...................................................111 FIGURE 81. NUMBER OF INDIVIDUALS WITH POOR FOOD CONSUMPTION EXAMINED IN RELATION TO
NUMBER OF BENEFICIARIES BY STATE IN GREATER DARFUR .....................................111 FIGURE 82. SIGNIFICANT PREDICTORS OF HOUSEHOLD FOOD SECURITY STATUS, TAKING ACCOUNT
OF POTENTIAL CONFOUNDERS .......................................................................113 FIGURE 83. INSTANCES OF VIOLENCE BY AREA AND TYPE OF INCIDENT IN GREATER DARFUR......115 FIGURE 84. HIGH RISK FLOOD AREAS IN GREATER DARFUR ...........................................116 FIGURE 85. ANNUAL FLUCTUATIONS IN GAM, SAM AND U5 MORTALITY RATES IN GREATER DARFUR
.........................................................................................................119 FIGURE 86. ANNUAL FLUCTUATIONS IN GAM, SAM, U5 MORTALITY RATES AND NUMBERS OF FOOD
AID BENEFICIARIES IN GREATER DARFUR ..........................................................120 FIGURE 87. GEOGRAPHIC DISTRIBUTION OF TRADITIONAL LIVELIHOOD ZONE IN SOUTHERN SUDAN
.........................................................................................................127 FIGURE 88. NUMBER OF LIVELIHOODS HOUSEHOLDS THAT ENGAGE IN 5 MAIN ACTIVITIES IN
SOUTHERN SUDAN....................................................................................129 FIGURE 89. TOP FOUR LIVELIHOOD PROFILES BY STATE ................................................130 FIGURE 90. NUMBER OF TIMES FOOD GROUPS WERE CONSUMED PER WEEK BY STATE IN SOUTHERN
SUDAN .................................................................................................135 FIGURE 91. SOURCE OF FOOD BY STATE IN SOUTHERN SUDAN........................................135 FIGURE 92. SOURCES OF FOOD (ONLY FOOD FROM FOOD AID BASKET) BY STATE IN SOUTHERN
SUDAN .................................................................................................136 FIGURE 93. PREVALENCE OF FOOD INSECURITY AND POVERTY BY STATE .............................137 FIGURE 94. SHARE OF FOOD INSECURE HOUSEHOLDS EXAMINED IN RELATION TO SHARE OF
BENEFICIARIES BY STATE IN SOUTHERN SUDAN ...................................................138 FIGURE 95. NUMBER OF FOOD INSECURE PEOPLE EXAMINED IN RELATION TO NUMBER OF
BENEFICIARIES BY STATE, SOUTHERN SUDAN .....................................................138 FIGURE 96. SIGNIFICANT PREDICTORS OF FOOD SECURITY STATUS, TAKING ACCOUNT OF POTENTIAL
CONFOUNDERS ........................................................................................140 FIGURE 97. HIGH RISK FLOOD AREAS IN SOUTHERN SUDAN...........................................142 FIGURE 98. ANNUAL FLUCTUATIONS IN GAM, SAM, AND U5 MORTALITY RATES IN THE NILE AND
SOBAT RIVERS/ EASTERN FLOOD PLAINS ZONES..................................................145 FIGURE 99. ANNUAL FLUCTUATIONS IN GAM, SAM, AND U5 MORTALITY RATES IN THE WESTERN
FLOOD PLAINS ZONE ..................................................................................145 FIGURE 100. ANNUAL FLUCTUATIONS IN GAM, SAM, U5 MORTALITY RATES AND NUMBERS OF FOOD
AID BENEFICIARIES IN THE NILE AND SOBAT RIVERS/ EASTERN FLOOD PLAINS ZONES ......148 FIGURE 101. ANNUAL FLUCTUATIONS IN GAM, SAM, U5 MORTALITY RATES AND NUMBERS OF
BENEFICIARIES IN THE WESTERN FLOOD PLAINS ZONE ...........................................148
List of acronyms
CPA Comprehensive Peace Agreement
CPI Consumer Price Index
DPA Darfur Peace Agreement
GAM Global Acute Malnutrition Rates
GONU Government of National Unity
GOS Government of Sudan
GOSS Government of Southern Sudan
HAZ Height-for-age z-scores
IDD Iodine Deficiency Disorder
LRA Lord’s Resistance Army
PDF People’s Defense Forces
ROS Rest of Sudan
SAF Sudanese Armed Forces
SAM Severe Acute Malnutrition
SPLA Sudan People’s Liberation Army
SPLM Sudan People’s Liberation Movement
SSDF Southern Sudanese Defense Forces
U5MR Under Five Mortality Rates
UNICEF United Nations Children’s Fund
WAZ Weight-for-age z-scores
WHO World Health Organization
WHZ Weight-for-height z-scores
Executive Summary
Introduction
In Sudan, civil war has raged between north and south for decades. While the 2005 Comprehensive Peace Agreement (CPA) ended hostilities, the human toll of the conflict remains evident. Overall, it is estimated that 2 million died, 6 million were displaced and untold millions lost assets, land and livelihoods. Economic and developmental repercussions have been far reaching. Existing infrastructure in the south has either been destroyed or suffered years of neglect. While underdevelopment is a particularly acute problem in the south, the rest of Sudan also faces economic and developmental obstacles. High poverty, childhood malnutrition, morbidity and mortality rates are the norm. The persistence of large-scale civil conflict in Darfur promises only to exacerbate these problems. Continuing conflict has left hundreds of thousands dead and millions displaced in the region.
Despite the numerous problems facing Sudan, the signing of the CPA substantially improved security throughout southern Sudan and the “three areas” and provided a crucial window for the Government and the international community to assess the health and wellbeing of households throughout the country. The 2006 Sudan Household Health Survey (SHHS) is the first step in this process. This survey provides the first comprehensive, state-by-state assessment of the current food security, health and nutrition situation, helping to identify populations most at risk.
Seizing upon this newly available baseline information as well as the results of other relevant assessments and studies, WFP has compiled this Comprehensive Food Security and Vulnerability Analysis (CFSVA) with the objective of measuring the extent and depth of food insecurity throughout Sudan. In this way, the CFSVA is intended to inform relevant decision-making processes to mitigate food crises and increase food security.
Socio-economic situation in Sudan
Sudan is a culturally diverse country with many different ethnicities, languages and religions. The arab and non arab peoples of northern Sudan practice Sunni Islam and speak Arabic as the official language. Northern Sudan (for the purposes of this report) is comprised of two distinct regions: Rest of Sudan (ROS) and Greater Darfur. ROS, which includes the economic and political centres of Khartoum and Port Sudan, is the country’s wealthiest and most developed region. Sudan’s rapid economic growth in the last 5-10 years has benefited households in this region disproportionately. Greater Darfur is comprised of the three western-most states, North, South and West Darfur. Households in this area, even pre-conflict, were substantially poorer than households in ROS, despite two of its three states traditionally being surplus food producers and the region itself being a primary source of trade revenue from livestock. Given the ongoing conflict and its affects on infrastructure, livelihood opportunities and societal cohesion, wealth disparities between households in Greater Darfur and ROS appear likely to grow.
Southern Sudan (again for purposes of discussion in this report) is comprised of the 10 southern-most states in Sudan. In southern Sudan, there are over 500 different ethnicities and hundreds of dialects. The majority of the population practice Christianity or various other indigenous faiths. Southern Sudan has suffered during the civil war with the north. Years of fighting destroyed much of the existing infrastructure and resulted in a fundamental breakdown of traditional livelihoods. While the wellbeing of households has increased in the post-CPA period, southern Sudan remains the poorest and least developed region in Sudan and one of the poorest and least developed regions in the world.
Population estimates for the country, given persistent conflict and the nomadic nature of Sudanese households, are difficult to verify, though the most recent and trusted estimates put Sudan’s population at slightly over 40 million, with just over 30 million in the north (ROS and Greater Darfur) and about 10 million in the south. Information on demographic and household composition is typical for a developing country. Overall, data from the SHHS showed a young population (with a mean age of 16), evenly split between males and females. Households had
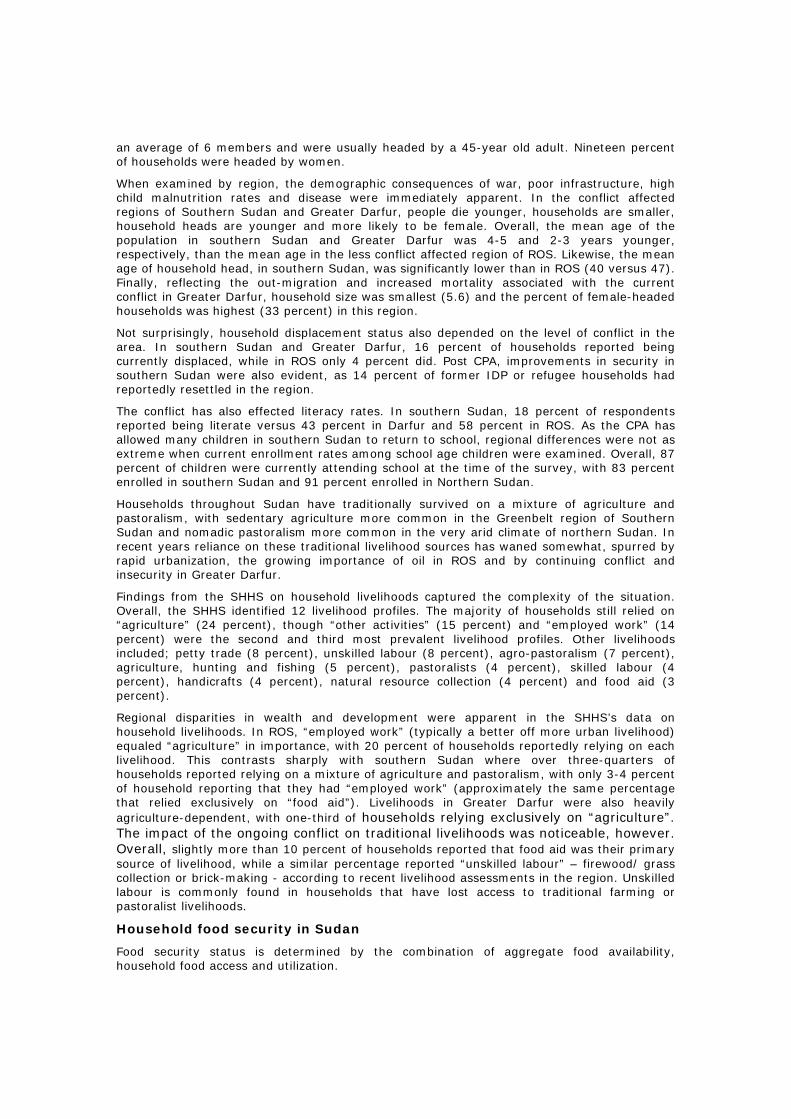
an average of 6 members and were usually headed by a 45-year old adult. Nineteen percent of households were headed by women.
When examined by region, the demographic consequences of war, poor infrastructure, high child malnutrition rates and disease were immediately apparent. In the conflict affected regions of Southern Sudan and Greater Darfur, people die younger, households are smaller, household heads are younger and more likely to be female. Overall, the mean age of the population in southern Sudan and Greater Darfur was 4-5 and 2-3 years younger, respectively, than the mean age in the less conflict affected region of ROS. Likewise, the mean age of household head, in southern Sudan, was significantly lower than in ROS (40 versus 47). Finally, reflecting the out-migration and increased mortality associated with the current conflict in Greater Darfur, household size was smallest (5.6) and the percent of female-headed households was highest (33 percent) in this region.
Not surprisingly, household displacement status also depended on the level of conflict in the area. In southern Sudan and Greater Darfur, 16 percent of households reported being currently displaced, while in ROS only 4 percent did. Post CPA, improvements in security in southern Sudan were also evident, as 14 percent of former IDP or refugee households had reportedly resettled in the region.
The conflict has also effected literacy rates. In southern Sudan, 18 percent of respondents reported being literate versus 43 percent in Darfur and 58 percent in ROS. As the CPA has allowed many children in southern Sudan to return to school, regional differences were not as extreme when current enrollment rates among school age children were examined. Overall, 87 percent of children were currently attending school at the time of the survey, with 83 percent enrolled in southern Sudan and 91 percent enrolled in Northern Sudan.
Households throughout Sudan have traditionally survived on a mixture of agriculture and pastoralism, with sedentary agriculture more common in the Greenbelt region of Southern Sudan and nomadic pastoralism more common in the very arid climate of northern Sudan. In recent years reliance on these traditional livelihood sources has waned somewhat, spurred by rapid urbanization, the growing importance of oil in ROS and by continuing conflict and insecurity in Greater Darfur.
Findings from the SHHS on household livelihoods captured the complexity of the situation. Overall, the SHHS identified 12 livelihood profiles. The majority of households still relied on “agriculture” (24 percent), though “other activities” (15 percent) and “employed work” (14 percent) were the second and third most prevalent livelihood profiles. Other livelihoods included; petty trade (8 percent), unskilled labour (8 percent), agro-pastoralism (7 percent), agriculture, hunting and fishing (5 percent), pastoralists (4 percent), skilled labour (4 percent), handicrafts (4 percent), natural resource collection (4 percent) and food aid (3 percent).
Regional disparities in wealth and development were apparent in the SHHS’s data on household livelihoods. In ROS, “employed work” (typically a better off more urban livelihood) equaled “agriculture” in importance, with 20 percent of households reportedly relying on each livelihood. This contrasts sharply with southern Sudan where over three-quarters of households reported relying on a mixture of agriculture and pastoralism, with only 3-4 percent of household reporting that they had “employed work” (approximately the same percentage that relied exclusively on “food aid”). Livelihoods in Greater Darfur were also heavily agriculture-dependent, with one-third of households relying exclusively on “agriculture”. The impact of the ongoing conflict on traditional livelihoods was noticeable, however. Overall, slightly more than 10 percent of households reported that food aid was their primary source of livelihood, while a similar percentage reported “unskilled labour” – firewood/ grass collection or brick-making - according to recent livelihood assessments in the region. Unskilled labour is commonly found in households that have lost access to traditional farming or pastoralist livelihoods.
Household food security in Sudan
Food security status is determined by the combination of aggregate food availability, household food access and utilization.
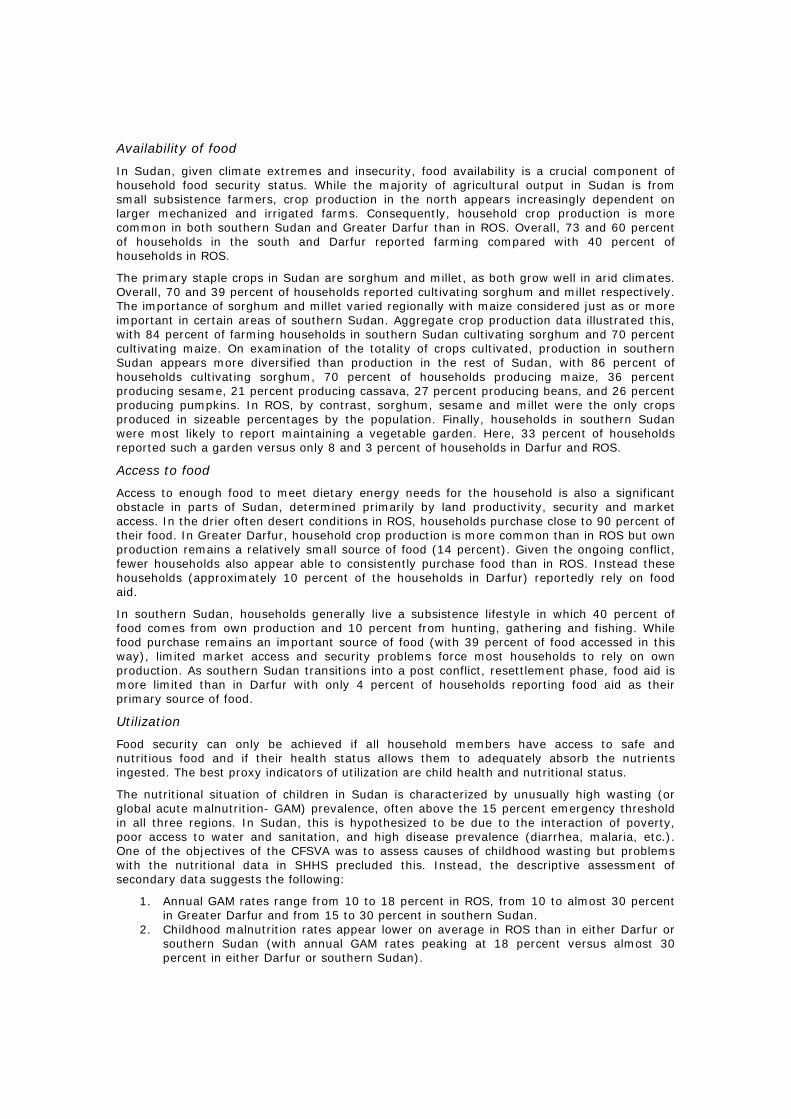
Availability of food
In Sudan, given climate extremes and insecurity, food availability is a crucial component of household food security status. While the majority of agricultural output in Sudan is from small subsistence farmers, crop production in the north appears increasingly dependent on larger mechanized and irrigated farms. Consequently, household crop production is more common in both southern Sudan and Greater Darfur than in ROS. Overall, 73 and 60 percent of households in the south and Darfur reported farming compared with 40 percent of households in ROS.
The primary staple crops in Sudan are sorghum and millet, as both grow well in arid climates. Overall, 70 and 39 percent of households reported cultivating sorghum and millet respectively. The importance of sorghum and millet varied regionally with maize considered just as or more important in certain areas of southern Sudan. Aggregate crop production data illustrated this, with 84 percent of farming households in southern Sudan cultivating sorghum and 70 percent cultivating maize. On examination of the totality of crops cultivated, production in southern Sudan appears more diversified than production in the rest of Sudan, with 86 percent of households cultivating sorghum, 70 percent of households producing maize, 36 percent producing sesame, 21 percent producing cassava, 27 percent producing beans, and 26 percent producing pumpkins. In ROS, by contrast, sorghum, sesame and millet were the only crops produced in sizeable percentages by the population. Finally, households in southern Sudan were most likely to report maintaining a vegetable garden. Here, 33 percent of households reported such a garden versus only 8 and 3 percent of households in Darfur and ROS.
Access to food
Access to enough food to meet dietary energy needs for the household is also a significant obstacle in parts of Sudan, determined primarily by land productivity, security and market access. In the drier often desert conditions in ROS, households purchase close to 90 percent of their food. In Greater Darfur, household crop production is more common than in ROS but own production remains a relatively small source of food (14 percent). Given the ongoing conflict, fewer households also appear able to consistently purchase food than in ROS. Instead these households (approximately 10 percent of the households in Darfur) reportedly rely on food aid.
In southern Sudan, households generally live a subsistence lifestyle in which 40 percent of food comes from own production and 10 percent from hunting, gathering and fishing. While food purchase remains an important source of food (with 39 percent of food accessed in this way), limited market access and security problems force most households to rely on own production. As southern Sudan transitions into a post conflict, resettlement phase, food aid is more limited than in Darfur with only 4 percent of households reporting food aid as their primary source of food.
Utilization
Food security can only be achieved if all household members have access to safe and nutritious food and if their health status allows them to adequately absorb the nutrients ingested. The best proxy indicators of utilization are child health and nutritional status.
The nutritional situation of children in Sudan is characterized by unusually high wasting (or global acute malnutrition- GAM) prevalence, often above the 15 percent emergency threshold in all three regions. In Sudan, this is hypothesized to be due to the interaction of poverty, poor access to water and sanitation, and high disease prevalence (diarrhea, malaria, etc.). One of the objectives of the CFSVA was to assess causes of childhood wasting but problems with the nutritional data in SHHS precluded this. Instead, the descriptive assessment of secondary data suggests the following:
1. Annual GAM rates range from 10 to 18 percent in ROS, from 10 to almost 30 percent in Greater Darfur and from 15 to 30 percent in southern Sudan.
2. Childhood malnutrition rates appear lower on average in ROS than in either Darfur or southern Sudan (with annual GAM rates peaking at 18 percent versus almost 30 percent in either Darfur or southern Sudan).

3. Childhood malnutrition rates in Greater Darfur and southern Sudan peak twice a year, the first at the start of rainy/ hunger season and the second at the end of the hunger season/ peak malarial season.
4. In ROS, childhood malnutrition rates do not appear to peak annually at the end of the hunger period/ peak malarial season (only at the start of the rainy/ hunger period). This is notable as fever appears to be significantly less common in ROS than in southern Sudan, with many more mothers reporting that they take their child to the health centre if they experience fever.
5. In southern Sudan, data seems to suggest that wasting rates consistently between 20 -25 percent on average combined with elevated morbidity rates are associated with high Under 5 mortality rates, while wasting rates consistently between 15-20 percent on average and elevated morbidity rates are not.
Another aim of the CFSVA was to gather information on micronutrient deficiencies. While the SHHS did not gather information on the prevalence of micronutrient deficiencies, it did assess progress in programmes combating micronutrient deficiencies, namely salt iodization and vitamin A supplementation programmes.
Analysis of the iodine content in household salt revealed that very few households have access to properly iodized salt (only 12 percent of households nationwide,) particularly in ROS. This is largely a result of Government failure to enforce the policy of Universal Salt Iodization (USI) adopted in 1994. Households that had access to iodized salt at the time of the survey (primarily households in southern Sudan and Greater Darfur,) were either the likely beneficiaries of cross-border trade activities with countries such as Uganda or Kenya, or they received their salt via food aid. Progress combating vitamin A deficiency appeared uneven with 80 percent of children in ROS reportedly receiving supplements and only 30 percent in southern Sudan.
Prevalence of diarrhea and fever (in the two weeks preceding the survey,) was much more common among children in southern Sudan than in either Darfur or ROS. Cough appeared common in all regions with 41 and 38 percent of children reporting a cough in Darfur and southern Sudan respectively versus only 28 percent of children in ROS.
Food consumption status as a proxy indicator of food security status
Lacking a standard measurement of food security, the CFSVA determined food security status using a measure of both food frequency and dietary diversity known as the food consumption score (FCS). To capture food frequency, the FCS section asked respondents how much of a certain food item (later aggregated to food groups) was consumed in a typical week. The number of times each food group was eaten was multiplied by a weight, developed according to the nutrient density of the food group. Total scores were calculated and food consumption groups were calculated using standard cut offs. Households in the poor and borderline consumption groups were considered food insecure.
Utilizing this methodology, 8.2 percent of households in ROS were determined to be food insecure, compared to 26 percent of households in Darfur and 33 percent of households in Southern Sudan.
Who are the food insecure and where do they live?
To assess vulnerable groups throughout the country, food security assessments were conducted within regions. The most vulnerable geographic and livelihood groups, according to the SHHS, are discussed below.
Rest Of Sudan (ROS)
South Korfofan had the largest percentage of food insecure households (32 percent). Blue Nile, North Kordofan, Red Sea and Kassala, likewise had elevated food insecurity rates, however prevalence was much lower in these states (11-14 percent food insecure). The states with the lowest percent of food insecure were Northern (1 percent), Gezira (1.5 percent) and River Nile (2.6 percent). Northern and River Nile are two of the three states not covered by WFP programmes.
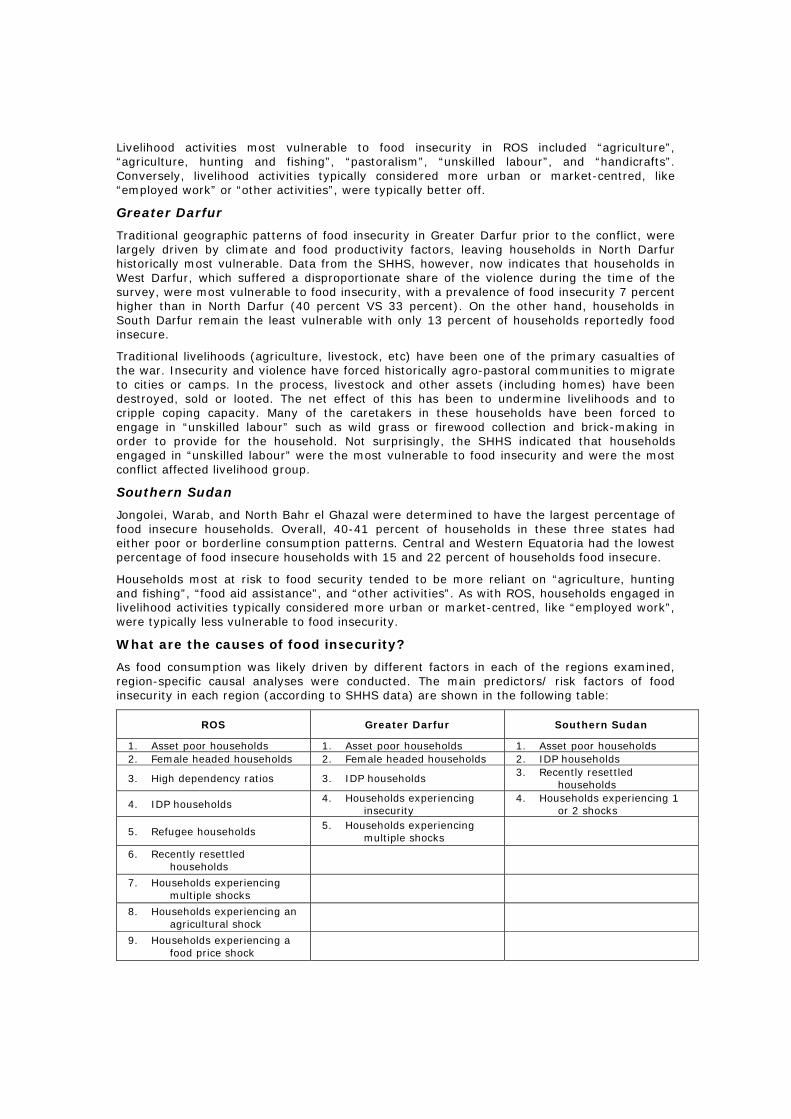
Livelihood activities most vulnerable to food insecurity in ROS included “agriculture”, “agriculture, hunting and fishing”, “pastoralism”, “unskilled labour”, and “handicrafts”. Conversely, livelihood activities typically considered more urban or market-centred, like “employed work” or “other activities”, were typically better off.
Greater Darfur
Traditional geographic patterns of food insecurity in Greater Darfur prior to the conflict, were largely driven by climate and food productivity factors, leaving households in North Darfur historically most vulnerable. Data from the SHHS, however, now indicates that households in West Darfur, which suffered a disproportionate share of the violence during the time of the survey, were most vulnerable to food insecurity, with a prevalence of food insecurity 7 percent higher than in North Darfur (40 percent VS 33 percent). On the other hand, households in South Darfur remain the least vulnerable with only 13 percent of households reportedly food insecure.
Traditional livelihoods (agriculture, livestock, etc) have been one of the primary casualties of the war. Insecurity and violence have forced historically agro-pastoral communities to migrate to cities or camps. In the process, livestock and other assets (including homes) have been destroyed, sold or looted. The net effect of this has been to undermine livelihoods and to cripple coping capacity. Many of the caretakers in these households have been forced to engage in “unskilled labour” such as wild grass or firewood collection and brick-making in order to provide for the household. Not surprisingly, the SHHS indicated that households engaged in “unskilled labour” were the most vulnerable to food insecurity and were the most conflict affected livelihood group.
Southern Sudan
Jongolei, Warab, and North Bahr el Ghazal were determined to have the largest percentage of food insecure households. Overall, 40-41 percent of households in these three states had either poor or borderline consumption patterns. Central and Western Equatoria had the lowest percentage of food insecure households with 15 and 22 percent of households food insecure.
Households most at risk to food security tended to be more reliant on “agriculture, hunting and fishing”, “food aid assistance”, and “other activities”. As with ROS, households engaged in livelihood activities typically considered more urban or market-centred, like “employed work”, were typically less vulnerable to food insecurity.
What are the causes of food insecurity?
As food consumption was likely driven by different factors in each of the regions examined, region-specific causal analyses were conducted. The main predictors/ risk factors of food insecurity in each region (according to SHHS data) are shown in the following table:
ROS Greater Darfur Southern Sudan
1. Asset poor households 1. Asset poor households 1. Asset poor households 2. Female headed households 2. Female headed households 2. IDP households
3. High dependency ratios 3. IDP households 3. Recently resettled households
4. IDP households 4. Households experiencing insecurity
4. Households experiencing 1 or 2 shocks
5. Refugee households 5. Households experiencing
multiple shocks
6. Recently resettled households
7. Households experiencing multiple shocks
8. Households experiencing an agricultural shock
9. Households experiencing a food price shock
Implications for programming
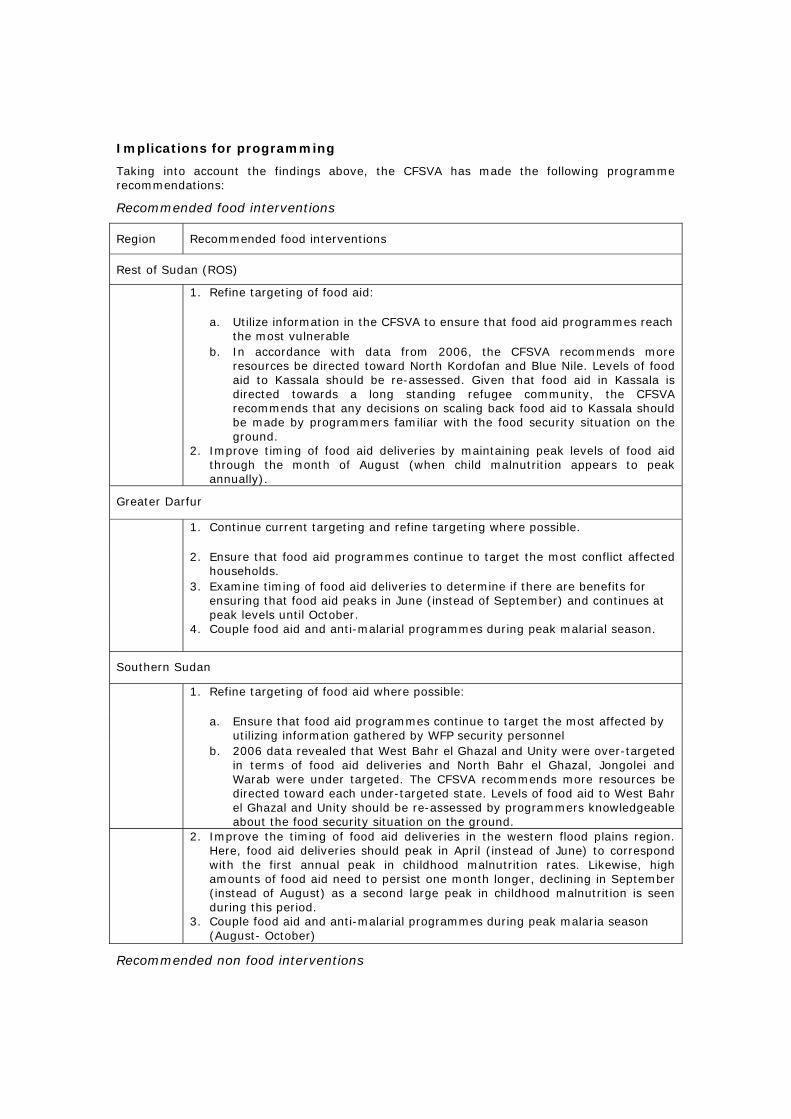
Taking into account the findings above, the CFSVA has made the following programme recommendations:
Recommended food interventions
Region Recommended food interventions
Rest of Sudan (ROS)
1. Refine targeting of food aid:
a. Utilize information in the CFSVA to ensure that food aid programmes reach
the most vulnerable
b. In accordance with data from 2006, the CFSVA recommends more
resources be directed toward North Kordofan and Blue Nile. Levels of food aid to Kassala should be re-assessed. Given that food aid in Kassala is directed towards a long standing refugee community, the CFSVA recommends that any decisions on scaling back food aid to Kassala should be made by programmers familiar with the food security situation on the ground.
2. Improve timing of food aid deliveries by maintaining peak levels of food aid
through the month of August (when child malnutrition appears to peak annually).
Greater Darfur
1. Continue current targeting and refine targeting where possible.
2. Ensure that food aid programmes continue to target the most conflict affected
households.
3. Examine timing of food aid deliveries to determine if there are benefits for
ensuring that food aid peaks in June (instead of September) and continues at peak levels until October.
4. Couple food aid and anti-malarial programmes during peak malarial season.
Southern Sudan
1. Refine targeting of food aid where possible:
a. Ensure that food aid programmes continue to target the most affected by
utilizing information gathered by WFP security personnel
b. 2006 data revealed that West Bahr el Ghazal and Unity were over-targeted
in terms of food aid deliveries and North Bahr el Ghazal, Jongolei and Warab were under targeted. The CFSVA recommends more resources be directed toward each under-targeted state. Levels of food aid to West Bahr el Ghazal and Unity should be re-assessed by programmers knowledgeable about the food security situation on the ground.
2. Improve the timing of food aid deliveries in the western flood plains region.
Here, food aid deliveries should peak in April (instead of June) to correspond with the first annual peak in childhood malnutrition rates. Likewise, high amounts of food aid need to persist one month longer, declining in September (instead of August) as a second large peak in childhood malnutrition is seen during this period.
3. Couple food aid and anti-malarial programmes during peak malaria season
(August- October)
Recommended non food interventions
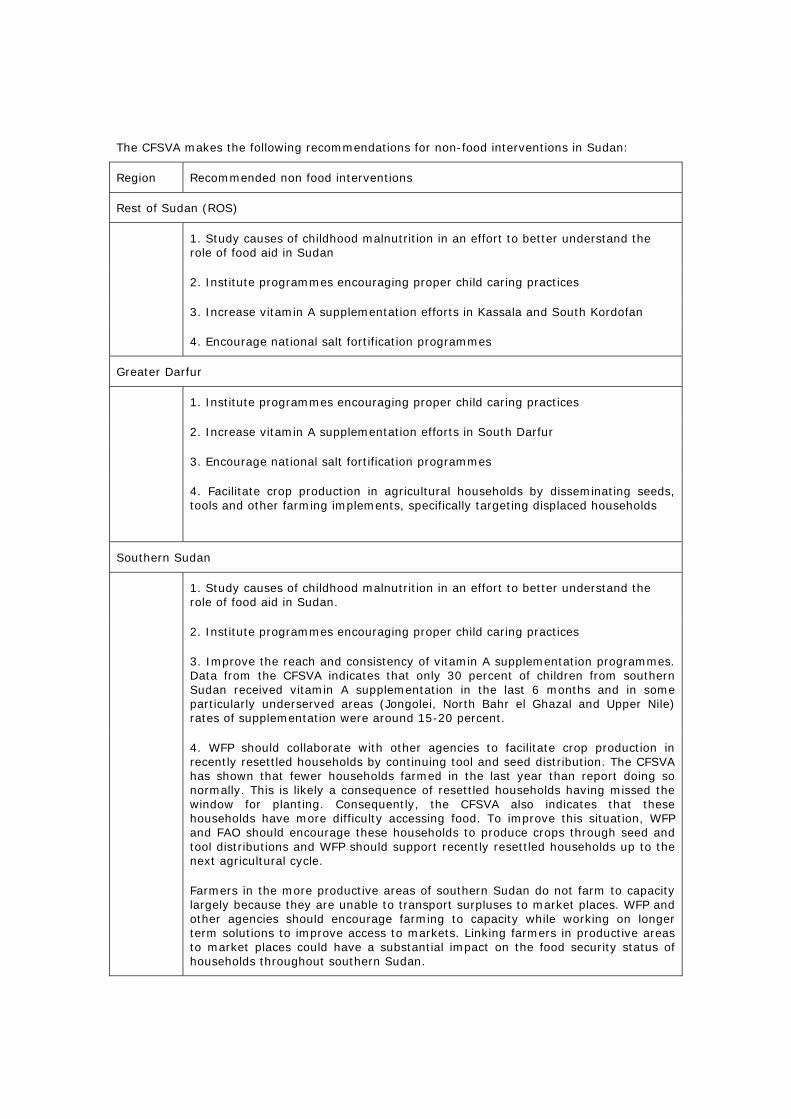
The CFSVA makes the following recommendations for non-food interventions in Sudan:
Region Recommended non food interventions
Rest of Sudan (ROS)
1. Study causes of childhood malnutrition in an effort to better understand the role of food aid in Sudan
2. Institute programmes encouraging proper child caring practices
3. Increase vitamin A supplementation efforts in Kassala and South Kordofan
4. Encourage national salt fortification programmes
Greater Darfur
1. Institute programmes encouraging proper child caring practices
2. Increase vitamin A supplementation efforts in South Darfur
3. Encourage national salt fortification programmes
4. Facilitate crop production in agricultural households by disseminating seeds, tools and other farming implements, specifically targeting displaced households
Southern Sudan
1. Study causes of childhood malnutrition in an effort to better understand the role of food aid in Sudan.
2. Institute programmes encouraging proper child caring practices
3. Improve the reach and consistency of vitamin A supplementation programmes. Data from the CFSVA indicates that only 30 percent of children from southern Sudan received vitamin A supplementation in the last 6 months and in some particularly underserved areas (Jongolei, North Bahr el Ghazal and Upper Nile) rates of supplementation were around 15-20 percent.
4. WFP should collaborate with other agencies to facilitate crop production in recently resettled households by continuing tool and seed distribution. The CFSVA has shown that fewer households farmed in the last year than report doing so normally. This is likely a consequence of resettled households having missed the window for planting. Consequently, the CFSVA also indicates that these households have more difficulty accessing food. To improve this situation, WFP and FAO should encourage these households to produce crops through seed and tool distributions and WFP should support recently resettled households up to the next agricultural cycle.
Farmers in the more productive areas of southern Sudan do not farm to capacity largely because they are unable to transport surpluses to market places. WFP and other agencies should encourage farming to capacity while working on longer term solutions to improve access to markets. Linking farmers in productive areas to market places could have a substantial impact on the food security status of households throughout southern Sudan.
1
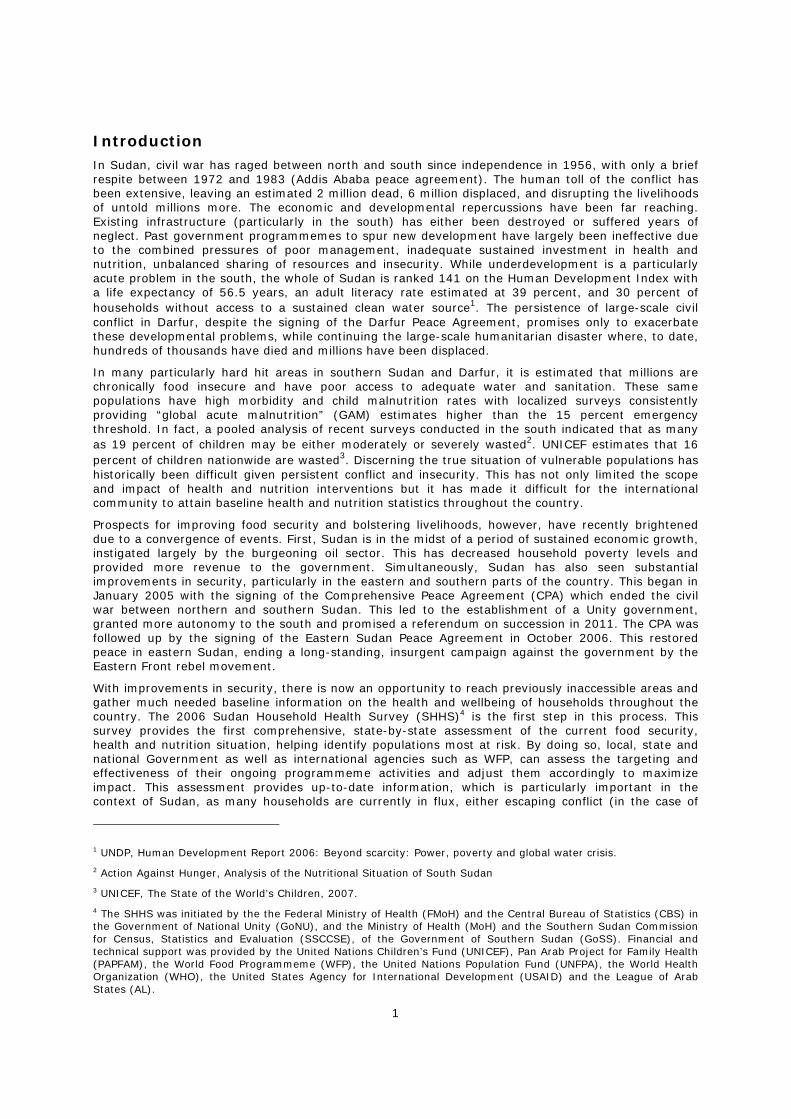
Introduction In Sudan, civil war has raged between north and south since independence in 1956, with only a brief respite between 1972 and 1983 (Addis Ababa peace agreement). The human toll of the conflict has been extensive, leaving an estimated 2 million dead, 6 million displaced, and disrupting the livelihoods of untold millions more. The economic and developmental repercussions have been far reaching. Existing infrastructure (particularly in the south) has either been destroyed or suffered years of neglect. Past government programmemes to spur new development have largely been ineffective due to the combined pressures of poor management, inadequate sustained investment in health and nutrition, unbalanced sharing of resources and insecurity. While underdevelopment is a particularly acute problem in the south, the whole of Sudan is ranked 141 on the Human Development Index with a life expectancy of 56.5 years, an adult literacy rate estimated at 39 percent, and 30 percent of households without access to a sustained clean water source1. The persistence of large-scale civil conflict in Darfur, despite the signing of the Darfur Peace Agreement, promises only to exacerbate these developmental problems, while continuing the large-scale humanitarian disaster where, to date, hundreds of thousands have died and millions have been displaced.
In many particularly hard hit areas in southern Sudan and Darfur, it is estimated that millions are chronically food insecure and have poor access to adequate water and sanitation. These same populations have high morbidity and child malnutrition rates with localized surveys consistently providing “global acute malnutrition” (GAM) estimates higher than the 15 percent emergency threshold. In fact, a pooled analysis of recent surveys conducted in the south indicated that as many as 19 percent of children may be either moderately or severely wasted2. UNICEF estimates that 16 percent of children nationwide are wasted3. Discerning the true situation of vulnerable populations has historically been difficult given persistent conflict and insecurity. This has not only limited the scope and impact of health and nutrition interventions but it has made it difficult for the international community to attain baseline health and nutrition statistics throughout the country.
Prospects for improving food security and bolstering livelihoods, however, have recently brightened due to a convergence of events. First, Sudan is in the midst of a period of sustained economic growth, instigated largely by the burgeoning oil sector. This has decreased household poverty levels and provided more revenue to the government. Simultaneously, Sudan has also seen substantial improvements in security, particularly in the eastern and southern parts of the country. This began in January 2005 with the signing of the Comprehensive Peace Agreement (CPA) which ended the civil war between northern and southern Sudan. This led to the establishment of a Unity government, granted more autonomy to the south and promised a referendum on succession in 2011. The CPA was followed up by the signing of the Eastern Sudan Peace Agreement in October 2006. This restored peace in eastern Sudan, ending a long-standing, insurgent campaign against the government by the Eastern Front rebel movement.
With improvements in security, there is now an opportunity to reach previously inaccessible areas and gather much needed baseline information on the health and wellbeing of households throughout the country. The 2006 Sudan Household Health Survey (SHHS)4 is the first step in this process. This survey provides the first comprehensive, state-by-state assessment of the current food security, health and nutrition situation, helping identify populations most at risk. By doing so, local, state and national Government as well as international agencies such as WFP, can assess the targeting and effectiveness of their ongoing programmeme activities and adjust them accordingly to maximize impact. This assessment provides up-to-date information, which is particularly important in the context of Sudan, as many households are currently in flux, either escaping conflict (in the case of
1 UNDP, Human Development Report 2006: Beyond scarcity: Power, poverty and global water crisis.
2 Action Against Hunger, Analysis of the Nutritional Situation of South Sudan
3 UNICEF, The State of the World’s Children, 2007.
4 The SHHS was initiated by the the Federal Ministry of Health (FMoH) and the Central Bureau of Statistics (CBS) in the Government of National Unity (GoNU), and the Ministry of Health (MoH) and the Southern Sudan Commission for Census, Statistics and Evaluation (SSCCSE), of the Government of Southern Sudan (GoSS). Financial and technical support was provided by the United Nations Children’s Fund (UNICEF), Pan Arab Project for Family Health (PAPFAM), the World Food Programmeme (WFP), the United Nations Population Fund (UNFPA), the World Health Organization (WHO), the United States Agency for International Development (USAID) and the League of Arab States (AL).
2
Darfur) or returning from conflict-related displacement (in the case of the southern and eastern Sudan).
Using data gathered under the SHHS, WFP has produced a Comprehensive Food Security and Vulnerability Analysis (CFSVA) with the objective of measuring the extent, depth and causes of food insecurity. The CFSVA is intended to inform relevant decision-making processes to mitigate food crises and increase food security. It relies heavily on the findings of the SHHS and draws on other relevant assessments and studies. The delay in publication of this report is principally due to difficulties during the data cleaning process, which was largely completed in early 2007 (though cleaning on the child level dataset has only recently been completed). Due to this issue, WFP was not officially granted access to the data until February 2007. Since that time, data cleaning, analysis and report writing have been ongoing.
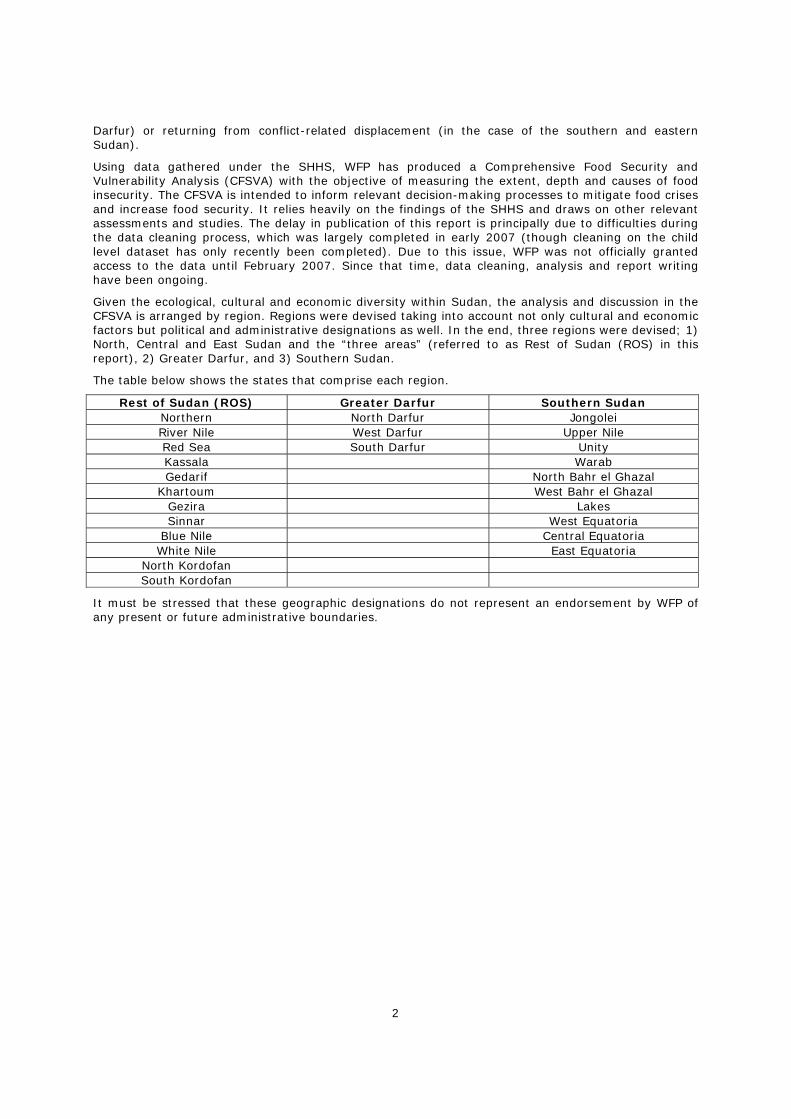
Given the ecological, cultural and economic diversity within Sudan, the analysis and discussion in the CFSVA is arranged by region. Regions were devised taking into account not only cultural and economic factors but political and administrative designations as well. In the end, three regions were devised; 1) North, Central and East Sudan and the “three areas” (referred to as Rest of Sudan (ROS) in this report), 2) Greater Darfur, and 3) Southern Sudan.
The table below shows the states that comprise each region.
Rest of Sudan (ROS) Greater Darfur Southern Sudan Northern North Darfur Jongolei River Nile West Darfur Upper Nile Red Sea South Darfur Unity Kassala Warab Gedarif North Bahr el Ghazal
Khartoum West Bahr el Ghazal Gezira Lakes Sinnar West Equatoria
Blue Nile Central Equatoria White Nile East Equatoria
North Kordofan South Kordofan
It must be stressed that these geographic designations do not represent an endorsement by WFP of any present or future administrative boundaries.
3
1. Study objectives and methodology
1.1 Objectives
The Comprehensive Food Security and Vulnerability Analysis (CFSVA) seeks to compile and critically assess available information on household livelihoods, food security and vulnerability in Sudan. The primary objectives of the CFSVA are threefold; 1) to provide an accurate and detailed assessment of the current food security situation within Sudan, 2) to assess the causes and risk factors for food insecurity and childhood malnutrition and potential ways to mitigate both, and 3) to identify particularly vulnerable households (or pockets of vulnerability) where assistance may be required in the future. Specifically, this report will answer 5 main questions:
Who are the “food-insecure” and “vulnerable”?
How many are there?
Where do they live?
Why are they food-insecure?
What interventions might be appropriate to reduce their food insecurity and vulnerability?
The answers to these questions are intended to assist WFP programme staff throughout Sudan in their decision-making processes on how to better focus and target activities to maximize impact.
1.2 Definitions, terminology and concepts
1.2.1 Food Security
According to the 1996 World Food Summit:
Food security exists when all people, at all times, have physical, social and economic access to sufficient, safe and nutritious food which meets their dietary needs and food preferences for an active and healthy life [thus food insecurity is the inverse of this].
Thus, food security status is determined by the interaction of a broad range of political, socio-economic, agricultural, and health related factors. While there is no single, direct measure, food security has three distinct, but interrelated dimensions: food availability, household food access, and individual food utilization.
To achieve food security, each dimension must be addressed. Thus, food security exists only when:
Food availability: There is adequate availability of physical supplies of food to the household or at the national level either from domestic production, commercial imports, food aid, and national stocks;
Food access: Household livelihoods ensure adequate access for all members of the household to food supplies through home production, market purchases, or transfers from other sources; and
Food utilization: intra-household use of food accessible and the individuals’ ability to absorb and use nutrients (often a function of health status)
1.2.2 Vulnerability
Vulnerability is another important food security related concept. It can be defined as:
The probability of an acute decline in food access, or consumption, often in reference to some critical value that defines minimum levels of human well being.
This understanding of vulnerability can be summarized as follows:
Vulnerability = exposure to risk + risk management
As this equation illustrates, it is largely a function of:
Exposure to risk: the probability of an event or shock, that if it did materialize, would negatively impact the household (i.e. drought); and
Risk management: the ability to mitigate the consequences of a potential shock. Managing risk can be accomplished through preparedness or coping. Coping as a technique may be negative, affecting
4
the livelihoods or resource base of the household (and consequently affecting the coping capacity of the household in the future). How effectively households are able to manage risks also depends on the frequency and severity of the shock itself and on underlying social, political or socio-economic conditions.
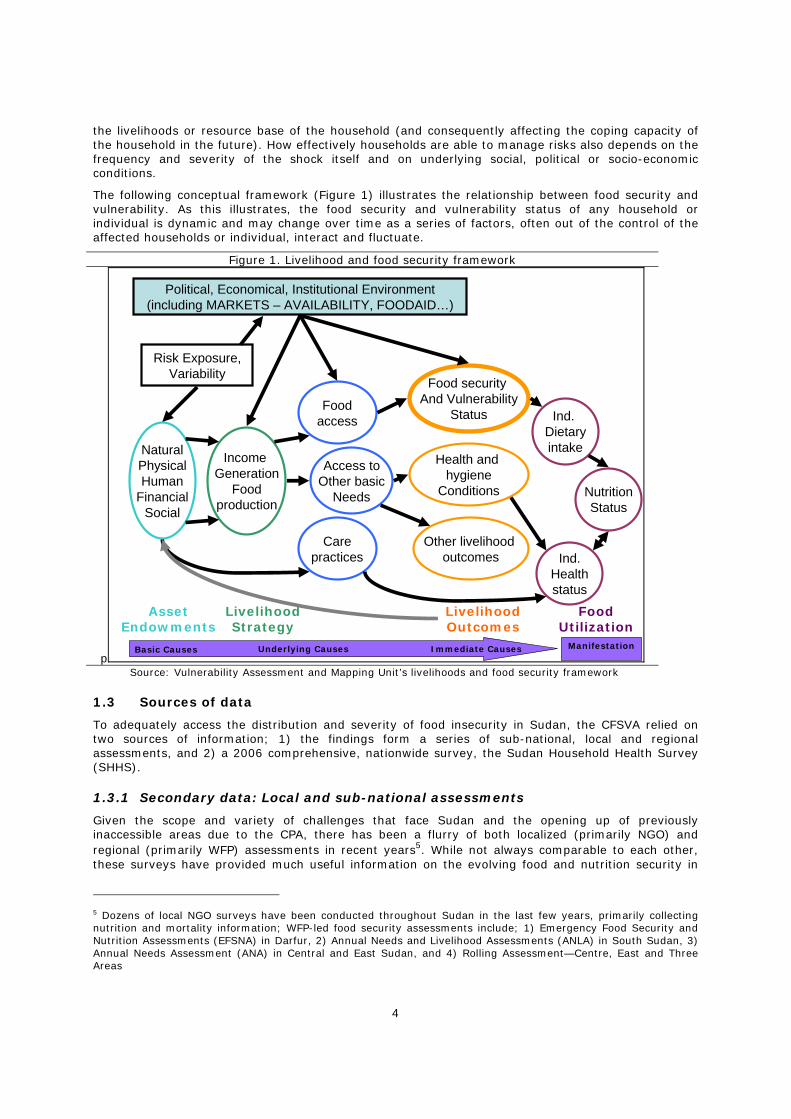
The following conceptual framework (Figure 1) illustrates the relationship between food security and vulnerability. As this illustrates, the food security and vulnerability status of any household or individual is dynamic and may change over time as a series of factors, often out of the control of the affected households or individual, interact and fluctuate.
Figure 1. Livelihood and food security framework
p
NaturalPhysicalHuman
FinancialSocial
Income Generation
Foodproduction
Foodaccess
Access toOther basic
Needs
Carepractices
Food security And Vulnerability
Status
Health and hygiene
Conditions
Other livelihood outcomes
Ind. Dietaryintake
Ind.Healthstatus
NutritionStatus
Political, Economical, Institutional Environment(including MARKETS – AVAILABILITY, FOODAID…)
Risk Exposure,Variability
Asset Endowments
Livelihood Strategy
LivelihoodOutcomes
Food Utilization
ManifestationImmediate CausesUnderlying CausesBasic Causes
Source: Vulnerability Assessment and Mapping Unit’s livelihoods and food security framework
1.3 Sources of data
To adequately access the distribution and severity of food insecurity in Sudan, the CFSVA relied on two sources of information; 1) the findings form a series of sub-national, local and regional assessments, and 2) a 2006 comprehensive, nationwide survey, the Sudan Household Health Survey (SHHS).
1.3.1 Secondary data: Local and sub-national assessments
Given the scope and variety of challenges that face Sudan and the opening up of previously inaccessible areas due to the CPA, there has been a flurry of both localized (primarily NGO) and regional (primarily WFP) assessments in recent years5. While not always comparable to each other, these surveys have provided much useful information on the evolving food and nutrition security in
5 Dozens of local NGO surveys have been conducted throughout Sudan in the last few years, primarily collecting nutrition and mortality information; WFP-led food security assessments include; 1) Emergency Food Security and Nutrition Assessments (EFSNA) in Darfur, 2) Annual Needs and Livelihood Assessments (ANLA) in South Sudan, 3) Annual Needs Assessment (ANA) in Central and East Sudan, and 4) Rolling Assessment—Centre, East and Three Areas
5
Sudan. The overall findings from these assessments will be discussed when appropriate throughout this report.
1.3.2 Primary data collection
The bulk of this report will focus on the results of the SHHS, the first nationwide survey in 2 decades. This survey was intended to comprehensively assess the health and nutrition of women and children throughout Sudan. The specific objectives of the survey, as laid out in the Sudan Household Health Survey Draft report, were:
• To provide up-to-date information for assessing the situation of women and children in Sudan
• To furnish data needed for monitoring progress toward goals established by the Millennium Development Goals, the goals of A World Fit For Children, Programme of Action adopted at the International Conference on Population and Development (ICPD), and other internationally agreed upon goals, as a basis for action;
• To contribute to the improvement of data and monitoring systems in Sudan and to strengthen technical expertise in the design, implementation, and analysis of such systems.
• To strengthen and build the institutional capacity of government partners for the upcoming 2007 Census and large scale surveys.
This survey was collaborative effort between both the Government of National Unity (GoNU) and the Government of South Sudan (GoSS). It was implemented by the GoNU’s Federal Ministry of Health (FMOH), the Ministry of Health (MoH in South Sudan) and the Southern Sudan Commission for the Census, Statistics, and Evaluation (SSCCSE). Technical and financial support were provided by the United Nations Children’s Fund (UNICEF), Pan Arab Project for Family Health (PAPFAM), the World Food Programme (WFP), the United Nations Population Fund (UNFPA), the World Health Organization (WHO), the United States Agency for International Development (USAID) and the League of Arab States (AL).
1.4 Survey instruments
Five separate questionnaires were administered to sampled households. These included;
1. Household questionnaire (a basic listing of all household members, basic households characteristics, etc.)
2. Food security questionnaire (questions on livelihoods, expenditure, agricultural production and food consumption, etc.)
3. Women’s questionnaire (administered to all women aged 15-49 years of age).
4. Under-5 questionnaire (administered to the mothers/ caretakers of all children under 5 years of age).
5. Community questionnaire (administered to leading figures and key informants in each locality).
The Household, Women, and Under-5 questionnaires were modeled on the MICS3 and PAPFAM questionnaires. Questionnaires were pilot tested in November of 2005. Pilot testing of the questionnaires for states in the north and Darfur occurred in Althawra, Umbadda Hamad Elneel, and Alsaroarab. Pilot testing in the south occurred in Rumbek (including Rumbek County and Rumbek East) and Baar Pakeing.
The results of the pilot survey led to small revisions of the questionnaire format. The final version of each questionnaire was printed in January 2006. The food consumption module of the “Household questionnaire” distributed in the northern states differed slightly from the module distributed in the southern states. In the north, the number of times “sorghum” and “millet” were consumed was asked as two questions, while in the south both of these foods were included in only one question. Likewise, the number of times “dates” were consumed was included as another question in the north, but excluded in the south. Consequently, the food consumption module had 16 questions in the north and only 14 questions in the south.
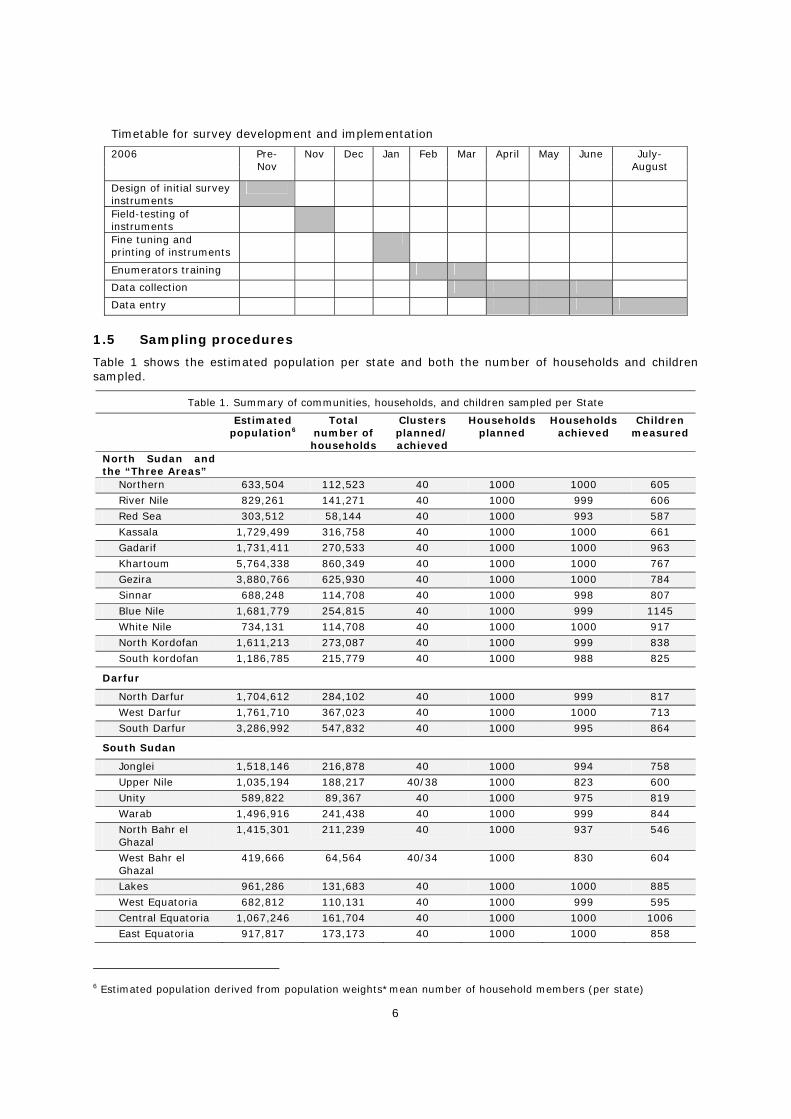
6
Timetable for survey development and implementation
2006 Pre- Nov
Nov Dec Jan Feb Mar April May June July-August
Design of initial survey instruments
Field-testing of instruments
Fine tuning and printing of instruments
Enumerators training
Data collection
Data entry
1.5 Sampling procedures
Table 1 shows the estimated population per state and both the number of households and children sampled.
Table 1. Summary of communities, households, and children sampled per State
Estimated population6
Total number of households
Clusters planned/ achieved
Households planned
Households achieved
Children measured
North Sudan and the “Three Areas”
Northern 633,504 112,523 40 1000 1000 605
River Nile 829,261 141,271 40 1000 999 606
Red Sea 303,512 58,144 40 1000 993 587
Kassala 1,729,499 316,758 40 1000 1000 661
Gadarif 1,731,411 270,533 40 1000 1000 963
Khartoum 5,764,338 860,349 40 1000 1000 767
Gezira 3,880,766 625,930 40 1000 1000 784
Sinnar 688,248 114,708 40 1000 998 807
Blue Nile 1,681,779 254,815 40 1000 999 1145
White Nile 734,131 114,708 40 1000 1000 917
North Kordofan 1,611,213 273,087 40 1000 999 838
South kordofan 1,186,785 215,779 40 1000 988 825
Darfur
North Darfur 1,704,612 284,102 40 1000 999 817
West Darfur 1,761,710 367,023 40 1000 1000 713
South Darfur 3,286,992 547,832 40 1000 995 864
South Sudan
Jonglei 1,518,146 216,878 40 1000 994 758
Upper Nile 1,035,194 188,217 40/38 1000 823 600
Unity 589,822 89,367 40 1000 975 819
Warab 1,496,916 241,438 40 1000 999 844
North Bahr el Ghazal
1,415,301 211,239 40 1000 937 546
West Bahr el Ghazal
419,666 64,564 40/34 1000 830 604
Lakes 961,286 131,683 40 1000 1000 885
West Equatoria 682,812 110,131 40 1000 999 595
Central Equatoria 1,067,246 161,704 40 1000 1000 1006
East Equatoria 917,817 173,173 40 1000 1000 858
6 Estimated population derived from population weights*mean number of household members (per state)
7
The sample of the SHHS was designed to provide national and state level estimates of key indicators of household food insecurity and vulnerability as well as maternal and child health. Overall, Sudan is divided into 26 states. The sampling frame for the states in the north was derived from the most recent census, completed in 1993. This census, however, was not an effective sampling frame for the south as its coverage (given the ongoing war at the time) was limited to the garrison towns of Juba, Malakal, Wau, and certain other selected areas. Consequently, the population estimates of the census were replaced by the list of villages and estimated population derived by the World Health Organization (WHO) and United Nations Children Fund (UNICEF) for their recent National Immunization Days (NIDs) campaign. This source replaced Census estimates for Darfur as well. Populations living in institutions, hospitals, military bases and prisons were excluded from the sampling frame.
To get state level estimates, a stratified, equal allocation, multi-stage sampling design was utilized. The sampling frame was first stratified by major geographic and administrative areas (states) and then by urban and rural areas within states. Urban areas were defined as towns with a population of more than 50,000 people. Stratifying by urban and rural areas was not possible in the Darfurs and in the South. States were then divided into counties, localities and finally clusters, or primary sampling units (PSU’s). Clusters were ordered by locality and systematically selected using Probability Proportional to Size (PPS) sampling techniques. In total, given the constraints associated with resources, logistics, transportation and communication, 40 PSUs were selected per state and 25 households per PSU. Altogether, approximately 1000 households were surveyed in each state with 24,527 sampled nationwide. The unit of analysis was intended to be households or household members.
1.5 Enumerator training and data collection
Training of enumerators and data collection teams was conducted in February and March 2006. Training generally lasted 7-10 days and included a detailed discussion of the questionnaires and specific guidance on interviewing techniques and onsite maintenance of data quality. Practical components of the training included mock interviews between trainees and 3 days of field practice in selected states.
Fieldwork for all states was conducted between March and June. On average, data collection took 31 days per state, with slight variations depending on accessibility or insecurity. Data collection was conducted by 112 teams, with 4-6 teams per state in the south and 4 teams per state elsewhere. Most teams were comprised of 4 enumerators, one driver, one editor/ measurer, and one supervisor. In the south, one-third of the teams did not utilize drivers due to lack of vehicles or fear of landmines. In the course of the interviews, survey team members were not only asked to administer the questionnaires but they were also asked to test the iodine content of the salt used for cooking and measure the weight and height of children under 5 years of age. Throughout this process, 850 interviewers, 110 team leaders and supervisors and 40 national supervisors and leaders were involved in the data collection process.
1.6 Data entry and statistical analysis
Data was entered using CSPro software. Data gathered in ROS and Greater Darfur was entered in Khartoum while data from southern Sudan was entered in Rumbek. In Khartoum, the data entry team consisted of 40 operators, 6 data entry supervisors, 10 data editors and 6 programmers. In Rumbek, the team consisted of 26 operators, 4 data entry supervisors, 7 data editors, and 2 programmers. For quality control purposes, questionnaires from the first 6 states (to be entered) were double entered. Then, 5 randomly selected clusters from the remaining 19 states were double entered. Other internal consistency checks were included as well. Data entry and editing began simultaneously with data collection and the entire process was complete by early August 2006.
For the CFSVA, data cleaning and analysis began in March 2007. Data was analyzed using the Statistical Package for Social Sciences (SPSS) software programme (Version 11.5), STATA 9.2, and ADATTI version 6.
Given that the survey data was not self weighting, households, women and children were each weighted according to probabilities of selection. More information on the specifics of the weighting procedures can be found in the GoNU’s Sudan Household Health Report (forthcoming).
8
1.7 Survey limitations
This survey faced a number of obstacles and limitations. First, given that many areas in Sudan are just emerging from civil war, there is little reliable population data in much of the south. As a result, the sampling frame in southern Sudan was estimated from a comprehensive child listing, conducted at the time of 2005 UNICEF/ WHO vaccination drive. Given this situation, it is likely that certain areas were either over or under sampled. This potential bias is worsened by the fluidity of the population at the time. Internally displaced persons (IDP’s) are being resettled throughout in former areas of conflict, which has resulted in rapid population growth. Since the resettlement process is ongoing, the sampling frame likely underestimates the population in these areas (and particularly the returning IDP population—a potentially vulnerable group). This would bias estimates, leaving IDP’s inadequately represented and likely under-estimating vulnerability in areas with ongoing resettlement.
Secondly, this survey was undoubtedly affected by enumerators not being to gain physical access to certain places. Access problems were attributed to 4 main factors; 1) crippled or non existent infrastructure, 2) difficulty getting transportation, 3) landmines and 4) ongoing conflict/ insecurity (particularly in Darfur). People residing in remote or conflict affected areas (another potentially vulnerable group) were therefore less likely to be selected and interviewed than households in accessible areas. This again would underestimate vulnerability in these areas.
A major limitation, given that the SHHS is the first nationally representative survey in two decades, is the general lack of capacity (in terms of survey development and administration techniques). Difficulties with survey administration were particularly evident in several southern states (Jonglei, North, and West Bahr el Ghazal), where, in a significant percentage of cases, certain questionnaire modules were either not answered/ not enumerated/ or not entered correctly. This problem was most evident in the food consumption and child anthropometry modules of the questionnaires.
9
2. Political, Economical, Institutional Environment in Sudan
2.1 Political context
Sudan has been plagued by decades of civil war, which has left many areas of the country with little infrastructure, fragmented civil society, and a poverty-stricken population. The first signs of hope came in 2005, when the CPA was signed. The peace treaty declared the formation of a unity government, which would rule for a period of six years, until 2011, after which a referendum will be held to determine whether southern Sudan will remain an autonomous part of Sudan or become an independent sovereign state. In 2006, another peace agreement was signed between the government and rebel groups in the Eastern state of Kassala. This agreement brought peace to this long troubled region. Unfortunately, despite the signing of the DPA in 2006, the conflict in Darfur remains unresolved and is a continuing humanitarian crisis.
2.2 Economic context
2.2.1 Macro-economic situation and trends
The 1990s were characterized by economic reforms, which reduced the role of the State, removed price and market controls, and introduced incentives for production. Inflation dropped significantly from 130 percent in 1996 to 4.9 percent in 20017. GDP growth steadily increased in the last decade averaging growth of 6.2 percent8. While agriculture continues to be the most important sector (followed by the service and manufacturing sectors), the oil and gas sector of the economy has grown rapidly. By 2005, oil exports accounted for 85 percent of all exports9. Throughout this time, the Sudanese Dinar has strengthened against the US dollar, in part because of the ongoing oil boom. While economic gains have been made, Sudan faces a looming external debt, which, in 2006, was estimated at US$28 billion10. The impact this will have on the economy will very much depend on whether the country is granted debt relief.
2.2.2 The agricultural sector
Despite the recent boom in the oil and gas sector, agriculture remains the most important sector of Sudan’s economy. In 2005, it represented 39 percent of GDP11. Agriculture continues to be the main source of livelihoods in rural areas, with production from traditional rain-fed framing primarily focused on cereals like sorghum and millet and pulses such as groundnuts and sesame. The irrigated agricultural schemes, prevalent the parts of the northern and eastern states, are responsible for most of Sudan’s cotton production, which has historically been an important export. Increasingly, livestock and meat exports have become one of the most important components of the agriculture sector. In recent years, Government incentives have bolstered the commercial livestock industry, particularly ownership and trade of camels, sheep, cattle, and goats. A high proportion of livestock and meat production is for export, mainly to Saudi Arabia, making it the second largest export earner after crude oil.
2.3 Aggregate availability and markets
2.3.1 Food markets
2.3.1.1 Aggregate availability of staple cereals
At the aggregate level, Sudan is capable of importing enough cereal to meet its requirements, due to the large inflows of foreign exchange from petroleum exports. Table 2 presents the aggregate cereal balance sheet from the FAO/WFP Crop and Food Supply Assessment Mission for the 2006/7 season.
7 FAO/WFP. Special Report: FAO/WFP Crop and Food Supply Assessment Mission to Sudan. February 2004.
8 The World Bank. African Development Indicators: 2006. Washington DC. 2006.
9 FAO/WFP. Special Report: FAO/WFP Crop and Food Supply Assessment Mission to Sudan. February 2006.
10 Central Bank of Sudan estimate
11 WFP, 2006/2007 Annal Needs and Livelihoods Assessment for the Centre, East and “Three Areas”.
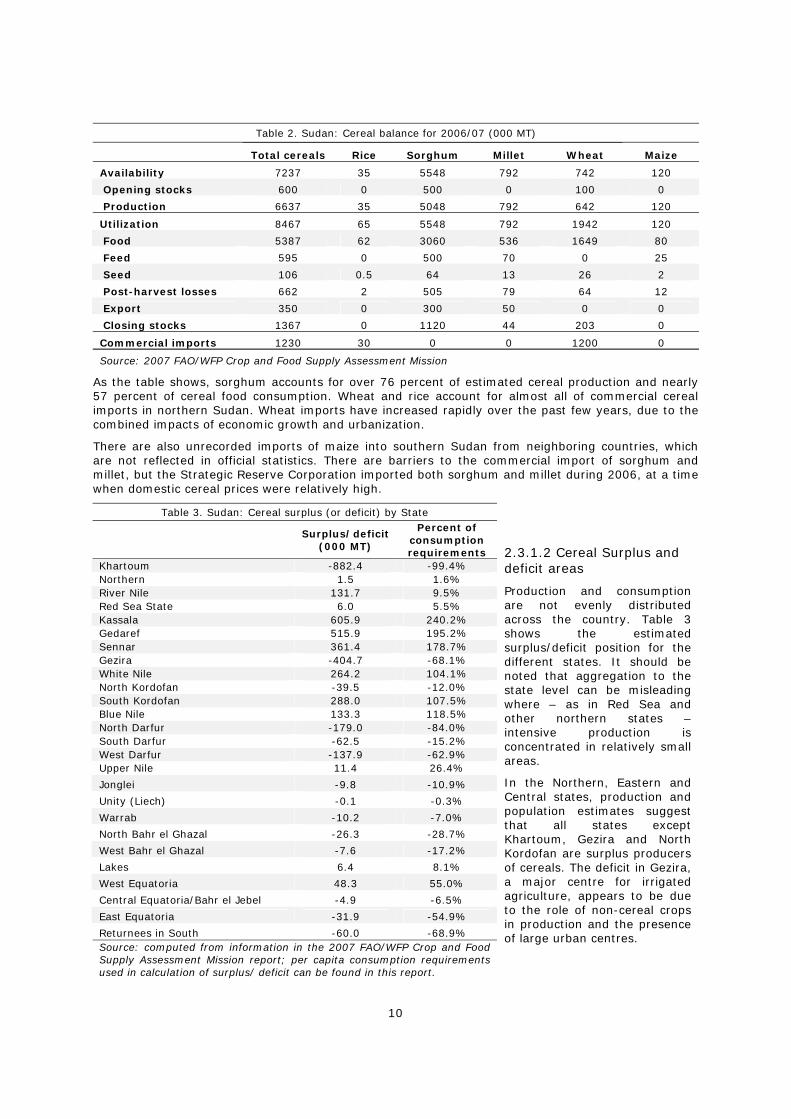
10
Table 2. Sudan: Cereal balance for 2006/07 (000 MT)
Total cereals Rice Sorghum Millet Wheat Maize
Availability 7237 35 5548 792 742 120
Opening stocks 600 0 500 0 100 0
Production 6637 35 5048 792 642 120
Utilization 8467 65 5548 792 1942 120
Food 5387 62 3060 536 1649 80
Feed 595 0 500 70 0 25
Seed 106 0.5 64 13 26 2
Post-harvest losses 662 2 505 79 64 12
Export 350 0 300 50 0 0
Closing stocks 1367 0 1120 44 203 0
Commercial imports 1230 30 0 0 1200 0
Source: 2007 FAO/WFP Crop and Food Supply Assessment Mission
As the table shows, sorghum accounts for over 76 percent of estimated cereal production and nearly 57 percent of cereal food consumption. Wheat and rice account for almost all of commercial cereal imports in northern Sudan. Wheat imports have increased rapidly over the past few years, due to the combined impacts of economic growth and urbanization.
There are also unrecorded imports of maize into southern Sudan from neighboring countries, which are not reflected in official statistics. There are barriers to the commercial import of sorghum and millet, but the Strategic Reserve Corporation imported both sorghum and millet during 2006, at a time when domestic cereal prices were relatively high.
Table 3. Sudan: Cereal surplus (or deficit) by State
Surplus/deficit
(000 MT)
Percent of consumption requirements
Khartoum -882.4 -99.4% Northern 1.5 1.6% River Nile 131.7 9.5% Red Sea State 6.0 5.5% Kassala 605.9 240.2% Gedaref 515.9 195.2% Sennar 361.4 178.7% Gezira -404.7 -68.1% White Nile 264.2 104.1% North Kordofan -39.5 -12.0% South Kordofan 288.0 107.5% Blue Nile 133.3 118.5% North Darfur -179.0 -84.0% South Darfur -62.5 -15.2% West Darfur -137.9 -62.9% Upper Nile 11.4 26.4%
Jonglei -9.8 -10.9%
Unity (Liech) -0.1 -0.3%
Warrab -10.2 -7.0%
North Bahr el Ghazal -26.3 -28.7%
West Bahr el Ghazal -7.6 -17.2%
Lakes 6.4 8.1%
West Equatoria 48.3 55.0%
Central Equatoria/Bahr el Jebel -4.9 -6.5%
East Equatoria -31.9 -54.9%
Returnees in South -60.0 -68.9% Source: computed from information in the 2007 FAO/WFP Crop and Food Supply Assessment Mission report; per capita consumption requirements used in calculation of surplus/ deficit can be found in this report.
2.3.1.2 Cereal Surplus and deficit areas
Production and consumption are not evenly distributed across the country. Table 3 shows the estimated surplus/deficit position for the different states. It should be noted that aggregation to the state level can be misleading where – as in Red Sea and other northern states – intensive production is concentrated in relatively small areas.
In the Northern, Eastern and Central states, production and population estimates suggest that all states except Khartoum, Gezira and North Kordofan are surplus producers of cereals. The deficit in Gezira, a major centre for irrigated agriculture, appears to be due to the role of non-cereal crops in production and the presence of large urban centres.
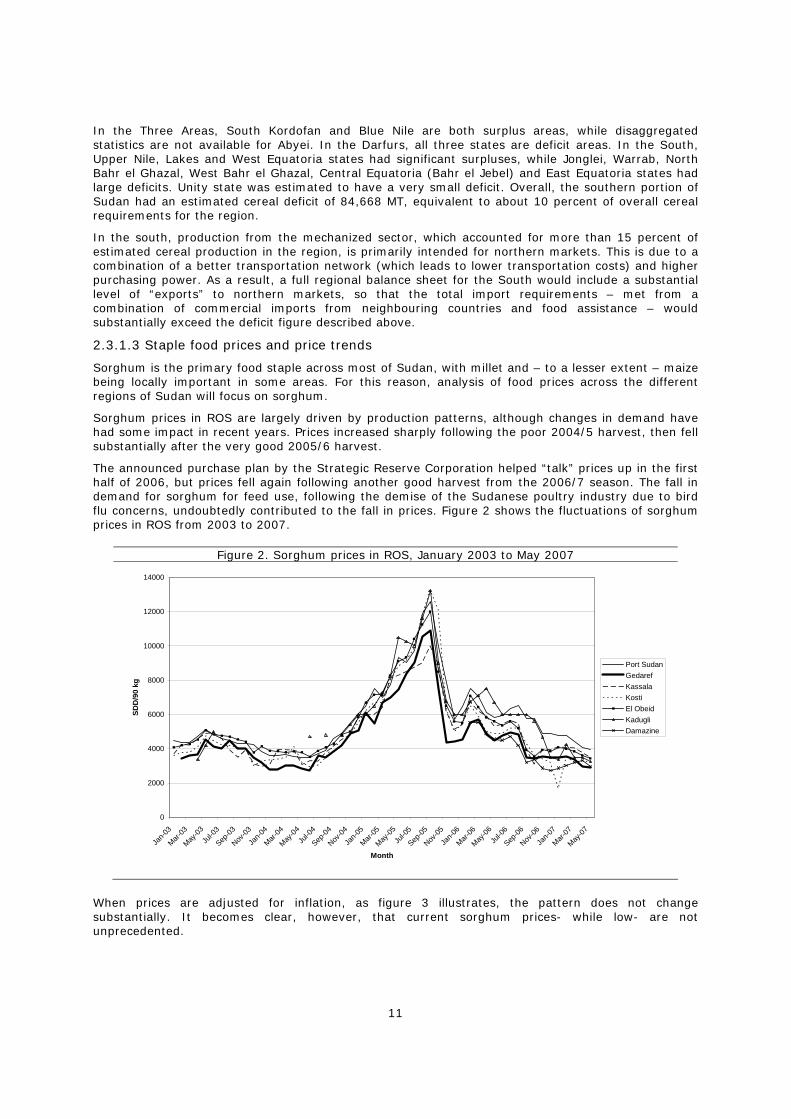
11
In the Three Areas, South Kordofan and Blue Nile are both surplus areas, while disaggregated statistics are not available for Abyei. In the Darfurs, all three states are deficit areas. In the South, Upper Nile, Lakes and West Equatoria states had significant surpluses, while Jonglei, Warrab, North Bahr el Ghazal, West Bahr el Ghazal, Central Equatoria (Bahr el Jebel) and East Equatoria states had large deficits. Unity state was estimated to have a very small deficit. Overall, the southern portion of Sudan had an estimated cereal deficit of 84,668 MT, equivalent to about 10 percent of overall cereal requirements for the region.
In the south, production from the mechanized sector, which accounted for more than 15 percent of estimated cereal production in the region, is primarily intended for northern markets. This is due to a combination of a better transportation network (which leads to lower transportation costs) and higher purchasing power. As a result, a full regional balance sheet for the South would include a substantial level of “exports” to northern markets, so that the total import requirements – met from a combination of commercial imports from neighbouring countries and food assistance – would substantially exceed the deficit figure described above.
2.3.1.3 Staple food prices and price trends
Sorghum is the primary food staple across most of Sudan, with millet and – to a lesser extent – maize being locally important in some areas. For this reason, analysis of food prices across the different regions of Sudan will focus on sorghum.
Sorghum prices in ROS are largely driven by production patterns, although changes in demand have had some impact in recent years. Prices increased sharply following the poor 2004/5 harvest, then fell substantially after the very good 2005/6 harvest.
The announced purchase plan by the Strategic Reserve Corporation helped “talk” prices up in the first half of 2006, but prices fell again following another good harvest from the 2006/7 season. The fall in demand for sorghum for feed use, following the demise of the Sudanese poultry industry due to bird flu concerns, undoubtedly contributed to the fall in prices. Figure 2 shows the fluctuations of sorghum prices in ROS from 2003 to 2007.
Figure 2. Sorghum prices in ROS, January 2003 to May 2007
0
2000
4000
6000
8000
10000
12000
14000
Jan-0
3
Mar-03
May-03
Jul-0
3
Sep-03
Nov-03
Jan-0
4
Mar-04
May-04
Jul-0
4
Sep-04
Nov-04
Jan-0
5
Mar-05
May-05
Jul-0
5
Sep-05
Nov-05
Jan-0
6
Mar-06
May-06
Jul-0
6
Sep-06
Nov-06
Jan-0
7
Mar-07
May-07
Month
SDD
/90
kg
Port SudanGedarefKassalaKostiEl ObeidKadugliDamazine
When prices are adjusted for inflation, as figure 3 illustrates, the pattern does not change substantially. It becomes clear, however, that current sorghum prices- while low- are not unprecedented.
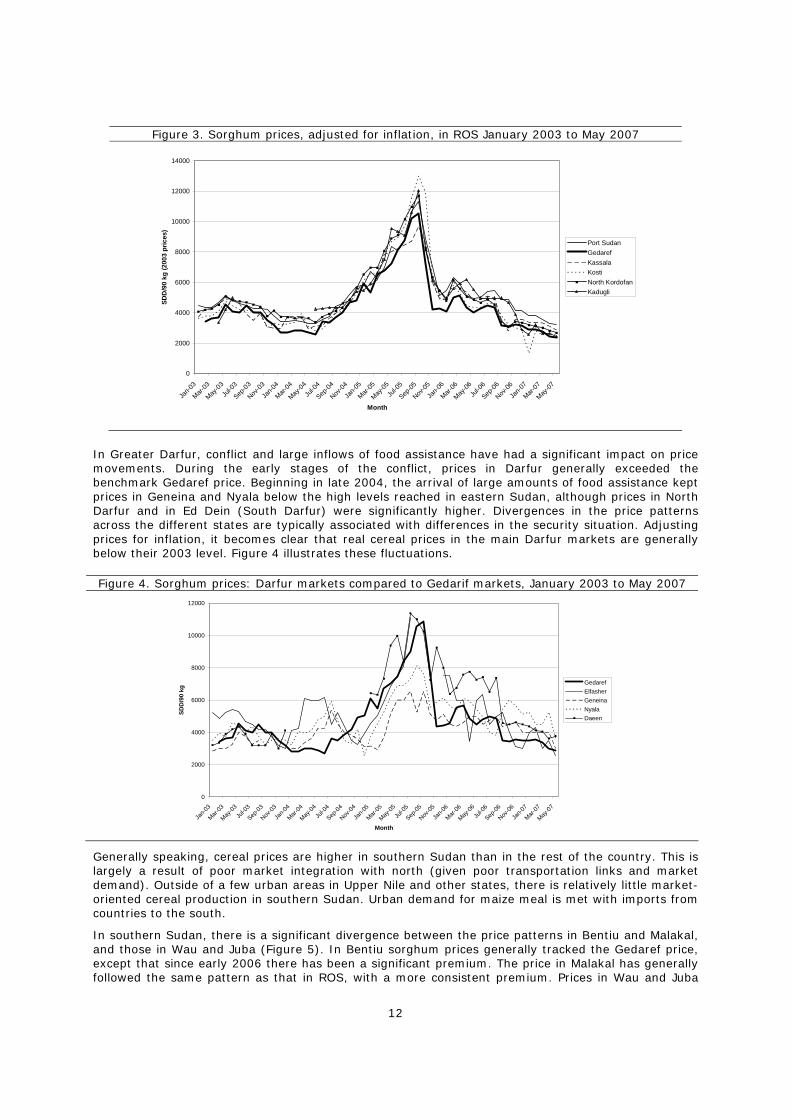
12
Figure 3. Sorghum prices, adjusted for inflation, in ROS January 2003 to May 2007
0
2000
4000
6000
8000
10000
12000
14000
Jan-0
3
Mar-03
May-03
Jul-0
3
Sep-03
Nov-03
Jan-0
4
Mar-04
May-04
Jul-0
4
Sep-04
Nov-04
Jan-0
5
Mar-05
May-05
Jul-0
5
Sep-05
Nov-05
Jan-0
6
Mar-06
May-06
Jul-0
6
Sep-06
Nov-06
Jan-0
7
Mar-07
May-07
Month
SDD
/90
kg (2
003
pric
es)
Port SudanGedarefKassalaKostiNorth KordofanKadugli
In Greater Darfur, conflict and large inflows of food assistance have had a significant impact on price movements. During the early stages of the conflict, prices in Darfur generally exceeded the benchmark Gedaref price. Beginning in late 2004, the arrival of large amounts of food assistance kept prices in Geneina and Nyala below the high levels reached in eastern Sudan, although prices in North Darfur and in Ed Dein (South Darfur) were significantly higher. Divergences in the price patterns across the different states are typically associated with differences in the security situation. Adjusting prices for inflation, it becomes clear that real cereal prices in the main Darfur markets are generally below their 2003 level. Figure 4 illustrates these fluctuations.
Figure 4. Sorghum prices: Darfur markets compared to Gedarif markets, January 2003 to May 2007
0
2000
4000
6000
8000
10000
12000
Jan-0
3
Mar-03
May-03
Jul-0
3
Sep-03
Nov-03
Jan-0
4
Mar-04
May-04
Jul-0
4
Sep-04
Nov-04
Jan-0
5
Mar-05
May-05
Jul-0
5
Sep-05
Nov-05
Jan-0
6
Mar-06
May-06
Jul-0
6
Sep-06
Nov-06
Jan-0
7
Mar-07
May-07
Month
SDD
/90
kg
GedarefElfasherGeneina NyalaDaeen
Generally speaking, cereal prices are higher in southern Sudan than in the rest of the country. This is largely a result of poor market integration with north (given poor transportation links and market demand). Outside of a few urban areas in Upper Nile and other states, there is relatively little market-oriented cereal production in southern Sudan. Urban demand for maize meal is met with imports from countries to the south.
In southern Sudan, there is a significant divergence between the price patterns in Bentiu and Malakal, and those in Wau and Juba (Figure 5). In Bentiu sorghum prices generally tracked the Gedaref price, except that since early 2006 there has been a significant premium. The price in Malakal has generally followed the same pattern as that in ROS, with a more consistent premium. Prices in Wau and Juba
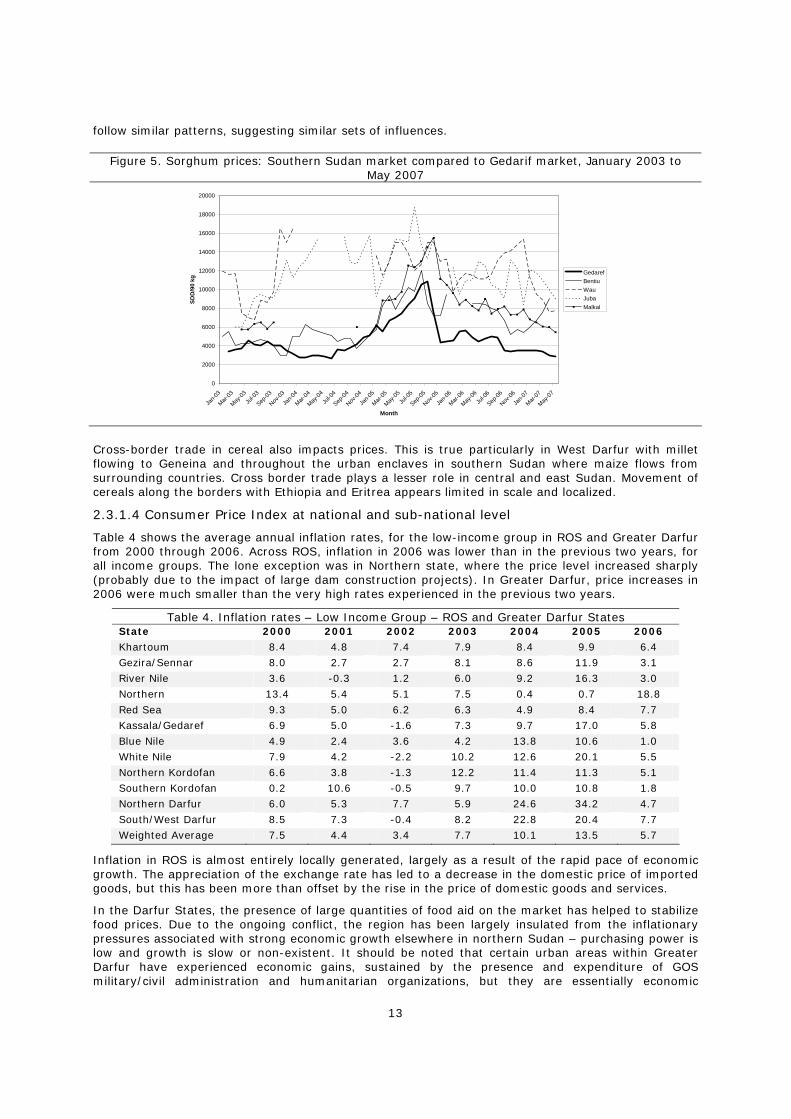
13
follow similar patterns, suggesting similar sets of influences.
Figure 5. Sorghum prices: Southern Sudan market compared to Gedarif market, January 2003 to May 2007
0
2000
4000
6000
8000
10000
12000
14000
16000
18000
20000
Jan-0
3
Mar-03
May-03
Jul-0
3
Sep-03
Nov-03
Jan-0
4
Mar-04
May-04
Jul-0
4
Sep-04
Nov-04
Jan-0
5
Mar-05
May-05
Jul-0
5
Sep-05
Nov-05
Jan-0
6
Mar-06
May-06
Jul-0
6
Sep-06
Nov-06
Jan-0
7
Mar-07
May-07
Month
SDD
/90
kg
GedarefBentiuWauJubaMalkal
Cross-border trade in cereal also impacts prices. This is true particularly in West Darfur with millet flowing to Geneina and throughout the urban enclaves in southern Sudan where maize flows from surrounding countries. Cross border trade plays a lesser role in central and east Sudan. Movement of cereals along the borders with Ethiopia and Eritrea appears limited in scale and localized.
2.3.1.4 Consumer Price Index at national and sub-national level
Table 4 shows the average annual inflation rates, for the low-income group in ROS and Greater Darfur from 2000 through 2006. Across ROS, inflation in 2006 was lower than in the previous two years, for all income groups. The lone exception was in Northern state, where the price level increased sharply (probably due to the impact of large dam construction projects). In Greater Darfur, price increases in 2006 were much smaller than the very high rates experienced in the previous two years.
Table 4. Inflation rates – Low Income Group – ROS and Greater Darfur States State 2000 2001 2002 2003 2004 2005 2006
Khartoum 8.4 4.8 7.4 7.9 8.4 9.9 6.4
Gezira/Sennar 8.0 2.7 2.7 8.1 8.6 11.9 3.1
River Nile 3.6 -0.3 1.2 6.0 9.2 16.3 3.0
Northern 13.4 5.4 5.1 7.5 0.4 0.7 18.8
Red Sea 9.3 5.0 6.2 6.3 4.9 8.4 7.7
Kassala/Gedaref 6.9 5.0 -1.6 7.3 9.7 17.0 5.8
Blue Nile 4.9 2.4 3.6 4.2 13.8 10.6 1.0
White Nile 7.9 4.2 -2.2 10.2 12.6 20.1 5.5
Northern Kordofan 6.6 3.8 -1.3 12.2 11.4 11.3 5.1
Southern Kordofan 0.2 10.6 -0.5 9.7 10.0 10.8 1.8
Northern Darfur 6.0 5.3 7.7 5.9 24.6 34.2 4.7
South/West Darfur 8.5 7.3 -0.4 8.2 22.8 20.4 7.7
Weighted Average 7.5 4.4 3.4 7.7 10.1 13.5 5.7
Inflation in ROS is almost entirely locally generated, largely as a result of the rapid pace of economic growth. The appreciation of the exchange rate has led to a decrease in the domestic price of imported goods, but this has been more than offset by the rise in the price of domestic goods and services.
In the Darfur States, the presence of large quantities of food aid on the market has helped to stabilize food prices. Due to the ongoing conflict, the region has been largely insulated from the inflationary pressures associated with strong economic growth elsewhere in northern Sudan – purchasing power is low and growth is slow or non-existent. It should be noted that certain urban areas within Greater Darfur have experienced economic gains, sustained by the presence and expenditure of GOS military/civil administration and humanitarian organizations, but they are essentially economic
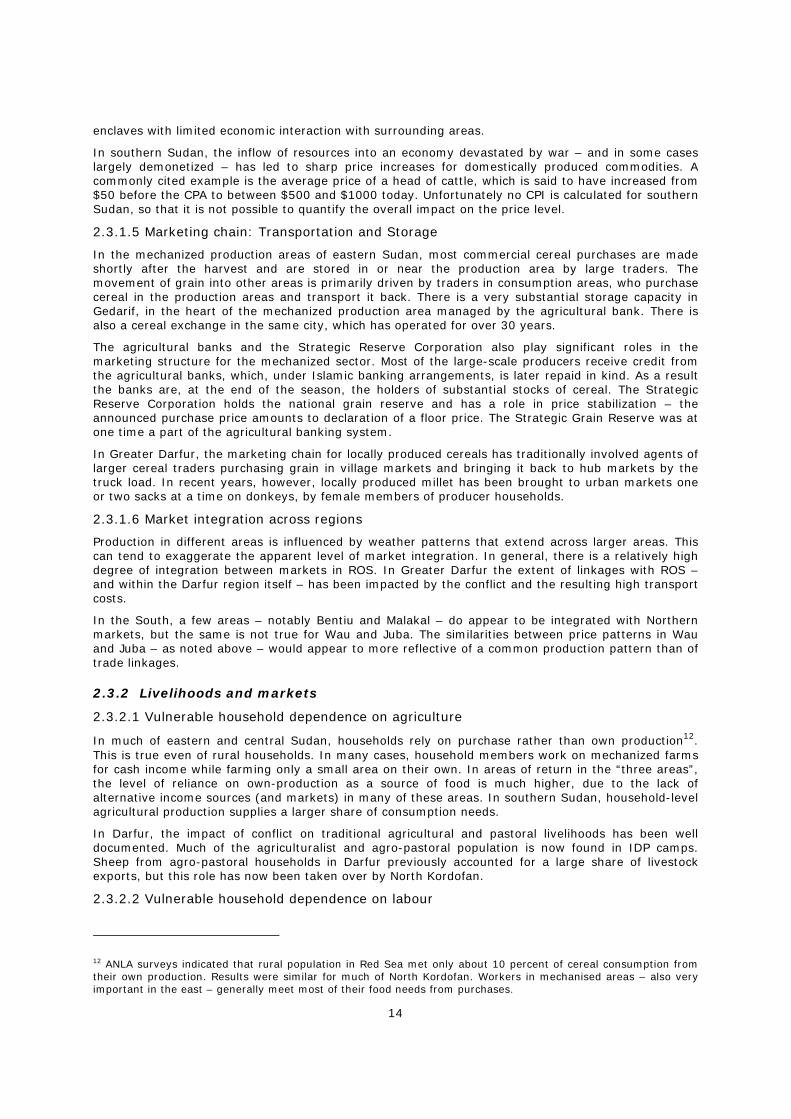
14
enclaves with limited economic interaction with surrounding areas.
In southern Sudan, the inflow of resources into an economy devastated by war – and in some cases largely demonetized – has led to sharp price increases for domestically produced commodities. A commonly cited example is the average price of a head of cattle, which is said to have increased from $50 before the CPA to between $500 and $1000 today. Unfortunately no CPI is calculated for southern Sudan, so that it is not possible to quantify the overall impact on the price level.
2.3.1.5 Marketing chain: Transportation and Storage
In the mechanized production areas of eastern Sudan, most commercial cereal purchases are made shortly after the harvest and are stored in or near the production area by large traders. The movement of grain into other areas is primarily driven by traders in consumption areas, who purchase cereal in the production areas and transport it back. There is a very substantial storage capacity in Gedarif, in the heart of the mechanized production area managed by the agricultural bank. There is also a cereal exchange in the same city, which has operated for over 30 years.
The agricultural banks and the Strategic Reserve Corporation also play significant roles in the marketing structure for the mechanized sector. Most of the large-scale producers receive credit from the agricultural banks, which, under Islamic banking arrangements, is later repaid in kind. As a result the banks are, at the end of the season, the holders of substantial stocks of cereal. The Strategic Reserve Corporation holds the national grain reserve and has a role in price stabilization – the announced purchase price amounts to declaration of a floor price. The Strategic Grain Reserve was at one time a part of the agricultural banking system.
In Greater Darfur, the marketing chain for locally produced cereals has traditionally involved agents of larger cereal traders purchasing grain in village markets and bringing it back to hub markets by the truck load. In recent years, however, locally produced millet has been brought to urban markets one or two sacks at a time on donkeys, by female members of producer households.
2.3.1.6 Market integration across regions
Production in different areas is influenced by weather patterns that extend across larger areas. This can tend to exaggerate the apparent level of market integration. In general, there is a relatively high degree of integration between markets in ROS. In Greater Darfur the extent of linkages with ROS – and within the Darfur region itself – has been impacted by the conflict and the resulting high transport costs.
In the South, a few areas – notably Bentiu and Malakal – do appear to be integrated with Northern markets, but the same is not true for Wau and Juba. The similarities between price patterns in Wau and Juba – as noted above – would appear to more reflective of a common production pattern than of trade linkages.
2.3.2 Livelihoods and markets
2.3.2.1 Vulnerable household dependence on agriculture
In much of eastern and central Sudan, households rely on purchase rather than own production12. This is true even of rural households. In many cases, household members work on mechanized farms for cash income while farming only a small area on their own. In areas of return in the “three areas”, the level of reliance on own-production as a source of food is much higher, due to the lack of alternative income sources (and markets) in many of these areas. In southern Sudan, household-level agricultural production supplies a larger share of consumption needs.
In Darfur, the impact of conflict on traditional agricultural and pastoral livelihoods has been well documented. Much of the agriculturalist and agro-pastoral population is now found in IDP camps. Sheep from agro-pastoral households in Darfur previously accounted for a large share of livestock exports, but this role has now been taken over by North Kordofan.
2.3.2.2 Vulnerable household dependence on labour
12 ANLA surveys indicated that rural population in Red Sea met only about 10 percent of cereal consumption from their own production. Results were similar for much of North Kordofan. Workers in mechanised areas – also very important in the east – generally meet most of their food needs from purchases.
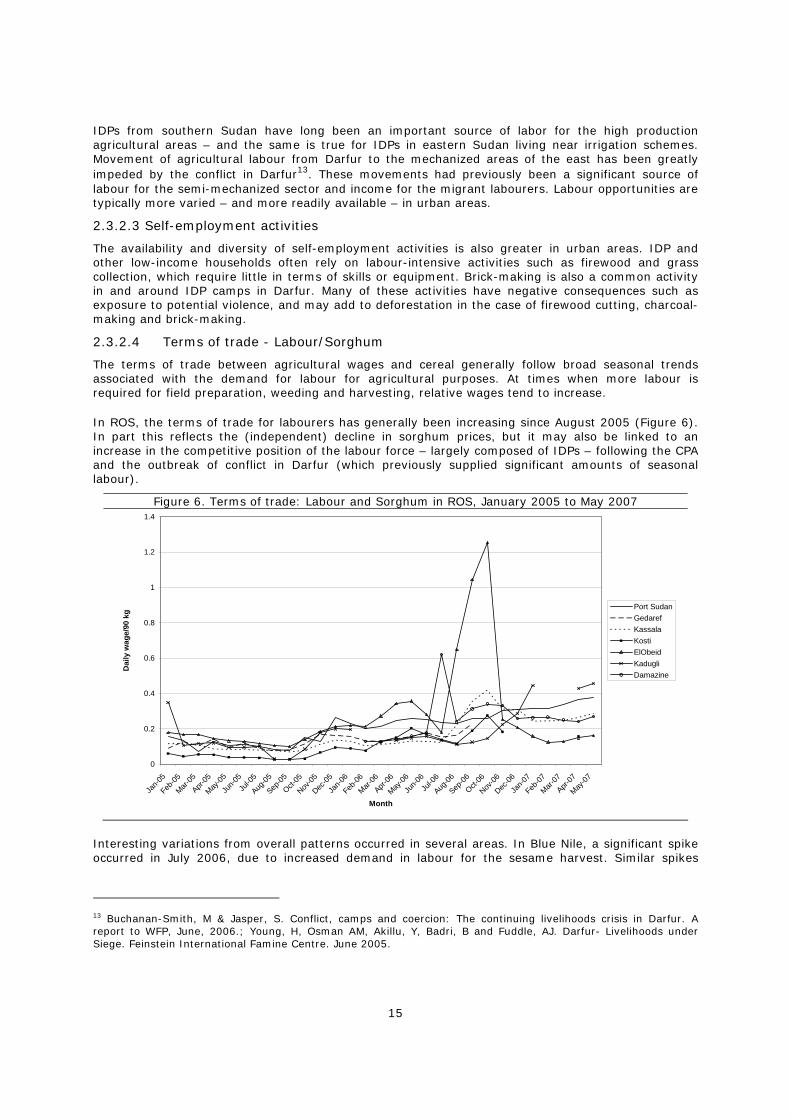
15
IDPs from southern Sudan have long been an important source of labor for the high production agricultural areas – and the same is true for IDPs in eastern Sudan living near irrigation schemes. Movement of agricultural labour from Darfur to the mechanized areas of the east has been greatly impeded by the conflict in Darfur13. These movements had previously been a significant source of labour for the semi-mechanized sector and income for the migrant labourers. Labour opportunities are typically more varied – and more readily available – in urban areas.
2.3.2.3 Self-employment activities
The availability and diversity of self-employment activities is also greater in urban areas. IDP and other low-income households often rely on labour-intensive activities such as firewood and grass collection, which require little in terms of skills or equipment. Brick-making is also a common activity in and around IDP camps in Darfur. Many of these activities have negative consequences such as exposure to potential violence, and may add to deforestation in the case of firewood cutting, charcoal-making and brick-making.
2.3.2.4 Terms of trade - Labour/Sorghum
The terms of trade between agricultural wages and cereal generally follow broad seasonal trends associated with the demand for labour for agricultural purposes. At times when more labour is required for field preparation, weeding and harvesting, relative wages tend to increase.
In ROS, the terms of trade for labourers has generally been increasing since August 2005 (Figure 6). In part this reflects the (independent) decline in sorghum prices, but it may also be linked to an increase in the competitive position of the labour force – largely composed of IDPs – following the CPA and the outbreak of conflict in Darfur (which previously supplied significant amounts of seasonal labour).
Figure 6. Terms of trade: Labour and Sorghum in ROS, January 2005 to May 2007
0
0.2
0.4
0.6
0.8
1
1.2
1.4
Jan-0
5
Feb-05
Mar-05
Apr-05
May-05
Jun-0
5Ju
l-05
Aug-05
Sep-05
Oct-05
Nov-05
Dec-05
Jan-0
6
Feb-06
Mar-06
Apr-06
May-06
Jun-0
6Ju
l-06
Aug-06
Sep-06
Oct-06
Nov-06
Dec-06
Jan-0
7
Feb-07
Mar-07
Apr-07
May-07
Month
Dai
ly w
age/
90 k
g Port SudanGedarefKassalaKostiElObeidKadugliDamazine
Interesting variations from overall patterns occurred in several areas. In Blue Nile, a significant spike occurred in July 2006, due to increased demand in labour for the sesame harvest. Similar spikes
13 Buchanan-Smith, M & Jasper, S. Conflict, camps and coercion: The continuing livelihoods crisis in Darfur. A report to WFP, June, 2006.; Young, H, Osman AM, Akillu, Y, Badri, B and Fuddle, AJ. Darfur- Livelihoods under Siege. Feinstein International Famine Centre. June 2005.
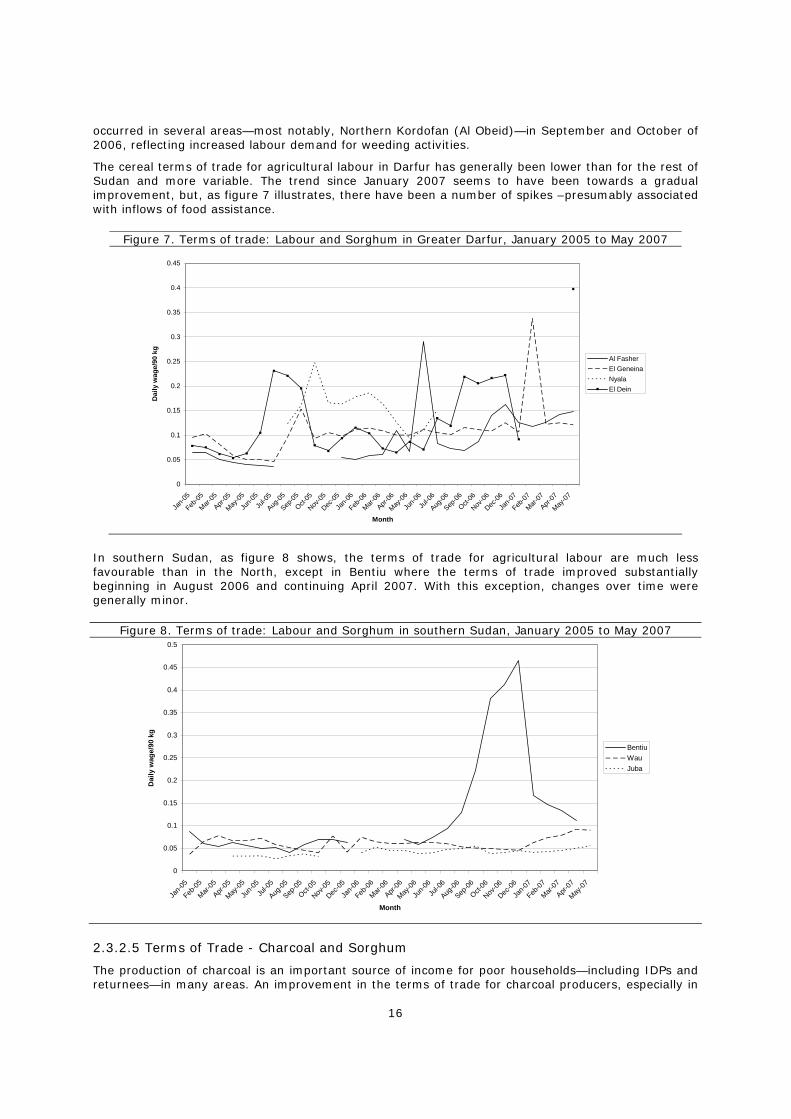
16
occurred in several areas—most notably, Northern Kordofan (Al Obeid)—in September and October of 2006, reflecting increased labour demand for weeding activities.
The cereal terms of trade for agricultural labour in Darfur has generally been lower than for the rest of Sudan and more variable. The trend since January 2007 seems to have been towards a gradual improvement, but, as figure 7 illustrates, there have been a number of spikes –presumably associated with inflows of food assistance.
Figure 7. Terms of trade: Labour and Sorghum in Greater Darfur, January 2005 to May 2007
0
0.05
0.1
0.15
0.2
0.25
0.3
0.35
0.4
0.45
Jan-0
5
Feb-05
Mar-05
Apr-05
May-05
Jun-0
5Ju
l-05
Aug-05
Sep-05
Oct-05
Nov-05
Dec-05
Jan-0
6
Feb-06
Mar-06
Apr-06
May-06
Jun-0
6Ju
l-06
Aug-06
Sep-06
Oct-06
Nov-06
Dec-06
Jan-0
7
Feb-07
Mar-07
Apr-07
May-07
Month
Dai
ly w
age/
90 k
g
Al FasherEl GeneinaNyalaEl Dein
In southern Sudan, as figure 8 shows, the terms of trade for agricultural labour are much less favourable than in the North, except in Bentiu where the terms of trade improved substantially beginning in August 2006 and continuing April 2007. With this exception, changes over time were generally minor.
Figure 8. Terms of trade: Labour and Sorghum in southern Sudan, January 2005 to May 2007
0
0.05
0.1
0.15
0.2
0.25
0.3
0.35
0.4
0.45
0.5
Jan-0
5
Feb-05
Mar-05
Apr-05
May-05
Jun-0
5Ju
l-05
Aug-05
Sep-05
Oct-05
Nov-05
Dec-05
Jan-0
6
Feb-06
Mar-06
Apr-06
May-06
Jun-0
6Ju
l-06
Aug-06
Sep-06
Oct-06
Nov-06
Dec-06
Jan-0
7
Feb-07
Mar-07
Apr-07
May-07
Month
Dai
ly w
age/
90 k
g
BentiuWauJuba
2.3.2.5 Terms of Trade - Charcoal and Sorghum
The production of charcoal is an important source of income for poor households—including IDPs and returnees—in many areas. An improvement in the terms of trade for charcoal producers, especially in
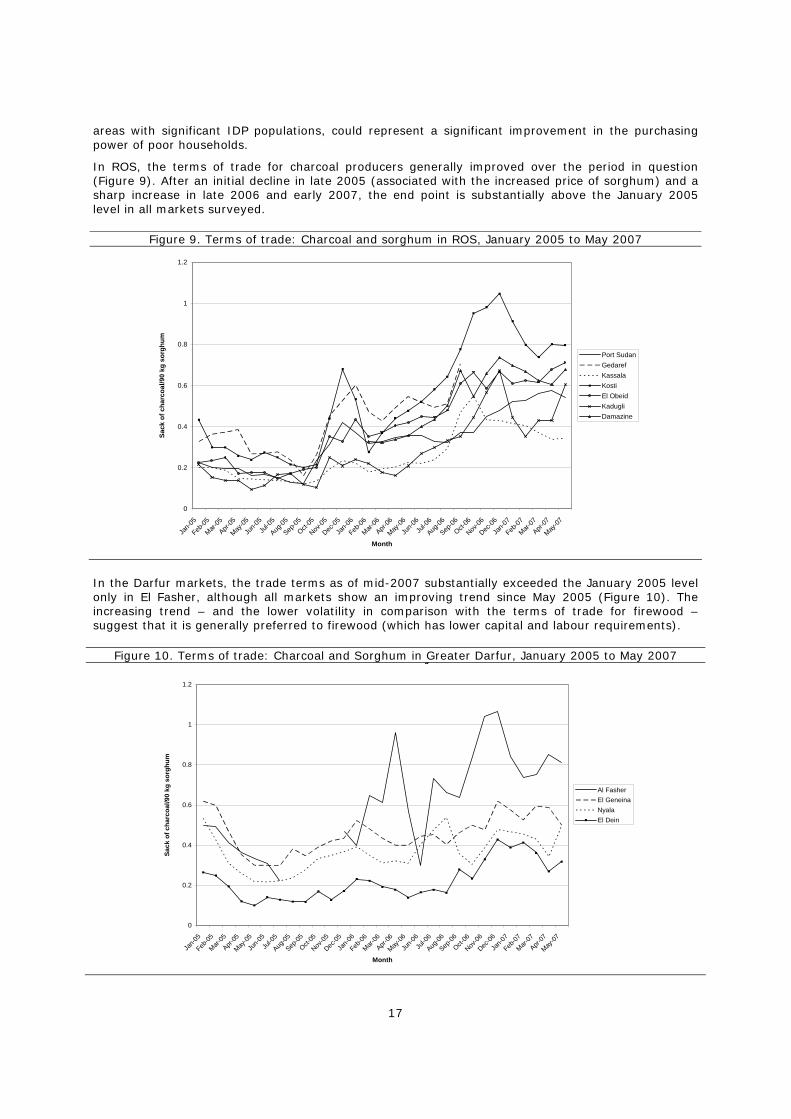
17
areas with significant IDP populations, could represent a significant improvement in the purchasing power of poor households.
In ROS, the terms of trade for charcoal producers generally improved over the period in question (Figure 9). After an initial decline in late 2005 (associated with the increased price of sorghum) and a sharp increase in late 2006 and early 2007, the end point is substantially above the January 2005 level in all markets surveyed.
Figure 9. Terms of trade: Charcoal and sorghum in ROS, January 2005 to May 2007
0
0.2
0.4
0.6
0.8
1
1.2
Jan-0
5
Feb-05
Mar-05
Apr-05
May-05
Jun-0
5Ju
l-05
Aug-05
Sep-05
Oct-05
Nov-05
Dec-05
Jan-0
6
Feb-06
Mar-06
Apr-06
May-06
Jun-0
6Ju
l-06
Aug-06
Sep-06
Oct-06
Nov-06
Dec-06
Jan-0
7
Feb-07
Mar-07
Apr-07
May-07
Month
Sack
of c
harc
oal/9
0 kg
sor
ghum
Port SudanGedarefKassalaKostiEl ObeidKadugliDamazine
In the Darfur markets, the trade terms as of mid-2007 substantially exceeded the January 2005 level only in El Fasher, although all markets show an improving trend since May 2005 (Figure 10). The increasing trend – and the lower volatility in comparison with the terms of trade for firewood – suggest that it is generally preferred to firewood (which has lower capital and labour requirements).
Figure 10. Terms of trade: Charcoal and Sorghum in Greater Darfur, January 2005 to May 2007 g
0
0.2
0.4
0.6
0.8
1
1.2
Jan-0
5
Feb-05
Mar-05
Apr-05
May-05
Jun-0
5Ju
l-05
Aug-05
Sep-05
Oct-05
Nov-05
Dec-05
Jan-0
6
Feb-06
Mar-06
Apr-06
May-06
Jun-0
6Ju
l-06
Aug-06
Sep-06
Oct-06
Nov-06
Dec-06
Jan-0
7
Feb-07
Mar-07
Apr-07
May-07
Month
Sack
of c
harc
oal/9
0 kg
sor
ghum
Al FasherEl GeneinaNyalaEl Dein
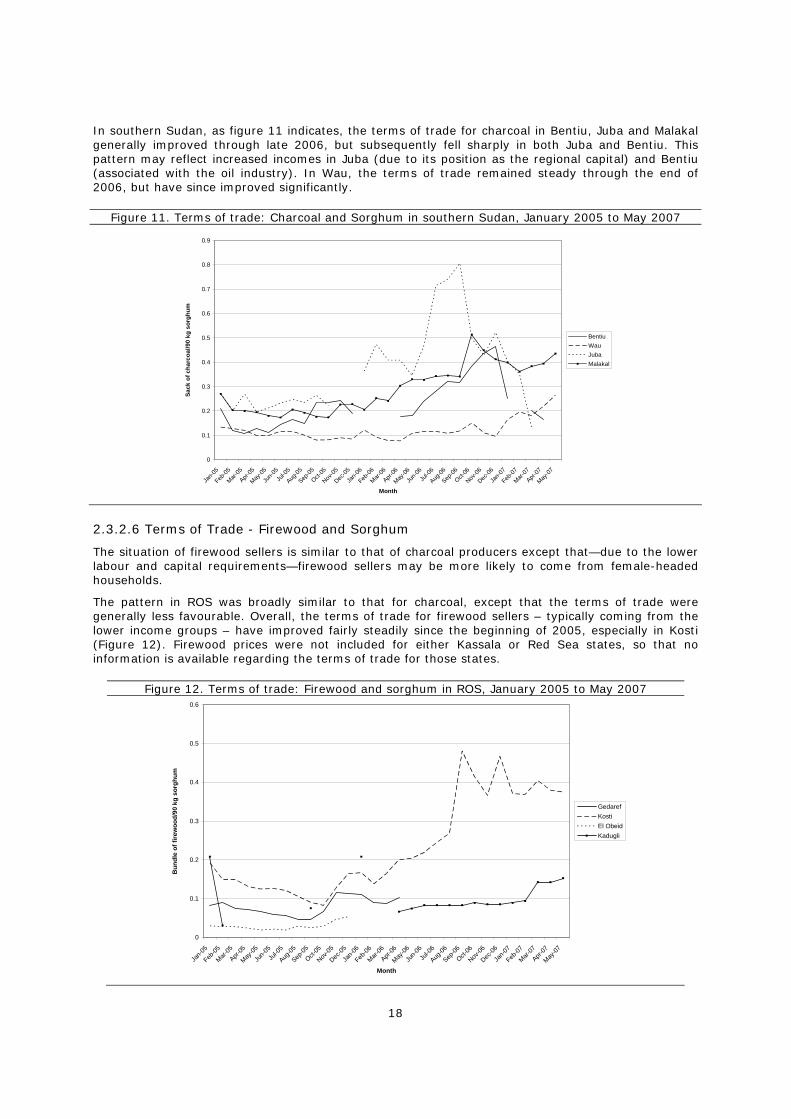
18
In southern Sudan, as figure 11 indicates, the terms of trade for charcoal in Bentiu, Juba and Malakal generally improved through late 2006, but subsequently fell sharply in both Juba and Bentiu. This pattern may reflect increased incomes in Juba (due to its position as the regional capital) and Bentiu (associated with the oil industry). In Wau, the terms of trade remained steady through the end of 2006, but have since improved significantly.
Figure 11. Terms of trade: Charcoal and Sorghum in southern Sudan, January 2005 to May 2007
0
0.1
0.2
0.3
0.4
0.5
0.6
0.7
0.8
0.9
Jan-0
5
Feb-05
Mar-05
Apr-05
May-05
Jun-0
5Ju
l-05
Aug-05
Sep-05
Oct-05
Nov-05
Dec-05
Jan-0
6
Feb-06
Mar-06
Apr-06
May-06
Jun-0
6Ju
l-06
Aug-06
Sep-06
Oct-06
Nov-06
Dec-06
Jan-0
7
Feb-07
Mar-07
Apr-07
May-07
Month
Sack
of c
harc
oal/9
0 kg
sor
ghum
BentiuWauJubaMalakal
2.3.2.6 Terms of Trade - Firewood and Sorghum
The situation of firewood sellers is similar to that of charcoal producers except that—due to the lower labour and capital requirements—firewood sellers may be more likely to come from female-headed households.
The pattern in ROS was broadly similar to that for charcoal, except that the terms of trade were generally less favourable. Overall, the terms of trade for firewood sellers – typically coming from the lower income groups – have improved fairly steadily since the beginning of 2005, especially in Kosti (Figure 12). Firewood prices were not included for either Kassala or Red Sea states, so that no information is available regarding the terms of trade for those states.
Figure 12. Terms of trade: Firewood and sorghum in ROS, January 2005 to May 2007
0
0.1
0.2
0.3
0.4
0.5
0.6
Jan-0
5
Feb-05
Mar-05
Apr-05
May-05
Jun-0
5Ju
l-05
Aug-05
Sep-05
Oct-05
Nov-05
Dec-05
Jan-0
6
Feb-06
Mar-06
Apr-06
May-06
Jun-0
6Ju
l-06
Aug-06
Sep-06
Oct-06
Nov-06
Dec-06
Jan-0
7
Feb-07
Mar-07
Apr-07
May-07
Month
Bun
dle
of fi
rew
ood/
90 k
g so
rghu
m
GedarefKostiEl ObeidKadugli
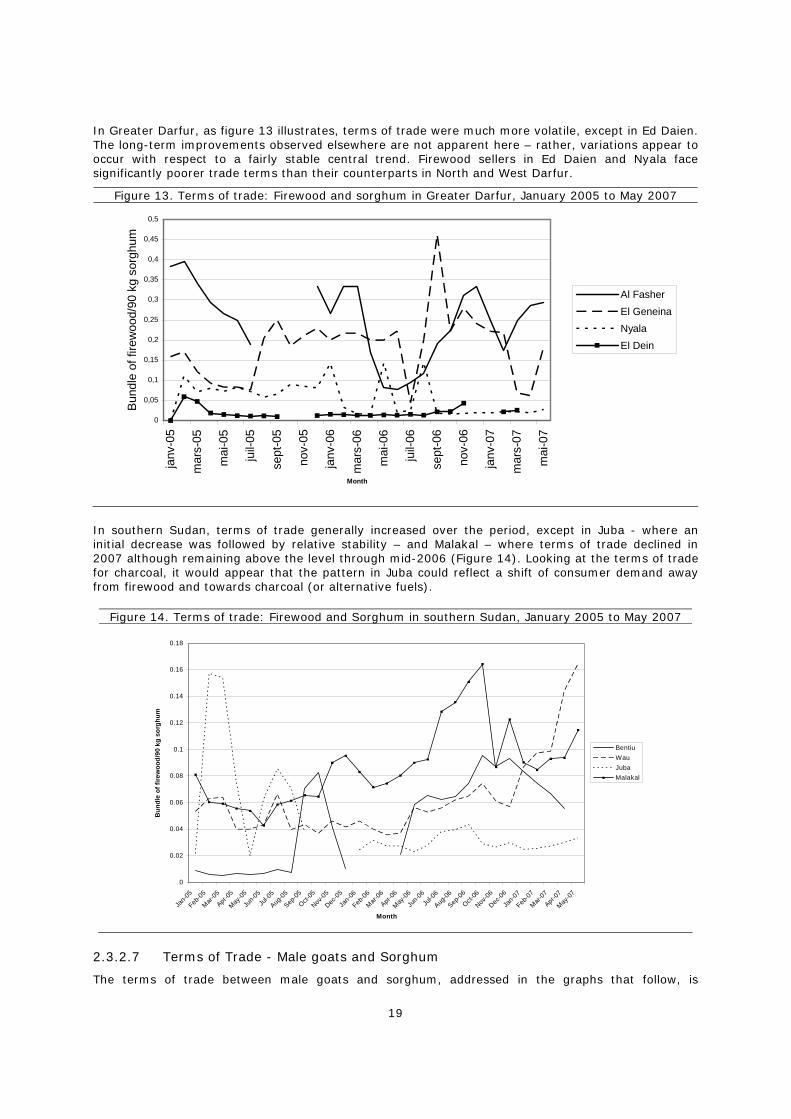
19
In Greater Darfur, as figure 13 illustrates, terms of trade were much more volatile, except in Ed Daien. The long-term improvements observed elsewhere are not apparent here – rather, variations appear to occur with respect to a fairly stable central trend. Firewood sellers in Ed Daien and Nyala face significantly poorer trade terms than their counterparts in North and West Darfur.
Figure 13. Terms of trade: Firewood and sorghum in Greater Darfur, January 2005 to May 2007
0
0,05
0,1
0,15
0,2
0,25
0,3
0,35
0,4
0,45
0,5
janv
-05
mar
s-05
mai
-05
juil-
05
sept
-05
nov-
05
janv
-06
mar
s-06
mai
-06
juil-
06
sept
-06
nov-
06
janv
-07
mar
s-07
mai
-07
Month
Bun
dle
of fi
rew
ood/
90 k
g so
rghu
m
Al FasherEl GeneinaNyalaEl Dein
In southern Sudan, terms of trade generally increased over the period, except in Juba - where an initial decrease was followed by relative stability – and Malakal – where terms of trade declined in 2007 although remaining above the level through mid-2006 (Figure 14). Looking at the terms of trade for charcoal, it would appear that the pattern in Juba could reflect a shift of consumer demand away from firewood and towards charcoal (or alternative fuels).
Figure 14. Terms of trade: Firewood and Sorghum in southern Sudan, January 2005 to May 2007
0
0.02
0.04
0.06
0.08
0.1
0.12
0.14
0.16
0.18
Jan-0
5
Feb-0
5
Mar-05
Apr-05
May-05
Jun-0
5Ju
l-05
Aug-05
Sep-05
Oct-05
Nov-05
Dec-0
5
Jan-
06
Feb-06
Mar-06
Apr-06
May-06
Jun-0
6Ju
l-06
Aug-06
Sep-06
Oct-06
Nov-0
6
Dec-06
Jan-0
7
Feb-07
Mar-07
Apr-07
May-07
Month
Bun
dle
of fi
rew
ood/
90 k
g so
rghu
m
BentiuWauJubaMalakal
2.3.2.7 Terms of Trade - Male goats and Sorghum
The terms of trade between male goats and sorghum, addressed in the graphs that follow, is
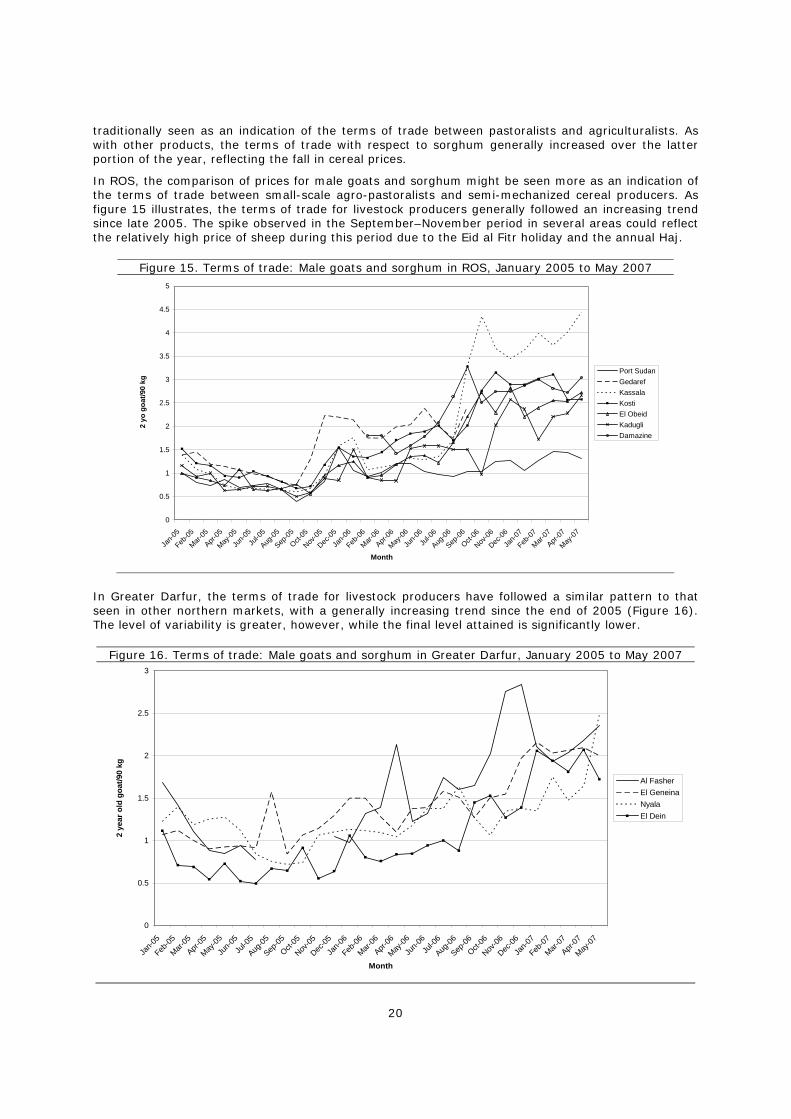
20
traditionally seen as an indication of the terms of trade between pastoralists and agriculturalists. As with other products, the terms of trade with respect to sorghum generally increased over the latter portion of the year, reflecting the fall in cereal prices.
In ROS, the comparison of prices for male goats and sorghum might be seen more as an indication of the terms of trade between small-scale agro-pastoralists and semi-mechanized cereal producers. As figure 15 illustrates, the terms of trade for livestock producers generally followed an increasing trend since late 2005. The spike observed in the September–November period in several areas could reflect the relatively high price of sheep during this period due to the Eid al Fitr holiday and the annual Haj.
Figure 15. Terms of trade: Male goats and sorghum in ROS, January 2005 to May 2007
0
0.5
1
1.5
2
2.5
3
3.5
4
4.5
5
Jan-0
5
Feb-05
Mar-05
Apr-05
May-05
Jun-0
5Ju
l-05
Aug-05
Sep-05
Oct-05
Nov-05
Dec-05
Jan-0
6
Feb-06
Mar-06
Apr-06
May-06
Jun-0
6Ju
l-06
Aug-06
Sep-06
Oct-06
Nov-06
Dec-06
Jan-0
7
Feb-07
Mar-07
Apr-07
May-07
Month
2 y
o go
at/9
0 kg
Port SudanGedarefKassalaKostiEl ObeidKadugliDamazine
In Greater Darfur, the terms of trade for livestock producers have followed a similar pattern to that seen in other northern markets, with a generally increasing trend since the end of 2005 (Figure 16). The level of variability is greater, however, while the final level attained is significantly lower.
Figure 16. Terms of trade: Male goats and sorghum in Greater Darfur, January 2005 to May 2007
0
0.5
1
1.5
2
2.5
3
Jan-0
5
Feb-05
Mar-05
Apr-05
May-05
Jun-0
5Ju
l-05
Aug-05
Sep-05
Oct-05
Nov-05
Dec-05
Jan-0
6
Feb-06
Mar-06
Apr-06
May-06
Jun-0
6Ju
l-06
Aug-06
Sep-06
Oct-06
Nov-06
Dec-06
Jan-0
7
Feb-07
Mar-07
Apr-07
May-07
Month
2 ye
ar o
ld g
oat/9
0 kg
Al FasherEl GeneinaNyalaEl Dein
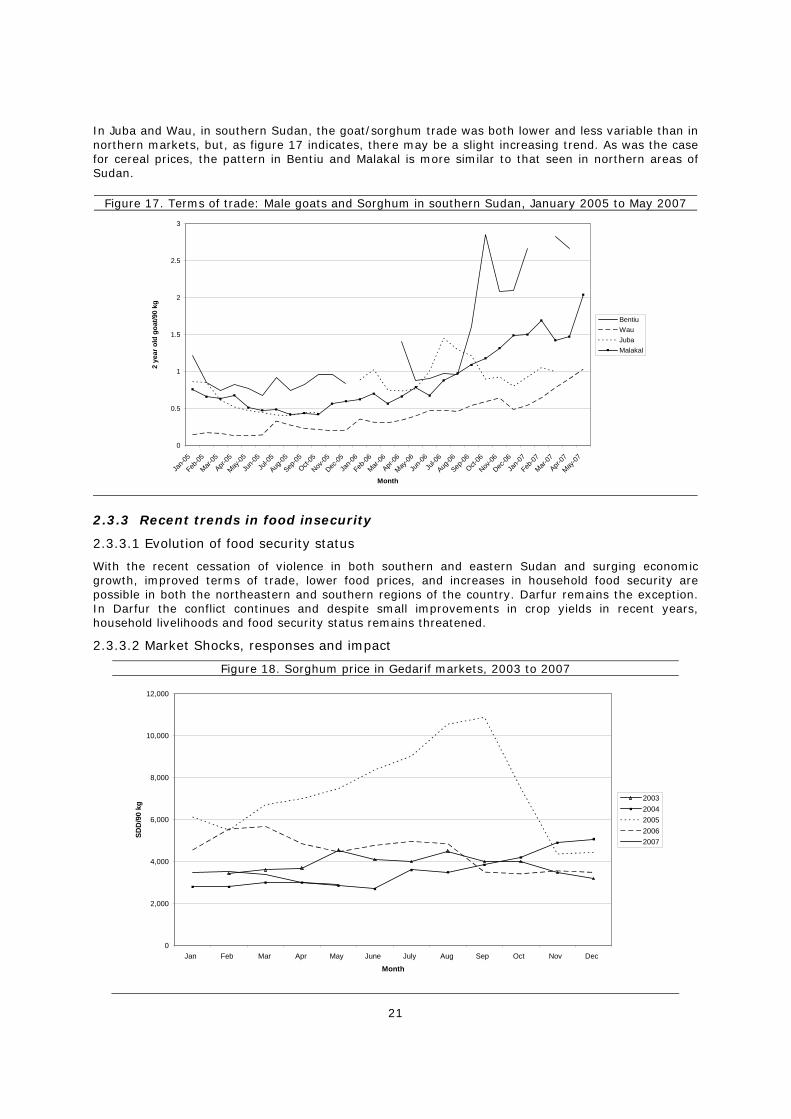
21
In Juba and Wau, in southern Sudan, the goat/sorghum trade was both lower and less variable than in northern markets, but, as figure 17 indicates, there may be a slight increasing trend. As was the case for cereal prices, the pattern in Bentiu and Malakal is more similar to that seen in northern areas of Sudan.
Figure 17. Terms of trade: Male goats and Sorghum in southern Sudan, January 2005 to May 2007
0
0.5
1
1.5
2
2.5
3
Jan-0
5
Feb-05
Mar-05
Apr-05
May-05
Jun-0
5Ju
l-05
Aug-05
Sep-05
Oct-05
Nov-05
Dec-05
Jan-0
6
Feb-06
Mar-06
Apr-06
May-06
Jun-0
6Ju
l-06
Aug-06
Sep-06
Oct-06
Nov-06
Dec-06
Jan-0
7
Feb-07
Mar-07
Apr-07
May-07
Month
2 ye
ar o
ld g
oat/9
0 kg
BentiuWauJubaMalakal
2.3.3 Recent trends in food insecurity
2.3.3.1 Evolution of food security status
With the recent cessation of violence in both southern and eastern Sudan and surging economic growth, improved terms of trade, lower food prices, and increases in household food security are possible in both the northeastern and southern regions of the country. Darfur remains the exception. In Darfur the conflict continues and despite small improvements in crop yields in recent years, household livelihoods and food security status remains threatened.
2.3.3.2 Market Shocks, responses and impact
Figure 18. Sorghum price in Gedarif markets, 2003 to 2007
0
2,000
4,000
6,000
8,000
10,000
12,000
Jan Feb Mar Apr May June July Aug Sep Oct Nov Dec
Month
SDD
/90
kg
20032004200520062007
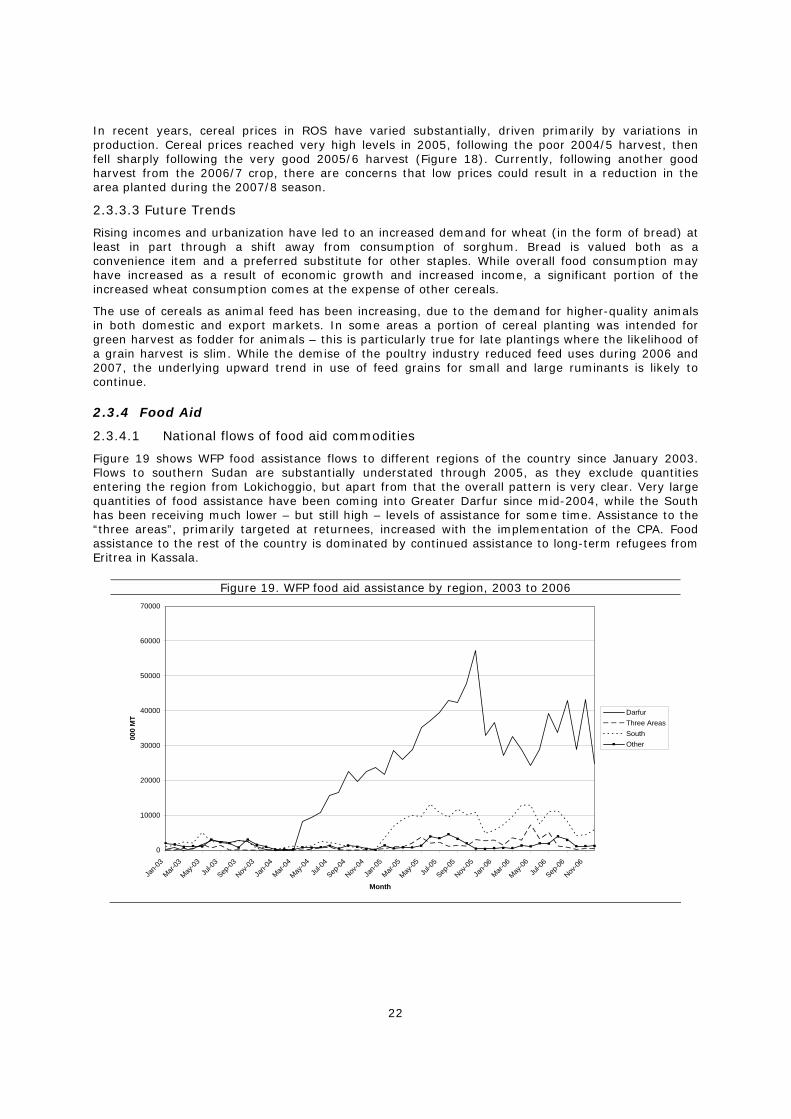
22
In recent years, cereal prices in ROS have varied substantially, driven primarily by variations in production. Cereal prices reached very high levels in 2005, following the poor 2004/5 harvest, then fell sharply following the very good 2005/6 harvest (Figure 18). Currently, following another good harvest from the 2006/7 crop, there are concerns that low prices could result in a reduction in the area planted during the 2007/8 season.
2.3.3.3 Future Trends
Rising incomes and urbanization have led to an increased demand for wheat (in the form of bread) at least in part through a shift away from consumption of sorghum. Bread is valued both as a convenience item and a preferred substitute for other staples. While overall food consumption may have increased as a result of economic growth and increased income, a significant portion of the increased wheat consumption comes at the expense of other cereals.
The use of cereals as animal feed has been increasing, due to the demand for higher-quality animals in both domestic and export markets. In some areas a portion of cereal planting was intended for green harvest as fodder for animals – this is particularly true for late plantings where the likelihood of a grain harvest is slim. While the demise of the poultry industry reduced feed uses during 2006 and 2007, the underlying upward trend in use of feed grains for small and large ruminants is likely to continue.
2.3.4 Food Aid
2.3.4.1 National flows of food aid commodities
Figure 19 shows WFP food assistance flows to different regions of the country since January 2003. Flows to southern Sudan are substantially understated through 2005, as they exclude quantities entering the region from Lokichoggio, but apart from that the overall pattern is very clear. Very large quantities of food assistance have been coming into Greater Darfur since mid-2004, while the South has been receiving much lower – but still high – levels of assistance for some time. Assistance to the “three areas”, primarily targeted at returnees, increased with the implementation of the CPA. Food assistance to the rest of the country is dominated by continued assistance to long-term refugees from Eritrea in Kassala.
Figure 19. WFP food aid assistance by region, 2003 to 2006
0
10000
20000
30000
40000
50000
60000
70000
Jan-0
3
Mar-03
May-03
Jul-0
3
Sep-03
Nov-03
Jan-0
4
Mar-04
May-04
Jul-0
4
Sep-04
Nov-04
Jan-0
5
Mar-05
May-05
Jul-0
5
Sep-05
Nov-05
Jan-0
6
Mar-06
May-06
Jul-0
6
Sep-06
Nov-06
Month
000
MT
DarfurThree AreasSouthOther
23
3. Asset Endowments The combination or portfolio of household assets is an important determinant of the success households will have with their livelihoods activities. In the Sustainable Livelihoods Framework14, the term ‘asset’ is taken in a broad sense, referring to 5 groups or classes of assets: physical, natural, human, financial and social. Livelihood outcomes, such as the degree of food security at household level, depend on these assets and how well households combine them in pursuing their different livelihoods activities. It is very difficult to combine all of these assets into a statistical analysis, as they are of different nature (e.g. education levels-- human assets-- and agricultural tools--physical assets). Further, the value of different assets, from a livelihoods outcome perspective, change depending on how they are utilized. One cannot therefore ‘read out’ the livelihood outcome (e.g. food security) from only looking at accumulated assets. But looking at the availability of certain assets among the population can indicate that certain households have better opportunities for sustainable livelihoods and may also indicate where some of the major constraints lie. The following chapter takes a closer look at the different asset endowments of household throughout Sudan.
3.1 Natural Capital
3.1.1 Geography, climate and natural resources
Sudan is the largest country in Africa, spanning approximately 2.5 million square kilometres and sharing a border with nine different countries. Given its size, it is comprised of many climatic and ecological zones, ranging from arid desert conditions in the north to fertile flood plains and rainforest in the south. This variation translates into greater fertility and food crop production potential in the south then in either Darfur or ROS.
Sudan is an oil rich country, with large oil deposits located in the South Kordofan and Abyei areas, which comprise two of the “three areas” discussed by the CPA. Aside from oil, Sudan also relies heavily on the exportation of meat and livestock, which has recently become the second largest export from Sudan (and the largest non oil export).
3.1.2 Land distribution/tenure
Land distribution and tenure issues have been characterized by intense competition and recurrent conflict between largely sedentary agriculturalists and highly nomadic pastoralists. This tension has been ongoing for decades, however several factors have exacerbated it in recent years. First, there have been natural factors like population growth, drought and desertification that have reduced the amount of arable land available on a per capita basis. Second, social and political factors like “the politicization of conflicts and the breakdown of traditional arbitration mechanisms, alongside exploitation of tribal rivalries and easy access to weapons” have led to ever more violent and persistent conflicts15. Much of this can be traced back to land tenure legislation passed in 1970, which declared all unregistered land government property, even if it was currently in use by local inhabitants. The end result of this was displacement and subsequent armed revolts by various ethnic groups and tribes. This was one of the factors contributing to the persistence of the civil war between north and south.
Prior to the CPA, rates of land ownership were not readily known. Data from the SHHS provides a snapshot of land ownership and use by region in 2006. Overall, 48 percent of households reported owning farmland while 52 percent reported simply using land for agriculture. Generally, land tenure and use were most common in more productive areas and amongst households heavily reliant on agriculture. Thus, two-thirds of households in southern Sudan reported owning land and more than three-quarters reported using land for agriculture. Households in ROS, on the other hand, were least likely to own farmland. Here, 40 percent or fewer households did. Table 5 shows these findings
14 Department for International Development (DFID), 2006: “Sustainable Livelihoods Guidance Sheets”, London, UK.
(http://www.livelihoods.org/info/info_guidancesheets.html#1)
15 World Bank, UN, GOS and SPLM. Joint Assessment Mission (JAM): Framework for sustained peace, development and poverty eradication.
Volume 1. March 2005.
24
Table 5. Land tenure and use, examined by region Own land for agriculture Use land for agriculture
ROS 37.0% 40.2% Greater Darfur 55.6% 60.1% Southern Sudan 66.1% 77.3% Sudan- Overall 47.6% 52.4%
3.1.3 Livestock
A mix of agriculture and pastoralism is common throughout Sudan, with livestock ownership an increasingly important component of the agricultural sector. Data from the SHHS indicates that approximately 50 percent of households reportedly own animals. Households in southern Sudan own significantly more cattle, milk cows and sheep than households in the rest of Sudan, while households in Darfur reportedly own more horses, donkeys and mules. The most common animals owned by households in ROS were chickens and goats (Table 6).
Table 6. Livestock ownership by region (percent) Region Own
animals Cattle Chicken
s Goats Milk
cows Sheep Horses,
donkeys, mules
Camels
ROS 47.6 28.8 54.1 67.4 21.5 26.1 47.9 5.9
Greater Darfur 54.8 32.8 44.8 50.1 22.0 12.1 85.4 5.3
Southern Sudan
50.7 78.5 60.5 76.9 63.9 46.4 5.2 1.7
Sudan- Overall 49.6 42.3 53.8 66.2 32.4 28.3 45.3 4.8
3.2 Human capital
3.2.1 Demographic structure
Sudan is culturally diverse, as the population is comprised of many different ethnicities, languages and religions. Generally the northern part of Sudan is comprised of mostly Sunni Muslim Arab and non-Arab populations. Southern Sudan, on the other hand, is primarily non-Muslim, with populations practicing either Christianity or various indigenous faiths. Southern Sudan has numerous ethnicities (over 500) with the largest being the Dinka.
Estimating population numbers is difficult in Sudan. Given the persistent conflicts, no census has been conducted since 1993 (and no truly nationwide census has been conducted for several decades). To further complicate matters, many of the populations in Sudan are either nomadic or semi-nomadic, and are highly mobile for at least part of the year, making them difficult to count. Given these problems, population estimates vary. The latest and most trusted estimate puts Sudan’s population at slightly over 40 million, with just over 30 million in the north (ROS and Greater Darfur) and about 10 million in the south16.
As table 7 illustrates, the gender breakdown is 50 percent female and 50 percent male. This varies slightly by region. In ROS and Greater Darfur, there are slightly more women than men, while in southern Sudan, there are slightly more men than women.
Table 7. Gender composition of Sudanese population (percent) Sex Sudan- Overall ROS Greater Darfur Southern Sudan Male 50.0 49.5 49.7 50.7 Female 50.0 50.5 50.3 49.3
Examining the age structure of the population, the majority of Sudanese are younger than 20 years of age, with a mean age of 16. When examined by region, some significant differences emerge. In Darfur and southern Sudan, the population appears younger on average than the population in ROS, with mean ages between 14 and 15 in Darfur and between 13 and 14 in southern Sudan. This is likely a
16 Census estimates derived from the 1993 census (for the north), and census projections, migration assumptions, and the WHO/NDI population estimates (for the south)
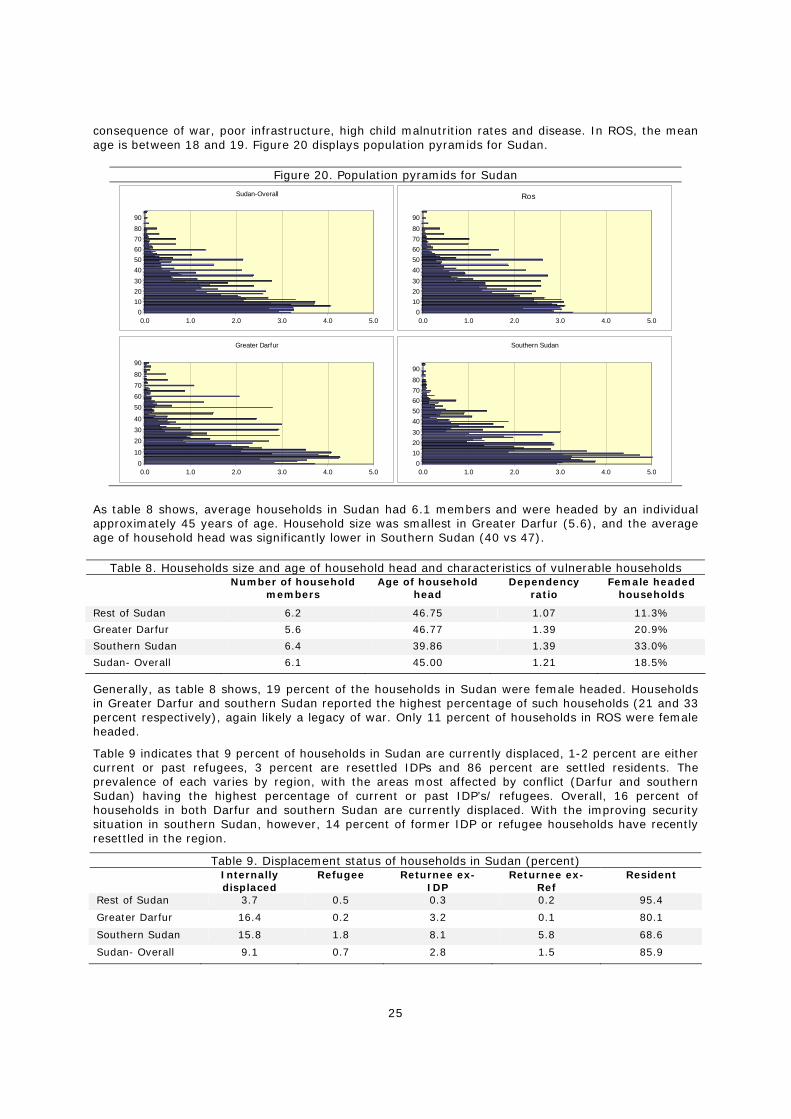
25
consequence of war, poor infrastructure, high child malnutrition rates and disease. In ROS, the mean age is between 18 and 19. Figure 20 displays population pyramids for Sudan.
Figure 20. Population pyramids for Sudan
As table 8 shows, average households in Sudan had 6.1 members and were headed by an individual approximately 45 years of age. Household size was smallest in Greater Darfur (5.6), and the average age of household head was significantly lower in Southern Sudan (40 vs 47).
Table 8. Households size and age of household head and characteristics of vulnerable households Number of household
members Age of household
head Dependency
ratio Female headed
households
Rest of Sudan 6.2 46.75 1.07 11.3%
Greater Darfur 5.6 46.77 1.39 20.9%
Southern Sudan 6.4 39.86 1.39 33.0%
Sudan- Overall 6.1 45.00 1.21 18.5%
Generally, as table 8 shows, 19 percent of the households in Sudan were female headed. Households in Greater Darfur and southern Sudan reported the highest percentage of such households (21 and 33 percent respectively), again likely a legacy of war. Only 11 percent of households in ROS were female headed.
Table 9 indicates that 9 percent of households in Sudan are currently displaced, 1-2 percent are either current or past refugees, 3 percent are resettled IDPs and 86 percent are settled residents. The prevalence of each varies by region, with the areas most affected by conflict (Darfur and southern Sudan) having the highest percentage of current or past IDP’s/ refugees. Overall, 16 percent of households in both Darfur and southern Sudan are currently displaced. With the improving security situation in southern Sudan, however, 14 percent of former IDP or refugee households have recently resettled in the region.
Table 9. Displacement status of households in Sudan (percent) Internally
displaced Refugee Returnee ex-
IDP Returnee ex-
Ref Resident
Rest of Sudan 3.7 0.5 0.3 0.2 95.4
Greater Darfur 16.4 0.2 3.2 0.1 80.1
Southern Sudan 15.8 1.8 8.1 5.8 68.6
Sudan- Overall 9.1 0.7 2.8 1.5 85.9
0.0 1.0 2.0 3.0 4.0 5.00
10
203040
50607080
90
Greater Darfur
0.0 1.0 2.0 3.0 4.0 5.00
102030405060708090
Sudan-Overall
0.0 1.0 2.0 3.0 4.0 5.00
102030405060708090
CETA
0.0 1.0 2.0 3.0 4.0 5.00
102030405060708090
Southern Sudan
Ros
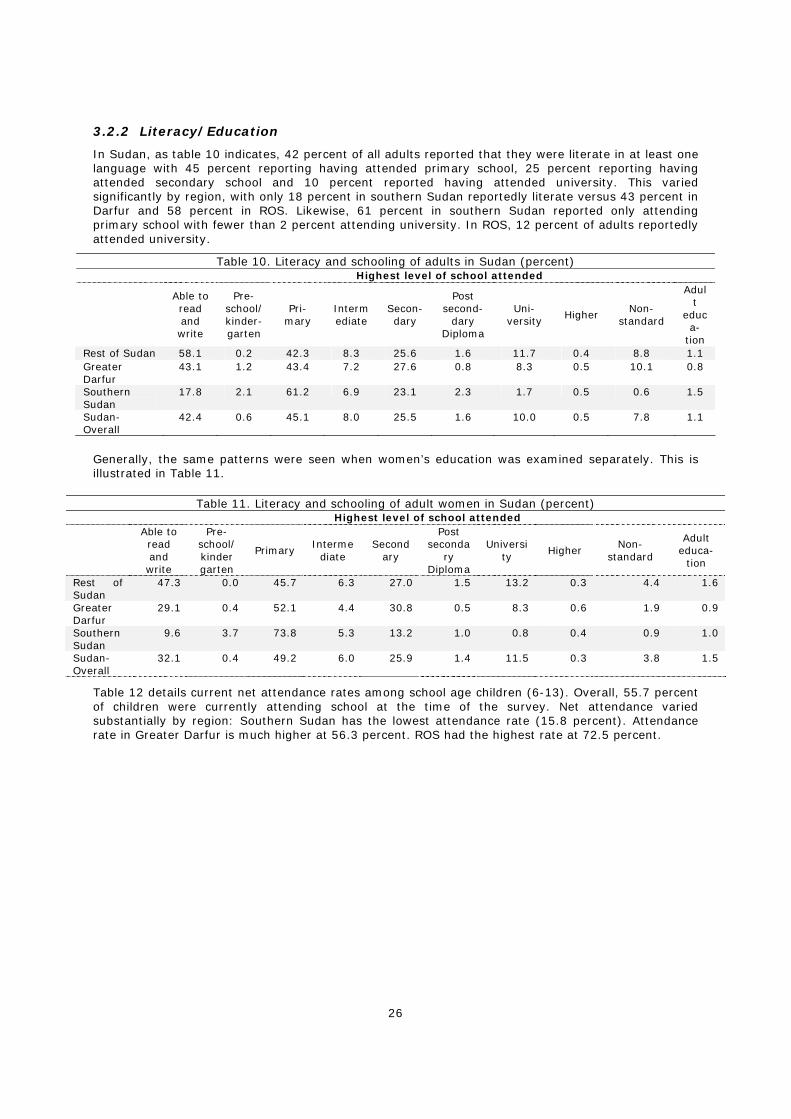
26
3.2.2 Literacy/Education
In Sudan, as table 10 indicates, 42 percent of all adults reported that they were literate in at least one language with 45 percent reporting having attended primary school, 25 percent reporting having attended secondary school and 10 percent reported having attended university. This varied significantly by region, with only 18 percent in southern Sudan reportedly literate versus 43 percent in Darfur and 58 percent in ROS. Likewise, 61 percent in southern Sudan reported only attending primary school with fewer than 2 percent attending university. In ROS, 12 percent of adults reportedly attended university.
Table 10. Literacy and schooling of adults in Sudan (percent) Highest level of school attended Able to
read and write
Pre-school/ kinder-garten
Pri-mary
Intermediate
Secon-dary
Post second-
dary Diploma
Uni-versity
Higher Non-
standard
Adult
educa-
tion Rest of Sudan 58.1 0.2 42.3 8.3 25.6 1.6 11.7 0.4 8.8 1.1 Greater Darfur
43.1 1.2 43.4 7.2 27.6 0.8 8.3 0.5 10.1 0.8
Southern Sudan
17.8 2.1 61.2 6.9 23.1 2.3 1.7 0.5 0.6 1.5
Sudan- Overall
42.4 0.6 45.1 8.0 25.5 1.6 10.0 0.5 7.8 1.1
Generally, the same patterns were seen when women’s education was examined separately. This is illustrated in Table 11.
Table 11. Literacy and schooling of adult women in Sudan (percent) Highest level of school attended Able to
read and write
Pre-school/ kinder garten
Primary Interme
diate Second
ary
Post seconda
ry Diploma
University
Higher Non-
standard
Adult educa-
tion
Rest of Sudan
47.3 0.0 45.7 6.3 27.0 1.5 13.2 0.3 4.4 1.6
Greater Darfur
29.1 0.4 52.1 4.4 30.8 0.5 8.3 0.6 1.9 0.9
Southern Sudan
9.6 3.7 73.8 5.3 13.2 1.0 0.8 0.4 0.9 1.0
Sudan- Overall
32.1 0.4 49.2 6.0 25.9 1.4 11.5 0.3 3.8 1.5
Table 12 details current net attendance rates among school age children (6-13). Overall, 55.7 percent of children were currently attending school at the time of the survey. Net attendance varied substantially by region: Southern Sudan has the lowest attendance rate (15.8 percent). Attendance rate in Greater Darfur is much higher at 56.3 percent. ROS had the highest rate at 72.5 percent.
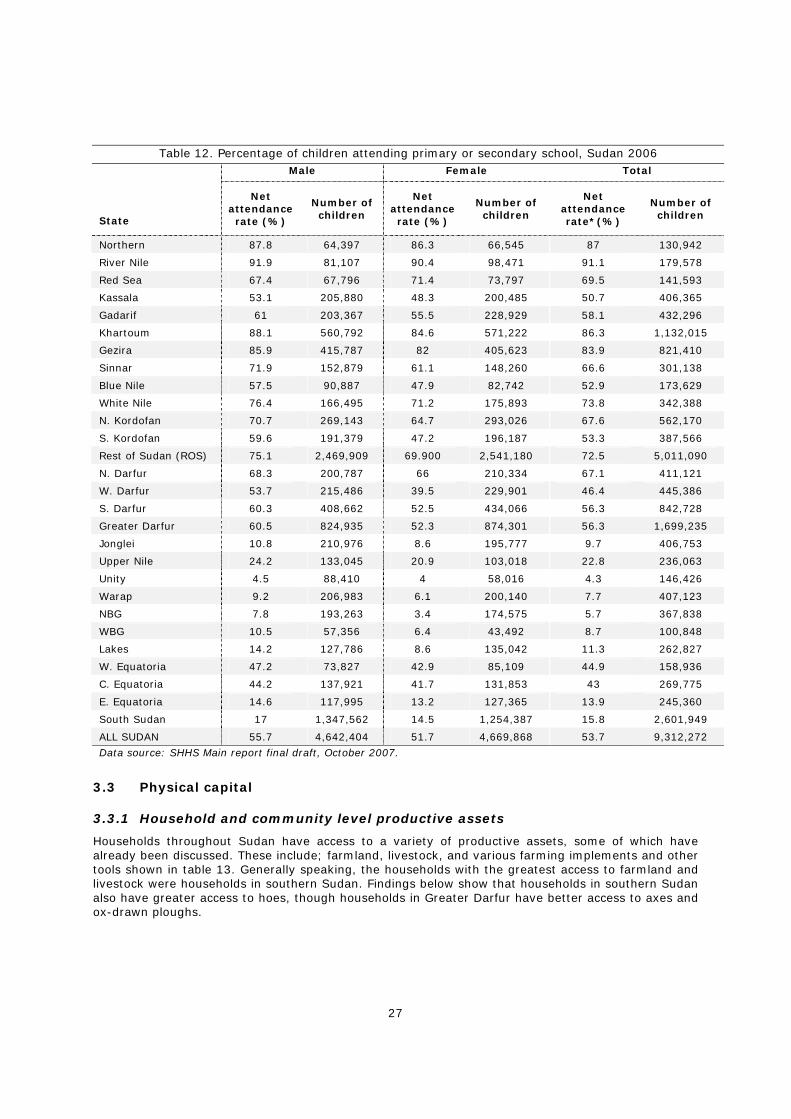
27
Table 12. Percentage of children attending primary or secondary school, Sudan 2006
Male Female Total
State
Net attendance rate (%)
Number of children
Net attendance rate (%)
Number of children
Net attendance rate*(%)
Number of children
Northern 87.8 64,397 86.3 66,545 87 130,942
River Nile 91.9 81,107 90.4 98,471 91.1 179,578
Red Sea 67.4 67,796 71.4 73,797 69.5 141,593
Kassala 53.1 205,880 48.3 200,485 50.7 406,365
Gadarif 61 203,367 55.5 228,929 58.1 432,296
Khartoum 88.1 560,792 84.6 571,222 86.3 1,132,015
Gezira 85.9 415,787 82 405,623 83.9 821,410
Sinnar 71.9 152,879 61.1 148,260 66.6 301,138
Blue Nile 57.5 90,887 47.9 82,742 52.9 173,629
White Nile 76.4 166,495 71.2 175,893 73.8 342,388
N. Kordofan 70.7 269,143 64.7 293,026 67.6 562,170
S. Kordofan 59.6 191,379 47.2 196,187 53.3 387,566
Rest of Sudan (ROS) 75.1 2,469,909 69.900 2,541,180 72.5 5,011,090
N. Darfur 68.3 200,787 66 210,334 67.1 411,121
W. Darfur 53.7 215,486 39.5 229,901 46.4 445,386
S. Darfur 60.3 408,662 52.5 434,066 56.3 842,728
Greater Darfur 60.5 824,935 52.3 874,301 56.3 1,699,235
Jonglei 10.8 210,976 8.6 195,777 9.7 406,753
Upper Nile 24.2 133,045 20.9 103,018 22.8 236,063
Unity 4.5 88,410 4 58,016 4.3 146,426
Warap 9.2 206,983 6.1 200,140 7.7 407,123
NBG 7.8 193,263 3.4 174,575 5.7 367,838
WBG 10.5 57,356 6.4 43,492 8.7 100,848
Lakes 14.2 127,786 8.6 135,042 11.3 262,827
W. Equatoria 47.2 73,827 42.9 85,109 44.9 158,936
C. Equatoria 44.2 137,921 41.7 131,853 43 269,775
E. Equatoria 14.6 117,995 13.2 127,365 13.9 245,360
South Sudan 17 1,347,562 14.5 1,254,387 15.8 2,601,949
ALL SUDAN 55.7 4,642,404 51.7 4,669,868 53.7 9,312,272
Data source: SHHS Main report final draft, October 2007.
3.3 Physical capital
3.3.1 Household and community level productive assets
Households throughout Sudan have access to a variety of productive assets, some of which have already been discussed. These include; farmland, livestock, and various farming implements and other tools shown in table 13. Generally speaking, the households with the greatest access to farmland and livestock were households in southern Sudan. Findings below show that households in southern Sudan also have greater access to hoes, though households in Greater Darfur have better access to axes and ox-drawn ploughs.
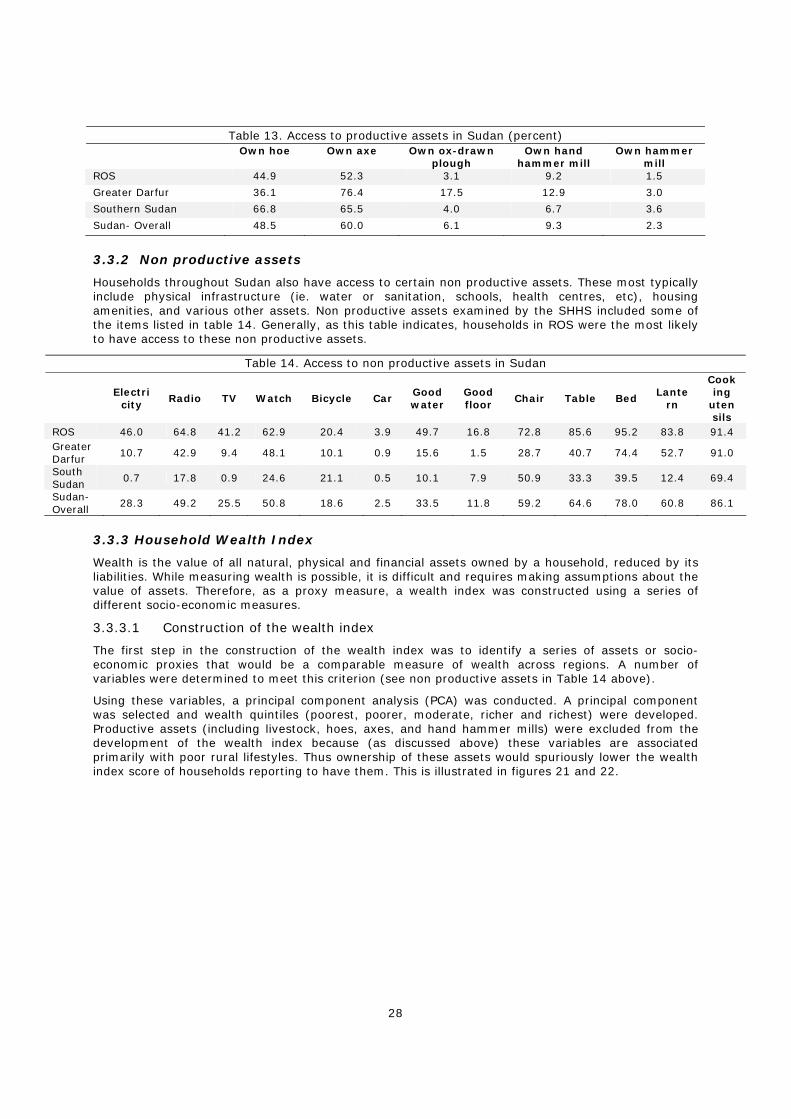
28
Table 13. Access to productive assets in Sudan (percent) Own hoe Own axe Own ox-drawn
plough Own hand
hammer mill Own hammer
mill ROS 44.9 52.3 3.1 9.2 1.5
Greater Darfur 36.1 76.4 17.5 12.9 3.0
Southern Sudan 66.8 65.5 4.0 6.7 3.6
Sudan- Overall 48.5 60.0 6.1 9.3 2.3
3.3.2 Non productive assets
Households throughout Sudan also have access to certain non productive assets. These most typically include physical infrastructure (ie. water or sanitation, schools, health centres, etc), housing amenities, and various other assets. Non productive assets examined by the SHHS included some of the items listed in table 14. Generally, as this table indicates, households in ROS were the most likely to have access to these non productive assets.
3.3.3 Household Wealth Index
Wealth is the value of all natural, physical and financial assets owned by a household, reduced by its liabilities. While measuring wealth is possible, it is difficult and requires making assumptions about the value of assets. Therefore, as a proxy measure, a wealth index was constructed using a series of different socio-economic measures.
3.3.3.1 Construction of the wealth index
The first step in the construction of the wealth index was to identify a series of assets or socio-economic proxies that would be a comparable measure of wealth across regions. A number of variables were determined to meet this criterion (see non productive assets in Table 14 above).
Using these variables, a principal component analysis (PCA) was conducted. A principal component was selected and wealth quintiles (poorest, poorer, moderate, richer and richest) were developed. Productive assets (including livestock, hoes, axes, and hand hammer mills) were excluded from the development of the wealth index because (as discussed above) these variables are associated primarily with poor rural lifestyles. Thus ownership of these assets would spuriously lower the wealth index score of households reporting to have them. This is illustrated in figures 21 and 22.
Table 14. Access to non productive assets in Sudan
Electricity
Radio TV Watch Bicycle Car Good water
Good floor
Chair Table Bed Lante
rn
Cook ing
uten sils
ROS 46.0 64.8 41.2 62.9 20.4 3.9 49.7 16.8 72.8 85.6 95.2 83.8 91.4 Greater Darfur
10.7 42.9 9.4 48.1 10.1 0.9 15.6 1.5 28.7 40.7 74.4 52.7 91.0
South Sudan
0.7 17.8 0.9 24.6 21.1 0.5 10.1 7.9 50.9 33.3 39.5 12.4 69.4
Sudan- Overall
28.3 49.2 25.5 50.8 18.6 2.5 33.5 11.8 59.2 64.6 78.0 60.8 86.1
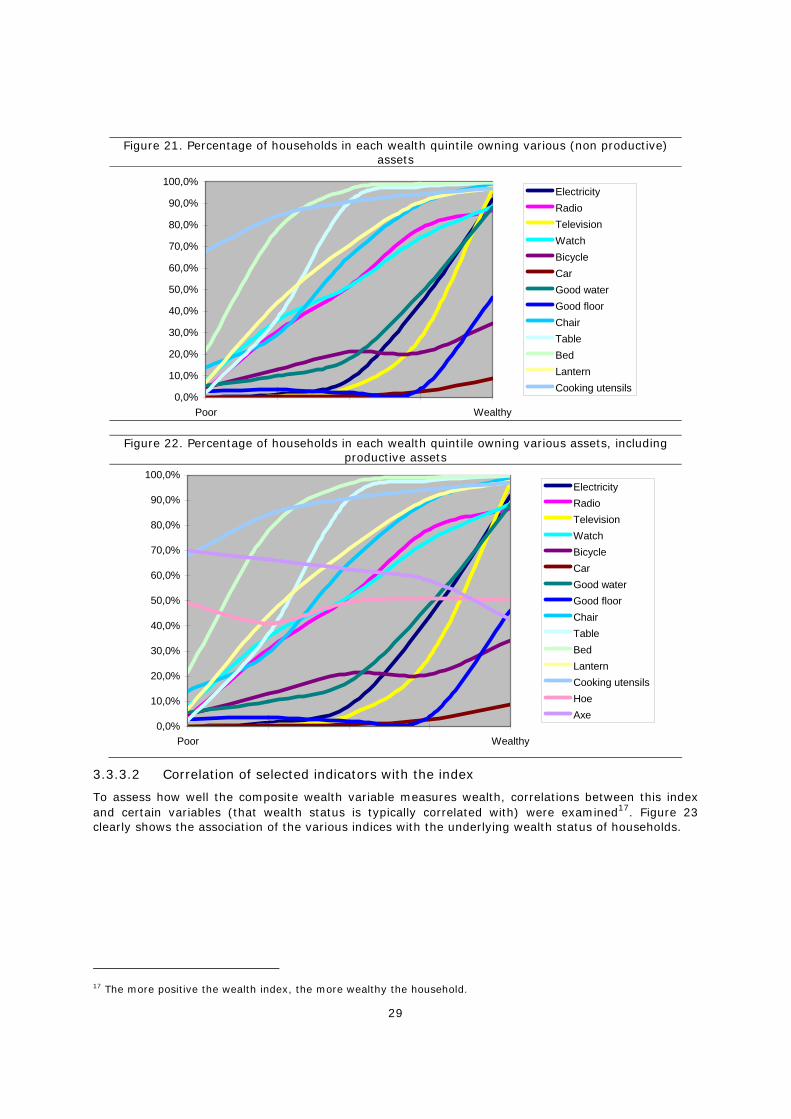
29
Figure 21. Percentage of households in each wealth quintile owning various (non productive)
assets
0,0%
10,0%
20,0%
30,0%
40,0%
50,0%
60,0%
70,0%
80,0%
90,0%
100,0%
Poor Wealthy
ElectricityRadioTelevisionWatchBicycleCarGood waterGood floorChairTableBedLanternCooking utensils
Figure 22. Percentage of households in each wealth quintile owning various assets, including productive assets
0,0%
10,0%
20,0%
30,0%
40,0%
50,0%
60,0%
70,0%
80,0%
90,0%
100,0%
Poor Wealthy
ElectricityRadioTelevisionWatchBicycleCarGood waterGood floorChairTableBedLanternCooking utensilsHoeAxe
3.3.3.2 Correlation of selected indicators with the index
To assess how well the composite wealth variable measures wealth, correlations between this index and certain variables (that wealth status is typically correlated with) were examined17. Figure 23 clearly shows the association of the various indices with the underlying wealth status of households.
17 The more positive the wealth index, the more wealthy the household.
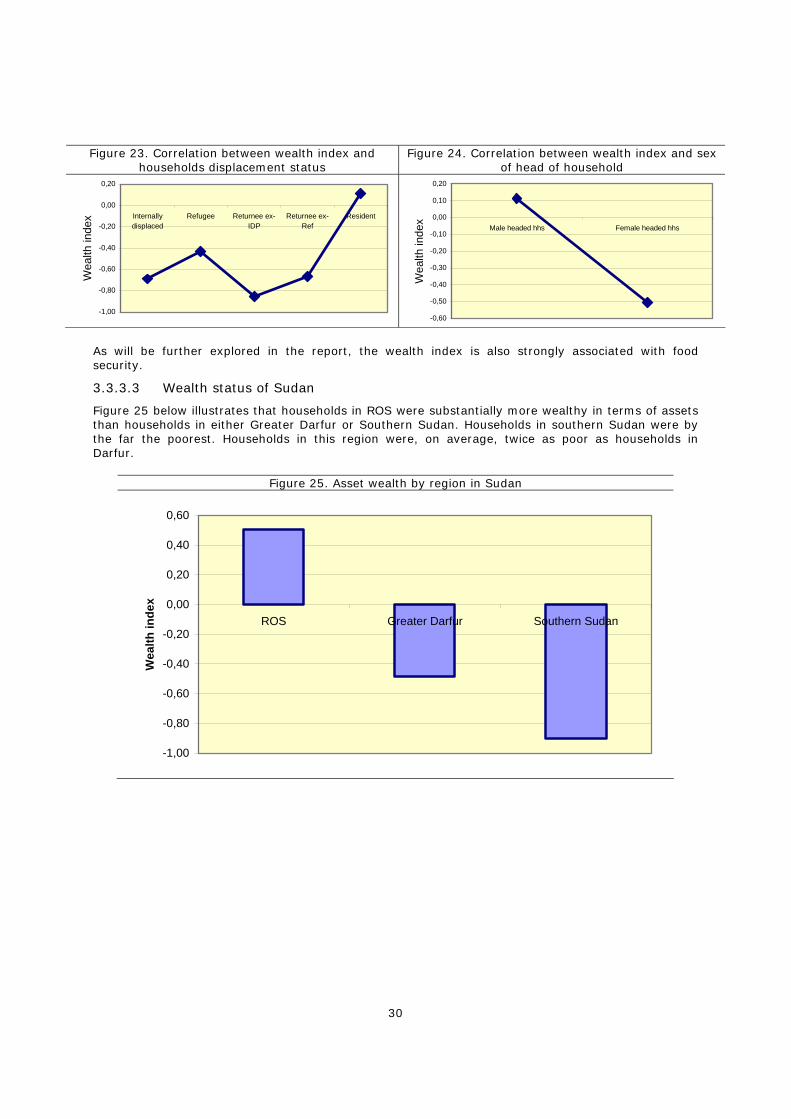
30
Figure 23. Correlation between wealth index and households displacement status
Figure 24. Correlation between wealth index and sex of head of household
-1,00
-0,80
-0,60
-0,40
-0,20
0,00
0,20
Internallydisplaced
Refugee Returnee ex-IDP
Returnee ex-Ref
Resident
Wea
lth in
dex
-0,60
-0,50
-0,40
-0,30
-0,20
-0,10
0,00
0,10
0,20
Male headed hhs Female headed hhs
Wea
lth in
dex
As will be further explored in the report, the wealth index is also strongly associated with food security.
3.3.3.3 Wealth status of Sudan
Figure 25 below illustrates that households in ROS were substantially more wealthy in terms of assets than households in either Greater Darfur or Southern Sudan. Households in southern Sudan were by the far the poorest. Households in this region were, on average, twice as poor as households in Darfur.
Figure 25. Asset wealth by region in Sudan
-1,00
-0,80
-0,60
-0,40
-0,20
0,00
0,20
0,40
0,60
ROS Greater Darfur Southern Sudan
Wea
lth in
dex
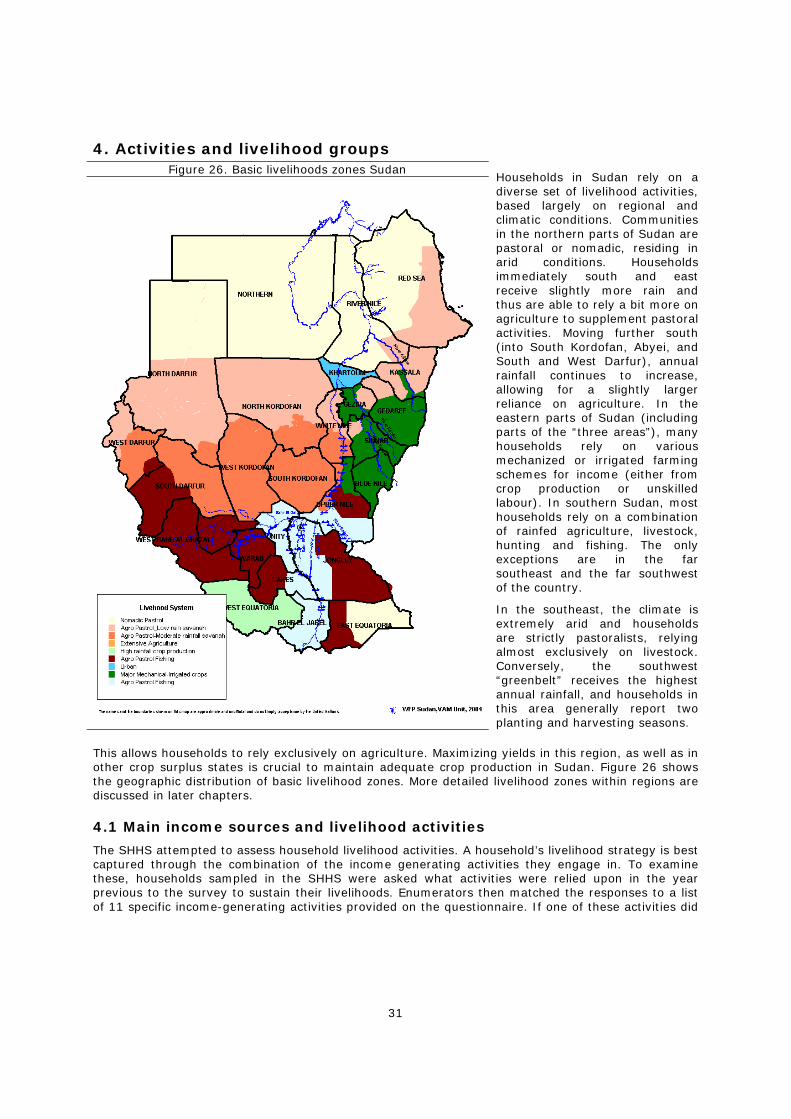
31
4. Activities and livelihood groups Figure 26. Basic livelihoods zones Sudan
Households in Sudan rely on a diverse set of livelihood activities, based largely on regional and climatic conditions. Communities in the northern parts of Sudan are pastoral or nomadic, residing in arid conditions. Households immediately south and east receive slightly more rain and thus are able to rely a bit more on agriculture to supplement pastoral activities. Moving further south (into South Kordofan, Abyei, and South and West Darfur), annual rainfall continues to increase, allowing for a slightly larger reliance on agriculture. In the eastern parts of Sudan (including parts of the “three areas”), many households rely on various mechanized or irrigated farming schemes for income (either from crop production or unskilled labour). In southern Sudan, most households rely on a combination of rainfed agriculture, livestock, hunting and fishing. The only exceptions are in the far southeast and the far southwest of the country.
In the southeast, the climate is extremely arid and households are strictly pastoralists, relying almost exclusively on livestock. Conversely, the southwest “greenbelt” receives the highest annual rainfall, and households in this area generally report two planting and harvesting seasons.
This allows households to rely exclusively on agriculture. Maximizing yields in this region, as well as in other crop surplus states is crucial to maintain adequate crop production in Sudan. Figure 26 shows the geographic distribution of basic livelihood zones. More detailed livelihood zones within regions are discussed in later chapters.
4.1 Main income sources and livelihood activities
The SHHS attempted to assess household livelihood activities. A household’s livelihood strategy is best captured through the combination of the income generating activities they engage in. To examine these, households sampled in the SHHS were asked what activities were relied upon in the year previous to the survey to sustain their livelihoods. Enumerators then matched the responses to a list of 11 specific income-generating activities provided on the questionnaire. If one of these activities did
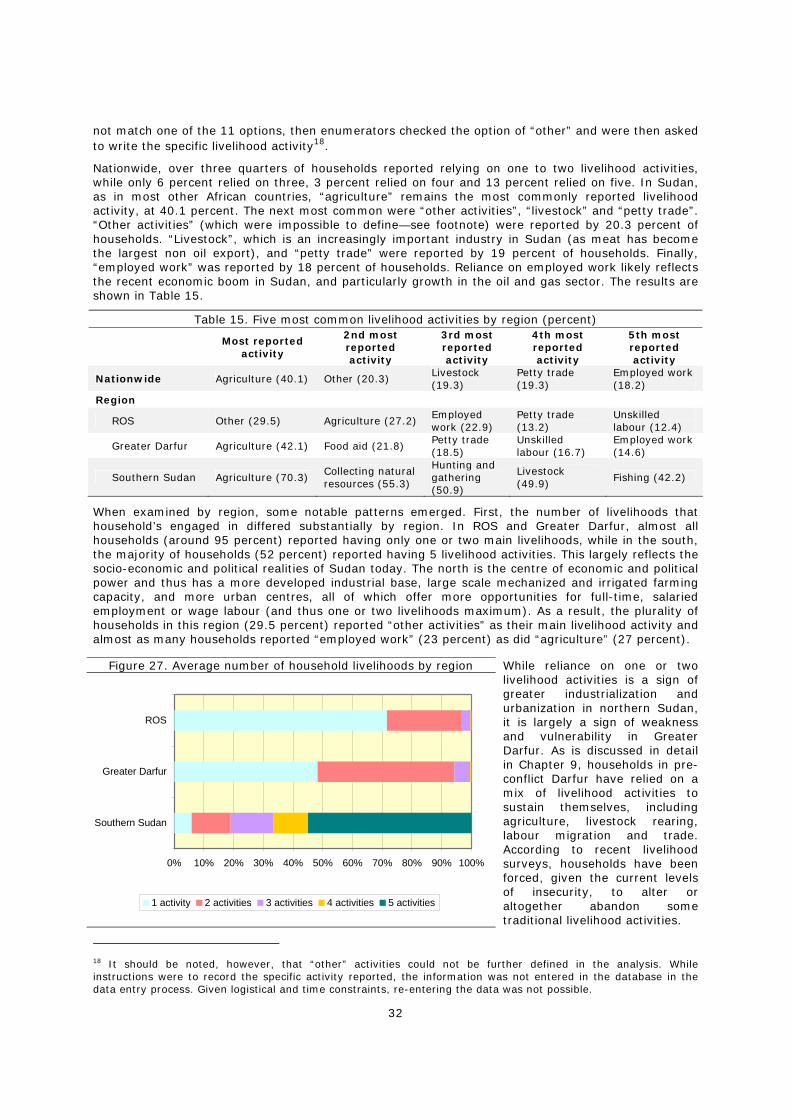
32
not match one of the 11 options, then enumerators checked the option of “other” and were then asked to write the specific livelihood activity18.
Nationwide, over three quarters of households reported relying on one to two livelihood activities, while only 6 percent relied on three, 3 percent relied on four and 13 percent relied on five. In Sudan, as in most other African countries, “agriculture” remains the most commonly reported livelihood activity, at 40.1 percent. The next most common were “other activities”, “livestock” and “petty trade”. “Other activities” (which were impossible to define—see footnote) were reported by 20.3 percent of households. “Livestock”, which is an increasingly important industry in Sudan (as meat has become the largest non oil export), and “petty trade” were reported by 19 percent of households. Finally, “employed work” was reported by 18 percent of households. Reliance on employed work likely reflects the recent economic boom in Sudan, and particularly growth in the oil and gas sector. The results are shown in Table 15.
Table 15. Five most common livelihood activities by region (percent)
Most reported
activity
2nd most reported activity
3rd most reported activity
4th most reported activity
5th most reported activity
Nationwide Agriculture (40.1) Other (20.3) Livestock (19.3)
Petty trade (19.3)
Employed work (18.2)
Region
ROS Other (29.5) Agriculture (27.2) Employed work (22.9)
Petty trade (13.2)
Unskilled labour (12.4)
Greater Darfur Agriculture (42.1) Food aid (21.8) Petty trade (18.5)
Unskilled labour (16.7)
Employed work (14.6)
Southern Sudan Agriculture (70.3) Collecting natural resources (55.3)
Hunting and gathering (50.9)
Livestock (49.9)
Fishing (42.2)
When examined by region, some notable patterns emerged. First, the number of livelihoods that household’s engaged in differed substantially by region. In ROS and Greater Darfur, almost all households (around 95 percent) reported having only one or two main livelihoods, while in the south, the majority of households (52 percent) reported having 5 livelihood activities. This largely reflects the socio-economic and political realities of Sudan today. The north is the centre of economic and political power and thus has a more developed industrial base, large scale mechanized and irrigated farming capacity, and more urban centres, all of which offer more opportunities for full-time, salaried employment or wage labour (and thus one or two livelihoods maximum). As a result, the plurality of households in this region (29.5 percent) reported “other activities” as their main livelihood activity and almost as many households reported “employed work” (23 percent) as did “agriculture” (27 percent).
Figure 27. Average number of household livelihoods by region
0% 10% 20% 30% 40% 50% 60% 70% 80% 90% 100%
Southern Sudan
Greater Darfur
ROS
1 activity 2 activities 3 activities 4 activities 5 activities
While reliance on one or two livelihood activities is a sign of greater industrialization and urbanization in northern Sudan, it is largely a sign of weakness and vulnerability in Greater Darfur. As is discussed in detail in Chapter 9, households in pre-conflict Darfur have relied on a mix of livelihood activities to sustain themselves, including agriculture, livestock rearing, labour migration and trade. According to recent livelihood surveys, households have been forced, given the current levels of insecurity, to alter or altogether abandon some traditional livelihood activities.
18 It should be noted, however, that “other” activities could not be further defined in the analysis. While instructions were to record the specific activity reported, the information was not entered in the database in the data entry process. Given logistical and time constraints, re-entering the data was not possible.
33
Data from the SHHS appears to support this finding, with almost 50 percent of households now relying on only one livelihood activity and over 90 percent of households relying on either one or two livelihoods. Despite this however, the SHHS does indicate that “agriculture” remains the most commonly reported livelihood activity, with over 40 percent of households engaging in it to various degrees. While it is encouraging that agricultural production is continuing, this is likely not as positive as it might appear. A 2006 comprehensive livelihoods assessment indicated that, while yields improved from 2005 to 2006, farmers continue to utilize only a portion of their farmland (fearing to stray too far from home) and many are forced to farm in more difficult, less productive areas (given the large destruction of existing agriculture infrastructure). Thus, it is likely that agricultural yields remain compromised and there are fewer secondary or tertiary income sources to fall back on.
The second most commonly reported livelihood activity in Darfur was “food aid assistance” with over 20 percent of households relying on this to some degree. Ten percent of households reported “food aid assistance” as their main livelihood source. Other commonly reported livelihood activities included: “petty trade”, “unskilled labour” or “employed work”. This reflects further livelihood changes identified by the 2006 livelihood assessment, which found that in insecure areas people are beginning to embrace non traditional livelihoods (i.e. petty trading, brick making, gathering of grass, etc) to sustain themselves during difficult times.
Findings from southern Sudan differed substantially from findings in the rest of Sudan. Here, households make their living out of a combination of farming and non-farming activities, including hunting, gathering and petty trade. The most common livelihoods reported included “agriculture” or “collection of natural resources” (70 percent and 55 percent of households). “Hunting and gathering”, “livestock” and “fishing” were also commonly reported with 51 percent, 50 percent and 42 percent of households reporting these activities. Being able to rely on multiple sources of income is, on one hand, an indication of the resource-wealth in the south, but with little “employed work” or “skilled labour” it is also a sign of the household poverty and underdevelopment that exists. It should be noted too that 15 percent of households in the south reported having no main livelihood activity at all.
4.2 Household Livelihood profiles
One of the objectives of the CFSVA is to describe household food insecurity and vulnerability on the basis of household characteristics. Household livelihood strategies have a direct impact on food access and food security. The goal of livelihood profiling is to use cluster analysis to group households that are engaged in the same activities or combination of activities.
To create profiles, the income generating activities reported by households were assessed, taking account of the percentage of household income derived from each. It should be noted that households were not asked what percentage of income was derived from each reported activity. To remedy this, the percentage that each activity contributed to household income was approximated based on the number of total activities, as follows:
• 1 activity: 100 percent
• 2 activities: 1st 66 percent; 2nd 33 percent
• 3 activities: 1st 57 percent; 2nd 29 percent; 3rd 14 percent
• 4 activities: 1st 53 percent; 2nd 27 percent; 3rd 13 percent; 4th 6 percent
• 5 activities: 1st 52 percent; 2nd 26 percent; 3rd 13 percent; 4th 6 percent; 5th 3 percent
Based on these assumptions, 12 new variables were created, one for each livelihood activity. The new variables were then was used in the cluster analysis (preceded by principal component analysis) and eleven livelihood profiles were detected based on the CFSVA data. Table 16 shows the livelihood profiles created and provides a brief description of the classes/ profiles.
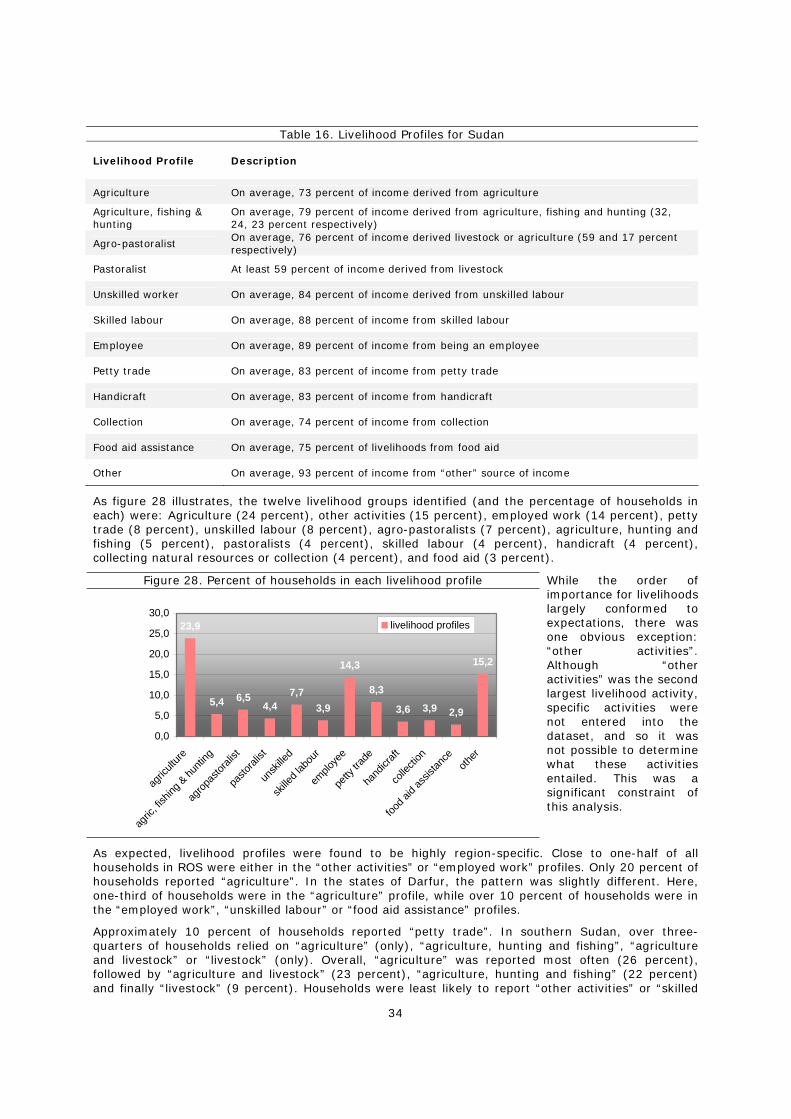
34
Table 16. Livelihood Profiles for Sudan
Livelihood Profile Description
Agriculture On average, 73 percent of income derived from agriculture
Agriculture, fishing & hunting
On average, 79 percent of income derived from agriculture, fishing and hunting (32, 24, 23 percent respectively)
Agro-pastoralist On average, 76 percent of income derived livestock or agriculture (59 and 17 percent respectively)
Pastoralist At least 59 percent of income derived from livestock
Unskilled worker On average, 84 percent of income derived from unskilled labour
Skilled labour On average, 88 percent of income from skilled labour
Employee On average, 89 percent of income from being an employee
Petty trade On average, 83 percent of income from petty trade
Handicraft On average, 83 percent of income from handicraft
Collection On average, 74 percent of income from collection
Food aid assistance On average, 75 percent of livelihoods from food aid
Other On average, 93 percent of income from “other” source of income
As figure 28 illustrates, the twelve livelihood groups identified (and the percentage of households in each) were: Agriculture (24 percent), other activities (15 percent), employed work (14 percent), petty trade (8 percent), unskilled labour (8 percent), agro-pastoralists (7 percent), agriculture, hunting and fishing (5 percent), pastoralists (4 percent), skilled labour (4 percent), handicraft (4 percent), collecting natural resources or collection (4 percent), and food aid (3 percent).
Figure 28. Percent of households in each livelihood profile
23,9
5,4 6,54,4
7,73,9
14,3
8,3
3,6 3,9 2,9
15,2
0,0
5,0
10,0
15,0
20,0
25,0
30,0
agric
ulture
agric
, fish
ing &
hunti
ng
agrop
astor
alist
pasto
ralist
unsk
illed
skille
d lab
our
emplo
yee
petty
trade
hand
icraft
colle
ction
food a
id as
sistan
ceoth
er
livelihood profiles
While the order of importance for livelihoods largely conformed to expectations, there was one obvious exception: “other activities”. Although “other activities” was the second largest livelihood activity, specific activities were not entered into the dataset, and so it was not possible to determine what these activities entailed. This was a significant constraint of this analysis.
As expected, livelihood profiles were found to be highly region-specific. Close to one-half of all households in ROS were either in the “other activities” or “employed work” profiles. Only 20 percent of households reported “agriculture”. In the states of Darfur, the pattern was slightly different. Here, one-third of households were in the “agriculture” profile, while over 10 percent of households were in the “employed work”, “unskilled labour” or “food aid assistance” profiles.
Approximately 10 percent of households reported “petty trade”. In southern Sudan, over three-quarters of households relied on “agriculture” (only), “agriculture, hunting and fishing”, “agriculture and livestock” or “livestock” (only). Overall, “agriculture” was reported most often (26 percent), followed by “agriculture and livestock” (23 percent), “agriculture, hunting and fishing” (22 percent) and finally “livestock” (9 percent). Households were least likely to report “other activities” or “skilled
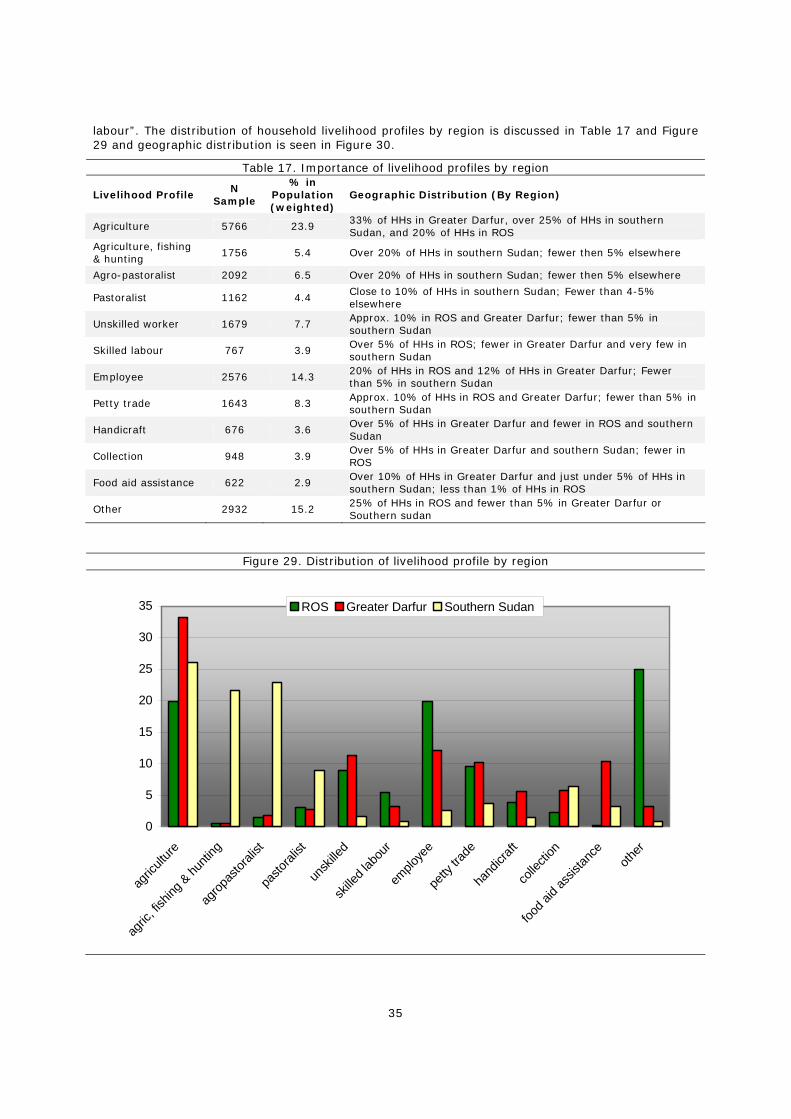
35
labour”. The distribution of household livelihood profiles by region is discussed in Table 17 and Figure 29 and geographic distribution is seen in Figure 30.
Table 17. Importance of livelihood profiles by region
Livelihood Profile N
Sample
% in Population (weighted)
Geographic Distribution (By Region)
Agriculture 5766 23.9 33% of HHs in Greater Darfur, over 25% of HHs in southern Sudan, and 20% of HHs in ROS
Agriculture, fishing & hunting
1756 5.4 Over 20% of HHs in southern Sudan; fewer then 5% elsewhere
Agro-pastoralist 2092 6.5 Over 20% of HHs in southern Sudan; fewer then 5% elsewhere
Pastoralist 1162 4.4 Close to 10% of HHs in southern Sudan; Fewer than 4-5% elsewhere
Unskilled worker 1679 7.7 Approx. 10% in ROS and Greater Darfur; fewer than 5% in southern Sudan
Skilled labour 767 3.9 Over 5% of HHs in ROS; fewer in Greater Darfur and very few in southern Sudan
Employee 2576 14.3 20% of HHs in ROS and 12% of HHs in Greater Darfur; Fewer than 5% in southern Sudan
Petty trade 1643 8.3 Approx. 10% of HHs in ROS and Greater Darfur; fewer than 5% in southern Sudan
Handicraft 676 3.6 Over 5% of HHs in Greater Darfur and fewer in ROS and southern Sudan
Collection 948 3.9 Over 5% of HHs in Greater Darfur and southern Sudan; fewer in ROS
Food aid assistance 622 2.9 Over 10% of HHs in Greater Darfur and just under 5% of HHs in southern Sudan; less than 1% of HHs in ROS
Other 2932 15.2 25% of HHs in ROS and fewer than 5% in Greater Darfur or Southern sudan
Figure 29. Distribution of livelihood profile by region
0
5
10
15
20
25
30
35
agric
ulture
agric
, fish
ing &
hunti
ng
agrop
astor
alist
pasto
ralist
unsk
illed
skille
d lab
our
emplo
yee
petty
trade
hand
icraft
colle
ction
food a
id as
sistan
ceoth
er
ROS Greater Darfur Southern Sudan
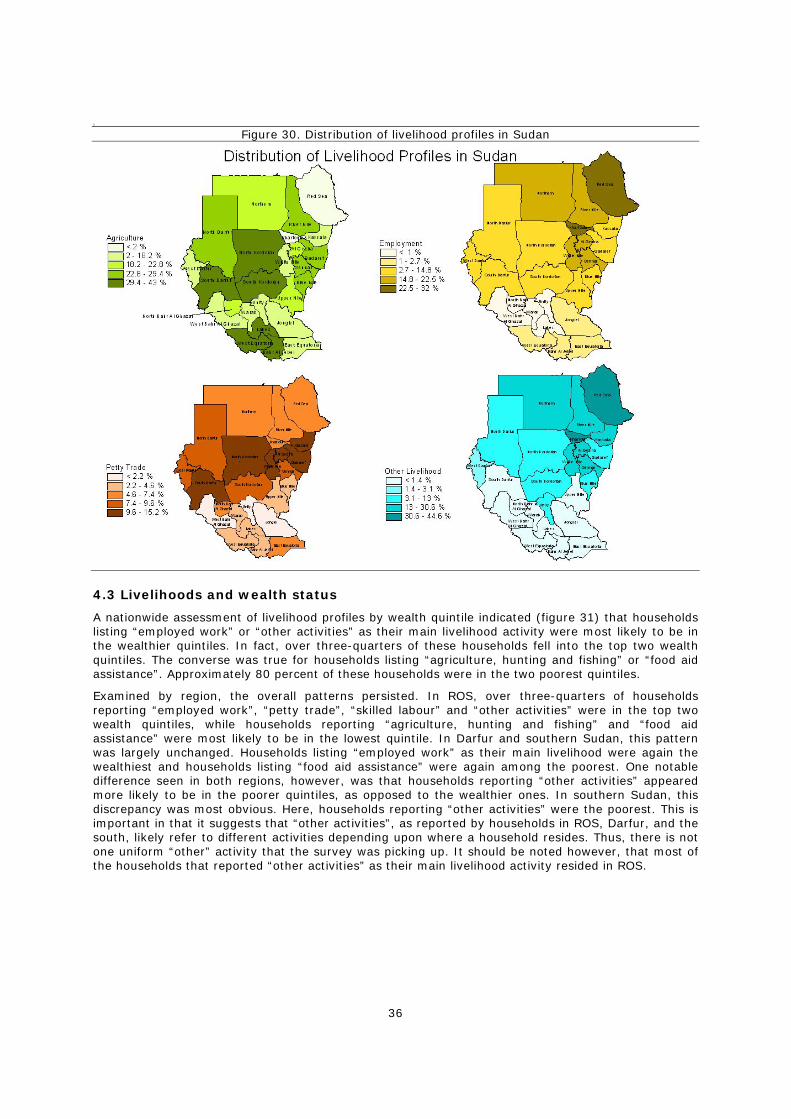
36
3
Figure 30. Distribution of livelihood profiles in Sudan
4.3 Livelihoods and wealth status
A nationwide assessment of livelihood profiles by wealth quintile indicated (figure 31) that households listing “employed work” or “other activities” as their main livelihood activity were most likely to be in the wealthier quintiles. In fact, over three-quarters of these households fell into the top two wealth quintiles. The converse was true for households listing “agriculture, hunting and fishing” or “food aid assistance”. Approximately 80 percent of these households were in the two poorest quintiles.
Examined by region, the overall patterns persisted. In ROS, over three-quarters of households reporting “employed work”, “petty trade”, “skilled labour” and “other activities” were in the top two wealth quintiles, while households reporting “agriculture, hunting and fishing” and “food aid assistance” were most likely to be in the lowest quintile. In Darfur and southern Sudan, this pattern was largely unchanged. Households listing “employed work” as their main livelihood were again the wealthiest and households listing “food aid assistance” were again among the poorest. One notable difference seen in both regions, however, was that households reporting “other activities” appeared more likely to be in the poorer quintiles, as opposed to the wealthier ones. In southern Sudan, this discrepancy was most obvious. Here, households reporting “other activities” were the poorest. This is important in that it suggests that “other activities”, as reported by households in ROS, Darfur, and the south, likely refer to different activities depending upon where a household resides. Thus, there is not one uniform “other” activity that the survey was picking up. It should be noted however, that most of the households that reported “other activities” as their main livelihood activity resided in ROS.
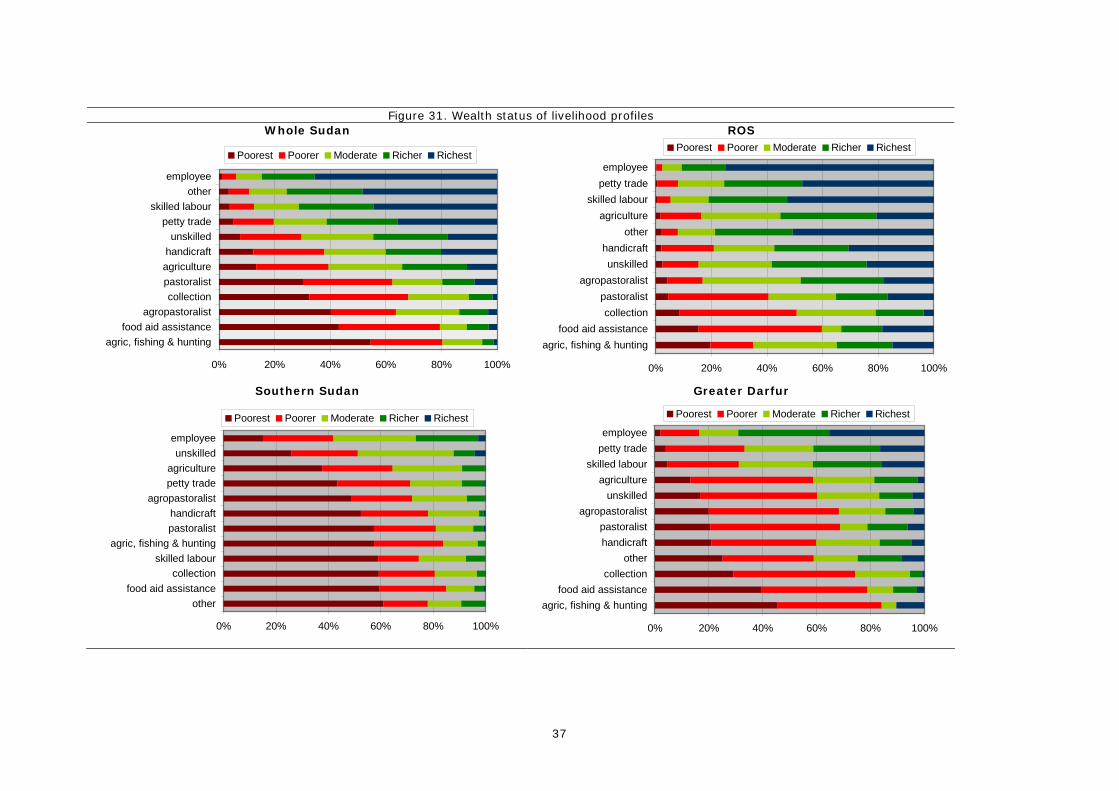
37
Figure 31. Wealth status of livelihood profiles
Whole Sudan ROS
0% 20% 40% 60% 80% 100%
agric, fishing & huntingfood aid assistance
agropastoralistcollection
pastoralistagriculturehandicraftunskilled
petty tradeskilled labour
otheremployee
Poorest Poorer Moderate Richer Richest
0% 20% 40% 60% 80% 100%
agric, fishing & huntingfood aid assistance
collectionpastoralist
agropastoralistunskilled
handicraftother
agricultureskilled labour
petty tradeemployee
Poorest Poorer Moderate Richer Richest
Southern Sudan Greater Darfur
0% 20% 40% 60% 80% 100%
otherfood aid assistance
collectionskilled labour
agric, fishing & huntingpastoralisthandicraft
agropastoralistpetty tradeagriculture
unskilledemployee
Poorest Poorer Moderate Richer Richest
0% 20% 40% 60% 80% 100%
agric, fishing & huntingfood aid assistance
collectionother
handicraftpastoralist
agropastoralistunskilled
agricultureskilled labour
petty tradeemployee
Poorest Poorer Moderate Richer Richest
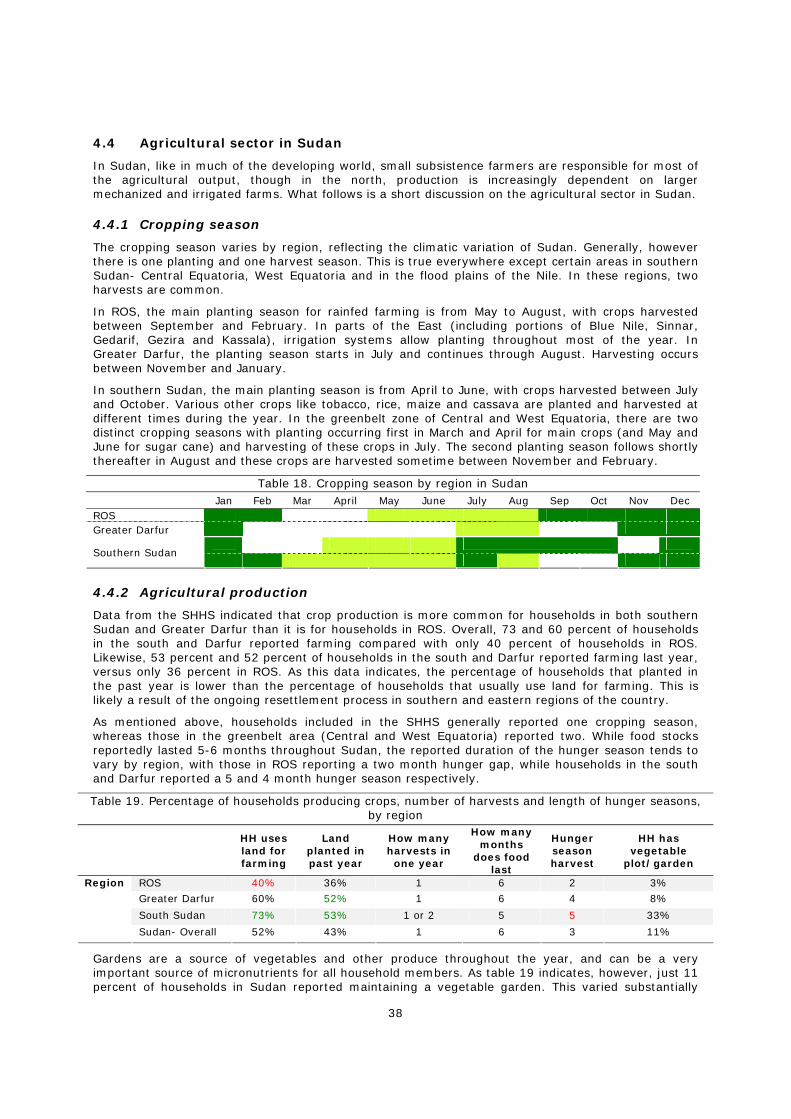
38
4.4 Agricultural sector in Sudan
In Sudan, like in much of the developing world, small subsistence farmers are responsible for most of the agricultural output, though in the north, production is increasingly dependent on larger mechanized and irrigated farms. What follows is a short discussion on the agricultural sector in Sudan.
4.4.1 Cropping season
The cropping season varies by region, reflecting the climatic variation of Sudan. Generally, however there is one planting and one harvest season. This is true everywhere except certain areas in southern Sudan- Central Equatoria, West Equatoria and in the flood plains of the Nile. In these regions, two harvests are common.
In ROS, the main planting season for rainfed farming is from May to August, with crops harvested between September and February. In parts of the East (including portions of Blue Nile, Sinnar, Gedarif, Gezira and Kassala), irrigation systems allow planting throughout most of the year. In Greater Darfur, the planting season starts in July and continues through August. Harvesting occurs between November and January.
In southern Sudan, the main planting season is from April to June, with crops harvested between July and October. Various other crops like tobacco, rice, maize and cassava are planted and harvested at different times during the year. In the greenbelt zone of Central and West Equatoria, there are two distinct cropping seasons with planting occurring first in March and April for main crops (and May and June for sugar cane) and harvesting of these crops in July. The second planting season follows shortly thereafter in August and these crops are harvested sometime between November and February.
Table 18. Cropping season by region in Sudan Jan Feb Mar April May June July Aug Sep Oct Nov Dec
ROS Greater Darfur
Southern Sudan
4.4.2 Agricultural production
Data from the SHHS indicated that crop production is more common for households in both southern Sudan and Greater Darfur than it is for households in ROS. Overall, 73 and 60 percent of households in the south and Darfur reported farming compared with only 40 percent of households in ROS. Likewise, 53 percent and 52 percent of households in the south and Darfur reported farming last year, versus only 36 percent in ROS. As this data indicates, the percentage of households that planted in the past year is lower than the percentage of households that usually use land for farming. This is likely a result of the ongoing resettlement process in southern and eastern regions of the country.
As mentioned above, households included in the SHHS generally reported one cropping season, whereas those in the greenbelt area (Central and West Equatoria) reported two. While food stocks reportedly lasted 5-6 months throughout Sudan, the reported duration of the hunger season tends to vary by region, with those in ROS reporting a two month hunger gap, while households in the south and Darfur reported a 5 and 4 month hunger season respectively.
Table 19. Percentage of households producing crops, number of harvests and length of hunger seasons, by region
HH uses land for farming
Land planted in past year
How many harvests in one year
How many months
does food last
Hunger season harvest
HH has vegetable
plot/garden
ROS 40% 36% 1 6 2 3%
Greater Darfur 60% 52% 1 6 4 8%
South Sudan 73% 53% 1 or 2 5 5 33%
Region
Sudan- Overall 52% 43% 1 6 3 11%
Gardens are a source of vegetables and other produce throughout the year, and can be a very important source of micronutrients for all household members. As table 19 indicates, however, just 11 percent of households in Sudan reported maintaining a vegetable garden. This varied substantially
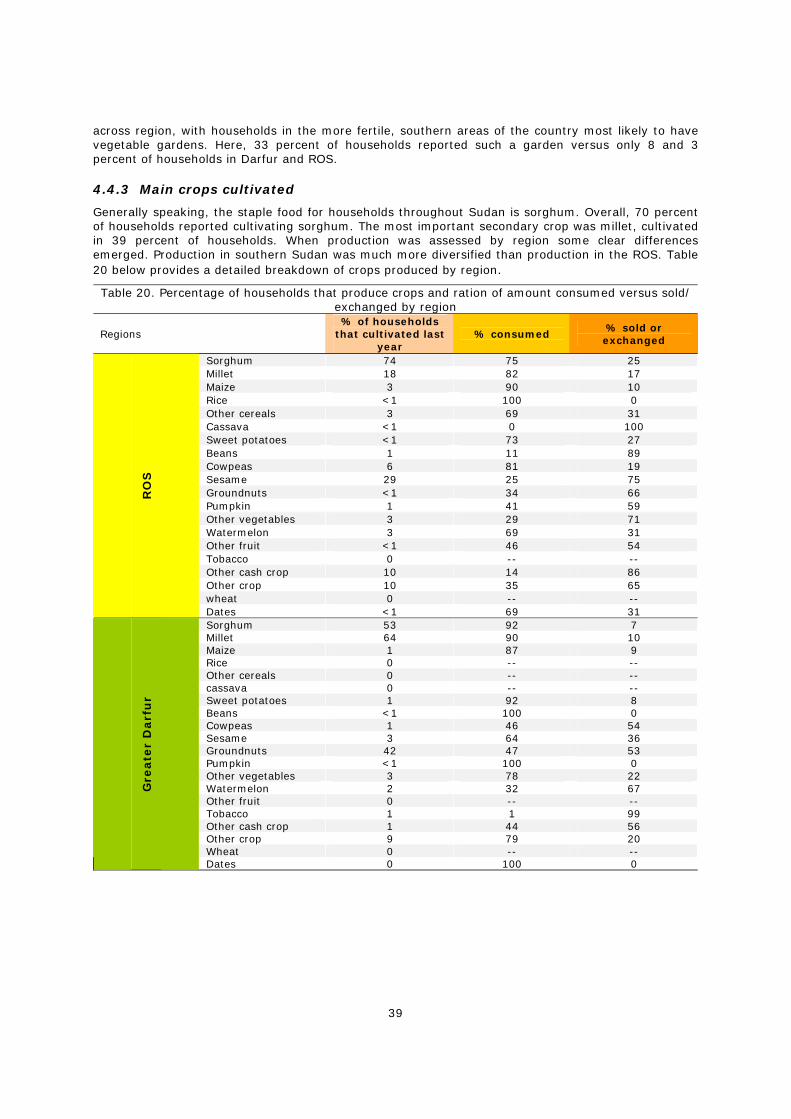
39
across region, with households in the more fertile, southern areas of the country most likely to have vegetable gardens. Here, 33 percent of households reported such a garden versus only 8 and 3 percent of households in Darfur and ROS.
4.4.3 Main crops cultivated
Generally speaking, the staple food for households throughout Sudan is sorghum. Overall, 70 percent of households reported cultivating sorghum. The most important secondary crop was millet, cultivated in 39 percent of households. When production was assessed by region some clear differences emerged. Production in southern Sudan was much more diversified than production in the ROS. Table 20 below provides a detailed breakdown of crops produced by region.
Table 20. Percentage of households that produce crops and ration of amount consumed versus sold/ exchanged by region
Regions % of households
that cultivated last year
% consumed % sold or exchanged
Sorghum 74 75 25 Millet 18 82 17 Maize 3 90 10 Rice <1 100 0 Other cereals 3 69 31 Cassava <1 0 100 Sweet potatoes <1 73 27 Beans 1 11 89 Cowpeas 6 81 19 Sesame 29 25 75 Groundnuts <1 34 66 Pumpkin 1 41 59 Other vegetables 3 29 71 Watermelon 3 69 31 Other fruit <1 46 54 Tobacco 0 -- -- Other cash crop 10 14 86 Other crop 10 35 65 wheat 0 -- --
RO
S
Dates <1 69 31 Sorghum 53 92 7 Millet 64 90 10 Maize 1 87 9 Rice 0 -- -- Other cereals 0 -- -- cassava 0 -- -- Sweet potatoes 1 92 8 Beans <1 100 0 Cowpeas 1 46 54 Sesame 3 64 36 Groundnuts 42 47 53 Pumpkin <1 100 0 Other vegetables 3 78 22 Watermelon 2 32 67 Other fruit 0 -- -- Tobacco 1 1 99 Other cash crop 1 44 56 Other crop 9 79 20 Wheat 0 -- --
Gre
ate
r D
arf
ur
Dates 0 100 0
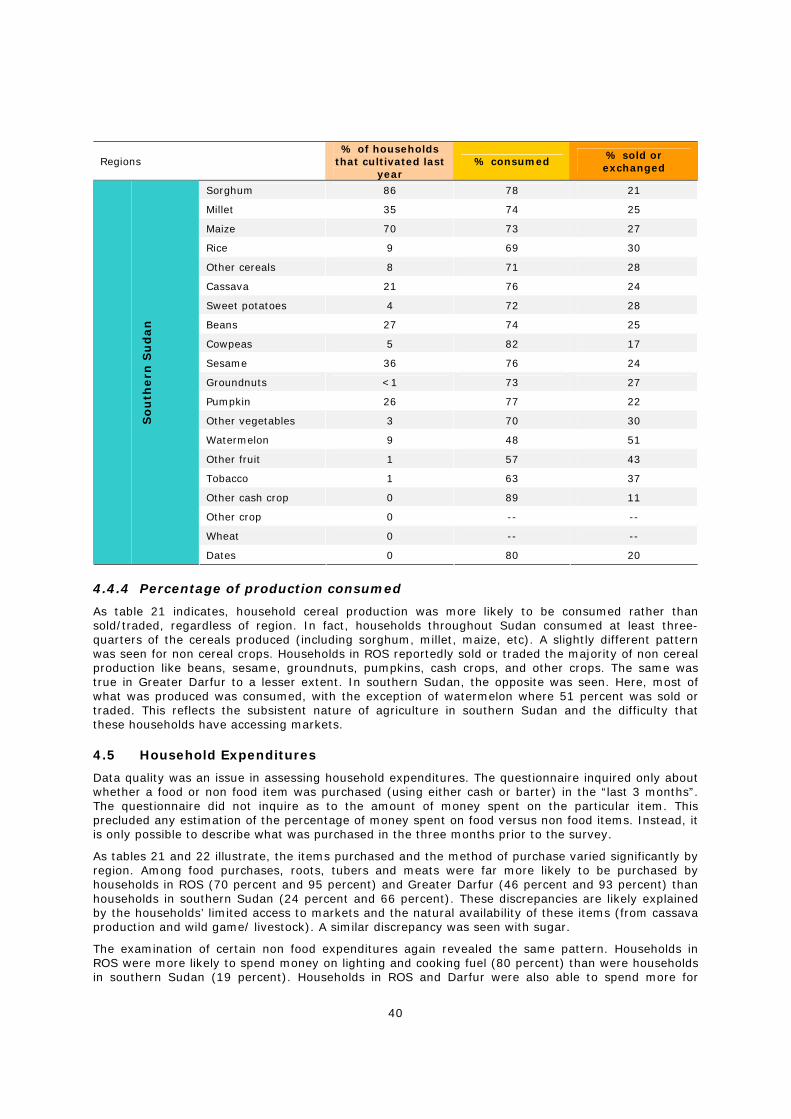
40
Regions % of households
that cultivated last year
% consumed % sold or exchanged
Sorghum 86 78 21
Millet 35 74 25
Maize 70 73 27
Rice 9 69 30
Other cereals 8 71 28
Cassava 21 76 24
Sweet potatoes 4 72 28
Beans 27 74 25
Cowpeas 5 82 17
Sesame 36 76 24
Groundnuts <1 73 27
Pumpkin 26 77 22
Other vegetables 3 70 30
Watermelon 9 48 51
Other fruit 1 57 43
Tobacco 1 63 37
Other cash crop 0 89 11
Other crop 0 -- --
Wheat 0 -- --
So
uth
ern
Su
dan
Dates 0 80 20
4.4.4 Percentage of production consumed
As table 21 indicates, household cereal production was more likely to be consumed rather than sold/traded, regardless of region. In fact, households throughout Sudan consumed at least three-quarters of the cereals produced (including sorghum, millet, maize, etc). A slightly different pattern was seen for non cereal crops. Households in ROS reportedly sold or traded the majority of non cereal production like beans, sesame, groundnuts, pumpkins, cash crops, and other crops. The same was true in Greater Darfur to a lesser extent. In southern Sudan, the opposite was seen. Here, most of what was produced was consumed, with the exception of watermelon where 51 percent was sold or traded. This reflects the subsistent nature of agriculture in southern Sudan and the difficulty that these households have accessing markets.
4.5 Household Expenditures
Data quality was an issue in assessing household expenditures. The questionnaire inquired only about whether a food or non food item was purchased (using either cash or barter) in the “last 3 months”. The questionnaire did not inquire as to the amount of money spent on the particular item. This precluded any estimation of the percentage of money spent on food versus non food items. Instead, it is only possible to describe what was purchased in the three months prior to the survey.
As tables 21 and 22 illustrate, the items purchased and the method of purchase varied significantly by region. Among food purchases, roots, tubers and meats were far more likely to be purchased by households in ROS (70 percent and 95 percent) and Greater Darfur (46 percent and 93 percent) than households in southern Sudan (24 percent and 66 percent). These discrepancies are likely explained by the households’ limited access to markets and the natural availability of these items (from cassava production and wild game/ livestock). A similar discrepancy was seen with sugar.
The examination of certain non food expenditures again revealed the same pattern. Households in ROS were more likely to spend money on lighting and cooking fuel (80 percent) than were households in southern Sudan (19 percent). Households in ROS and Darfur were also able to spend more for
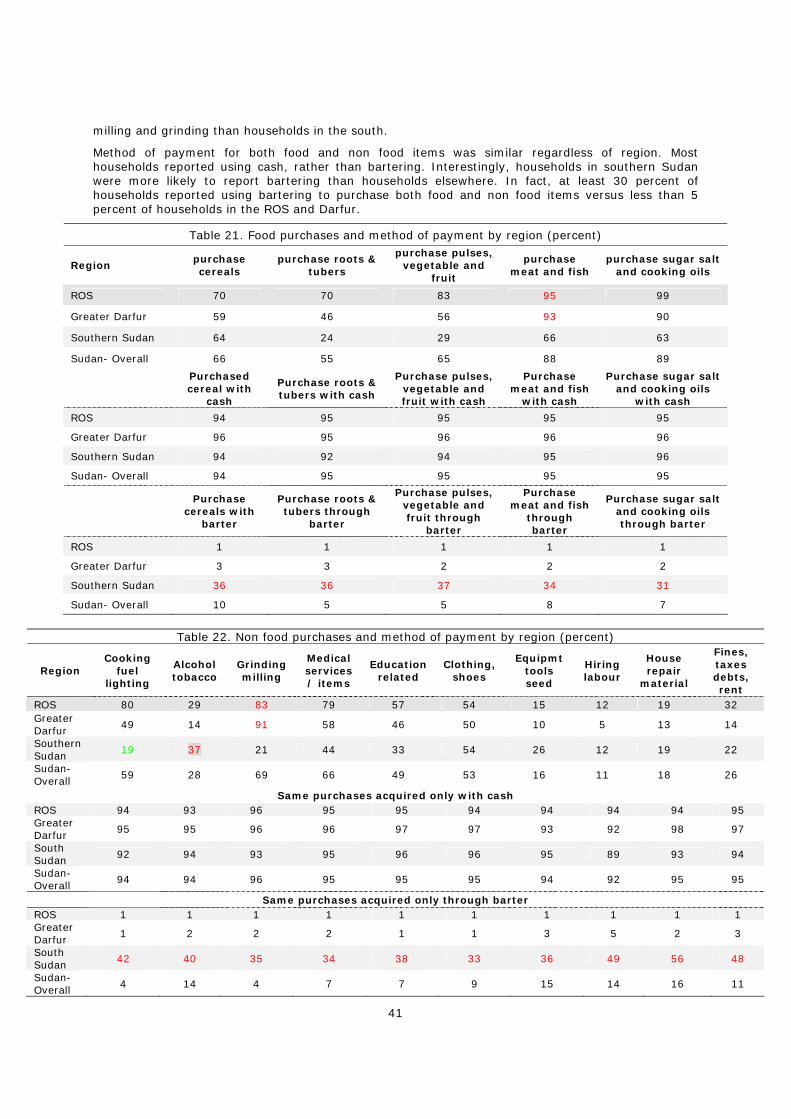
41
milling and grinding than households in the south.
Method of payment for both food and non food items was similar regardless of region. Most households reported using cash, rather than bartering. Interestingly, households in southern Sudan were more likely to report bartering than households elsewhere. In fact, at least 30 percent of households reported using bartering to purchase both food and non food items versus less than 5 percent of households in the ROS and Darfur.
Table 21. Food purchases and method of payment by region (percent)
Region purchase cereals
purchase roots & tubers
purchase pulses, vegetable and
fruit
purchase meat and fish
purchase sugar salt and cooking oils
ROS 70 70 83 95 99
Greater Darfur 59 46 56 93 90
Southern Sudan 64 24 29 66 63
Sudan- Overall 66 55 65 88 89
Purchased cereal with
cash
Purchase roots & tubers with cash
Purchase pulses, vegetable and fruit with cash
Purchase meat and fish
with cash
Purchase sugar salt and cooking oils
with cash
ROS 94 95 95 95 95
Greater Darfur 96 95 96 96 96
Southern Sudan 94 92 94 95 96
Sudan- Overall 94 95 95 95 95
Purchase
cereals with barter
Purchase roots & tubers through
barter
Purchase pulses, vegetable and fruit through
barter
Purchase meat and fish
through barter
Purchase sugar salt and cooking oils through barter
ROS 1 1 1 1 1
Greater Darfur 3 3 2 2 2
Southern Sudan 36 36 37 34 31
Sudan- Overall 10 5 5 8 7
Table 22. Non food purchases and method of payment by region (percent)
Region Cooking
fuel lighting
Alcohol tobacco
Grinding milling
Medical services/ items
Education related
Clothing, shoes
Equipmt tools seed
Hiring labour
House repair
material
Fines, taxes debts, rent
ROS 80 29 83 79 57 54 15 12 19 32 Greater Darfur 49 14 91 58 46 50 10 5 13 14
Southern Sudan 19 37 21 44 33 54 26 12 19 22
Sudan- Overall
59 28 69 66 49 53 16 11 18 26
Same purchases acquired only with cash ROS 94 93 96 95 95 94 94 94 94 95 Greater Darfur 95 95 96 96 97 97 93 92 98 97
South Sudan 92 94 93 95 96 96 95 89 93 94
Sudan- Overall 94 94 96 95 95 95 94 92 95 95
Same purchases acquired only through barter ROS 1 1 1 1 1 1 1 1 1 1 Greater Darfur
1 2 2 2 1 1 3 5 2 3
South Sudan 42 40 35 34 38 33 36 49 56 48
Sudan-Overall 4 14 4 7 7 9 15 14 16 11
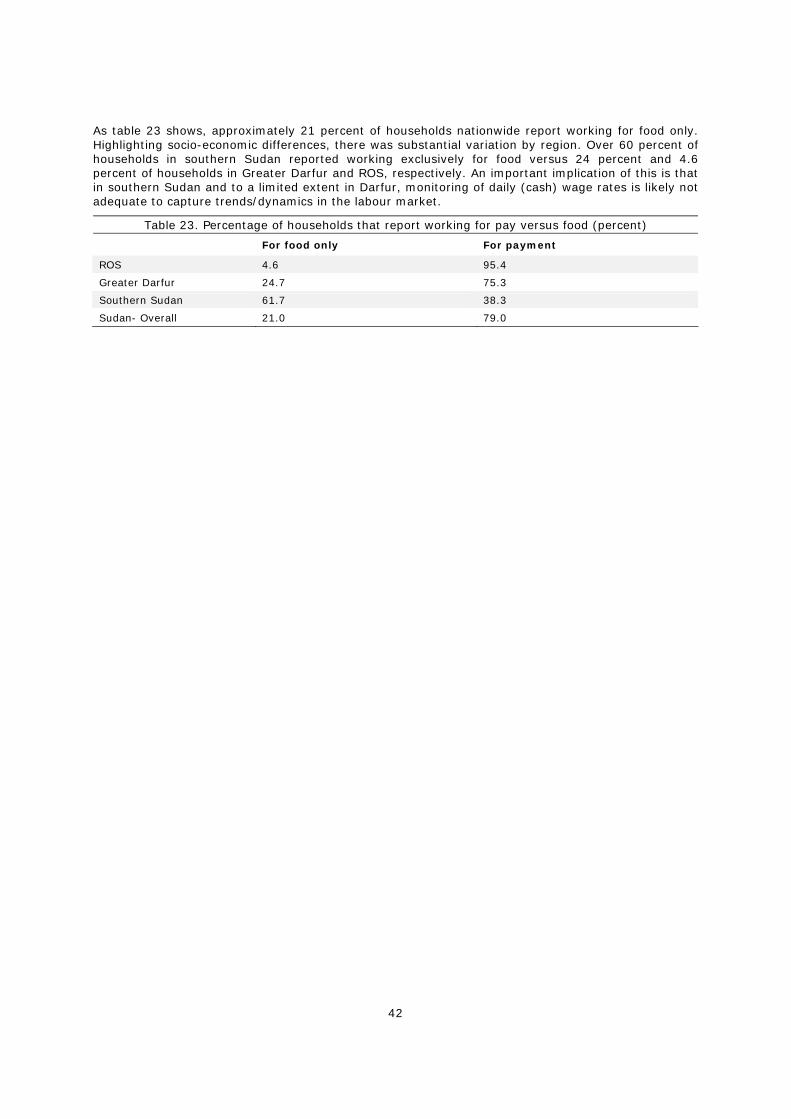
42
As table 23 shows, approximately 21 percent of households nationwide report working for food only. Highlighting socio-economic differences, there was substantial variation by region. Over 60 percent of households in southern Sudan reported working exclusively for food versus 24 percent and 4.6 percent of households in Greater Darfur and ROS, respectively. An important implication of this is that in southern Sudan and to a limited extent in Darfur, monitoring of daily (cash) wage rates is likely not adequate to capture trends/dynamics in the labour market.
Table 23. Percentage of households that report working for pay versus food (percent)
For food only For payment
ROS 4.6 95.4
Greater Darfur 24.7 75.3
Southern Sudan 61.7 38.3
Sudan- Overall 21.0 79.0
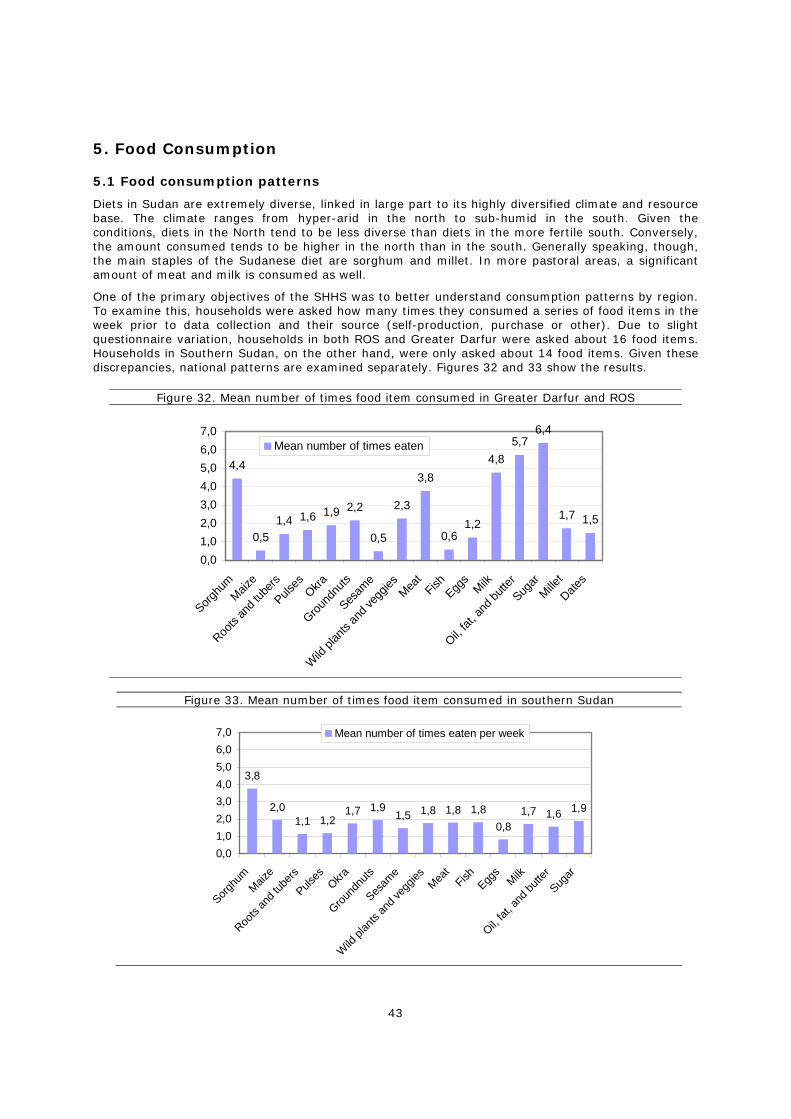
43
5. Food Consumption
5.1 Food consumption patterns
Diets in Sudan are extremely diverse, linked in large part to its highly diversified climate and resource base. The climate ranges from hyper-arid in the north to sub-humid in the south. Given the conditions, diets in the North tend to be less diverse than diets in the more fertile south. Conversely, the amount consumed tends to be higher in the north than in the south. Generally speaking, though, the main staples of the Sudanese diet are sorghum and millet. In more pastoral areas, a significant amount of meat and milk is consumed as well.
One of the primary objectives of the SHHS was to better understand consumption patterns by region. To examine this, households were asked how many times they consumed a series of food items in the week prior to data collection and their source (self-production, purchase or other). Due to slight questionnaire variation, households in both ROS and Greater Darfur were asked about 16 food items. Households in Southern Sudan, on the other hand, were only asked about 14 food items. Given these discrepancies, national patterns are examined separately. Figures 32 and 33 show the results.
Figure 32. Mean number of times food item consumed in Greater Darfur and ROS
4,4
0,51,4 1,6 1,9 2,2
0,5
2,3
3,8
0,61,2
4,85,7
6,4
1,7 1,5
0,01,02,03,04,05,06,07,0
Sorghu
mMaiz
e
Roots
and t
ubers
Pulses
Okra
Ground
nuts
Sesam
e
Wild pl
ants
and v
eggie
sMea
tFish
Eggs
Milk
Oil, fat
, and
butte
rSug
arMille
tDate
s
Mean number of times eaten
Figure 33. Mean number of times food item consumed in southern Sudan
3,8
2,01,1 1,2
1,7 1,91,5 1,8 1,8 1,8
0,81,7 1,6 1,9
0,01,02,03,04,05,06,07,0
Sorghu
mMaiz
e
Roots
and t
ubers
Pulses
Okra
Ground
nuts
Sesam
e
Wild
plan
ts an
d veg
gies
Meat
FishEgg
sMilk
Oil, fat
, and
butte
rSug
ar
Mean number of times eaten per week
44
5.1.1 Cereals
Nationwide, the most common cereals consumed are sorghum and millet. Regional consumption patterns show that sorghum and millet are consumed approximately 6 times a week in ROS and Greater Darfur and about 4 times a week in southern Sudan. Alternatively, maize is consumed twice on average per week in the south and less than once a week in the rest of Sudan. Roots and tubers are consumed about once a week in the south and about 1.5 times per week in ROS and Darfur. The consumption of cassava is frequent in certain areas in southern Sudan, though cassava is not a preferred food. Instead, it is generally relied upon to make up for sorghum crop failures.
5.1.2 Pulses
Pulses (peas, beans, lentils, groundnuts etc) are eaten slightly more on average in ROS than in the southern Sudan. Overall, households in the north eat pulses about 1.5 times per week, while households in the south eat them about once a week.
5.1.3 Meat, fish and Dairy products
In Sudan, meat (goat, cow, and chicken) is consumed quite frequently, especially in the drier pastoral areas. Regional consumption varies, with much more meat consumption reported in northern than southern areas. In fact, in ROS, meat is consumed almost 4 times per week on average, while in southern Sudan, meat is consumed less than twice per week. In parts of southern Sudan (particularly in the areas bordering Ethiopia), the meat consumed can at least partially be attributed to hunting of wild game. Game meat can include antelopes (dik diks), buffalo, bush-rats, gazelles, monkeys, pigs, bushbucks, baboons, hares, guinea fowl, pigeons, ant bears, warthogs, porcupines and ground squirrels. In these areas, meat and occasionally blood are relied on more heavily during the hunger season.
Fish is also an important component of the Sudanese diet, at least for poorer and middle income households living near the Nile river or its flood plains. Fish is also consumed by wealthier households but consumption among these households is more common during times of general food stress. Generally fish is consumed fresh but it is sometimes dried and stored for later consumption or sold at the market. Fish consumption is more common in southern Sudan. Here, households reportedly eat fish almost 2 times per week. In ROS, on the other hand, fish is consumed less than once a week.
With game meat and fish being an important source of both protein and fat in parts of southern Sudan (especially during times of conflict or insecurity), maintaining access to these food sources by ensuring proper wildlife management (preventing overfishing or hunting) is crucial to maintain adequate food supplies. This is of particular concern given that anecdotal reports have consistently indicated that both fish and wild game populations (because of war and over reliance on these food sources) have been declining. While neither the veracity of these claims nor the scale of the potential problem has been assessed quantitatively, declining wildlife populations could significantly impact the health and well-being of the population reliant on these food sources.
Milk consumption is an integral part of the Sudanese diet. Cow and goat milk is consumed, though consumption of goat milk is more common among poorer households. As with meat, there are regional variations in the amount of milk consumed. In ROS, milk is consumed about 5 times per week on average, while in southern Sudan it is consumed less than twice a week. It should noted (at least in the south) that milk consumption is heavily correlated with grazing patterns. Cattle typically leave the homestead during the dry season looking for grazing land. During this period, milk consumption is less common, until the cattle return with the rains. Given these patterns, a milk by-product, “Ghee”, is an important commodity in agro-pastoral areas as it can be stored (for consumption when milk is not readily available) or can be traded.
Eggs tend to be consumed infrequently with households throughout Sudan reporting consumption on average once a week.
5.1.4 Fruits and vegetables
In Sudan, fruit and vegetables comprise a relatively minor part of the diet. The main fruit and vegetables consumed are 1) wild foods and vegetables- water lilies, lalop (or desert dates), komok (a shrub), koliya, tamarind, wild berries, thoto and kote (palm fruits), yams, roots, wild rice, shea butter, grass seeds and various leaves; 2) Dates (in the north); 3) Okra; and 4) various cultivated fruits- watermelons, mangoes, oranges, pineapples, and lemons.
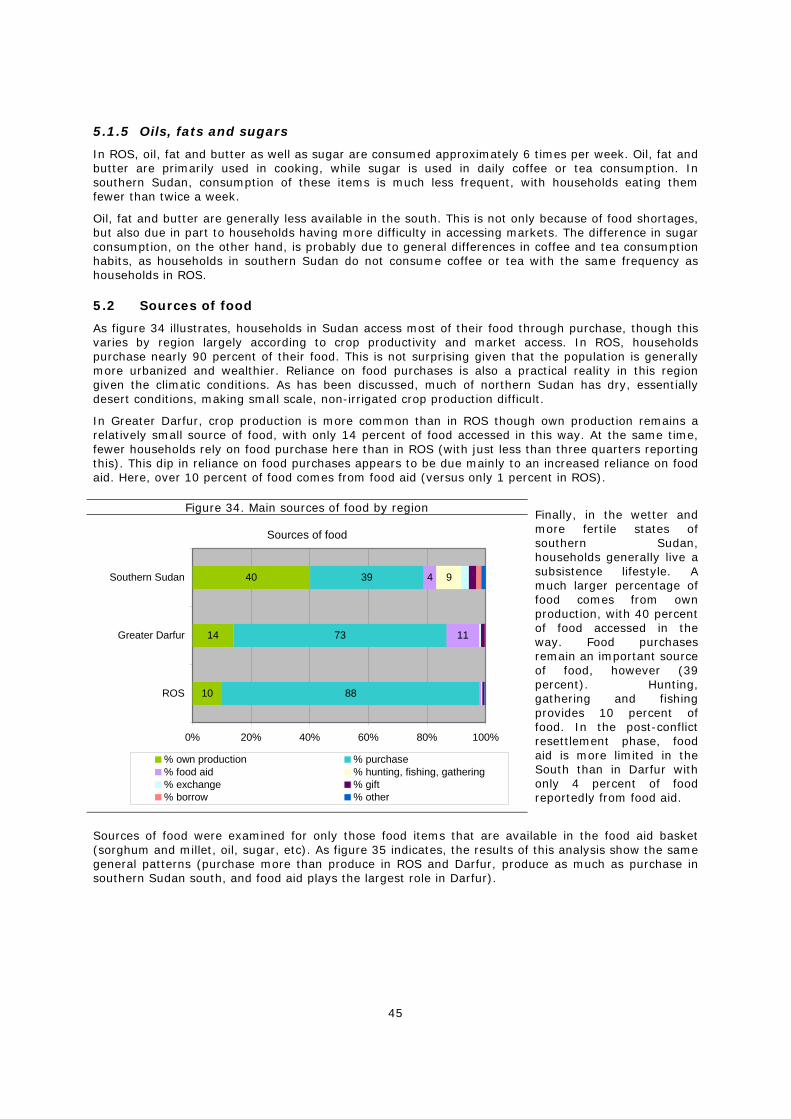
45
5.1.5 Oils, fats and sugars
In ROS, oil, fat and butter as well as sugar are consumed approximately 6 times per week. Oil, fat and butter are primarily used in cooking, while sugar is used in daily coffee or tea consumption. In southern Sudan, consumption of these items is much less frequent, with households eating them fewer than twice a week.
Oil, fat and butter are generally less available in the south. This is not only because of food shortages, but also due in part to households having more difficulty in accessing markets. The difference in sugar consumption, on the other hand, is probably due to general differences in coffee and tea consumption habits, as households in southern Sudan do not consume coffee or tea with the same frequency as households in ROS.
5.2 Sources of food
As figure 34 illustrates, households in Sudan access most of their food through purchase, though this varies by region largely according to crop productivity and market access. In ROS, households purchase nearly 90 percent of their food. This is not surprising given that the population is generally more urbanized and wealthier. Reliance on food purchases is also a practical reality in this region given the climatic conditions. As has been discussed, much of northern Sudan has dry, essentially desert conditions, making small scale, non-irrigated crop production difficult.
In Greater Darfur, crop production is more common than in ROS though own production remains a relatively small source of food, with only 14 percent of food accessed in this way. At the same time, fewer households rely on food purchase here than in ROS (with just less than three quarters reporting this). This dip in reliance on food purchases appears to be due mainly to an increased reliance on food aid. Here, over 10 percent of food comes from food aid (versus only 1 percent in ROS).
Figure 34. Main sources of food by region
Sources of food
10
14
40
88
73
39
11
4 9
0% 20% 40% 60% 80% 100%
ROS
Greater Darfur
Southern Sudan
% own production % purchase% food aid % hunting, fishing, gathering% exchange % gift% borrow % other
Finally, in the wetter and more fertile states of southern Sudan, households generally live a subsistence lifestyle. A much larger percentage of food comes from own production, with 40 percent of food accessed in the way. Food purchases remain an important source of food, however (39 percent). Hunting, gathering and fishing provides 10 percent of food. In the post-conflict resettlement phase, food aid is more limited in the South than in Darfur with only 4 percent of food reportedly from food aid.
Sources of food were examined for only those food items that are available in the food aid basket (sorghum and millet, oil, sugar, etc). As figure 35 indicates, the results of this analysis show the same general patterns (purchase more than produce in ROS and Darfur, produce as much as purchase in southern Sudan south, and food aid plays the largest role in Darfur).
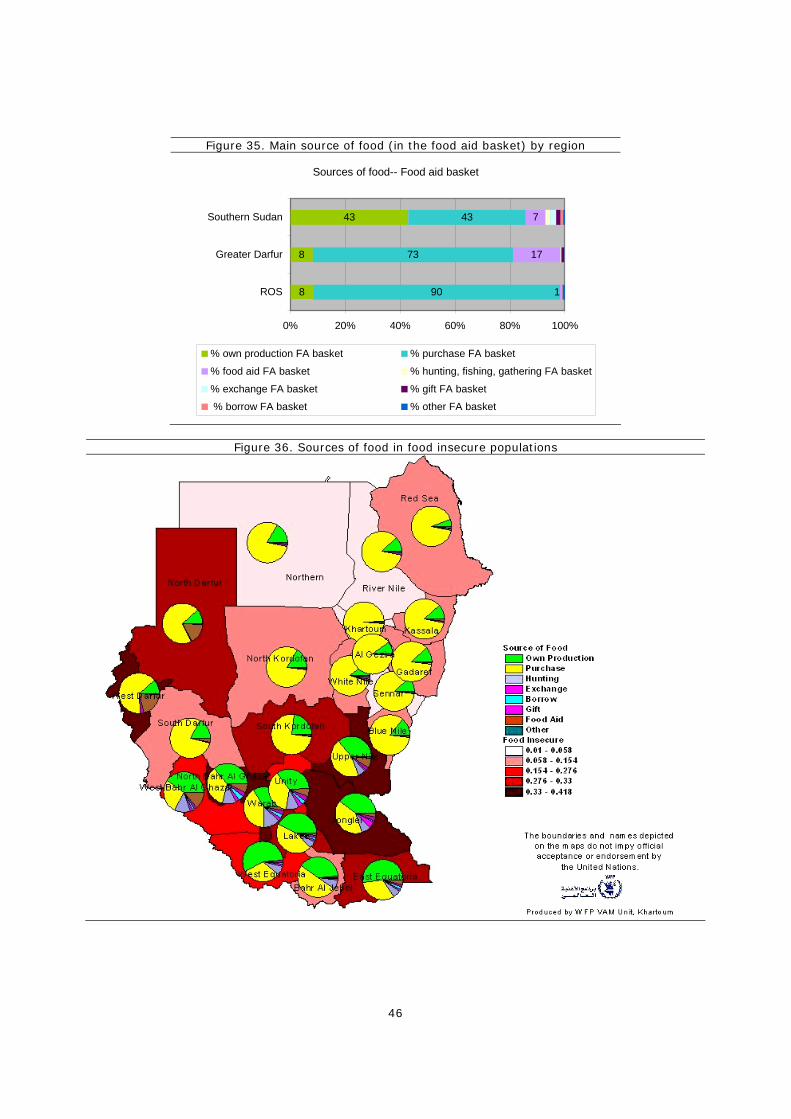
46
Figure 35. Main source of food (in the food aid basket) by region
Sources of food-- Food aid basket
8
8
43
90
73
43
17
7
1
0% 20% 40% 60% 80% 100%
ROS
Greater Darfur
Southern Sudan
% own production FA basket % purchase FA basket
% food aid FA basket % hunting, fishing, gathering FA basket
% exchange FA basket % gift FA basket
% borrow FA basket % other FA basket
Figure 36. Sources of food in food insecure populations
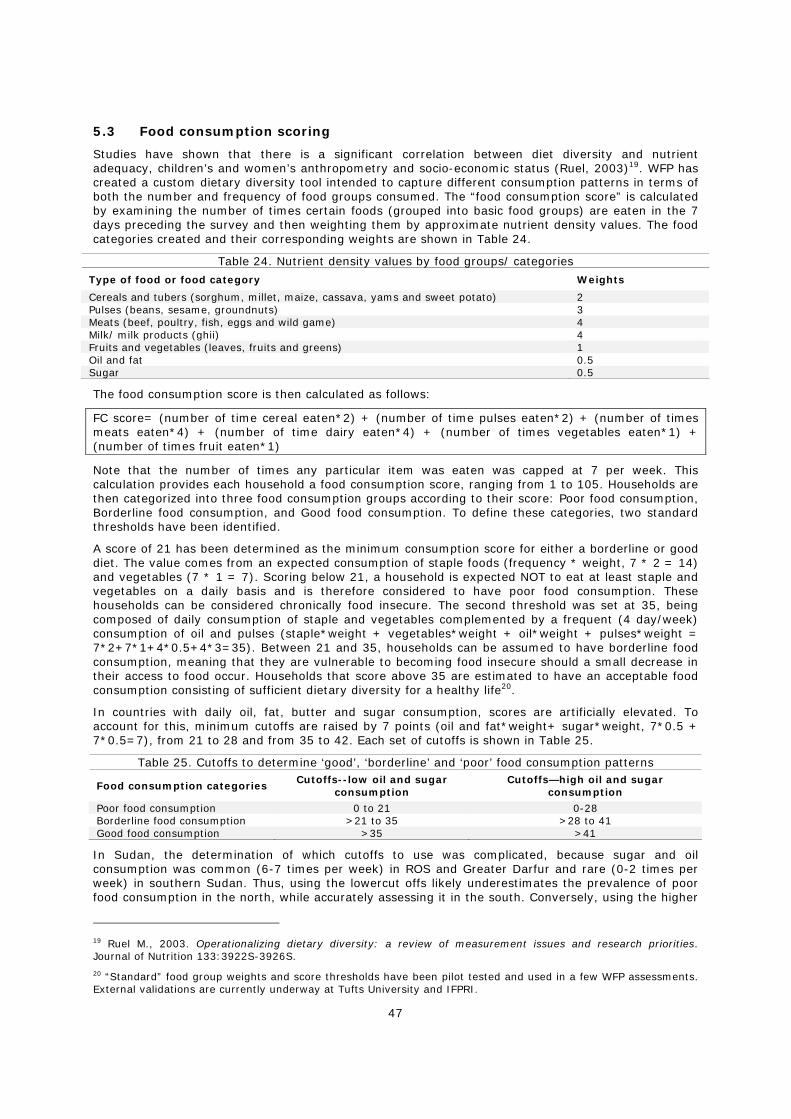
47
5.3 Food consumption scoring
Studies have shown that there is a significant correlation between diet diversity and nutrient adequacy, children’s and women’s anthropometry and socio-economic status (Ruel, 2003)19. WFP has created a custom dietary diversity tool intended to capture different consumption patterns in terms of both the number and frequency of food groups consumed. The “food consumption score” is calculated by examining the number of times certain foods (grouped into basic food groups) are eaten in the 7 days preceding the survey and then weighting them by approximate nutrient density values. The food categories created and their corresponding weights are shown in Table 24.
Table 24. Nutrient density values by food groups/ categories
Type of food or food category Weights
Cereals and tubers (sorghum, millet, maize, cassava, yams and sweet potato) 2 Pulses (beans, sesame, groundnuts) 3 Meats (beef, poultry, fish, eggs and wild game) 4 Milk/ milk products (ghii) 4 Fruits and vegetables (leaves, fruits and greens) 1 Oil and fat 0.5 Sugar 0.5
The food consumption score is then calculated as follows:
FC score= (number of time cereal eaten*2) + (number of time pulses eaten*2) + (number of times meats eaten*4) + (number of time dairy eaten*4) + (number of times vegetables eaten*1) + (number of times fruit eaten*1)
Note that the number of times any particular item was eaten was capped at 7 per week. This calculation provides each household a food consumption score, ranging from 1 to 105. Households are then categorized into three food consumption groups according to their score: Poor food consumption, Borderline food consumption, and Good food consumption. To define these categories, two standard thresholds have been identified.
A score of 21 has been determined as the minimum consumption score for either a borderline or good diet. The value comes from an expected consumption of staple foods (frequency * weight, 7 * 2 = 14) and vegetables (7 * 1 = 7). Scoring below 21, a household is expected NOT to eat at least staple and vegetables on a daily basis and is therefore considered to have poor food consumption. These households can be considered chronically food insecure. The second threshold was set at 35, being composed of daily consumption of staple and vegetables complemented by a frequent (4 day/week) consumption of oil and pulses (staple*weight + vegetables*weight + oil*weight + pulses*weight = 7*2+7*1+4*0.5+4*3=35). Between 21 and 35, households can be assumed to have borderline food consumption, meaning that they are vulnerable to becoming food insecure should a small decrease in their access to food occur. Households that score above 35 are estimated to have an acceptable food consumption consisting of sufficient dietary diversity for a healthy life20.
In countries with daily oil, fat, butter and sugar consumption, scores are artificially elevated. To account for this, minimum cutoffs are raised by 7 points (oil and fat*weight+ sugar*weight, 7*0.5 + 7*0.5=7), from 21 to 28 and from 35 to 42. Each set of cutoffs is shown in Table 25.
Table 25. Cutoffs to determine ‘good’, ‘borderline’ and ‘poor’ food consumption patterns
Food consumption categories Cutoffs--low oil and sugar
consumption Cutoffs—high oil and sugar
consumption
Poor food consumption 0 to 21 0-28 Borderline food consumption >21 to 35 >28 to 41 Good food consumption >35 >41
In Sudan, the determination of which cutoffs to use was complicated, because sugar and oil consumption was common (6-7 times per week) in ROS and Greater Darfur and rare (0-2 times per week) in southern Sudan. Thus, using the lowercut offs likely underestimates the prevalence of poor food consumption in the north, while accurately assessing it in the south. Conversely, using the higher
19 Ruel M., 2003. Operationalizing dietary diversity: a review of measurement issues and research priorities. Journal of Nutrition 133:3922S-3926S.
20 “Standard” food group weights and score thresholds have been pilot tested and used in a few WFP assessments. External validations are currently underway at Tufts University and IFPRI.
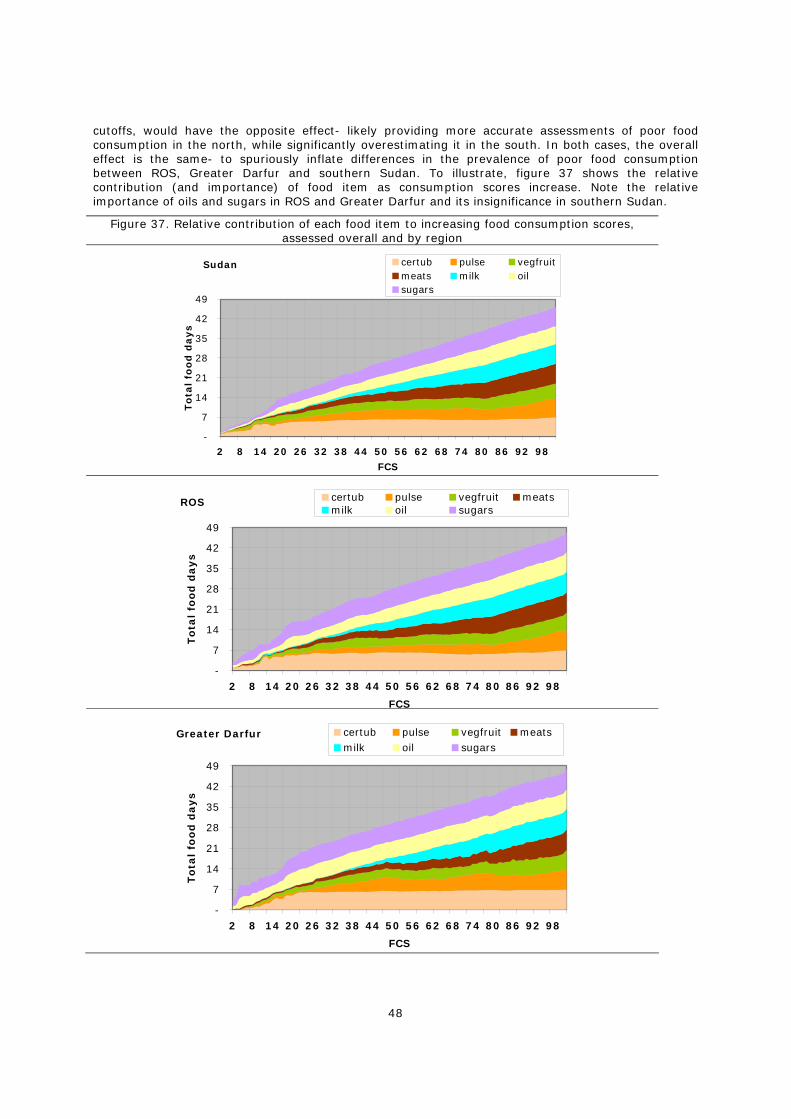
48
cutoffs, would have the opposite effect- likely providing more accurate assessments of poor food consumption in the north, while significantly overestimating it in the south. In both cases, the overall effect is the same- to spuriously inflate differences in the prevalence of poor food consumption between ROS, Greater Darfur and southern Sudan. To illustrate, figure 37 shows the relative contribution (and importance) of food item as consumption scores increase. Note the relative importance of oils and sugars in ROS and Greater Darfur and its insignificance in southern Sudan.
Figure 37. Relative contribution of each food item to increasing food consumption scores, assessed overall and by region
Sudan
-
7
14
21
28
35
42
49
2 8 14 20 26 32 38 44 50 56 62 68 74 80 86 92 98
FCS
To
tal
foo
d d
ays
certub pulse vegfruitmeats milk oilsugars
ROS
-
7
14
21
28
35
42
49
2 8 14 20 26 32 38 44 50 56 62 68 74 80 86 92 98
FCS
Tota
l fo
od
days
certub pulse vegfruit meatsmilk oil sugars
Greater Darfur
-
7
14
21
28
35
42
49
2 8 14 20 26 32 38 44 50 56 62 68 74 80 86 92 98
FCS
Tota
l fo
od
days
certub pulse vegfruit meatsmilk oil sugars
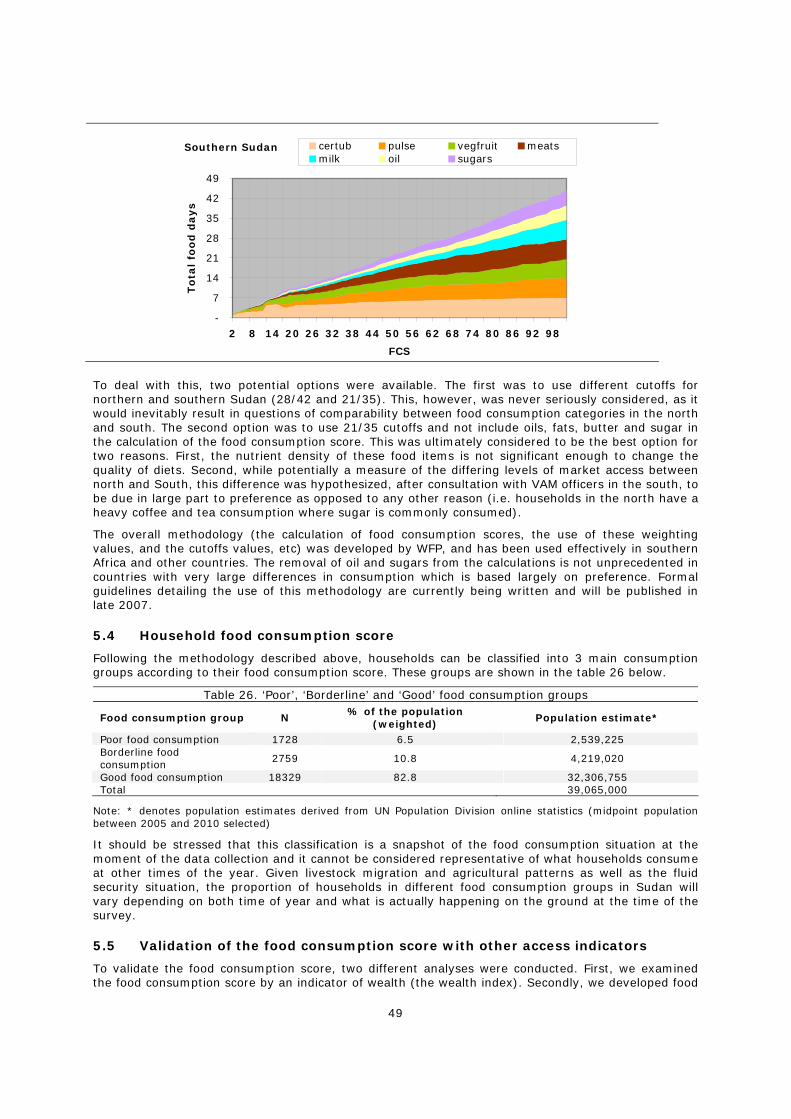
49
Southern Sudan
-
7
14
21
28
35
42
49
2 8 14 20 26 32 38 44 50 56 62 68 74 80 86 92 98
FCS
To
tal
foo
d d
ays
certub pulse vegfruit meatsmilk oil sugars
To deal with this, two potential options were available. The first was to use different cutoffs for northern and southern Sudan (28/42 and 21/35). This, however, was never seriously considered, as it would inevitably result in questions of comparability between food consumption categories in the north and south. The second option was to use 21/35 cutoffs and not include oils, fats, butter and sugar in the calculation of the food consumption score. This was ultimately considered to be the best option for two reasons. First, the nutrient density of these food items is not significant enough to change the quality of diets. Second, while potentially a measure of the differing levels of market access between north and South, this difference was hypothesized, after consultation with VAM officers in the south, to be due in large part to preference as opposed to any other reason (i.e. households in the north have a heavy coffee and tea consumption where sugar is commonly consumed).
The overall methodology (the calculation of food consumption scores, the use of these weighting values, and the cutoffs values, etc) was developed by WFP, and has been used effectively in southern Africa and other countries. The removal of oil and sugars from the calculations is not unprecedented in countries with very large differences in consumption which is based largely on preference. Formal guidelines detailing the use of this methodology are currently being written and will be published in late 2007.
5.4 Household food consumption score
Following the methodology described above, households can be classified into 3 main consumption groups according to their food consumption score. These groups are shown in the table 26 below.
Table 26. ‘Poor’, ‘Borderline’ and ‘Good’ food consumption groups
Food consumption group N % of the population
(weighted) Population estimate*
Poor food consumption 1728 6.5 2,539,225 Borderline food consumption 2759 10.8 4,219,020
Good food consumption 18329 82.8 32,306,755 Total 39,065,000
Note: * denotes population estimates derived from UN Population Division online statistics (midpoint population between 2005 and 2010 selected)
It should be stressed that this classification is a snapshot of the food consumption situation at the moment of the data collection and it cannot be considered representative of what households consume at other times of the year. Given livestock migration and agricultural patterns as well as the fluid security situation, the proportion of households in different food consumption groups in Sudan will vary depending on both time of year and what is actually happening on the ground at the time of the survey.
5.5 Validation of the food consumption score with other access indicators
To validate the food consumption score, two different analyses were conducted. First, we examined the food consumption score by an indicator of wealth (the wealth index). Secondly, we developed food
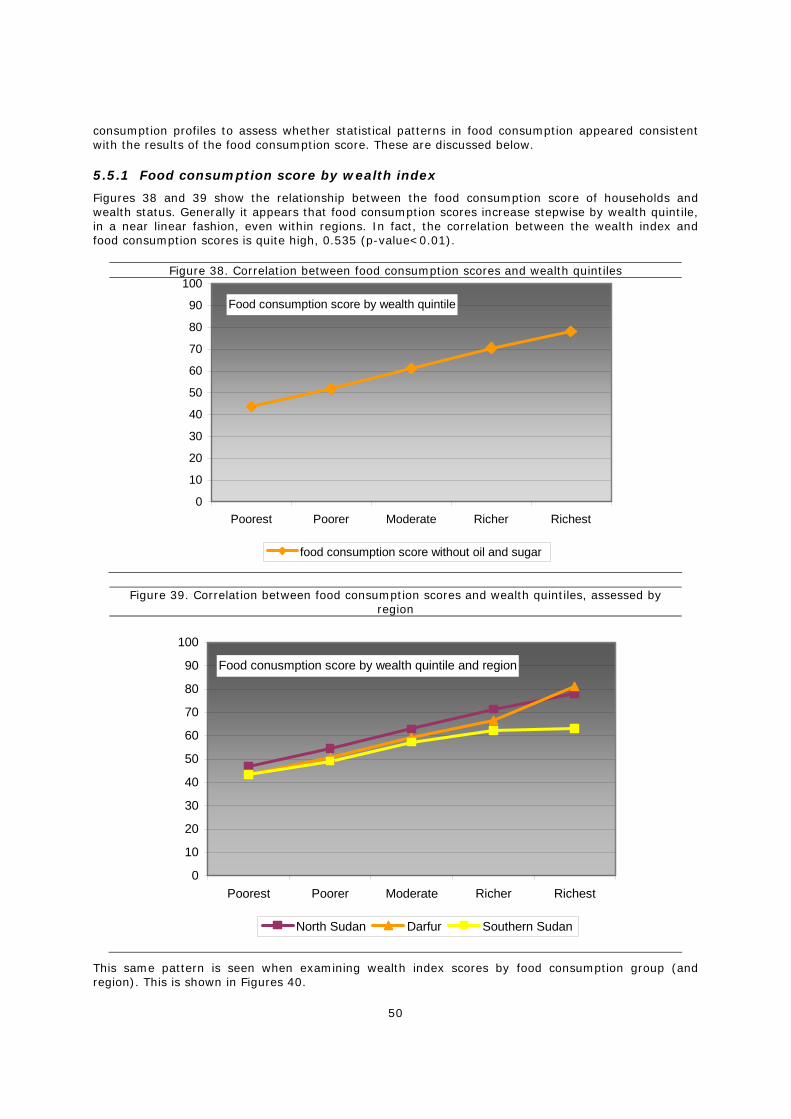
50
consumption profiles to assess whether statistical patterns in food consumption appeared consistent with the results of the food consumption score. These are discussed below.
5.5.1 Food consumption score by wealth index
Figures 38 and 39 show the relationship between the food consumption score of households and wealth status. Generally it appears that food consumption scores increase stepwise by wealth quintile, in a near linear fashion, even within regions. In fact, the correlation between the wealth index and food consumption scores is quite high, 0.535 (p-value<0.01).
Figure 38. Correlation between food consumption scores and wealth quintiles
Food consumption score by wealth quintile
0
10
20
30
40
50
60
70
80
90
100
Poorest Poorer Moderate Richer Richest
food consumption score without oil and sugar
Figure 39. Correlation between food consumption scores and wealth quintiles, assessed by
region
Food conusmption score by wealth quintile and region
0
10
20
30
40
50
60
70
80
90
100
Poorest Poorer Moderate Richer Richest
North Sudan Darfur Southern Sudan
This same pattern is seen when examining wealth index scores by food consumption group (and region). This is shown in Figures 40.
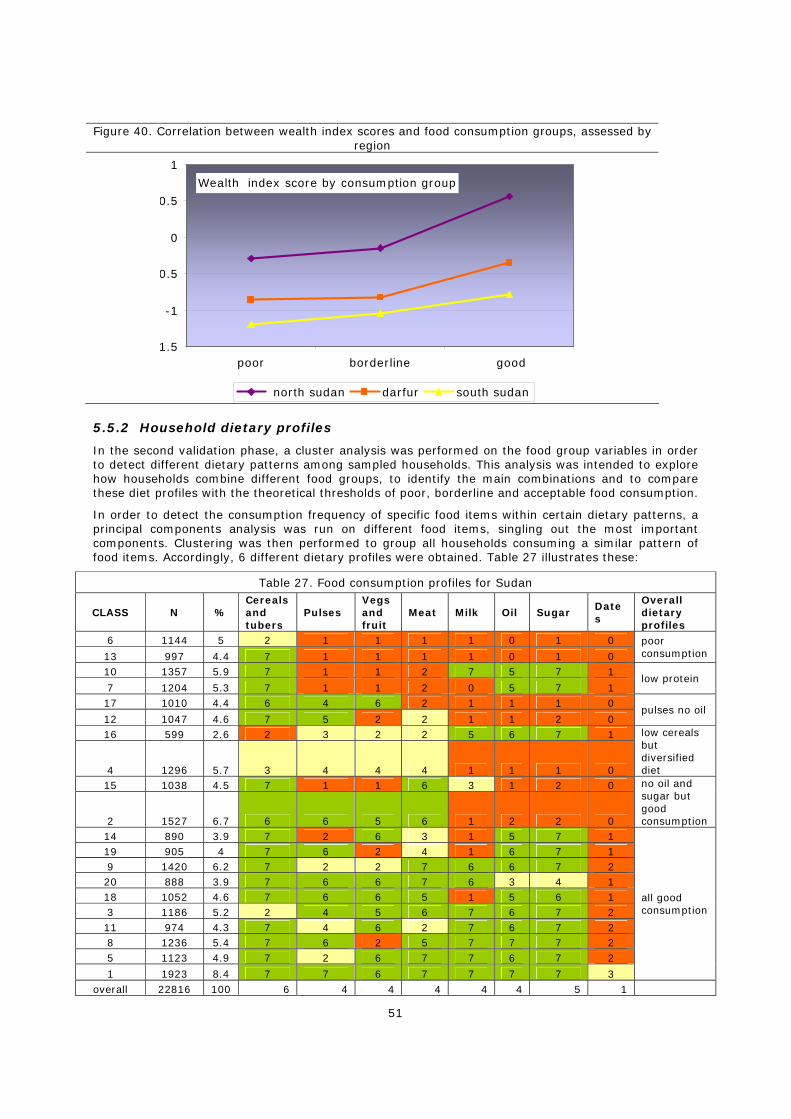
51
Figure 40. Correlation between wealth index scores and food consumption groups, assessed by region
Wealth index score by consumption group
1.5
-1
0.5
0
0.5
1
poor borderline good
north sudan darfur south sudan
5.5.2 Household dietary profiles
In the second validation phase, a cluster analysis was performed on the food group variables in order to detect different dietary patterns among sampled households. This analysis was intended to explore how households combine different food groups, to identify the main combinations and to compare these diet profiles with the theoretical thresholds of poor, borderline and acceptable food consumption.
In order to detect the consumption frequency of specific food items within certain dietary patterns, a principal components analysis was run on different food items, singling out the most important components. Clustering was then performed to group all households consuming a similar pattern of food items. Accordingly, 6 different dietary profiles were obtained. Table 27 illustrates these:
Table 27. Food consumption profiles for Sudan
CLASS N % Cereals and tubers
Pulses Vegs and fruit
Meat Milk Oil Sugar Dates
Overall dietary profiles
6 1144 5 2 1 1 1 1 0 1 0
13 997 4.4 7 1 1 1 1 0 1 0
poor consumption
10 1357 5.9 7 1 1 2 7 5 7 1
7 1204 5.3 7 1 1 2 0 5 7 1 low protein
17 1010 4.4 6 4 6 2 1 1 1 0
12 1047 4.6 7 5 2 2 1 1 2 0 pulses no oil
16 599 2.6 2 3 2 2 5 6 7 1
4 1296 5.7 3 4 4 4 1 1 1 0
low cereals but diversified diet
15 1038 4.5 7 1 1 6 3 1 2 0
2 1527 6.7 6 6 5 6 1 2 2 0
no oil and sugar but good consumption
14 890 3.9 7 2 6 3 1 5 7 1 19 905 4 7 6 2 4 1 6 7 1 9 1420 6.2 7 2 2 7 6 6 7 2 20 888 3.9 7 6 6 7 6 3 4 1 18 1052 4.6 7 6 6 5 1 5 6 1 3 1186 5.2 2 4 5 6 7 6 7 2 11 974 4.3 7 4 6 2 7 6 7 2 8 1236 5.4 7 6 2 5 7 7 7 2 5 1123 4.9 7 2 6 7 7 6 7 2
1 1923 8.4 7 7 6 7 7 7 7 3
all good consumption
overall 22816 100 6 4 4 4 4 4 5 1
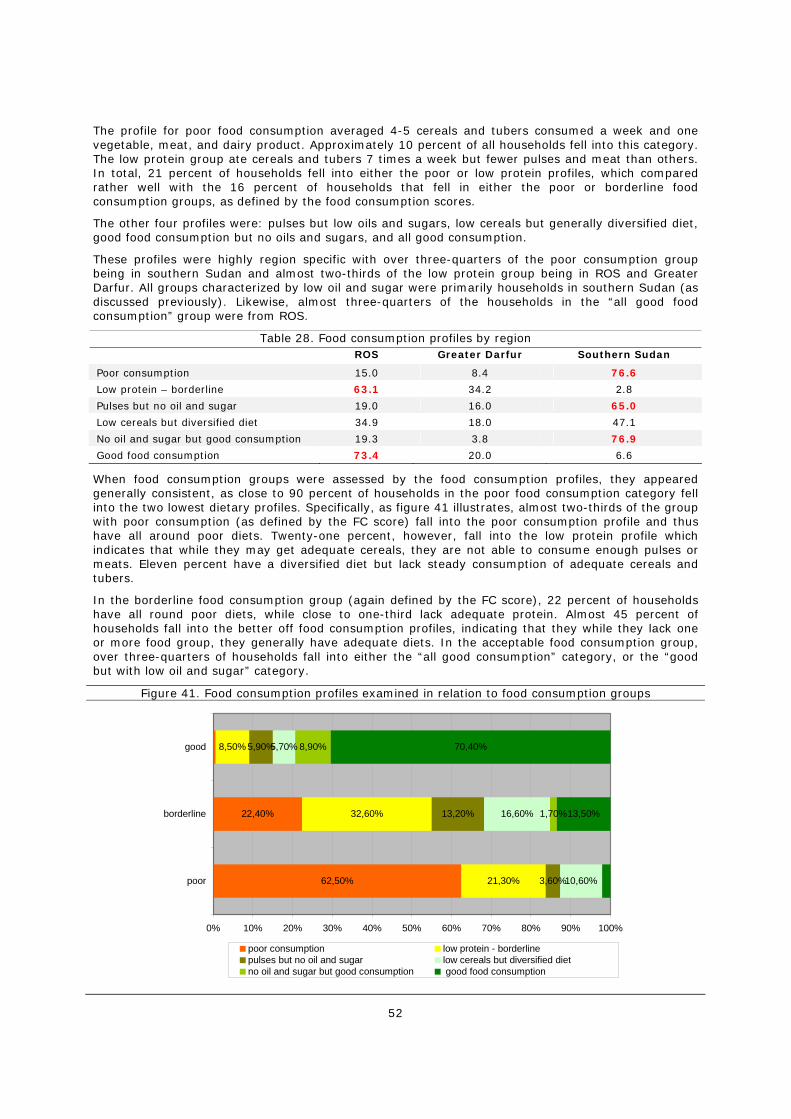
52
The profile for poor food consumption averaged 4-5 cereals and tubers consumed a week and one vegetable, meat, and dairy product. Approximately 10 percent of all households fell into this category. The low protein group ate cereals and tubers 7 times a week but fewer pulses and meat than others. In total, 21 percent of households fell into either the poor or low protein profiles, which compared rather well with the 16 percent of households that fell in either the poor or borderline food consumption groups, as defined by the food consumption scores.
The other four profiles were: pulses but low oils and sugars, low cereals but generally diversified diet, good food consumption but no oils and sugars, and all good consumption.
These profiles were highly region specific with over three-quarters of the poor consumption group being in southern Sudan and almost two-thirds of the low protein group being in ROS and Greater Darfur. All groups characterized by low oil and sugar were primarily households in southern Sudan (as discussed previously). Likewise, almost three-quarters of the households in the “all good food consumption” group were from ROS.
Table 28. Food consumption profiles by region ROS Greater Darfur Southern Sudan
Poor consumption 15.0 8.4 76.6
Low protein – borderline 63.1 34.2 2.8
Pulses but no oil and sugar 19.0 16.0 65.0
Low cereals but diversified diet 34.9 18.0 47.1
No oil and sugar but good consumption 19.3 3.8 76.9
Good food consumption 73.4 20.0 6.6
When food consumption groups were assessed by the food consumption profiles, they appeared generally consistent, as close to 90 percent of households in the poor food consumption category fell into the two lowest dietary profiles. Specifically, as figure 41 illustrates, almost two-thirds of the group with poor consumption (as defined by the FC score) fall into the poor consumption profile and thus have all around poor diets. Twenty-one percent, however, fall into the low protein profile which indicates that while they may get adequate cereals, they are not able to consume enough pulses or meats. Eleven percent have a diversified diet but lack steady consumption of adequate cereals and tubers.
In the borderline food consumption group (again defined by the FC score), 22 percent of households have all round poor diets, while close to one-third lack adequate protein. Almost 45 percent of households fall into the better off food consumption profiles, indicating that they while they lack one or more food group, they generally have adequate diets. In the acceptable food consumption group, over three-quarters of households fall into either the “all good consumption” category, or the “good but with low oil and sugar” category.
Figure 41. Food consumption profiles examined in relation to food consumption groups
62,50%
22,40%
21,30%
32,60%
8,50%
3,60%
13,20%
5,90%
10,60%
16,60%
5,70%
1,70%
8,90%
13,50%
70,40%
0% 10% 20% 30% 40% 50% 60% 70% 80% 90% 100%
poor
borderline
good
poor consumption low protein - borderlinepulses but no oil and sugar low cereals but diversified dietno oil and sugar but good consumption good food consumption
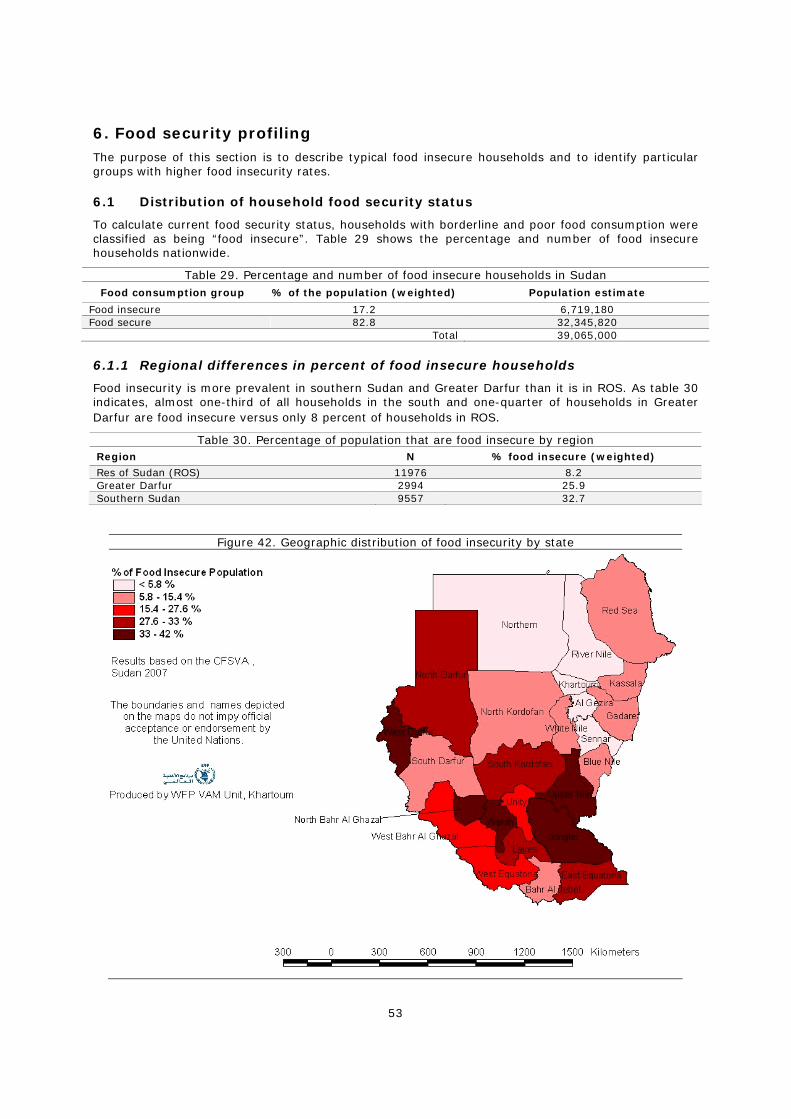
53
6. Food security profiling The purpose of this section is to describe typical food insecure households and to identify particular groups with higher food insecurity rates.
6.1 Distribution of household food security status
To calculate current food security status, households with borderline and poor food consumption were classified as being “food insecure”. Table 29 shows the percentage and number of food insecure households nationwide.
Table 29. Percentage and number of food insecure households in Sudan Food consumption group % of the population (weighted) Population estimate
Food insecure 17.2 6,719,180 Food secure 82.8 32,345,820
Total 39,065,000
6.1.1 Regional differences in percent of food insecure households
Food insecurity is more prevalent in southern Sudan and Greater Darfur than it is in ROS. As table 30 indicates, almost one-third of all households in the south and one-quarter of households in Greater Darfur are food insecure versus only 8 percent of households in ROS.
Table 30. Percentage of population that are food insecure by region Region N % food insecure (weighted)
Res of Sudan (ROS) 11976 8.2 Greater Darfur 2994 25.9 Southern Sudan 9557 32.7
Figure 42. Geographic distribution of food insecurity by state
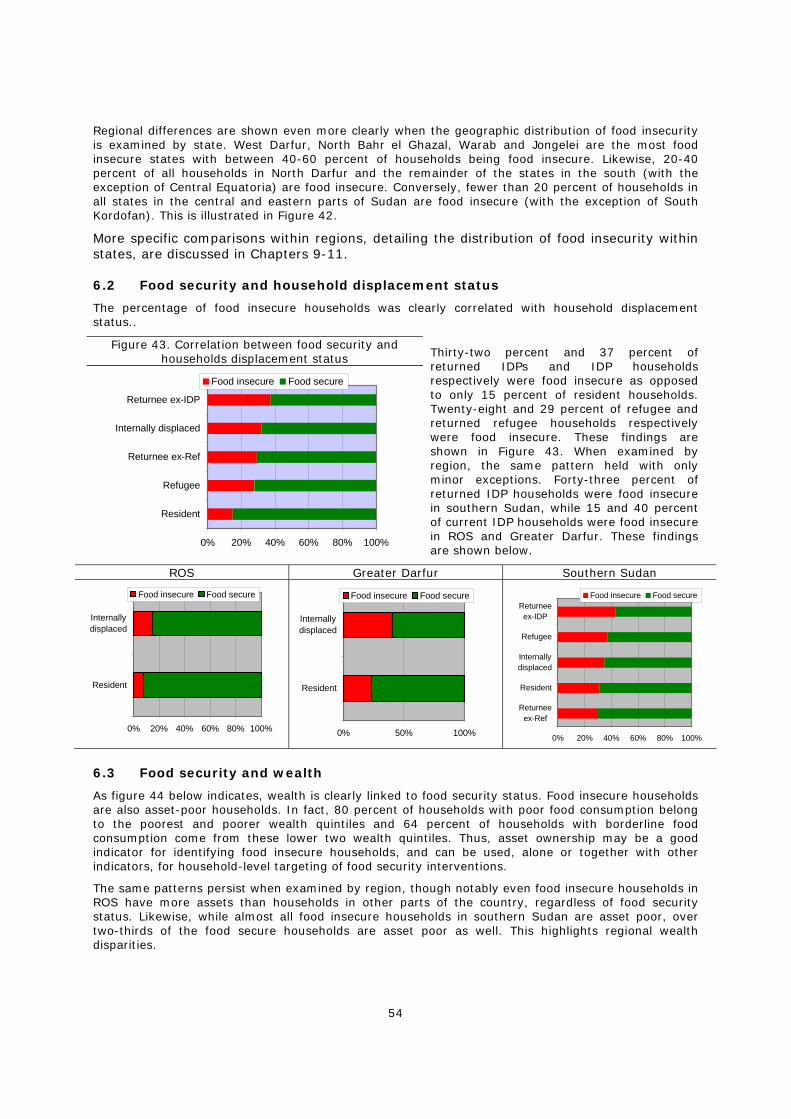
54
Regional differences are shown even more clearly when the geographic distribution of food insecurity is examined by state. West Darfur, North Bahr el Ghazal, Warab and Jongelei are the most food insecure states with between 40-60 percent of households being food insecure. Likewise, 20-40 percent of all households in North Darfur and the remainder of the states in the south (with the exception of Central Equatoria) are food insecure. Conversely, fewer than 20 percent of households in all states in the central and eastern parts of Sudan are food insecure (with the exception of South Kordofan). This is illustrated in Figure 42.
More specific comparisons within regions, detailing the distribution of food insecurity within states, are discussed in Chapters 9-11.
6.2 Food security and household displacement status
The percentage of food insecure households was clearly correlated with household displacement status..
Figure 43. Correlation between food security and households displacement status
0% 20% 40% 60% 80% 100%
Resident
Refugee
Returnee ex-Ref
Internally displaced
Returnee ex-IDP
Food insecure Food secure
Thirty-two percent and 37 percent of returned IDPs and IDP households respectively were food insecure as opposed to only 15 percent of resident households. Twenty-eight and 29 percent of refugee and returned refugee households respectively were food insecure. These findings are shown in Figure 43. When examined by region, the same pattern held with only minor exceptions. Forty-three percent of returned IDP households were food insecure in southern Sudan, while 15 and 40 percent of current IDP households were food insecure in ROS and Greater Darfur. These findings are shown below.
ROS Greater Darfur Southern Sudan
0% 20% 40% 60% 80% 100%
Resident
Internallydisplaced
Food insecure Food secure
0% 50% 100%
Resident
Internallydisplaced
Food insecure Food secure
0% 20% 40% 60% 80% 100%
Returneeex-Ref
Resident
Internallydisplaced
Refugee
Returneeex-IDP
Food insecure Food secure
6.3 Food security and wealth
As figure 44 below indicates, wealth is clearly linked to food security status. Food insecure households are also asset-poor households. In fact, 80 percent of households with poor food consumption belong to the poorest and poorer wealth quintiles and 64 percent of households with borderline food consumption come from these lower two wealth quintiles. Thus, asset ownership may be a good indicator for identifying food insecure households, and can be used, alone or together with other indicators, for household-level targeting of food security interventions.
The same patterns persist when examined by region, though notably even food insecure households in ROS have more assets than households in other parts of the country, regardless of food security status. Likewise, while almost all food insecure households in southern Sudan are asset poor, over two-thirds of the food secure households are asset poor as well. This highlights regional wealth disparities.
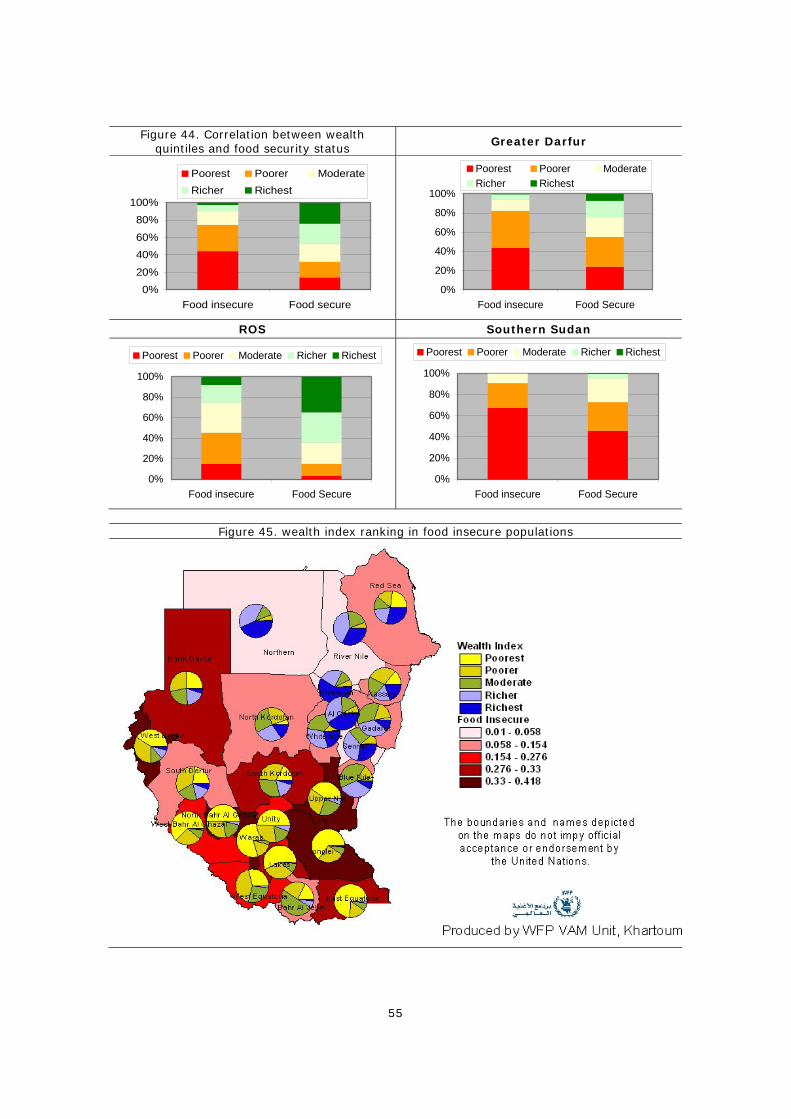
55
Figure 44. Correlation between wealth quintiles and food security status
Greater Darfur
0%
20%
40%
60%
80%
100%
Food insecure Food secure
Poorest Poorer ModerateRicher Richest
0%
20%
40%
60%
80%
100%
Food insecure Food Secure
Poorest Poorer ModerateRicher Richest
ROS Southern Sudan
0%
20%
40%
60%
80%
100%
Food insecure Food Secure
Poorest Poorer Moderate Richer Richest
0%
20%
40%
60%
80%
100%
Food insecure Food Secure
Poorest Poorer Moderate Richer Richest
Figure 45. wealth index ranking in food insecure populations
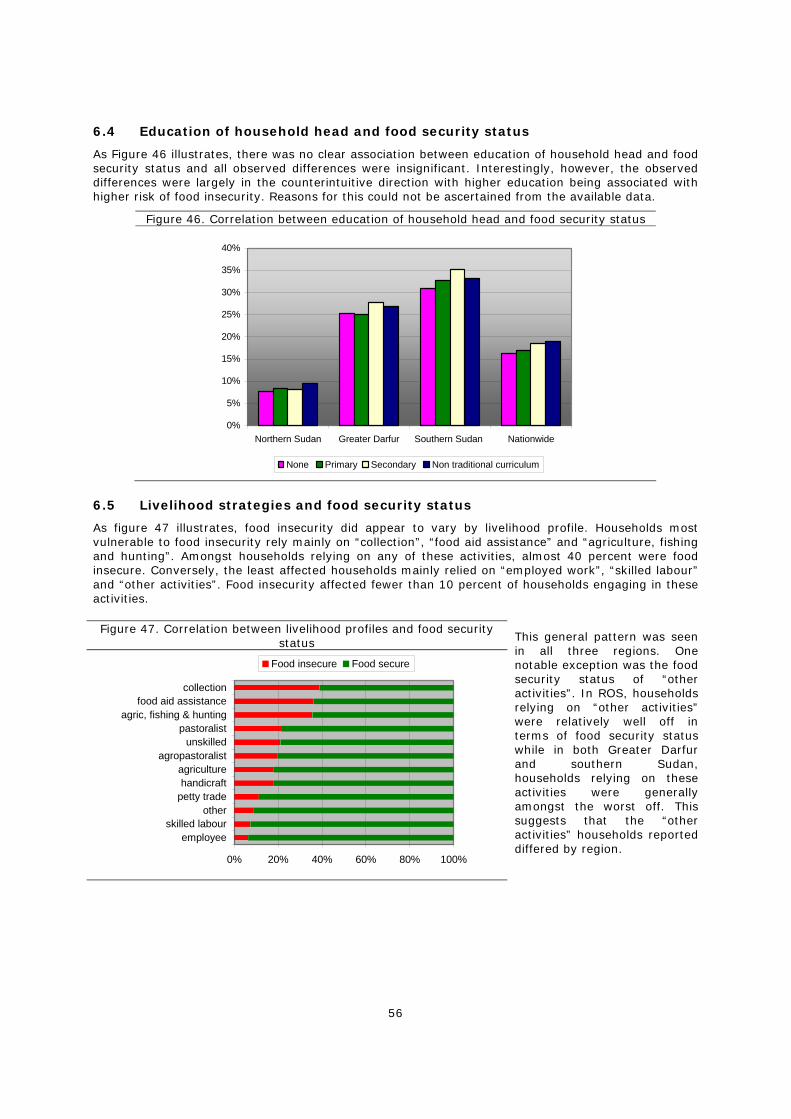
56
6.4 Education of household head and food security status
As Figure 46 illustrates, there was no clear association between education of household head and food security status and all observed differences were insignificant. Interestingly, however, the observed differences were largely in the counterintuitive direction with higher education being associated with higher risk of food insecurity. Reasons for this could not be ascertained from the available data.
Figure 46. Correlation between education of household head and food security status
0%
5%
10%
15%
20%
25%
30%
35%
40%
Northern Sudan Greater Darfur Southern Sudan Nationwide
None Primary Secondary Non traditional curriculum
6.5 Livelihood strategies and food security status
As figure 47 illustrates, food insecurity did appear to vary by livelihood profile. Households most vulnerable to food insecurity rely mainly on “collection”, “food aid assistance” and “agriculture, fishing and hunting”. Amongst households relying on any of these activities, almost 40 percent were food insecure. Conversely, the least affected households mainly relied on “employed work”, “skilled labour” and “other activities”. Food insecurity affected fewer than 10 percent of households engaging in these activities.
Figure 47. Correlation between livelihood profiles and food security status
0% 20% 40% 60% 80% 100%
employeeskilled labour
otherpetty tradehandicraftagriculture
agropastoralistunskilled
pastoralistagric, fishing & hunting
food aid assistancecollection
Food insecure Food secure
This general pattern was seen in all three regions. One notable exception was the food security status of “other activities”. In ROS, households relying on “other activities” were relatively well off in terms of food security status while in both Greater Darfur and southern Sudan, households relying on these activities were generally amongst the worst off. This suggests that the “other activities” households reported differed by region.
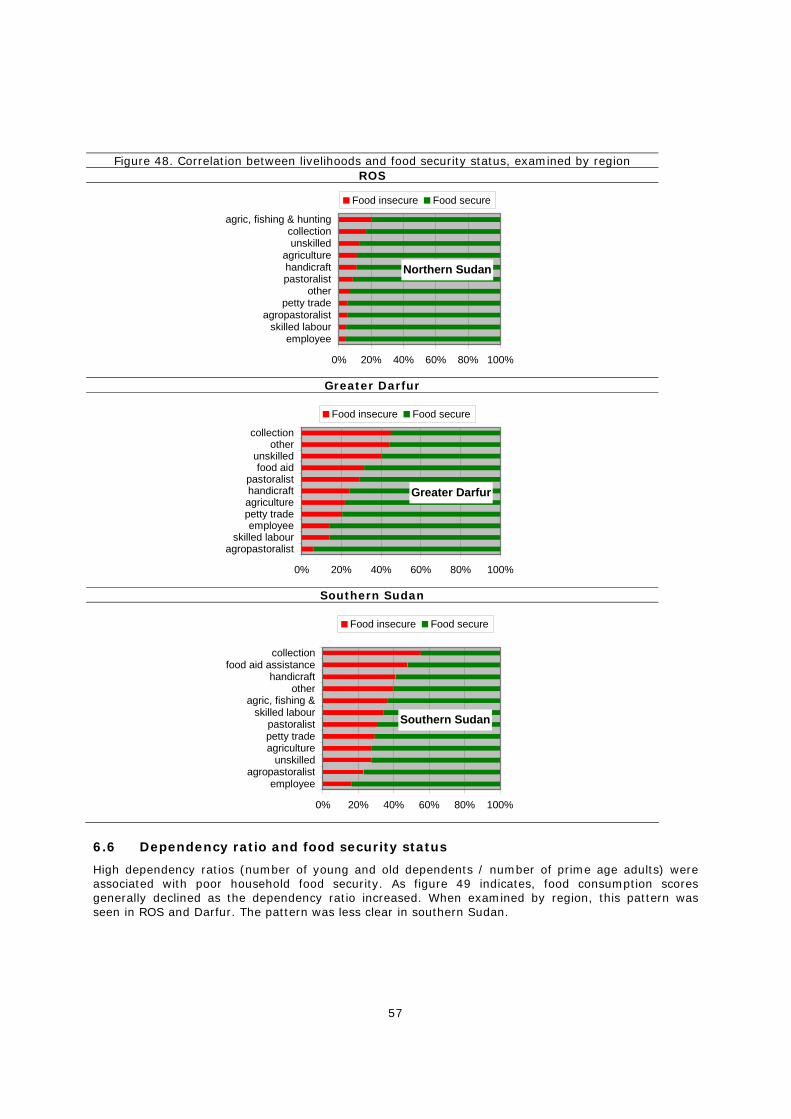
57
Figure 48. Correlation between livelihoods and food security status, examined by region ROS
Northern Sudan
0% 20% 40% 60% 80% 100%
employeeskilled labour
agropastoralistpetty trade
otherpastoralisthandicraftagriculture
unskilledcollection
agric, fishing & hunting
Food insecure Food secure
Greater Darfur
Greater Darfur
0% 20% 40% 60% 80% 100%
agropastoralistskilled labour
employeepetty tradeagriculturehandicraftpastoralist
food aidunskilled
othercollection
Food insecure Food secure
Southern Sudan
Southern Sudan
0% 20% 40% 60% 80% 100%
employeeagropastoralist
unskilledagriculturepetty tradepastoralist
skilled labouragric, fishing &
otherhandicraft
food aid assistancecollection
Food insecure Food secure
6.6 Dependency ratio and food security status
High dependency ratios (number of young and old dependents / number of prime age adults) were associated with poor household food security. As figure 49 indicates, food consumption scores generally declined as the dependency ratio increased. When examined by region, this pattern was seen in ROS and Darfur. The pattern was less clear in southern Sudan.
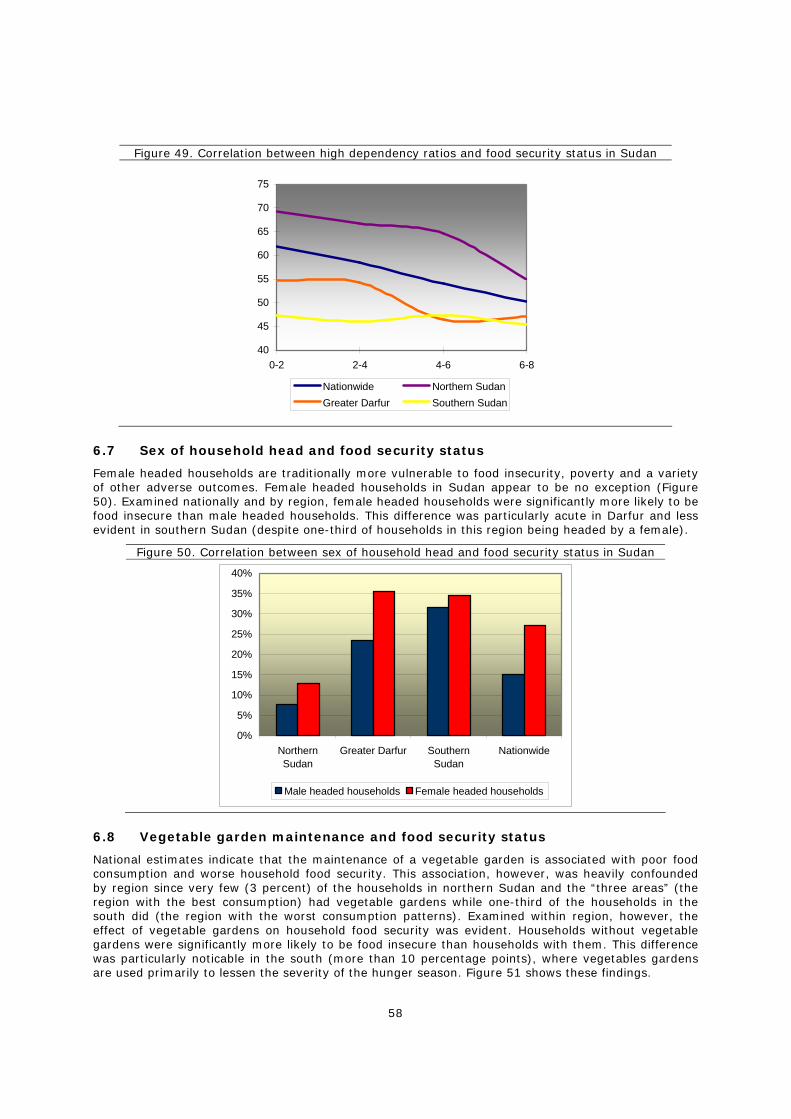
58
Figure 49. Correlation between high dependency ratios and food security status in Sudan
40
45
50
55
60
65
70
75
0-2 2-4 4-6 6-8
Nationwide Northern SudanGreater Darfur Southern Sudan
6.7 Sex of household head and food security status
Female headed households are traditionally more vulnerable to food insecurity, poverty and a variety of other adverse outcomes. Female headed households in Sudan appear to be no exception (Figure 50). Examined nationally and by region, female headed households were significantly more likely to be food insecure than male headed households. This difference was particularly acute in Darfur and less evident in southern Sudan (despite one-third of households in this region being headed by a female).
Figure 50. Correlation between sex of household head and food security status in Sudan
0%
5%
10%
15%
20%
25%
30%
35%
40%
NorthernSudan
Greater Darfur SouthernSudan
Nationwide
Male headed households Female headed households
6.8 Vegetable garden maintenance and food security status
National estimates indicate that the maintenance of a vegetable garden is associated with poor food consumption and worse household food security. This association, however, was heavily confounded by region since very few (3 percent) of the households in northern Sudan and the “three areas” (the region with the best consumption) had vegetable gardens while one-third of the households in the south did (the region with the worst consumption patterns). Examined within region, however, the effect of vegetable gardens on household food security was evident. Households without vegetable gardens were significantly more likely to be food insecure than households with them. This difference was particularly noticable in the south (more than 10 percentage points), where vegetables gardens are used primarily to lessen the severity of the hunger season. Figure 51 shows these findings.
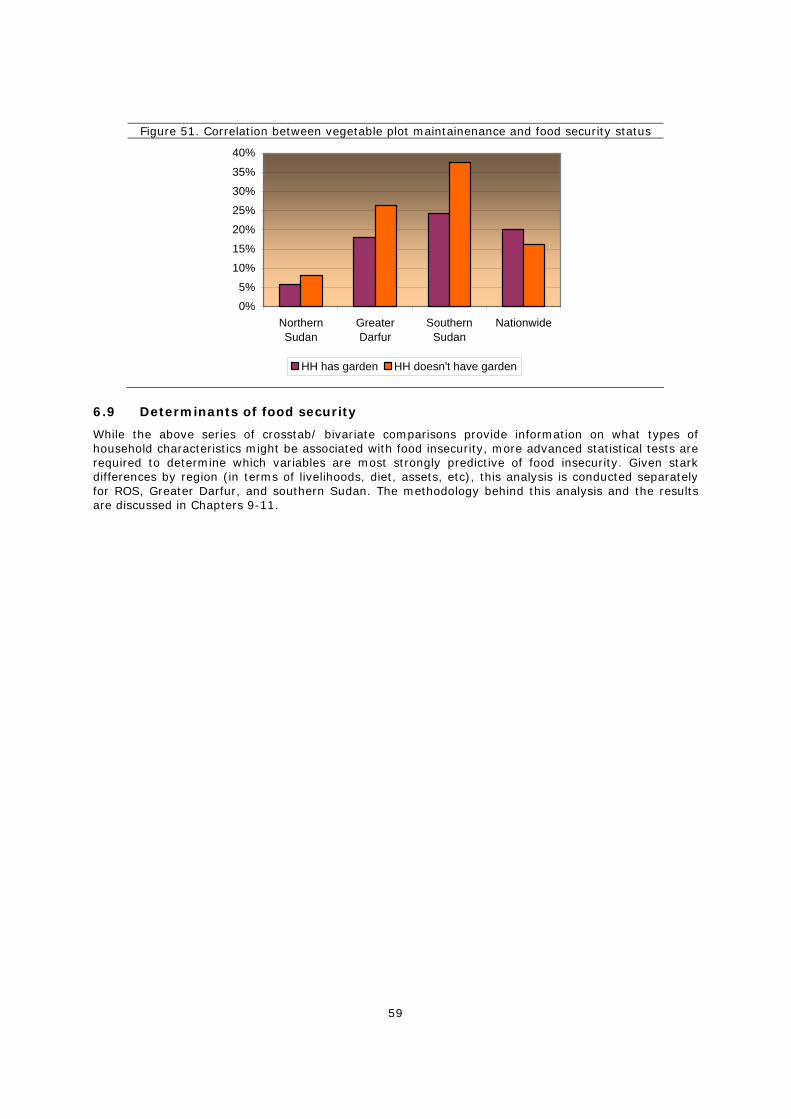
59
Figure 51. Correlation between vegetable plot maintainenance and food security status
0%
5%
10%
15%
20%
25%
30%
35%
40%
NorthernSudan
GreaterDarfur
SouthernSudan
Nationwide
HH has garden HH doesn't have garden
6.9 Determinants of food security
While the above series of crosstab/ bivariate comparisons provide information on what types of household characteristics might be associated with food insecurity, more advanced statistical tests are required to determine which variables are most strongly predictive of food insecurity. Given stark differences by region (in terms of livelihoods, diet, assets, etc), this analysis is conducted separately for ROS, Greater Darfur, and southern Sudan. The methodology behind this analysis and the results are discussed in Chapters 9-11.
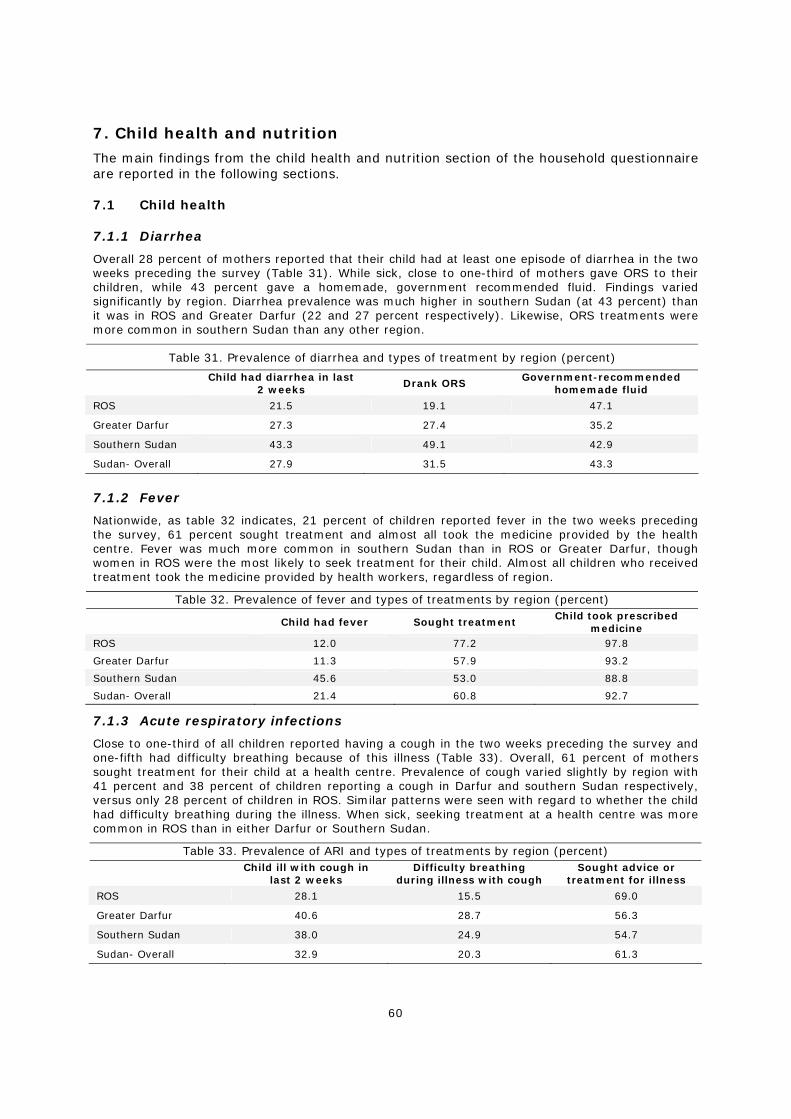
60
7. Child health and nutrition
The main findings from the child health and nutrition section of the household questionnaire are reported in the following sections.
7.1 Child health
7.1.1 Diarrhea
Overall 28 percent of mothers reported that their child had at least one episode of diarrhea in the two weeks preceding the survey (Table 31). While sick, close to one-third of mothers gave ORS to their children, while 43 percent gave a homemade, government recommended fluid. Findings varied significantly by region. Diarrhea prevalence was much higher in southern Sudan (at 43 percent) than it was in ROS and Greater Darfur (22 and 27 percent respectively). Likewise, ORS treatments were more common in southern Sudan than any other region.
Table 31. Prevalence of diarrhea and types of treatment by region (percent)
Child had diarrhea in last 2 weeks
Drank ORS Government-recommended homemade fluid
ROS 21.5 19.1 47.1
Greater Darfur 27.3 27.4 35.2
Southern Sudan 43.3 49.1 42.9
Sudan- Overall 27.9 31.5 43.3
7.1.2 Fever
Nationwide, as table 32 indicates, 21 percent of children reported fever in the two weeks preceding the survey, 61 percent sought treatment and almost all took the medicine provided by the health centre. Fever was much more common in southern Sudan than in ROS or Greater Darfur, though women in ROS were the most likely to seek treatment for their child. Almost all children who received treatment took the medicine provided by health workers, regardless of region.
Table 32. Prevalence of fever and types of treatments by region (percent)
Child had fever Sought treatment Child took prescribed
medicine ROS 12.0 77.2 97.8
Greater Darfur 11.3 57.9 93.2
Southern Sudan 45.6 53.0 88.8
Sudan- Overall 21.4 60.8 92.7
7.1.3 Acute respiratory infections
Close to one-third of all children reported having a cough in the two weeks preceding the survey and one-fifth had difficulty breathing because of this illness (Table 33). Overall, 61 percent of mothers sought treatment for their child at a health centre. Prevalence of cough varied slightly by region with 41 percent and 38 percent of children reporting a cough in Darfur and southern Sudan respectively, versus only 28 percent of children in ROS. Similar patterns were seen with regard to whether the child had difficulty breathing during the illness. When sick, seeking treatment at a health centre was more common in ROS than in either Darfur or Southern Sudan.
Table 33. Prevalence of ARI and types of treatments by region (percent)
Child ill with cough in
last 2 weeks Difficulty breathing
during illness with cough Sought advice or
treatment for illness
ROS 28.1 15.5 69.0
Greater Darfur 40.6 28.7 56.3
Southern Sudan 38.0 24.9 54.7
Sudan- Overall 32.9 20.3 61.3
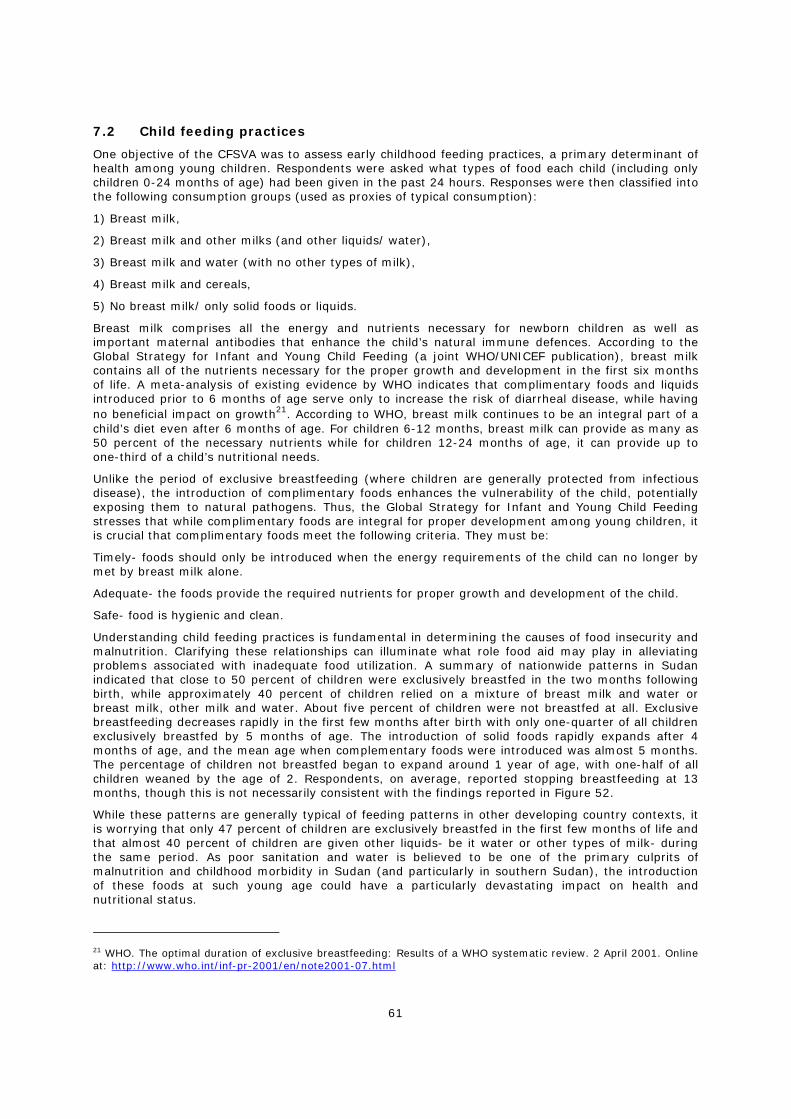
61
7.2 Child feeding practices
One objective of the CFSVA was to assess early childhood feeding practices, a primary determinant of health among young children. Respondents were asked what types of food each child (including only children 0-24 months of age) had been given in the past 24 hours. Responses were then classified into the following consumption groups (used as proxies of typical consumption):
1) Breast milk,
2) Breast milk and other milks (and other liquids/ water),
3) Breast milk and water (with no other types of milk),
4) Breast milk and cereals,
5) No breast milk/ only solid foods or liquids.
Breast milk comprises all the energy and nutrients necessary for newborn children as well as important maternal antibodies that enhance the child’s natural immune defences. According to the Global Strategy for Infant and Young Child Feeding (a joint WHO/UNICEF publication), breast milk contains all of the nutrients necessary for the proper growth and development in the first six months of life. A meta-analysis of existing evidence by WHO indicates that complimentary foods and liquids introduced prior to 6 months of age serve only to increase the risk of diarrheal disease, while having no beneficial impact on growth21. According to WHO, breast milk continues to be an integral part of a child’s diet even after 6 months of age. For children 6-12 months, breast milk can provide as many as 50 percent of the necessary nutrients while for children 12-24 months of age, it can provide up to one-third of a child’s nutritional needs.
Unlike the period of exclusive breastfeeding (where children are generally protected from infectious disease), the introduction of complimentary foods enhances the vulnerability of the child, potentially exposing them to natural pathogens. Thus, the Global Strategy for Infant and Young Child Feeding stresses that while complimentary foods are integral for proper development among young children, it is crucial that complimentary foods meet the following criteria. They must be:
Timely- foods should only be introduced when the energy requirements of the child can no longer by met by breast milk alone.
Adequate- the foods provide the required nutrients for proper growth and development of the child.
Safe- food is hygienic and clean.
Understanding child feeding practices is fundamental in determining the causes of food insecurity and malnutrition. Clarifying these relationships can illuminate what role food aid may play in alleviating problems associated with inadequate food utilization. A summary of nationwide patterns in Sudan indicated that close to 50 percent of children were exclusively breastfed in the two months following birth, while approximately 40 percent of children relied on a mixture of breast milk and water or breast milk, other milk and water. About five percent of children were not breastfed at all. Exclusive breastfeeding decreases rapidly in the first few months after birth with only one-quarter of all children exclusively breastfed by 5 months of age. The introduction of solid foods rapidly expands after 4 months of age, and the mean age when complementary foods were introduced was almost 5 months. The percentage of children not breastfed began to expand around 1 year of age, with one-half of all children weaned by the age of 2. Respondents, on average, reported stopping breastfeeding at 13 months, though this is not necessarily consistent with the findings reported in Figure 52.
While these patterns are generally typical of feeding patterns in other developing country contexts, it is worrying that only 47 percent of children are exclusively breastfed in the first few months of life and that almost 40 percent of children are given other liquids- be it water or other types of milk- during the same period. As poor sanitation and water is believed to be one of the primary culprits of malnutrition and childhood morbidity in Sudan (and particularly in southern Sudan), the introduction of these foods at such young age could have a particularly devastating impact on health and nutritional status.
21 WHO. The optimal duration of exclusive breastfeeding: Results of a WHO systematic review. 2 April 2001. Online at: http://www.who.int/inf-pr-2001/en/note2001-07.html
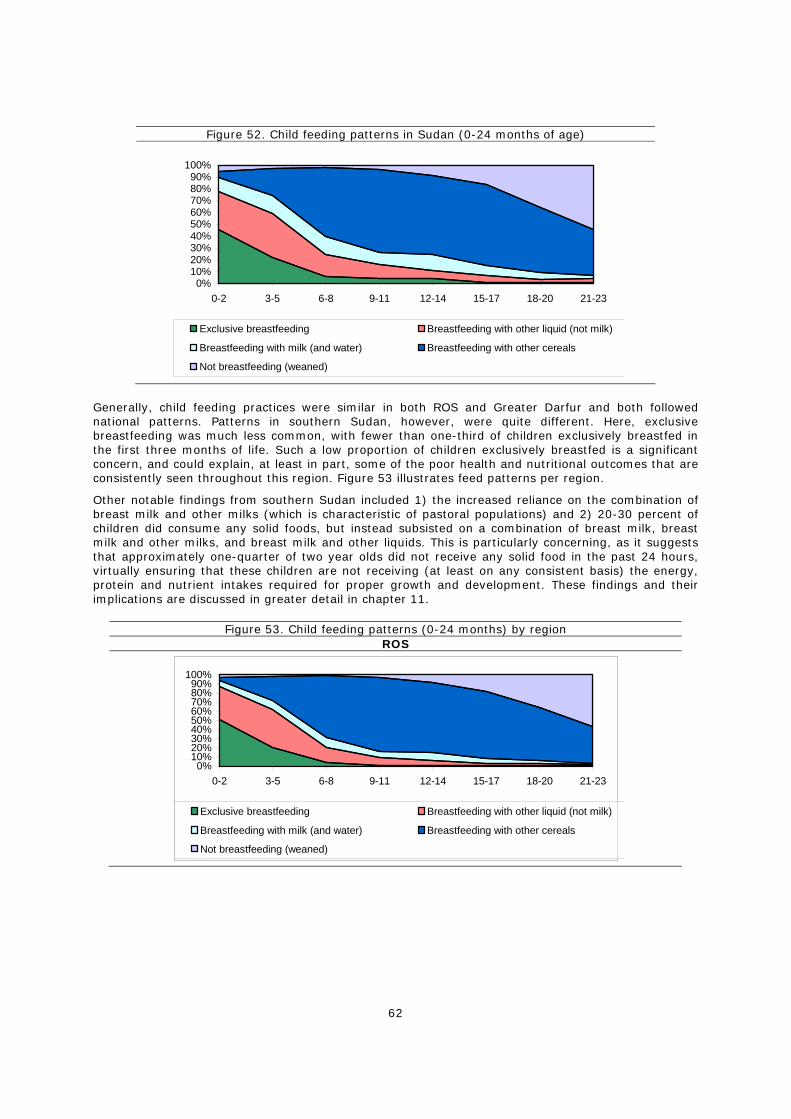
62
Figure 52. Child feeding patterns in Sudan (0-24 months of age)
0%10%20%30%40%50%60%70%80%90%
100%
0-2 3-5 6-8 9-11 12-14 15-17 18-20 21-23
Exclusive breastfeeding Breastfeeding with other liquid (not milk)
Breastfeeding with milk (and water) Breastfeeding with other cereals
Not breastfeeding (weaned)
Generally, child feeding practices were similar in both ROS and Greater Darfur and both followed national patterns. Patterns in southern Sudan, however, were quite different. Here, exclusive breastfeeding was much less common, with fewer than one-third of children exclusively breastfed in the first three months of life. Such a low proportion of children exclusively breastfed is a significant concern, and could explain, at least in part, some of the poor health and nutritional outcomes that are consistently seen throughout this region. Figure 53 illustrates feed patterns per region.
Other notable findings from southern Sudan included 1) the increased reliance on the combination of breast milk and other milks (which is characteristic of pastoral populations) and 2) 20-30 percent of children did consume any solid foods, but instead subsisted on a combination of breast milk, breast milk and other milks, and breast milk and other liquids. This is particularly concerning, as it suggests that approximately one-quarter of two year olds did not receive any solid food in the past 24 hours, virtually ensuring that these children are not receiving (at least on any consistent basis) the energy, protein and nutrient intakes required for proper growth and development. These findings and their implications are discussed in greater detail in chapter 11.
Figure 53. Child feeding patterns (0-24 months) by region ROS
0%10%20%30%40%50%60%70%80%90%
100%
0-2 3-5 6-8 9-11 12-14 15-17 18-20 21-23
Exclusive breastfeeding Breastfeeding with other liquid (not milk)
Breastfeeding with milk (and water) Breastfeeding with other cereals
Not breastfeeding (weaned)
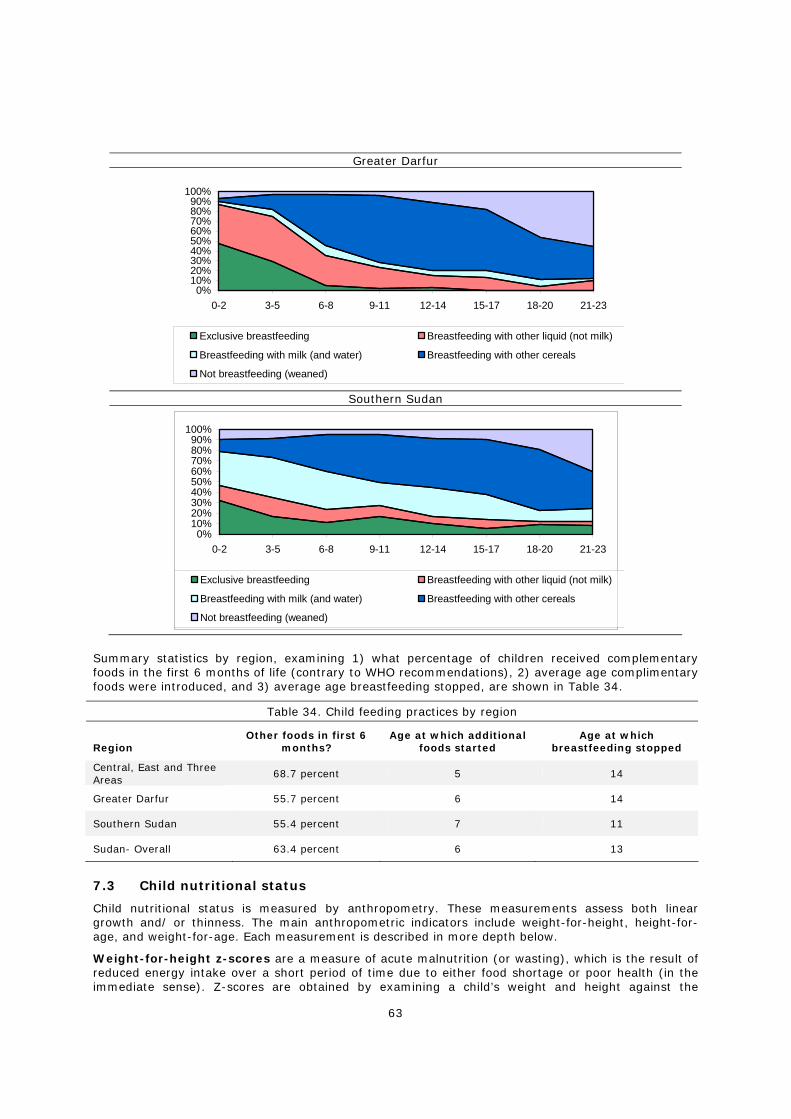
63
Greater Darfur
0%10%20%30%40%50%60%70%80%90%
100%
0-2 3-5 6-8 9-11 12-14 15-17 18-20 21-23
Exclusive breastfeeding Breastfeeding with other liquid (not milk)
Breastfeeding with milk (and water) Breastfeeding with other cereals
Not breastfeeding (weaned)
Southern Sudan
0%10%20%30%40%50%60%70%80%90%
100%
0-2 3-5 6-8 9-11 12-14 15-17 18-20 21-23
Exclusive breastfeeding Breastfeeding with other liquid (not milk)
Breastfeeding with milk (and water) Breastfeeding with other cereals
Not breastfeeding (weaned)
Summary statistics by region, examining 1) what percentage of children received complementary foods in the first 6 months of life (contrary to WHO recommendations), 2) average age complimentary foods were introduced, and 3) average age breastfeeding stopped, are shown in Table 34.
Table 34. Child feeding practices by region
Region
Other foods in first 6 months?
Age at which additional foods started
Age at which breastfeeding stopped
Central, East and Three Areas
68.7 percent 5 14
Greater Darfur 55.7 percent 6 14
Southern Sudan 55.4 percent 7 11
Sudan- Overall 63.4 percent 6 13
7.3 Child nutritional status
Child nutritional status is measured by anthropometry. These measurements assess both linear growth and/ or thinness. The main anthropometric indicators include weight-for-height, height-for-age, and weight-for-age. Each measurement is described in more depth below.
Weight-for-height z-scores are a measure of acute malnutrition (or wasting), which is the result of reduced energy intake over a short period of time due to either food shortage or poor health (in the immediate sense). Z-scores are obtained by examining a child’s weight and height against the
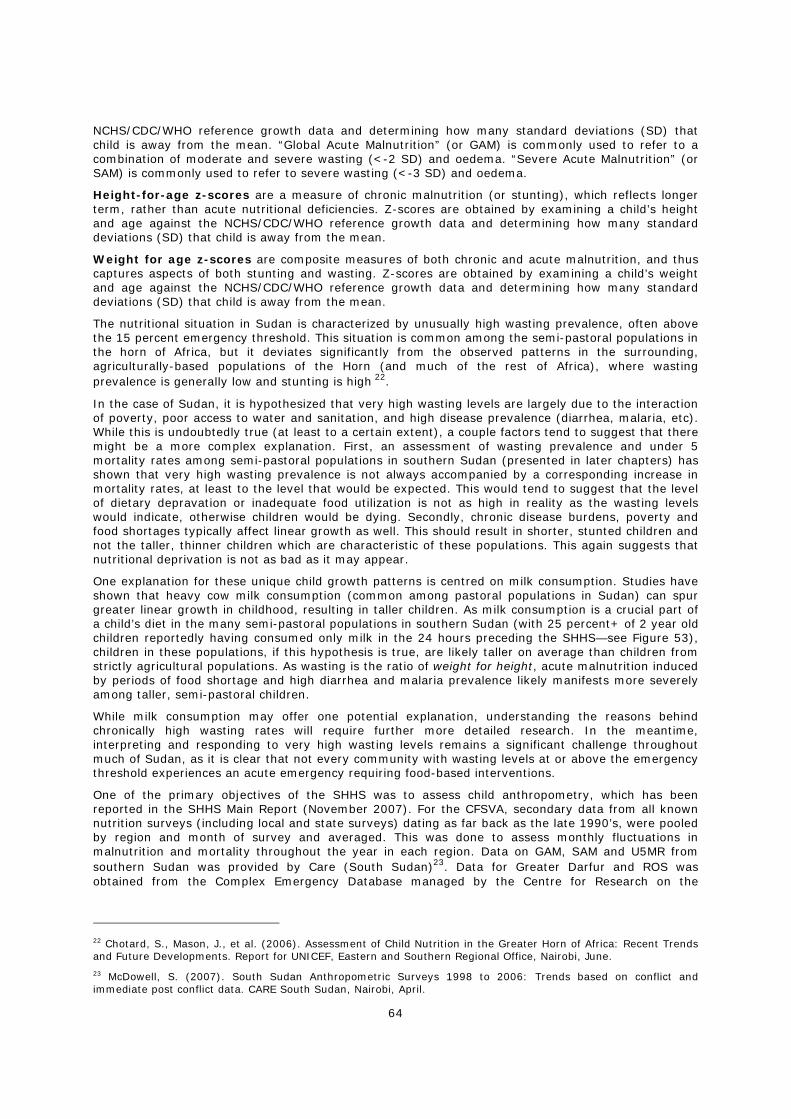
64
NCHS/CDC/WHO reference growth data and determining how many standard deviations (SD) that child is away from the mean. “Global Acute Malnutrition” (or GAM) is commonly used to refer to a combination of moderate and severe wasting (<-2 SD) and oedema. “Severe Acute Malnutrition” (or SAM) is commonly used to refer to severe wasting (<-3 SD) and oedema.
Height-for-age z-scores are a measure of chronic malnutrition (or stunting), which reflects longer term, rather than acute nutritional deficiencies. Z-scores are obtained by examining a child’s height and age against the NCHS/CDC/WHO reference growth data and determining how many standard deviations (SD) that child is away from the mean.
Weight for age z-scores are composite measures of both chronic and acute malnutrition, and thus captures aspects of both stunting and wasting. Z-scores are obtained by examining a child’s weight and age against the NCHS/CDC/WHO reference growth data and determining how many standard deviations (SD) that child is away from the mean.
The nutritional situation in Sudan is characterized by unusually high wasting prevalence, often above the 15 percent emergency threshold. This situation is common among the semi-pastoral populations in the horn of Africa, but it deviates significantly from the observed patterns in the surrounding, agriculturally-based populations of the Horn (and much of the rest of Africa), where wasting prevalence is generally low and stunting is high 22.
In the case of Sudan, it is hypothesized that very high wasting levels are largely due to the interaction of poverty, poor access to water and sanitation, and high disease prevalence (diarrhea, malaria, etc). While this is undoubtedly true (at least to a certain extent), a couple factors tend to suggest that there might be a more complex explanation. First, an assessment of wasting prevalence and under 5 mortality rates among semi-pastoral populations in southern Sudan (presented in later chapters) has shown that very high wasting prevalence is not always accompanied by a corresponding increase in mortality rates, at least to the level that would be expected. This would tend to suggest that the level of dietary depravation or inadequate food utilization is not as high in reality as the wasting levels would indicate, otherwise children would be dying. Secondly, chronic disease burdens, poverty and food shortages typically affect linear growth as well. This should result in shorter, stunted children and not the taller, thinner children which are characteristic of these populations. This again suggests that nutritional deprivation is not as bad as it may appear.
One explanation for these unique child growth patterns is centred on milk consumption. Studies have shown that heavy cow milk consumption (common among pastoral populations in Sudan) can spur greater linear growth in childhood, resulting in taller children. As milk consumption is a crucial part of a child’s diet in the many semi-pastoral populations in southern Sudan (with 25 percent+ of 2 year old children reportedly having consumed only milk in the 24 hours preceding the SHHS—see Figure 53), children in these populations, if this hypothesis is true, are likely taller on average than children from strictly agricultural populations. As wasting is the ratio of weight for height, acute malnutrition induced by periods of food shortage and high diarrhea and malaria prevalence likely manifests more severely among taller, semi-pastoral children.
While milk consumption may offer one potential explanation, understanding the reasons behind chronically high wasting rates will require further more detailed research. In the meantime, interpreting and responding to very high wasting levels remains a significant challenge throughout much of Sudan, as it is clear that not every community with wasting levels at or above the emergency threshold experiences an acute emergency requiring food-based interventions.
One of the primary objectives of the SHHS was to assess child anthropometry, which has been reported in the SHHS Main Report (November 2007). For the CFSVA, secondary data from all known nutrition surveys (including local and state surveys) dating as far back as the late 1990’s, were pooled by region and month of survey and averaged. This was done to assess monthly fluctuations in malnutrition and mortality throughout the year in each region. Data on GAM, SAM and U5MR from southern Sudan was provided by Care (South Sudan)23. Data for Greater Darfur and ROS was obtained from the Complex Emergency Database managed by the Centre for Research on the
22 Chotard, S., Mason, J., et al. (2006). Assessment of Child Nutrition in the Greater Horn of Africa: Recent Trends and Future Developments. Report for UNICEF, Eastern and Southern Regional Office, Nairobi, June.
23 McDowell, S. (2007). South Sudan Anthropometric Surveys 1998 to 2006: Trends based on conflict and immediate post conflict data. CARE South Sudan, Nairobi, April.
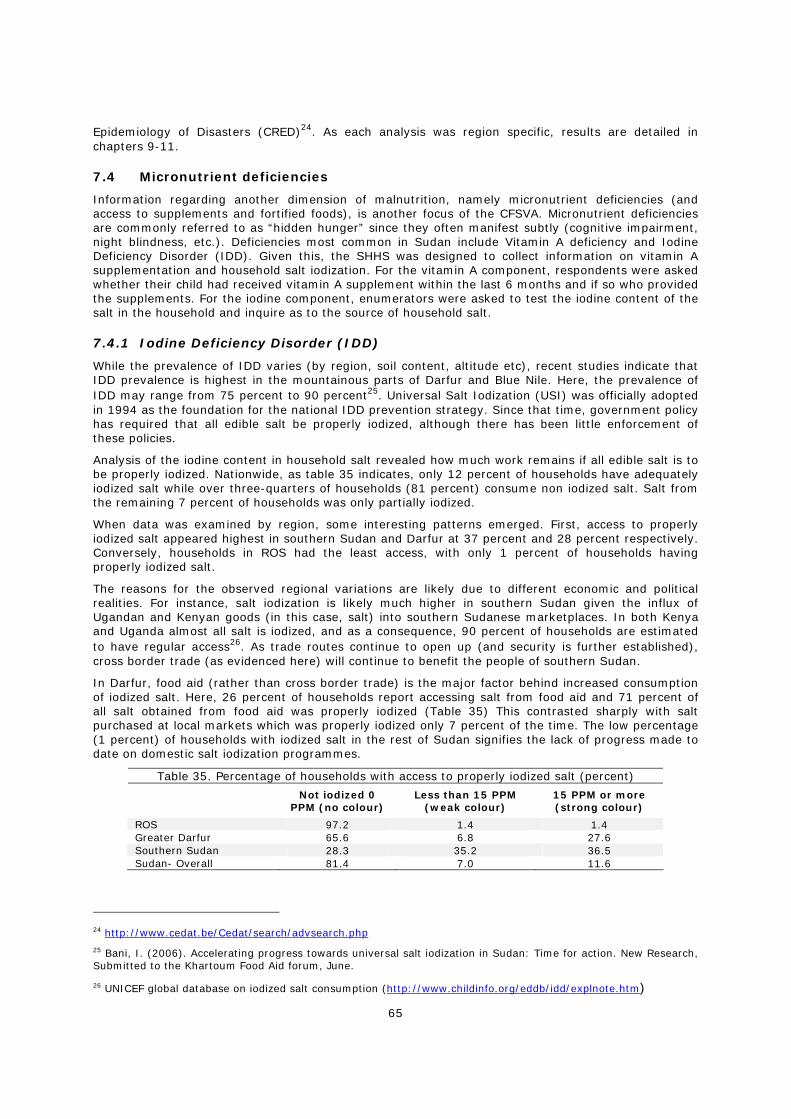
65
Epidemiology of Disasters (CRED)24. As each analysis was region specific, results are detailed in chapters 9-11.
7.4 Micronutrient deficiencies
Information regarding another dimension of malnutrition, namely micronutrient deficiencies (and access to supplements and fortified foods), is another focus of the CFSVA. Micronutrient deficiencies are commonly referred to as “hidden hunger” since they often manifest subtly (cognitive impairment, night blindness, etc.). Deficiencies most common in Sudan include Vitamin A deficiency and Iodine Deficiency Disorder (IDD). Given this, the SHHS was designed to collect information on vitamin A supplementation and household salt iodization. For the vitamin A component, respondents were asked whether their child had received vitamin A supplement within the last 6 months and if so who provided the supplements. For the iodine component, enumerators were asked to test the iodine content of the salt in the household and inquire as to the source of household salt.
7.4.1 Iodine Deficiency Disorder (IDD)
While the prevalence of IDD varies (by region, soil content, altitude etc), recent studies indicate that IDD prevalence is highest in the mountainous parts of Darfur and Blue Nile. Here, the prevalence of IDD may range from 75 percent to 90 percent25. Universal Salt Iodization (USI) was officially adopted in 1994 as the foundation for the national IDD prevention strategy. Since that time, government policy has required that all edible salt be properly iodized, although there has been little enforcement of these policies.
Analysis of the iodine content in household salt revealed how much work remains if all edible salt is to be properly iodized. Nationwide, as table 35 indicates, only 12 percent of households have adequately iodized salt while over three-quarters of households (81 percent) consume non iodized salt. Salt from the remaining 7 percent of households was only partially iodized.
When data was examined by region, some interesting patterns emerged. First, access to properly iodized salt appeared highest in southern Sudan and Darfur at 37 percent and 28 percent respectively. Conversely, households in ROS had the least access, with only 1 percent of households having properly iodized salt.
The reasons for the observed regional variations are likely due to different economic and political realities. For instance, salt iodization is likely much higher in southern Sudan given the influx of Ugandan and Kenyan goods (in this case, salt) into southern Sudanese marketplaces. In both Kenya and Uganda almost all salt is iodized, and as a consequence, 90 percent of households are estimated to have regular access26. As trade routes continue to open up (and security is further established), cross border trade (as evidenced here) will continue to benefit the people of southern Sudan.
In Darfur, food aid (rather than cross border trade) is the major factor behind increased consumption of iodized salt. Here, 26 percent of households report accessing salt from food aid and 71 percent of all salt obtained from food aid was properly iodized (Table 35) This contrasted sharply with salt purchased at local markets which was properly iodized only 7 percent of the time. The low percentage (1 percent) of households with iodized salt in the rest of Sudan signifies the lack of progress made to date on domestic salt iodization programmes.
Table 35. Percentage of households with access to properly iodized salt (percent) Not iodized 0
PPM (no colour) Less than 15 PPM
(weak colour) 15 PPM or more (strong colour)
ROS 97.2 1.4 1.4 Greater Darfur 65.6 6.8 27.6 Southern Sudan 28.3 35.2 36.5 Sudan- Overall 81.4 7.0 11.6
24 http://www.cedat.be/Cedat/search/advsearch.php
25 Bani, I. (2006). Accelerating progress towards universal salt iodization in Sudan: Time for action. New Research, Submitted to the Khartoum Food Aid forum, June. 26 UNICEF global database on iodized salt consumption (http://www.childinfo.org/eddb/idd/explnote.htm)
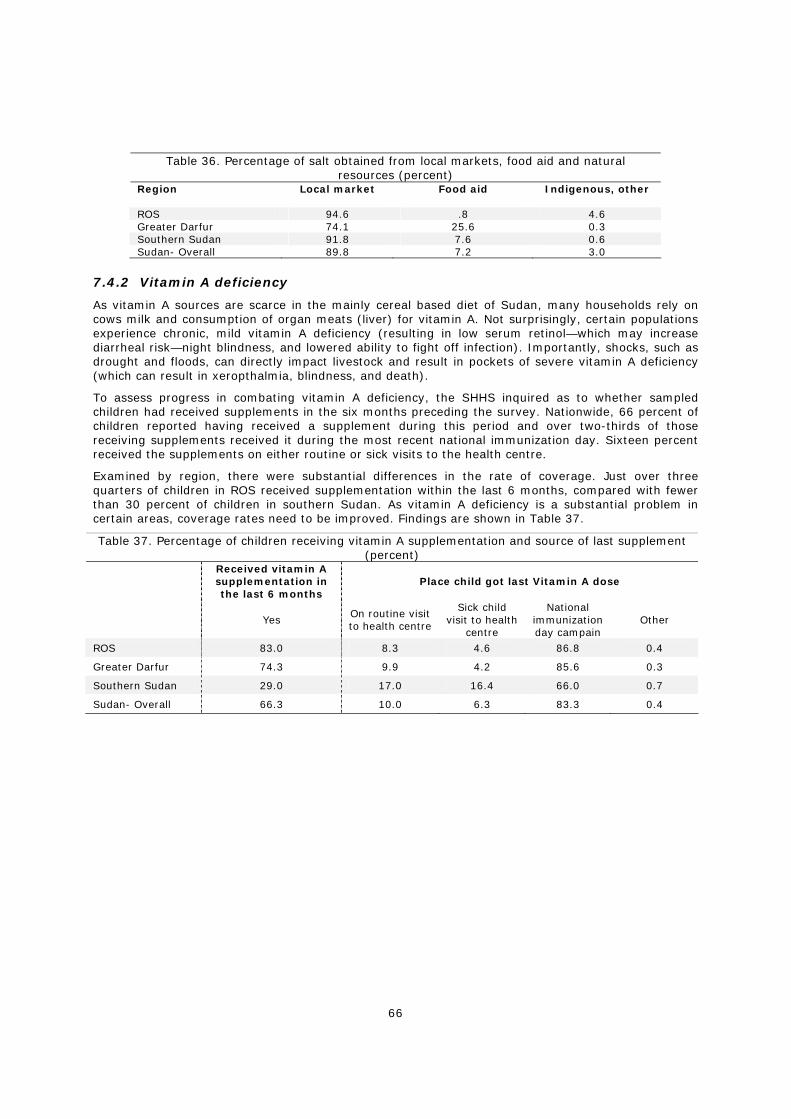
66
Table 36. Percentage of salt obtained from local markets, food aid and natural resources (percent)
Region Local market Food aid Indigenous, other
ROS 94.6 .8 4.6 Greater Darfur 74.1 25.6 0.3 Southern Sudan 91.8 7.6 0.6 Sudan- Overall 89.8 7.2 3.0
7.4.2 Vitamin A deficiency
As vitamin A sources are scarce in the mainly cereal based diet of Sudan, many households rely on cows milk and consumption of organ meats (liver) for vitamin A. Not surprisingly, certain populations experience chronic, mild vitamin A deficiency (resulting in low serum retinol—which may increase diarrheal risk—night blindness, and lowered ability to fight off infection). Importantly, shocks, such as drought and floods, can directly impact livestock and result in pockets of severe vitamin A deficiency (which can result in xeropthalmia, blindness, and death).
To assess progress in combating vitamin A deficiency, the SHHS inquired as to whether sampled children had received supplements in the six months preceding the survey. Nationwide, 66 percent of children reported having received a supplement during this period and over two-thirds of those receiving supplements received it during the most recent national immunization day. Sixteen percent received the supplements on either routine or sick visits to the health centre.
Examined by region, there were substantial differences in the rate of coverage. Just over three quarters of children in ROS received supplementation within the last 6 months, compared with fewer than 30 percent of children in southern Sudan. As vitamin A deficiency is a substantial problem in certain areas, coverage rates need to be improved. Findings are shown in Table 37.
Table 37. Percentage of children receiving vitamin A supplementation and source of last supplement (percent)
Received vitamin A supplementation in the last 6 months
Place child got last Vitamin A dose
Yes On routine visit to health centre
Sick child visit to health
centre
National immunization day campain
Other
ROS 83.0 8.3 4.6 86.8 0.4
Greater Darfur 74.3 9.9 4.2 85.6 0.3
Southern Sudan 29.0 17.0 16.4 66.0 0.7
Sudan- Overall 66.3 10.0 6.3 83.3 0.4
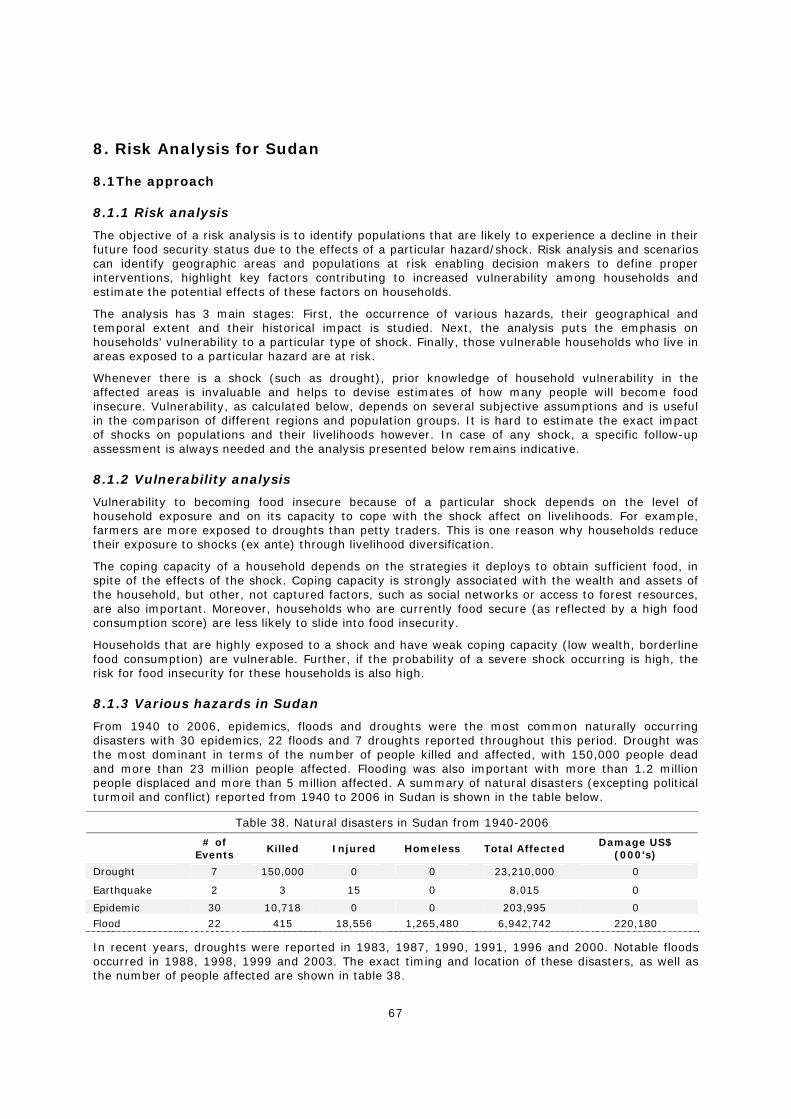
67
8. Risk Analysis for Sudan
8.1The approach
8.1.1 Risk analysis
The objective of a risk analysis is to identify populations that are likely to experience a decline in their future food security status due to the effects of a particular hazard/shock. Risk analysis and scenarios can identify geographic areas and populations at risk enabling decision makers to define proper interventions, highlight key factors contributing to increased vulnerability among households and estimate the potential effects of these factors on households.
The analysis has 3 main stages: First, the occurrence of various hazards, their geographical and temporal extent and their historical impact is studied. Next, the analysis puts the emphasis on households’ vulnerability to a particular type of shock. Finally, those vulnerable households who live in areas exposed to a particular hazard are at risk.
Whenever there is a shock (such as drought), prior knowledge of household vulnerability in the affected areas is invaluable and helps to devise estimates of how many people will become food insecure. Vulnerability, as calculated below, depends on several subjective assumptions and is useful in the comparison of different regions and population groups. It is hard to estimate the exact impact of shocks on populations and their livelihoods however. In case of any shock, a specific follow-up assessment is always needed and the analysis presented below remains indicative.
8.1.2 Vulnerability analysis
Vulnerability to becoming food insecure because of a particular shock depends on the level of household exposure and on its capacity to cope with the shock affect on livelihoods. For example, farmers are more exposed to droughts than petty traders. This is one reason why households reduce their exposure to shocks (ex ante) through livelihood diversification.
The coping capacity of a household depends on the strategies it deploys to obtain sufficient food, in spite of the effects of the shock. Coping capacity is strongly associated with the wealth and assets of the household, but other, not captured factors, such as social networks or access to forest resources, are also important. Moreover, households who are currently food secure (as reflected by a high food consumption score) are less likely to slide into food insecurity.
Households that are highly exposed to a shock and have weak coping capacity (low wealth, borderline food consumption) are vulnerable. Further, if the probability of a severe shock occurring is high, the risk for food insecurity for these households is also high.
8.1.3 Various hazards in Sudan
From 1940 to 2006, epidemics, floods and droughts were the most common naturally occurring disasters with 30 epidemics, 22 floods and 7 droughts reported throughout this period. Drought was the most dominant in terms of the number of people killed and affected, with 150,000 people dead and more than 23 million people affected. Flooding was also important with more than 1.2 million people displaced and more than 5 million affected. A summary of natural disasters (excepting political turmoil and conflict) reported from 1940 to 2006 in Sudan is shown in the table below.
Table 38. Natural disasters in Sudan from 1940-2006
# of Events Killed Injured Homeless Total Affected
Damage US$ (000's)
Drought 7 150,000 0 0 23,210,000 0
Earthquake 2 3 15 0 8,015 0
Epidemic 30 10,718 0 0 203,995 0
Flood 22 415 18,556 1,265,480 6,942,742 220,180
In recent years, droughts were reported in 1983, 1987, 1990, 1991, 1996 and 2000. Notable floods occurred in 1988, 1998, 1999 and 2003. The exact timing and location of these disasters, as well as the number of people affected are shown in table 38.
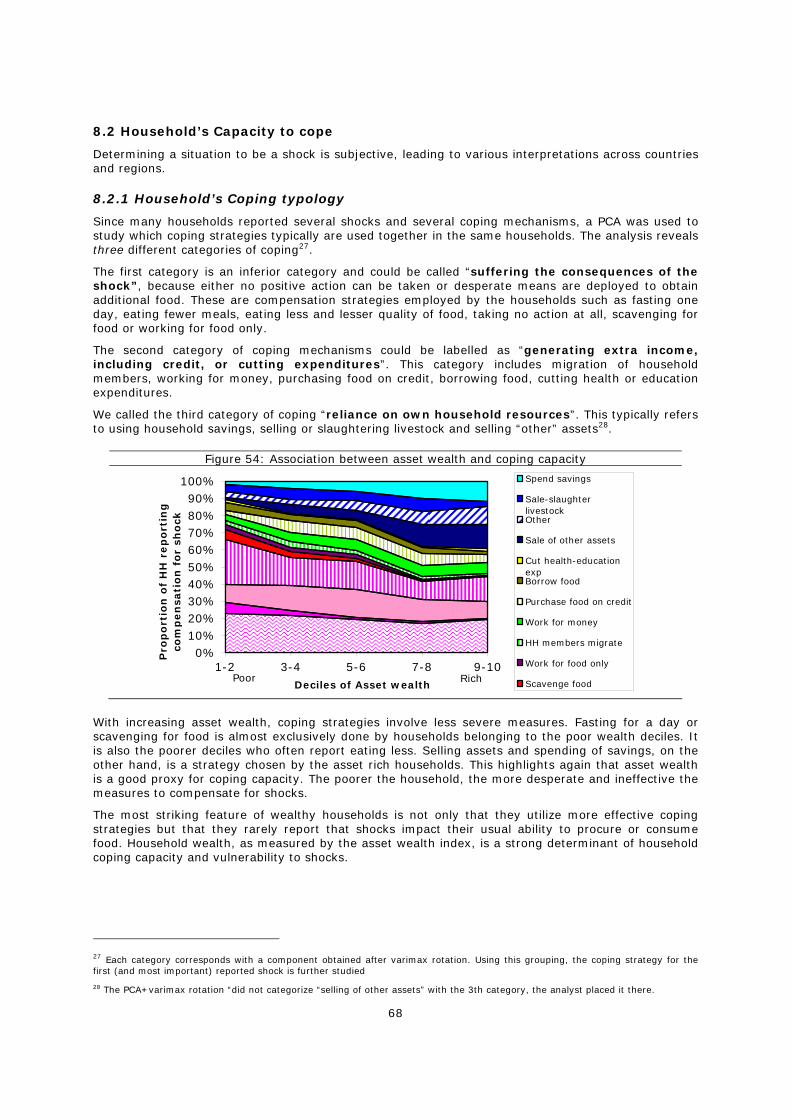
68
8.2 Household’s Capacity to cope
Determining a situation to be a shock is subjective, leading to various interpretations across countries and regions.
8.2.1 Household’s Coping typology
Since many households reported several shocks and several coping mechanisms, a PCA was used to study which coping strategies typically are used together in the same households. The analysis reveals three different categories of coping27.
The first category is an inferior category and could be called “suffering the consequences of the shock”, because either no positive action can be taken or desperate means are deployed to obtain additional food. These are compensation strategies employed by the households such as fasting one day, eating fewer meals, eating less and lesser quality of food, taking no action at all, scavenging for food or working for food only.
The second category of coping mechanisms could be labelled as “generating extra income, including credit, or cutting expenditures”. This category includes migration of household members, working for money, purchasing food on credit, borrowing food, cutting health or education expenditures.
We called the third category of coping “reliance on own household resources”. This typically refers to using household savings, selling or slaughtering livestock and selling “other” assets28.
Figure 54: Association between asset wealth and coping capacity
0%10%20%30%40%50%60%70%80%90%
100%
1-2 3-4 5-6 7-8 9-10
Spend savings
Sale-slaughterlivestockOther
Sale of other assets
Cut health-educationexpBorrow food
Purchase food on credit
Work for money
HH members migrate
Work for food only
Scavenge foodDeciles of Asset wealthPoor Rich
Pro
po
rtio
n o
f H
H r
ep
ort
ing
co
mp
en
sati
on
fo
r sh
ock
With increasing asset wealth, coping strategies involve less severe measures. Fasting for a day or scavenging for food is almost exclusively done by households belonging to the poor wealth deciles. It is also the poorer deciles who often report eating less. Selling assets and spending of savings, on the other hand, is a strategy chosen by the asset rich households. This highlights again that asset wealth is a good proxy for coping capacity. The poorer the household, the more desperate and ineffective the measures to compensate for shocks.
The most striking feature of wealthy households is not only that they utilize more effective coping strategies but that they rarely report that shocks impact their usual ability to procure or consume food. Household wealth, as measured by the asset wealth index, is a strong determinant of household coping capacity and vulnerability to shocks.
27 Each category corresponds with a component obtained after varimax rotation. Using this grouping, the coping strategy for the first (and most important) reported shock is further studied
28 The PCA+varimax rotation “did not categorize “selling of other assets” with the 3th category, the analyst placed it there.
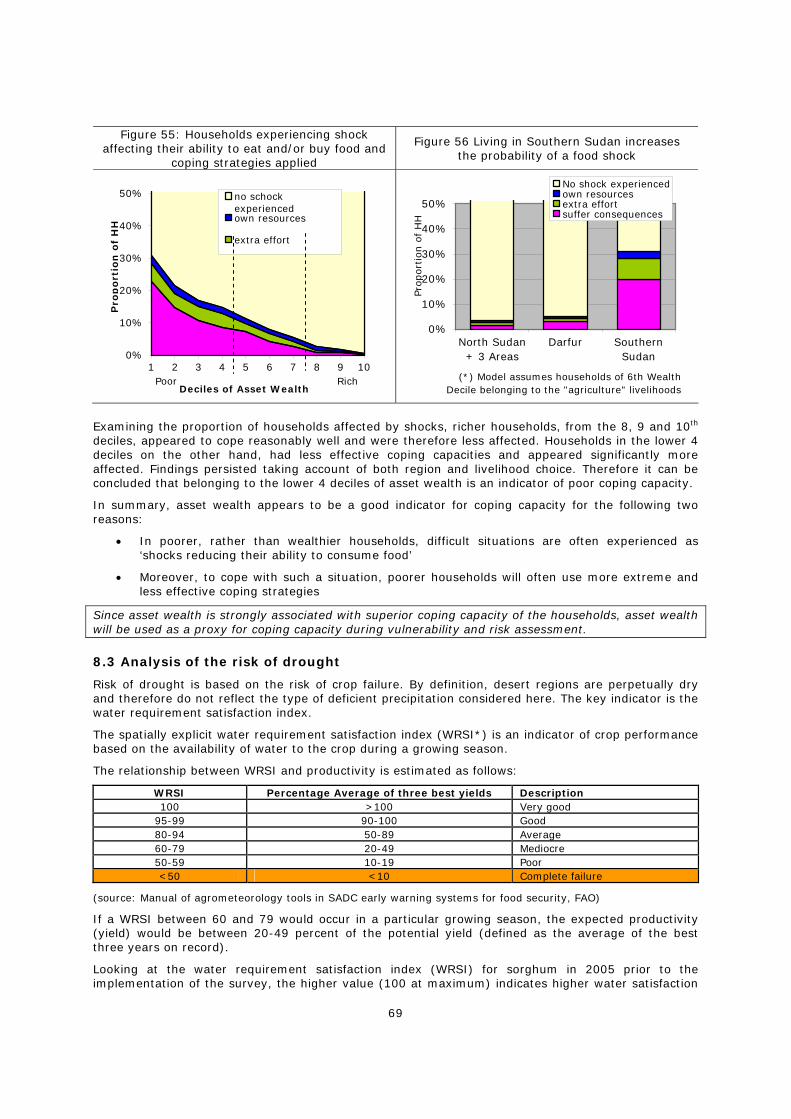
69
Figure 55: Households experiencing shock affecting their ability to eat and/or buy food and
coping strategies applied
Figure 56 Living in Southern Sudan increases the probability of a food shock
0%
10%
20%
30%
40%
50%
1 2 3 4 5 6 7 8 9 10
no schockexperiencedown resources
extra effort
Pro
po
rtio
n o
f H
H
Deciles of Asset WealthPoor Rich
0%
10%
20%
30%
40%
50%
North Sudan+ 3 Areas
Darfur SouthernSudan
No shock experiencedown resourcesextra effortsuffer consequences
Pro
port
ion o
f H
H
(*) Model assumes households of 6th WealthDecile belonging to the "agriculture" livelihoods
Examining the proportion of households affected by shocks, richer households, from the 8, 9 and 10th deciles, appeared to cope reasonably well and were therefore less affected. Households in the lower 4 deciles on the other hand, had less effective coping capacities and appeared significantly more affected. Findings persisted taking account of both region and livelihood choice. Therefore it can be concluded that belonging to the lower 4 deciles of asset wealth is an indicator of poor coping capacity.
In summary, asset wealth appears to be a good indicator for coping capacity for the following two reasons:
• In poorer, rather than wealthier households, difficult situations are often experienced as ‘shocks reducing their ability to consume food’
• Moreover, to cope with such a situation, poorer households will often use more extreme and less effective coping strategies
Since asset wealth is strongly associated with superior coping capacity of the households, asset wealth will be used as a proxy for coping capacity during vulnerability and risk assessment.
8.3 Analysis of the risk of drought
Risk of drought is based on the risk of crop failure. By definition, desert regions are perpetually dry and therefore do not reflect the type of deficient precipitation considered here. The key indicator is the water requirement satisfaction index.
The spatially explicit water requirement satisfaction index (WRSI*) is an indicator of crop performance based on the availability of water to the crop during a growing season.
The relationship between WRSI and productivity is estimated as follows:
WRSI Percentage Average of three best yields Description 100 >100 Very good
95-99 90-100 Good 80-94 50-89 Average 60-79 20-49 Mediocre 50-59 10-19 Poor <50 <10 Complete failure
(source: Manual of agrometeorology tools in SADC early warning systems for food security, FAO)
If a WRSI between 60 and 79 would occur in a particular growing season, the expected productivity (yield) would be between 20-49 percent of the potential yield (defined as the average of the best three years on record).
Looking at the water requirement satisfaction index (WRSI) for sorghum in 2005 prior to the implementation of the survey, the higher value (100 at maximum) indicates higher water satisfaction
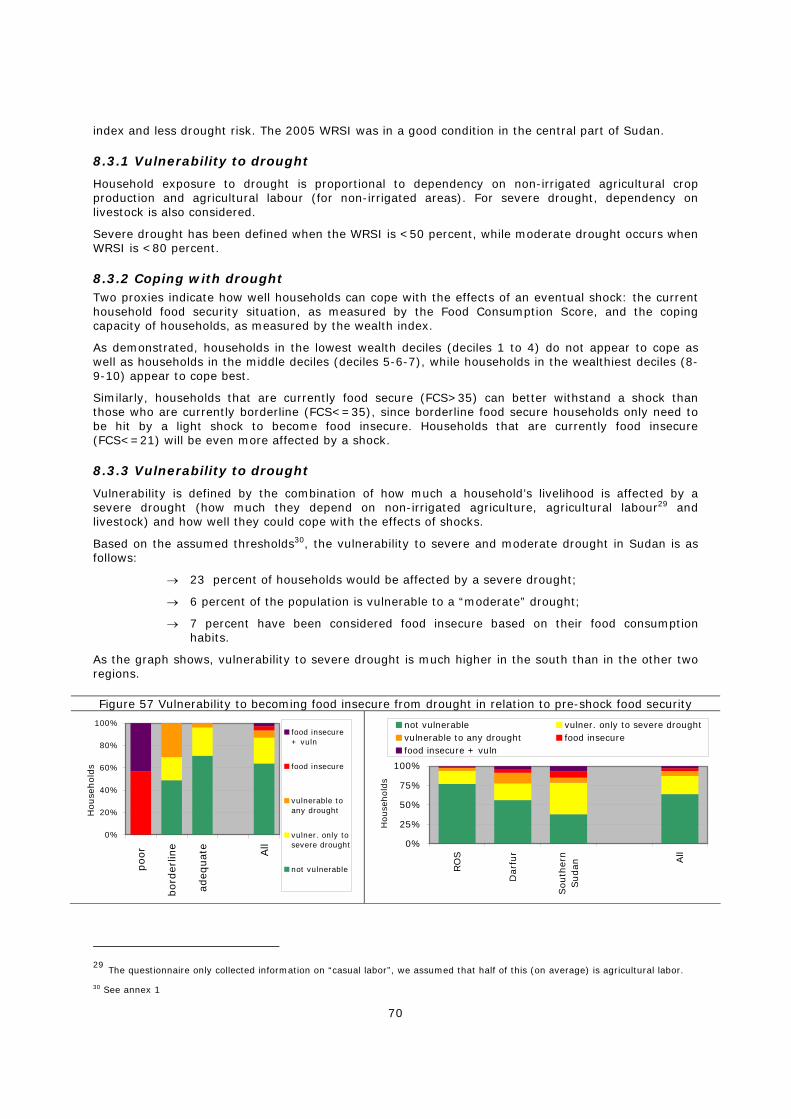
70
index and less drought risk. The 2005 WRSI was in a good condition in the central part of Sudan.
8.3.1 Vulnerability to drought
Household exposure to drought is proportional to dependency on non-irrigated agricultural crop production and agricultural labour (for non-irrigated areas). For severe drought, dependency on livestock is also considered.
Severe drought has been defined when the WRSI is <50 percent, while moderate drought occurs when WRSI is <80 percent.
8.3.2 Coping with drought Two proxies indicate how well households can cope with the effects of an eventual shock: the current household food security situation, as measured by the Food Consumption Score, and the coping capacity of households, as measured by the wealth index.
As demonstrated, households in the lowest wealth deciles (deciles 1 to 4) do not appear to cope as well as households in the middle deciles (deciles 5-6-7), while households in the wealthiest deciles (8-9-10) appear to cope best.
Similarly, households that are currently food secure (FCS>35) can better withstand a shock than those who are currently borderline (FCS<=35), since borderline food secure households only need to be hit by a light shock to become food insecure. Households that are currently food insecure (FCS<=21) will be even more affected by a shock.
8.3.3 Vulnerability to drought
Vulnerability is defined by the combination of how much a household’s livelihood is affected by a severe drought (how much they depend on non-irrigated agriculture, agricultural labour29 and livestock) and how well they could cope with the effects of shocks.
Based on the assumed thresholds30, the vulnerability to severe and moderate drought in Sudan is as follows:
→ 23 percent of households would be affected by a severe drought;
→ 6 percent of the population is vulnerable to a “moderate” drought;
→ 7 percent have been considered food insecure based on their food consumption habits.
As the graph shows, vulnerability to severe drought is much higher in the south than in the other two regions.
Figure 57 Vulnerability to becoming food insecure from drought in relation to pre-shock food security
0%
20%
40%
60%
80%
100%
poor
bord
erlin
e
adeq
uat
e
All
food insecure+ vuln
food insecure
vulnerable toany drought
vulner. only tosevere drought
not vulnerable
Hou
sehol
ds
0%
25%
50%
75%
100%
RO
S
Dar
fur
Sou
ther
nSudan
All
not vulnerable vulner. only to severe droughtvulnerable to any drought food insecurefood insecure + vuln
House
hold
s
29 The questionnaire only collected information on “casual labor”, we assumed that half of this (on average) is agricultural labor.
30 See annex 1
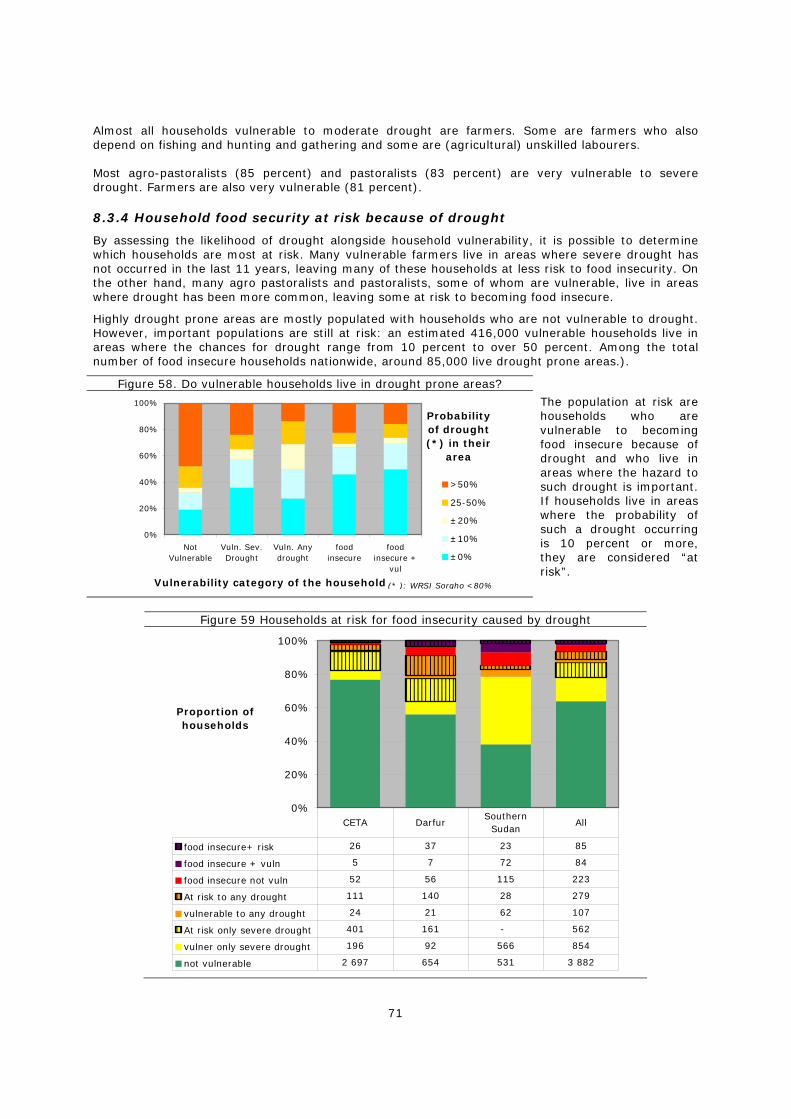
71
Almost all households vulnerable to moderate drought are farmers. Some are farmers who also depend on fishing and hunting and gathering and some are (agricultural) unskilled labourers. Most agro-pastoralists (85 percent) and pastoralists (83 percent) are very vulnerable to severe drought. Farmers are also very vulnerable (81 percent).
8.3.4 Household food security at risk because of drought
By assessing the likelihood of drought alongside household vulnerability, it is possible to determine which households are most at risk. Many vulnerable farmers live in areas where severe drought has not occurred in the last 11 years, leaving many of these households at less risk to food insecurity. On the other hand, many agro pastoralists and pastoralists, some of whom are vulnerable, live in areas where drought has been more common, leaving some at risk to becoming food insecure.
Highly drought prone areas are mostly populated with households who are not vulnerable to drought. However, important populations are still at risk: an estimated 416,000 vulnerable households live in areas where the chances for drought range from 10 percent to over 50 percent. Among the total number of food insecure households nationwide, around 85,000 live drought prone areas.).
Figure 58. Do vulnerable households live in drought prone areas?
0%
20%
40%
60%
80%
100%
NotVulnerable
Vuln. Sev.Drought
Vuln. Anydrought
foodinsecure
foodinsecure +
vul
>50%
25-50%
±20%
±10%
±0%
Probability of drought (*) in their
area
Vulnerability category of the household (* ): WRSI Sorgho <80%
The population at risk are households who are vulnerable to becoming food insecure because of drought and who live in areas where the hazard to such drought is important. If households live in areas where the probability of such a drought occurring is 10 percent or more, they are considered “at risk”.
Figure 59 Households at risk for food insecurity caused by drought
0%
20%
40%
60%
80%
100%
food insecure+ risk 26 37 23 85
food insecure + vuln 5 7 72 84
food insecure not vuln 52 56 115 223
At risk to any drought 111 140 28 279
vulnerable to any drought 24 21 62 107
At risk only severe drought 401 161 - 562
vulner only severe drought 196 92 566 854
not vulnerable 2 697 654 531 3 882
CETA DarfurSouthern
SudanAll
Proportion ofhouseholds
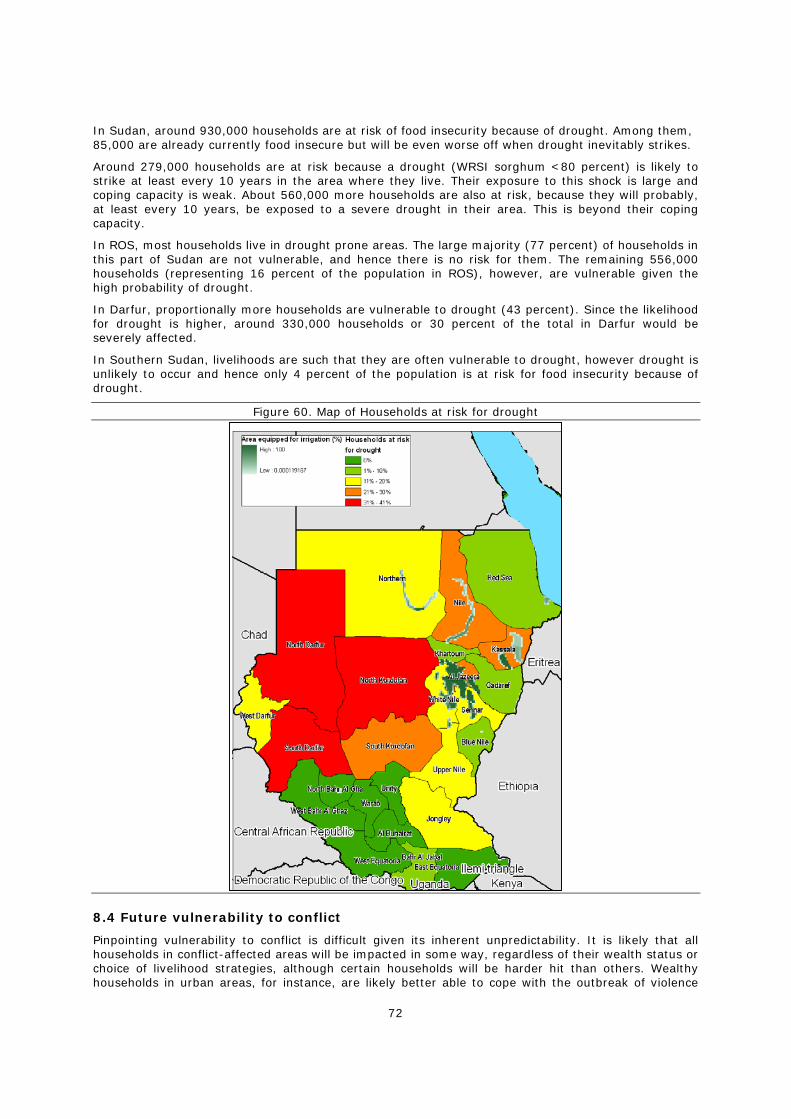
72
In Sudan, around 930,000 households are at risk of food insecurity because of drought. Among them, 85,000 are already currently food insecure but will be even worse off when drought inevitably strikes.
Around 279,000 households are at risk because a drought (WRSI sorghum <80 percent) is likely to strike at least every 10 years in the area where they live. Their exposure to this shock is large and coping capacity is weak. About 560,000 more households are also at risk, because they will probably, at least every 10 years, be exposed to a severe drought in their area. This is beyond their coping capacity.
In ROS, most households live in drought prone areas. The large majority (77 percent) of households in this part of Sudan are not vulnerable, and hence there is no risk for them. The remaining 556,000 households (representing 16 percent of the population in ROS), however, are vulnerable given the high probability of drought.
In Darfur, proportionally more households are vulnerable to drought (43 percent). Since the likelihood for drought is higher, around 330,000 households or 30 percent of the total in Darfur would be severely affected.
In Southern Sudan, livelihoods are such that they are often vulnerable to drought, however drought is unlikely to occur and hence only 4 percent of the population is at risk for food insecurity because of drought.
Figure 60. Map of Households at risk for drought
8.4 Future vulnerability to conflict
Pinpointing vulnerability to conflict is difficult given its inherent unpredictability. It is likely that all households in conflict-affected areas will be impacted in some way, regardless of their wealth status or choice of livelihood strategies, although certain households will be harder hit than others. Wealthy households in urban areas, for instance, are likely better able to cope with the outbreak of violence
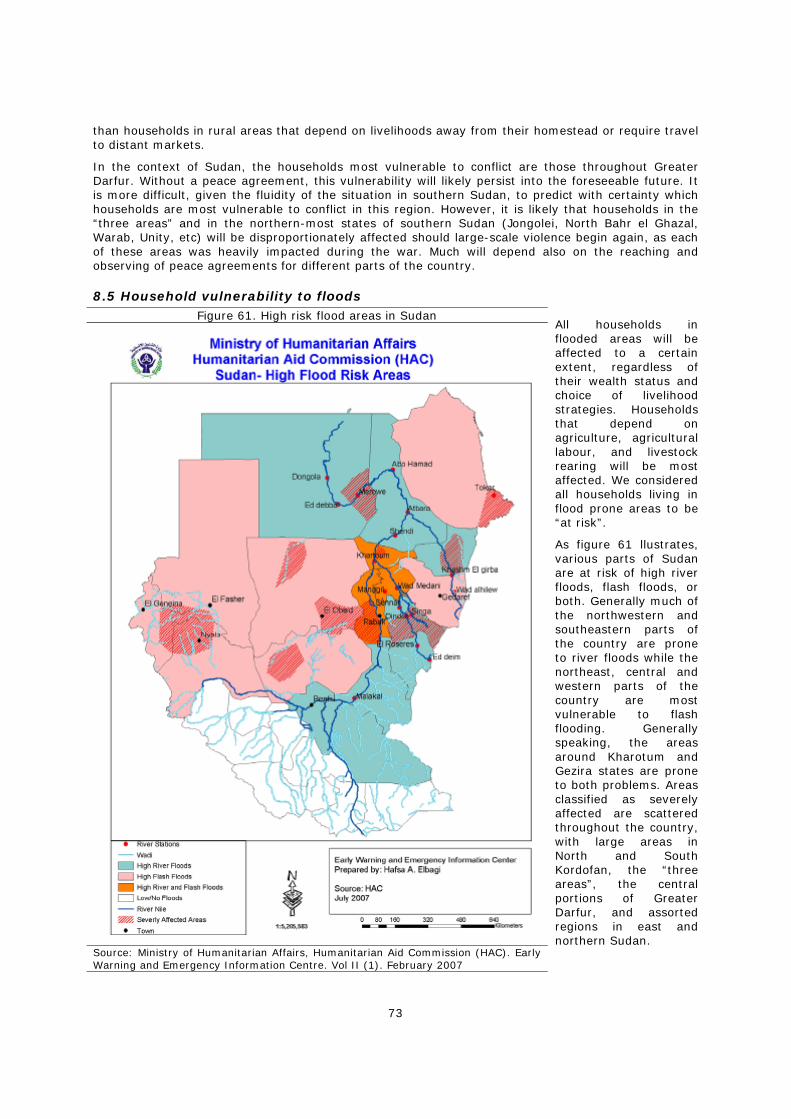
73
than households in rural areas that depend on livelihoods away from their homestead or require travel to distant markets.
In the context of Sudan, the households most vulnerable to conflict are those throughout Greater Darfur. Without a peace agreement, this vulnerability will likely persist into the foreseeable future. It is more difficult, given the fluidity of the situation in southern Sudan, to predict with certainty which households are most vulnerable to conflict in this region. However, it is likely that households in the “three areas” and in the northern-most states of southern Sudan (Jongolei, North Bahr el Ghazal, Warab, Unity, etc) will be disproportionately affected should large-scale violence begin again, as each of these areas was heavily impacted during the war. Much will depend also on the reaching and observing of peace agreements for different parts of the country.
8.5 Household vulnerability to floods Figure 61. High risk flood areas in Sudan
Source: Ministry of Humanitarian Affairs, Humanitarian Aid Commission (HAC). Early Warning and Emergency Information Centre. Vol II (1). February 2007
All households in flooded areas will be affected to a certain extent, regardless of their wealth status and choice of livelihood strategies. Households that depend on agriculture, agricultural labour, and livestock rearing will be most affected. We considered all households living in flood prone areas to be “at risk”.
As figure 61 llustrates, various parts of Sudan are at risk of high river floods, flash floods, or both. Generally much of the northwestern and southeastern parts of the country are prone to river floods while the northeast, central and western parts of the country are most vulnerable to flash flooding. Generally speaking, the areas around Kharotum and Gezira states are prone to both problems. Areas classified as severely affected are scattered throughout the country, with large areas in North and South Kordofan, the “three areas”, the central portions of Greater Darfur, and assorted regions in east and northern Sudan.
74
9. Rest of Sudan (ROS)
9.1 Situational analysis
9.1.1 Overview
The ROS region of Sudan is comprised of 12 states that span three large ecological zones, including the arid desert zones in the north and the low and moderate rainfall savannah zones in the middle and southern parts of the region. Households in the region survive on a mixture of agriculture and pastoralism. Oil has become an important source of economic prosperity and livelihoods, though much of the oil lies in disputed territories between north and south. This region also comprises some of the largest urban centres, including Khartoum, the economic and political centre of Sudan.
Throughout the long turbulent post-independence history of Sudan, households in the northern and central regions of ROS have remained largely unaffected by the various conflicts in Sudan. Certain areas in ROS, however, have experienced the impact of war. The eastern states, like Kassala and Gedarif, have been affected by the long standing insurgent campaign of the Eastern Front Rebel Movement. The Eastern Sudan Peace Agreement, which was signed in October 2006, has since brought an end to this campaign. Households in the “three areas” (Abyei, South Kordofan and Blue Nile) have, likewise, been heavily affected by the war. These regions were the front lines in the long standing civil war between north and south.
9.1.2 Current Food Security Situation
Household food security in the ROS region is defined by local factors, often relating to climate, livelihood or conflict issues. Household food security in the northern states (Northern, River Nile and Red Sea) has been impacted most often by drought, floods and acute increases in food prices. The southern states (and particularly those in the “three areas”) have been heavily conflict affected. Thus, food security status has been impacted by limited infrastructure, persistent conflicts over land and water resources, the continued presence of landmines, delays in the normalisation of political and administrative systems, and the need to absorb large numbers of returnees31. Efforts to improve food security in this region are largely dependent on the continued implementation of the CPA. Eastern Sudan (Red Sea, Kassala and Gedaref States) has also been conflict affected. This, along with persistent drought, has severely impacted food security status in this region.
9.1.3 Economic Situation and household livelihoods
Overall, the Sudanese economy has been experiencing a prolonged period of economic growth, largely a result of increasing oil exports. Over the past decade, per capita GDP has increased from around 400 USD to over 1000 USD, making Sudan one of the fastest growing economies in Africa. The benefits of these economic improvements, however, have not extended far beyond the economic and political centre of Khartoum, leaving many in urban and rural areas in poverty.
Aside from employment in the oil sector, a large percentage of the population in ROS are subsistence agro-pastoralists, with the importance of agriculture dependent largely on the climate and the annual amounts of rainfall. Households in the desert regions in the north are nomadic pastoralists, while households in the moderate rainfall savannahs of South Kordofan rely more heavily on sedentary farming. Since ROS contains many of the most populated urban centres, employed work, skilled/ unskilled labour and petty trade are also important sources of livelihoods.
9.1.4 Agricultural Sector
In the last decade, the agricultural sector’s contribution to GDP has risen to 40 percent, up from 28 percent during the mid 1980’s32. Agriculture in ROS is not only the largest sector in the economy but it provides the majority of livelihoods in the region33. Productivity varies dramatically, given varying
31 WFP, 2006/2007 Annual Needs and Livelihoods Assessment for the Centre, East and “Three Areas”.
32 WFP. 2006/2007 Annual Needs and Livelihoods Assessment for the Centre, East and “Three Areas”. .
33 Ahmed. E. Adam (2004) Economic Analysis of the Irrigated Cotton Production Constraints in Sudan, Case Study Gezira Scheme. Farming & Rural Systems Series, Volume 61, Margraf Publishers, Weikersheim, Germany.
75
climates and is lowest in the north, where rainfall amounts are negligible and highest in the southern states where rainfall amounts are more significant.
In ROS, there are three major farming schemes employed; (1) irrigation; (2) rainfed semi-mechanized and (3) rainfed traditional farming. Traditional rainfed farming in ROS is largely employed in North and South Kordofan. Semi-mechanized rainfed farming schemes are employed throughout the states of Gezira, Sinnar, and Blue Nile. In both traditional and semi-mechanized farming areas, the main planting season is between May and August, with crops harvested anytime between September and February. Sorghum is the main staple crop produced, however, millet, sesame and groundnuts are also important.
Irrigated farming occurs primarily in the Nile Basin, which stretches from Northern state through Khartoum, Gezira, White Nile, Blue Nile and parts of Gedarif and Kassala. According to reports, 4-5 million feddan are currently used for irrigated agriculture34. Irrigated schemes allow planting and harvesting throughout much of the year and are used for food crops (ie. sorghum and millet) as well as for almost all the cotton production in Sudan.
The importance of livestock and meat exports to the agricultural sector should not be overlooked. It is estimated that these exports are amongst the most important of all non oil exports. The value of these exports increased from US$98 million in 2003 to US$138 in 200435.
9.1.5 Obstacles and hurdles
Obstacles faced by households in ROS are defined by both climate or environmental issues and larger geopolitical concerns. Households in the northern and central regions face poverty, inequitable sharing of resources, food shortages/ higher food prices and natural disasters (like floods, droughts, etc). Households in the eastern and southern regions of ROS, however, are considerably more vulnerable as they face a continuation of the violence if either of the recently signed peace agreements are not honoured.
9.2 Livelihood strategies of households
9.2.1 Traditional Livelihoods and income sources
Households in ROS have traditionally relied on a mixture of agriculture and pastoralism with sedentary agriculture more common in the southern regions and nomadic pastoralism more common in northern areas. The growth of urban centres has also led many households to rely on urban livelihoods like employed work, skilled/ unskilled labour and petty trade. The discovery of oil reserves has recently opened up a new set of employment opportunities and income generating possibilities.
9.2.2 Current livelihood activities/ profiles (from the SHHS)
In the collection of livelihood information for households in ROS, there was a problem with the data. Many households (in fact, a plurality) reported “other activities” as their primary livelihood source. Information on what “other activities” referred to was collected but it was never entered into the dataset. Thus, it was not possible to determine what “other activities” households were engaging in. For purposes of this report, therefore, these activities are simply referred to as “other”.
Not withstanding this problem, findings from the SHHS were generally consistent with previous reports on livelihoods in ROS. “Agriculture”, “other activities” or “unskilled labour” were the most common livelihood activities reported by states. “Agriculture” was the most common livelihood activity in the traditional rainfed farming states of North and South Kordofan and the semi-mechanized and irrigated farming states of Northern, Gezira and Sinnar. “Other activities” was most commonly reported in all other states, excepting Gedarif. Here “unskilled labour” was reported most frequently. The next most common activities reported included a mix of “agriculture”, “livestock”, “employed work”, “petty trade”, “other activities” and “unskilled labour”. The order of importance differed by state. It should be noted that Kassala, Khartoum, and Blue Nile differed slightly from this pattern. In Kassala and Blue
34 Abbadi, K., Ahmed, A. Brief Overview of Sudan Economy and Future Prospects of Agricultural Development. Khartoum Food Aid Forum, June 2006.
35 Abbadi, K., Ahmed, A. Brief Overview of Sudan Economy and Future Prospects of Agricultural Development. Khartoum Food Aid Forum, June 2006.
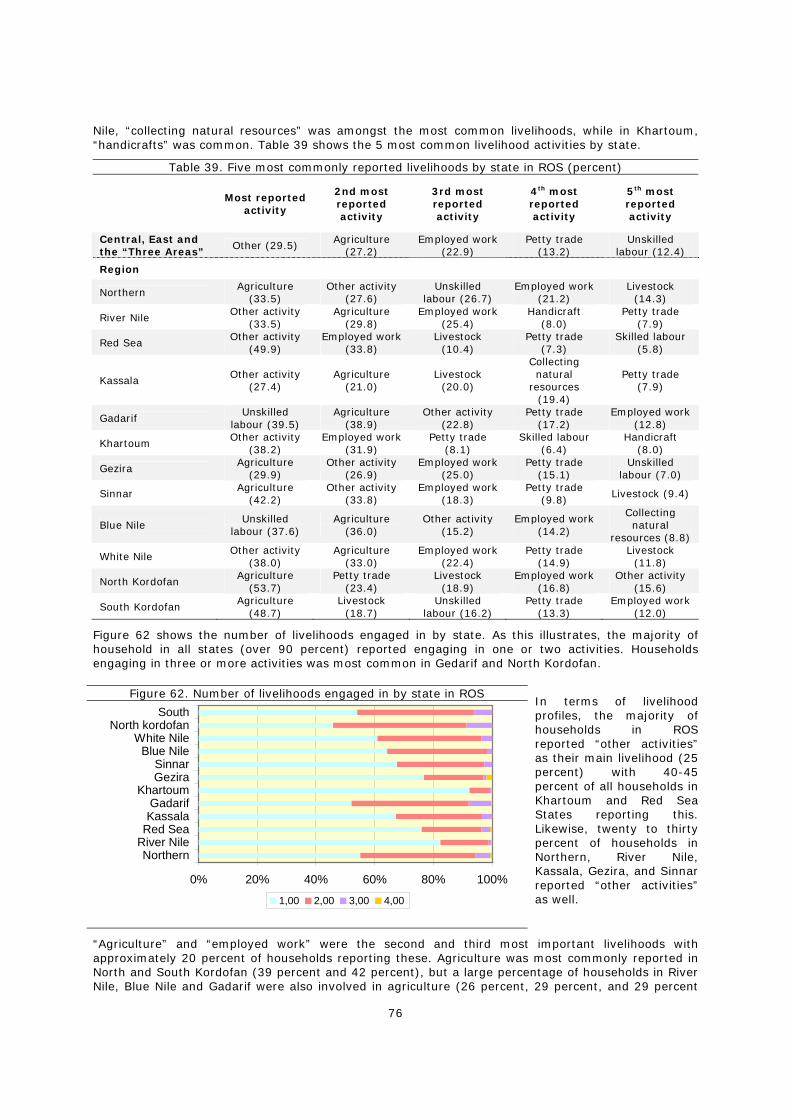
76
Nile, “collecting natural resources” was amongst the most common livelihoods, while in Khartoum, “handicrafts” was common. Table 39 shows the 5 most common livelihood activities by state.
Table 39. Five most commonly reported livelihoods by state in ROS (percent)
Most reported
activity
2nd most reported activity
3rd most reported activity
4th most reported activity
5th most reported activity
Central, East and the “Three Areas”
Other (29.5) Agriculture (27.2)
Employed work (22.9)
Petty trade (13.2)
Unskilled labour (12.4)
Region
Northern Agriculture
(33.5) Other activity
(27.6) Unskilled
labour (26.7) Employed work
(21.2) Livestock
(14.3)
River Nile Other activity
(33.5) Agriculture
(29.8) Employed work
(25.4) Handicraft
(8.0) Petty trade
(7.9)
Red Sea Other activity
(49.9) Employed work
(33.8) Livestock
(10.4) Petty trade
(7.3) Skilled labour
(5.8)
Kassala Other activity (27.4)
Agriculture (21.0)
Livestock (20.0)
Collecting natural
resources (19.4)
Petty trade (7.9)
Gadarif Unskilled
labour (39.5) Agriculture
(38.9) Other activity
(22.8) Petty trade
(17.2) Employed work
(12.8)
Khartoum Other activity
(38.2) Employed work
(31.9) Petty trade
(8.1) Skilled labour
(6.4) Handicraft
(8.0)
Gezira Agriculture (29.9)
Other activity (26.9)
Employed work (25.0)
Petty trade (15.1)
Unskilled labour (7.0)
Sinnar Agriculture (42.2)
Other activity (33.8)
Employed work (18.3)
Petty trade (9.8)
Livestock (9.4)
Blue Nile Unskilled
labour (37.6) Agriculture
(36.0) Other activity
(15.2) Employed work
(14.2)
Collecting natural
resources (8.8)
White Nile Other activity
(38.0) Agriculture
(33.0) Employed work
(22.4) Petty trade
(14.9) Livestock
(11.8)
North Kordofan Agriculture
(53.7) Petty trade
(23.4) Livestock
(18.9) Employed work
(16.8) Other activity
(15.6)
South Kordofan Agriculture
(48.7) Livestock
(18.7) Unskilled
labour (16.2) Petty trade
(13.3) Employed work
(12.0)
Figure 62 shows the number of livelihoods engaged in by state. As this illustrates, the majority of household in all states (over 90 percent) reported engaging in one or two activities. Households engaging in three or more activities was most common in Gedarif and North Kordofan.
Figure 62. Number of livelihoods engaged in by state in ROS
0% 20% 40% 60% 80% 100%
NorthernRiver NileRed SeaKassalaGadarif
KhartoumGeziraSinnar
Blue NileWhite Nile
North kordofanSouth
1,00 2,00 3,00 4,00
In terms of livelihood profiles, the majority of households in ROS reported “other activities” as their main livelihood (25 percent) with 40-45 percent of all households in Khartoum and Red Sea States reporting this. Likewise, twenty to thirty percent of households in Northern, River Nile, Kassala, Gezira, and Sinnar reported “other activities” as well.
“Agriculture” and “employed work” were the second and third most important livelihoods with approximately 20 percent of households reporting these. Agriculture was most commonly reported in North and South Kordofan (39 percent and 42 percent), but a large percentage of households in River Nile, Blue Nile and Gadarif were also involved in agriculture (26 percent, 29 percent, and 29 percent
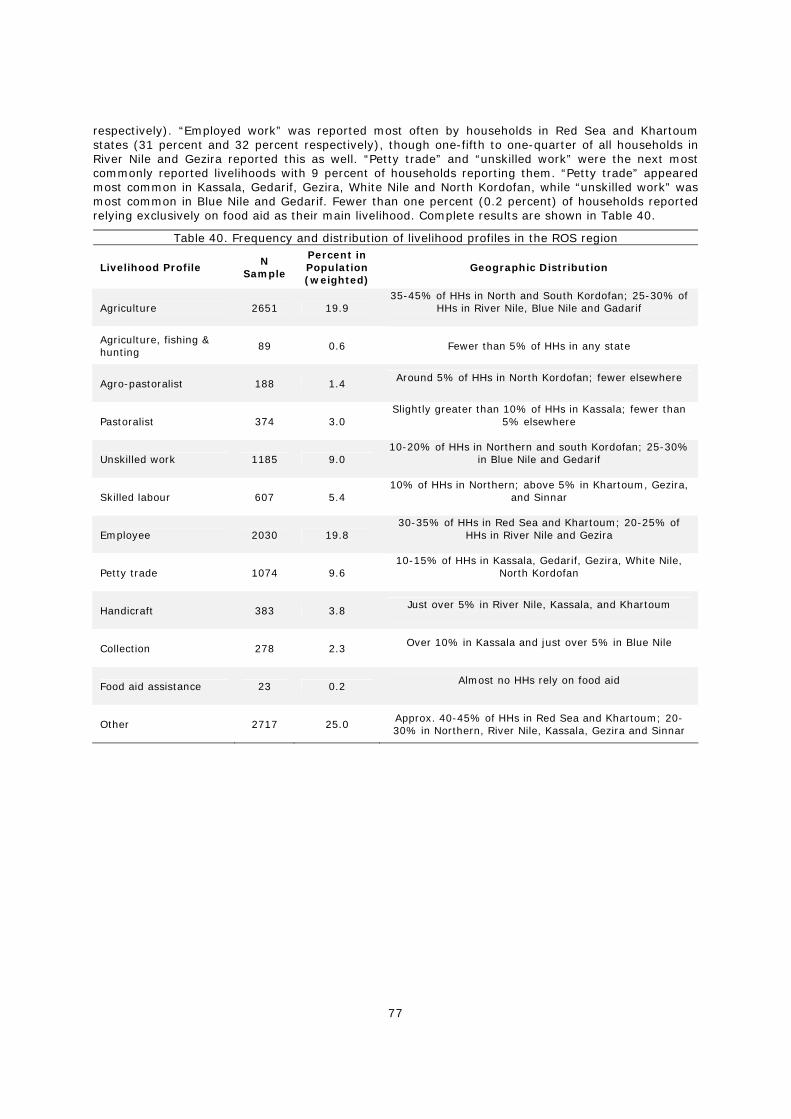
77
respectively). “Employed work” was reported most often by households in Red Sea and Khartoum states (31 percent and 32 percent respectively), though one-fifth to one-quarter of all households in River Nile and Gezira reported this as well. “Petty trade” and “unskilled work” were the next most commonly reported livelihoods with 9 percent of households reporting them. “Petty trade” appeared most common in Kassala, Gedarif, Gezira, White Nile and North Kordofan, while “unskilled work” was most common in Blue Nile and Gedarif. Fewer than one percent (0.2 percent) of households reported relying exclusively on food aid as their main livelihood. Complete results are shown in Table 40.
Table 40. Frequency and distribution of livelihood profiles in the ROS region
Livelihood Profile N
Sample
Percent in Population (weighted)
Geographic Distribution
Agriculture 2651 19.9 35-45% of HHs in North and South Kordofan; 25-30% of
HHs in River Nile, Blue Nile and Gadarif
Agriculture, fishing & hunting 89 0.6 Fewer than 5% of HHs in any state
Agro-pastoralist 188 1.4 Around 5% of HHs in North Kordofan; fewer elsewhere
Pastoralist 374 3.0 Slightly greater than 10% of HHs in Kassala; fewer than
5% elsewhere
Unskilled work 1185 9.0 10-20% of HHs in Northern and south Kordofan; 25-30%
in Blue Nile and Gedarif
Skilled labour 607 5.4 10% of HHs in Northern; above 5% in Khartoum, Gezira,
and Sinnar
Employee 2030 19.8 30-35% of HHs in Red Sea and Khartoum; 20-25% of
HHs in River Nile and Gezira
Petty trade 1074 9.6 10-15% of HHs in Kassala, Gedarif, Gezira, White Nile,
North Kordofan
Handicraft 383 3.8 Just over 5% in River Nile, Kassala, and Khartoum
Collection 278 2.3 Over 10% in Kassala and just over 5% in Blue Nile
Food aid assistance 23 0.2 Almost no HHs rely on food aid
Other 2717 25.0 Approx. 40-45% of HHs in Red Sea and Khartoum; 20-30% in Northern, River Nile, Kassala, Gezira and Sinnar
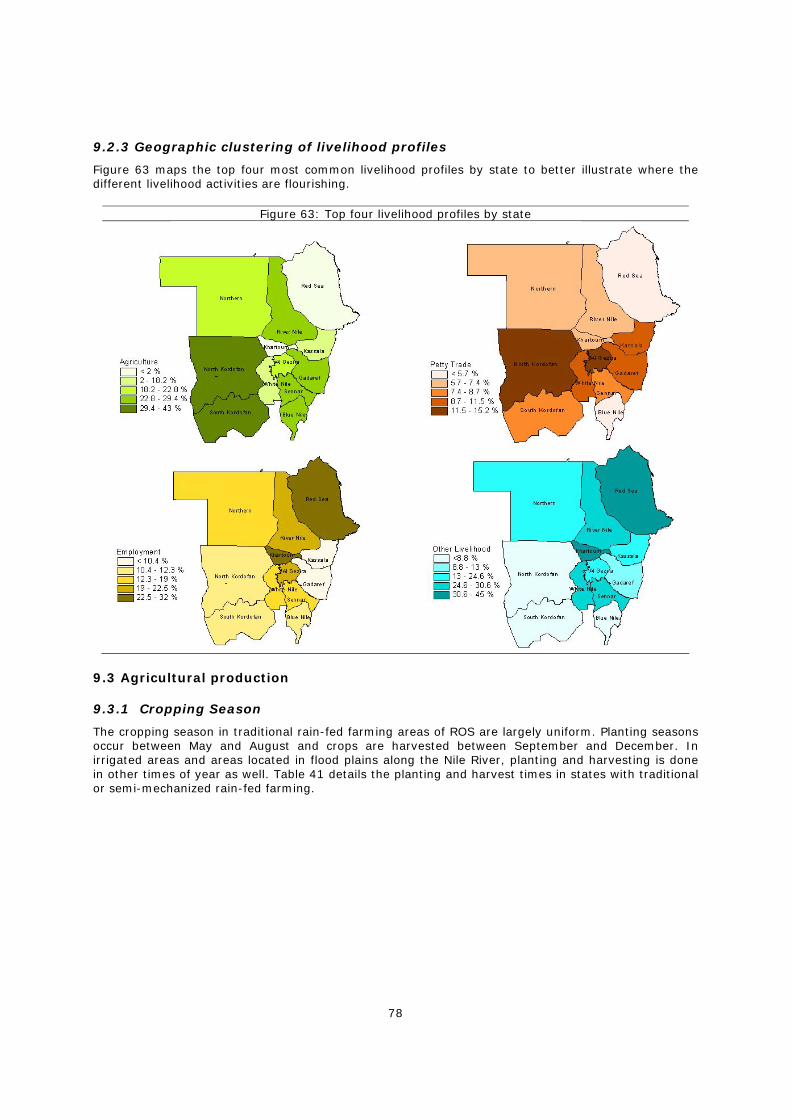
78
9.2.3 Geographic clustering of livelihood profiles
Figure 63 maps the top four most common livelihood profiles by state to better illustrate where the different livelihood activities are flourishing.
Figure 63: Top four livelihood profiles by state
9.3 Agricultural production
9.3.1 Cropping Season
The cropping season in traditional rain-fed farming areas of ROS are largely uniform. Planting seasons occur between May and August and crops are harvested between September and December. In irrigated areas and areas located in flood plains along the Nile River, planting and harvesting is done in other times of year as well. Table 41 details the planting and harvest times in states with traditional or semi-mechanized rain-fed farming.
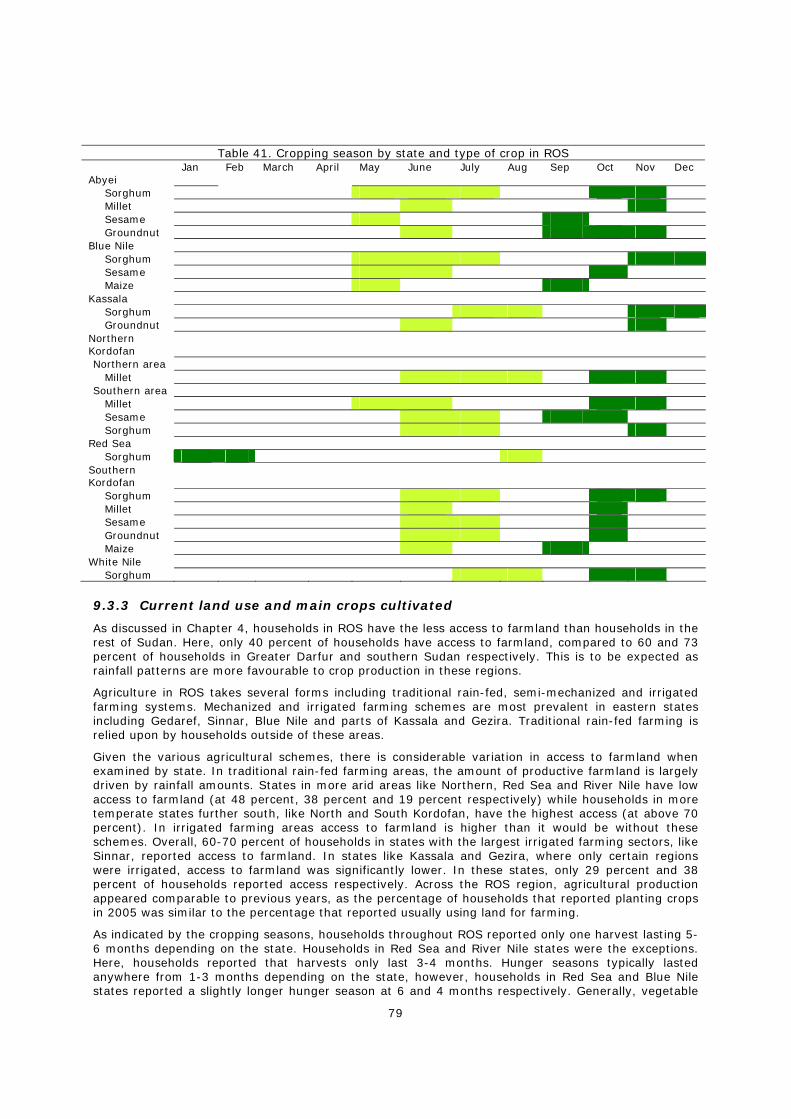
79
Table 41. Cropping season by state and type of crop in ROS Jan Feb March April May June July Aug Sep Oct Nov Dec Abyei
Sorghum Millet Sesame Groundnut
Blue Nile Sorghum Sesame Maize
Kassala Sorghum Groundnut
Northern Kordofan
Northern area Millet
Southern area Millet Sesame Sorghum
Red Sea Sorghum
Southern Kordofan
Sorghum Millet Sesame Groundnut Maize
White Nile Sorghum
9.3.3 Current land use and main crops cultivated
As discussed in Chapter 4, households in ROS have the less access to farmland than households in the rest of Sudan. Here, only 40 percent of households have access to farmland, compared to 60 and 73 percent of households in Greater Darfur and southern Sudan respectively. This is to be expected as rainfall patterns are more favourable to crop production in these regions.
Agriculture in ROS takes several forms including traditional rain-fed, semi-mechanized and irrigated farming systems. Mechanized and irrigated farming schemes are most prevalent in eastern states including Gedaref, Sinnar, Blue Nile and parts of Kassala and Gezira. Traditional rain-fed farming is relied upon by households outside of these areas.
Given the various agricultural schemes, there is considerable variation in access to farmland when examined by state. In traditional rain-fed farming areas, the amount of productive farmland is largely driven by rainfall amounts. States in more arid areas like Northern, Red Sea and River Nile have low access to farmland (at 48 percent, 38 percent and 19 percent respectively) while households in more temperate states further south, like North and South Kordofan, have the highest access (at above 70 percent). In irrigated farming areas access to farmland is higher than it would be without these schemes. Overall, 60-70 percent of households in states with the largest irrigated farming sectors, like Sinnar, reported access to farmland. In states like Kassala and Gezira, where only certain regions were irrigated, access to farmland was significantly lower. In these states, only 29 percent and 38 percent of households reported access respectively. Across the ROS region, agricultural production appeared comparable to previous years, as the percentage of households that reported planting crops in 2005 was similar to the percentage that reported usually using land for farming.
As indicated by the cropping seasons, households throughout ROS reported only one harvest lasting 5-6 months depending on the state. Households in Red Sea and River Nile states were the exceptions. Here, households reported that harvests only last 3-4 months. Hunger seasons typically lasted anywhere from 1-3 months depending on the state, however, households in Red Sea and Blue Nile states reported a slightly longer hunger season at 6 and 4 months respectively. Generally, vegetable
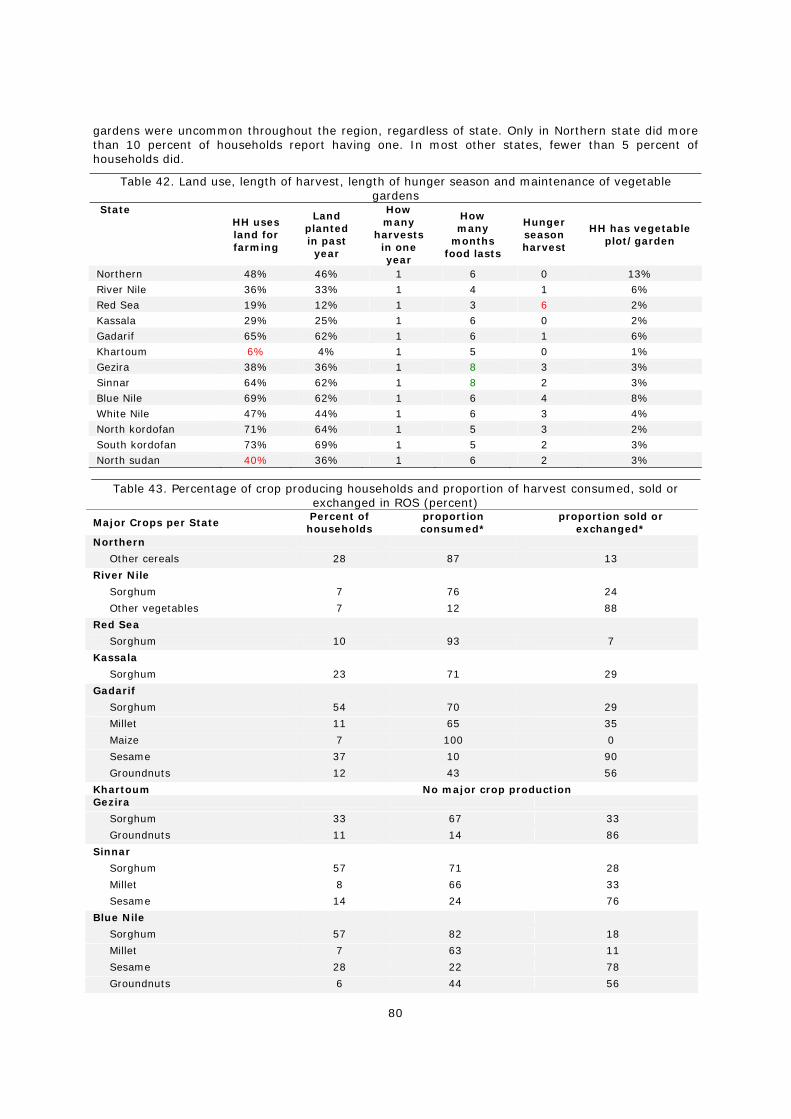
80
gardens were uncommon throughout the region, regardless of state. Only in Northern state did more than 10 percent of households report having one. In most other states, fewer than 5 percent of households did.
Table 42. Land use, length of harvest, length of hunger season and maintenance of vegetable gardens
State HH uses land for farming
Land planted in past year
How many
harvests in one year
How many
months food lasts
Hunger season harvest
HH has vegetable plot/garden
Northern 48% 46% 1 6 0 13% River Nile 36% 33% 1 4 1 6% Red Sea 19% 12% 1 3 6 2% Kassala 29% 25% 1 6 0 2% Gadarif 65% 62% 1 6 1 6% Khartoum 6% 4% 1 5 0 1% Gezira 38% 36% 1 8 3 3% Sinnar 64% 62% 1 8 2 3% Blue Nile 69% 62% 1 6 4 8% White Nile 47% 44% 1 6 3 4% North kordofan 71% 64% 1 5 3 2% South kordofan 73% 69% 1 5 2 3% North sudan 40% 36% 1 6 2 3%
Table 43. Percentage of crop producing households and proportion of harvest consumed, sold or exchanged in ROS (percent)
Major Crops per State Percent of households
proportion consumed*
proportion sold or exchanged*
Northern
Other cereals 28 87 13
River Nile
Sorghum 7 76 24
Other vegetables 7 12 88
Red Sea
Sorghum 10 93 7
Kassala
Sorghum 23 71 29
Gadarif
Sorghum 54 70 29
Millet 11 65 35
Maize 7 100 0
Sesame 37 10 90
Groundnuts 12 43 56
Khartoum No major crop production Gezira
Sorghum 33 67 33
Groundnuts 11 14 86
Sinnar
Sorghum 57 71 28
Millet 8 66 33
Sesame 14 24 76
Blue Nile
Sorghum 57 82 18
Millet 7 63 11
Sesame 28 22 78
Groundnuts 6 44 56
81
White Nile
Sorghum 36 68 31
Sesame 13 12 88
Groundnuts 6 21 79
North kordofan
Sorghum 18 87 13
Millet 42 89 11
Watermelon 8 77 23
Sesame 27 27 73
Groundnuts 23 29 71
South kordofan
Sorghum 55 92 0
Millet 17 87 12
Cowpeas 14 87 13
Sesame 24 58 42
Groundnuts 28 59 40
9.4 Food consumption patterns and current household food security
Households in ROS, like the rest of Sudan, have a cereal-based diet, with sorghum and millet as the primary staple crops. When compared to other regions in Sudan, households in ROS tend to have better consumption patterns, consuming more of each food group. Below is a discussion of food consumption patterns and how these patterns differ by state.
9.4.1 Food consumption patterns and sources of food
Figure 65 shows the number of times per week foods from each main food group are consumed by state. Cereals and tubers (sorghum and millet) are generally eaten 6-7 times per week regardless of state. The only exceptions to this were Northern, Red Sea and Khartoum states. Here, they were consumed 5 times per week or less. Pulses (beans, groundnuts, sesame and cowpeas) were generally consumed between 3 and 4 times per week. Pulses consumption was most frequent in Northern and Gezira states (at 4-5 times per week) and less frequent in Red Sea and Kassala (fewer than 3 times per week).
Fruits and vegetables (pumpkin, watermelon, etc) were consumed between 3 and 5 times per week with households in Northern State reporting the most frequent consumption and household in Red Sea and South Kordofan reporting the least. Meats were also eaten between 3 and 5 times per week. In Khartoum, Gezira and Sinnar households reported the most frequent consumption at almost 6 times per week. Households in South Kordofan reported the least frequent meat consumption at 3 times per week.
Milk consumption was more varied than the consumption of other foods. Generally speaking, milk consumption was highest in pastoral and agro pastoral areas. States with the most frequent milk consumption were Northern and River Nile. Here households reportedly consumed milk 6-7 times per week. Conversely, households in the states more reliant on sedentary agriculture (like Blue Nile and South Kordofan) were the least likely to consume milk. In both states, households reportedly consumed milk fewer than three times per week.
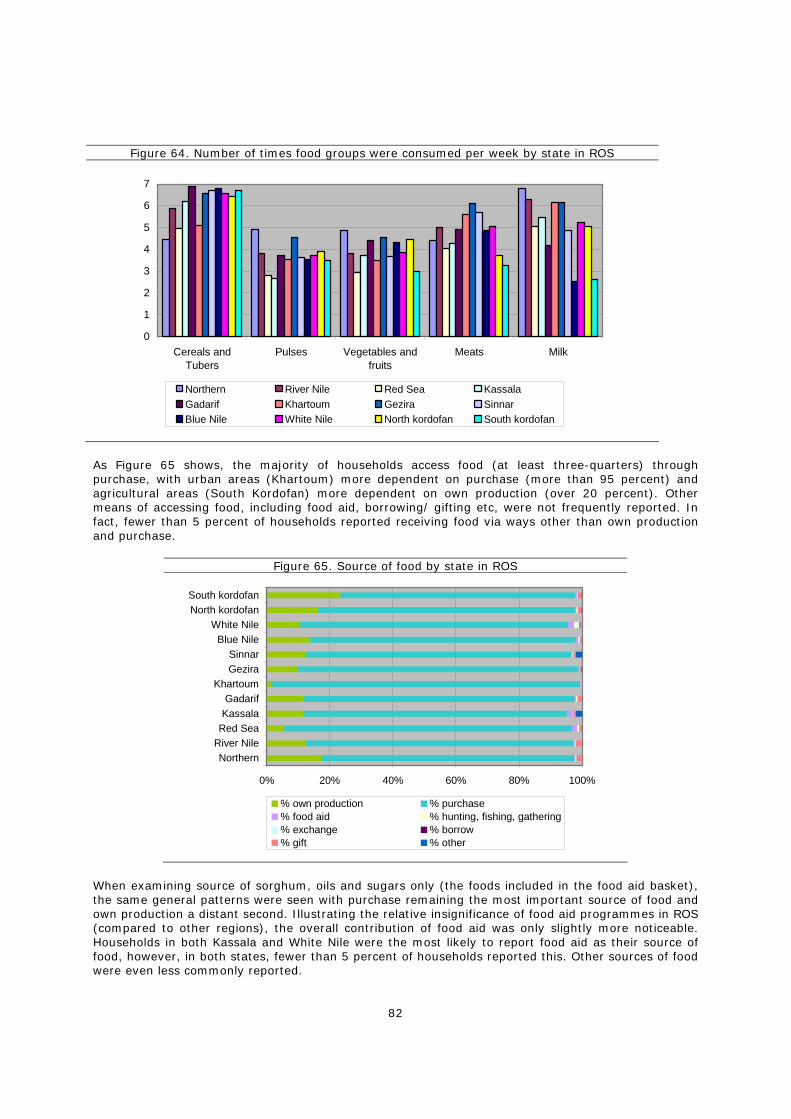
82
Figure 64. Number of times food groups were consumed per week by state in ROS
0
1
2
3
4
5
6
7
Cereals andTubers
Pulses Vegetables andfruits
Meats Milk
Northern River Nile Red Sea KassalaGadarif Khartoum Gezira SinnarBlue Nile White Nile North kordofan South kordofan
As Figure 65 shows, the majority of households access food (at least three-quarters) through purchase, with urban areas (Khartoum) more dependent on purchase (more than 95 percent) and agricultural areas (South Kordofan) more dependent on own production (over 20 percent). Other means of accessing food, including food aid, borrowing/ gifting etc, were not frequently reported. In fact, fewer than 5 percent of households reported receiving food via ways other than own production and purchase.
Figure 65. Source of food by state in ROS
0% 20% 40% 60% 80% 100%
NorthernRiver NileRed SeaKassalaGadarif
KhartoumGeziraSinnar
Blue NileWhite Nile
North kordofanSouth kordofan
% own production % purchase% food aid % hunting, fishing, gathering% exchange % borrow% gift % other
When examining source of sorghum, oils and sugars only (the foods included in the food aid basket), the same general patterns were seen with purchase remaining the most important source of food and own production a distant second. Illustrating the relative insignificance of food aid programmes in ROS (compared to other regions), the overall contribution of food aid was only slightly more noticeable. Households in both Kassala and White Nile were the most likely to report food aid as their source of food, however, in both states, fewer than 5 percent of households reported this. Other sources of food were even less commonly reported.
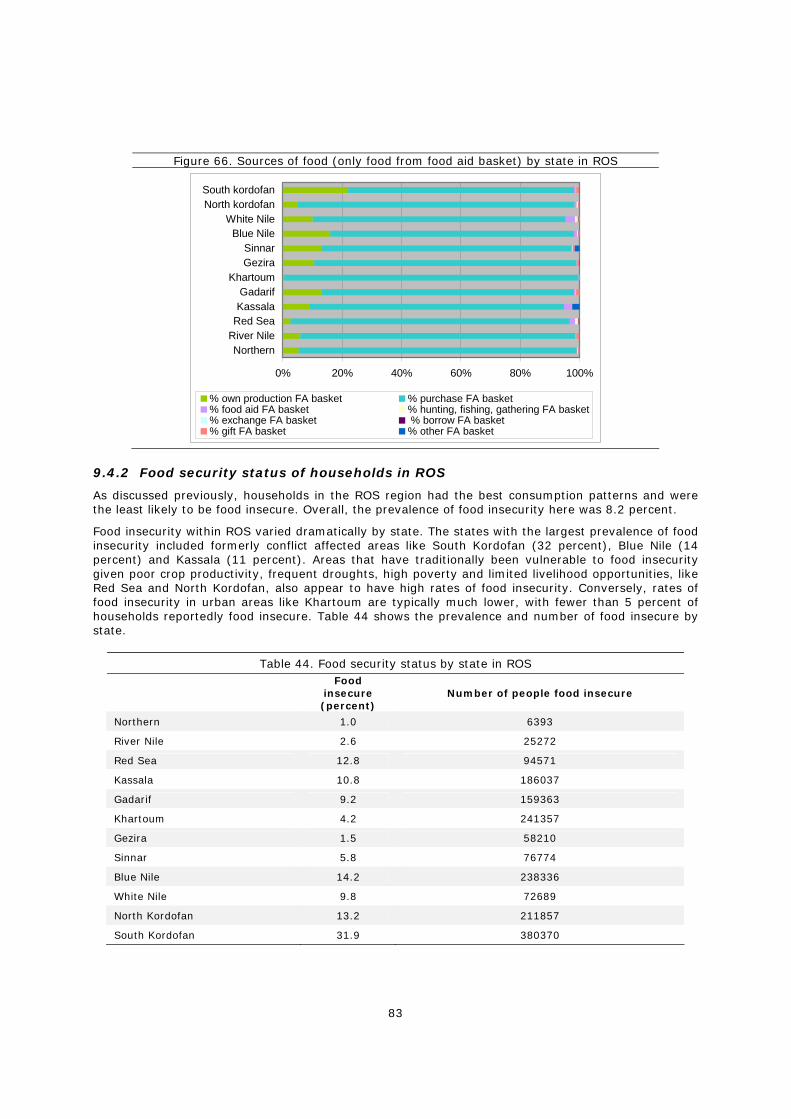
83
Figure 66. Sources of food (only food from food aid basket) by state in ROS
0% 20% 40% 60% 80% 100%
NorthernRiver NileRed SeaKassalaGadarif
KhartoumGeziraSinnar
Blue NileWhite Nile
North kordofanSouth kordofan
% own production FA basket % purchase FA basket% food aid FA basket % hunting, fishing, gathering FA basket% exchange FA basket % borrow FA basket% gift FA basket % other FA basket
9.4.2 Food security status of households in ROS
As discussed previously, households in the ROS region had the best consumption patterns and were the least likely to be food insecure. Overall, the prevalence of food insecurity here was 8.2 percent.
Food insecurity within ROS varied dramatically by state. The states with the largest prevalence of food insecurity included formerly conflict affected areas like South Kordofan (32 percent), Blue Nile (14 percent) and Kassala (11 percent). Areas that have traditionally been vulnerable to food insecurity given poor crop productivity, frequent droughts, high poverty and limited livelihood opportunities, like Red Sea and North Kordofan, also appear to have high rates of food insecurity. Conversely, rates of food insecurity in urban areas like Khartoum are typically much lower, with fewer than 5 percent of households reportedly food insecure. Table 44 shows the prevalence and number of food insecure by state.
Table 44. Food security status by state in ROS
Food
insecure (percent)
Number of people food insecure
Northern 1.0 6393
River Nile 2.6 25272
Red Sea 12.8 94571
Kassala 10.8 186037
Gadarif 9.2 159363
Khartoum 4.2 241357
Gezira 1.5 58210
Sinnar 5.8 76774
Blue Nile 14.2 238336
White Nile 9.8 72689
North Kordofan 13.2 211857
South Kordofan 31.9 380370
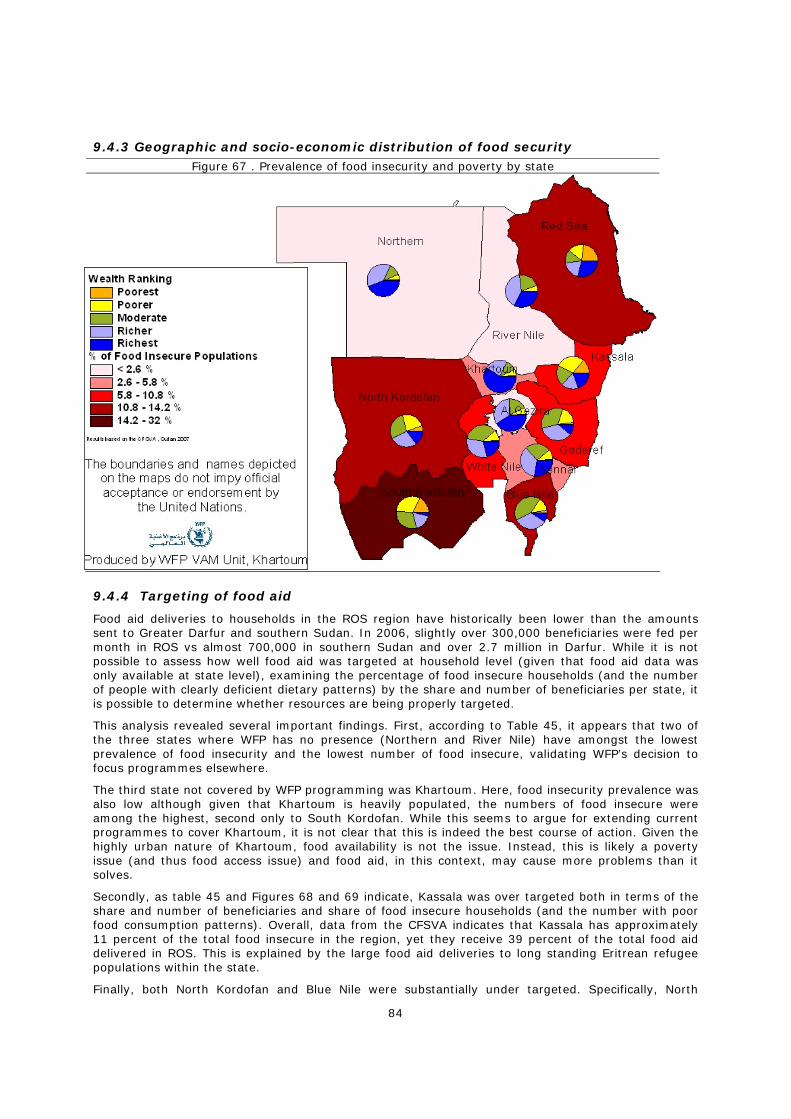
84
9.4.3 Geographic and socio-economic distribution of food security Figure 67 . Prevalence of food insecurity and poverty by state
9.4.4 Targeting of food aid
Food aid deliveries to households in the ROS region have historically been lower than the amounts sent to Greater Darfur and southern Sudan. In 2006, slightly over 300,000 beneficiaries were fed per month in ROS vs almost 700,000 in southern Sudan and over 2.7 million in Darfur. While it is not possible to assess how well food aid was targeted at household level (given that food aid data was only available at state level), examining the percentage of food insecure households (and the number of people with clearly deficient dietary patterns) by the share and number of beneficiaries per state, it is possible to determine whether resources are being properly targeted.
This analysis revealed several important findings. First, according to Table 45, it appears that two of the three states where WFP has no presence (Northern and River Nile) have amongst the lowest prevalence of food insecurity and the lowest number of food insecure, validating WFP’s decision to focus programmes elsewhere.
The third state not covered by WFP programming was Khartoum. Here, food insecurity prevalence was also low although given that Khartoum is heavily populated, the numbers of food insecure were among the highest, second only to South Kordofan. While this seems to argue for extending current programmes to cover Khartoum, it is not clear that this is indeed the best course of action. Given the highly urban nature of Khartoum, food availability is not the issue. Instead, this is likely a poverty issue (and thus food access issue) and food aid, in this context, may cause more problems than it solves.
Secondly, as table 45 and Figures 68 and 69 indicate, Kassala was over targeted both in terms of the share and number of beneficiaries and share of food insecure households (and the number with poor food consumption patterns). Overall, data from the CFSVA indicates that Kassala has approximately 11 percent of the total food insecure in the region, yet they receive 39 percent of the total food aid delivered in ROS. This is explained by the large food aid deliveries to long standing Eritrean refugee populations within the state.
Finally, both North Kordofan and Blue Nile were substantially under targeted. Specifically, North
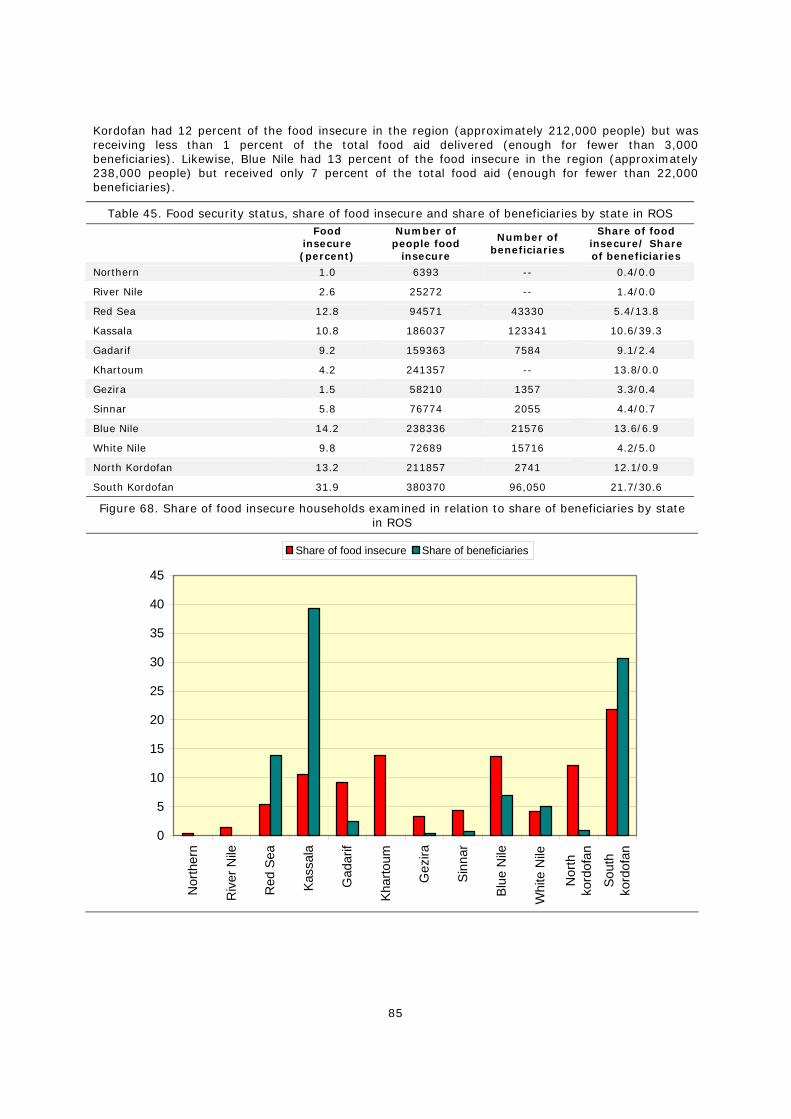
85
Kordofan had 12 percent of the food insecure in the region (approximately 212,000 people) but was receiving less than 1 percent of the total food aid delivered (enough for fewer than 3,000 beneficiaries). Likewise, Blue Nile had 13 percent of the food insecure in the region (approximately 238,000 people) but received only 7 percent of the total food aid (enough for fewer than 22,000 beneficiaries).
Table 45. Food security status, share of food insecure and share of beneficiaries by state in ROS Food
insecure (percent)
Number of people food
insecure
Number of beneficiaries
Share of food insecure/ Share of beneficiaries
Northern 1.0 6393 -- 0.4/0.0
River Nile 2.6 25272 -- 1.4/0.0
Red Sea 12.8 94571 43330 5.4/13.8
Kassala 10.8 186037 123341 10.6/39.3
Gadarif 9.2 159363 7584 9.1/2.4
Khartoum 4.2 241357 -- 13.8/0.0
Gezira 1.5 58210 1357 3.3/0.4
Sinnar 5.8 76774 2055 4.4/0.7
Blue Nile 14.2 238336 21576 13.6/6.9
White Nile 9.8 72689 15716 4.2/5.0
North Kordofan 13.2 211857 2741 12.1/0.9
South Kordofan 31.9 380370 96,050 21.7/30.6
Figure 68. Share of food insecure households examined in relation to share of beneficiaries by state in ROS
0
5
10
15
20
25
30
35
40
45
Nor
ther
n
Riv
er N
ile
Red
Sea
Kass
ala
Gad
arif
Khar
toum
Gez
ira
Sinn
ar
Blue
Nile
Whi
te N
ile
Nor
thko
rdof
an
Sout
hko
rdof
an
Share of food insecure Share of beneficiaries
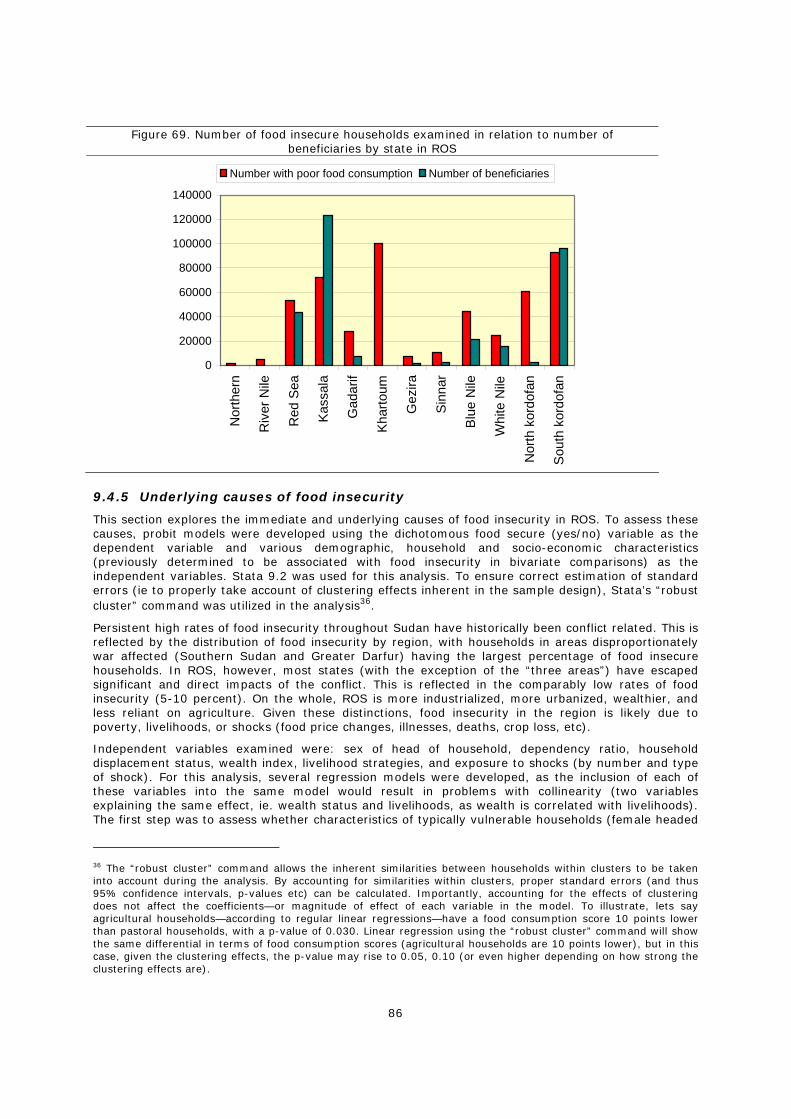
86
Figure 69. Number of food insecure households examined in relation to number of beneficiaries by state in ROS
0
20000
40000
60000
80000
100000
120000
140000
Nor
ther
n
Riv
er N
ile
Red
Sea
Kas
sala
Gad
arif
Kha
rtoum
Gez
ira
Sin
nar
Blu
e N
ile
Whi
te N
ile
Nor
th k
ordo
fan
Sou
th k
ordo
fan
Number with poor food consumption Number of beneficiaries
9.4.5 Underlying causes of food insecurity
This section explores the immediate and underlying causes of food insecurity in ROS. To assess these causes, probit models were developed using the dichotomous food secure (yes/no) variable as the dependent variable and various demographic, household and socio-economic characteristics (previously determined to be associated with food insecurity in bivariate comparisons) as the independent variables. Stata 9.2 was used for this analysis. To ensure correct estimation of standard errors (ie to properly take account of clustering effects inherent in the sample design), Stata’s “robust cluster” command was utilized in the analysis36.
Persistent high rates of food insecurity throughout Sudan have historically been conflict related. This is reflected by the distribution of food insecurity by region, with households in areas disproportionately war affected (Southern Sudan and Greater Darfur) having the largest percentage of food insecure households. In ROS, however, most states (with the exception of the “three areas”) have escaped significant and direct impacts of the conflict. This is reflected in the comparably low rates of food insecurity (5-10 percent). On the whole, ROS is more industrialized, more urbanized, wealthier, and less reliant on agriculture. Given these distinctions, food insecurity in the region is likely due to poverty, livelihoods, or shocks (food price changes, illnesses, deaths, crop loss, etc).
Independent variables examined were: sex of head of household, dependency ratio, household displacement status, wealth index, livelihood strategies, and exposure to shocks (by number and type of shock). For this analysis, several regression models were developed, as the inclusion of each of these variables into the same model would result in problems with collinearity (two variables explaining the same effect, ie. wealth status and livelihoods, as wealth is correlated with livelihoods). The first step was to assess whether characteristics of typically vulnerable households (female headed
36 The “robust cluster” command allows the inherent similarities between households within clusters to be taken into account during the analysis. By accounting for similarities within clusters, proper standard errors (and thus 95% confidence intervals, p-values etc) can be calculated. Importantly, accounting for the effects of clustering does not affect the coefficients—or magnitude of effect of each variable in the model. To illustrate, lets say agricultural households—according to regular linear regressions—have a food consumption score 10 points lower than pastoral households, with a p-value of 0.030. Linear regression using the “robust cluster” command will show the same differential in terms of food consumption scores (agricultural households are 10 points lower), but in this case, given the clustering effects, the p-value may rise to 0.05, 0.10 (or even higher depending on how strong the clustering effects are).
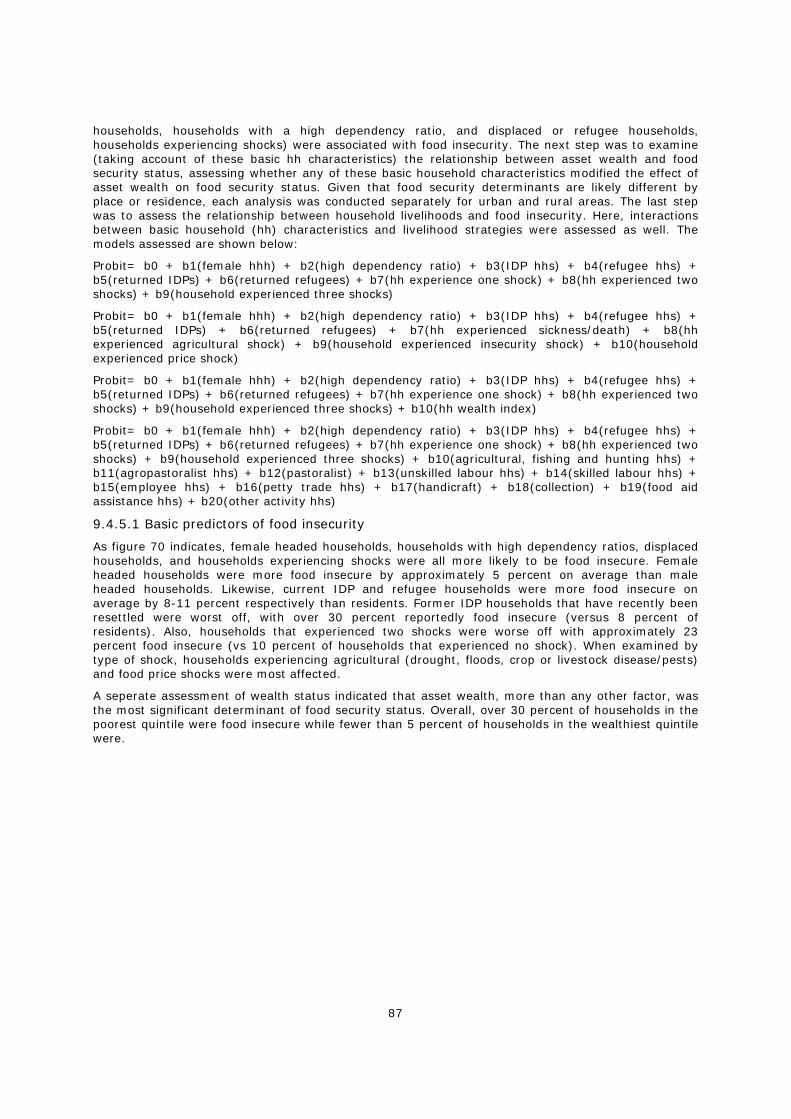
87
households, households with a high dependency ratio, and displaced or refugee households, households experiencing shocks) were associated with food insecurity. The next step was to examine (taking account of these basic hh characteristics) the relationship between asset wealth and food security status, assessing whether any of these basic household characteristics modified the effect of asset wealth on food security status. Given that food security determinants are likely different by place or residence, each analysis was conducted separately for urban and rural areas. The last step was to assess the relationship between household livelihoods and food insecurity. Here, interactions between basic household (hh) characteristics and livelihood strategies were assessed as well. The models assessed are shown below:
Probit= b0 + b1(female hhh) + b2(high dependency ratio) + b3(IDP hhs) + b4(refugee hhs) + b5(returned IDPs) + b6(returned refugees) + b7(hh experience one shock) + b8(hh experienced two shocks) + b9(household experienced three shocks)
Probit= b0 + b1(female hhh) + b2(high dependency ratio) + b3(IDP hhs) + b4(refugee hhs) + b5(returned IDPs) + b6(returned refugees) + b7(hh experienced sickness/death) + b8(hh experienced agricultural shock) + b9(household experienced insecurity shock) + b10(household experienced price shock)
Probit= b0 + b1(female hhh) + b2(high dependency ratio) + b3(IDP hhs) + b4(refugee hhs) + b5(returned IDPs) + b6(returned refugees) + b7(hh experience one shock) + b8(hh experienced two shocks) + b9(household experienced three shocks) + b10(hh wealth index)
Probit= b0 + b1(female hhh) + b2(high dependency ratio) + b3(IDP hhs) + b4(refugee hhs) + b5(returned IDPs) + b6(returned refugees) + b7(hh experience one shock) + b8(hh experienced two shocks) + b9(household experienced three shocks) + b10(agricultural, fishing and hunting hhs) + b11(agropastoralist hhs) + b12(pastoralist) + b13(unskilled labour hhs) + b14(skilled labour hhs) + b15(employee hhs) + b16(petty trade hhs) + b17(handicraft) + b18(collection) + b19(food aid assistance hhs) + b20(other activity hhs)
9.4.5.1 Basic predictors of food insecurity
As figure 70 indicates, female headed households, households with high dependency ratios, displaced households, and households experiencing shocks were all more likely to be food insecure. Female headed households were more food insecure by approximately 5 percent on average than male headed households. Likewise, current IDP and refugee households were more food insecure on average by 8-11 percent respectively than residents. Former IDP households that have recently been resettled were worst off, with over 30 percent reportedly food insecure (versus 8 percent of residents). Also, households that experienced two shocks were worse off with approximately 23 percent food insecure (vs 10 percent of households that experienced no shock). When examined by type of shock, households experiencing agricultural (drought, floods, crop or livestock disease/pests) and food price shocks were most affected.
A seperate assessment of wealth status indicated that asset wealth, more than any other factor, was the most significant determinant of food security status. Overall, over 30 percent of households in the poorest quintile were food insecure while fewer than 5 percent of households in the wealthiest quintile were.
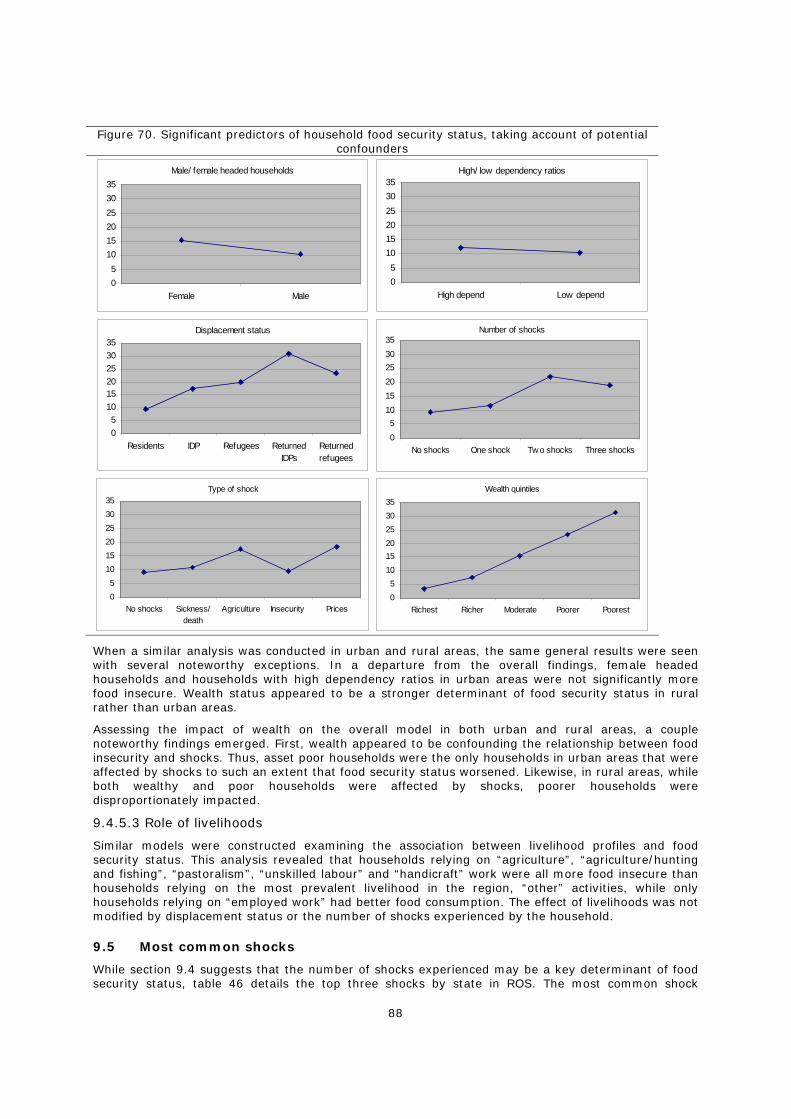
88
Figure 70. Significant predictors of household food security status, taking account of potential confounders
When a similar analysis was conducted in urban and rural areas, the same general results were seen with several noteworthy exceptions. In a departure from the overall findings, female headed households and households with high dependency ratios in urban areas were not significantly more food insecure. Wealth status appeared to be a stronger determinant of food security status in rural rather than urban areas.
Assessing the impact of wealth on the overall model in both urban and rural areas, a couple noteworthy findings emerged. First, wealth appeared to be confounding the relationship between food insecurity and shocks. Thus, asset poor households were the only households in urban areas that were affected by shocks to such an extent that food security status worsened. Likewise, in rural areas, while both wealthy and poor households were affected by shocks, poorer households were disproportionately impacted.
9.4.5.3 Role of livelihoods
Similar models were constructed examining the association between livelihood profiles and food security status. This analysis revealed that households relying on “agriculture”, “agriculture/hunting and fishing”, “pastoralism”, “unskilled labour” and “handicraft” work were all more food insecure than households relying on the most prevalent livelihood in the region, “other” activities, while only households relying on “employed work” had better food consumption. The effect of livelihoods was not modified by displacement status or the number of shocks experienced by the household.
9.5 Most common shocks
While section 9.4 suggests that the number of shocks experienced may be a key determinant of food security status, table 46 details the top three shocks by state in ROS. The most common shock
Male/ female headed households
05
101520253035
Female Male
High/ low dependency ratios
05
101520253035
High depend Low depend
Displacement status
05
101520253035
Residents IDP Refugees ReturnedIDPs
Returnedrefugees
Number of shocks
05
101520253035
No shocks One shock Tw o shocks Three shocks
Type of shock
05
101520253035
No shocks Sickness/death
Agriculture Insecurity Prices
Wealth quintiles
05
101520253035
Richest Richer Moderate Poorer Poorest
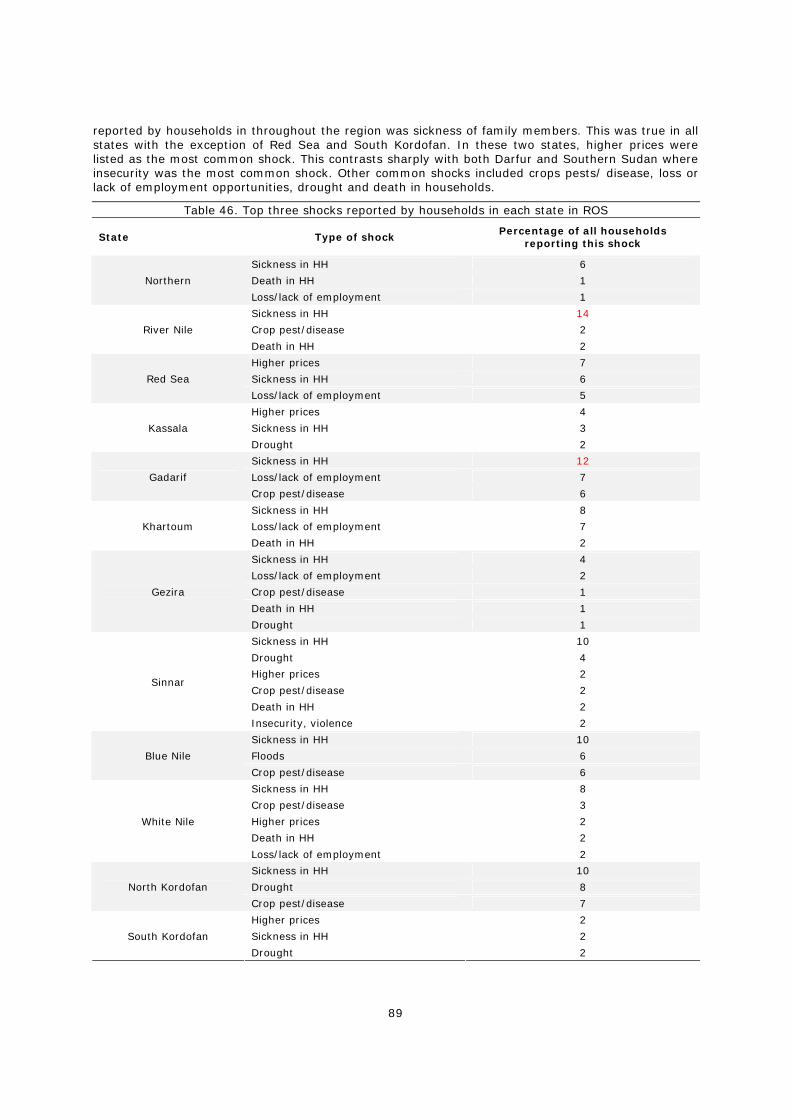
89
reported by households in throughout the region was sickness of family members. This was true in all states with the exception of Red Sea and South Kordofan. In these two states, higher prices were listed as the most common shock. This contrasts sharply with both Darfur and Southern Sudan where insecurity was the most common shock. Other common shocks included crops pests/ disease, loss or lack of employment opportunities, drought and death in households.
Table 46. Top three shocks reported by households in each state in ROS
State Type of shock Percentage of all households
reporting this shock
Sickness in HH 6
Death in HH 1 Northern
Loss/lack of employment 1
Sickness in HH 14
Crop pest/disease 2 River Nile
Death in HH 2
Higher prices 7
Sickness in HH 6 Red Sea
Loss/lack of employment 5
Higher prices 4
Sickness in HH 3 Kassala
Drought 2
Sickness in HH 12
Loss/lack of employment 7 Gadarif
Crop pest/disease 6
Sickness in HH 8
Loss/lack of employment 7 Khartoum
Death in HH 2
Sickness in HH 4
Loss/lack of employment 2
Crop pest/disease 1
Death in HH 1
Gezira
Drought 1
Sickness in HH 10
Drought 4
Higher prices 2
Crop pest/disease 2
Death in HH 2
Sinnar
Insecurity, violence 2
Sickness in HH 10
Floods 6 Blue Nile
Crop pest/disease 6
Sickness in HH 8
Crop pest/disease 3
Higher prices 2
Death in HH 2
White Nile
Loss/lack of employment 2
Sickness in HH 10
Drought 8 North Kordofan
Crop pest/disease 7
Higher prices 2
Sickness in HH 2 South Kordofan
Drought 2
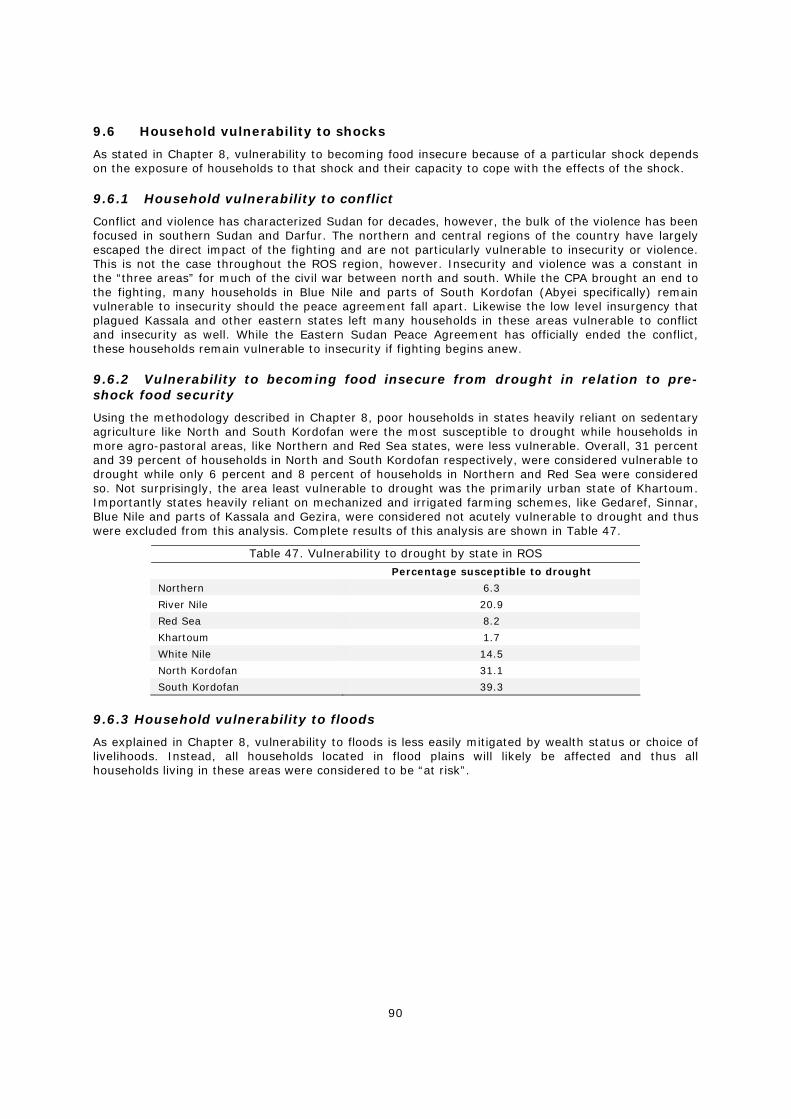
90
9.6 Household vulnerability to shocks
As stated in Chapter 8, vulnerability to becoming food insecure because of a particular shock depends on the exposure of households to that shock and their capacity to cope with the effects of the shock.
9.6.1 Household vulnerability to conflict
Conflict and violence has characterized Sudan for decades, however, the bulk of the violence has been focused in southern Sudan and Darfur. The northern and central regions of the country have largely escaped the direct impact of the fighting and are not particularly vulnerable to insecurity or violence. This is not the case throughout the ROS region, however. Insecurity and violence was a constant in the “three areas” for much of the civil war between north and south. While the CPA brought an end to the fighting, many households in Blue Nile and parts of South Kordofan (Abyei specifically) remain vulnerable to insecurity should the peace agreement fall apart. Likewise the low level insurgency that plagued Kassala and other eastern states left many households in these areas vulnerable to conflict and insecurity as well. While the Eastern Sudan Peace Agreement has officially ended the conflict, these households remain vulnerable to insecurity if fighting begins anew.
9.6.2 Vulnerability to becoming food insecure from drought in relation to pre-shock food security
Using the methodology described in Chapter 8, poor households in states heavily reliant on sedentary agriculture like North and South Kordofan were the most susceptible to drought while households in more agro-pastoral areas, like Northern and Red Sea states, were less vulnerable. Overall, 31 percent and 39 percent of households in North and South Kordofan respectively, were considered vulnerable to drought while only 6 percent and 8 percent of households in Northern and Red Sea were considered so. Not surprisingly, the area least vulnerable to drought was the primarily urban state of Khartoum. Importantly states heavily reliant on mechanized and irrigated farming schemes, like Gedaref, Sinnar, Blue Nile and parts of Kassala and Gezira, were considered not acutely vulnerable to drought and thus were excluded from this analysis. Complete results of this analysis are shown in Table 47.
Table 47. Vulnerability to drought by state in ROS Percentage susceptible to drought
Northern 6.3
River Nile 20.9
Red Sea 8.2
Khartoum 1.7
White Nile 14.5
North Kordofan 31.1
South Kordofan 39.3
9.6.3 Household vulnerability to floods
As explained in Chapter 8, vulnerability to floods is less easily mitigated by wealth status or choice of livelihoods. Instead, all households located in flood plains will likely be affected and thus all households living in these areas were considered to be “at risk”.
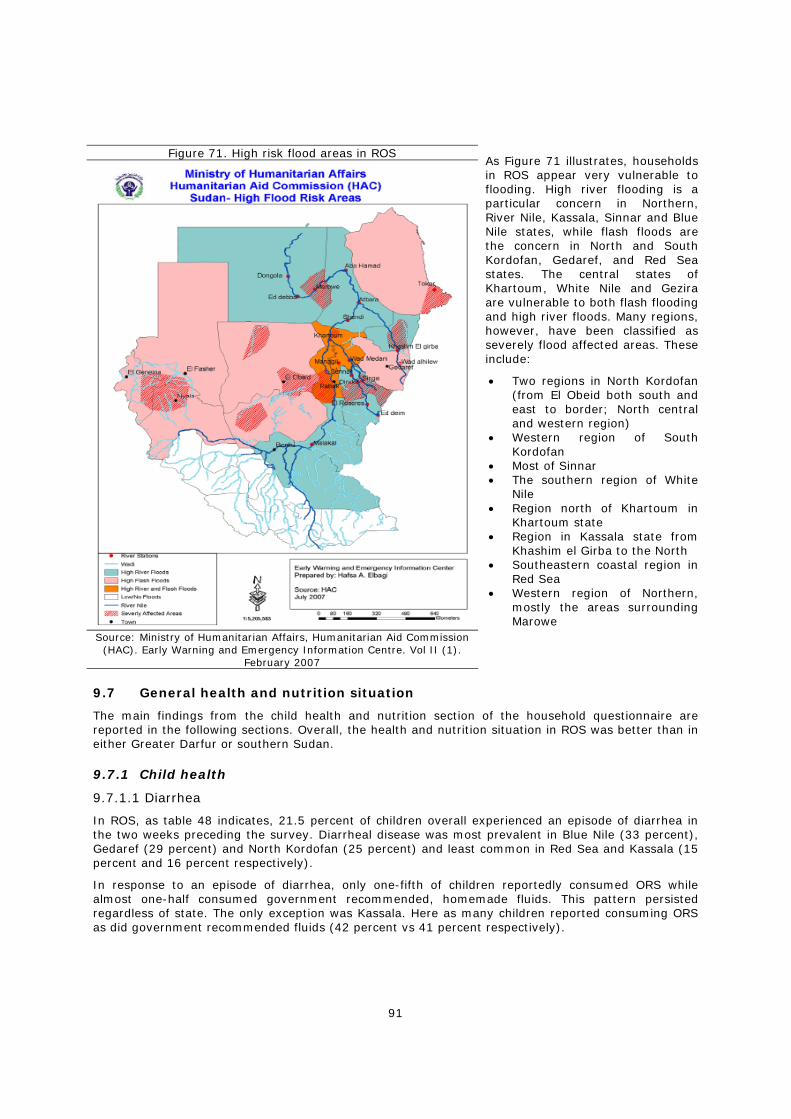
91
Figure 71. High risk flood areas in ROS
Source: Ministry of Humanitarian Affairs, Humanitarian Aid Commission
(HAC). Early Warning and Emergency Information Centre. Vol II (1). February 2007
As Figure 71 illustrates, households in ROS appear very vulnerable to flooding. High river flooding is a particular concern in Northern, River Nile, Kassala, Sinnar and Blue Nile states, while flash floods are the concern in North and South Kordofan, Gedaref, and Red Sea states. The central states of Khartoum, White Nile and Gezira are vulnerable to both flash flooding and high river floods. Many regions, however, have been classified as severely flood affected areas. These include:
• Two regions in North Kordofan (from El Obeid both south and east to border; North central and western region)
• Western region of South Kordofan
• Most of Sinnar • The southern region of White
Nile • Region north of Khartoum in
Khartoum state • Region in Kassala state from
Khashim el Girba to the North • Southeastern coastal region in
Red Sea • Western region of Northern,
mostly the areas surrounding Marowe
9.7 General health and nutrition situation
The main findings from the child health and nutrition section of the household questionnaire are reported in the following sections. Overall, the health and nutrition situation in ROS was better than in either Greater Darfur or southern Sudan.
9.7.1 Child health
9.7.1.1 Diarrhea
In ROS, as table 48 indicates, 21.5 percent of children overall experienced an episode of diarrhea in the two weeks preceding the survey. Diarrheal disease was most prevalent in Blue Nile (33 percent), Gedaref (29 percent) and North Kordofan (25 percent) and least common in Red Sea and Kassala (15 percent and 16 percent respectively).
In response to an episode of diarrhea, only one-fifth of children reportedly consumed ORS while almost one-half consumed government recommended, homemade fluids. This pattern persisted regardless of state. The only exception was Kassala. Here as many children reported consuming ORS as did government recommended fluids (42 percent vs 41 percent respectively).
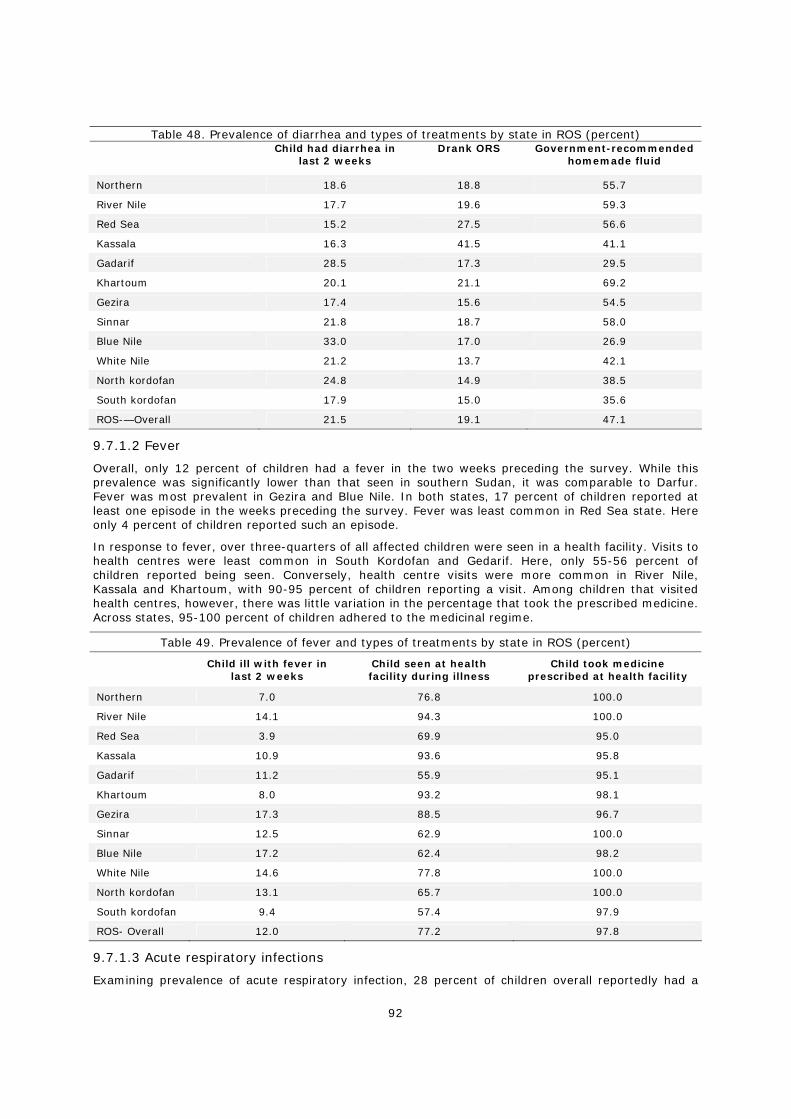
92
Table 48. Prevalence of diarrhea and types of treatments by state in ROS (percent) Child had diarrhea in
last 2 weeks Drank ORS Government-recommended
homemade fluid
Northern 18.6 18.8 55.7
River Nile 17.7 19.6 59.3
Red Sea 15.2 27.5 56.6
Kassala 16.3 41.5 41.1
Gadarif 28.5 17.3 29.5
Khartoum 20.1 21.1 69.2
Gezira 17.4 15.6 54.5
Sinnar 21.8 18.7 58.0
Blue Nile 33.0 17.0 26.9
White Nile 21.2 13.7 42.1
North kordofan 24.8 14.9 38.5
South kordofan 17.9 15.0 35.6
ROS-—Overall 21.5 19.1 47.1
9.7.1.2 Fever
Overall, only 12 percent of children had a fever in the two weeks preceding the survey. While this prevalence was significantly lower than that seen in southern Sudan, it was comparable to Darfur. Fever was most prevalent in Gezira and Blue Nile. In both states, 17 percent of children reported at least one episode in the weeks preceding the survey. Fever was least common in Red Sea state. Here only 4 percent of children reported such an episode.
In response to fever, over three-quarters of all affected children were seen in a health facility. Visits to health centres were least common in South Kordofan and Gedarif. Here, only 55-56 percent of children reported being seen. Conversely, health centre visits were more common in River Nile, Kassala and Khartoum, with 90-95 percent of children reporting a visit. Among children that visited health centres, however, there was little variation in the percentage that took the prescribed medicine. Across states, 95-100 percent of children adhered to the medicinal regime.
Table 49. Prevalence of fever and types of treatments by state in ROS (percent)
Child ill with fever in
last 2 weeks Child seen at health facility during illness
Child took medicine prescribed at health facility
Northern 7.0 76.8 100.0
River Nile 14.1 94.3 100.0
Red Sea 3.9 69.9 95.0
Kassala 10.9 93.6 95.8
Gadarif 11.2 55.9 95.1
Khartoum 8.0 93.2 98.1
Gezira 17.3 88.5 96.7
Sinnar 12.5 62.9 100.0
Blue Nile 17.2 62.4 98.2
White Nile 14.6 77.8 100.0
North kordofan 13.1 65.7 100.0
South kordofan 9.4 57.4 97.9
ROS- Overall 12.0 77.2 97.8
9.7.1.3 Acute respiratory infections
Examining prevalence of acute respiratory infection, 28 percent of children overall reportedly had a
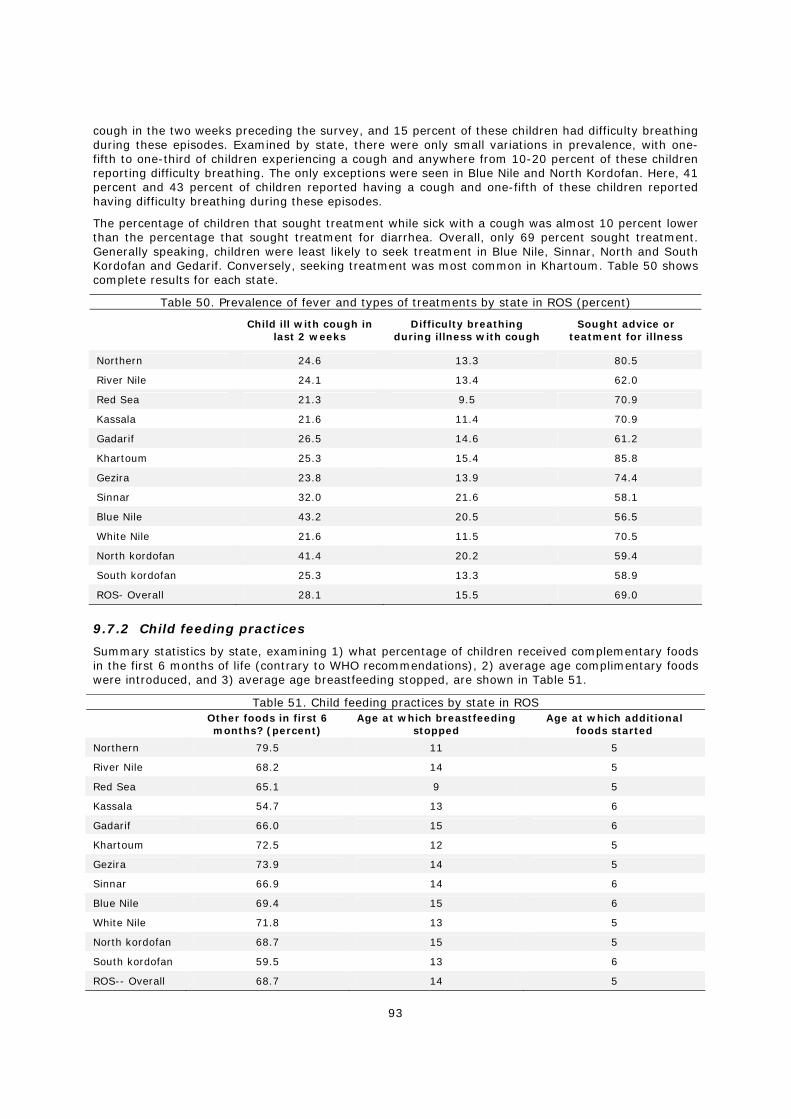
93
cough in the two weeks preceding the survey, and 15 percent of these children had difficulty breathing during these episodes. Examined by state, there were only small variations in prevalence, with one-fifth to one-third of children experiencing a cough and anywhere from 10-20 percent of these children reporting difficulty breathing. The only exceptions were seen in Blue Nile and North Kordofan. Here, 41 percent and 43 percent of children reported having a cough and one-fifth of these children reported having difficulty breathing during these episodes.
The percentage of children that sought treatment while sick with a cough was almost 10 percent lower than the percentage that sought treatment for diarrhea. Overall, only 69 percent sought treatment. Generally speaking, children were least likely to seek treatment in Blue Nile, Sinnar, North and South Kordofan and Gedarif. Conversely, seeking treatment was most common in Khartoum. Table 50 shows complete results for each state.
Table 50. Prevalence of fever and types of treatments by state in ROS (percent)
Child ill with cough in
last 2 weeks Difficulty breathing
during illness with cough Sought advice or
teatment for illness
Northern 24.6 13.3 80.5
River Nile 24.1 13.4 62.0
Red Sea 21.3 9.5 70.9
Kassala 21.6 11.4 70.9
Gadarif 26.5 14.6 61.2
Khartoum 25.3 15.4 85.8
Gezira 23.8 13.9 74.4
Sinnar 32.0 21.6 58.1
Blue Nile 43.2 20.5 56.5
White Nile 21.6 11.5 70.5
North kordofan 41.4 20.2 59.4
South kordofan 25.3 13.3 58.9
ROS- Overall 28.1 15.5 69.0
9.7.2 Child feeding practices
Summary statistics by state, examining 1) what percentage of children received complementary foods in the first 6 months of life (contrary to WHO recommendations), 2) average age complimentary foods were introduced, and 3) average age breastfeeding stopped, are shown in Table 51.
Table 51. Child feeding practices by state in ROS Other foods in first 6
months? (percent) Age at which breastfeeding
stopped Age at which additional
foods started
Northern 79.5 11 5
River Nile 68.2 14 5
Red Sea 65.1 9 5
Kassala 54.7 13 6
Gadarif 66.0 15 6
Khartoum 72.5 12 5
Gezira 73.9 14 5
Sinnar 66.9 14 6
Blue Nile 69.4 15 6
White Nile 71.8 13 5
North kordofan 68.7 15 5
South kordofan 59.5 13 6
ROS-- Overall 68.7 14 5
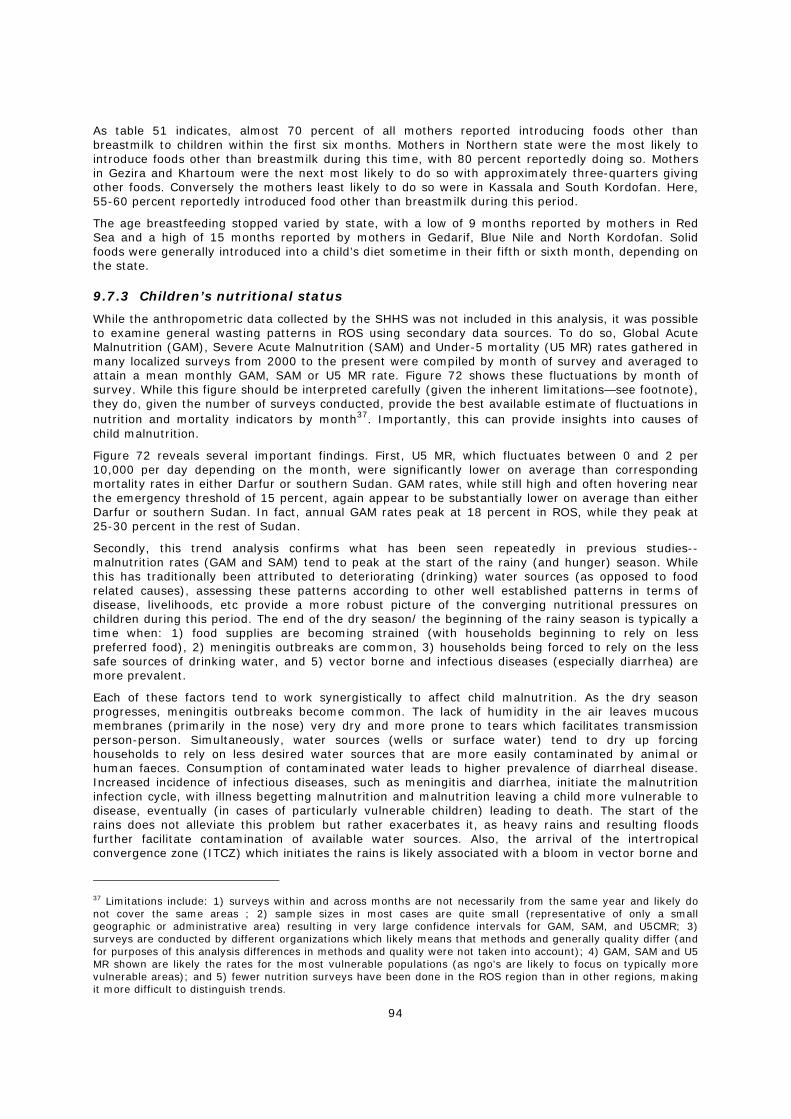
94
As table 51 indicates, almost 70 percent of all mothers reported introducing foods other than breastmilk to children within the first six months. Mothers in Northern state were the most likely to introduce foods other than breastmilk during this time, with 80 percent reportedly doing so. Mothers in Gezira and Khartoum were the next most likely to do so with approximately three-quarters giving other foods. Conversely the mothers least likely to do so were in Kassala and South Kordofan. Here, 55-60 percent reportedly introduced food other than breastmilk during this period.
The age breastfeeding stopped varied by state, with a low of 9 months reported by mothers in Red Sea and a high of 15 months reported by mothers in Gedarif, Blue Nile and North Kordofan. Solid foods were generally introduced into a child’s diet sometime in their fifth or sixth month, depending on the state.
9.7.3 Children’s nutritional status
While the anthropometric data collected by the SHHS was not included in this analysis, it was possible to examine general wasting patterns in ROS using secondary data sources. To do so, Global Acute Malnutrition (GAM), Severe Acute Malnutrition (SAM) and Under-5 mortality (U5 MR) rates gathered in many localized surveys from 2000 to the present were compiled by month of survey and averaged to attain a mean monthly GAM, SAM or U5 MR rate. Figure 72 shows these fluctuations by month of survey. While this figure should be interpreted carefully (given the inherent limitations—see footnote), they do, given the number of surveys conducted, provide the best available estimate of fluctuations in nutrition and mortality indicators by month37. Importantly, this can provide insights into causes of child malnutrition.
Figure 72 reveals several important findings. First, U5 MR, which fluctuates between 0 and 2 per 10,000 per day depending on the month, were significantly lower on average than corresponding mortality rates in either Darfur or southern Sudan. GAM rates, while still high and often hovering near the emergency threshold of 15 percent, again appear to be substantially lower on average than either Darfur or southern Sudan. In fact, annual GAM rates peak at 18 percent in ROS, while they peak at 25-30 percent in the rest of Sudan.
Secondly, this trend analysis confirms what has been seen repeatedly in previous studies-- malnutrition rates (GAM and SAM) tend to peak at the start of the rainy (and hunger) season. While this has traditionally been attributed to deteriorating (drinking) water sources (as opposed to food related causes), assessing these patterns according to other well established patterns in terms of disease, livelihoods, etc provide a more robust picture of the converging nutritional pressures on children during this period. The end of the dry season/ the beginning of the rainy season is typically a time when: 1) food supplies are becoming strained (with households beginning to rely on less preferred food), 2) meningitis outbreaks are common, 3) households being forced to rely on the less safe sources of drinking water, and 5) vector borne and infectious diseases (especially diarrhea) are more prevalent.
Each of these factors tend to work synergistically to affect child malnutrition. As the dry season progresses, meningitis outbreaks become common. The lack of humidity in the air leaves mucous membranes (primarily in the nose) very dry and more prone to tears which facilitates transmission person-person. Simultaneously, water sources (wells or surface water) tend to dry up forcing households to rely on less desired water sources that are more easily contaminated by animal or human faeces. Consumption of contaminated water leads to higher prevalence of diarrheal disease. Increased incidence of infectious diseases, such as meningitis and diarrhea, initiate the malnutrition infection cycle, with illness begetting malnutrition and malnutrition leaving a child more vulnerable to disease, eventually (in cases of particularly vulnerable children) leading to death. The start of the rains does not alleviate this problem but rather exacerbates it, as heavy rains and resulting floods further facilitate contamination of available water sources. Also, the arrival of the intertropical convergence zone (ITCZ) which initiates the rains is likely associated with a bloom in vector borne and
37 Limitations include: 1) surveys within and across months are not necessarily from the same year and likely do not cover the same areas ; 2) sample sizes in most cases are quite small (representative of only a small geographic or administrative area) resulting in very large confidence intervals for GAM, SAM, and U5CMR; 3) surveys are conducted by different organizations which likely means that methods and generally quality differ (and for purposes of this analysis differences in methods and quality were not taken into account); 4) GAM, SAM and U5 MR shown are likely the rates for the most vulnerable populations (as ngo’s are likely to focus on typically more vulnerable areas); and 5) fewer nutrition surveys have been done in the ROS region than in other regions, making it more difficult to distinguish trends.
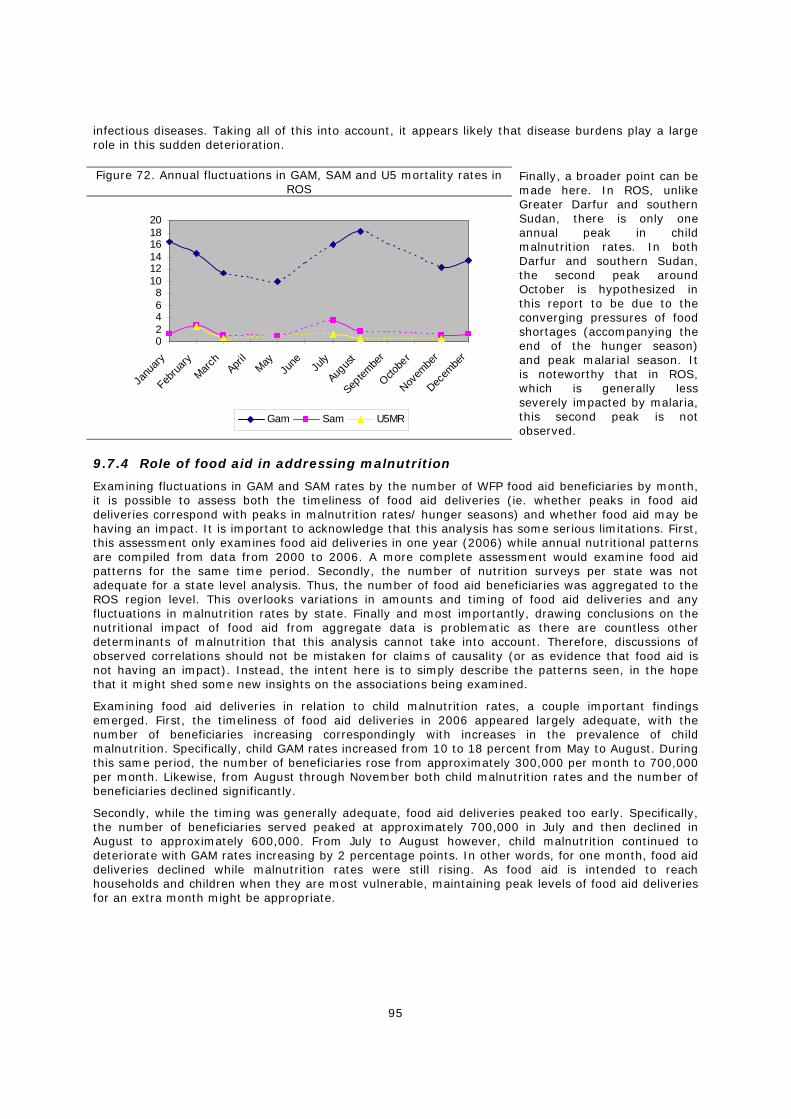
95
infectious diseases. Taking all of this into account, it appears likely that disease burdens play a large role in this sudden deterioration.
Figure 72. Annual fluctuations in GAM, SAM and U5 mortality rates in ROS
02468
101214161820
Janu
ary
Februa
ryMarc
hApri
lMay
June Ju
ly
Augus
t
Septem
ber
Octobe
r
Novem
ber
Decem
ber
Gam Sam U5MR
Finally, a broader point can be made here. In ROS, unlike Greater Darfur and southern Sudan, there is only one annual peak in child malnutrition rates. In both Darfur and southern Sudan, the second peak around October is hypothesized in this report to be due to the converging pressures of food shortages (accompanying the end of the hunger season) and peak malarial season. It is noteworthy that in ROS, which is generally less severely impacted by malaria, this second peak is not observed.
9.7.4 Role of food aid in addressing malnutrition
Examining fluctuations in GAM and SAM rates by the number of WFP food aid beneficiaries by month, it is possible to assess both the timeliness of food aid deliveries (ie. whether peaks in food aid deliveries correspond with peaks in malnutrition rates/ hunger seasons) and whether food aid may be having an impact. It is important to acknowledge that this analysis has some serious limitations. First, this assessment only examines food aid deliveries in one year (2006) while annual nutritional patterns are compiled from data from 2000 to 2006. A more complete assessment would examine food aid patterns for the same time period. Secondly, the number of nutrition surveys per state was not adequate for a state level analysis. Thus, the number of food aid beneficiaries was aggregated to the ROS region level. This overlooks variations in amounts and timing of food aid deliveries and any fluctuations in malnutrition rates by state. Finally and most importantly, drawing conclusions on the nutritional impact of food aid from aggregate data is problematic as there are countless other determinants of malnutrition that this analysis cannot take into account. Therefore, discussions of observed correlations should not be mistaken for claims of causality (or as evidence that food aid is not having an impact). Instead, the intent here is to simply describe the patterns seen, in the hope that it might shed some new insights on the associations being examined.
Examining food aid deliveries in relation to child malnutrition rates, a couple important findings emerged. First, the timeliness of food aid deliveries in 2006 appeared largely adequate, with the number of beneficiaries increasing correspondingly with increases in the prevalence of child malnutrition. Specifically, child GAM rates increased from 10 to 18 percent from May to August. During this same period, the number of beneficiaries rose from approximately 300,000 per month to 700,000 per month. Likewise, from August through November both child malnutrition rates and the number of beneficiaries declined significantly.
Secondly, while the timing was generally adequate, food aid deliveries peaked too early. Specifically, the number of beneficiaries served peaked at approximately 700,000 in July and then declined in August to approximately 600,000. From July to August however, child malnutrition continued to deteriorate with GAM rates increasing by 2 percentage points. In other words, for one month, food aid deliveries declined while malnutrition rates were still rising. As food aid is intended to reach households and children when they are most vulnerable, maintaining peak levels of food aid deliveries for an extra month might be appropriate.
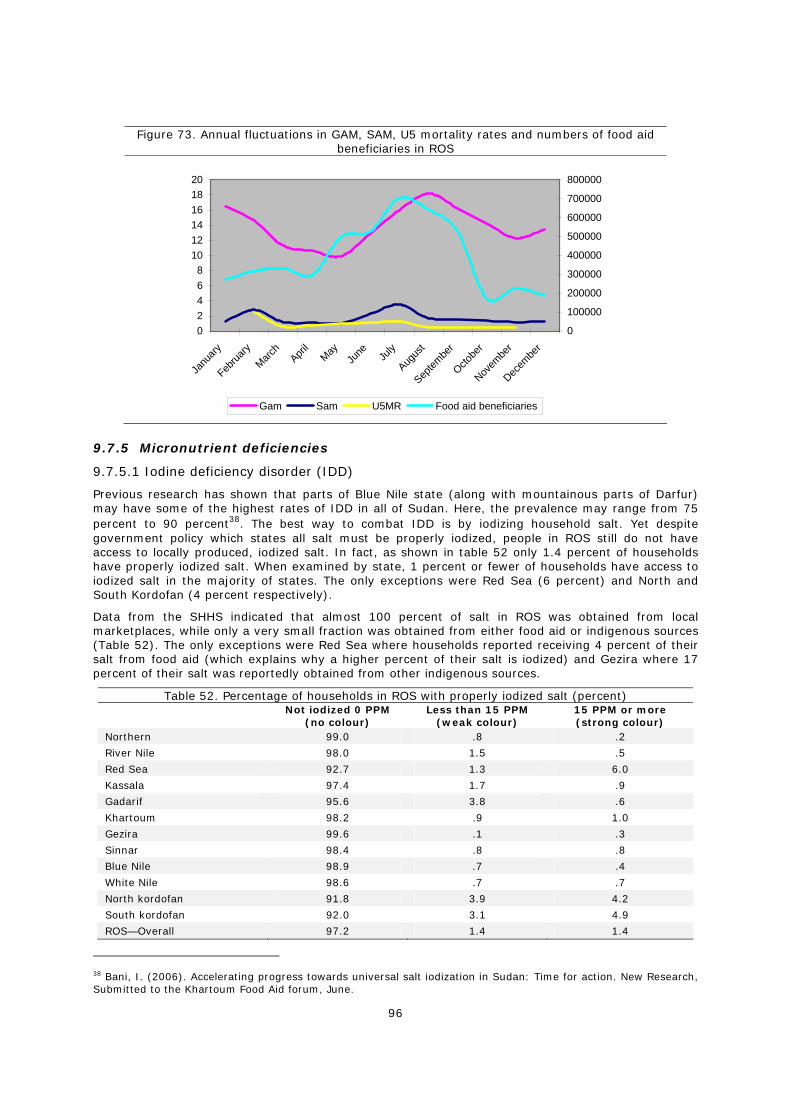
96
Figure 73. Annual fluctuations in GAM, SAM, U5 mortality rates and numbers of food aid beneficiaries in ROS
02468
101214161820
Janu
ary
Februa
ryMarc
hApri
lMay
June Ju
ly
Augus
t
Septem
ber
Octobe
r
Novem
ber
Decem
ber
0
100000
200000
300000
400000
500000
600000
700000
800000
Gam Sam U5MR Food aid beneficiaries
9.7.5 Micronutrient deficiencies
9.7.5.1 Iodine deficiency disorder (IDD)
Previous research has shown that parts of Blue Nile state (along with mountainous parts of Darfur) may have some of the highest rates of IDD in all of Sudan. Here, the prevalence may range from 75 percent to 90 percent38. The best way to combat IDD is by iodizing household salt. Yet despite government policy which states all salt must be properly iodized, people in ROS still do not have access to locally produced, iodized salt. In fact, as shown in table 52 only 1.4 percent of households have properly iodized salt. When examined by state, 1 percent or fewer of households have access to iodized salt in the majority of states. The only exceptions were Red Sea (6 percent) and North and South Kordofan (4 percent respectively).
Data from the SHHS indicated that almost 100 percent of salt in ROS was obtained from local marketplaces, while only a very small fraction was obtained from either food aid or indigenous sources (Table 52). The only exceptions were Red Sea where households reported receiving 4 percent of their salt from food aid (which explains why a higher percent of their salt is iodized) and Gezira where 17 percent of their salt was reportedly obtained from other indigenous sources.
Table 52. Percentage of households in ROS with properly iodized salt (percent)
Not iodized 0 PPM
(no colour) Less than 15 PPM
(weak colour) 15 PPM or more (strong colour)
Northern 99.0 .8 .2
River Nile 98.0 1.5 .5
Red Sea 92.7 1.3 6.0
Kassala 97.4 1.7 .9
Gadarif 95.6 3.8 .6
Khartoum 98.2 .9 1.0
Gezira 99.6 .1 .3
Sinnar 98.4 .8 .8
Blue Nile 98.9 .7 .4
White Nile 98.6 .7 .7
North kordofan 91.8 3.9 4.2
South kordofan 92.0 3.1 4.9
ROS—Overall 97.2 1.4 1.4
38 Bani, I. (2006). Accelerating progress towards universal salt iodization in Sudan: Time for action. New Research, Submitted to the Khartoum Food Aid forum, June.
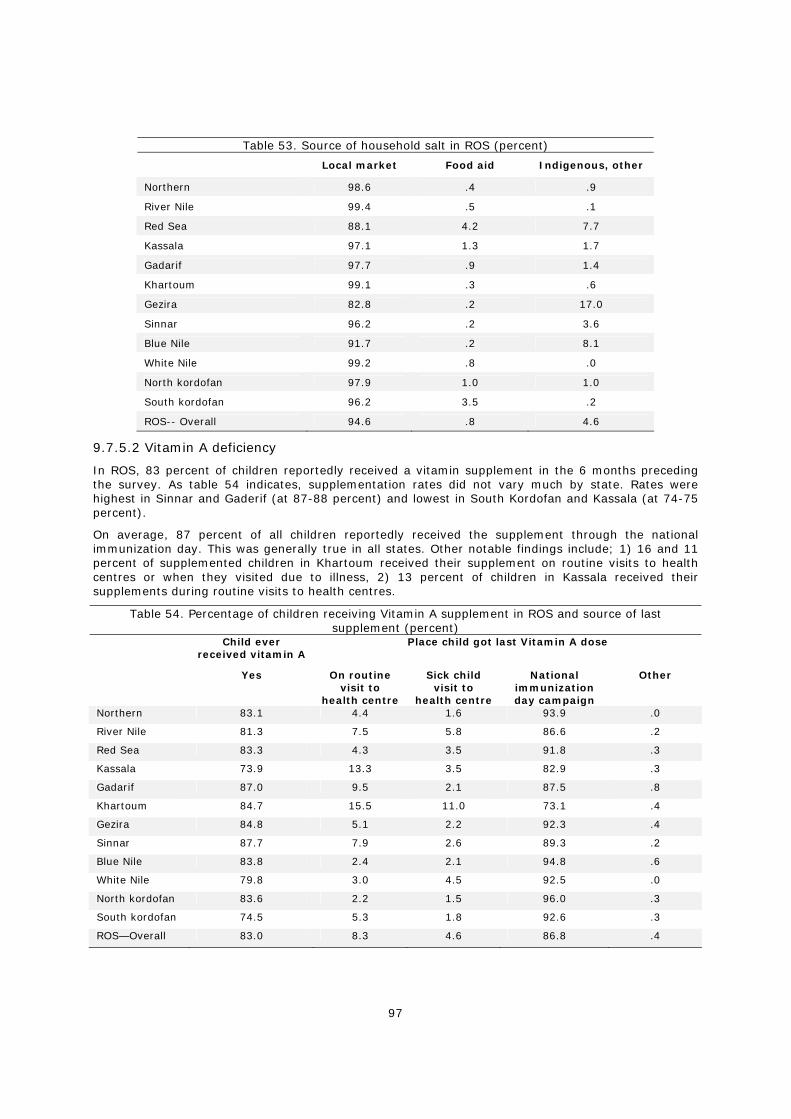
97
Table 53. Source of household salt in ROS (percent)
Local market Food aid Indigenous, other
Northern 98.6 .4 .9
River Nile 99.4 .5 .1
Red Sea 88.1 4.2 7.7
Kassala 97.1 1.3 1.7
Gadarif 97.7 .9 1.4
Khartoum 99.1 .3 .6
Gezira 82.8 .2 17.0
Sinnar 96.2 .2 3.6
Blue Nile 91.7 .2 8.1
White Nile 99.2 .8 .0
North kordofan 97.9 1.0 1.0
South kordofan 96.2 3.5 .2
ROS-- Overall 94.6 .8 4.6
9.7.5.2 Vitamin A deficiency
In ROS, 83 percent of children reportedly received a vitamin supplement in the 6 months preceding the survey. As table 54 indicates, supplementation rates did not vary much by state. Rates were highest in Sinnar and Gaderif (at 87-88 percent) and lowest in South Kordofan and Kassala (at 74-75 percent).
On average, 87 percent of all children reportedly received the supplement through the national immunization day. This was generally true in all states. Other notable findings include; 1) 16 and 11 percent of supplemented children in Khartoum received their supplement on routine visits to health centres or when they visited due to illness, 2) 13 percent of children in Kassala received their supplements during routine visits to health centres.
Table 54. Percentage of children receiving Vitamin A supplement in ROS and source of last supplement (percent)
Child ever received vitamin A
Place child got last Vitamin A dose
Yes On routine visit to
health centre
Sick child visit to
health centre
National immunization day campaign
Other
Northern 83.1 4.4 1.6 93.9 .0
River Nile 81.3 7.5 5.8 86.6 .2
Red Sea 83.3 4.3 3.5 91.8 .3
Kassala 73.9 13.3 3.5 82.9 .3
Gadarif 87.0 9.5 2.1 87.5 .8
Khartoum 84.7 15.5 11.0 73.1 .4
Gezira 84.8 5.1 2.2 92.3 .4
Sinnar 87.7 7.9 2.6 89.3 .2
Blue Nile 83.8 2.4 2.1 94.8 .6
White Nile 79.8 3.0 4.5 92.5 .0
North kordofan 83.6 2.2 1.5 96.0 .3
South kordofan 74.5 5.3 1.8 92.6 .3
ROS—Overall 83.0 8.3 4.6 86.8 .4
98
9.8 Conclusions and recommendations
In conclusion, ROS is the wealthiest and most food secure region in Sudan. Overall, 8.2 percent of households in ROS are food insecure, compared to 26 percent of households in Darfur and 33 percent of households in Southern Sudan. It should be noted that ROS is not universally better off, however, as certain sub-populations are as bad off as households in parts of Darfur and Southern Sudan.
9.8.1 Livelihood food security and vulnerability profiles
Livelihood activities most vulnerable to food insecurity included “agriculture”, “agriculture, hunting and fishing”, “pastoralism”, “unskilled labour”, and “handicraft”. “Agriculture”, “pastoralism” and “unskilled labour” were prevalent in North and South Kordofan, Kassala, Blue Nile, and Gedarif, while “handicraft” was most prevalent in Khartoum and River Nile.
Conversely, livelihood activities typically considered more urban or market-centreed, like “employed work” or “other activities”, were typically better off.
9.8.2 Geographic Food security and vulnerability profiles
When the geographic distribution of food insecurity was examined, South Korfofan was determined to have the largest percentage of food insecure households. Here, 32 percent of households were food insecure, which was comparable to food insecurity rates throughout much of southern Sudan. Blue Nile, North Kordofan, Red Sea and Kassala, had elevated food insecurity rates, although households in these states were significantly less vulnerable to food insecurity than households in South Kordofan. In these states, 11-14 percent of households were food insecure. The states with the lowest percent of food insecure were Northern (1 percent), Gezira (1.5 percent) and River Nile (2.6 percent). Northern and River Nile are two of the three states not covered by WFP programming.
9.8.3 Causes of food insecurity and vulnerability
The main predictors of food insecurity in ROS consisted of the following:
• Wealth status
• Sex of household head (female headed more vulnerable)
• High dependency ratios
• Households status (IDP HH, refugee households, and IDP HH recently resettled)
• Household experiencing shocks (multiple shocks, agricultural and food price shocks)
Wealth was the strongest predictor of food security status, with households in the poorest quintile more food insecure on average by 25 percent than households in the richest quintile (30 percent vs 5 percent food insecure). The poorest states on average included South Kordofan, Kassala, and Red Sea. Female headed households and households with high dependency ratios were also worse off, by 5 percent and 3 percent respectively.
Present and former IDP households were both found to be more at risk of food insecurity than settled residents. Current IDP and refugee households had a predicted food insecurity prevalence 8 percent and 11 percent higher than residents while recently resettled IDPs had a prevalence of 22 percent higher.
Households affected by shocks (particularly multiple shocks, agricultural and food price shocks) appeared to be more vulnerable to food insecurity than households affected by no shocks. Households affected by multiple shocks were worse off by approximately 15 percent while household affected by agricultural and food price shocks were worse off by approximately 10 percent.
The states most affected by shocks included Gedarif (30 percent), North Kordofan (26 percent) and Blue Nile (25 percent). The states considered most vulnerable to insecurity and drought, as determined from the vulnerability analysis, are shown in Table 55.
Table 55. The states most vulnerable to drought and insecurity in ROS Type of shock Households most vulnerable to insecurity and drought
Insecurity South Kordofan Blue Nile Kassala
Drought South Kordofan North Kordofan River Nile
99
While most of ROS was vulnerable to either river or flash floods, the areas most vulnerable included:
• Two regions in North Kordofan (from El Obeid both south and east to border; North central and western region)
• Western region of South Kordofan
• Most of Sinnar
• The southern region of White Nile
• Region north of Khartoum in Khartoum state
• Region in Kassala state from Khashim el Girba to the North
• Southeastern coastal region in Red Sea
• Western region of Northern, mostly the areas surrounding Marowe
9.8.4 Targeting and timing of food aid
An assessment of whether food aid programmes were targeted correctly revealed that some recalibrations may be necessary. In Kassala the amount of food aid given in 2006 seemed to exceed needs when examined in terms of the share of food insecure. At the same time, the amount of food aid given in North Kordofan and Blue Nile seemed in adequate for the level of need. Kassala, for instance, had 11 percent of the food insecure but received 39 percent of the food aid. North Kordofan, on the other hand, had 12 percent of the food insecure and received less than one percent of the food aid.
An assessment of the timing of food aid deliveries by annual patterns in childhood wasting levels (in traditional livelihoods zones) revealed that overall food aid deliveries were timed correctly though the number of beneficiaries peaked one month prior to annual highs in child malnutrition rates (and declined by 100,000 beneficiaries while malnutrition rates were still rising). Given this situation, maintaining peak food aid levels for an additional month would likely be beneficial.
9.8.5 Recommended food interventions by priority area and priority group
The CFSVA makes the following recommendations:
1. Refine the targeting of food aid
The CFSVA provides rough guidance on what characteristics food insecure households tend to share and where the largest concentration of food insecure households are located. Household characteristics associated with food insecurity include:
• Asset poverty
• Female headed households
• Households with high dependency ratios
• Households reliant on agriculture, pastoralism, unskilled labour, handicraft, or a mixture of agriculture, hunting and fishing
• Current or recently resettled IDP households
• Refugee households
• Household frequently affected by multiple agricultural and food price shocks
In terms of where the food insecure are located, CFSVA results indicate that households in South Kordofan are significantly more vulnerable to food insecurity than households in any other state. Other households at elevated risk include households in Blue Nile, North Kordofan, Red Sea, and Kassala. Conversely, households least vulnerable to food insecurity are located in Northern, River Nile and Gezira.
To better refine targeting, this information should be utilized to determine whether communities currently receiving heavy amounts of food aid (and those communities that are not) share the characteristics indicative of food insecurity. It should be stressed that this is intended only as a guide, as every food insecure household has unique characteristics.
100
The second component crucial in more effective targeting is to ensure that the share and number of beneficiaries is proportional to the share and number of food insecure. The CFSVA has shown that Kassala was heavily overtargeted (at least in terms of the share of food insecure) while North Kordofan and Blue Nile were undertargeted. Given this, the CFSVA recommends that in the future more resources be directed towards North Kordofan and Blue Nile. It is not clear, however, whether resources should be re-directed from Kassala, as the refugee population remains. This decision should be made by programmemers with knowledge of the current state of food insecurity in Kassala.
2. Improve timing of food aid deliveries
One of the important findings from this CFSVA was that the timing of food aid in this region appeared adequate. The only recommendation from the CFSVA is that food aid programmers take into consideration that August appears to be the annual peak in malnutrition rates for children. This may indicate a need for peak levels of food aid to persist at least through this month.
9.8.6 Recommended non-food interventions by priority area and priority group
Findings from the CFSVA also provide some guidance on what non food interventions or activities should be prioritized. These are discussed below.
Child health and nutrition priorities/ interventions:
1. Study causes of childhood malnutrition;
The CFSVA recommends that WFP invest in analytical studies examining the causes of malnutrition amongst children in ROS and the reasons behind the perpetually high rates of wasting (at or above the 15 percent emergency threshold for much of the year), even in areas typically considered better off in terms of other indicators. While the CFSVA recognizes that WFP’s mission is not research oriented, better understanding the origins of malnutrition would facilitate decision-making within WFP on the role of food aid programmes in the region. It would also be instrumental in maximizing the cost-effectiveness and generalized impact of WFP programmes.
2. Institute programmes encouraging improved child caring practices and particularly child feeding practices;
The CFSVA also recommends incorporating programmes encouraging proper child caring practices, and particularly child feeding patterns into existing nutritional support programmes. The majority of mothers in ROS (ranging from 55 to 80 percent depending on the state) introduce foods other than breastmilk to children under 6 months of age. This practice should be discouraged, by disseminating the recommendations of WHO. Particular attention should be paid to feeding practices in areas typically considered better off (Northern, Khartoum and Gezira) as 70-80 percent of mothers in these areas are introducing other foods too early.
3. Increase vitamin A supplementation programmes, with a particular focus on children in Kassala and South Kordofan states;
The CFSVA recommends that vitamin A supplementation programmes be instituted to improve supplementation rates, particularly in the underserved areas of Kassala and South Kordofan. CFSVA data indicates that supplementation rates throughout ROS are generally good, with over 80 percent of children having received a supplement in the 6 months preceding the survey (most through the national immunization day). In both Kassala and South Kordofan, however, fewer than three-fourths of children have been supplemented. This would suggest a need to expand the reach of supplementation efforts during the national immunization day in both states or to encourage existing health centres within both states to provide supplements to children who have previously not been supplemented.
4. Encourage salt fortification programmes;
Recent studies have indicated that some of the regions most affected by IDD are located in the ROS region and specifically in Blue Nile state. While the Universal Salt Iodization (USI) policy was officially adopted in 1994 as the foundation for the national IDD prevention strategy, this policy has not been properly enforced, leaving people in ROS, without access to properly iodized salt. Households that have iodized salt receive their salt from non domestic sources, either by trade with surrounding countries or from food aid. Given that neither cross-border trade nor food aid receipt is common for households in ROS, the only solution to IDD is to encourage the government to enforce the USI and ensure that all domestically produced salt is iodized. This should be encouraged by WFP.
101
10. Greater Darfur
10.1 Situational analysis
10.1.1 Overview
Situated between the Sahelian and desert zones, Greater Darfur is comprised of 3 states and covers an area approximately 511,412 square kilometres. Northern Sudan is typically more arid, receiving less than 100 mm of rain, while South Darfur is part of the Sudanic zone and enjoys a much longer rainy season, receiving 500 to 900 mm of rain.
Culturally, Darfur is comprised of both sedentary (non arab) and nomadic (arab) agro-pastoralists. Tribal and ethnic conflicts over natural resources have historically been common, though in recent years they became both more frequent and more severe, ultimately culminating in the current crisis that began in 2003. The roots causes of this crisis have been summarized as follows39:
- General marginalisation and neglect of Darfur;
- Marginalisation of Arab nomad tribes within Darfur;
- National and international strategies of arabisation;
- Drought and competition over limited natural resources within Darfur;
- Land tenure rights;
While sporadic conflict was relatively common in the years before the war, large scale fighting began in earnest in late 2003, with rebel forces launching an insurgent campaign against strategically important GOS targets. The response from GOS and allied militia forces was swift and violent, particularly in North and West Darfur. In these areas, villages were completely destroyed and livelihoods (crops, livestock, etc) were systematically targeted for destruction. The violence was so widespread that most of the rural populations in these states were displaced, with many moving to scattered IDP camps throughout the region.
Rebel forces have also been implicated in attacks on pastoral communities, particularly in North Darfur, which has resulted in killings and looting of livestock.
The net effect of this crisis has been widespread displacement, and livelihood destruction. As of 2006, it is estimated that 3.7 million people have been affected by the conflict and close to 2 million people have been displaced. To illustrate the depth of the displacement, figure 74 shows the geographic distribution of IDP and refugee camps as of April 2007.
39 V. Tanner. ‘Rules of lawlessness. Roots and repercussions of the Darfur crisis’. Inter-agency paper of the Sudan Advocacy Coalition, January 2005
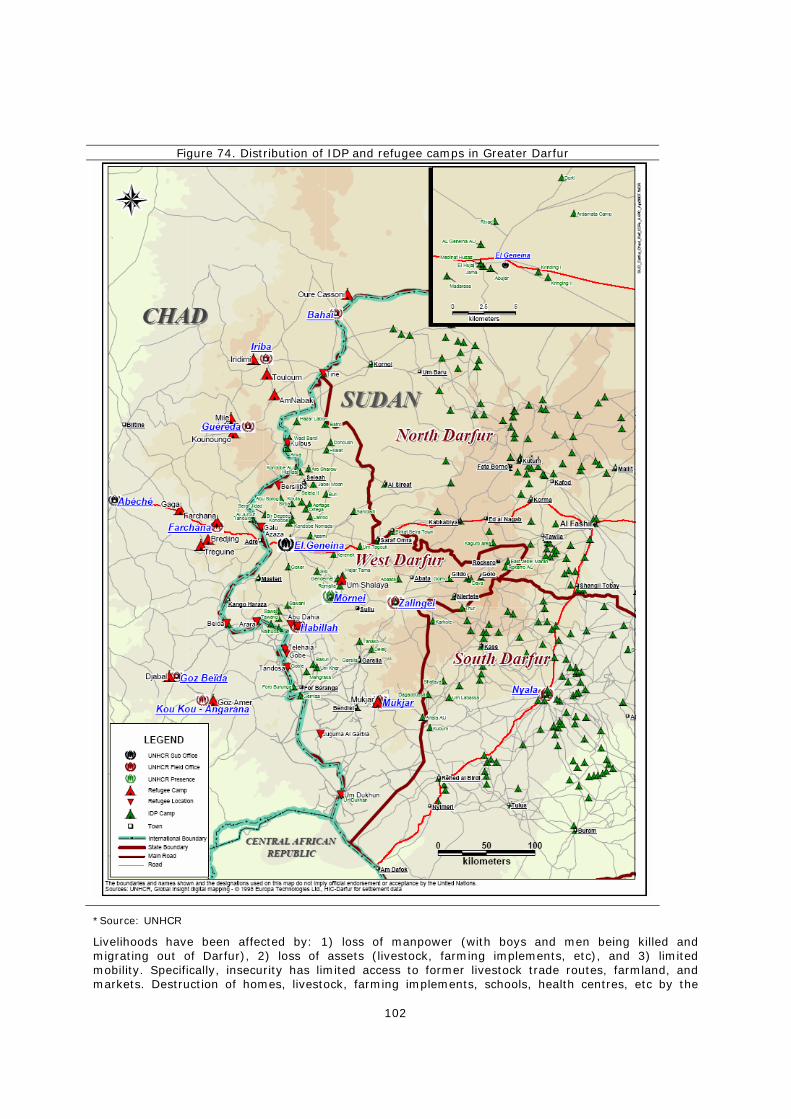
102
Figure 74. Distribution of IDP and refugee camps in Greater Darfur
*Source: UNHCR
Livelihoods have been affected by: 1) loss of manpower (with boys and men being killed and migrating out of Darfur), 2) loss of assets (livestock, farming implements, etc), and 3) limited mobility. Specifically, insecurity has limited access to former livestock trade routes, farmland, and markets. Destruction of homes, livestock, farming implements, schools, health centres, etc by the
103
GOS and Janjaweed forces has made it even more difficult for displaced households to return home and restart their livelihoods. It is estimated that the non arab population in Darfur has lost 50-90 percent of their cattle40. Movement by IDPs and residents in search of water, food or in pursuit of various livelihood activities (like collection of wild grass and firewood) is also restricted, as venturing too far from camps or towns leaves people exposed to attacks by Janjaweed. Rape, in particular, remains a constant threat to women.
10.1.2 Current Security Situation
While the same dynamics have largely persisted in Darfur (GOS/ Janjaweed vs SLA/ JEM), the specific nature of the conflict has changed somewhat since 2003. First, new engagements and resulting displacements are decidedly smaller in scale. This is due to the fact that both sides have consolidated their power and new fighting is over areas of specific strategic importance to one side or the other. Secondly, fighting has metastasized from something approaching a civil war (GOS/ Janjaweed vs SLA/ JEM) in the beginning to the general state of lawlessness that now exists. This can largely be attributed to the splintering of existing rebel factions (like the SLA and JEM), resurgent tribal tensions (and subsequent shifting of alliances) and activities of third party participants (ie. the Chadian rebels). The decentralization of the conflict has resulted in violence that is increasingly revenge oriented, with certain groups attacking particular households to settle old scores. This, combined with the proliferation of arms has also led to a spike in general banditry and other kinds of criminal activities. Unfortunately this is increasingly affecting aid workers, as car jackings and assaults have become more common. Another important emerging source of insecurity is the threat of terrorism that has been directed against UN facilities. While this threat is specifically targeted towards the UN, a successful attack could alter how WFP operates, affecting millions of people reliant on food aid.
Recent developments provide renewed hope for an end to violence. In April, the Government in Khartoum finally came to an agreement with the UN Security Council, in regards to the deployment of a 26,000 hybrid UN-AU peacekeeping force. While this appears to be a step in the right direction, only time will indicate whether this deployment will proceed as planned and whether it will be effective.
10.1.3 Economic Situation and household livelihoods
Before the conflict, the main livelihood sources for households in Darfur consisted of subsistence farming and trade in livestock. Agricultural production and yields have historically been highly erratic due to unpredictable patterns of rainfall, pest infestations and the lack of appropriate agricultural implements. The livestock trade has been a crucial livelihood component with tens of thousands of livestock (pre-conflict) exported annually to surrounding countries. A shortage of grazing land and water, however, has placed added pressure on livestock populations over the past decades.
Regional food security is dependent on a combination of food production, formal and informal inter-state and cross border trade. A breakdown at any of these levels due to production shocks or to disruptions to physical and economic access to markets could have severe food security repercussions. Despite unpredictable yields, cereal production in Greater Darfur was usually sufficient to satisfy demand in each state. Regional cereal self-sufficiency is important, as cereals produced in other parts of Sudan are not routinely brought into the region because of substantial transportation costs.
10.1.4 Agricultural Sector
Most households in Darfur, even generally nomadic households, engage in some food crop production, with sorghum and millet as the primary crops. Aside from cereals, households throughout the region also rely on water melon, tobacco, and groundnut production. South and West Darfur, given generally more favorable agricultural conditions, tend to be surplus food producing areas, while North Darfur is typically food deficient. The arid climate limits crop diversity as conditions only permit millet (and groundnut) production, leaving households reliant on foods produced in South and West Darfur.
Livestock is a crucial part of the agricultural sector here, as virtually all households own livestock and at least pre-conflict there was a thriving international trade. The importance of livestock as a livelihood has diminished in importance since the start of the conflict, as typical trade routes are largely inaccessible and livestock populations have been placed under increasing pressure. Also many households have had their livestock plundered, forcing them to turn to other livelihoods.
40 Young, H, Osman AM, Akillu, Y, Badri, B and Fuddle, AJ. Darfur- Livelihoods under Siege. Feinstein International Famine Centre. June 2005.
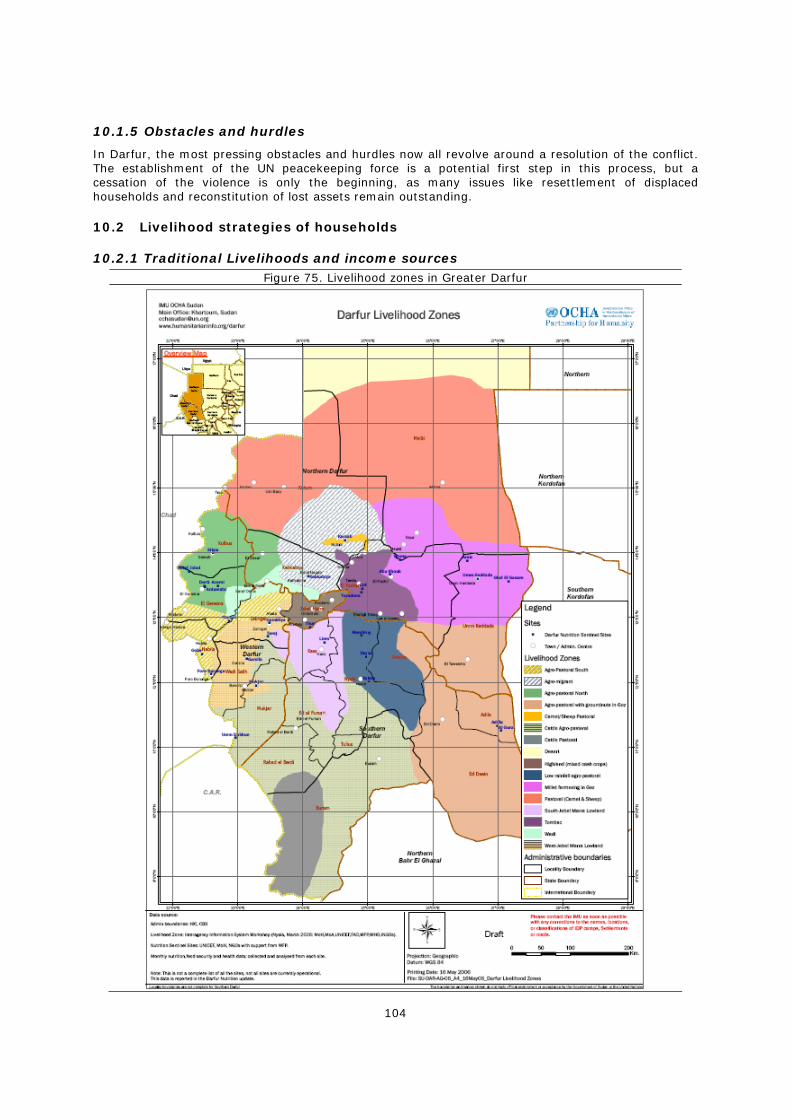
104
10.1.5 Obstacles and hurdles
In Darfur, the most pressing obstacles and hurdles now all revolve around a resolution of the conflict. The establishment of the UN peacekeeping force is a potential first step in this process, but a cessation of the violence is only the beginning, as many issues like resettlement of displaced households and reconstitution of lost assets remain outstanding.
10.2 Livelihood strategies of households
10.2.1 Traditional Livelihoods and income sources Figure 75. Livelihood zones in Greater Darfur
105
Prior to the start of the conflict in 2003, traditional livelihoods in Darfur consisted of 4 main income generating activities. These included: 1) agriculture, 2) livestock/ herding, 3) trade, 4) labour migration (Khartoum, Libya, etc). As discussed above, Darfur has historically been able to provide for its food needs with the most productive areas also being a crucial source of labour. South Darfur (with a longer rainy season) traditionally has some of the most productive land and consequently has always been wealthier and more food secure than either West or North Darfur. North Darfur, given its arid climate (especially in the northern regions) has consistently been the most food insecure state in Darfur. Trade in livestock has also been an important source of livelihoods with tens of thousands of camels exported annually (pre-conflict) to Libya and Egypt. Figure 75 above provides a concise break down of primary livelihood activities by geographic area in Greater Darfur.
10.2.2 Impact of war on livelihoods
The outbreak of the war in late 2003/ early 2004 resulted in the systematic destruction of livelihoods throughout the region. The early stages of the war were particularly damaging, as household assets (including productive and non productive assets, livestock, etc) and entire communities were systematically destroyed. Livestock losses were particularly severe not only because of violence but also because of distress selling by households. Agricultural production and livestock trade also suffered, as access to farmland was severely limited and typical trade routes were largely cut off.
Since that time, the amount of large scale violence has declined, though significant ongoing fighting in certain areas, theft, looting, rape and criminal activity are still heavily affecting livelihoods. Women are fearful to leave their villages, IDP camps or garrison towns for any reason, lest they be raped or murdered. Displaced farmers are being forced off of productive land and onto less productive, hard clay soils. Farmers that remain on their land are usually able to access only a fraction of it, as they are unwilling to venture far from home for fear of violence. A livelihood assessment conducted in 2006 indicated that Janjaweed sometimes graze their cattle on crops before they can be harvested.
The practical effect of the ongoing violence and traditional livelihood destruction has been less reliance on traditional livelihoods and an emerging reliance on daily labour and petty trade activities. According to the livelihoods assessments conducted in 2006, IDPs, especially those with access to capital from relatives or loans, are increasingly engaging in petty trade activities. One specific activity that has become increasingly common is brick-making. This activity by and large allows the participant to stay in the relatively safety of their town or village, thus not exposing them to violence. Another common activity is the collection of wild grass and firewood. This activity involves more risk as collection of these resources requires that participants leave the town or village.
10.2.3 Current livelihood activities/ profiles (from the SHHS)
The war’s impact on livelihoods is reflected in the current SHHS data. While agricultural activities remain the most common livelihood activity, “food aid”, “petty trade”, and “unskilled labour” are the next most common income generating activities in Greater Darfur. Examined by state, food aid assistance was the most commonly reported livelihood activity in West Darfur, which was experiencing most of the violence at the time of data collection. Overall, 36 percent of households reported this. In both North and South Darfur, the impact of the war was noticeable. While “agriculture” was the most common livelihood activity, “food aid assistance” and “unskilled labour” were the second and third most common activities in North Darfur and “petty trade” and “unskilled labour” were the second and fifth most common activities in South Darfur. Complete results by state are shown in Table 56. It should be noted that “food aid assistance” was not a prominent source of livelihoods in South Darfur as it was in both North and West Darfur. This discrepancy can only be explained by households in South Darfur having greater income generating opportunities (whether it be agriculture, employed work etc) and thus, despite receiving a similar share of food aid, are less likely to consider food aid a stand alone source of livelihood rather than a supplement to their existing livelihoods. This explanation is bolstered by the fact that households in South Darfur have been historically better off (in terms of food security and child nutrition) than households in North and West Darfur.
When assessed by number rather than type, approximately 50 percent of households, regardless of state, relied on one livelihood activity primarily while 30-40 percent relied on 2. Fewer than 10 percent of households relied on more than 2 activities (Figure 76).
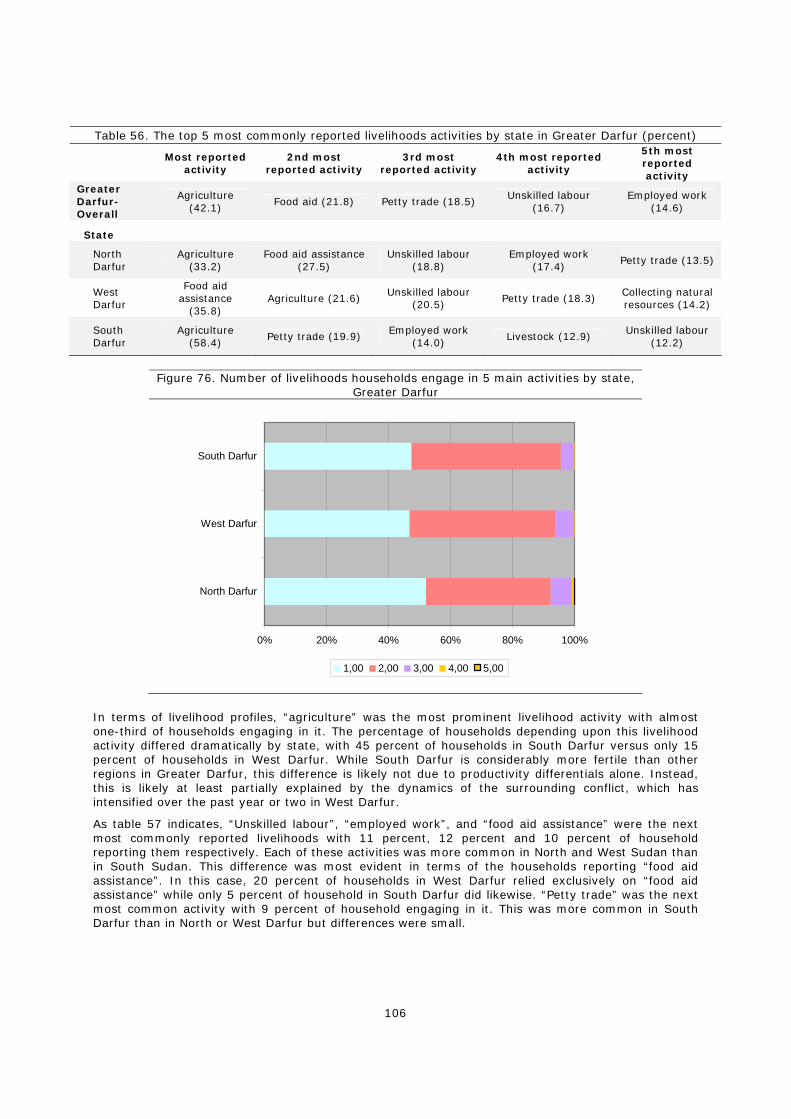
106
Table 56. The top 5 most commonly reported livelihoods activities by state in Greater Darfur (percent)
Most reported activity
2nd most reported activity
3rd most reported activity
4th most reported activity
5th most reported activity
Greater Darfur- Overall
Agriculture (42.1)
Food aid (21.8) Petty trade (18.5) Unskilled labour
(16.7) Employed work
(14.6)
State
North Darfur
Agriculture (33.2)
Food aid assistance (27.5)
Unskilled labour (18.8)
Employed work (17.4)
Petty trade (13.5)
West Darfur
Food aid assistance
(35.8) Agriculture (21.6)
Unskilled labour (20.5) Petty trade (18.3)
Collecting natural resources (14.2)
South Darfur
Agriculture (58.4)
Petty trade (19.9) Employed work
(14.0) Livestock (12.9)
Unskilled labour (12.2)
Figure 76. Number of livelihoods households engage in 5 main activities by state,
Greater Darfur
0% 20% 40% 60% 80% 100%
North Darfur
West Darfur
South Darfur
1,00 2,00 3,00 4,00 5,00
In terms of livelihood profiles, “agriculture” was the most prominent livelihood activity with almost one-third of households engaging in it. The percentage of households depending upon this livelihood activity differed dramatically by state, with 45 percent of households in South Darfur versus only 15 percent of households in West Darfur. While South Darfur is considerably more fertile than other regions in Greater Darfur, this difference is likely not due to productivity differentials alone. Instead, this is likely at least partially explained by the dynamics of the surrounding conflict, which has intensified over the past year or two in West Darfur.
As table 57 indicates, “Unskilled labour”, “employed work”, and “food aid assistance” were the next most commonly reported livelihoods with 11 percent, 12 percent and 10 percent of household reporting them respectively. Each of these activities was more common in North and West Sudan than in South Sudan. This difference was most evident in terms of the households reporting “food aid assistance”. In this case, 20 percent of households in West Darfur relied exclusively on “food aid assistance” while only 5 percent of household in South Darfur did likewise. “Petty trade” was the next most common activity with 9 percent of household engaging in it. This was more common in South Darfur than in North or West Darfur but differences were small.
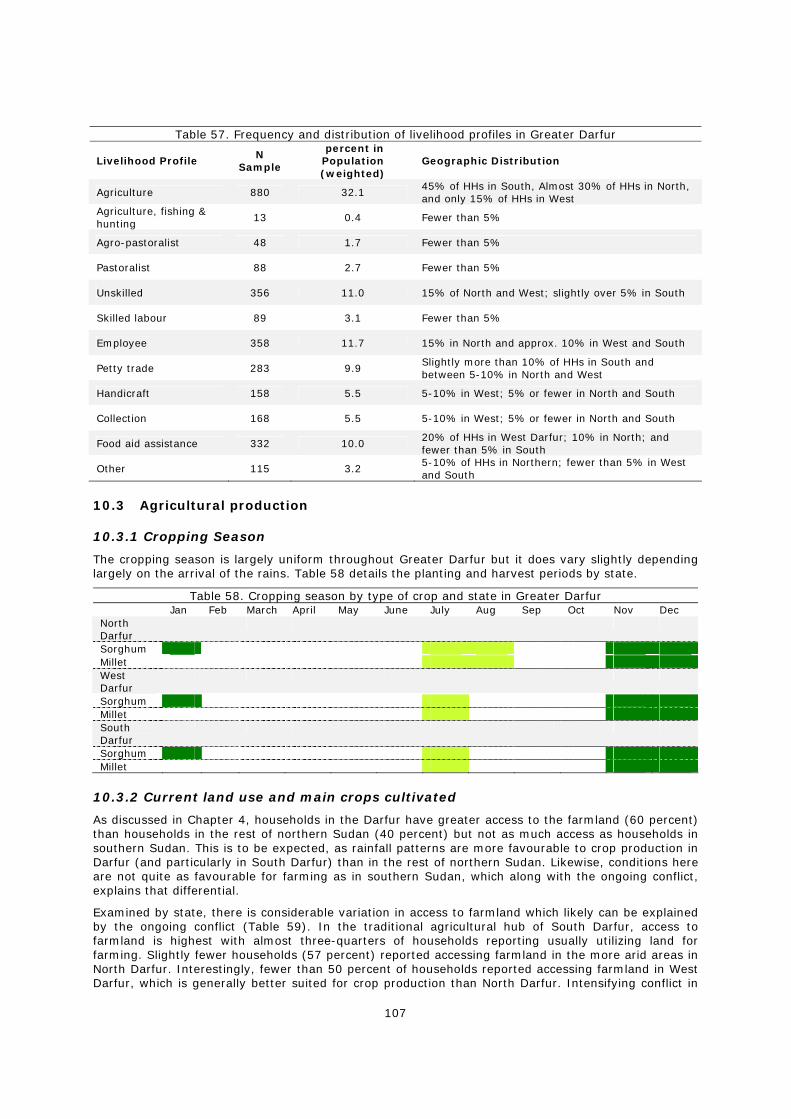
107
Table 57. Frequency and distribution of livelihood profiles in Greater Darfur
Livelihood Profile N Sample
percent in Population (weighted)
Geographic Distribution
Agriculture 880 32.1 45% of HHs in South, Almost 30% of HHs in North, and only 15% of HHs in West
Agriculture, fishing & hunting
13 0.4 Fewer than 5%
Agro-pastoralist 48 1.7 Fewer than 5%
Pastoralist 88 2.7 Fewer than 5%
Unskilled 356 11.0 15% of North and West; slightly over 5% in South
Skilled labour 89 3.1 Fewer than 5%
Employee 358 11.7 15% in North and approx. 10% in West and South
Petty trade 283 9.9 Slightly more than 10% of HHs in South and between 5-10% in North and West
Handicraft 158 5.5 5-10% in West; 5% or fewer in North and South
Collection 168 5.5 5-10% in West; 5% or fewer in North and South
Food aid assistance 332 10.0 20% of HHs in West Darfur; 10% in North; and fewer than 5% in South
Other 115 3.2 5-10% of HHs in Northern; fewer than 5% in West and South
10.3 Agricultural production
10.3.1 Cropping Season
The cropping season is largely uniform throughout Greater Darfur but it does vary slightly depending largely on the arrival of the rains. Table 58 details the planting and harvest periods by state.
Table 58. Cropping season by type of crop and state in Greater Darfur Jan Feb March April May June July Aug Sep Oct Nov Dec North Darfur
Sorghum Millet West Darfur
Sorghum Millet South Darfur
Sorghum Millet
10.3.2 Current land use and main crops cultivated
As discussed in Chapter 4, households in the Darfur have greater access to the farmland (60 percent) than households in the rest of northern Sudan (40 percent) but not as much access as households in southern Sudan. This is to be expected, as rainfall patterns are more favourable to crop production in Darfur (and particularly in South Darfur) than in the rest of northern Sudan. Likewise, conditions here are not quite as favourable for farming as in southern Sudan, which along with the ongoing conflict, explains that differential.
Examined by state, there is considerable variation in access to farmland which likely can be explained by the ongoing conflict (Table 59). In the traditional agricultural hub of South Darfur, access to farmland is highest with almost three-quarters of households reporting usually utilizing land for farming. Slightly fewer households (57 percent) reported accessing farmland in the more arid areas in North Darfur. Interestingly, fewer than 50 percent of households reported accessing farmland in West Darfur, which is generally better suited for crop production than North Darfur. Intensifying conflict in
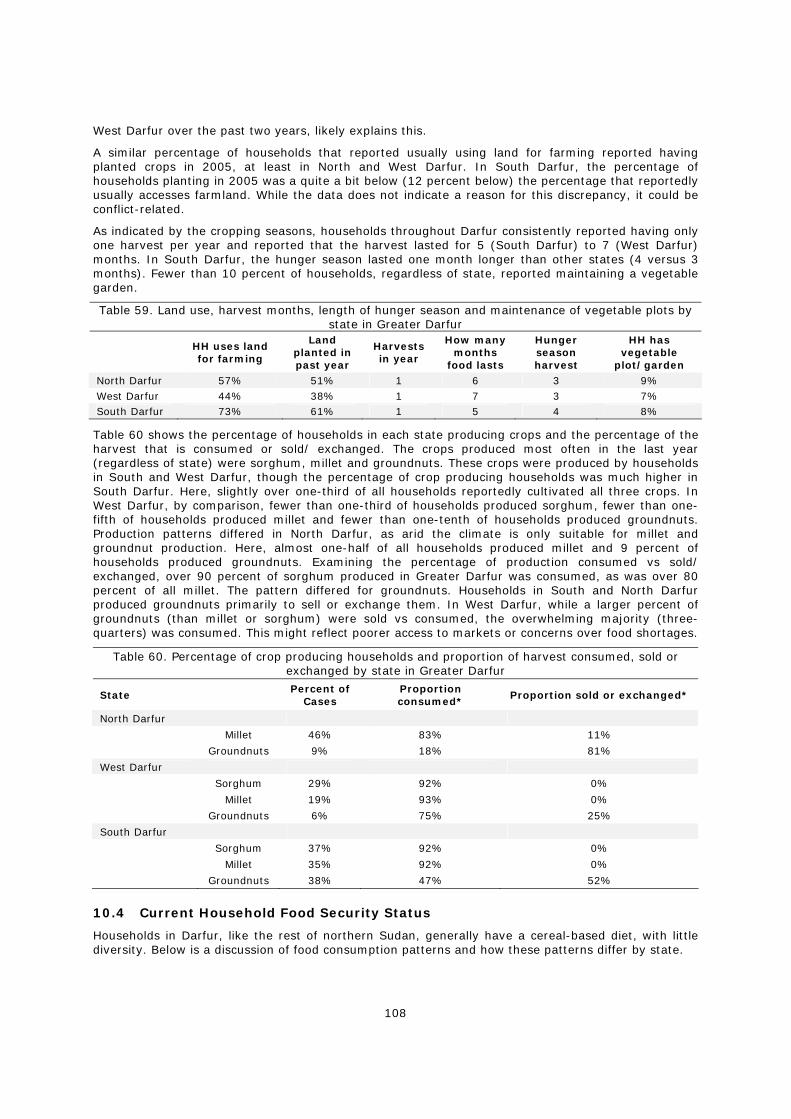
108
West Darfur over the past two years, likely explains this.
A similar percentage of households that reported usually using land for farming reported having planted crops in 2005, at least in North and West Darfur. In South Darfur, the percentage of households planting in 2005 was a quite a bit below (12 percent below) the percentage that reportedly usually accesses farmland. While the data does not indicate a reason for this discrepancy, it could be conflict-related.
As indicated by the cropping seasons, households throughout Darfur consistently reported having only one harvest per year and reported that the harvest lasted for 5 (South Darfur) to 7 (West Darfur) months. In South Darfur, the hunger season lasted one month longer than other states (4 versus 3 months). Fewer than 10 percent of households, regardless of state, reported maintaining a vegetable garden.
Table 59. Land use, harvest months, length of hunger season and maintenance of vegetable plots by state in Greater Darfur
HH uses land for farming
Land planted in past year
Harvests in year
How many months
food lasts
Hunger season harvest
HH has vegetable
plot/garden North Darfur 57% 51% 1 6 3 9% West Darfur 44% 38% 1 7 3 7% South Darfur 73% 61% 1 5 4 8%
Table 60 shows the percentage of households in each state producing crops and the percentage of the harvest that is consumed or sold/ exchanged. The crops produced most often in the last year (regardless of state) were sorghum, millet and groundnuts. These crops were produced by households in South and West Darfur, though the percentage of crop producing households was much higher in South Darfur. Here, slightly over one-third of all households reportedly cultivated all three crops. In West Darfur, by comparison, fewer than one-third of households produced sorghum, fewer than one-fifth of households produced millet and fewer than one-tenth of households produced groundnuts. Production patterns differed in North Darfur, as arid the climate is only suitable for millet and groundnut production. Here, almost one-half of all households produced millet and 9 percent of households produced groundnuts. Examining the percentage of production consumed vs sold/ exchanged, over 90 percent of sorghum produced in Greater Darfur was consumed, as was over 80 percent of all millet. The pattern differed for groundnuts. Households in South and North Darfur produced groundnuts primarily to sell or exchange them. In West Darfur, while a larger percent of groundnuts (than millet or sorghum) were sold vs consumed, the overwhelming majority (three-quarters) was consumed. This might reflect poorer access to markets or concerns over food shortages.
Table 60. Percentage of crop producing households and proportion of harvest consumed, sold or exchanged by state in Greater Darfur
State Percent of
Cases Proportion consumed*
Proportion sold or exchanged*
North Darfur
Millet 46% 83% 11%
Groundnuts 9% 18% 81%
West Darfur
Sorghum 29% 92% 0%
Millet 19% 93% 0%
Groundnuts 6% 75% 25%
South Darfur
Sorghum 37% 92% 0%
Millet 35% 92% 0%
Groundnuts 38% 47% 52%
10.4 Current Household Food Security Status
Households in Darfur, like the rest of northern Sudan, generally have a cereal-based diet, with little diversity. Below is a discussion of food consumption patterns and how these patterns differ by state.
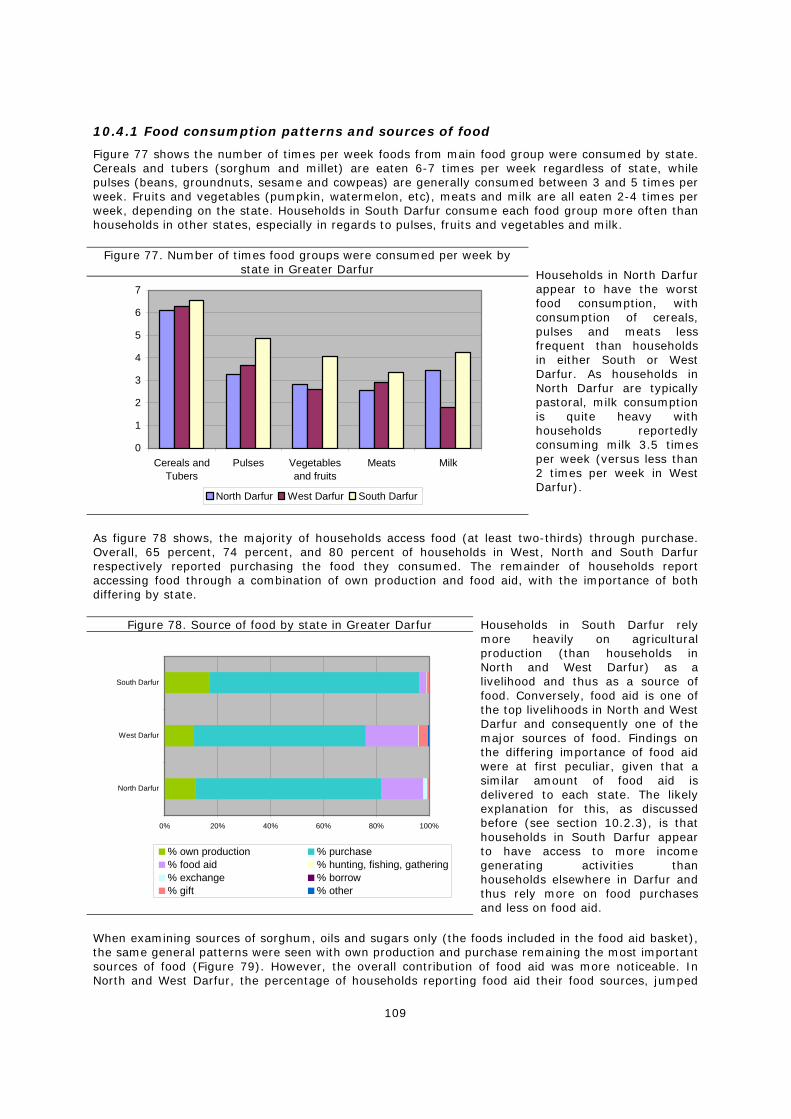
109
10.4.1 Food consumption patterns and sources of food
Figure 77 shows the number of times per week foods from main food group were consumed by state. Cereals and tubers (sorghum and millet) are eaten 6-7 times per week regardless of state, while pulses (beans, groundnuts, sesame and cowpeas) are generally consumed between 3 and 5 times per week. Fruits and vegetables (pumpkin, watermelon, etc), meats and milk are all eaten 2-4 times per week, depending on the state. Households in South Darfur consume each food group more often than households in other states, especially in regards to pulses, fruits and vegetables and milk.
Figure 77. Number of times food groups were consumed per week by state in Greater Darfur
0
1
2
3
4
5
6
7
Cereals andTubers
Pulses Vegetablesand fruits
Meats Milk
North Darfur West Darfur South Darfur
Households in North Darfur appear to have the worst food consumption, with consumption of cereals, pulses and meats less frequent than households in either South or West Darfur. As households in North Darfur are typically pastoral, milk consumption is quite heavy with households reportedly consuming milk 3.5 times per week (versus less than 2 times per week in West Darfur).
As figure 78 shows, the majority of households access food (at least two-thirds) through purchase. Overall, 65 percent, 74 percent, and 80 percent of households in West, North and South Darfur respectively reported purchasing the food they consumed. The remainder of households report accessing food through a combination of own production and food aid, with the importance of both differing by state.
Figure 78. Source of food by state in Greater Darfur
0% 20% 40% 60% 80% 100%
North Darfur
West Darfur
South Darfur
% own production % purchase% food aid % hunting, fishing, gathering% exchange % borrow% gift % other
Households in South Darfur rely more heavily on agricultural production (than households in North and West Darfur) as a livelihood and thus as a source of food. Conversely, food aid is one of the top livelihoods in North and West Darfur and consequently one of the major sources of food. Findings on the differing importance of food aid were at first peculiar, given that a similar amount of food aid is delivered to each state. The likely explanation for this, as discussed before (see section 10.2.3), is that households in South Darfur appear to have access to more income generating activities than households elsewhere in Darfur and thus rely more on food purchases and less on food aid.
When examining sources of sorghum, oils and sugars only (the foods included in the food aid basket), the same general patterns were seen with own production and purchase remaining the most important sources of food (Figure 79). However, the overall contribution of food aid was more noticeable. In North and West Darfur, the percentage of households reporting food aid their food sources, jumped
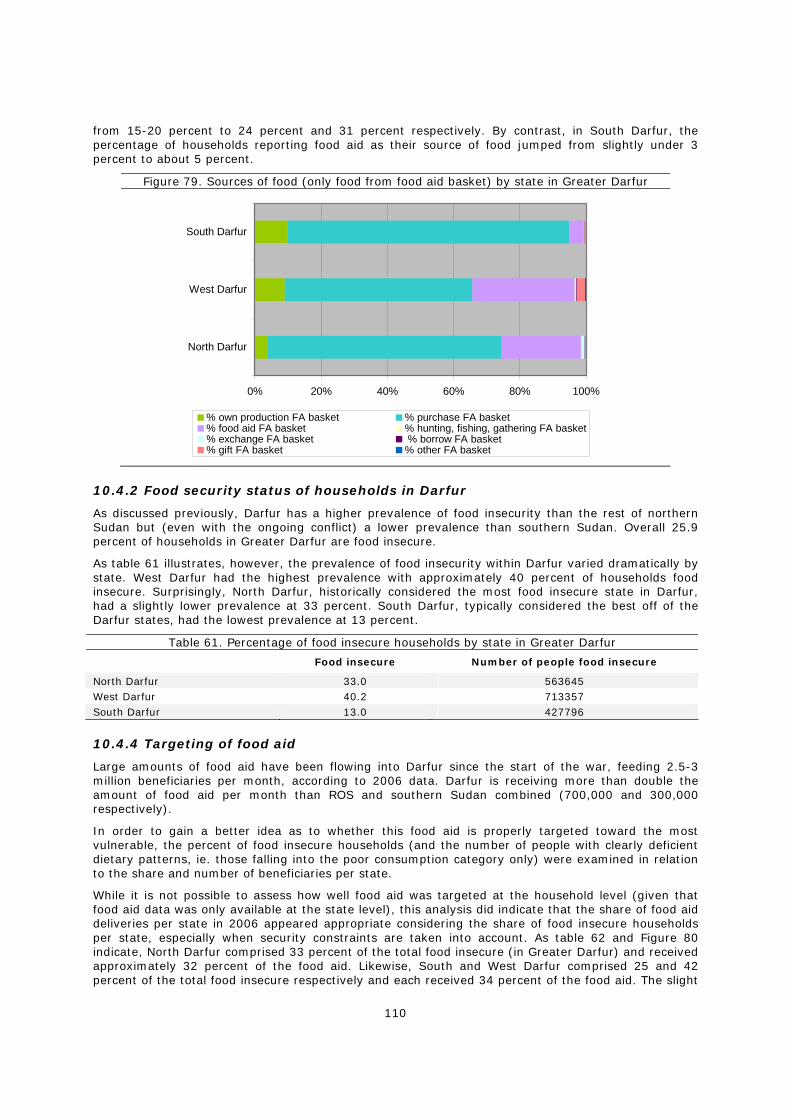
110
from 15-20 percent to 24 percent and 31 percent respectively. By contrast, in South Darfur, the percentage of households reporting food aid as their source of food jumped from slightly under 3 percent to about 5 percent.
Figure 79. Sources of food (only food from food aid basket) by state in Greater Darfur
0% 20% 40% 60% 80% 100%
North Darfur
West Darfur
South Darfur
% own production FA basket % purchase FA basket% food aid FA basket % hunting, fishing, gathering FA basket% exchange FA basket % borrow FA basket% gift FA basket % other FA basket
10.4.2 Food security status of households in Darfur
As discussed previously, Darfur has a higher prevalence of food insecurity than the rest of northern Sudan but (even with the ongoing conflict) a lower prevalence than southern Sudan. Overall 25.9 percent of households in Greater Darfur are food insecure.
As table 61 illustrates, however, the prevalence of food insecurity within Darfur varied dramatically by state. West Darfur had the highest prevalence with approximately 40 percent of households food insecure. Surprisingly, North Darfur, historically considered the most food insecure state in Darfur, had a slightly lower prevalence at 33 percent. South Darfur, typically considered the best off of the Darfur states, had the lowest prevalence at 13 percent.
Table 61. Percentage of food insecure households by state in Greater Darfur
Food insecure Number of people food insecure
North Darfur 33.0 563645 West Darfur 40.2 713357 South Darfur 13.0 427796
10.4.4 Targeting of food aid
Large amounts of food aid have been flowing into Darfur since the start of the war, feeding 2.5-3 million beneficiaries per month, according to 2006 data. Darfur is receiving more than double the amount of food aid per month than ROS and southern Sudan combined (700,000 and 300,000 respectively).
In order to gain a better idea as to whether this food aid is properly targeted toward the most vulnerable, the percent of food insecure households (and the number of people with clearly deficient dietary patterns, ie. those falling into the poor consumption category only) were examined in relation to the share and number of beneficiaries per state.
While it is not possible to assess how well food aid was targeted at the household level (given that food aid data was only available at the state level), this analysis did indicate that the share of food aid deliveries per state in 2006 appeared appropriate considering the share of food insecure households per state, especially when security constraints are taken into account. As table 62 and Figure 80 indicate, North Darfur comprised 33 percent of the total food insecure (in Greater Darfur) and received approximately 32 percent of the food aid. Likewise, South and West Darfur comprised 25 and 42 percent of the total food insecure respectively and each received 34 percent of the food aid. The slight
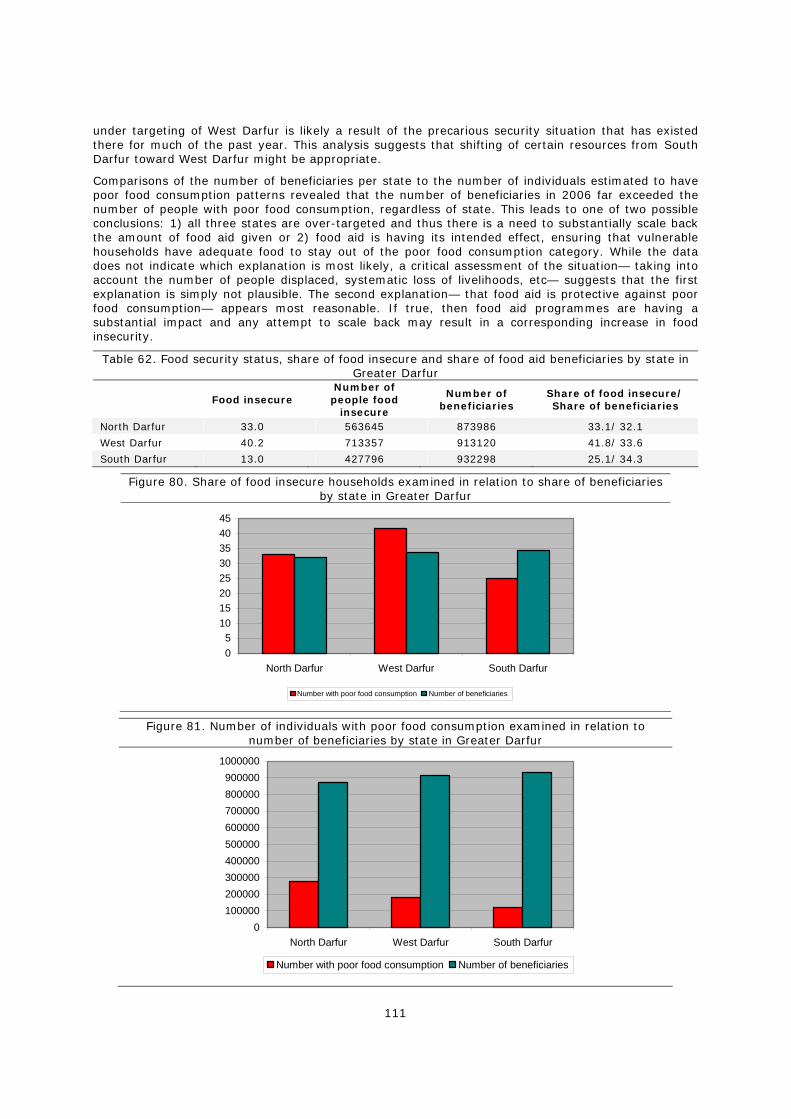
111
under targeting of West Darfur is likely a result of the precarious security situation that has existed there for much of the past year. This analysis suggests that shifting of certain resources from South Darfur toward West Darfur might be appropriate.
Comparisons of the number of beneficiaries per state to the number of individuals estimated to have poor food consumption patterns revealed that the number of beneficiaries in 2006 far exceeded the number of people with poor food consumption, regardless of state. This leads to one of two possible conclusions: 1) all three states are over-targeted and thus there is a need to substantially scale back the amount of food aid given or 2) food aid is having its intended effect, ensuring that vulnerable households have adequate food to stay out of the poor food consumption category. While the data does not indicate which explanation is most likely, a critical assessment of the situation— taking into account the number of people displaced, systematic loss of livelihoods, etc— suggests that the first explanation is simply not plausible. The second explanation— that food aid is protective against poor food consumption— appears most reasonable. If true, then food aid programmes are having a substantial impact and any attempt to scale back may result in a corresponding increase in food insecurity.
Table 62. Food security status, share of food insecure and share of food aid beneficiaries by state in Greater Darfur
Food insecure Number of people food
insecure
Number of beneficiaries
Share of food insecure/ Share of beneficiaries
North Darfur 33.0 563645 873986 33.1/ 32.1
West Darfur 40.2 713357 913120 41.8/ 33.6
South Darfur 13.0 427796 932298 25.1/ 34.3
Figure 80. Share of food insecure households examined in relation to share of beneficiaries by state in Greater Darfur
05
1015202530354045
North Darfur West Darfur South Darfur
Number with poor food consumption Number of beneficiaries
Figure 81. Number of individuals with poor food consumption examined in relation to number of beneficiaries by state in Greater Darfur
0100000200000300000400000500000600000700000800000900000
1000000
North Darfur West Darfur South Darfur
Number with poor food consumption Number of beneficiaries
112
10.4.5 Underlying causes of food insecurity
This section explores the immediate and underlying causes of food insecurity in Greater Darfur. To assess these causes, probit models were developed using the dichotomous food secure (yes/no) variable as the dependent variable and various demographic, household and socio-economic characteristics (previously determined to be associated with food insecurity in bivariate comparisons) as the independent variables. Stata 9.2 was used for the analysis and the “robust cluster” function was used to ensure correct estimation of standard errors.
Darfur, unlike the rest of Sudan, is currently experiencing large-scale fighting and population displacement. Thus, the largest predictors of food security status are likely to be factors associated with conflict, including level of conflict-affectedness, household displacement status and loss of livelihoods. SHHS data indicates that the level of displacement and livelihood abandonment is significant with at least 10 percent of households reporting food aid as their primary source of food and income and almost one-third of households reportedly rely on less risky, closer to home livelihoods like petty trade, collection (likely collection of grass and firewood for sale), unskilled labour (likely brick-making) or handicrafts. Not surprisingly, many of these livelihoods are commonly reported in West Darfur which at the time of data collection was experiencing a disproportionate share of the violence.
While conflict-related factors are likely the most important determinants of food security status, other factors should not be overlooked. Wealth status is likely one of the most important determinants as wealth may provide a household not only with consistent food access but also with a greater degree of security, both of which is crucial to maintaining proper food security. Agricultural shocks, such as drought and floods also pose a significant risk, as crop cultivation does continue despite the violence, especially in the traditionally agricultural areas of South Darfur. Other important factors may include food price shocks, death of household members, etc.
Taking into account the unique situation in Greater Darfur, the independent variables examined included in the analysis were sex of head of household, dependency ratio, household displacement status, wealth index, livelihood strategies, and exposure to shocks (by number and type of shock). Again, there was particular focus on conflict related factors, but the same general iterative model progression (seen in the causal analysis in the rest of northern Sudan) was followed. First, characteristics of typically vulnerable households (female headed hhs, hhs with a high dependency ratio, and displaced—idp or refugee—hhs, households experiencing shocks) were examined in relation to food insecurity. Next, asset wealth was examined (taking account of these basic hh characteristics) in relation to food security status, assessing whether any of these basic household characteristics modified wealth’s effect on food security status. Finally, household’s livelihoods were examined in relation to food security status, again taking account of and examining interactions with basic hh vulnerability characteristics. The models assessed are shown below:
Probit= b0 + b1(female hhh) + b2(high dependency ratio) + b3(IDP hhs) + b4(refugee hhs) + b5(returned IDPs) + b6(returned refugees) + b7(hh experience one shock) + b8(hh experienced two shocks) + b9(household experienced three shocks)
Probit= b0 + b1(female hhh) + b2(high dependency ratio) + b3(IDP hhs) + b4(refugee hhs) + b5(returned IDPs) + b6(returned refugees) + b7(hh experienced sickness/death) + b8(hh experienced agricultural shock) + b9(household experienced insecurity shock) + b10(household experienced price shock)
Probit= b0 + b1(female hhh) + b2(high dependency ratio) + b3(IDP hhs) + b4(refugee hhs) + b5(returned IDPs) + b6(returned refugees) + b7(hh experience one shock) + b8(hh experienced two shocks) + b9(household experienced three shocks) + b10(hh wealth index)
Probit= b0 + b1(female hhh) + b2(high dependency ratio) + b3(IDP hhs) + b4(refugee hhs) + b5(returned IDPs) + b6(returned refugees) + b7(hh experience one shock) + b8(hh experienced two shocks) + b9(household experienced three shocks) + b10(agricultural, fishing and hunting hhs) + b11(agropastoralist hhs) + b12(pastoralist) + b13(unskilled labour hhs) + b14(skilled labour hhs) + b15(employee hhs) + b16(petty trade hhs) + b17(handicraft) + b18(collection) + b19(food aid assistance hhs) + b20(other activity hhs)
10.4.5.1 Basic predictors of food insecurity
As figure 83 shows, female headed households, IDP households, and households experiencing shocks were significantly more likely to be food insecure. Specifically, female headed households, IDP households, and households experiencing two or three shocks were more food insecure (than
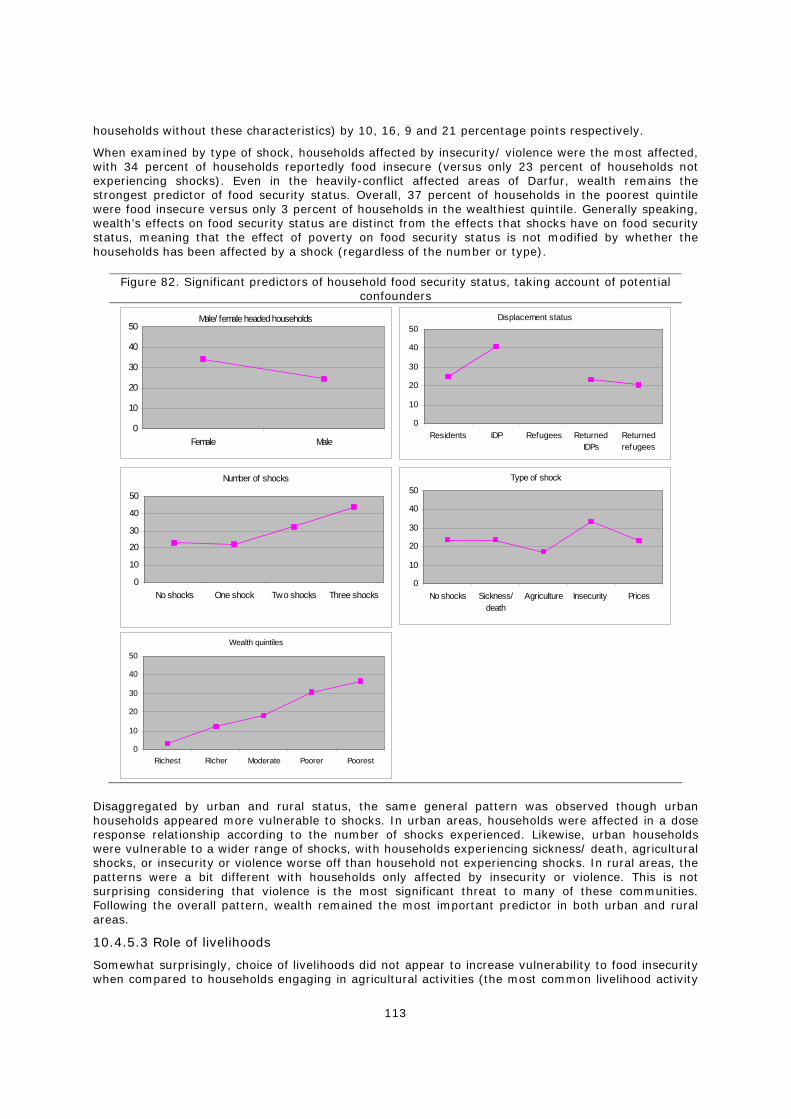
113
households without these characteristics) by 10, 16, 9 and 21 percentage points respectively.
When examined by type of shock, households affected by insecurity/ violence were the most affected, with 34 percent of households reportedly food insecure (versus only 23 percent of households not experiencing shocks). Even in the heavily-conflict affected areas of Darfur, wealth remains the strongest predictor of food security status. Overall, 37 percent of households in the poorest quintile were food insecure versus only 3 percent of households in the wealthiest quintile. Generally speaking, wealth’s effects on food security status are distinct from the effects that shocks have on food security status, meaning that the effect of poverty on food security status is not modified by whether the households has been affected by a shock (regardless of the number or type).
Figure 82. Significant predictors of household food security status, taking account of potential confounders
Disaggregated by urban and rural status, the same general pattern was observed though urban households appeared more vulnerable to shocks. In urban areas, households were affected in a dose response relationship according to the number of shocks experienced. Likewise, urban households were vulnerable to a wider range of shocks, with households experiencing sickness/ death, agricultural shocks, or insecurity or violence worse off than household not experiencing shocks. In rural areas, the patterns were a bit different with households only affected by insecurity or violence. This is not surprising considering that violence is the most significant threat to many of these communities. Following the overall pattern, wealth remained the most important predictor in both urban and rural areas.
10.4.5.3 Role of livelihoods
Somewhat surprisingly, choice of livelihoods did not appear to increase vulnerability to food insecurity when compared to households engaging in agricultural activities (the most common livelihood activity
Male/ female headed households
0
10
20
30
40
50
Female Male
Displacement status
0
10
20
30
40
50
Residents IDP Refugees ReturnedIDPs
Returnedrefugees
Number of shocks
0
10
20
30
40
50
No shocks One shock Two shocks Three shocks
Type of shock
0
10
20
30
40
50
No shocks Sickness/death
Agriculture Insecurity Prices
Wealth quintiles
0
10
20
30
40
50
Richest Richer Moderate Poorer Poorest
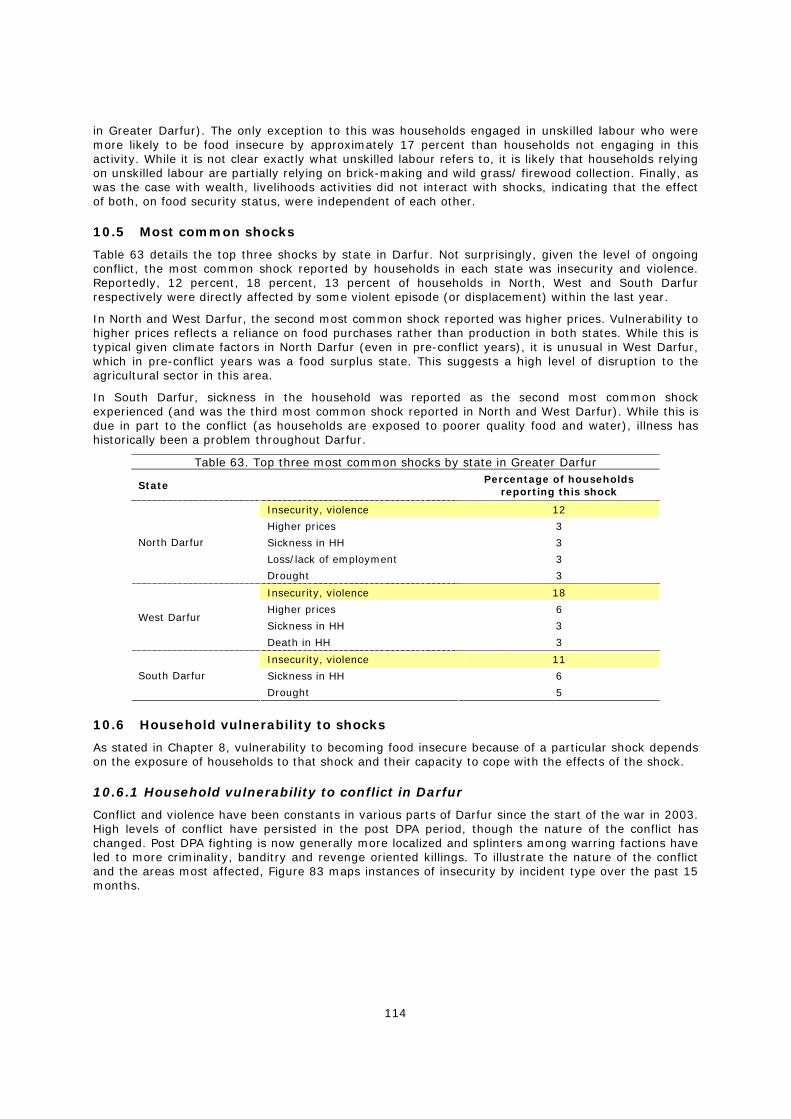
114
in Greater Darfur). The only exception to this was households engaged in unskilled labour who were more likely to be food insecure by approximately 17 percent than households not engaging in this activity. While it is not clear exactly what unskilled labour refers to, it is likely that households relying on unskilled labour are partially relying on brick-making and wild grass/ firewood collection. Finally, as was the case with wealth, livelihoods activities did not interact with shocks, indicating that the effect of both, on food security status, were independent of each other.
10.5 Most common shocks
Table 63 details the top three shocks by state in Darfur. Not surprisingly, given the level of ongoing conflict, the most common shock reported by households in each state was insecurity and violence. Reportedly, 12 percent, 18 percent, 13 percent of households in North, West and South Darfur respectively were directly affected by some violent episode (or displacement) within the last year.
In North and West Darfur, the second most common shock reported was higher prices. Vulnerability to higher prices reflects a reliance on food purchases rather than production in both states. While this is typical given climate factors in North Darfur (even in pre-conflict years), it is unusual in West Darfur, which in pre-conflict years was a food surplus state. This suggests a high level of disruption to the agricultural sector in this area.
In South Darfur, sickness in the household was reported as the second most common shock experienced (and was the third most common shock reported in North and West Darfur). While this is due in part to the conflict (as households are exposed to poorer quality food and water), illness has historically been a problem throughout Darfur.
Table 63. Top three most common shocks by state in Greater Darfur
State Percentage of households reporting this shock
Insecurity, violence 12
Higher prices 3
Sickness in HH 3
Loss/lack of employment 3
North Darfur
Drought 3
Insecurity, violence 18
Higher prices 6
Sickness in HH 3 West Darfur
Death in HH 3
Insecurity, violence 11
Sickness in HH 6 South Darfur
Drought 5
10.6 Household vulnerability to shocks
As stated in Chapter 8, vulnerability to becoming food insecure because of a particular shock depends on the exposure of households to that shock and their capacity to cope with the effects of the shock.
10.6.1 Household vulnerability to conflict in Darfur
Conflict and violence have been constants in various parts of Darfur since the start of the war in 2003. High levels of conflict have persisted in the post DPA period, though the nature of the conflict has changed. Post DPA fighting is now generally more localized and splinters among warring factions have led to more criminality, banditry and revenge oriented killings. To illustrate the nature of the conflict and the areas most affected, Figure 83 maps instances of insecurity by incident type over the past 15 months.
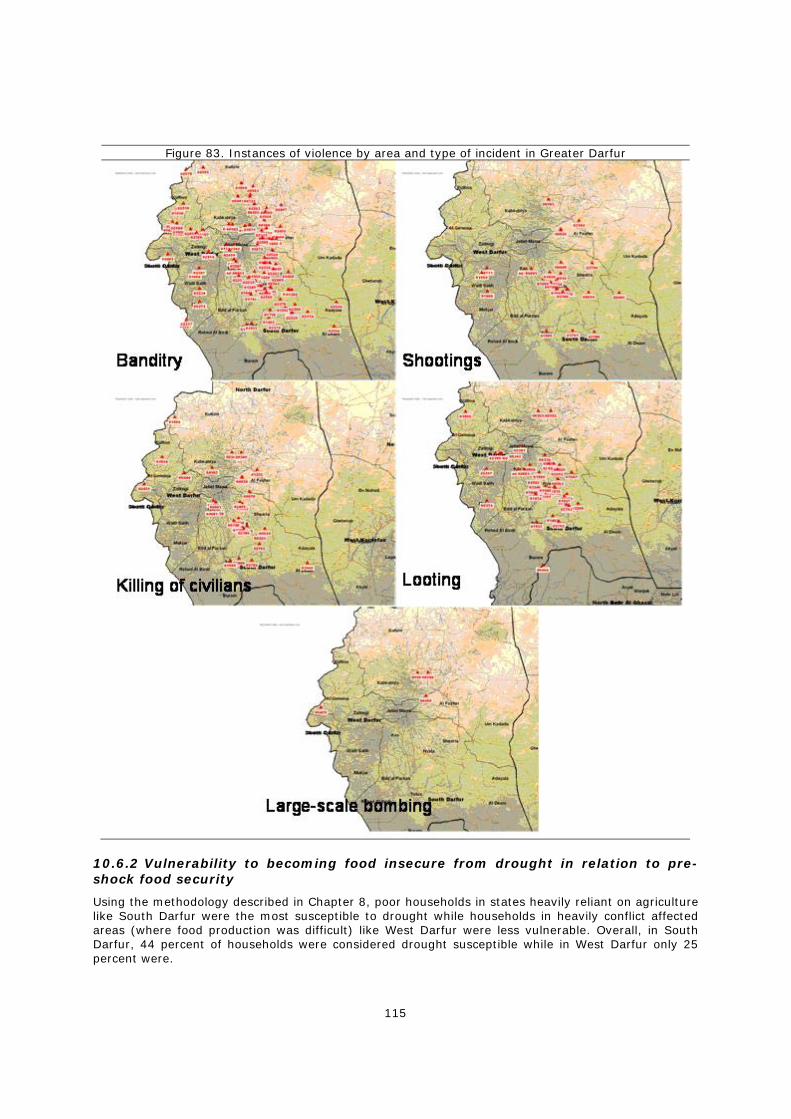
115
Figure 83. Instances of violence by area and type of incident in Greater Darfur
10.6.2 Vulnerability to becoming food insecure from drought in relation to pre-shock food security
Using the methodology described in Chapter 8, poor households in states heavily reliant on agriculture like South Darfur were the most susceptible to drought while households in heavily conflict affected areas (where food production was difficult) like West Darfur were less vulnerable. Overall, in South Darfur, 44 percent of households were considered drought susceptible while in West Darfur only 25 percent were.
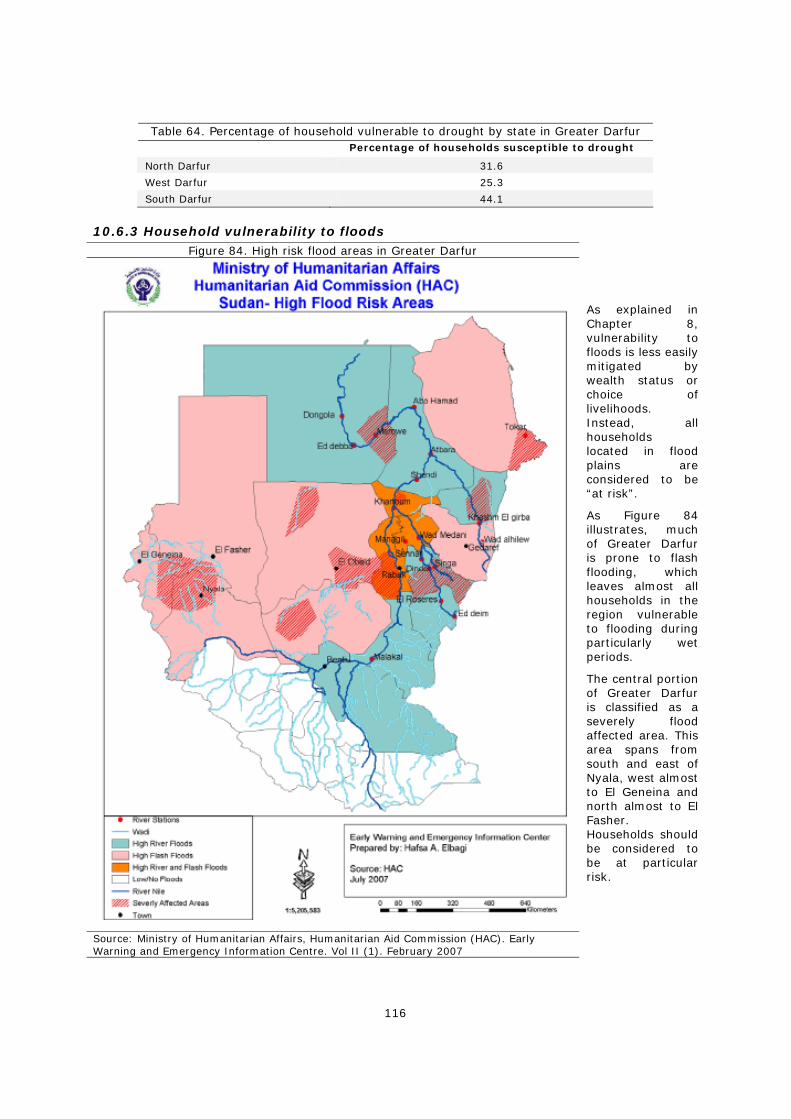
116
Table 64. Percentage of household vulnerable to drought by state in Greater Darfur Percentage of households susceptible to drought
North Darfur 31.6
West Darfur 25.3
South Darfur 44.1
10.6.3 Household vulnerability to floods Figure 84. High risk flood areas in Greater Darfur
Source: Ministry of Humanitarian Affairs, Humanitarian Aid Commission (HAC). Early Warning and Emergency Information Centre. Vol II (1). February 2007
As explained in Chapter 8, vulnerability to floods is less easily mitigated by wealth status or choice of livelihoods. Instead, all households located in flood plains are considered to be “at risk”.
As Figure 84 illustrates, much of Greater Darfur is prone to flash flooding, which leaves almost all households in the region vulnerable to flooding during particularly wet periods.
The central portion of Greater Darfur is classified as a severely flood affected area. This area spans from south and east of Nyala, west almost to El Geneina and north almost to El Fasher. Households should be considered to be at particular risk.
117
10.7 General health and nutrition situation
The main findings from the child health and nutrition section of the household questionnaire for Darfur are reported below.
10.7.1 Child health
10.7.1.1 Diarrhea
In Greater Darfur, 27 percent of children overall experienced an episode of diarrhea in the two weeks preceding the survey. As table 65 shows, frequency of diarrheal disease was similar regardless of state, but children in South Darfur reported the highest prevalence at 29 percent. The percentage of sick children that used ORS was generally highest in West Darfur (at 40 percent), likely provided at the various IDP camps scattered throughout the state. Homemade fluids recommended by the government were most often used in South Darfur at 39 percent.
Table 65. Prevalence of diarrhea and types of treatments by state in Greater Darfur (percent) Child had diarrhea in
last 2 weeks Drank fluid made from special packet (ORS)
Govt. recommended homemade fluid
North Darfur 24.1 28.6 37.6
West Darfur 26.9 39.5 25.5
South Darfur 29.2 20.4 39.4
Greater Darfur-- Overall 27.3 27.4 35.2
10.7.1.2 Fever
Overall, as shown in Table 66, 11 percent of children had a fever in the two weeks preceding the survey, but prevalence differed significantly by state following rainfall patterns. In South and West Darfur, which both generally receive more rain than North Darfur, 15 and 12 percent of children reported fever in the 2 weeks preceding the survey. Conversely, in North Darfur, the driest region, only 4 percent of children reported fever.
In response to fever, 58 percent of children in Greater Darfur reported being seen at a health centre and 93 percent reported taking the medicine prescribed by the health worker. Access to health centres was most common in North Darfur, with close to 86 percent seen at clinics. Access was much more limited in both West and South Darfur, with only 52 and 56 percent visiting clinics respectively. Adherence to the medicinal regimen prescribed was high in all three states with at least 90 percent of children taking their medicine.
Table 66. Prevalence of fever and types of treatments by state in Greater Darfur (percent) Child ill with fever
in last 2 weeks Child seen at health facility during illness
Child took medicine prescribed at health facility
North Darfur 4.1 86.5 93.8
West Darfur 11.7 52.2 89.6
South Darfur 15.0 56.4 94.7
Greater Darfur-- Overall 11.3 57.9 93.2
10.7.1.3 Acute respiratory infections
Forty-one percent of children in Greater Darfur had a cough in the two weeks preceding the survey, and slightly over one-quarter of these children had difficulty breathing during these episodes. Prevalence varied by state, with children in South Darfur by far the most affected. Here 55 percent of children reported having a cough and 40 percent reportedly had difficulty breathing. In West Darfur, almost one-third of children reported a cough while in North Darfur less than one-quarter did. One-fifth or less of these children reported difficulty breathing during these episodes.
Again, caregivers in North Darfur were more likely to take their child to a health centre than caregivers in either West or South Darfur. Overall, 70 percent sought treatment in North Darfur while only slightly over half did so in either West or South Darfur.
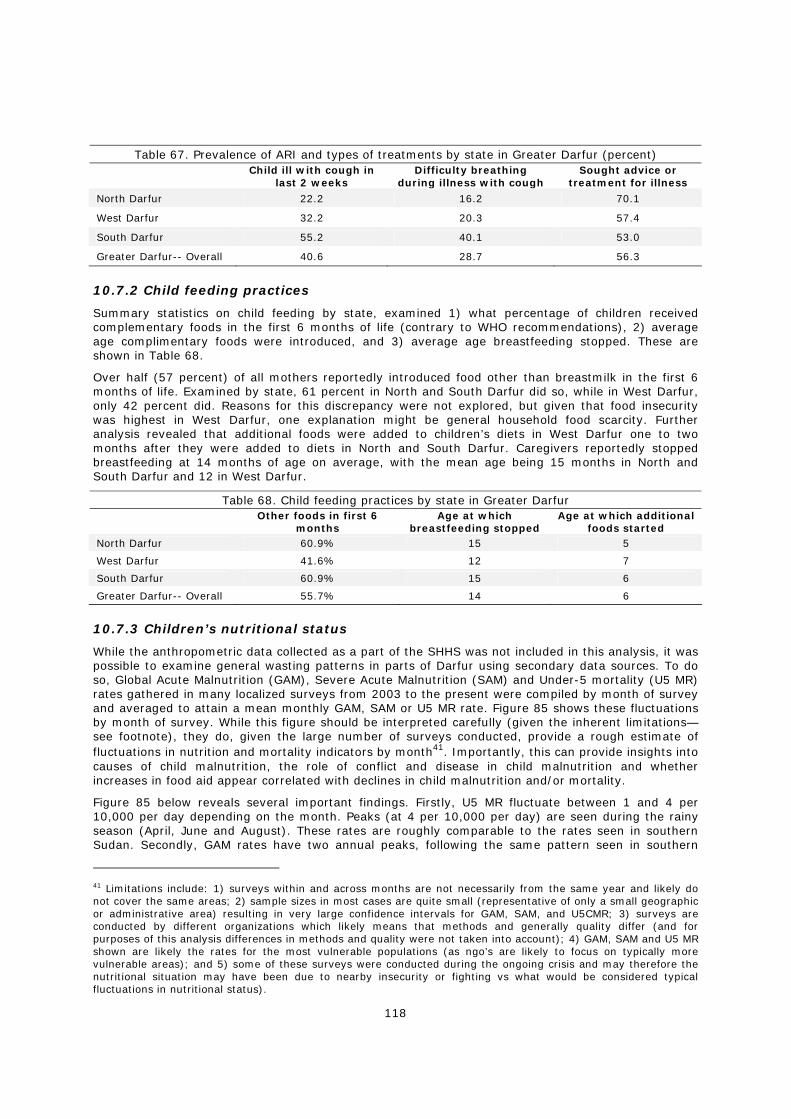
118
Table 67. Prevalence of ARI and types of treatments by state in Greater Darfur (percent)
Child ill with cough in
last 2 weeks Difficulty breathing
during illness with cough Sought advice or
treatment for illness
North Darfur 22.2 16.2 70.1
West Darfur 32.2 20.3 57.4
South Darfur 55.2 40.1 53.0
Greater Darfur-- Overall 40.6 28.7 56.3
10.7.2 Child feeding practices
Summary statistics on child feeding by state, examined 1) what percentage of children received complementary foods in the first 6 months of life (contrary to WHO recommendations), 2) average age complimentary foods were introduced, and 3) average age breastfeeding stopped. These are shown in Table 68.
Over half (57 percent) of all mothers reportedly introduced food other than breastmilk in the first 6 months of life. Examined by state, 61 percent in North and South Darfur did so, while in West Darfur, only 42 percent did. Reasons for this discrepancy were not explored, but given that food insecurity was highest in West Darfur, one explanation might be general household food scarcity. Further analysis revealed that additional foods were added to children’s diets in West Darfur one to two months after they were added to diets in North and South Darfur. Caregivers reportedly stopped breastfeeding at 14 months of age on average, with the mean age being 15 months in North and South Darfur and 12 in West Darfur.
Table 68. Child feeding practices by state in Greater Darfur
Other foods in first 6 months
Age at which breastfeeding stopped
Age at which additional foods started
North Darfur 60.9% 15 5
West Darfur 41.6% 12 7
South Darfur 60.9% 15 6
Greater Darfur-- Overall 55.7% 14 6
10.7.3 Children’s nutritional status
While the anthropometric data collected as a part of the SHHS was not included in this analysis, it was possible to examine general wasting patterns in parts of Darfur using secondary data sources. To do so, Global Acute Malnutrition (GAM), Severe Acute Malnutrition (SAM) and Under-5 mortality (U5 MR) rates gathered in many localized surveys from 2003 to the present were compiled by month of survey and averaged to attain a mean monthly GAM, SAM or U5 MR rate. Figure 85 shows these fluctuations by month of survey. While this figure should be interpreted carefully (given the inherent limitations—see footnote), they do, given the large number of surveys conducted, provide a rough estimate of fluctuations in nutrition and mortality indicators by month41. Importantly, this can provide insights into causes of child malnutrition, the role of conflict and disease in child malnutrition and whether increases in food aid appear correlated with declines in child malnutrition and/or mortality.
Figure 85 below reveals several important findings. Firstly, U5 MR fluctuate between 1 and 4 per 10,000 per day depending on the month. Peaks (at 4 per 10,000 per day) are seen during the rainy season (April, June and August). These rates are roughly comparable to the rates seen in southern Sudan. Secondly, GAM rates have two annual peaks, following the same pattern seen in southern
41 Limitations include: 1) surveys within and across months are not necessarily from the same year and likely do not cover the same areas; 2) sample sizes in most cases are quite small (representative of only a small geographic or administrative area) resulting in very large confidence intervals for GAM, SAM, and U5CMR; 3) surveys are conducted by different organizations which likely means that methods and generally quality differ (and for purposes of this analysis differences in methods and quality were not taken into account); 4) GAM, SAM and U5 MR shown are likely the rates for the most vulnerable populations (as ngo’s are likely to focus on typically more vulnerable areas); and 5) some of these surveys were conducted during the ongoing crisis and may therefore the nutritional situation may have been due to nearby insecurity or fighting vs what would be considered typical fluctuations in nutritional status).
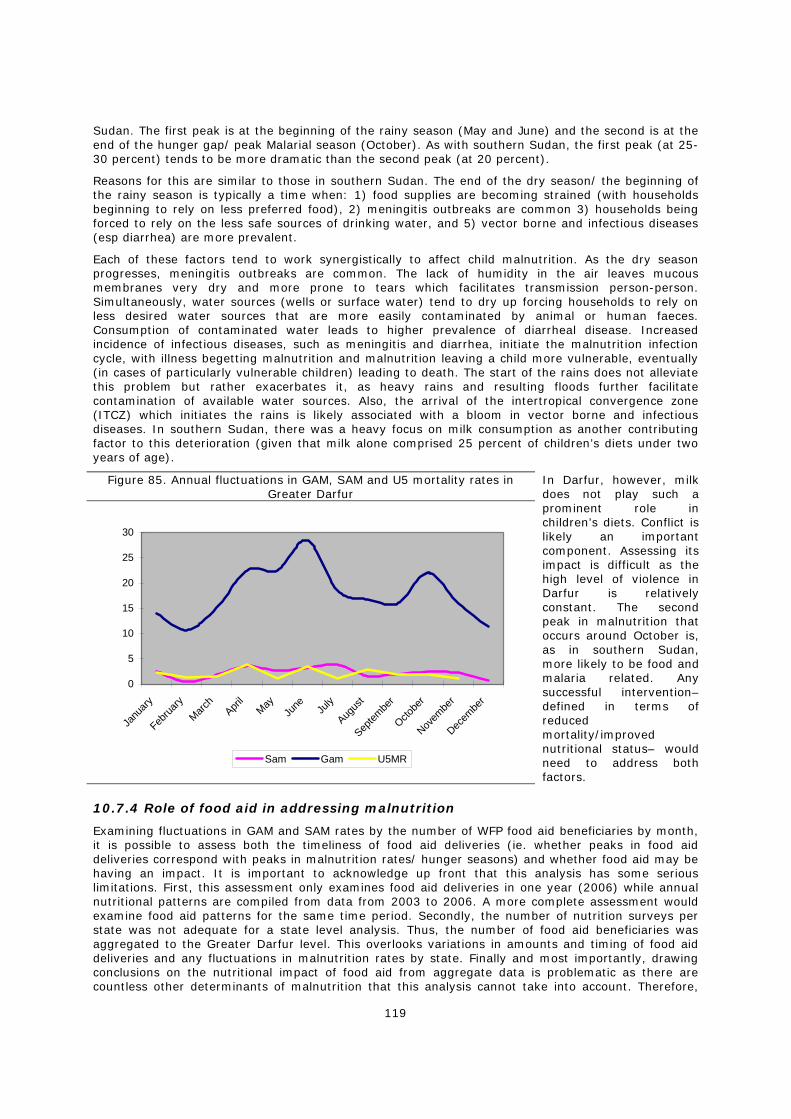
119
Sudan. The first peak is at the beginning of the rainy season (May and June) and the second is at the end of the hunger gap/ peak Malarial season (October). As with southern Sudan, the first peak (at 25-30 percent) tends to be more dramatic than the second peak (at 20 percent).
Reasons for this are similar to those in southern Sudan. The end of the dry season/ the beginning of the rainy season is typically a time when: 1) food supplies are becoming strained (with households beginning to rely on less preferred food), 2) meningitis outbreaks are common 3) households being forced to rely on the less safe sources of drinking water, and 5) vector borne and infectious diseases (esp diarrhea) are more prevalent.
Each of these factors tend to work synergistically to affect child malnutrition. As the dry season progresses, meningitis outbreaks are common. The lack of humidity in the air leaves mucous membranes very dry and more prone to tears which facilitates transmission person-person. Simultaneously, water sources (wells or surface water) tend to dry up forcing households to rely on less desired water sources that are more easily contaminated by animal or human faeces. Consumption of contaminated water leads to higher prevalence of diarrheal disease. Increased incidence of infectious diseases, such as meningitis and diarrhea, initiate the malnutrition infection cycle, with illness begetting malnutrition and malnutrition leaving a child more vulnerable, eventually (in cases of particularly vulnerable children) leading to death. The start of the rains does not alleviate this problem but rather exacerbates it, as heavy rains and resulting floods further facilitate contamination of available water sources. Also, the arrival of the intertropical convergence zone (ITCZ) which initiates the rains is likely associated with a bloom in vector borne and infectious diseases. In southern Sudan, there was a heavy focus on milk consumption as another contributing factor to this deterioration (given that milk alone comprised 25 percent of children’s diets under two years of age).
Figure 85. Annual fluctuations in GAM, SAM and U5 mortality rates in Greater Darfur
0
5
10
15
20
25
30
Janu
ary
Februa
ryMarc
hApri
lMay
June Ju
ly
Augus
t
Septem
ber
Octobe
r
Novem
ber
Decem
ber
Sam Gam U5MR
In Darfur, however, milk does not play such a prominent role in children’s diets. Conflict is likely an important component. Assessing its impact is difficult as the high level of violence in Darfur is relatively constant. The second peak in malnutrition that occurs around October is, as in southern Sudan, more likely to be food and malaria related. Any successful intervention– defined in terms of reduced mortality/improved nutritional status– would need to address both factors.
10.7.4 Role of food aid in addressing malnutrition
Examining fluctuations in GAM and SAM rates by the number of WFP food aid beneficiaries by month, it is possible to assess both the timeliness of food aid deliveries (ie. whether peaks in food aid deliveries correspond with peaks in malnutrition rates/ hunger seasons) and whether food aid may be having an impact. It is important to acknowledge up front that this analysis has some serious limitations. First, this assessment only examines food aid deliveries in one year (2006) while annual nutritional patterns are compiled from data from 2003 to 2006. A more complete assessment would examine food aid patterns for the same time period. Secondly, the number of nutrition surveys per state was not adequate for a state level analysis. Thus, the number of food aid beneficiaries was aggregated to the Greater Darfur level. This overlooks variations in amounts and timing of food aid deliveries and any fluctuations in malnutrition rates by state. Finally and most importantly, drawing conclusions on the nutritional impact of food aid from aggregate data is problematic as there are countless other determinants of malnutrition that this analysis cannot take into account. Therefore,
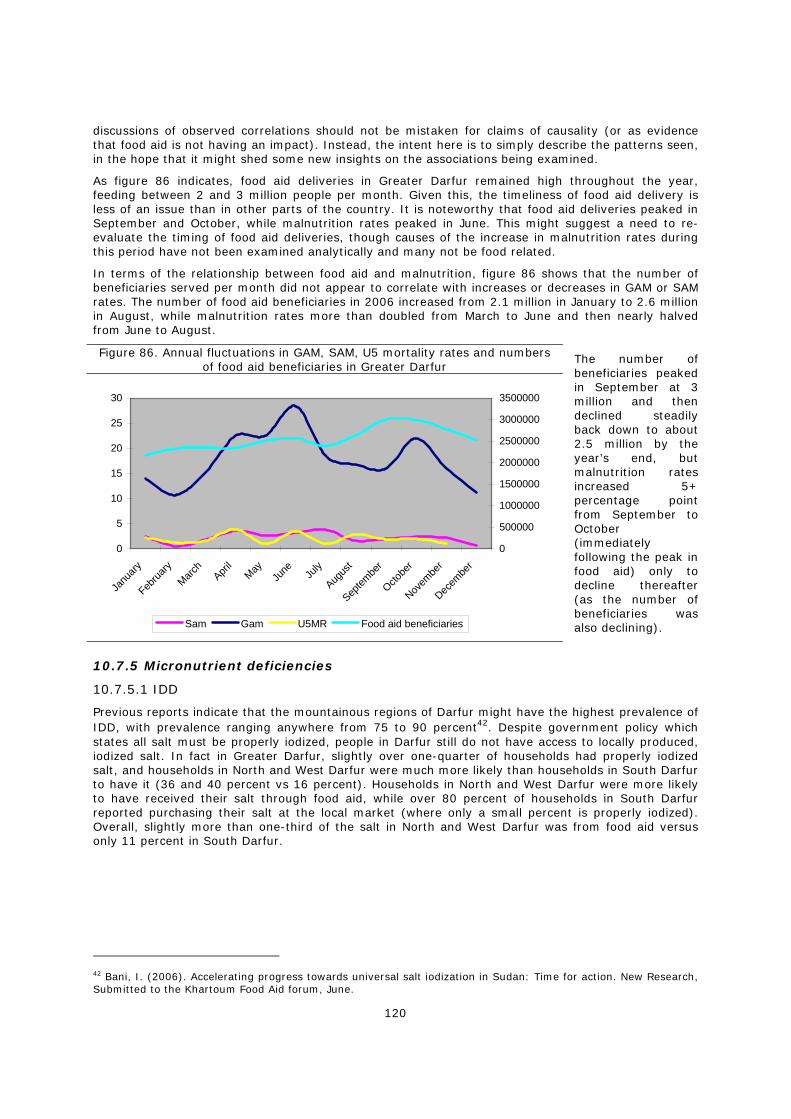
120
discussions of observed correlations should not be mistaken for claims of causality (or as evidence that food aid is not having an impact). Instead, the intent here is to simply describe the patterns seen, in the hope that it might shed some new insights on the associations being examined.
As figure 86 indicates, food aid deliveries in Greater Darfur remained high throughout the year, feeding between 2 and 3 million people per month. Given this, the timeliness of food aid delivery is less of an issue than in other parts of the country. It is noteworthy that food aid deliveries peaked in September and October, while malnutrition rates peaked in June. This might suggest a need to re-evaluate the timing of food aid deliveries, though causes of the increase in malnutrition rates during this period have not been examined analytically and many not be food related.
In terms of the relationship between food aid and malnutrition, figure 86 shows that the number of beneficiaries served per month did not appear to correlate with increases or decreases in GAM or SAM rates. The number of food aid beneficiaries in 2006 increased from 2.1 million in January to 2.6 million in August, while malnutrition rates more than doubled from March to June and then nearly halved from June to August.
Figure 86. Annual fluctuations in GAM, SAM, U5 mortality rates and numbers of food aid beneficiaries in Greater Darfur
0
5
10
15
20
25
30
Janu
ary
Februa
ryMarc
hApri
lMay
June Ju
ly
Augus
t
Septem
ber
Octobe
r
Novem
ber
Decem
ber
0
500000
1000000
1500000
2000000
2500000
3000000
3500000
Sam Gam U5MR Food aid beneficiaries
The number of beneficiaries peaked in September at 3 million and then declined steadily back down to about 2.5 million by the year’s end, but malnutrition rates increased 5+ percentage point from September to October (immediately following the peak in food aid) only to decline thereafter (as the number of beneficiaries was also declining).
10.7.5 Micronutrient deficiencies
10.7.5.1 IDD
Previous reports indicate that the mountainous regions of Darfur might have the highest prevalence of IDD, with prevalence ranging anywhere from 75 to 90 percent42. Despite government policy which states all salt must be properly iodized, people in Darfur still do not have access to locally produced, iodized salt. In fact in Greater Darfur, slightly over one-quarter of households had properly iodized salt, and households in North and West Darfur were much more likely than households in South Darfur to have it (36 and 40 percent vs 16 percent). Households in North and West Darfur were more likely to have received their salt through food aid, while over 80 percent of households in South Darfur reported purchasing their salt at the local market (where only a small percent is properly iodized). Overall, slightly more than one-third of the salt in North and West Darfur was from food aid versus only 11 percent in South Darfur.
42 Bani, I. (2006). Accelerating progress towards universal salt iodization in Sudan: Time for action. New Research, Submitted to the Khartoum Food Aid forum, June.
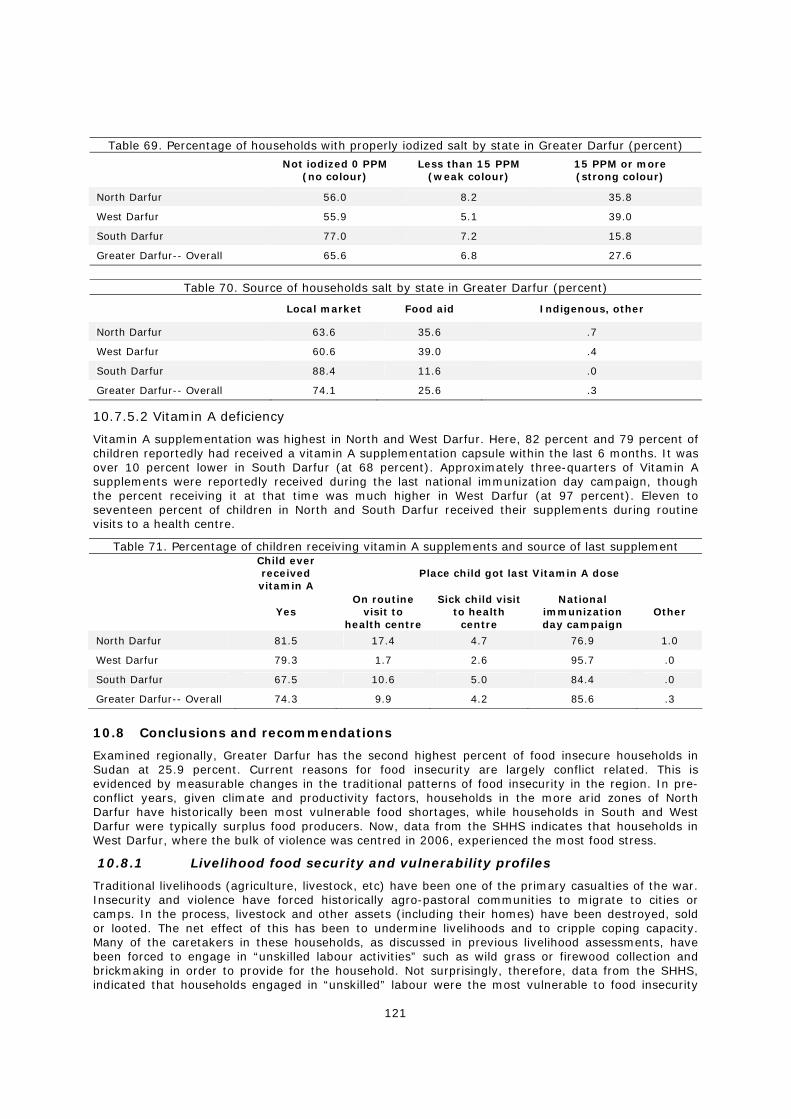
121
Table 69. Percentage of households with properly iodized salt by state in Greater Darfur (percent)
Not iodized 0 PPM
(no colour) Less than 15 PPM
(weak colour) 15 PPM or more (strong colour)
North Darfur 56.0 8.2 35.8
West Darfur 55.9 5.1 39.0
South Darfur 77.0 7.2 15.8
Greater Darfur-- Overall 65.6 6.8 27.6
Table 70. Source of households salt by state in Greater Darfur (percent)
Local market Food aid Indigenous, other
North Darfur 63.6 35.6 .7
West Darfur 60.6 39.0 .4
South Darfur 88.4 11.6 .0
Greater Darfur-- Overall 74.1 25.6 .3
10.7.5.2 Vitamin A deficiency
Vitamin A supplementation was highest in North and West Darfur. Here, 82 percent and 79 percent of children reportedly had received a vitamin A supplementation capsule within the last 6 months. It was over 10 percent lower in South Darfur (at 68 percent). Approximately three-quarters of Vitamin A supplements were reportedly received during the last national immunization day campaign, though the percent receiving it at that time was much higher in West Darfur (at 97 percent). Eleven to seventeen percent of children in North and South Darfur received their supplements during routine visits to a health centre.
Table 71. Percentage of children receiving vitamin A supplements and source of last supplement Child ever received vitamin A
Place child got last Vitamin A dose
Yes On routine
visit to health centre
Sick child visit to health
centre
National immunization day campaign
Other
North Darfur 81.5 17.4 4.7 76.9 1.0
West Darfur 79.3 1.7 2.6 95.7 .0
South Darfur 67.5 10.6 5.0 84.4 .0
Greater Darfur-- Overall 74.3 9.9 4.2 85.6 .3
10.8 Conclusions and recommendations
Examined regionally, Greater Darfur has the second highest percent of food insecure households in Sudan at 25.9 percent. Current reasons for food insecurity are largely conflict related. This is evidenced by measurable changes in the traditional patterns of food insecurity in the region. In pre-conflict years, given climate and productivity factors, households in the more arid zones of North Darfur have historically been most vulnerable food shortages, while households in South and West Darfur were typically surplus food producers. Now, data from the SHHS indicates that households in West Darfur, where the bulk of violence was centred in 2006, experienced the most food stress.
10.8.1 Livelihood food security and vulnerability profiles
Traditional livelihoods (agriculture, livestock, etc) have been one of the primary casualties of the war. Insecurity and violence have forced historically agro-pastoral communities to migrate to cities or camps. In the process, livestock and other assets (including their homes) have been destroyed, sold or looted. The net effect of this has been to undermine livelihoods and to cripple coping capacity. Many of the caretakers in these households, as discussed in previous livelihood assessments, have been forced to engage in “unskilled labour activities” such as wild grass or firewood collection and brickmaking in order to provide for the household. Not surprisingly, therefore, data from the SHHS, indicated that households engaged in “unskilled” labour were the most vulnerable to food insecurity
122
and were the most affected livelihood group.
10.8.2 Geographic Food security and vulnerability profiles
Traditional geographic patterns of food insecurity in Greater Darfur were largely driven by climate and food productivity factors. Generally speaking, households in North Darfur have historically been worst off while households in West and South Darfur, both food surplus states, have been better off. Data from the SHHS, however, now indicates that households in West Darfur that suffered a disproportionate share of the violence during the time of the survey, were most vulnerable to food insecurity, with a prevalence of food insecurity 7 percent higher than in North Darfur (40 percent VS 33 percent). On the other hand, households in South Darfur remain the least vulnerable with only 13 percent of households reportedly food insecure.
10.8.3 Priority areas and causes of food insecurity and vulnerability
The causes of food insecurity in Darfur, according to data from the SHHS, are all conflict-related. These included:
1. Sex of head of household
2. Displacement status--IDP households
3. Households experiencing 2 or 3 shocks
4. Households experiencing insecurity
5. Wealth status
The strongest predictor of food security status was asset wealth. Specifically, 37 percent of households in the poorest quintile were food insecure versus only 3 percent of households in the wealthiest quintile. One of the effects of the conflict has been to systematically strip assets from households, meaning that households most affected by conflict are likely to have the fewest number of assets. Conversely, households with significant wealth are more able to insulate themselves from the effects of the war (by paying protection fees to Janjaweed, migration, etc) while also being able to recover from shocks more easily.
Not surprisingly, female headed households were more vulnerable to food insecurity than male headed households. Female headed households are also households that are most likely to be affected by conflict, as it is likely that the men of the household have either fled (to other parts of Sudan, to rebel movements, etc.) or were killed. On average, female headed households were 10 percent more likely than male headed households to be food insecure.
Finally, families who had been driven their homes and were displaced at the time of survey were also significantly more likely than residents to be food insecure. On average, 41 percent of displaced households were food insecure vs only 25 percent of resident households.
Households experiencing shocks, particularly those households experiencing two or three shocks, were more vulnerable, on average, than households not experiencing shocks by 9 percent and 21 percent respectively. When examined by type of shock, households experiencing insecurity or violence were the most vulnerable. Overall, 34 percent of households experiencing violence or insecurity were food insecure vs 23 percent of households not experiencing shocks. Households throughout Darfur were vulnerable to conflict and flooding, though in both cases households in the areas north and west of Nyala were are particular risk.
10.8.4 Targeting and timing of food aid assistance
In Greater Darfur the targeting of food aid assistance appeared adequate, though West Darfur did appear to be slightly under-targeted while South Darfur was slightly over targeted. Given the security situation in 2006, this was hypothesized, however, to be a result of inaccessibility rather than poor targeting. One other important finding was that the number of beneficiaries greatly outnumbered the number of food insecure people in all three states. While at first glance this suggests that each state is over-targeted, a critical evaluation of the situation suggests that this is more likely an indication that food aid assistance is having its intended effect, by keeping households out of the poor food consumption group. This also suggests that any reduction in food aid may result in noticeable increases in the number of households in the most vulnerable food insecurity category.
The timing of food aid was less of an issue in Darfur than in the rest of Sudan as the levels of food aid
123
were very high year round. However, the CFSVA did indicate that the peak in food aid assistance in 2006 (in September) did not coincide with the annual peaks in child malnutrition rates (in June). While it is recognized that the levels of food aid assistance- particularly in conflict affected areas- are driven by a variety of factors (including perceived need, seasonality, accessibility, etc), this data may suggest a need to slightly recalibrate the timing of food aid deliveries to better take into account seasonal fluctuations in child malnutrition rates.
10.8.5 Food interventions by priority area and priority group
Synthesizing the main findings above, a three pronged approach in terms of food interventions is recommended in southern Sudan.
1. Refine the targeting of food aid
The CFSVA indicates that food insecurity in Darfur is largely the result of ongoing conflict. Household characteristics associated with food insecurity are listed below. As discussed previously, conflict affected households are the most likely to display these characteristics.
• Asset poverty (conflict affectedness is associated with asset loss);
• Households reliant on “unskilled labour” (IDP/ conflict affected households engage in brickmaking, grass and firewood collection, etc.);
• IDP households (displaced by violence or insecurity);
• Household frequently affected by/ vulnerable to shocks (multiple shocks or insecurity shocks).
In terms of the location of food insecure households, the CFSVA indicates that these households are likely to be in the most conflict affected areas. In 2006, the majority of food insecure households were located in West Darfur. As the conflict evolves and other areas become more affected, the geographic distribution of food insecure is likely to change correspondingly. This is a significant departure from traditional patterns of food insecurity in Darfur, which were largely driven by climate and crop productivity levels. In pre-conflict times, this meant that households in the low productivity, arid environment of North Darfur were the most vulnerable to food insecurity, while households in the wetter and more productive states of West and South Darfur were better off.
The CFSVA recommends that programmers continue current activities, targeting the most conflict affected areas and areas where there are large numbers of IDPs. To facilitate this, the CFSVA recommends that programmers take full advantage of the data collected by security personel.
2. Examine timing of food aid deliveries
While the timing of food aid deliveries is less of an issue in Darfur than in the rest of Sudan, given the amount of food delivered, the CFSVA recommends that the timing of food aid be examined to determine if there are benefits for ensuring that food aid peaks in June (instead of September) and continues at peak levels until October.
3. Couple food aid and malarial programmes
The CFSVA recommends that WFP consider coupling food interventions with anti-malarial programmes in September and October to try and reduce the deterioration in child nutrition that occurs annually at the end of the hunger season and peak malarial season. Research also indicates that being malnourished leaves children more vulnerable to mortality from malaria43.
11.8.6 Recommended non-food interventions by priority area and priority group
Findings from the CFSVA provide guidance on what non food interventions or activities should be prioritized. These are discussed below.
Child health and nutrition priorities/ interventions
1. Institute programmes encouraging improved child caring practices and particularly child feeding practices
43 Caulfield, L, Richard, S, and Black, R. Undernutrition as an underlying cause of malaria morbidity and mortality. DCPP working paper No. 16. John’s Hopkins University Bloomberg School of Public Health.
124
The CFSVA recommends incorporating programmes encouraging proper child caring practices, and particularly child feeding patterns into existing nutritional support programmes. This appears to be especially important in the context of North and South Darfur. Here over 60 percent of women report providing foods other than breastmilk in the first 6 months of life.
2. Increase vitamin A supplementation programmes in South Darfur
The CFSVA recommends that vitamin A supplementation programmes be instituted in South Darfur to improve supplementation rates. CFSVA data indicates that supplementation rates are generally 10-15 percent lower in South Darfur than in North and West Darfur. While reasons for this are unclear, fewer children are reached by the national immunization day campaign in South Darfur than in West Darfur and fewer children receive supplements during routine visits than in North Darfur. This would suggest a need to expand the reach of supplementation efforts during the national immunization day and a need to encourage health centres to provide supplements to children who may not have been supplemented during this campaign.
3. Encourage salt fortification programmes
While the prevalence of IDD varies (by region, soil content, altitude etc), recent studies indicate that IDD prevalence is highest in the mountainous parts of Darfur, with prevalence ranging from 75 percent to 90 percent44. While the Universal Salt Iodization (USI) policy was officially adopted in 1994 as the foundation for the national IDD prevention strategy, this policy has not been properly enforced, leaving people in Greater Darfur as in the rest of Sudan, without access to properly iodized salt. Given the level of food aid flowing into Darfur, it is obviously the primary source of iodized salt. Substantial declines in food aid (given either improvement or substantial deterioration in the security situation) would leave many people at much greater risk of IDD. The long term solution to IDD is to encourage the government to enforce the USI and ensure that all domestically produced salt is iodized. The CFSVA recommends that WFP encourage such efforts.
Agricultural interventions
1. Facilitate crop production in agricultural households, specifically targeting displaced households
WFP should collaborate with other agencies, like FAO, to facilitate crop production. One of the consequences of the ongoing conflict has been significant asset loss by households, specifically in terms of agriculture and livestock losses. The CFSVA recommends that displaced, agricultural households be targeted for distribution of seeds, tools and other farming implements, enabling these households to maximize crop outputs.
44 Bani, I. (2006). Accelerating progress towards universal salt iodization in Sudan: Time for action. New Research, Submitted to the Khartoum Food Aid forum, June.
125
11. Southern Sudan
11.1 Situational analysis
11.1.1 Overview
Southern Sudan suffered disproportionately in the years of civil war with the north. Over 2 million people were killed and over 4 million people were displaced. Years of fighting destroyed much of the existing infrastructure and rendered new development impossible. Constant insecurity and displacement resulted in the breakdown of traditional livelihoods.
The legacies of conflict are visible throughout society. It has created a generation without proper educational opportunities, access to basic health care services, and a lack of general capacity, all of which threaten future development. Years of displacement and migration away from conflict have lessened agricultural capacity, resulting in low output and productivity. The destruction of infrastructure and stunting of new development has also limited opportunities for employment outside the agricultural sector and limited access to markets, creating further developmental obstacles.
Despite the obvious difficulties that remain, the signing of the Comprehensive Peace Agreement (CPA) in 2005 has notably improved the well-being of households throughout the region, engendering hope for a better future. Consequently, it has given the Government of National Unity (GNU), the Government of South Sudan (GOS), and international organizations a crucial window during which fundamental improvements to health, nutrition, and food security are possible. As a first step in this process, a detailed assessment of the current food security and nutritional situation is necessary. This chapter attempts to provide such as assessment.
11.1.2 Current security situation
With the signing of the CPA, large scale fighting has ceased, eliminating the most significant threat to health and well-being. Various threats to security remain, however. First and foremost among these threats is the persistence of armed tribal factions and militias operating in various areas of Southern Sudan. The most prominent of these include the Sudan People’s Liberation Army (SPLA), Joint Integrated Unit (JIU), Sudanese Armed Forces (SAF), People’s Defense Forces (PDF), and Southern Sudanese Defense Forces (SSDF). The existence of these groups inevitably results in scattered clashes from time to time. The Lord’s Resistance Army (LRA) from Uganda has emerged recently as a particularly destabilizing factor in Eastern, Central and Western Equatoria. This is of particular concern as they have disrupted agricultural activities in the “greenbelt region” whose crop surpluses are often relied upon by surrounding states in times of food shortages.
Maintaining “peace” remains the most significant challenge for both the GNU and GOSS. The most difficult components of the CPA (removal of GOS troops from the south and disarmament) are being implemented gradually. The first phase of GOS troop withdrawals was scheduled to begin on July 9, 2007. Disarmament is being undertaken gradually and with limited success to date. Full GOS withdrawal and militia disarmament is scheduled to be completed in the next few years.
Lesser security threats also remain a significant concern. Crime and banditry is rife in certain areas, particularly along the border with Kenya in Eastern Equatoria. This has had an impact on commerce and has hindered recovery and development to a certain extent. Landmines also pose a threat. A significant number still populate certain transportation routes, especially in areas previously heavily affected by the conflict. This has limited market access and hindered resettlement and development activities. Finally, IDP resettlement activities have introduced another level of potential conflict or tension, with returnees having to compete for natural resources and infrastructure with local residents.
11.1.3 Political progress
Despite continuing, localized insecurity, the GOSS, as well as state and local governments have been established and are in the process of formulating policy guidelines and institutional structures. The Government of South Sudan is now headquartered in the new Capital, Juba. State governments, meanwhile, are in the process of developing detailed long and short term development plans, intended to guide programme activities.
The establishment of a functioning government at all levels has had immediate benefits. First, the
126
assumption of control by local governments has filled the vacuum that emerged with the CPA. This has bolstered security and provided a framework by which disputes can be handled without resorting to violence. Second, the establishment of these governments has led to an emerging civil service, creating not only employment opportunities, but also providing crucial governing experience and building capacity. As the GOSS matures and the emerging civil service gains more experience, there will be greater opportunity to couple food security and nutrition programmes with ongoing governmental development efforts, with the aim of reaching the more people and having maximum impact.
11.1.4 Economic situation and household livelihoods
While the economy of southern Sudan remains largely informal and is based primarily on subsistence agriculture and livestock, anecdotal evidence seems to indicate that household livelihoods have improved after the signing of the CPA. Resettlement activities have returned many previously displaced to their homes, allowing these households to resume their livelihoods. This promises to bolster agricultural production in the years in ahead. Migration to urban areas has resulted in rapid population growth in many of the urban centres throughout the region. This has increased market dependence and led to substantial increases in demand for various agricultural commodities. As demand has increased so has trade, both locally and with communities across the border in Uganda and Kenya.
As urban areas continue to expand, the need to improve infrastructure has increased. Foreign companies, eager to invest in the rebuilding of southern Sudan, have stepped in to fill this need. Many have begun to partner with local governments and are actively employing local labour. Consequently, construction and infrastructure projects have become common in certain communities and urban centres, creating a new demand for labour and thus a new source of jobs. While the impact of these improvements has been relatively localized, it is likely (with the continuance of peace) that the reach of these activities will expand and the benefits will be felt far beyond these immediate urban centres. As infrastructure improves and as economic opportunities increase, significant improvements in health and food security are likely to follow.
11.1.5 Agricultural sector
While there are no official statistics on what share of GDP is attributed to agriculture in southern Sudan, it is widely considered the most important sector. Agriculture is largely traditional, relying primarily on hand power with very limited use of animals (which have only been introduced recently). Pesticides and herbicides are not common either.
The most fertile areas of southern Sudan (termed the “greenbelt”) are in the regions of Western and Central Equatoria. This area receives rain throughout the year and crop surpluses here are often used to supplement food stocks in surrounding states during times of shortage. In much of the rest of southern Sudan (outside of the greenbelt), households rely on a mix of crop production and livestock rearing, supplemented by the gathering of wild foods, hunting wild game or fishing. Within these areas, the importance of crop production (as a share of total households livelihoods) largely depends on the amount of rainfall, flooding etc. Livestock is increasingly important, however. In fact, recent statistics indicate that the exportation of beef has surpassed cash crops as the largest non oil export of Sudan.
Throughout southern Sudan, sorghum, millet and maize are the most important crops, though in certain regions cassava, sweet potatoes, pumpkins, beans, sesame and a variety of other crops are also cultivated. Agricultural production and yield is traditionally determined by several factors:
1. Amount and timing of rain
2. Area planted
3. Availability of agricultural inputs
4. Weeds, pests, diseases and natural disasters
5. Localized insecurity
The cropping season in 2006 was no exception. Insecurity, blamed on the Lords Resistance Army (LRA) in greenbelt regions, militia activity in Jongolei and Upper Nile, and tribal clashes in Lakes, Warrap and Central Equatoria were cited specifically as reasons for reduced crop yields. Likewise, the lack of rain in June and July in parts of Central and Western Equatoria, Unity, Jongolei and Upper Nile
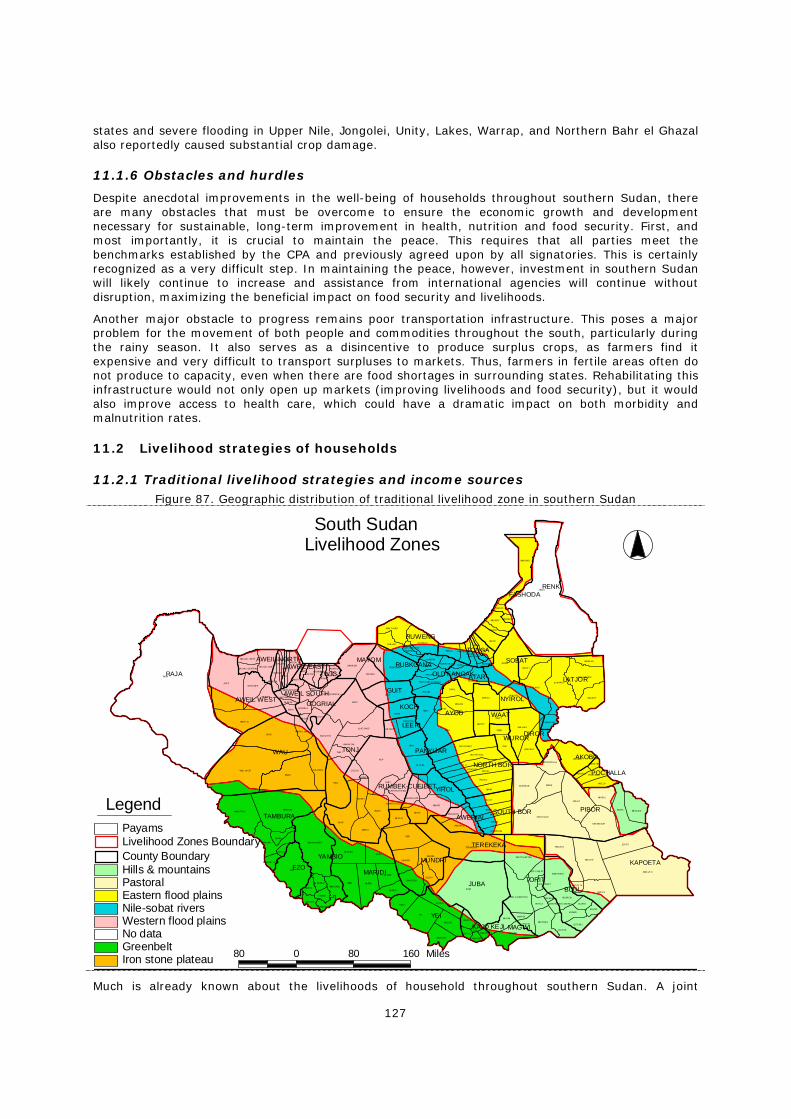
127
states and severe flooding in Upper Nile, Jongolei, Unity, Lakes, Warrap, and Northern Bahr el Ghazal also reportedly caused substantial crop damage.
11.1.6 Obstacles and hurdles
Despite anecdotal improvements in the well-being of households throughout southern Sudan, there are many obstacles that must be overcome to ensure the economic growth and development necessary for sustainable, long-term improvement in health, nutrition and food security. First, and most importantly, it is crucial to maintain the peace. This requires that all parties meet the benchmarks established by the CPA and previously agreed upon by all signatories. This is certainly recognized as a very difficult step. In maintaining the peace, however, investment in southern Sudan will likely continue to increase and assistance from international agencies will continue without disruption, maximizing the beneficial impact on food security and livelihoods.
Another major obstacle to progress remains poor transportation infrastructure. This poses a major problem for the movement of both people and commodities throughout the south, particularly during the rainy season. It also serves as a disincentive to produce surplus crops, as farmers find it expensive and very difficult to transport surpluses to markets. Thus, farmers in fertile areas often do not produce to capacity, even when there are food shortages in surrounding states. Rehabilitating this infrastructure would not only open up markets (improving livelihoods and food security), but it would also improve access to health care, which could have a dramatic impact on both morbidity and malnutrition rates.
11.2 Livelihood strategies of households
11.2.1 Traditional livelihood strategies and income sources Figure 87. Geographic distribution of traditional livelihood zone in southern Sudan
RAJA
WAU
PIBOR
RENK
TONJ
YEI
KAPOETA
TORITJUBA
LATJOR
MARIDI
AYOD
TAMBURA
BUDI
MUNDRIYAMBIO
YIROLRUMBEK-CUEIBET
AWEIL WEST
NORTH BOR
EZO
DIROR
SOBAT
FASHODA
TEREKEKA
GUIT
RUWENG
MAYOM
GOGRIALNYIROL
AKOBO
TONGA
ATARTWIC
MAGWI
SOUTH BOR
LEERWAAT
OLD FANGAK
PANYIJAR
KOCH
RUBKOANA
AWERIAL
WUROR
AWEIL EAST
POCHALLA
AWEIL NORTH
KAJO KEJI
AWEIL SOUTH
RAJA
RENK
JUBA
RUP
KWA UT O
AYA T
UDICI
WAU
EZO
YEI
WAU W EST
BAZIA
NAGE RO
SOBAT
AKOP
TONJ
VENTHAITH
YERI
TEREKE KA
GUIT
IBBA
NGAP
ULANG
AKE LO
NADIAN GERE
MOGOS
LOP ET
ARIOY O
ADOR
BOMA
MW OMO
LU AK PINY
KOZE
NAMU TINA
WALGA K
NYA L
GUMURUK
MA RUKO
BALE I
RIW OT O
NARUS
MA RIDI
KOCH
RUBKOANA
ABIRIU
KED IBA
NYA ND IT
MA NK IEN
PACITI (LAF ON)
HAA T
MA AR
PIBOR
NYIROL
YUA I
PALIA U
JA LLE
KAS SINGOR
LA NK IEN
PAGERI
LUACJANG
KUA NJTHII
TORE
KIMOTONG
ABA NG
DUK PA DIE T
LONGUCHOK
LIT H
MA ROU
KUA JIENA
AWE RIA L
KAIK UINY
GUMRIA K
MUNDRI
WICHOK
MA IWUT
NGOP
MA MBE
ORINY
MA RIA M
LA INY A
ALEK
PAGIL
BUR (LORONYO)
ME OUN D
LOU
TAMBURA
BALIE T
OTOGO
WUNLA M
MA GWI
MOTOT
NYUAK
DUONY
IMOTONG
KUE I
GA NY IEL
GOMJUE R
DUK PA YUEL
KUE LDIT
BANGOLO
IKOTOS
ANY IDI
MOGOK
AKOBO
BAIDIT
WAA T
MV OLO
AWE T-A DET
MOROBO
TOCH (GOGRIAL)
TONGA
NGARICH
NYA DIN
LA NDILI
KONGOR
LOZOH
PIERI
THIE T
ANA NA TAK
KOMIRI
ABUROC
AKIE LA
THONYOR
JIE CH
MA LUA L EAS T
BANGASU
OGOD
MA BA AN
GOKA NGULE
CITCOK
DUMA
PAGUIR
LOP IT WE ST
LOTUKE I
ALUA KLUAK
NZA RA
NGEP O
BUNAGOK
MA YINDIT
MA LUA LBAI
POCHALLA
HIYA LA
AKON
IFUOTU
KEE W
LA URO
KUR W AY
KOLNYA NG
BAA U
MA RIA L WA U
SAK URE
MA KUAC
PANYOK
LOUDO
ALAMTOCH W EST
PATHUON
KODOK
WANDING
YAMBIO
GOGRIA L
JUAIB OR
LI- RA NGU
WUNROK
TOC H (OLD FA NGAK )
KWOJO
PAK ANG
NAB IAP AI
MA LUA L WE ST
LIRE
TURALEIMA NGOK
KAP OE TA
ALAM
AWE NGYARGOT
IMUR OK
PANYIKA NG
MUPOI
LIV OLO
BAA C
MA NGARGIER
MA DHOLAKOC
KUE RNYA NG
ALAMTOCH E AST
SOURCE YUBU
ADONGO
MA LUA L CE NTRAL
PAW ENG
KONGAM
BURAT OR
AJAKK UA C
ATH IDW OI
WAT HMOUK
RIAU
GA KR OL
LOP IT EAS T
PANYIDWA I
KANGEPO II
OB WA
WUNLA NG
KANGEPO I
KUA JOK
TUH UB AK
LOMOHIDANG (ISOKE )
MA NGAR TONG
KUE L MOL P INY
CUEIBE T
Iron stone plateauGreenbeltNo dataWestern flood plainsNile-sobat riversEastern flood plainsPastoralHills & mountainsCounty BoundaryLivelihood Zones BoundaryPayams
Legend
South Sudan Livelihood Zones
80 0 80 160 Miles
Much is already known about the livelihoods of household throughout southern Sudan. A joint
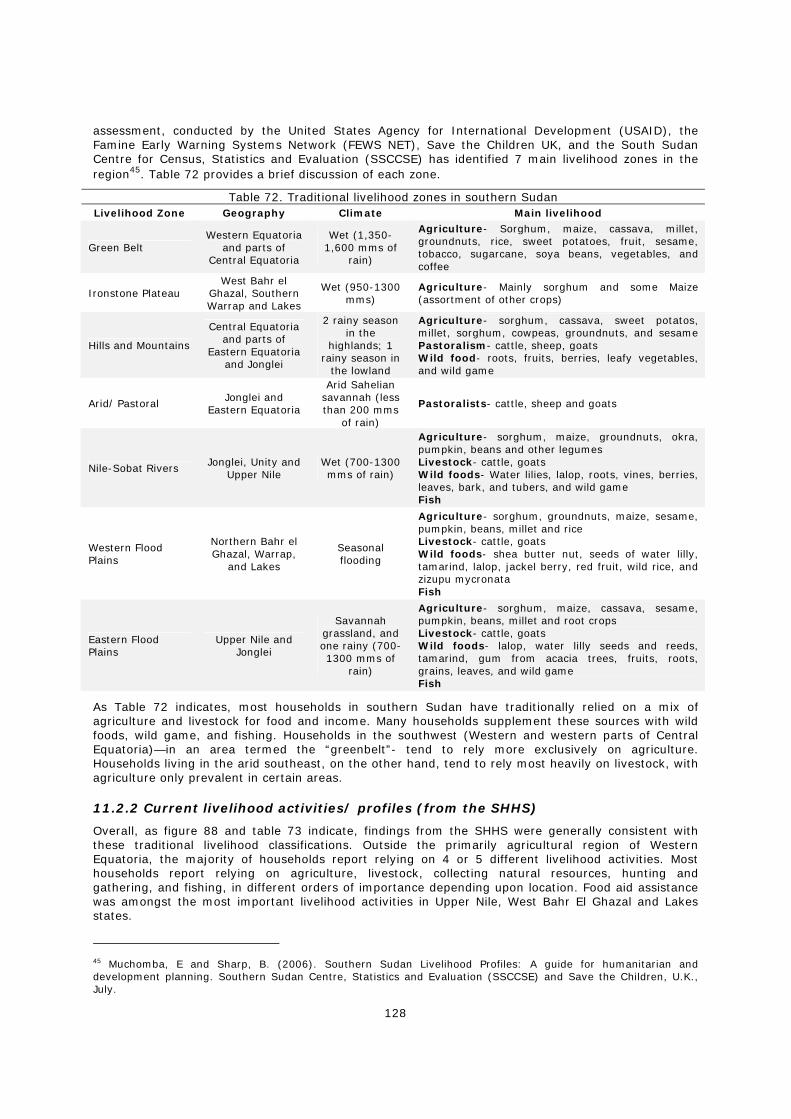
128
assessment, conducted by the United States Agency for International Development (USAID), the Famine Early Warning Systems Network (FEWS NET), Save the Children UK, and the South Sudan Centre for Census, Statistics and Evaluation (SSCCSE) has identified 7 main livelihood zones in the region45. Table 72 provides a brief discussion of each zone.
Table 72. Traditional livelihood zones in southern Sudan Livelihood Zone Geography Climate Main livelihood
Green Belt Western Equatoria
and parts of Central Equatoria
Wet (1,350-1,600 mms of
rain)
Agriculture- Sorghum, maize, cassava, millet, groundnuts, rice, sweet potatoes, fruit, sesame, tobacco, sugarcane, soya beans, vegetables, and coffee
Ironstone Plateau West Bahr el
Ghazal, Southern Warrap and Lakes
Wet (950-1300 mms)
Agriculture- Mainly sorghum and some Maize (assortment of other crops)
Hills and Mountains
Central Equatoria and parts of
Eastern Equatoria and Jonglei
2 rainy season in the
highlands; 1 rainy season in
the lowland
Agriculture- sorghum, cassava, sweet potatos, millet, sorghum, cowpeas, groundnuts, and sesame Pastoralism- cattle, sheep, goats Wild food- roots, fruits, berries, leafy vegetables, and wild game
Arid/ Pastoral Jonglei and Eastern Equatoria
Arid Sahelian savannah (less than 200 mms
of rain)
Pastoralists- cattle, sheep and goats
Nile-Sobat Rivers Jonglei, Unity and Upper Nile
Wet (700-1300 mms of rain)
Agriculture- sorghum, maize, groundnuts, okra, pumpkin, beans and other legumes Livestock- cattle, goats Wild foods- Water lilies, lalop, roots, vines, berries, leaves, bark, and tubers, and wild game Fish
Western Flood Plains
Northern Bahr el Ghazal, Warrap,
and Lakes
Seasonal flooding
Agriculture- sorghum, groundnuts, maize, sesame, pumpkin, beans, millet and rice Livestock- cattle, goats Wild foods- shea butter nut, seeds of water lilly, tamarind, lalop, jackel berry, red fruit, wild rice, and zizupu mycronata Fish
Eastern Flood Plains
Upper Nile and Jonglei
Savannah grassland, and one rainy (700-1300 mms of
rain)
Agriculture- sorghum, maize, cassava, sesame, pumpkin, beans, millet and root crops Livestock- cattle, goats Wild foods- lalop, water lilly seeds and reeds, tamarind, gum from acacia trees, fruits, roots, grains, leaves, and wild game Fish
As Table 72 indicates, most households in southern Sudan have traditionally relied on a mix of agriculture and livestock for food and income. Many households supplement these sources with wild foods, wild game, and fishing. Households in the southwest (Western and western parts of Central Equatoria)—in an area termed the “greenbelt”- tend to rely more exclusively on agriculture. Households living in the arid southeast, on the other hand, tend to rely most heavily on livestock, with agriculture only prevalent in certain areas.
11.2.2 Current livelihood activities/ profiles (from the SHHS)
Overall, as figure 88 and table 73 indicate, findings from the SHHS were generally consistent with these traditional livelihood classifications. Outside the primarily agricultural region of Western Equatoria, the majority of households report relying on 4 or 5 different livelihood activities. Most households report relying on agriculture, livestock, collecting natural resources, hunting and gathering, and fishing, in different orders of importance depending upon location. Food aid assistance was amongst the most important livelihood activities in Upper Nile, West Bahr El Ghazal and Lakes states.
45 Muchomba, E and Sharp, B. (2006). Southern Sudan Livelihood Profiles: A guide for humanitarian and development planning. Southern Sudan Centre, Statistics and Evaluation (SSCCSE) and Save the Children, U.K., July.
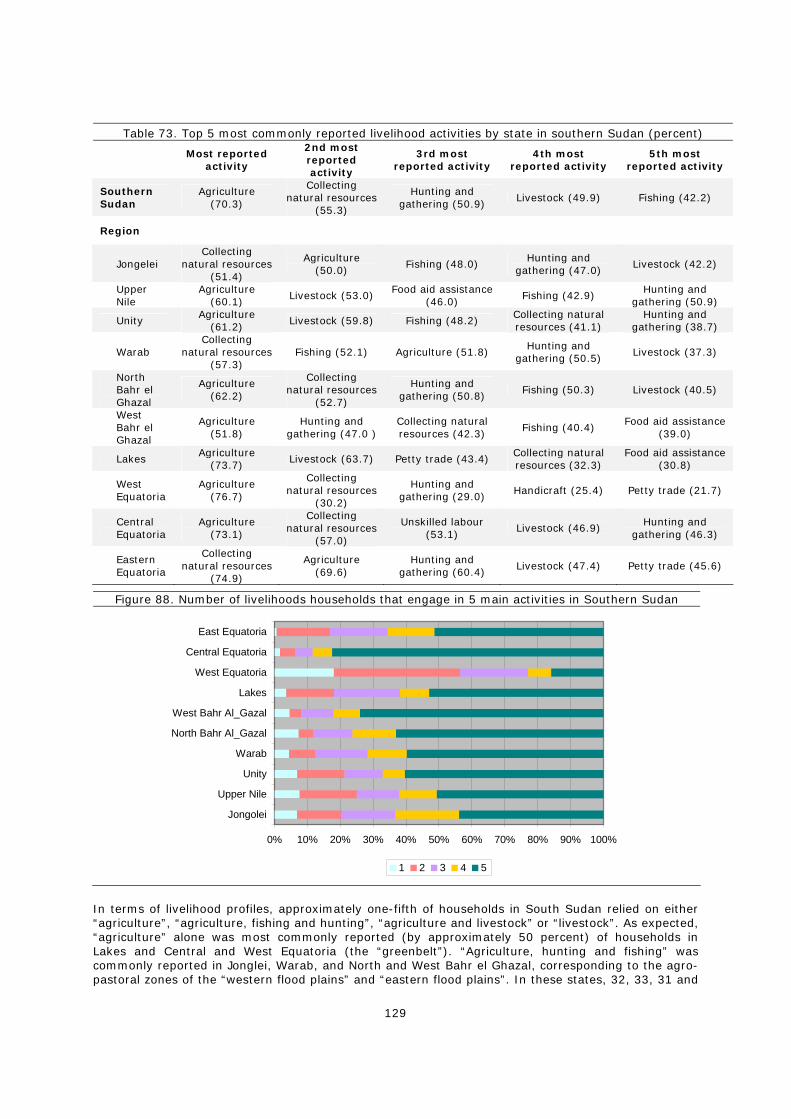
129
Table 73. Top 5 most commonly reported livelihood activities by state in southern Sudan (percent)
Most reported
activity
2nd most reported activity
3rd most reported activity
4th most reported activity
5th most reported activity
Southern Sudan
Agriculture (70.3)
Collecting natural resources
(55.3)
Hunting and gathering (50.9)
Livestock (49.9) Fishing (42.2)
Region
Jongelei Collecting
natural resources (51.4)
Agriculture (50.0)
Fishing (48.0) Hunting and
gathering (47.0) Livestock (42.2)
Upper Nile
Agriculture (60.1) Livestock (53.0)
Food aid assistance (46.0) Fishing (42.9)
Hunting and gathering (50.9)
Unity Agriculture
(61.2) Livestock (59.8) Fishing (48.2) Collecting natural resources (41.1)
Hunting and gathering (38.7)
Warab Collecting
natural resources (57.3)
Fishing (52.1) Agriculture (51.8) Hunting and
gathering (50.5) Livestock (37.3)
North Bahr el Ghazal
Agriculture (62.2)
Collecting natural resources
(52.7)
Hunting and gathering (50.8)
Fishing (50.3) Livestock (40.5)
West Bahr el Ghazal
Agriculture (51.8)
Hunting and gathering (47.0 )
Collecting natural resources (42.3)
Fishing (40.4) Food aid assistance
(39.0)
Lakes Agriculture
(73.7) Livestock (63.7) Petty trade (43.4) Collecting natural resources (32.3)
Food aid assistance (30.8)
West Equatoria
Agriculture (76.7)
Collecting natural resources
(30.2)
Hunting and gathering (29.0) Handicraft (25.4) Petty trade (21.7)
Central Equatoria
Agriculture (73.1)
Collecting natural resources
(57.0)
Unskilled labour (53.1)
Livestock (46.9) Hunting and gathering (46.3)
Eastern Equatoria
Collecting natural resources
(74.9)
Agriculture (69.6)
Hunting and gathering (60.4)
Livestock (47.4) Petty trade (45.6)
Figure 88. Number of livelihoods households that engage in 5 main activities in Southern Sudan
0% 10% 20% 30% 40% 50% 60% 70% 80% 90% 100%
Jongolei
Upper Nile
Unity
Warab
North Bahr Al_Gazal
West Bahr Al_Gazal
Lakes
West Equatoria
Central Equatoria
East Equatoria
1 2 3 4 5
In terms of livelihood profiles, approximately one-fifth of households in South Sudan relied on either “agriculture”, “agriculture, fishing and hunting”, “agriculture and livestock” or “livestock”. As expected, “agriculture” alone was most commonly reported (by approximately 50 percent) of households in Lakes and Central and West Equatoria (the “greenbelt”). “Agriculture, hunting and fishing” was commonly reported in Jonglei, Warab, and North and West Bahr el Ghazal, corresponding to the agro-pastoral zones of the “western flood plains” and “eastern flood plains”. In these states, 32, 33, 31 and
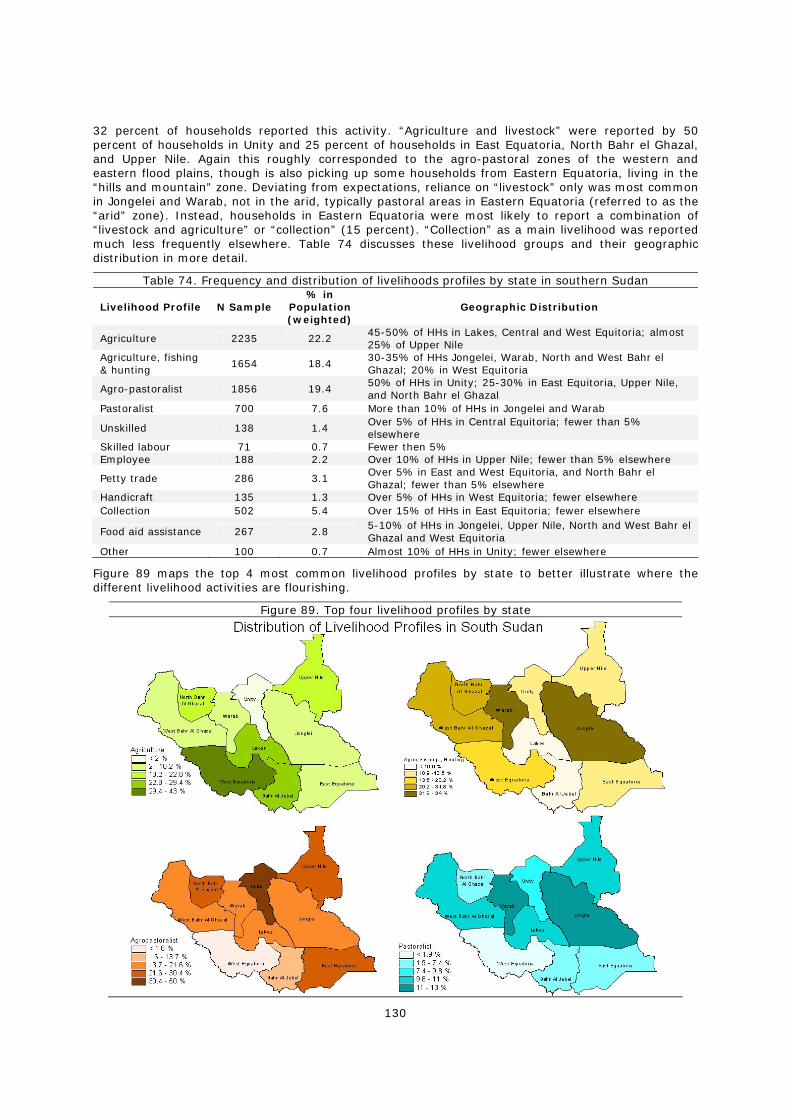
130
32 percent of households reported this activity. “Agriculture and livestock” were reported by 50 percent of households in Unity and 25 percent of households in East Equatoria, North Bahr el Ghazal, and Upper Nile. Again this roughly corresponded to the agro-pastoral zones of the western and eastern flood plains, though is also picking up some households from Eastern Equatoria, living in the “hills and mountain” zone. Deviating from expectations, reliance on “livestock” only was most common in Jongelei and Warab, not in the arid, typically pastoral areas in Eastern Equatoria (referred to as the “arid” zone). Instead, households in Eastern Equatoria were most likely to report a combination of “livestock and agriculture” or “collection” (15 percent). “Collection” as a main livelihood was reported much less frequently elsewhere. Table 74 discusses these livelihood groups and their geographic distribution in more detail.
Table 74. Frequency and distribution of livelihoods profiles by state in southern Sudan
Livelihood Profile N Sample % in
Population (weighted)
Geographic Distribution
Agriculture 2235 22.2 45-50% of HHs in Lakes, Central and West Equitoria; almost 25% of Upper Nile
Agriculture, fishing & hunting
1654 18.4 30-35% of HHs Jongelei, Warab, North and West Bahr el Ghazal; 20% in West Equitoria
Agro-pastoralist 1856 19.4 50% of HHs in Unity; 25-30% in East Equitoria, Upper Nile, and North Bahr el Ghazal
Pastoralist 700 7.6 More than 10% of HHs in Jongelei and Warab
Unskilled 138 1.4 Over 5% of HHs in Central Equitoria; fewer than 5% elsewhere
Skilled labour 71 0.7 Fewer then 5% Employee 188 2.2 Over 10% of HHs in Upper Nile; fewer than 5% elsewhere
Petty trade 286 3.1 Over 5% in East and West Equitoria, and North Bahr el Ghazal; fewer than 5% elsewhere
Handicraft 135 1.3 Over 5% of HHs in West Equitoria; fewer elsewhere Collection 502 5.4 Over 15% of HHs in East Equitoria; fewer elsewhere
Food aid assistance 267 2.8 5-10% of HHs in Jongelei, Upper Nile, North and West Bahr el Ghazal and West Equitoria
Other 100 0.7 Almost 10% of HHs in Unity; fewer elsewhere
Figure 89 maps the top 4 most common livelihood profiles by state to better illustrate where the different livelihood activities are flourishing.
Figure 89. Top four livelihood profiles by state
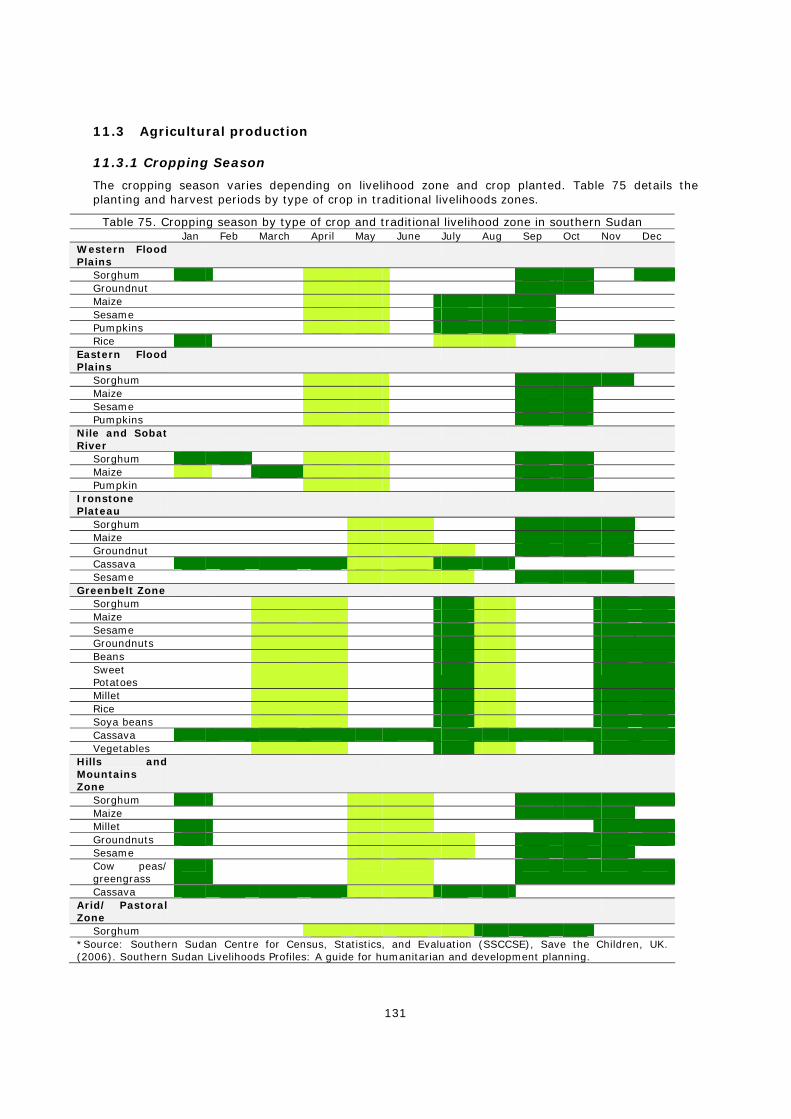
131
11.3 Agricultural production
11.3.1 Cropping Season
The cropping season varies depending on livelihood zone and crop planted. Table 75 details the planting and harvest periods by type of crop in traditional livelihoods zones.
Table 75. Cropping season by type of crop and traditional livelihood zone in southern Sudan Jan Feb March April May June July Aug Sep Oct Nov Dec Western Flood Plains
Sorghum Groundnut Maize Sesame Pumpkins Rice
Eastern Flood Plains
Sorghum Maize Sesame Pumpkins
Nile and Sobat River
Sorghum Maize Pumpkin
Ironstone Plateau
Sorghum Maize Groundnut Cassava Sesame
Greenbelt Zone Sorghum Maize Sesame Groundnuts Beans Sweet Potatoes
Millet Rice Soya beans Cassava Vegetables
Hills and Mountains Zone
Sorghum Maize Millet Groundnuts Sesame Cow peas/ greengrass
Cassava Arid/ Pastoral Zone
Sorghum *Source: Southern Sudan Centre for Census, Statistics, and Evaluation (SSCCSE), Save the Children, UK. (2006). Southern Sudan Livelihoods Profiles: A guide for humanitarian and development planning.
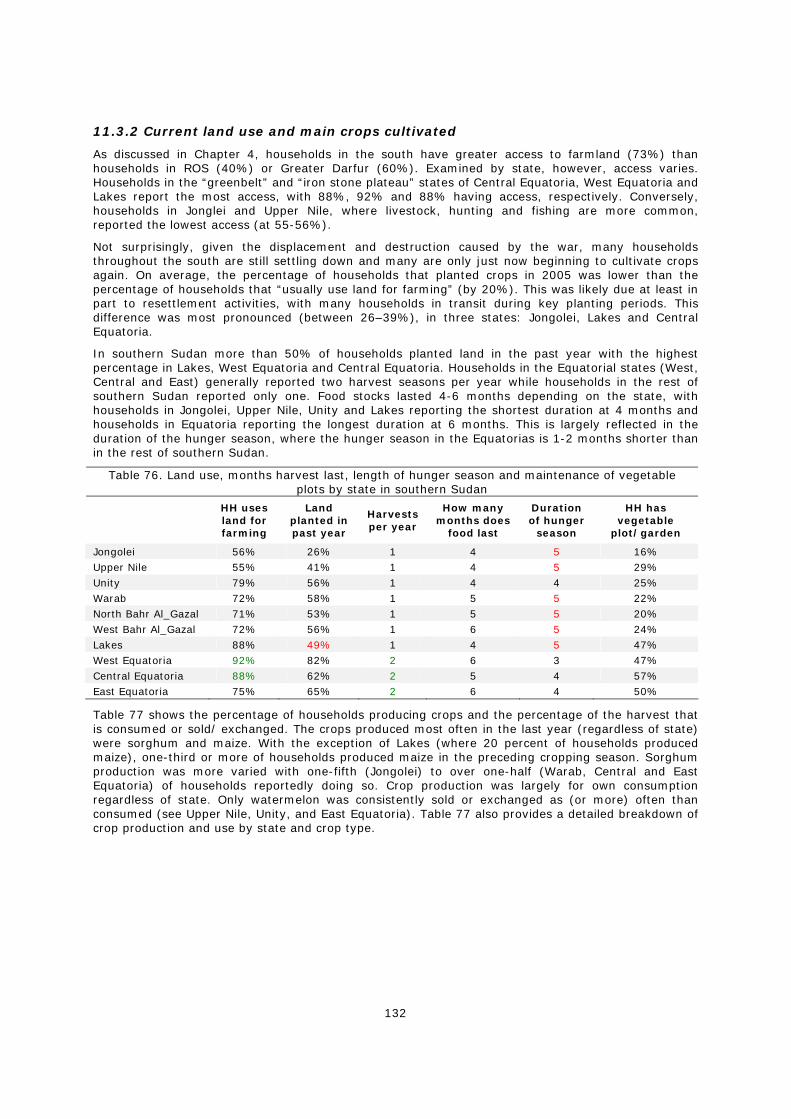
132
11.3.2 Current land use and main crops cultivated
As discussed in Chapter 4, households in the south have greater access to farmland (73%) than households in ROS (40%) or Greater Darfur (60%). Examined by state, however, access varies. Households in the “greenbelt” and “iron stone plateau” states of Central Equatoria, West Equatoria and Lakes report the most access, with 88%, 92% and 88% having access, respectively. Conversely, households in Jonglei and Upper Nile, where livestock, hunting and fishing are more common, reported the lowest access (at 55-56%).
Not surprisingly, given the displacement and destruction caused by the war, many households throughout the south are still settling down and many are only just now beginning to cultivate crops again. On average, the percentage of households that planted crops in 2005 was lower than the percentage of households that “usually use land for farming” (by 20%). This was likely due at least in part to resettlement activities, with many households in transit during key planting periods. This difference was most pronounced (between 26–39%), in three states: Jongolei, Lakes and Central Equatoria.
In southern Sudan more than 50% of households planted land in the past year with the highest percentage in Lakes, West Equatoria and Central Equatoria. Households in the Equatorial states (West, Central and East) generally reported two harvest seasons per year while households in the rest of southern Sudan reported only one. Food stocks lasted 4-6 months depending on the state, with households in Jongolei, Upper Nile, Unity and Lakes reporting the shortest duration at 4 months and households in Equatoria reporting the longest duration at 6 months. This is largely reflected in the duration of the hunger season, where the hunger season in the Equatorias is 1-2 months shorter than in the rest of southern Sudan.
Table 76. Land use, months harvest last, length of hunger season and maintenance of vegetable plots by state in southern Sudan
HH uses land for farming
Land planted in past year
Harvests per year
How many months does
food last
Duration of hunger
season
HH has vegetable
plot/garden
Jongolei 56% 26% 1 4 5 16% Upper Nile 55% 41% 1 4 5 29% Unity 79% 56% 1 4 4 25% Warab 72% 58% 1 5 5 22% North Bahr Al_Gazal 71% 53% 1 5 5 20% West Bahr Al_Gazal 72% 56% 1 6 5 24% Lakes 88% 49% 1 4 5 47% West Equatoria 92% 82% 2 6 3 47% Central Equatoria 88% 62% 2 5 4 57% East Equatoria 75% 65% 2 6 4 50%
Table 77 shows the percentage of households producing crops and the percentage of the harvest that is consumed or sold/ exchanged. The crops produced most often in the last year (regardless of state) were sorghum and maize. With the exception of Lakes (where 20 percent of households produced maize), one-third or more of households produced maize in the preceding cropping season. Sorghum production was more varied with one-fifth (Jongolei) to over one-half (Warab, Central and East Equatoria) of households reportedly doing so. Crop production was largely for own consumption regardless of state. Only watermelon was consistently sold or exchanged as (or more) often than consumed (see Upper Nile, Unity, and East Equatoria). Table 77 also provides a detailed breakdown of crop production and use by state and crop type.
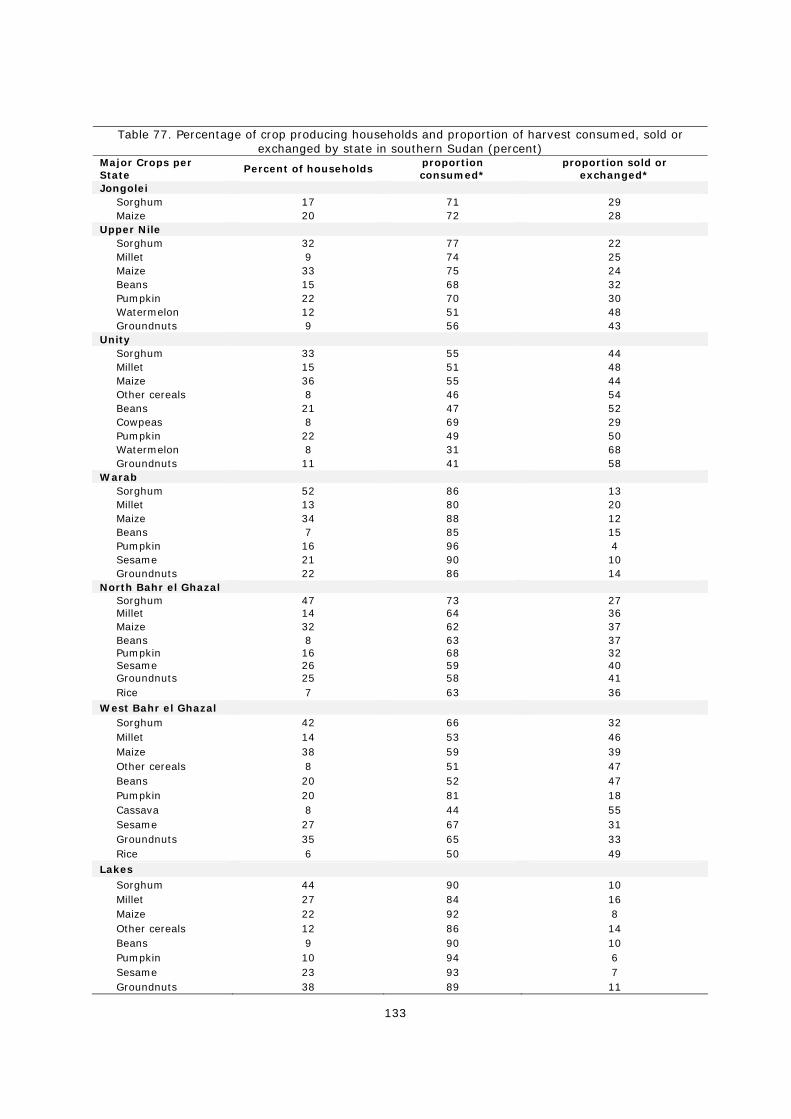
133
Table 77. Percentage of crop producing households and proportion of harvest consumed, sold or exchanged by state in southern Sudan (percent)
Major Crops per State
Percent of households proportion consumed*
proportion sold or exchanged*
Jongolei Sorghum 17 71 29 Maize 20 72 28
Upper Nile Sorghum 32 77 22 Millet 9 74 25 Maize 33 75 24 Beans 15 68 32 Pumpkin 22 70 30 Watermelon 12 51 48 Groundnuts 9 56 43
Unity Sorghum 33 55 44 Millet 15 51 48 Maize 36 55 44 Other cereals 8 46 54 Beans 21 47 52 Cowpeas 8 69 29 Pumpkin 22 49 50 Watermelon 8 31 68 Groundnuts 11 41 58
Warab Sorghum 52 86 13 Millet 13 80 20 Maize 34 88 12 Beans 7 85 15 Pumpkin 16 96 4 Sesame 21 90 10 Groundnuts 22 86 14
North Bahr el Ghazal Sorghum 47 73 27 Millet 14 64 36 Maize 32 62 37 Beans 8 63 37 Pumpkin 16 68 32 Sesame 26 59 40 Groundnuts 25 58 41 Rice 7 63 36
West Bahr el Ghazal Sorghum 42 66 32 Millet 14 53 46 Maize 38 59 39 Other cereals 8 51 47 Beans 20 52 47 Pumpkin 20 81 18 Cassava 8 44 55 Sesame 27 67 31 Groundnuts 35 65 33 Rice 6 50 49
Lakes
Sorghum 44 90 10 Millet 27 84 16 Maize 22 92 8 Other cereals 12 86 14 Beans 9 90 10 Pumpkin 10 94 6 Sesame 23 93 7 Groundnuts 38 89 11
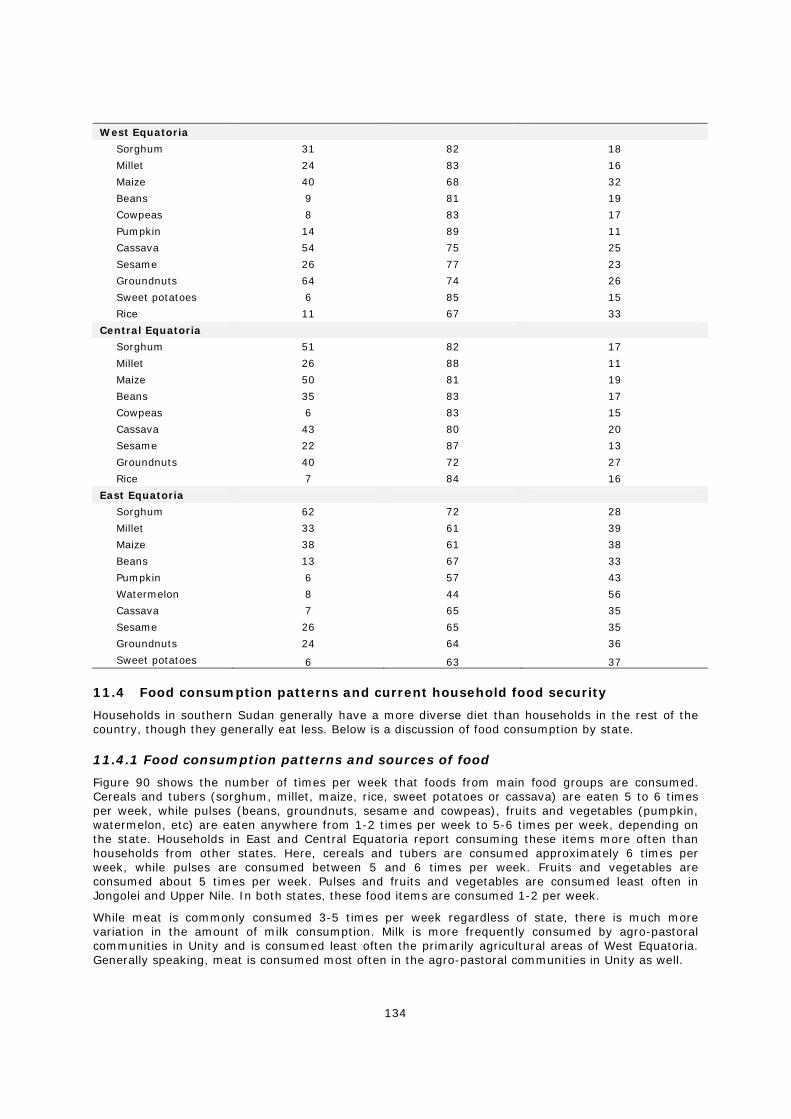
134
West Equatoria
Sorghum 31 82 18
Millet 24 83 16
Maize 40 68 32
Beans 9 81 19
Cowpeas 8 83 17
Pumpkin 14 89 11
Cassava 54 75 25
Sesame 26 77 23
Groundnuts 64 74 26
Sweet potatoes 6 85 15
Rice 11 67 33
Central Equatoria
Sorghum 51 82 17
Millet 26 88 11
Maize 50 81 19
Beans 35 83 17
Cowpeas 6 83 15
Cassava 43 80 20
Sesame 22 87 13
Groundnuts 40 72 27
Rice 7 84 16
East Equatoria
Sorghum 62 72 28
Millet 33 61 39
Maize 38 61 38
Beans 13 67 33
Pumpkin 6 57 43
Watermelon 8 44 56
Cassava 7 65 35
Sesame 26 65 35
Groundnuts 24 64 36
Sweet potatoes 6 63 37
11.4 Food consumption patterns and current household food security
Households in southern Sudan generally have a more diverse diet than households in the rest of the country, though they generally eat less. Below is a discussion of food consumption by state.
11.4.1 Food consumption patterns and sources of food
Figure 90 shows the number of times per week that foods from main food groups are consumed. Cereals and tubers (sorghum, millet, maize, rice, sweet potatoes or cassava) are eaten 5 to 6 times per week, while pulses (beans, groundnuts, sesame and cowpeas), fruits and vegetables (pumpkin, watermelon, etc) are eaten anywhere from 1-2 times per week to 5-6 times per week, depending on the state. Households in East and Central Equatoria report consuming these items more often than households from other states. Here, cereals and tubers are consumed approximately 6 times per week, while pulses are consumed between 5 and 6 times per week. Fruits and vegetables are consumed about 5 times per week. Pulses and fruits and vegetables are consumed least often in Jongolei and Upper Nile. In both states, these food items are consumed 1-2 per week.
While meat is commonly consumed 3-5 times per week regardless of state, there is much more variation in the amount of milk consumption. Milk is more frequently consumed by agro-pastoral communities in Unity and is consumed least often the primarily agricultural areas of West Equatoria. Generally speaking, meat is consumed most often in the agro-pastoral communities in Unity as well.
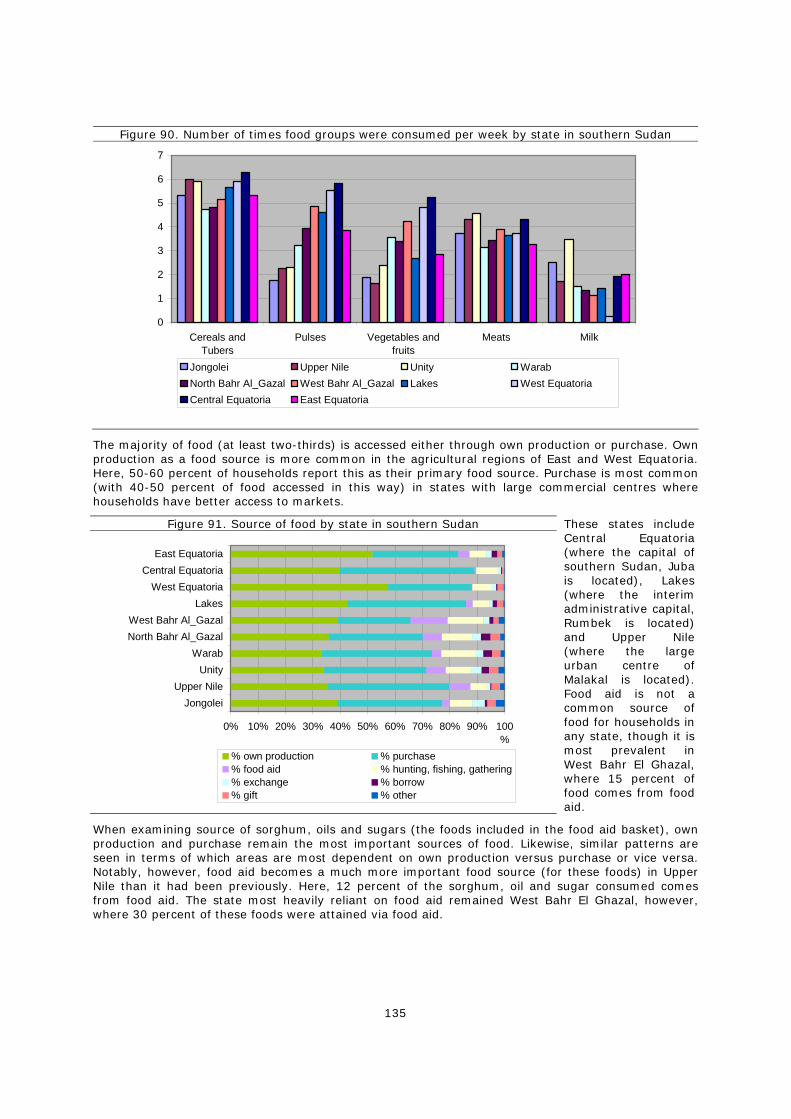
135
Figure 90. Number of times food groups were consumed per week by state in southern Sudan
0
1
2
3
4
5
6
7
Cereals andTubers
Pulses Vegetables andfruits
Meats Milk
Jongolei Upper Nile Unity WarabNorth Bahr Al_Gazal West Bahr Al_Gazal Lakes West EquatoriaCentral Equatoria East Equatoria
The majority of food (at least two-thirds) is accessed either through own production or purchase. Own production as a food source is more common in the agricultural regions of East and West Equatoria. Here, 50-60 percent of households report this as their primary food source. Purchase is most common (with 40-50 percent of food accessed in this way) in states with large commercial centres where households have better access to markets.
Figure 91. Source of food by state in southern Sudan
0% 10% 20% 30% 40% 50% 60% 70% 80% 90% 100%
JongoleiUpper Nile
UnityWarab
North Bahr Al_GazalWest Bahr Al_Gazal
LakesWest Equatoria
Central EquatoriaEast Equatoria
% own production % purchase% food aid % hunting, fishing, gathering% exchange % borrow% gift % other
These states include Central Equatoria (where the capital of southern Sudan, Juba is located), Lakes (where the interim administrative capital, Rumbek is located) and Upper Nile (where the large urban centre of Malakal is located). Food aid is not a common source of food for households in any state, though it is most prevalent in West Bahr El Ghazal, where 15 percent of food comes from food aid.
When examining source of sorghum, oils and sugars (the foods included in the food aid basket), own production and purchase remain the most important sources of food. Likewise, similar patterns are seen in terms of which areas are most dependent on own production versus purchase or vice versa. Notably, however, food aid becomes a much more important food source (for these foods) in Upper Nile than it had been previously. Here, 12 percent of the sorghum, oil and sugar consumed comes from food aid. The state most heavily reliant on food aid remained West Bahr El Ghazal, however, where 30 percent of these foods were attained via food aid.
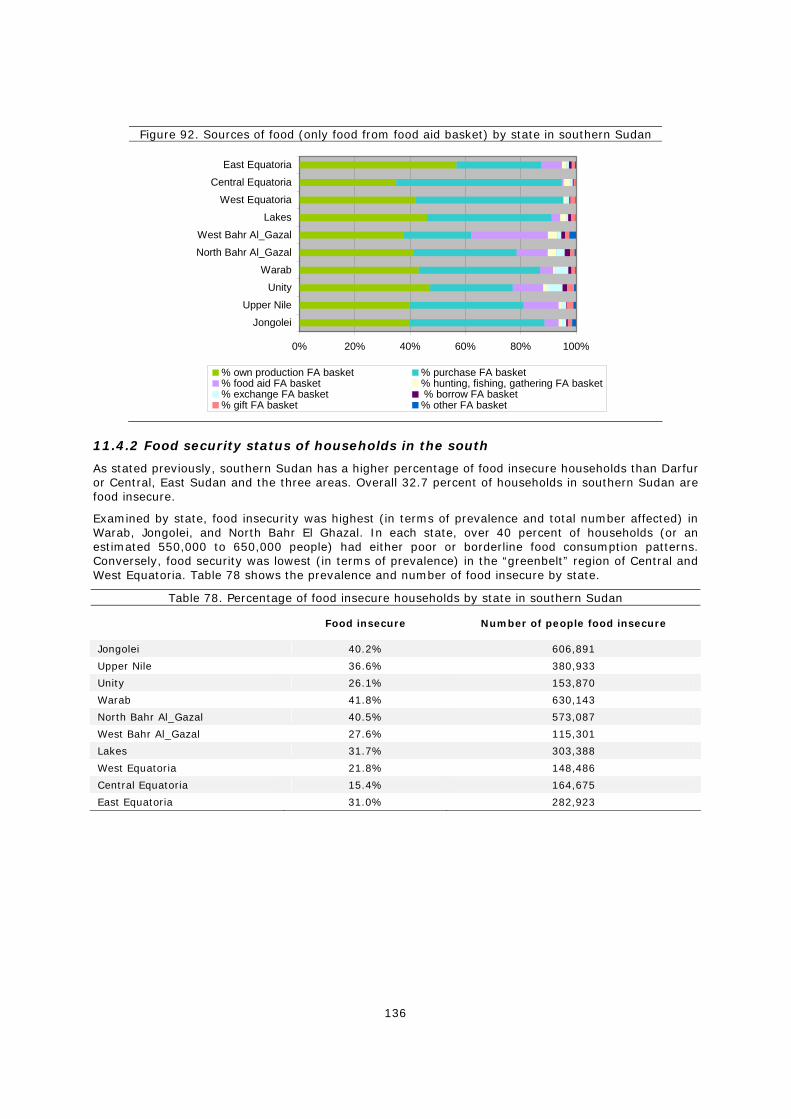
136
Figure 92. Sources of food (only food from food aid basket) by state in southern Sudan
0% 20% 40% 60% 80% 100%
Jongolei
Upper Nile
Unity
Warab
North Bahr Al_Gazal
West Bahr Al_Gazal
Lakes
West Equatoria
Central Equatoria
East Equatoria
% own production FA basket % purchase FA basket% food aid FA basket % hunting, fishing, gathering FA basket% exchange FA basket % borrow FA basket% gift FA basket % other FA basket
11.4.2 Food security status of households in the south
As stated previously, southern Sudan has a higher percentage of food insecure households than Darfur or Central, East Sudan and the three areas. Overall 32.7 percent of households in southern Sudan are food insecure.
Examined by state, food insecurity was highest (in terms of prevalence and total number affected) in Warab, Jongolei, and North Bahr El Ghazal. In each state, over 40 percent of households (or an estimated 550,000 to 650,000 people) had either poor or borderline food consumption patterns. Conversely, food security was lowest (in terms of prevalence) in the “greenbelt” region of Central and West Equatoria. Table 78 shows the prevalence and number of food insecure by state.
Table 78. Percentage of food insecure households by state in southern Sudan
Food insecure Number of people food insecure
Jongolei 40.2% 606,891
Upper Nile 36.6% 380,933
Unity 26.1% 153,870
Warab 41.8% 630,143
North Bahr Al_Gazal 40.5% 573,087
West Bahr Al_Gazal 27.6% 115,301
Lakes 31.7% 303,388
West Equatoria 21.8% 148,486
Central Equatoria 15.4% 164,675
East Equatoria 31.0% 282,923
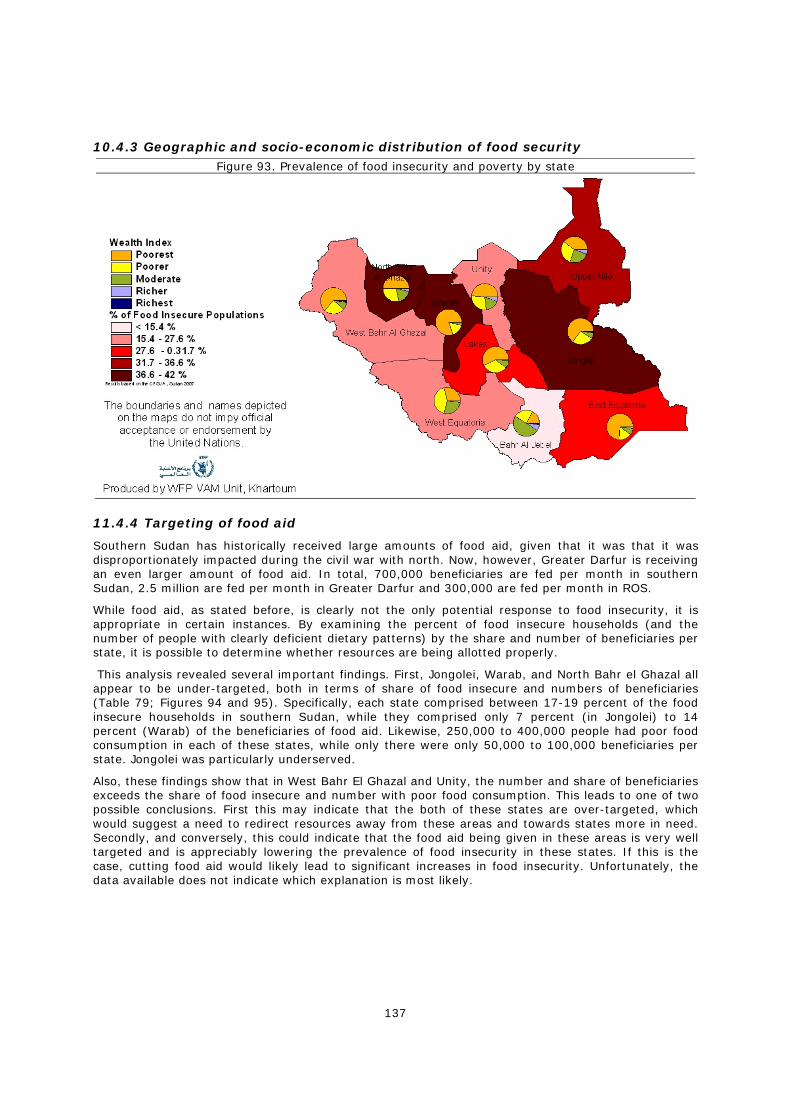
137
10.4.3 Geographic and socio-economic distribution of food security Figure 93. Prevalence of food insecurity and poverty by state
11.4.4 Targeting of food aid
Southern Sudan has historically received large amounts of food aid, given that it was that it was disproportionately impacted during the civil war with north. Now, however, Greater Darfur is receiving an even larger amount of food aid. In total, 700,000 beneficiaries are fed per month in southern Sudan, 2.5 million are fed per month in Greater Darfur and 300,000 are fed per month in ROS.
While food aid, as stated before, is clearly not the only potential response to food insecurity, it is appropriate in certain instances. By examining the percent of food insecure households (and the number of people with clearly deficient dietary patterns) by the share and number of beneficiaries per state, it is possible to determine whether resources are being allotted properly.
This analysis revealed several important findings. First, Jongolei, Warab, and North Bahr el Ghazal all appear to be under-targeted, both in terms of share of food insecure and numbers of beneficiaries (Table 79; Figures 94 and 95). Specifically, each state comprised between 17-19 percent of the food insecure households in southern Sudan, while they comprised only 7 percent (in Jongolei) to 14 percent (Warab) of the beneficiaries of food aid. Likewise, 250,000 to 400,000 people had poor food consumption in each of these states, while only there were only 50,000 to 100,000 beneficiaries per state. Jongolei was particularly underserved.
Also, these findings show that in West Bahr El Ghazal and Unity, the number and share of beneficiaries exceeds the share of food insecure and number with poor food consumption. This leads to one of two possible conclusions. First this may indicate that the both of these states are over-targeted, which would suggest a need to redirect resources away from these areas and towards states more in need. Secondly, and conversely, this could indicate that the food aid being given in these areas is very well targeted and is appreciably lowering the prevalence of food insecurity in these states. If this is the case, cutting food aid would likely lead to significant increases in food insecurity. Unfortunately, the data available does not indicate which explanation is most likely.
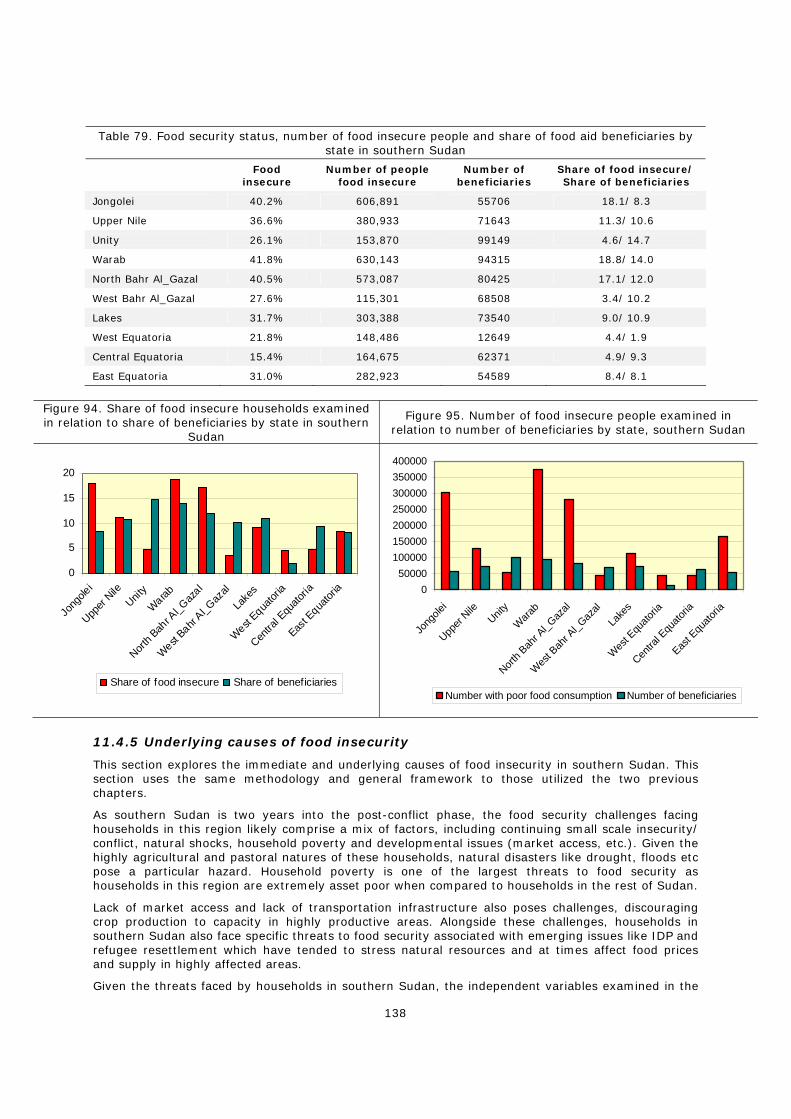
138
Table 79. Food security status, number of food insecure people and share of food aid beneficiaries by state in southern Sudan
Food insecure
Number of people food insecure
Number of beneficiaries
Share of food insecure/ Share of beneficiaries
Jongolei 40.2% 606,891 55706 18.1/ 8.3
Upper Nile 36.6% 380,933 71643 11.3/ 10.6
Unity 26.1% 153,870 99149 4.6/ 14.7
Warab 41.8% 630,143 94315 18.8/ 14.0
North Bahr Al_Gazal 40.5% 573,087 80425 17.1/ 12.0
West Bahr Al_Gazal 27.6% 115,301 68508 3.4/ 10.2
Lakes 31.7% 303,388 73540 9.0/ 10.9
West Equatoria 21.8% 148,486 12649 4.4/ 1.9
Central Equatoria 15.4% 164,675 62371 4.9/ 9.3
East Equatoria 31.0% 282,923 54589 8.4/ 8.1
Figure 94. Share of food insecure households examined in relation to share of beneficiaries by state in southern
Sudan
Figure 95. Number of food insecure people examined in relation to number of beneficiaries by state, southern Sudan
0
5
10
15
20
Jong
olei
Upper
NileUnit
y
Warab
North B
ahr A
l_Gaz
al
West Bahr
Al_Gaz
al
Lake
s
West Equa
toria
Centra
l Equ
atoria
East E
quator
ia
Share of food insecure Share of beneficiaries
050000
100000150000200000250000300000350000400000
Jong
olei
Upper
NileUnit
y
Wara
b
North B
ahr A
l_Gaz
al
Wes
t Bah
r Al_G
azal
Lake
s
West E
quato
ria
Centra
l Equ
atoria
East E
quato
ria
Number with poor food consumption Number of beneficiaries
11.4.5 Underlying causes of food insecurity
This section explores the immediate and underlying causes of food insecurity in southern Sudan. This section uses the same methodology and general framework to those utilized the two previous chapters.
As southern Sudan is two years into the post-conflict phase, the food security challenges facing households in this region likely comprise a mix of factors, including continuing small scale insecurity/ conflict, natural shocks, household poverty and developmental issues (market access, etc.). Given the highly agricultural and pastoral natures of these households, natural disasters like drought, floods etc pose a particular hazard. Household poverty is one of the largest threats to food security as households in this region are extremely asset poor when compared to households in the rest of Sudan.
Lack of market access and lack of transportation infrastructure also poses challenges, discouraging crop production to capacity in highly productive areas. Alongside these challenges, households in southern Sudan also face specific threats to food security associated with emerging issues like IDP and refugee resettlement which have tended to stress natural resources and at times affect food prices and supply in highly affected areas.
Given the threats faced by households in southern Sudan, the independent variables examined in the
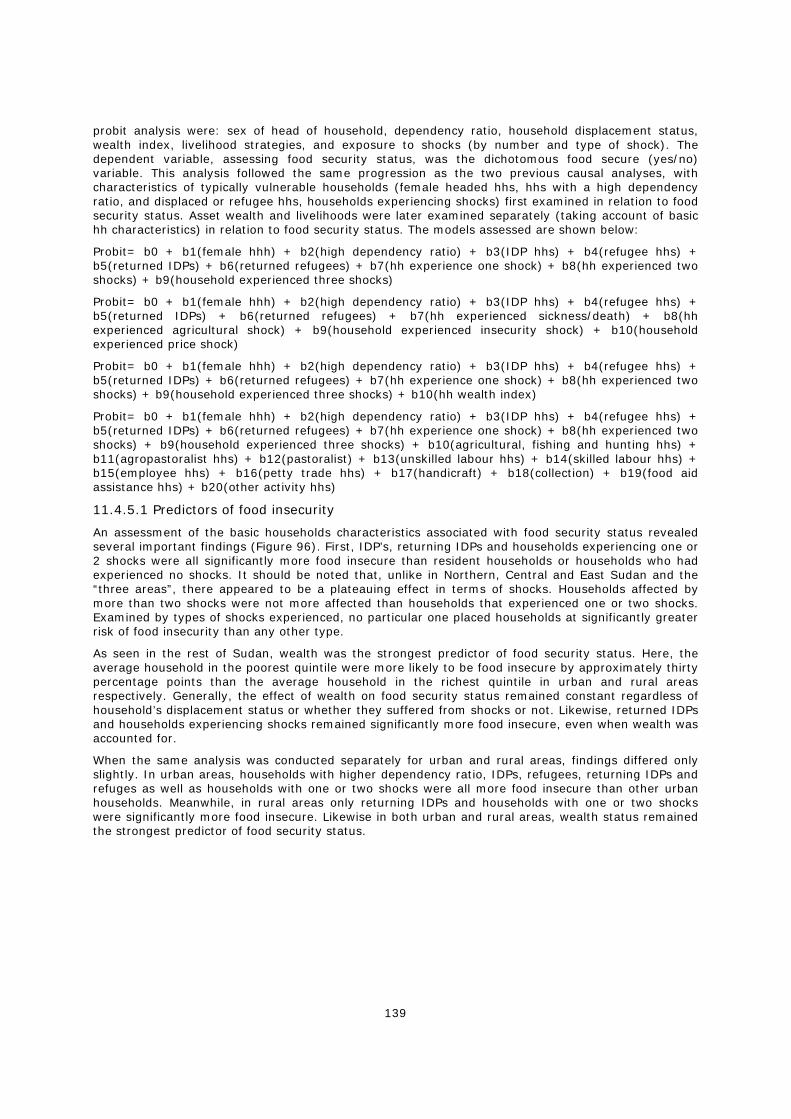
139
probit analysis were: sex of head of household, dependency ratio, household displacement status, wealth index, livelihood strategies, and exposure to shocks (by number and type of shock). The dependent variable, assessing food security status, was the dichotomous food secure (yes/no) variable. This analysis followed the same progression as the two previous causal analyses, with characteristics of typically vulnerable households (female headed hhs, hhs with a high dependency ratio, and displaced or refugee hhs, households experiencing shocks) first examined in relation to food security status. Asset wealth and livelihoods were later examined separately (taking account of basic hh characteristics) in relation to food security status. The models assessed are shown below:
Probit= b0 + b1(female hhh) + b2(high dependency ratio) + b3(IDP hhs) + b4(refugee hhs) + b5(returned IDPs) + b6(returned refugees) + b7(hh experience one shock) + b8(hh experienced two shocks) + b9(household experienced three shocks)
Probit= b0 + b1(female hhh) + b2(high dependency ratio) + b3(IDP hhs) + b4(refugee hhs) + b5(returned IDPs) + b6(returned refugees) + b7(hh experienced sickness/death) + b8(hh experienced agricultural shock) + b9(household experienced insecurity shock) + b10(household experienced price shock)
Probit= b0 + b1(female hhh) + b2(high dependency ratio) + b3(IDP hhs) + b4(refugee hhs) + b5(returned IDPs) + b6(returned refugees) + b7(hh experience one shock) + b8(hh experienced two shocks) + b9(household experienced three shocks) + b10(hh wealth index)
Probit= b0 + b1(female hhh) + b2(high dependency ratio) + b3(IDP hhs) + b4(refugee hhs) + b5(returned IDPs) + b6(returned refugees) + b7(hh experience one shock) + b8(hh experienced two shocks) + b9(household experienced three shocks) + b10(agricultural, fishing and hunting hhs) + b11(agropastoralist hhs) + b12(pastoralist) + b13(unskilled labour hhs) + b14(skilled labour hhs) + b15(employee hhs) + b16(petty trade hhs) + b17(handicraft) + b18(collection) + b19(food aid assistance hhs) + b20(other activity hhs)
11.4.5.1 Predictors of food insecurity
An assessment of the basic households characteristics associated with food security status revealed several important findings (Figure 96). First, IDP’s, returning IDPs and households experiencing one or 2 shocks were all significantly more food insecure than resident households or households who had experienced no shocks. It should be noted that, unlike in Northern, Central and East Sudan and the “three areas”, there appeared to be a plateauing effect in terms of shocks. Households affected by more than two shocks were not more affected than households that experienced one or two shocks. Examined by types of shocks experienced, no particular one placed households at significantly greater risk of food insecurity than any other type.
As seen in the rest of Sudan, wealth was the strongest predictor of food security status. Here, the average household in the poorest quintile were more likely to be food insecure by approximately thirty percentage points than the average household in the richest quintile in urban and rural areas respectively. Generally, the effect of wealth on food security status remained constant regardless of household’s displacement status or whether they suffered from shocks or not. Likewise, returned IDPs and households experiencing shocks remained significantly more food insecure, even when wealth was accounted for.
When the same analysis was conducted separately for urban and rural areas, findings differed only slightly. In urban areas, households with higher dependency ratio, IDPs, refugees, returning IDPs and refuges as well as households with one or two shocks were all more food insecure than other urban households. Meanwhile, in rural areas only returning IDPs and households with one or two shocks were significantly more food insecure. Likewise in both urban and rural areas, wealth status remained the strongest predictor of food security status.
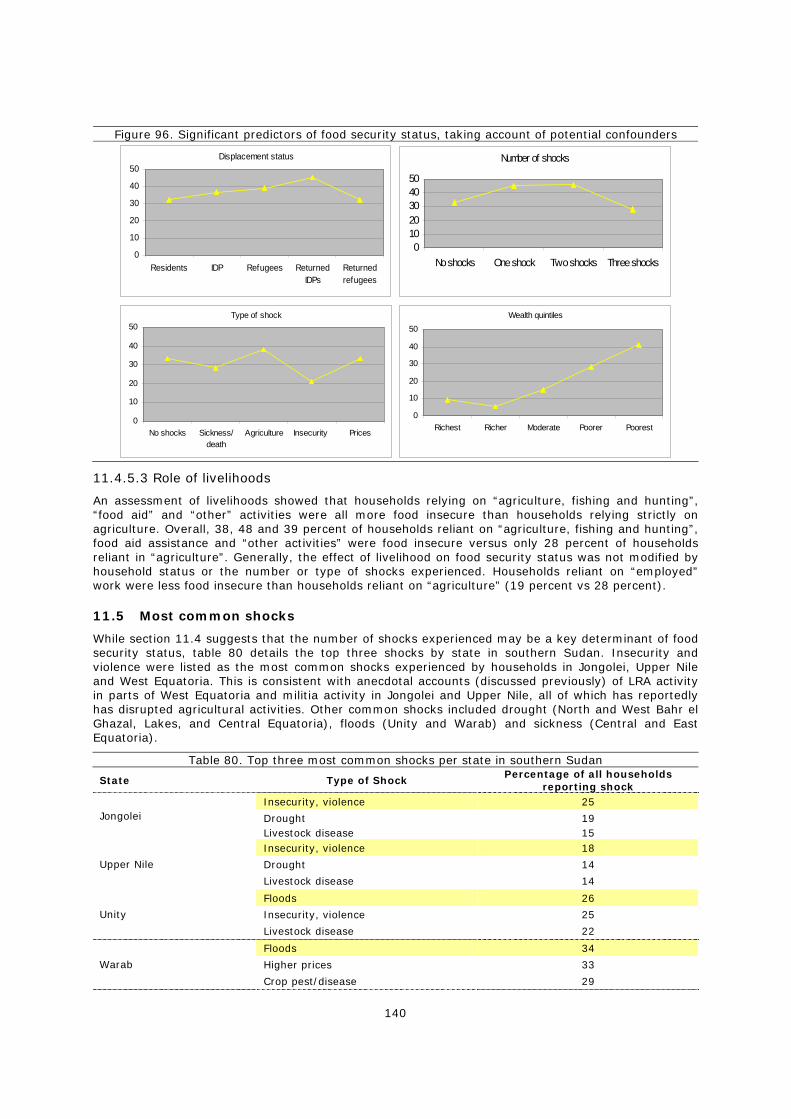
140
Figure 96. Significant predictors of food security status, taking account of potential confounders
11.4.5.3 Role of livelihoods
An assessment of livelihoods showed that households relying on “agriculture, fishing and hunting”, “food aid” and “other” activities were all more food insecure than households relying strictly on agriculture. Overall, 38, 48 and 39 percent of households reliant on “agriculture, fishing and hunting”, food aid assistance and “other activities” were food insecure versus only 28 percent of households reliant in “agriculture”. Generally, the effect of livelihood on food security status was not modified by household status or the number or type of shocks experienced. Households reliant on “employed” work were less food insecure than households reliant on “agriculture” (19 percent vs 28 percent).
11.5 Most common shocks
While section 11.4 suggests that the number of shocks experienced may be a key determinant of food security status, table 80 details the top three shocks by state in southern Sudan. Insecurity and violence were listed as the most common shocks experienced by households in Jongolei, Upper Nile and West Equatoria. This is consistent with anecdotal accounts (discussed previously) of LRA activity in parts of West Equatoria and militia activity in Jongolei and Upper Nile, all of which has reportedly has disrupted agricultural activities. Other common shocks included drought (North and West Bahr el Ghazal, Lakes, and Central Equatoria), floods (Unity and Warab) and sickness (Central and East Equatoria).
Table 80. Top three most common shocks per state in southern Sudan
State Type of Shock Percentage of all households
reporting shock Insecurity, violence 25
Drought 19 Jongolei
Livestock disease 15 Insecurity, violence 18
Drought 14 Upper Nile
Livestock disease 14
Floods 26
Insecurity, violence 25 Unity
Livestock disease 22
Floods 34
Higher prices 33 Warab
Crop pest/disease 29
Displacement status
0
10
20
30
40
50
Residents IDP Refugees ReturnedIDPs
Returnedrefugees
Number of shocks
01020304050
No shocks One shock Two shocks Three shocks
Type of shock
0
10
20
30
40
50
No shocks Sickness/death
Agriculture Insecurity Prices
Wealth quintiles
0
10
20
30
40
50
Richest Richer Moderate Poorer Poorest
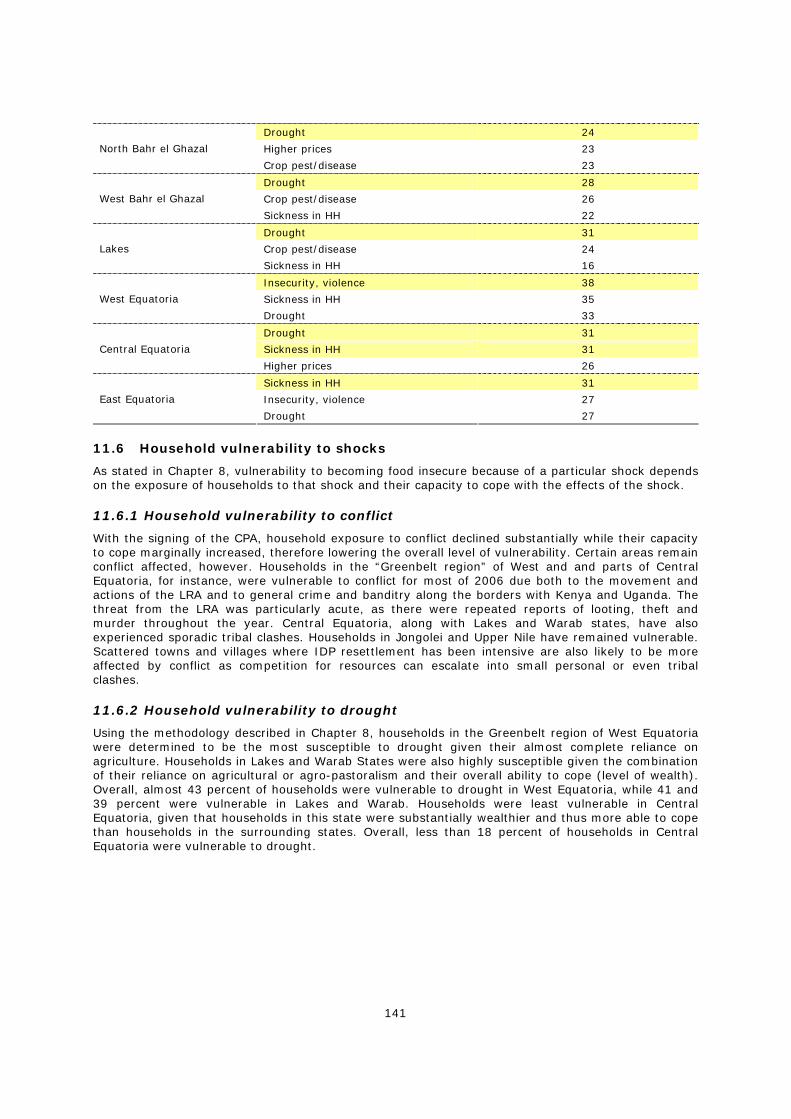
141
Drought 24
Higher prices 23 North Bahr el Ghazal
Crop pest/disease 23
Drought 28
Crop pest/disease 26 West Bahr el Ghazal
Sickness in HH 22
Drought 31
Crop pest/disease 24 Lakes
Sickness in HH 16
Insecurity, violence 38
Sickness in HH 35 West Equatoria
Drought 33
Drought 31
Sickness in HH 31 Central Equatoria
Higher prices 26
Sickness in HH 31
Insecurity, violence 27 East Equatoria
Drought 27
11.6 Household vulnerability to shocks
As stated in Chapter 8, vulnerability to becoming food insecure because of a particular shock depends on the exposure of households to that shock and their capacity to cope with the effects of the shock.
11.6.1 Household vulnerability to conflict
With the signing of the CPA, household exposure to conflict declined substantially while their capacity to cope marginally increased, therefore lowering the overall level of vulnerability. Certain areas remain conflict affected, however. Households in the “Greenbelt region” of West and and parts of Central Equatoria, for instance, were vulnerable to conflict for most of 2006 due both to the movement and actions of the LRA and to general crime and banditry along the borders with Kenya and Uganda. The threat from the LRA was particularly acute, as there were repeated reports of looting, theft and murder throughout the year. Central Equatoria, along with Lakes and Warab states, have also experienced sporadic tribal clashes. Households in Jongolei and Upper Nile have remained vulnerable. Scattered towns and villages where IDP resettlement has been intensive are also likely to be more affected by conflict as competition for resources can escalate into small personal or even tribal clashes.
11.6.2 Household vulnerability to drought
Using the methodology described in Chapter 8, households in the Greenbelt region of West Equatoria were determined to be the most susceptible to drought given their almost complete reliance on agriculture. Households in Lakes and Warab States were also highly susceptible given the combination of their reliance on agricultural or agro-pastoralism and their overall ability to cope (level of wealth). Overall, almost 43 percent of households were vulnerable to drought in West Equatoria, while 41 and 39 percent were vulnerable in Lakes and Warab. Households were least vulnerable in Central Equatoria, given that households in this state were substantially wealthier and thus more able to cope than households in the surrounding states. Overall, less than 18 percent of households in Central Equatoria were vulnerable to drought.
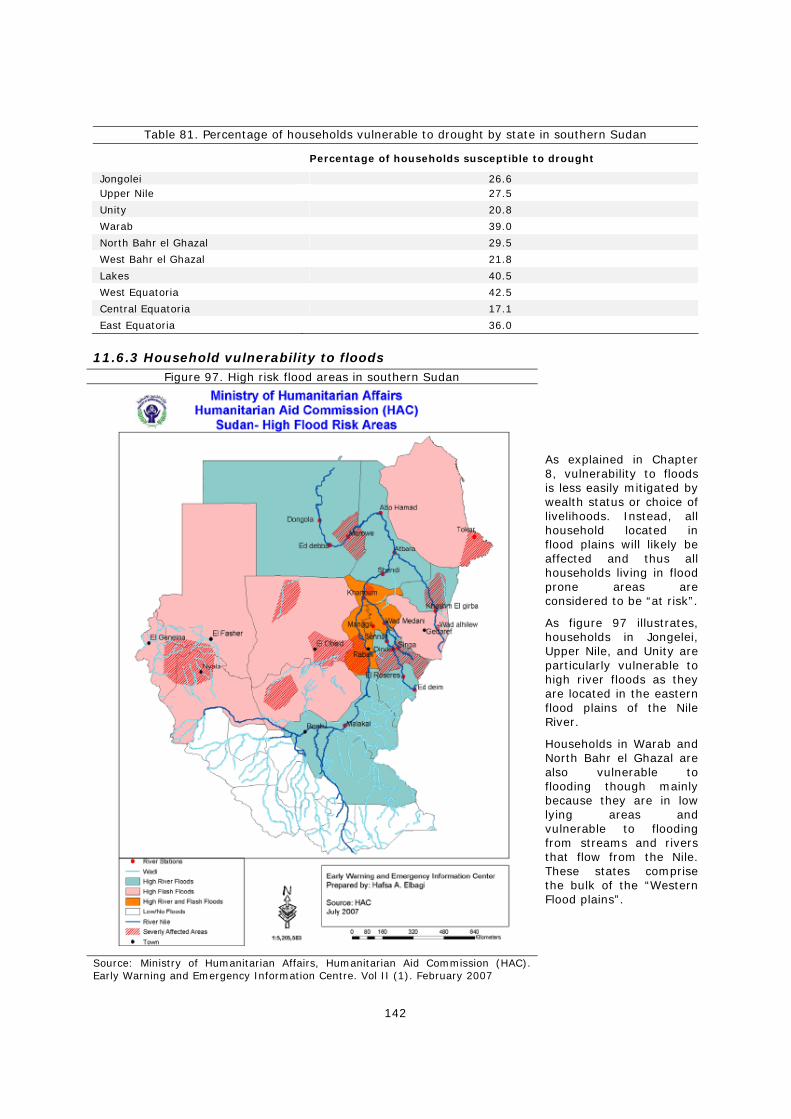
142
Table 81. Percentage of households vulnerable to drought by state in southern Sudan
Percentage of households susceptible to drought
Jongolei 26.6 Upper Nile 27.5
Unity 20.8
Warab 39.0
North Bahr el Ghazal 29.5
West Bahr el Ghazal 21.8
Lakes 40.5
West Equatoria 42.5
Central Equatoria 17.1
East Equatoria 36.0
11.6.3 Household vulnerability to floods Figure 97. High risk flood areas in southern Sudan
Source: Ministry of Humanitarian Affairs, Humanitarian Aid Commission (HAC). Early Warning and Emergency Information Centre. Vol II (1). February 2007
As explained in Chapter 8, vulnerability to floods is less easily mitigated by wealth status or choice of livelihoods. Instead, all household located in flood plains will likely be affected and thus all households living in flood prone areas are considered to be “at risk”.
As figure 97 illustrates, households in Jongelei, Upper Nile, and Unity are particularly vulnerable to high river floods as they are located in the eastern flood plains of the Nile River.
Households in Warab and North Bahr el Ghazal are also vulnerable to flooding though mainly because they are in low lying areas and vulnerable to flooding from streams and rivers that flow from the Nile. These states comprise the bulk of the “Western Flood plains”.
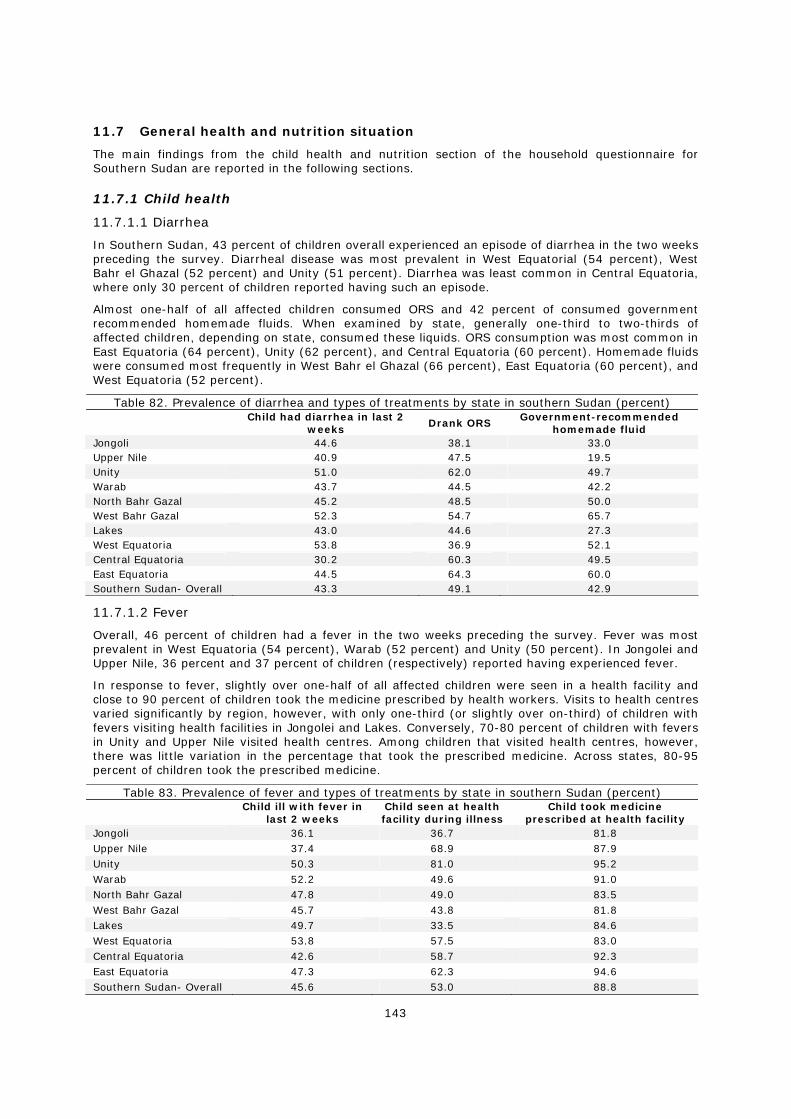
143
11.7 General health and nutrition situation
The main findings from the child health and nutrition section of the household questionnaire for Southern Sudan are reported in the following sections.
11.7.1 Child health
11.7.1.1 Diarrhea
In Southern Sudan, 43 percent of children overall experienced an episode of diarrhea in the two weeks preceding the survey. Diarrheal disease was most prevalent in West Equatorial (54 percent), West Bahr el Ghazal (52 percent) and Unity (51 percent). Diarrhea was least common in Central Equatoria, where only 30 percent of children reported having such an episode.
Almost one-half of all affected children consumed ORS and 42 percent of consumed government recommended homemade fluids. When examined by state, generally one-third to two-thirds of affected children, depending on state, consumed these liquids. ORS consumption was most common in East Equatoria (64 percent), Unity (62 percent), and Central Equatoria (60 percent). Homemade fluids were consumed most frequently in West Bahr el Ghazal (66 percent), East Equatoria (60 percent), and West Equatoria (52 percent).
Table 82. Prevalence of diarrhea and types of treatments by state in southern Sudan (percent)
Child had diarrhea in last 2 weeks
Drank ORS Government-recommended homemade fluid
Jongoli 44.6 38.1 33.0 Upper Nile 40.9 47.5 19.5 Unity 51.0 62.0 49.7 Warab 43.7 44.5 42.2 North Bahr Gazal 45.2 48.5 50.0 West Bahr Gazal 52.3 54.7 65.7 Lakes 43.0 44.6 27.3 West Equatoria 53.8 36.9 52.1 Central Equatoria 30.2 60.3 49.5 East Equatoria 44.5 64.3 60.0 Southern Sudan- Overall 43.3 49.1 42.9
11.7.1.2 Fever
Overall, 46 percent of children had a fever in the two weeks preceding the survey. Fever was most prevalent in West Equatoria (54 percent), Warab (52 percent) and Unity (50 percent). In Jongolei and Upper Nile, 36 percent and 37 percent of children (respectively) reported having experienced fever.
In response to fever, slightly over one-half of all affected children were seen in a health facility and close to 90 percent of children took the medicine prescribed by health workers. Visits to health centres varied significantly by region, however, with only one-third (or slightly over on-third) of children with fevers visiting health facilities in Jongolei and Lakes. Conversely, 70-80 percent of children with fevers in Unity and Upper Nile visited health centres. Among children that visited health centres, however, there was little variation in the percentage that took the prescribed medicine. Across states, 80-95 percent of children took the prescribed medicine.
Table 83. Prevalence of fever and types of treatments by state in southern Sudan (percent) Child ill with fever in
last 2 weeks Child seen at health facility during illness
Child took medicine prescribed at health facility
Jongoli 36.1 36.7 81.8 Upper Nile 37.4 68.9 87.9 Unity 50.3 81.0 95.2 Warab 52.2 49.6 91.0 North Bahr Gazal 47.8 49.0 83.5 West Bahr Gazal 45.7 43.8 81.8 Lakes 49.7 33.5 84.6 West Equatoria 53.8 57.5 83.0 Central Equatoria 42.6 58.7 92.3 East Equatoria 47.3 62.3 94.6 Southern Sudan- Overall 45.6 53.0 88.8
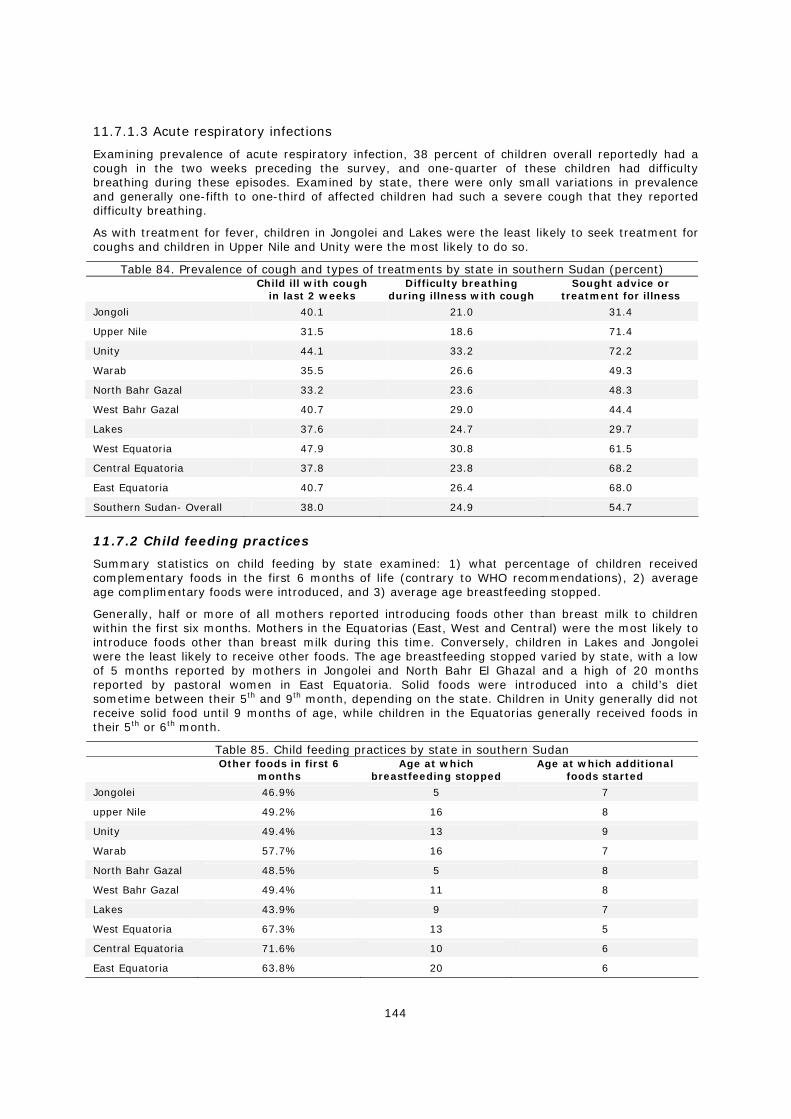
144
11.7.1.3 Acute respiratory infections
Examining prevalence of acute respiratory infection, 38 percent of children overall reportedly had a cough in the two weeks preceding the survey, and one-quarter of these children had difficulty breathing during these episodes. Examined by state, there were only small variations in prevalence and generally one-fifth to one-third of affected children had such a severe cough that they reported difficulty breathing.
As with treatment for fever, children in Jongolei and Lakes were the least likely to seek treatment for coughs and children in Upper Nile and Unity were the most likely to do so.
Table 84. Prevalence of cough and types of treatments by state in southern Sudan (percent) Child ill with cough
in last 2 weeks Difficulty breathing
during illness with cough Sought advice or
treatment for illness
Jongoli 40.1 21.0 31.4
Upper Nile 31.5 18.6 71.4
Unity 44.1 33.2 72.2
Warab 35.5 26.6 49.3
North Bahr Gazal 33.2 23.6 48.3
West Bahr Gazal 40.7 29.0 44.4
Lakes 37.6 24.7 29.7
West Equatoria 47.9 30.8 61.5
Central Equatoria 37.8 23.8 68.2
East Equatoria 40.7 26.4 68.0
Southern Sudan- Overall 38.0 24.9 54.7
11.7.2 Child feeding practices
Summary statistics on child feeding by state examined: 1) what percentage of children received complementary foods in the first 6 months of life (contrary to WHO recommendations), 2) average age complimentary foods were introduced, and 3) average age breastfeeding stopped.
Generally, half or more of all mothers reported introducing foods other than breast milk to children within the first six months. Mothers in the Equatorias (East, West and Central) were the most likely to introduce foods other than breast milk during this time. Conversely, children in Lakes and Jongolei were the least likely to receive other foods. The age breastfeeding stopped varied by state, with a low of 5 months reported by mothers in Jongolei and North Bahr El Ghazal and a high of 20 months reported by pastoral women in East Equatoria. Solid foods were introduced into a child’s diet sometime between their 5th and 9th month, depending on the state. Children in Unity generally did not receive solid food until 9 months of age, while children in the Equatorias generally received foods in their 5th or 6th month.
Table 85. Child feeding practices by state in southern Sudan
Other foods in first 6 months
Age at which breastfeeding stopped
Age at which additional foods started
Jongolei 46.9% 5 7
upper Nile 49.2% 16 8
Unity 49.4% 13 9
Warab 57.7% 16 7
North Bahr Gazal 48.5% 5 8
West Bahr Gazal 49.4% 11 8
Lakes 43.9% 9 7
West Equatoria 67.3% 13 5
Central Equatoria 71.6% 10 6
East Equatoria 63.8% 20 6
145
Southern Sudan- Overall
55.4% 11 7
11.7.3 Children’s nutritional status
While the anthropometric data collected as a part of SHHS was not included in this analysis, it was possible to examine general wasting patterns in parts of southern Sudan using secondary data sources. Using Global Acute Malnutrition (GAM), Severe Acute Malnutrition (SAM) and Under-5 mortality (U5 MR) rates gathered in many localized surveys from 2000 to the present it was possible to aggregate available surveys by month to get a rough estimate of the annual patterns in each indicator by general area (in this case, traditional livelihood zones). Data used was compiled (and a similar analysis was conducted) by Care - South Sudan. Adequate data was available for this analysis to be conducted for the following traditional livelihood zones; 1) the Nile and Sobat River Zone/ Eastern flood plains and 2) the Western flood plains.
Figure 98. Annual fluctuations in GAM, SAM, and U5 mortality rates in the Nile and Sobat Rivers/ Eastern flood plains zones
0
5
10
15
20
25
30
Jan Feb Mar Apr May Jun Jul Aug Sep Oct Nov Dec
U 5CMR GAM SAM
Figure 99. Annual fluctuations in GAM, SAM, and U5 mortality rates in the Western flood plains zone
0
5
10
15
20
25
30
Jan Feb Mar Apr May Jun Jul Aug Sep Oct Nov Dec
U 5CMR GAM SAM
Figures 98 and 99 are an adaptation of the analysis conducted by Care South Sudan46. While these figures should be interpreted carefully (given their inherent limitations—see footnote), they do, given the large number of surveys conducted, likely depict a relatively accurate picture of annual nutritional
46 Care southern Sudan. South Sudan Anthropometric Surveys 1998 to 2006: Trends based on Conflict and Immediate Post Conflict Data.
146
fluctuations, providing some interesting insights into what may be driving child malnutrition in southern Sudan and whether food aid has a role in any potential response47. The first and most basic point, illustrated by these figures, is that children in the Nile and Sobat River Zone/ Eastern flood plains zone appear (across years) to have higher GAM, SAM, and U5MR rates throughout the year than children in the Western flood plains. The reasons for this are unclear, especially given that food security, disease rates (in terms of diarrhea, ARI and fevers), access to health care, and child feeding patters are similar or—if anything—generally better in the states that comprise the Nile and Sobat/ Eastern flood plains region. Clarifying why these children consistently have higher malnutrition rates (and much higher mortality rates) than their counterparts in the western flood plains is crucial in determining appropriate interventions.
Secondly, this trend analysis confirms what has been seen repeatedly in previous studies-- malnutrition rates (GAM and SAM) tend to peak at the start of the rainy (and hunger) season. While this has traditionally been attributed to deteriorating (drinking) water sources (as opposed to food related causes), assessing these patterns according to other well established patterns in terms of disease, livelihoods, etc provide a more robust picture of the converging nutritional pressures on children during this period. The end of the dry season/ the beginning of the rainy season is typically a time when: 1) food supplies are becoming strained (with households beginning to rely on less preferred food), 2) cattle are away from the homestead, typically resulting in milk shortages, 3) meningitis outbreaks are common, 4) households being forced to rely on the less safe sources of drinking water, and 5) vector borne and infectious diseases (esp diarrhea) are more prevalent.
Each of these factors tend to work synergistically to affect child malnutrition. As with the other regions of Sudan surveyed, when the dry season progresses, meningitis outbreaks become common and water sources (be they wells or surface water) tend to dry up forcing households to rely on less desired water sources that are more easily contaminated by animal or human faeces. Increased incidence of infectious diseases, initiates a cycle, with illness begetting malnutrition and malnutrition increasing vulnerability to disease. The start of the rains exacerbates the problem by further facilitating the contamination of available water. The arrival of the intertropical convergence zone (ITCZ) which initiates the rains is associated with a bloom in vector borne and infectious diseases. Taking all of this into account, it appears likely that disease burdens play a large role in this sudden deterioration. Figure 100 appears to support this hypothesis, as mortality rates in the Nile and Sobat River/ Eastern flood plains mortality rates peak before either GAM or SAM.
Typically, the role of food in this rapid nutritional deterioration has been largely overlooked. As data from the SHHS indicated, however, milk availability is likely an important determinant of child nutritional status. In the pastoral areas of southern Sudan, breastmilk and other milks are a significant component of a child’s diet even at two years of age. As figure 100 indicates, over one-quarter of children two years of age received nothing but breastmilk or animal milks in the 24 hour period preceding the survey. While such a heavy reliance on milk (and inadequate consumption of solid foods) might go a long way in explaining some of the chronically high GAM rates observed throughout the year (given the association between milk consumption and linear growth), an acute shortage of milk in April and May could explain at least part of the rapid weight loss seen during this period.
The third finding is an observed second peak in malnutrition rates that occurs in each of these regions around September. This second spike in malnutrition rates is important for two reasons. First, it coincides with the end of the hunger season. Thus, contrary to the prevailing wisdom in southern Sudan (that malnutrition is largely a disease and water issue), the timing of this peak appears to suggest that food shortages may actually play a role in high malnutrition at certain times of year. This is important from a WFP perspective, as it might indicate an expanded role for food aid in any comprehensive response.
47 Limitations include: 1) surveys within and across months are not necessarily from the same year and likely do not cover the same areas, (and they are not representative of the livelihood zones in general); 2) sample sizes in most cases are quite small (representative of only a small geographic or administrative area) resulting in very large confidence intervals for GAM, SAM, and U5CMR; 3) surveys are conducted by different organizations which likely means that methods and generally quality differ (and for purposes of this analysis differences in methods and quality were not taken into account); 4) GAM, SAM and U5 MR shown are likely the rates for the most vulnerable populations (as ngo’s are likely to focus on typically more vulnerable areas); and 5) some of these surveys were conducted during the civil war and may therefore the nutritional situation may have been due to nearby insecurity or fighting (vs what would be considered typical fluctuations in nutritional status).
147
The second item of significance emerging from this is the role of malaria in childhood malnutrition rates. Given that this peak is at the height of the malarial season (September) and the fact that deteriorating nutritional status is most obvious in areas where childhood fevers are more common (according to SHHS), malaria does appear to be a major factor in this deterioration. Differentiating malaria’s impact versus that of food shortages, however, is not easy given the complicated relationship between child nutrition and malaria. First, some (but not all) emerging evidence is suggestive of a synergistic relationship between malaria and malnutrition, with malaria treatments and prophylactic measures (ITN bednets) positively correlated with growth in children (in Gambia, Nigeria, and Kenya) and malnutrition correlated with higher susceptibility to malaria48,49,50,51,52. Some of this evidence indicates that malaria is more likely to affect the nutritional status of younger rather than older children, due to immunity gathered over time53. Taken together, however, this evidence suggests that any approach to address deteriorating child nutritional status during this period will be most effective if interventions have both malaria and nutrition components.
11.7.4 Childhood mortality
One of the more interesting findings to emerge in the above assessment is the difference in baseline under 5 mortality rates between regions, with rates consistently higher in the Nile and Sobat River/ Eastern flood plains than in the Western flood plains. As Figure 101 illustrates, U5 MRs hover between 3 and 5 (per 10000 per day) for most of the year in the Nile and Sobat River and Eastern flood plains, while rates remain between 1 and 2 in the Western flood plains. This difference is perplexing when one considers that disease rates, food consumption patterns and access to health care are all similar between the two regions (with children even slightly better off in the Nile and Sobat River/Eastern flood plains)54. The only discernible difference between the two regions is in baseline malnutrition rates, with children in the Nile and Sobat River/ Eastern flood plains on average 5-10 percent more wasted than children in the Western flood plains. This suggests that a baseline wasting rate of 25 percent coupled with high morbidity is associated with excess mortality rates (above the emergency threshold) while 15 percent wasting (and similar-or even higher-morbidity rates) is not. This might indicate a need to re-calibrate (upwards) the traditional threshold (of 15 percent wasting) for an emergency situation to a level more consistent with excess mortality in this region. Before doing so, however, further, more detailed research on the appropriateness of this emergency threshold would need to be conducted. Finally, these findings also suggest that childhood mortality rates could be lowered in the Nile and Sobat River/ Eastern flood plains, by nutritional interventions aimed at lowering malnutrition rates to levels seen in the Western flood plains (by 5-10 percentage points).
11.7.5 Role of food aid in addressing malnutrition
Examining fluctuations in GAM and SAM rates by the number of WFP food aid beneficiaries by month, it is possible to assess both the timeliness of food aid deliveries and whether food aid may be having an impact. It is important to acknowledge up front that this analysis has some serious limitations. First, this assessment only examines food aid deliveries in one year (2006) while annual nutritional patterns are compiled from data from 2003 to 2006. A more complete assessment would examine food aid patterns for the same time period. Secondly, as it was not possible to disaggregate food aid
48 McGregor IA, Gilles HM, Walters JH, Davies AH, Pearson FA. Effects of heavy and repleted malarial infections on Gambian infants and children. Effects of erythrocyte parasitization. BMJ 1956;2:686-92.
49 Bradley-Moore AM, Greenwood BM, Bradley AK, Kirkwood BR, Gilles HM. Malaria chemoprophylaxis with chloroquine in young Nigerian children. III. Its effect on nutrition Ann Trop Med Parasitol 1985;79:575-84.
50 Snow RW, Molyneux CS, Njeru EK, et al. The effects of malaria control on nutritional status in infancy. Acta Trop 1997;65:1-10.
51 Ter Kuile F, Terlouw DJ, Kariuki S, et al. Impact of permethrin-treated bed nets on malaria, anemia, and growth in infants in an area of intense perennial malaria transmission in western Kenya. Am J Trop Med Hyg 2003;68:68-77.
52 Genton B, Al-Yaman F, Ginny M, Taraika J, Alpers MP. Relation of anthropometry to malaria morbidity and immunity in Papua New Guinean children. Am J Clin Nutr 1998;68:734-41.
53 Friedman JF, Phillips-Howard PA, Hawley W, et al. Impact of permethrin-treated bed nets on growth, nutritional status, and body composition of primary school children in Western Kenya. Am J Trop Med Hyg 2003;68:78-85.
54 According to data from collected during the SHHS
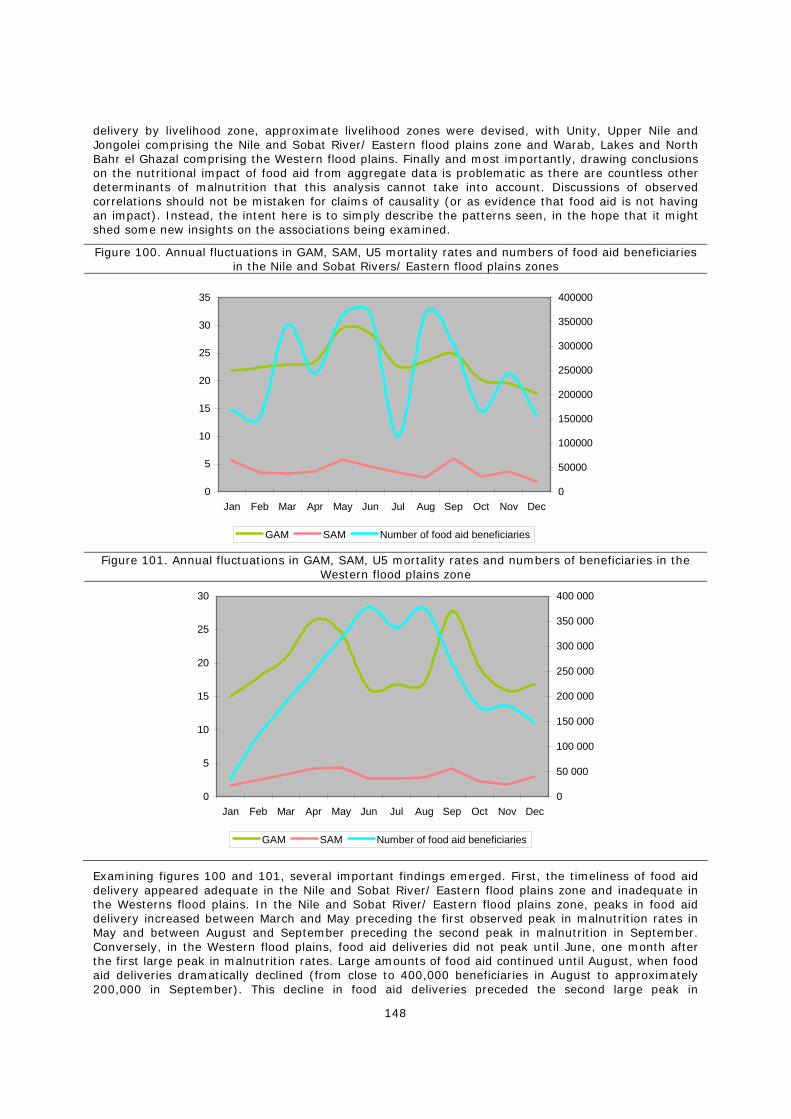
148
delivery by livelihood zone, approximate livelihood zones were devised, with Unity, Upper Nile and Jongolei comprising the Nile and Sobat River/ Eastern flood plains zone and Warab, Lakes and North Bahr el Ghazal comprising the Western flood plains. Finally and most importantly, drawing conclusions on the nutritional impact of food aid from aggregate data is problematic as there are countless other determinants of malnutrition that this analysis cannot take into account. Discussions of observed correlations should not be mistaken for claims of causality (or as evidence that food aid is not having an impact). Instead, the intent here is to simply describe the patterns seen, in the hope that it might shed some new insights on the associations being examined.
Figure 100. Annual fluctuations in GAM, SAM, U5 mortality rates and numbers of food aid beneficiaries in the Nile and Sobat Rivers/ Eastern flood plains zones
0
5
10
15
20
25
30
35
Jan Feb Mar Apr May Jun Jul Aug Sep Oct Nov Dec0
50000
100000
150000
200000
250000
300000
350000
400000
GAM SAM Number of food aid beneficiaries
Figure 101. Annual fluctuations in GAM, SAM, U5 mortality rates and numbers of beneficiaries in the Western flood plains zone
0
5
10
15
20
25
30
Jan Feb Mar Apr May Jun Jul Aug Sep Oct Nov Dec0
50 000
100 000
150 000
200 000
250 000
300 000
350 000
400 000
GAM SAM Number of food aid beneficiaries
Examining figures 100 and 101, several important findings emerged. First, the timeliness of food aid delivery appeared adequate in the Nile and Sobat River/ Eastern flood plains zone and inadequate in the Westerns flood plains. In the Nile and Sobat River/ Eastern flood plains zone, peaks in food aid delivery increased between March and May preceding the first observed peak in malnutrition rates in May and between August and September preceding the second peak in malnutrition in September. Conversely, in the Western flood plains, food aid deliveries did not peak until June, one month after the first large peak in malnutrition rates. Large amounts of food aid continued until August, when food aid deliveries dramatically declined (from close to 400,000 beneficiaries in August to approximately 200,000 in September). This decline in food aid deliveries preceded the second large peak in
149
malnutrition rates in September. Thus, to reach households and children when they are most vulnerable, food aid deliveries in the Western flood plains need to peak one to two months earlier and need to last one to two months longer.
The second important point here is that increases in food aid appear to be roughly correlated with declining child malnutrition rates55. Specifically, in the Nile and Sobat River/ Eastern flood plains, increases in the numbers of beneficiaries in both May and September are followed by declining child malnutrition rates. In the Western flood plains, this correlation is even more noticeable. Here, increases in food aid (between June and August) coincide with the lowest observed child malnutrition rates (of 15 percent). Likewise, sharp declines in food aid deliveries (from close to 400,000 to approximately 200,000 beneficiaries) in September coincide with sharp increases in child malnutrition rates (from 15 percent to about 27 percent). Also, a slight lowering in the number of beneficiaries, which occurs in July, coincides with a slight increase in malnutrition rates at the same time. One may question whether it would be possible for food aid deliveries to have such an immediate impact on child malnutrition rates. The answer is clearly “yes”. Wasting prevalence (low weight for height) is known as a very responsive indicator to changes in disease or diet patterns, which is illustrated nicely by the 5-10 percent increases in wasting prevalence which occur from one month to the next at certain times throughout the year.
11.7.6 Micronutrient deficiencies
11.7.6.1 Iodine deficiency disorder (IDD)
As discussed in Chapter 7, the percentage of households with properly iodized salt was highest in southern Sudan because of the trade with Kenya and Uganda. When examined by state (as Table 86 shows) households in the states near or bordering Kenya (Central Equatoria, East Equatoria, and Lakes) were the most likely to have properly iodized salt. In East Equatoria and Lakes, over 50 percent of households had iodized salt, while in Central Equatoria, almost 80 percent had properly iodized salt. Households in States where market access is difficult or where markets are likely not to have as many Kenyan and Ugandan goods (like Jongolei, Unity, Warab, and Upper Nile) were least likely to properly iodized salt at less then 15 percent.
As expected, the overwhelming majority of households accessed salt from marketplaces with fewer than one-fifth relying on food aid or indigenous sources. Reliance on food aid was highest in West Bahr el Ghazal. Here, 17.8 percent of households relied on food aid for salt.
Table 86. Percentage of households with properly iodized salt by state in southern Sudan (percent)
Not iodized 0 PPM (no colour)
Less than 15 PPM (weak colour)
15 PPM or more (strong colour)
Jongolei 73.9 19.7 6.4 Upper Nile 12.6 72.8 14.6 Unity 41.7 47.5 10.8 Warab 22.7 65.6 11.7 North Bahr Al_Gazal 60.3 18.6 21.2 West Bahr Al_Gazal 42.3 26.4 31.4 Lakes 15.4 25.3 59.3 West Equatoria 18.6 67.9 13.6 Central Equatoria 3.1 18.0 78.9 East Equatoria 18.9 30.6 50.5 Southern Sudan- Overall 28.3 35.2 36.5
55 Again, discussions of observed correlations should not be mistaken for claims of causality.
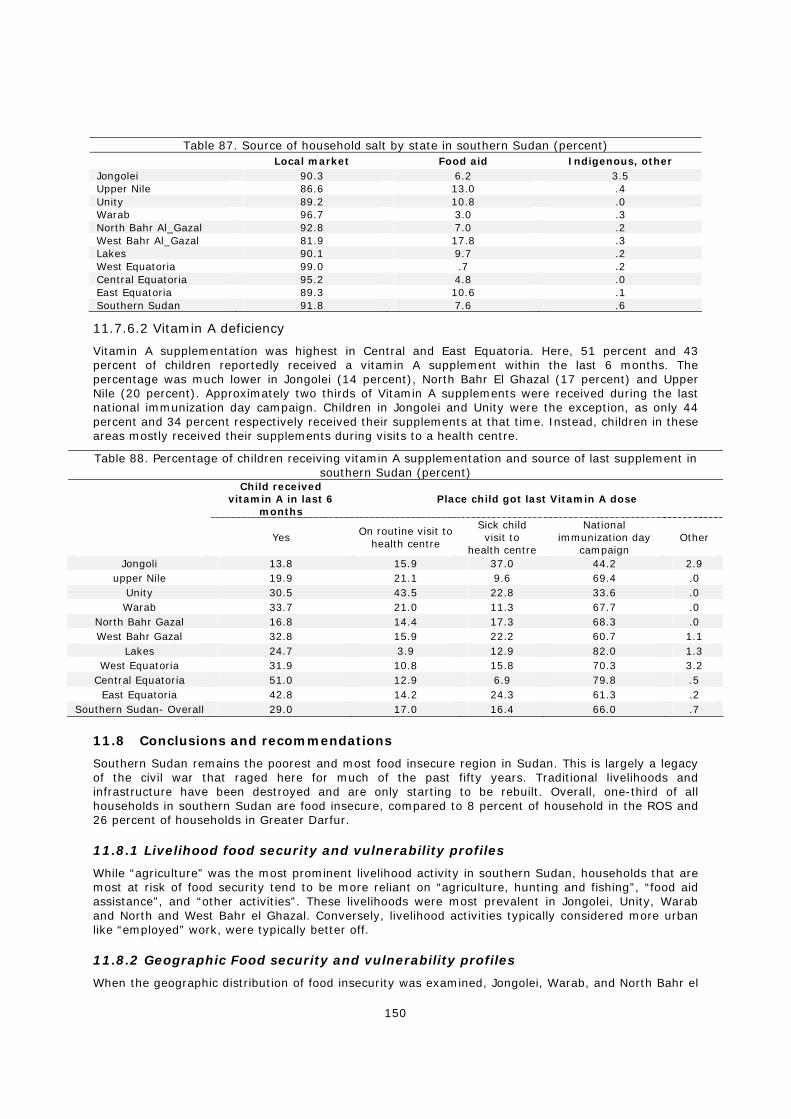
150
Table 87. Source of household salt by state in southern Sudan (percent)
Local market Food aid Indigenous, other Jongolei 90.3 6.2 3.5 Upper Nile 86.6 13.0 .4 Unity 89.2 10.8 .0 Warab 96.7 3.0 .3 North Bahr Al_Gazal 92.8 7.0 .2 West Bahr Al_Gazal 81.9 17.8 .3 Lakes 90.1 9.7 .2 West Equatoria 99.0 .7 .2 Central Equatoria 95.2 4.8 .0 East Equatoria 89.3 10.6 .1 Southern Sudan 91.8 7.6 .6
11.7.6.2 Vitamin A deficiency
Vitamin A supplementation was highest in Central and East Equatoria. Here, 51 percent and 43 percent of children reportedly received a vitamin A supplement within the last 6 months. The percentage was much lower in Jongolei (14 percent), North Bahr El Ghazal (17 percent) and Upper Nile (20 percent). Approximately two thirds of Vitamin A supplements were received during the last national immunization day campaign. Children in Jongolei and Unity were the exception, as only 44 percent and 34 percent respectively received their supplements at that time. Instead, children in these areas mostly received their supplements during visits to a health centre.
Table 88. Percentage of children receiving vitamin A supplementation and source of last supplement in southern Sudan (percent)
Child received
vitamin A in last 6 months
Place child got last Vitamin A dose
Yes On routine visit to
health centre
Sick child visit to
health centre
National immunization day
campaign Other
Jongoli 13.8 15.9 37.0 44.2 2.9 upper Nile 19.9 21.1 9.6 69.4 .0
Unity 30.5 43.5 22.8 33.6 .0 Warab 33.7 21.0 11.3 67.7 .0
North Bahr Gazal 16.8 14.4 17.3 68.3 .0 West Bahr Gazal 32.8 15.9 22.2 60.7 1.1
Lakes 24.7 3.9 12.9 82.0 1.3 West Equatoria 31.9 10.8 15.8 70.3 3.2
Central Equatoria 51.0 12.9 6.9 79.8 .5 East Equatoria 42.8 14.2 24.3 61.3 .2
Southern Sudan- Overall 29.0 17.0 16.4 66.0 .7
11.8 Conclusions and recommendations
Southern Sudan remains the poorest and most food insecure region in Sudan. This is largely a legacy of the civil war that raged here for much of the past fifty years. Traditional livelihoods and infrastructure have been destroyed and are only starting to be rebuilt. Overall, one-third of all households in southern Sudan are food insecure, compared to 8 percent of household in the ROS and 26 percent of households in Greater Darfur.
11.8.1 Livelihood food security and vulnerability profiles
While “agriculture” was the most prominent livelihood activity in southern Sudan, households that are most at risk of food security tend to be more reliant on “agriculture, hunting and fishing”, “food aid assistance”, and “other activities”. These livelihoods were most prevalent in Jongolei, Unity, Warab and North and West Bahr el Ghazal. Conversely, livelihood activities typically considered more urban like “employed” work, were typically better off.
11.8.2 Geographic Food security and vulnerability profiles
When the geographic distribution of food insecurity was examined, Jongolei, Warab, and North Bahr el
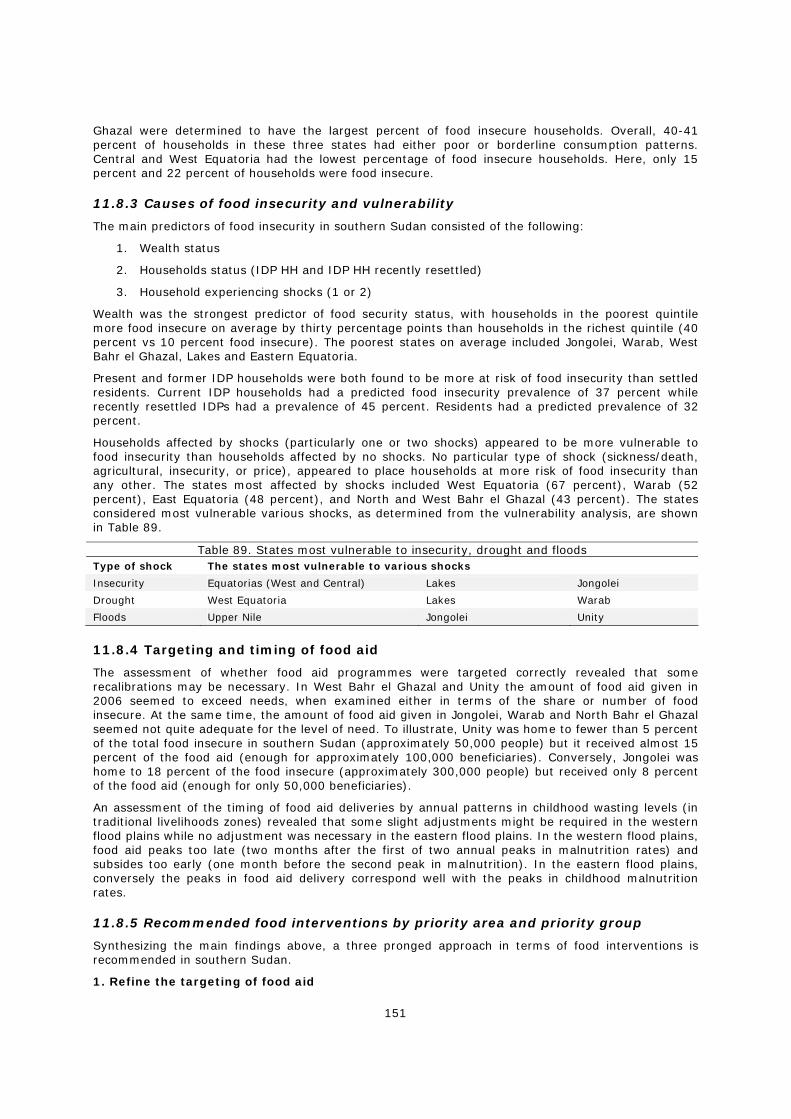
151
Ghazal were determined to have the largest percent of food insecure households. Overall, 40-41 percent of households in these three states had either poor or borderline consumption patterns. Central and West Equatoria had the lowest percentage of food insecure households. Here, only 15 percent and 22 percent of households were food insecure.
11.8.3 Causes of food insecurity and vulnerability
The main predictors of food insecurity in southern Sudan consisted of the following:
1. Wealth status
2. Households status (IDP HH and IDP HH recently resettled)
3. Household experiencing shocks (1 or 2)
Wealth was the strongest predictor of food security status, with households in the poorest quintile more food insecure on average by thirty percentage points than households in the richest quintile (40 percent vs 10 percent food insecure). The poorest states on average included Jongolei, Warab, West Bahr el Ghazal, Lakes and Eastern Equatoria.
Present and former IDP households were both found to be more at risk of food insecurity than settled residents. Current IDP households had a predicted food insecurity prevalence of 37 percent while recently resettled IDPs had a prevalence of 45 percent. Residents had a predicted prevalence of 32 percent.
Households affected by shocks (particularly one or two shocks) appeared to be more vulnerable to food insecurity than households affected by no shocks. No particular type of shock (sickness/death, agricultural, insecurity, or price), appeared to place households at more risk of food insecurity than any other. The states most affected by shocks included West Equatoria (67 percent), Warab (52 percent), East Equatoria (48 percent), and North and West Bahr el Ghazal (43 percent). The states considered most vulnerable various shocks, as determined from the vulnerability analysis, are shown in Table 89.
Table 89. States most vulnerable to insecurity, drought and floods Type of shock The states most vulnerable to various shocks
Insecurity Equatorias (West and Central) Lakes Jongolei
Drought West Equatoria Lakes Warab
Floods Upper Nile Jongolei Unity
11.8.4 Targeting and timing of food aid
The assessment of whether food aid programmes were targeted correctly revealed that some recalibrations may be necessary. In West Bahr el Ghazal and Unity the amount of food aid given in 2006 seemed to exceed needs, when examined either in terms of the share or number of food insecure. At the same time, the amount of food aid given in Jongolei, Warab and North Bahr el Ghazal seemed not quite adequate for the level of need. To illustrate, Unity was home to fewer than 5 percent of the total food insecure in southern Sudan (approximately 50,000 people) but it received almost 15 percent of the food aid (enough for approximately 100,000 beneficiaries). Conversely, Jongolei was home to 18 percent of the food insecure (approximately 300,000 people) but received only 8 percent of the food aid (enough for only 50,000 beneficiaries).
An assessment of the timing of food aid deliveries by annual patterns in childhood wasting levels (in traditional livelihoods zones) revealed that some slight adjustments might be required in the western flood plains while no adjustment was necessary in the eastern flood plains. In the western flood plains, food aid peaks too late (two months after the first of two annual peaks in malnutrition rates) and subsides too early (one month before the second peak in malnutrition). In the eastern flood plains, conversely the peaks in food aid delivery correspond well with the peaks in childhood malnutrition rates.
11.8.5 Recommended food interventions by priority area and priority group
Synthesizing the main findings above, a three pronged approach in terms of food interventions is recommended in southern Sudan.
1. Refine the targeting of food aid
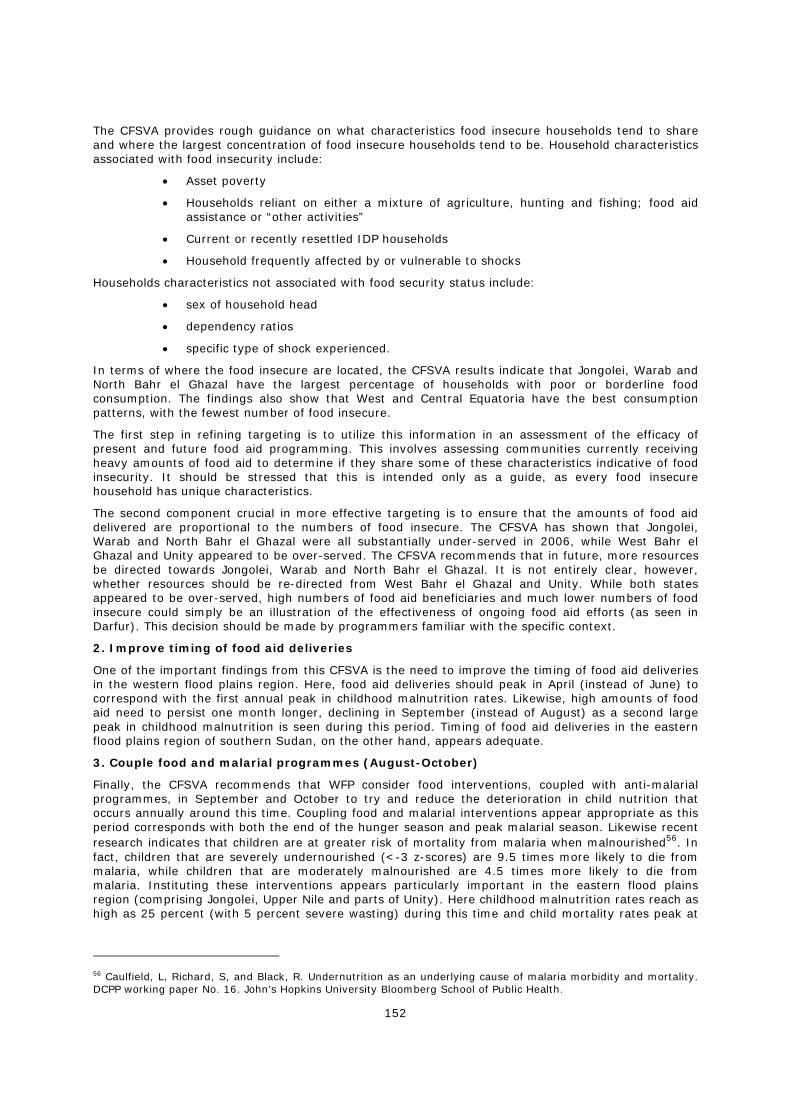
152
The CFSVA provides rough guidance on what characteristics food insecure households tend to share and where the largest concentration of food insecure households tend to be. Household characteristics associated with food insecurity include:
• Asset poverty
• Households reliant on either a mixture of agriculture, hunting and fishing; food aid assistance or “other activities”
• Current or recently resettled IDP households
• Household frequently affected by or vulnerable to shocks
Households characteristics not associated with food security status include:
• sex of household head
• dependency ratios
• specific type of shock experienced.
In terms of where the food insecure are located, the CFSVA results indicate that Jongolei, Warab and North Bahr el Ghazal have the largest percentage of households with poor or borderline food consumption. The findings also show that West and Central Equatoria have the best consumption patterns, with the fewest number of food insecure.
The first step in refining targeting is to utilize this information in an assessment of the efficacy of present and future food aid programming. This involves assessing communities currently receiving heavy amounts of food aid to determine if they share some of these characteristics indicative of food insecurity. It should be stressed that this is intended only as a guide, as every food insecure household has unique characteristics.
The second component crucial in more effective targeting is to ensure that the amounts of food aid delivered are proportional to the numbers of food insecure. The CFSVA has shown that Jongolei, Warab and North Bahr el Ghazal were all substantially under-served in 2006, while West Bahr el Ghazal and Unity appeared to be over-served. The CFSVA recommends that in future, more resources be directed towards Jongolei, Warab and North Bahr el Ghazal. It is not entirely clear, however, whether resources should be re-directed from West Bahr el Ghazal and Unity. While both states appeared to be over-served, high numbers of food aid beneficiaries and much lower numbers of food insecure could simply be an illustration of the effectiveness of ongoing food aid efforts (as seen in Darfur). This decision should be made by programmers familiar with the specific context.
2. Improve timing of food aid deliveries
One of the important findings from this CFSVA is the need to improve the timing of food aid deliveries in the western flood plains region. Here, food aid deliveries should peak in April (instead of June) to correspond with the first annual peak in childhood malnutrition rates. Likewise, high amounts of food aid need to persist one month longer, declining in September (instead of August) as a second large peak in childhood malnutrition is seen during this period. Timing of food aid deliveries in the eastern flood plains region of southern Sudan, on the other hand, appears adequate.
3. Couple food and malarial programmes (August-October)
Finally, the CFSVA recommends that WFP consider food interventions, coupled with anti-malarial programmes, in September and October to try and reduce the deterioration in child nutrition that occurs annually around this time. Coupling food and malarial interventions appear appropriate as this period corresponds with both the end of the hunger season and peak malarial season. Likewise recent research indicates that children are at greater risk of mortality from malaria when malnourished56. In fact, children that are severely undernourished (<-3 z-scores) are 9.5 times more likely to die from malaria, while children that are moderately malnourished are 4.5 times more likely to die from malaria. Instituting these interventions appears particularly important in the eastern flood plains region (comprising Jongolei, Upper Nile and parts of Unity). Here childhood malnutrition rates reach as high as 25 percent (with 5 percent severe wasting) during this time and child mortality rates peak at
56 Caulfield, L, Richard, S, and Black, R. Undernutrition as an underlying cause of malaria morbidity and mortality. DCPP working paper No. 16. John’s Hopkins University Bloomberg School of Public Health.
153
5/10,000/day. Here, the initiation of malarial and nutrition programmes might substantially impact child mortality.
11.8.6 Recommended non-food interventions by priority area and priority group
Findings from the CFSVA also provide some guidance on what non food interventions or activities should be prioritized. These are discussed below.
Child health and nutrition priorities/ interventions
1. Study causes of childhood malnutrition.
As for the ROS region, the CFSVA recommends that WFP invest in analytical studies examining the causes of malnutrition in southern Sudan. Again, while the CFSVA recognizes that WFP’s mission is not research oriented, better understanding the origins of malnutrition would facilitate decision-making within WFP on how to proceed programmatically. This is important in the context of southern Sudan, as WFP’s role in the region in the post-conflict phase has become increasingly uncertain.
The need for food aid has been questioned, based on the assumption that the annual deterioration in child nutrition in April and May is not food related. Rather, conventional wisdom contends that this deterioration is due primarily to worsening water sources and disease. This assumption, while reasonable, has not been examined analytically and it serves to discourage food aid programming at a time when it might make a difference. The findings from this study are not robust enough to determine if water and disease are the problem during this period or whether there are food components as well.
Another related challenge is the heavy focus on the first peak in childhood malnutrition rates, largely at the expense of the second peak in malnutrition rates occurring annually in September and October. This has shaped the conventional wisdom discussed above that food aid is not the most appropriate intervention. However, since this second peak occurs at the end of the hunger season, this deterioration is likely due at least in part to food pressures. Therefore, food aid may be a crucial component of any comprehensive response. To determine if this is the case, the primary nutritional pressures on children during September and October must be determined.
Finally, given the perpetually high rates of wasting (at or above the 15 percent emergency threshold for much of the year), discerning true nutritional emergencies remains one of the most difficult challenges for WFP. Childhood mortality differentials between the eastern and western flood plains regions are a good illustration of this. In both regions, baseline child malnutrition rates are at or above the 15 percent emergency threshold with cyclical jumps to as high as 25-30 percent. However, childhood mortality rates are only above the emergency threshold on consistent basis in the eastern flood plains region, with rates jumping as high as 5/10000/day. This leads to several difficult questions:
• Why is there an emergency situation in the eastern but not western flood plains?
• Could this be a result of malnutrition rates being consistently higher in the eastern flood plains (by approximately 5 percent)?
• If so, why would 20 percent baseline wasting be associated with elevated mortality while 15 percent wasting is not?
• Does this indicate a need to recalibrate the emergency thresholds to take account of agro-pastoral growth patterns and diets (milk consumption, etc)?
Only by understanding the causes of childhood malnutrition in this region will WFP have a foundation from which to answer these questions.
2. Institute programmes encouraging improved child caring practices and particularly child feeding practices.
The CFSVA recommends that programmes to encourage proper child caring practices, with a particular focus on improving child feeding patterns, be incorporated into any nutritional support. This could result in a measurable improvement in disease and wasting prevalence. CFVSA data indicates that 55.6 percent of women report introducing foods other than breastmilk within the first six months of life, contrary to WHO recommendations. This problem was particularly acute in Equatoria, with 64-72 percent of women giving their child other foods during this period. Likewise, the mean age when breastfeeding stopped was 11 months of age, which means that on average, children are being
154
weaned too early. This problem was particularly evident in Jongolei, North Bahr El Ghazal and Lakes. Children in these states were weaned between 5 and 9 months of age.
3. Improve the reach and consistency of vitamin A supplementation programmes
Finally, the CFSVA recommends that vitamin A supplementation programmes be incorporated into nutritional interventions, with an aim to ensure that supplements reach underserved areas and that they are given every six months. While the prevalence of Vitamin A deficiency in southern Sudan is not known, vitamin A deficiency remains an area of concern. Vitamin A deficiency is a significant contributor to childhood morbidity (blindness or infectious diseases such diarrhea, measles, etc) and mortality (as deficient children are often more severely affected by infectious diseases). CFSVA data indicates that 30 percent of children from southern Sudan received vitamin A supplements in the last 6 months. In particularly underserved areas, like Jongolei, North Bahr el Ghazal and Upper Nile, rates of supplementation were around half the regional average. In these three states, only 14 percent, 17 percent and 19 percent of children received vitamin A supplements in the last six months.
Agricultural interventions
1. Facilitate crop production among recently resettled households
WFP should collaborate with other agencies, like FAO, to facilitate crop production by recently resettled households. The CFSVA has shown that fewer households farmed in the last year than report doing so normally. This is likely driven by resettled households having missed the window for planting, given the resettlement schedule. Consequently, the data also shows that these households have more difficulty accessing food. To improve this situation, WFP and FAO should encourage these households to produce crops through seed and tool distributions and WFP should continue to support those resettled households that arrived too late for planting.
2. Encourage producing to capacity while working to improve market access
WFP should encourage farmers in productive areas to produce to capacity. There are numerous reports that farming households in the “greenbelt” region of southern Sudan do not routinely farm to capacity. The reasons for this are both structural and security related. First, the LRA has been active in the area, disrupting crop yields and discouraging farming to far away from the homestead. Secondly, these farmers see no benefit in farming to capacity as they do not need the food and they have no means of getting the surplus to markets. As many of the surrounding states could benefit from surpluses in these productive areas, WFP and other agencies should encourage farming to capacity while working in the longer term to improve access to markets. This is a longer term solution though successful connecting these marketplaces could have a substantial impact on food security status of households throughout southern Sudan.