Embed Size (px)
Citation preview
Tailoring Bank Regulations: Differences in
Bank Size, Activities, and Capital Levels
David W. Perkins
Analyst in Macroeconomic Policy
December 21, 2017
Congressional Research Service
7-5700
www.crs.gov
R45051

Tailoring Bank Regulations: Differences in Bank Size, Activities, and Capital Levels
Congressional Research Service
Summary Banking organizations differ across a multitude of characteristics. The amount of assets they hold,
the services they provide, and how they secure funding are just a few examples. These differences
affect an individual organization’s risk of failure and the risk its failure or distress could pose to
the overall financial system. Policymakers generally agree that certain banking regulations should
be tailored to account for such differences, and as a result, banks are currently subject to or
exempt from various regulations if they meet certain criteria. To what degree existing bank
classifications adequately tailor regulation and how tailoring should be designed and
implemented are debated issues. This report examines
existing and proposed bank regulatory classifications,
legislation that proposes to change existing classifications or create new ones,
and,
the characteristics of bank organizations that fall under existing and proposed
classifications.
Banks are classified in a variety of ways. Some are informal classifications that refer to widely
understood differences between community and Wall Street banks—two commonly recognized
types of banks—but that are unofficial classifications that do not affect banking regulations. For
example, community banks are understood to be small institutions that meet the credit needs of a
community and Wall Street banks are understood to be large, complex institutions that could
individually pose risk to the financial system. Existing regulatory classifications are official
classifications applied to banks that meet some criteria and determine whether a bank is subject to
certain regulations. In addition, several existing proposals would establish new regulatory
classifications and criteria.
Often (but not always) existing criteria are size-based thresholds that subject a bank to more
stringent regulation once it exceeds a certain amount of assets. Proponents of this system argue
simple, “bright line” rules create certainty and transparency and that asset size is an adequate
measurement to identify which institutions should or should not be subject to certain regulation.
Critics argue it too narrowly focuses on one aspect of a bank organization, and thus may subject
certain banks to inappropriate regulation. Critics may argue that new or additional criteria based
on other characteristics (e.g., the business activities a bank engages in or the amount of capital it
holds) should be implemented.
To investigate how well certain criteria would appropriately tailor regulation, it is informative to
examine characteristics of banking organizations and compare banks that meet some criteria to
those that do not. This report examines characteristics such as asset size; concentrations in loans,
deposits, trading assets, and trading liabilities; activity in derivatives; and capital levels. The
analysis generally suggests that these characteristics are correlated; larger banks tend to be
involved in more business lines and hold less capital whereas smaller banks tend to be more
focused on making loans and taking deposits and hold more capital. However, the large number
of banks and the high degree of variation across multiple variables means that no set of criteria is
easily and objectively identifiable as the best means of tailoring regulations.
In the 115th Congress, numerous bills—including H.R. 10, H.R. 1116, H.R. 1948, H.R. 2121,
H.R. 3072, H.R. 3312, S. 1002, S. 1284, S. 1499, and S. 1893—would change the existing system
of bank regulation tailoring. Some would alter existing size-based classifications or introduce
new sized-based criteria, and others would establish new activities-based or capital-based criteria.
Tailoring Bank Regulations: Differences in Bank Size, Activities, and Capital Levels
Congressional Research Service
Contents
Introduction ..................................................................................................................................... 1
Classifications of Banks .................................................................................................................. 2
Unofficial Classifications .......................................................................................................... 2 “Main Street” ...................................................................................................................... 3 “Wall Street” ....................................................................................................................... 4 Somewhere In Between ...................................................................................................... 4
Selected Official Classifications and Exemption Thresholds ................................................... 5 $1 Billion Threshold ........................................................................................................... 5 $10 Billion Threshold ......................................................................................................... 6 $50 Billion Threshold ......................................................................................................... 7 “Advanced Approaches Banks” .......................................................................................... 7 “Globally Systemically Important Banks” .......................................................................... 8
Selected Proposals for Additional Tailoring .............................................................................. 9 Activities-Based Criteria ................................................................................................... 10 Capital-Based Criteria ........................................................................................................ 11 Regulator Tailoring with Required Analysis ..................................................................... 13
Bank Characteristics ...................................................................................................................... 14
Banks by Asset Size ................................................................................................................ 14 Characteristics Across Different Asset Sizes .................................................................... 15 Differences Between Banks: Existing Size-Based Classifications ................................... 17 Size Trends ........................................................................................................................ 18
Banks by Activities ................................................................................................................. 19 Industry Activities Statistics ............................................................................................. 19 Differences Between Banks: Approximate TBO Criteria ................................................. 21
Banks by Capital Levels .......................................................................................................... 22 Industry Capital Level Statistics ....................................................................................... 22 Differences Between Banks: 10% Tier 1 Leverage Ratio Threshold ................................ 23
Selected Legislation ...................................................................................................................... 24
New or Changed Asset-Size Thresholds ................................................................................. 24 Activities-Based Proposals ...................................................................................................... 25 Capital-Based Proposals .......................................................................................................... 25 Regulator Designations and Tailoring ..................................................................................... 26
Conclusion ..................................................................................................................................... 26
Figures
Figure 1. Loan and Deposit Concentrations Across Size Cohorts ................................................. 17
Figure 2. Trading Asset and Liability Concentrations Across Size Cohorts .................................. 17
Tables
Table 1. Number of BHCs Meeting Selected Classification Groups ............................................... 9
Table 2. Size and Selected Activities of the 20 Largest Banking Organizations ........................... 15
Table 3. BHCs Over $1 Billion: Averages by Selected Classifications ......................................... 17
Tailoring Bank Regulations: Differences in Bank Size, Activities, and Capital Levels
Congressional Research Service
Table 4. BHCs Over $1 Billion: Trading Versus No Trading ........................................................ 20
Table 5. BHCs Over $1 Billion: Averages by Derivative Activity ................................................ 20
Table 6. BHCs Over $1 Billion: TBOs Versus Non-TBOs ............................................................ 21
Table 7. BHCs Over $1 Billion: Averages by Tier 1 Leverage Ratios .......................................... 23
Table 8. BHCs Over $1 Billion: Averages Above, Near, Below a 10% Leverage Ratios ............. 24
Table A-1. Metrics Used in Analysis of Banks .............................................................................. 27
Table A-2.Definition of Groupings ................................................................................................ 27
Appendixes
Appendix A. Variable and Grouping Descriptions ........................................................................ 27
Appendix B. Traditional Banking Organization Criteria and Leverage Ratios Compared ........... 28
Contacts
Author Contact Information .......................................................................................................... 29
Tailoring Bank Regulations: Differences in Bank Size, Activities, and Capital Levels
Congressional Research Service 1
Introduction Banks differ from each other across numerous aspects of their business models, including balance
sheet size, breadth of products and services offered, funding sources, and risk appetite, among
others.1 Policymakers and experts generally agree that bank regulation should be tailored to
account for these differences between institutions.2 As result, regulations are generally applied to
banks based on meeting or not meeting some criteria. These criteria are established on an ad hoc
basis, and are often (but not always) based on whether the bank is above or below a certain asset
size threshold, such as $1 billion, $10 billion, or $50 billion in total assets. To what degree the
application of regulation should vary and how those variations should be designed and
implemented are debated issues. These issues have been prominent in recent years at least in part
because legislative and regulatory responses to the financial crisis—such as the Dodd-Frank Wall
Street Reform and Consumer Protection Act (Dodd-Frank; P.L. 111-203) and the international
agreement known as Basel III Accord3—have amended or introduced a number of regulations
that include tailoring criteria.
Bank regulation aims to achieve certain potential benefits (e.g., better-managed risks, increased
consumer protection, greater systemic stability) that justify potential costs of the regulation (e.g.,
reduced credit availability for certain consumers and businesses, slower economic growth over
some period of time).4 The size of the realized benefits and costs of a regulation for any
individual bank or group of banks are likely to depend in part on certain characteristics of that
bank or group, such as willingness to take on risk, systemic importance, and ability to absorb
compliance costs. Thus, appropriately fitting regulation to banks of different types is an important
component of designing effective and efficient regulation. For illustrative purposes, consider the
following simplified example. A regulation aimed at reducing systemic risk may produce greater
benefit when applied to a very large, complex, globally active and interconnected institution than
when applied to a single-branch institution making residential and farm loans in a rural
community. In addition, the large institution may have more resources to comply with the
regulation.
1 In general, this report uses the term bank interchangeably to refer to Federal Deposit Insurance Cooperation (FDIC) -
insured depository institutions (IDIs) or organizations that own one or more IDIs, including bank holding companies
(BHCs), financial holding companies, intermediate holding companies, and savings and loan holding companies.
Portions of this report analyze data on holding companies that own one or more IDIs, and will refer to these as banking
organizations. If examined at the depository subsidiary level, IDIs are relatively homogenous across many
characteristics because the commercial banking activities are performed at these subsidiaries, whereas other activities
are performed at nonbank subsidiaries. Because the objective of this report is to examine how banks may differ, it
examines organizations at the consolidated top-parent company level. Under this approach, IDIs that are not part of a
holding company structure are not included in the data analysis. 2 Daniel K. Tarullo, “A Tiered Approach to Regulation and Supervision of Community Banks,” remarks at the
Community Bankers Symposium, Chicago, IL, November 7, 2014, pp. 1-2, at https://www.federalreserve.gov/
newsevents/speech/tarullo20141107a.pdf. 3 The Basel Committee on Banking Supervision (BCBS) is a committee that consists of bank regulators from different
countries (currently 28 are represented) that sets standards for bank regulation. The standards are set in agreements
known as Basel Accords. The first accord was finalized in 1988 in what is now known as the Basel I Accord. BCBS
revised this agreement, issuing the Basel II Accord in 2004. In part in response to the crisis, BCBS began developing
the Basel III Accord, which is the framework that regulators are currently in the process of implementing. For more
information, see https://www.bis.org/bcbs/history.htm. 4 To what degree current financial regulation appropriately balances these considerations is also a contentious issue that
will be at times examined in this report. For more in depth analysis on this topic, see CRS Report R44869, Financial
Regulatory Relief: Approaches for Congress, Regulators, and the Administration, coordinated by Marc Labonte.
Tailoring Bank Regulations: Differences in Bank Size, Activities, and Capital Levels
Congressional Research Service 2
Achieving appropriate tailoring for thousands of diverse banks is more difficult than laid out in
the stylized example above. Determining which banks should be regulated similarly to each other,
differently from others, and how regulation should differ between groups varies from regulation
to regulation. For example, the Dodd-Frank mandates enhanced prudential regulation for bank
holding companies (BHCs) with more than $50 billion in assets and assigns primary consumer
compliance supervision of banks with more than $10 billion to the Consumer Financial Protection
Bureau (CFPB).5 U.S. regulators have created classifications—largely in adherence to Basel III—
designating some large BHCs as advanced approaches banks and globally systemically important
banks, subjecting them to stricter capital and liquidity requirements.6 Classifications are also in
place for small banks. For example, certain banks with less than $1 billion are subject to less
frequent examinations, and BHCs below that threshold are exempt from certain requirements
involving mergers and capital ratios.7 In addition, a popular, but unofficial, terminology—which
includes terms such as community bank and Wall Street—is used during debate related to bank
regulation.
An exhaustive examination of all classifications and thresholds and dimensions across which
these various types of banks differ is beyond the scope of this report. Instead, this report examines
selected classifications of banks, briefly discusses selected legislation that would amend the
existing tailoring system, and analyzes three selected characteristics (size, business activities, and
reliance on capital funding) across which banking organizations may measurably differ.
Classifications of Banks A potential source of confusion in the debate over tailored regulation is the diversity of both
popular terminology describing banks and official statutory and regulatory classifications. Many
people conceptually understand ways in which banks differ, and terms that are not specifically or
universally defined have developed to describe those popularly understood concepts.8 Meanwhile,
policymakers and regulators must develop specific classification criteria for the practical
application of regulations. In addition, some observers assert the criteria used in the current
regulatory classifications could be improved. This section examines three types of bank
classifications:
1. Unofficial classifications described by popular but often subjective terminology,
2. Official classifications of banks officially defined in statute or regulation, and
3. Proposed classifications based on alternative criteria from those used in current
statute or regulation.
Unofficial Classifications
Many terms are used to classify banks according to qualitative descriptions of the business
models they employ. The utility of these terms is that they refer to widely held, intuitive
understanding of the differences between bank types and appropriate levels of regulation for
them. An examination of these terms can illustrate which characteristics observers believe should
5 12 U.S.C § 5365, 12 U.S.C. §§5581-5587. 6 12 CFR § 217.10(c), 12 CFR § 217.400. 7 12 CFR Appendix C to Part 225, 12 U.S. Code § 5371(b)(5)(C). 8 Federal Deposit Insurance Corporation, FDIC Community Banking Study, December 2012, at https://www.fdic.gov/
regulations/resources/cbi/report/cbi-full.pdf.
Tailoring Bank Regulations: Differences in Bank Size, Activities, and Capital Levels
Congressional Research Service 3
be considered when calibrating regulations. However, these terms can be problematic because
they can be interpreted differently and reaching consensus on exactly which banks fall into each
category is difficult.
“Main Street”
The terms community bank or Main Street bank typically refer to a bank that uses a simple
deposit-taking and loan-making business model to meet the credit needs of a certain community.
Although these banks may typically be small in terms of asset size, conceptually that does not
necessarily have to be a determining factor. Nevertheless, community banks are often identified
as such based on their small asset size. Complicating the identification of community banks using
only size as a criterion is that no consensus exists over what the specific size threshold should be.9
In addition, many have observed that most small banks are generally different from large banks in
a variety of ways besides asset size. For example, the Federal Deposit Insurance Corporation, for
research purposes, identifies community banks by assessing certain metrics related to asset size,
balance sheet characteristics, and geographic footprint.10
Under this definition, six banks with
more than $10 billion in assets and one with almost $41 billion in assets were classified as
community banks.11
Community banks are likely to be more concentrated in core commercial bank businesses of
making loans and taking deposits and less involved in other activities such as securities trading or
holding derivatives. Community banks also tend to operate within a smaller geographic area.
These banks are generally more likely to practice relationship lending wherein loan officers and
other bank employees have a longer-standing and perhaps more personal relationship with
borrowers.12
Due in part to these characteristics, proponents of community banks assert that these
banks are particularly important credit sources to local communities and otherwise underserved
groups, as big banks may be unwilling to meet the credit needs of a small market of which they
have little knowledge. Finally, relative to large banks, small banks are likely to have fewer
employees, fewer resources to dedicate to regulatory compliance, and are less likely to
individually pose a systemic risk to the broader financial system.13
For more information on the
regulation of small banks, see CRS Report R43999, An Analysis of the Regulatory Burden on
Small Banks, by Sean M. Hoskins and Marc Labonte.
9 For example, the Federal Reserve sets the threshold at $10 billion in Board of Governors of the Federal Reserve
System, Community Banking, at http://www.federalreserve.gov/bankinforeg/topics/community_banking.htm, whereas
the Office of the Comptroller of the Currency sets it at $1 billion in OCC, Community Bank Supervision: Comptroller’s
Handbook, January 2010, at https://www.occ.gov/publications/publications-by-type/comptrollers-handbook/pub-ch-ep-
cbs.pdf. 10 FDIC, FDIC Community Banking Study, December 2012, at https://www.fdic.gov/regulations/resources/cbi/report/
cbi-full.pdf. 11 FDIC, FDIC Community Banking Study Reference Data, as of June 30, 2017, at https://www.fdic.gov/regulations/
resources/cbi/data.html. 12 FDIC, FDIC Community Banking Study, December 2012, at https://www.fdic.gov/regulations/resources/cbi/report/
cbi-full.pdf. 13 Drew Dahl, Andrew Meyer, and Michelle Neely, “Scale Matters Community Banks and Compliance Costs,” Federal
Reserve Bank of St. Louis, The Regional Economist, July 2016, at https://www.stlouisfed.org/~/media/Publications/
Regional-Economist/2016/July/scale_matters.pdf.
Tailoring Bank Regulations: Differences in Bank Size, Activities, and Capital Levels
Congressional Research Service 4
“Wall Street”
Wall Street bank is a term for a very large, very complex bank that is involved in many business
lines outside of what is viewed as the traditional commercial bank activities of making loans and
taking deposits. Such a bank could have hundreds of billions or trillions of dollars’ worth of
assets and its corporate structure could involve hundreds or thousands of separate subsidiaries
under a parent bank holding company (BHC). Although at least one of these subsidiaries must be
a chartered bank, many others could be nonbanks, such as broker-dealers, asset managers, and
insurance brokers or agents. Wall Street banks may be internationally active and have a global
presence.14
The term Wall Street bank comes from the prominent role many of these institutions
play in underwriting and trading securities, activities that commonly take place on Wall Street in
New York City. However, an institution of the aforementioned size and complexity may not
necessarily be headquartered or even active on the actual Wall Street.
Too Big To Fail (TBTF) bank is another term that refers to large, complex institutions, and refers
to banks that meet a specific criterion that is not directly observable (or at least not directly
observable until the government takes actions to save it from default).15
A bank is said to be
TBTF when policymakers judge that its failure would cause such serious disruptions to the
financial system that the resulting economic and social outcomes would be unacceptable. To
avoid these outcomes, the government would be compelled to save the institution from failure,
perhaps by directly giving it funding. Characteristics that could make an institution so important
to the functioning of the financial system include its size, interconnectedness, complexity, or
central role in a certain market or sector. The belief among market participants that the
government will protect a certain bank or groups of banks could lead to moral hazard, wherein
market participants do not adequately assess or monitor risk because they feel protected from
potential losses. Moral hazard can result in excessive risk taking by the bank, lax risk monitoring
by shareholders and creditors, and unfair funding advantages. In addition, government “bailouts”
expose taxpayers to potential losses. Whether the policy reforms enacted by Dodd-Frank and
Basel III effectively addressed these problems is a matter of debate. For more information on the
TBTF issues, see CRS Report R42150, Systemically Important or “Too Big to Fail” Financial
Institutions, by Marc Labonte.
Somewhere In Between
The terms regional bank and mid-size bank generally refer to banks that do not fit neatly into a
“very large, complex, and systemically important” or “small and simple” dichotomy. The set of
banks to which the terms are referring can vary widely. Often, the terms describe a bank that has a
simple business model that focuses on taking deposits and making loans, but has a large amount
of assets and services a certain region of the country.16
Other times, the terms mean a bank that is
significantly larger and more complex than the thousands of community banks but nevertheless
its failure would not pose a risk to systemic stability.17
In either case, the goal is often to describe
14 Dafna Avraham, Patricia Selvaggi, and James Vickery, “A Structural View of U.S. Bank Holding Companies,”
Federal Reserve Bank of New York Policy Review, July 2012, pp. 65-68, at https://www.newyorkfed.org/medialibrary/
media/research/epr/12v18n2/1207avra.pdf. 15 Although most banking institutions that are considered to potentially be too big to fail (TBTF) are BHCs, it is
possible that a nonbank financial organization could be TBTF. 16 Heather Gratton, “Regional and Other Mid-size Banks: Recent Trends and Short-Term Prospects,” Federal Deposit
Insurance Future of Banking Study, June 22, 2004, pp. 1-3, at https://www.fdic.gov/bank/analytical/future/fob_06.pdf. 17 Robert Pozen, “The Heavy Burden Of Being Labelled Systemically Important,” The Financial Times, March 20,
2016.
Tailoring Bank Regulations: Differences in Bank Size, Activities, and Capital Levels
Congressional Research Service 5
banks that are in some way different than banks servicing small communities, but that are not of a
scale such that the material distress at a single bank would destabilize the entire financial system.
Selected Official Classifications and Exemption Thresholds
Banking is one of the most heavily regulated industries in the United States, due to its key role in
the economy, its inherent risks, and the potential taxpayer exposures it creates. Thus, all banks are
subject to numerous requirements, regardless of size. For example, banks are generally subject to
applicable federal and state laws related to banking, lending, and other financial activities,
consumer protection, and money laundering. Banks generally face many prudential (or “safety
and soundness”) regulations, including requirements to maintain a certain minimum capital level
and prohibitions on proprietary trading and affiliations with certain investment funds and
companies. All banks must be FDIC insured and are subject to regulatory supervision, which
includes examinations and reporting requirements. Banks that do not comply with all applicable
laws and regulations are subject to enforcement actions, such as being compelled to take prompt
corrective actions at the direction of a banking regulator.18
However, regulators and other policymakers have long recognized that appropriately regulating
banks require that banks with differing characteristics face different regulatory regimes.19
As a
result, they have created classifications and thresholds that subject each bank to certain
regulations, exempt it from others, or otherwise alter its regulatory treatment. Many of these
classifications use size-based asset thresholds that, once exceeded, subject a bank to additional
regulation.20
The strengths and weaknesses of this approach are described in the “Banks by Asset
Size” section. However, size considerations are only a component of other classification criteria.
This report does not include an exhaustive and detailed examination of every regulatory
classification and exemption threshold. Instead, it examines a selection of prominent
classifications facing banks that are often the subject of proposed changes.
$1 Billion Threshold
Small banks individually may pose relatively little risk to the financial system and possess fewer
resources on an absolute basis to comply with regulation. As shown in Table 1, of the 4,539
banking organizations, 3,922 (over 86%) reporting positive assets to the Federal Reserve held less
than $1 billion in assets as of June 30, 2017.21
These relatively small institutions are exempted
18 Forest E. Myers, Basics for Bank Directors (Kansas City, MO: Federal Reserve Bank of Kansas City, 2016). 19 An early example would be the National Banking Act of 1863, which established a national bank charter. Whether a
depository institution holds a national or state charter and whether a state-chartered bank is a member of the Federal
Reserve System determines which bank regulatory agency is the primary federal regulator for the institution. Thus,
these characteristics affect how the banks are regulated to some degree. However, because the federal agencies strive to
make federal bank regulation uniform through mechanisms including joint rulemaking and coordination through the
Federal Financial Institution Examination Council, differences between charter type and Federal Reserve membership
are not covered in this report. For more information about bank regulator jurisdiction, see CRS Report R44918, Who
Regulates Whom? An Overview of the U.S. Financial Regulatory Framework, by Marc Labonte. 20 Although this report focuses on size thresholds that are subject to much debate, some bank regulations are activity-
based and only apply should a bank engage in a specific activity. 21 This statistic is based on a Congressional Research Service (CRS) calculation using second quarter 2017 data from
the FR-YSP Consolidated Financial Statements for Small Holding Companies and the FR Y9-C Consolidated Financial
Statements for Small Holding Companies reports by BHCs to the Federal Reserve. In general, figures cited through the
remainder of this report are from the Y9-C only. In addition, although only BHCs with more than $1 billion in assets
are required to file Y-9Cs, some second quarter filers reported assets less than $1 billion. Because the analysis in this
report focuses on BHCs with more than $1 billion in assets, these small filers are generally excluded.
Tailoring Bank Regulations: Differences in Bank Size, Activities, and Capital Levels
Congressional Research Service 6
from certain regulations. For example, banks below this threshold that achieve certain bank exam
scores are subject to less frequent examinations.22
In addition, the quarterly reporting forms small
banks are required to file with federal bank regulators are simpler and less detailed than those
filed by larger banks.23
In accordance with the Federal Reserve’s Small-Bank Holding Company
Policy Statement, BHCs with less than $1 billion in assets are permitted to take on more debt in
order to complete a merger and are not required to meet the same capital requirements at the
holding company level (provided they meet certain other requirements concerning nonbank
activities, off balance sheet exposures, and debt and equities outstanding).24
In addition, under the
Community Reinvestment Act (P.L. 95-128)—which subjects banks to an evaluation on how well
they meet community credit needs—compliance examination is simpler for banks below a
threshold set slightly over $1 billion.25
Even among banks below this threshold, there is a substantive amount of variation between bank
characteristics. For example, the median asset size for banking organizations in this group is $22
million in assets, making banking organizations near the $1 billion threshold about 45 times the
size of the average banking organization in the group. However, policymakers and observers
generally are not proposing that banks with less than $1 billion be subject to additional regulation
or that this threshold be lowered. Thus, the data analysis that follows in this report focuses on the
617 banking organizations that are above the $1 billion threshold.
$10 Billion Threshold
For banks that exceed $1 billion in assets, the next major regulatory threshold is at $10 billion.26
As of June 30, 2017, 502 bank organizations (about 11%) held between $1 billion and $10 billion
in assets, and 115 (2.5%) held more than $10 billion in assets. Policymakers have determined it is
appropriate to subject banks exceeding this size to additional regulation, due to the amount of
harm the failure of these banks could potentially cause to the economy and the resources
available to the banks to dedicate to compliance. For example, the Consumer Financial Protection
Bureau is the primary federal agency for consumer compliance supervision at banks with more
than $10 billion in assets.27
In addition, banks of this size must complete a Dodd-Frank mandated,
company-run stress test—an examination of whether the bank could remain adequately
capitalized under hypothetical, stressed economic conditions—once a year.28
Furthermore, the
interchange fees these banks receive when customers use debit cards to make purchases are
capped by the Federal Reserve pursuant to Section 1075 of the Dodd-Frank Act.29
22 Office of the Comptroller of the Currency (OCC), the Federal Reserve System, and FDIC, “Expanded Examination
Cycle for Certain Small Insured Depository Institutions and U.S. Branches and Agencies of Foreign Banks,” 81
Federal Register 90949-90950, December 16, 2016. 23 Federal Financial Institutions Examination Council, “FFIEC Streamlines ‘Call Report’ for Small Institutions,” press
release, December 30, 2016, at https://www.ffiec.gov/press/pr123016.htm. 24 12 C.F.R Appendix C to Part 225, 12 U.S.C § 5371(b)(5)(C). 25 FDIC, Compliance Examination Manual, Section XI – 1.1, September 2015, at https://www.fdic.gov/regulations/
compliance/manual/11/xi-1.1.pdf. This threshold is adjusted for inflation and in 2017 was $1.226 billion. 26 Again, this report covers selected major thresholds, and is not an exhaustive examination of all thresholds at which
banks become subject to or receive exemptions for certain regulations. However, banks can cross some thresholds
between $1 billion and $10 billion that subject them to certain regulations. 27 12 U.S.C § 5365, 12 U.S.C. §§5581-5587. 28 OCC, the Federal Reserve System, and FDIC, “Capital Plan and Stress Test Rules,” 79 Federal Register 64026-
64027, October 27, 2014. 29 Section 1075 of the Dodd-Frank Act is sometimes referred to as the “Durbin Amendment.” For more information,
(continued...)
Tailoring Bank Regulations: Differences in Bank Size, Activities, and Capital Levels
Congressional Research Service 7
$50 Billion Threshold
For banks that exceed $10 billion in assets, the next major regulatory threshold is at $50 billion.
As of June 30, 2017, 73 bank organizations (1.5% of the total) held between $10 billion and $50
billion and 42 organizations (less than 1%) held more than $50 billion. Section 165 of the Dodd-
Frank Act directs the Federal Reserve to establish more stringent regulation for BHCs with more
than $50 billion in assets, based on the rationale that banks of this size could destabilize the U.S.
financial system if one were to fail or become distressed.30
Thus, BHCs of this size are subject to
this enhanced prudential regulation.31
For example, in addition to company-run stress test
requirements mentioned in the previous section, BHCs exceeding the $50 billion threshold must
submit data about its balance sheet and income to the Federal Reserve to be used in a separate
Federal Reserve-run stress test. Each of these banks must also submit a resolution plan, or “living
will,” to regulators detailing how the bank could be resolved through bankruptcy without
spreading distress throughout the financial system. In addition, these banks are required to hold
enough highly liquid assets to meet their cash flow needs during stress events, as determined by
the banks’ internal models. Finally, these banks also must meet a liquidity coverage ratio
requirement and, upon implementation expected in 2019, a net stable funding ratio—designed to
increase the likelihood that each bank can meet its obligations given its asset liquidity and
funding sources.32
“Advanced Approaches Banks”
In 2004, the Basel Committee on Banking Supervision (BCBS)—an international standards
setting body of bank regulators—created a framework known as the Basel II Accords.33
Part of
this framework called for using the internal risk measurement systems at internationally active
banks to determine the amount of capital each of these banks must hold to protect against risks
and set minimum standards for those systems.34
In 2007, U.S. bank regulators implemented
enhanced regulation related to these advanced approaches when calculating capital requirements,
including setting the criteria for which banks the regulation would cover.35
Although certain allowances for banks to opt in or out have changed over time, the basic criteria
has generally remained the same; banks with $250 billion in total assets or $10 billion in total
foreign exposures are considered “advanced approaches banks.” As of the end of 2016, 15 U.S.
BHCs—including 8 globally systemically important banks (G-SIBs) discussed in the following
section—were subject to these regulations.36
These banks were determined to be large and
(...continued)
see CRS Report R41913, Regulation of Debit Interchange Fees, by Darryl E. Getter. 30 12 U.S.C. § 5365(a)(1). 31 Nonbanks can also be designated systemically important financial institutions. Regulation of these institutions is
beyond the scope of this report. For more information, see CRS Report R42150, Systemically Important or “Too Big to
Fail” Financial Institutions, by Marc Labonte. 32 For more information on enhanced prudential regulation facing large banks, see CRS Report R45036, Bank Systemic
Risk Regulation: The $50 Billion Threshold in the Dodd-Frank Act, by Marc Labonte and David W. Perkins. 33 The BCBS would go on to establish new standards beginning in 2009 that would become known as the Basel III
Accords which are in effect today. 34 Basel Committee on Bank Supervision, International Convergence of Capital Measurement and Capital Standards:
A Revised Framework, Basel, Switzerland, June 2004, pp. 152-161, at http://www.bis.org/publ/bcbs107.pdf. 35 OCC, Federal Reserve, FDIC, and the Office of Thrift Supervision (OTS), “Risk-Based Capital Standards: Advanced
Capital Adequacy Framework: Basel II,” 72 Federal Register 235, December 7, 2007. 36 Of these 15 BHCs, 5 are still involved in the parallel-run phase of the phase-in process in which an organization must
(continued...)
Tailoring Bank Regulations: Differences in Bank Size, Activities, and Capital Levels
Congressional Research Service 8
complex enough that they should have the sophistication necessary to estimate their risks more
thoroughly than by using the relatively simple calculations required of other banks. As noted in
the original rulemaking, the advanced approaches framework is “intended to produce risk-based
capital requirements that are more risk-sensitive than the existing risk-based capital rules [and]
seeks to build on improvements to risk assessment approaches that a number of large banks have
adopted.”37
Many of the additional requirements that advance approaches banks in the United States face
involve regulatory ratio requirements—minimum ratios of balance sheet items that ensure banks
are unlikely to fail—implemented by U.S. bank regulators following the recent financial crisis
that generally adhere to BCBS’s revised Basel III framework. One such requirement is that when
calculating the ratios related to minimum capital requirements, advanced approaches banks must
include certain off balance sheet exposures (to account for more complicated risks) in addition to
the on balance sheet assets that all banks must include. Another is that these banks are subject to
countercyclical capital buffers—a requirement to increase capital holdings that regulators can
deploy to rein in risk-taking in the event regulators determine risks have become excessive. These
banks also must meet more stringent liquidity coverage ratio and net stable funding ratio
requirements.
“Globally Systemically Important Banks”
Basel III created a designation for certain banks that (if one were to fail or become distressed)
could inflict destabilizing losses and contagion effects throughout the global financial system,
calling such institutions globally systemically important banks (G-SIBs).38
In the United States,
the Federal Reserve designates banks as G-SIBs based on a scoring system using two methods
(called method 1 and method 2) to measure an institution’s systemic importance—the likelihood
that distress at or failure of the institution could destabilize the global financial system.39
A
detailed examination of how the scores are calculated and what qualifies a bank as a G-SIB is
beyond the scope of this report, but what is pertinent is that the size of the institution constitutes
only one of 12 indicators measured under method 1 and one of nine indicators in method 2.40
Meanwhile, both scoring methods include indicators of interconnectedness, complexity, and
cross-jurisdictional activity. Method 1 also measures substitutability—how easily its client
servicing or infrastructure support could be picked up by another institution—and method 2
measures an institution’s use of certain funding markets. Thus, the scores measure a number of
aspects of a bank’s business model besides its size. As a result, the eight G-SIBs are not the eight
(...continued)
demonstrate that its internal models are adequate to meet requirements. See, Céline Choulet, “The Future of U.S.
Banking Regulation in Question,” BNP Paribas Eco Conjoncture, May 2017. 37 OCC, Federal Reserve, FDIC, and OTS, “Risk-Based Capital Standards: Advanced Capital Adequacy Framework:
Basel II,” 72 Federal Register 235, December 7, 2007. 38 Basel Committee on Banking Supervision, “Globally Systemically Important Banks: Assessment Methodology and
the Additional Loss Absorbency Requirement,” November 2011, at http://www.bis.org/publ/bcbs207.pdf. 39 Federal Reserve System, “Regulatory Capital Rules: Implementation of Risk-Based Capital Surcharges for Global
Systemically Important Bank Holding Companies; Final Rule,” 80 Federal Register 157, August 14, 2015, at
https://www.gpo.gov/fdsys/pkg/FR-2015-08-14/pdf/2015-18702.pdf. 40 The first scoring method closely adheres to the standards agreed to in Basel III. The second method is based on the
Basel III system, but includes certain changes made by the Federal Reserve that place more emphasis on the banks’
funding sources.
Globally systemically important bank (G-SIB) scoring uses bank exposures as the size indicator rather than assets,
although the size indicator is more commonly used in most U.S. bank regulation thresholds.

Tailoring Bank Regulations: Differences in Bank Size, Activities, and Capital Levels
Congressional Research Service 9
largest U.S. banks. As of the end of 2016, eight U.S. banks were designated as G-SIBs (the six
largest, and the 9th and 13
th largest).
The eight G-SIBs are subject to the most stringent regulations and supervisory expectations of
any group of banks. A notable requirement is that they must hold additional capital—known as
the G-SIB surcharge—to avoid facing certain limitations on shareholder payouts and bonus
payments.41
In addition, these banks must hold a certain percentage of capital and debt that meets
certain quality requirements designed to ensure that the banks have adequate total loss absorbing
capacity (TLAC), thus improving their ability to survive losses and the likelihood they could be
resolved in an orderly fashion in the event of failure.42
Table 1. Number of BHCs Meeting Selected Classification Groups
(as of June 30, 2017)
Classification Number of BHCs
$0 - $1 billion 3,922
$1 billion - $10 billion 502
$10 billion - $50 billion 73
Over $50 billion
(but not Advanced Approaches or Globally
Systemically Important Banks)
27
Advanced Approaches Banks
(but not Globally Systemically Important Banks) 7
Globally Systemically Important Banks 8
Total 4,539
Source: Congressional Research Service (CRS) calculations using Federal Reserve Y-9C and Y-9SP data,
accessed on July 24, 2017.
Note: These counts include savings and loan holding companies that are not subject to the same regulations
facing bank holding companies, including certain regulations covered in this report.
Selected Proposals for Additional Tailoring
In general, all the classifications reviewed above except for the G-SIB designations are either
solely based on total assets or (in the case of the advanced approaches designation) largely based
on total assets. Some tailoring proposals call for calibrating the existing approach by raising or
lowering specific thresholds. Other proposals assert this system (whatever the level of individual
thresholds) is too heavily focused on one aspect of a bank (size) that does not directly reveal
much about other characteristics, such as complexity, interconnectedness, and risk posed. Thus,
these classifications alone arguably cannot effectively differentiate the application of regulations
across disparate banks. Other classifications that use alternative methods to tailor regulation have
been put forward including methods that examine a bank’s activities, measure its capital levels, or
41 Federal Reserve System, “Regulatory Capital Rules: Implementation of Risk-Based Capital Surcharges for Globally
Systemically Important Bank Holding Companies,” 80 Federal Register 49082-49089, August 14, 2015. 42 Federal Reserve System, “Total Loss-Absorbing Capacity, Long-Term Debt, and Clean Holding Company
Requirements for Systemically Important U.S. Bank Holding Companies and Intermediate Holding Companies of
Systemically Important Foreign Banking Organizations,” 80 Federal Register 74926-74931, November 30, 2015.
Tailoring Bank Regulations: Differences in Bank Size, Activities, and Capital Levels
Congressional Research Service 10
are based on greater regulator discretion. This section examines these potential alternative
criteria.
Activities-Based Criteria
A single line item on a bank balance sheet—total assets—does not provide information about the
types of assets the bank owns or how it funds itself to accumulate those assets. Many banks are
heavily concentrated in the business of making loans, using deposits for funding, and holding
most of those loans on the balance sheet. Subjecting such an institution to costly regulation aimed
at containing risks presented by complex activities, such as engaging in wholesale funding
markets, securities market making, and hedging with derivatives, would arguably be unduly
burdensome.43
Likewise, an institution that does engage significantly in such activities could be
(and possibly strategically choose to remain) below a threshold at which such regulations come
into effect. Again, the distinctions are conceptually simple, but hard in practice. The activities and
markets a bank could engage in are myriad; where should policymakers draw the line?
Examples of activities-based criteria could be those that place limitations on securities and
derivatives trading in which the bank engages.44
Trading assets and liabilities are generally
financial instruments that a bank underwrites and deals in, has positions in for the purpose of
selling in the near term, or has a position in to accommodate a customer.45
Trading assets and
liabilities could potentially experience relatively large price fluctuations due to market volatility,
and thus expose a bank to additional risks. Derivatives are instruments with values based on some
underlying asset or reference, such as interest rates, exchange rates, equity prices, or commodities
prices, and sudden, unexpected changes in the rate or value of the underlying references could
expose derivatives holders to large losses and increased cash obligations to counterparties.46
In
this way, although derivatives can be used to hedge risks, they can also expose an individual bank
to additional risks. In addition, because counterparties in a derivative are often other financial
institutions, derivatives could increase a bank’s interconnectivity with the rest of the financial
system. Because these activities are complex and potentially expose individual banks and the
financial system to additional risks, they have been proposed as tailoring-based criteria.47
Thomas Hoenig, the vice chairman of the Federal Deposit Insurance Corporation, has made one
such proposal. He argues a new classification of banks—“Traditional Banking Organizations”
(TBOs)—should be established that would make qualifying banks eligible for certain regulatory
relief.48
In the original April 2015 proposal, he suggested “defining eligibility for regulatory relief
around the following criteria:
43 Daniel K. Tarullo, “A Tiered Approach to Regulation and Supervision of Community Banks,” speech at the
Community Bankers Symposium, Chicago, IL, November 7, 2014, athttps://www.federalreserve.gov/newsevents/
speech/tarullo20141107a.htm. 44 Thomas M. Hoenig, “Regulatory Relief and Accountability for Financial Holding Companies Engaged in
Nontraditional Banking Activities,” May 12, 2017, at https://www.fdic.gov/news/news/speeches/spmar1317a.pdf. 45 FDIC, Instructions for Preparation of Consolidated Reports of Condition and Income, p. RC-6, at
https://www.ffiec.gov/pdf/ffiec_forms/ffiec031_034inst_200006.pdf. 46 FDIC, Instructions for Preparation of Consolidated Reports of Condition and Income, pages RC-L-7 to RC-L-12, at
https://www.ffiec.gov/pdf/ffiec_forms/ffiec031_034inst_200006.pdf. 47 FDIC Vice Chairman Thomas Hoenig, “A Conversation about Regulatory Relief and the Community Bank,”
remarks presented to the Hyman P. Minsky Conference, Washington, DC, April 15, 2015, at https://www.fdic.gov/
news/news/speeches/spapril1515.html. 48 The proposal also called for bank organizations that do engage in other lines of business outside of traditional bank
activities to create separate legal entities within their organization to carry out traditional banking and these other
(continued...)
Tailoring Bank Regulations: Differences in Bank Size, Activities, and Capital Levels
Congressional Research Service 11
banks that hold, effectively, zero trading assets or liabilities;
banks that hold no derivative positions other than interest rate swaps and foreign
exchange derivatives; and
banks whose total notional value of all their derivatives exposures—including
cleared and non-cleared derivatives—is less than $3 billion [later proposed at $8
billion].”49
This classification is intended to identify banks that limit themselves to minimal activity in
certain markets that are perceived to be outside of a traditional commercial banking model, and
exempt those from certain regulations, including certain Basel III and Dodd-Frank
requirements.50
Advocates of this approach contend the criteria used in the classification
accurately separate banks into two groups that use business models with substantially different
risk profiles.
However, opponents of measures to separate traditional banking from other activities often argue
that, while the activities identified in these criteria pose risks, it is not clear whether they pose
greater risks to bank solvency and financial stability than do traditional banking activities, such as
mortgage lending. Furthermore, taking on additional risks in different markets might diversify a
bank’s risk profile, making it less likely to fail.51
If this assessment is accurate, the TBO criteria
would arguably be inappropriate measures of bank riskiness and thus not necessarily an
appropriate basis for regulatory tailoring.
In the 115th Congress, S. 2155, H.R. 10 and H.R. 2121 would put certain activities-based criteria
into statue, and in the 114th Congress, H.R. 4647 also addressed these criteria. These bills are
covered in the “Selected Legislation” section.
Capital-Based Criteria
A bank secures funding by either issuing liabilities or raising capital. A bank’s liabilities are
largely the value of deposits and borrowings the bank owes savers and creditors. Capital is raised
through various methods, including issuing equity to shareholders and instruments that can be
converted into equity. Importantly, capital—unlike liabilities—does not require repayment of a
specified amount of money, and so its value can fluctuate. Thus, capital gives banks the ability to
(...continued)
business lines. This aspect of the proposal is beyond the scope of this CRS report and therefore is not covered. 49 For the original proposal, see FDIC Vice Chairman Thomas Hoenig, “A Conversation about Regulatory Relief and
the Community Bank,” Remarks presented to the Hyman P. Minsky Conference, Washington, DC, April 15, 2015,
https://www.fdic.gov/news/news/speeches/spapril1515.html.
For the updated proposal, see Thomas M. Hoenig, “Regulatory Relief and Accountability for Financial Holding
Companies Engaged in Nontraditional Banking Activities,” May 12, 2017, at https://www.fdic.gov/news/news/
speeches/spmar1317a.pdf.
The updated version of the TBO criteria released in March 2017, raised the derivative exposure threshold to $8 billion
and included a minimum leverage ratio—a requirement to hold a certain amount of capital, given the amount of assets
owned. Capital-based criteria are examined in the following section. 50 The proposal would also require bank organizations that did not meet this threshold to set up separately managed and
capitalized intermediate holding companies to separate the traditional activities and nontraditional activities of the
organizations. 51 Anjan V. Thakor, The Economic Consequences of the Volcker Rule, U.S. Chamber of Commerce Center for Capital
Markets Competitiveness, Summer 2012, pp. 28-30, at http://www.centerforcapitalmarkets.com/wp-content/uploads/
2010/04/17612_CCMC-Volcker-RuleFINAL.pdf.
Tailoring Bank Regulations: Differences in Bank Size, Activities, and Capital Levels
Congressional Research Service 12
absorb losses without failing.52
Because a primary goal of prudential regulation is to ensure that
banks (whatever their size or activity) are unlikely to fail, and because how a bank chooses to
fund itself is an important aspect of its business model, some policymakers have proposed
tailoring criteria based on a bank’s capital levels.
Banks are currently required to satisfy several minimum capital requirements, generally
expressed as ratios between items on bank balance sheets.53
Capital ratios fall into one of two
main types—a leverage ratio or a risk-weighted ratio. A leverage ratio treats all assets the same,
requiring banks to hold the same amount of capital against the asset regardless of how risky each
asset is. A risk-weighted ratio assigns a risk weight—a number based on the riskiness of the asset
that the asset value is multiplied by—because some assets are more likely to lose value than
others. Riskier assets receive a higher risk weight, which requires banks to hold more capital—to
better enable them to absorb potential losses—to meet the ratio requirement.54
Tailoring
regulations using capital-based criteria would entail identifying at least one of these ratios or
constructing another to serve as the benchmark and establishing some level above the minimum
at which a bank would be deemed well-capitalized enough to qualify for exemptions for some
regulations.
An example of such a classification is the election option for strongly capitalized banks proposed
in the Financial CHOICE Act of 2017 (FCA; H.R. 10), which would exempt banks that maintain
a minimum capital ratio from a variety of prudential regulations. Currently, most banks must
maintain at least 4% leverage ratio, and many choose to hold more.55
Under the FCA, if a bank
had a 10% leverage ratio, it could elect to be exempt from requirements, including other capital
ratios, certain liquidity requirements, and stress-test requirements.56
The FCA is covered in more
detail in the “Selected Legislation” section.
Proponents of the measure argue that it is unnecessary to subject banks with high leverage ratios
to other complex and burdensome regulation because holding that amount of capital makes them
safe from failure.57
However, opponents assert that a single ratio is not a complete measure of
bank riskiness and using one to exempt banks from certain requirements unwisely weakens
necessary prudential regulation. For example, they argue that without risk weighting, banks
would have an incentive to hold riskier assets because the same amount of capital must be held
against both risky and safe assets.58
52 FDIC, Risk Management Manual of Examination Policies: Section 2.1 Capital, pp. 2-3, at https://www.fdic.gov/
regulations/safety/manual/section2-1.pdf. 53 12 CFR § 3.10. 54 FDIC, Risk Management Manual of Examination Policies: Section 2.1 Capital, pp. 2-9, at https://www.fdic.gov/
regulations/safety/manual/section2-1.pdf. 55 12 CFR § 3.10(a)(4). 56 The Financial CHOICE Act, H.R. 10 Section 601, 115th Congress, 2017. 57 House Committee on Financial Services, “The Financial CHOICE Act: A Republican Proposal to Reform the
Financial Regulatory System,” June 23, 2016, at http://financialservices.house.gov/uploadedfiles/
financial_choice_act_comprehensive_outline.pdf. 58 See Chair Yellen’s comments during U.S. Congress, House Committee on Financial Services, Monetary Policy and
the State of the Economy, 114th Cong., 2nd sess., June 22, 2016, at http://www.cq.com/doc/congressionaltranscripts-
4915133?2.
Tailoring Bank Regulations: Differences in Bank Size, Activities, and Capital Levels
Congressional Research Service 13
Regulator Tailoring with Required Analysis
Policymakers have long debated choosing between establishing rules-based and principles-based
regulations. The classification systems discussed above are generally rules-based; if an objective,
numerical (sometimes called bright line) threshold is crossed, then a bank becomes subject to or
exempt from certain regulations. Such an approach has the advantage of minimizing ambiguity,
uncertainty, and opacity in the application of regulations.59
Banks, investors, and regulators all
clearly understand what regulation each bank will be subject to and why and can plan
accordingly.
However, rules-based approaches may be problematic because rule makers may be unable to
anticipate all relevant circumstances when promulgating the rule. Those circumstances would
then not be considered during application of the rule.60
For example, take a hypothetical $51
billion bank that uses a very safe and simple business model and a $49 billion bank that uses a
risky and complex one. Arguably, the first bank should be subject to less burdensome regulation
and the second more rigorous. However, suppose a bright line regulatory threshold has been set at
$50 billion, and a regulator does not have the authority to make a determination on which
regulations to apply. In this scenario, the bank with the slightly higher assets may be subject to
additional regulations whereas the slightly smaller one is not. Furthermore, such thresholds can
lead to “cliff effects,” wherein banks choose to remain below a certain threshold to avoid
additional regulation even though growing larger would not necessarily increase their risk
profile.61
Alternatively, Congress could grant regulators additional authority to tailor the application of
regulation. An example of such authority is granted in the Dodd-Frank Act in the application of
enhanced prudential regulation, permitting the Federal Reserve to “differentiate among
companies on an individual basis or by category, taking into consideration their capital structure,
riskiness, complexity, financial activities (including the financial activities of their subsidiaries),
size, and any other risk related factors” and to “establish a threshold above [$50 billion].”62
In
addition, regulators can exercise discretion in supervising different institutions. For example, the
Federal Reserve has placed 12 BHCs and one insurance company in a special supervisory
program administered by its Large Institution Supervision Coordinating Committee.63
Because of the potential weaknesses of the rules-based approach, some policymakers and
industry participants have advocated for exempting more bank organizations from regulations in
conjunction with allowing regulators to designate additional ones, provided the regulators
perform certain analyses to justify such designations.64
They argue giving technical experts wider
authority to determine whether certain regulations should apply to banks would lead to more
59 Pascal Frantz and Norvald Instefjord, “Rules vs Principles Based Financial Regulation,” Social Science Research
Network (SSRN), November 25, 2014, at https://ssrn.com/abstract=2561370. 60 Letter from Hugh Carney, vice president, American Bankers Association, and K. Richard Foster, senior vice
president and senior council, Financial Services Roundtable, to Robert Frierson, Secretary, Board of Governors of the
Federal Reserve System, November 23, 2016, at https://www.federalreserve.gov/SECRS/2017/January/20170112/R-
1548/R-1548_112316_131610_404923899385_1.pdf. 61 Ibid. 62 12 U.S.C. § 5365(a)(2). 63 Board of Governors of the Federal Reserve System, Supervision and Regulation Letter 12-17:Consolidated
Supervision Framework for Large Financial Institutions, December 17, 2012. 64 For example, see The Systemic Risk Designation Improvement Act, H.R. 3312, 115th Congress, 2017.
Tailoring Bank Regulations: Differences in Bank Size, Activities, and Capital Levels
Congressional Research Service 14
effective and efficient regulation than bright line criteria.65
Opponents of this type of rule assert
the advantages of the bright line approach—certainty and transparency—are preferable to a
discretionary approach, which may entail uncertainty over regulatory treatment and opacity in
how regulators make determinations.66
Legislation that would allow regulators to apply or exempt institutions from regulation based on
certain analyses includes the Systemic Risk Designation Improvement Act (H.R. 3312/S. 1893)
and the TAILOR Act (H.R. 1116/S. 366), which are covered in more detail in the “Selected
Legislation” section.
Bank Characteristics The various classifications and exemptions involved in bank regulation are intended to
appropriately tailor regulation based on each bank’s characteristics and risks. To examine to what
degree existing and proposed classifications accomplish this, it is helpful to understand the
differences between banks that do or do not meet the classification criteria. If examined at the
depository subsidiary level, IDIs are relatively homogenous across many characteristics because
the commercial banking activities are performed at these subsidiaries, whereas other activities are
performed at nonbank subsidiaries. Because the objective of this report is to examine how
banking organizations differ, it examines bank holding companies at the consolidated top-parent
company level.67
The following section analyzes differences in the size, business activities, and
capital levels of U.S. bank organizations and makes comparisons between organizations that meet
certain criteria and those that do not meet those criteria. The metrics include total assets, certain
balance sheet items that illustrate how involved an organization is in certain activities, and two
capital ratios. For more information about the metrics, see Appendix A.
Banks by Asset Size
As discussed in the previous section most of the existing official regulation classifications are
sized based, and this approach has both advantages and disadvantages. One advantage includes a
lack of ambiguity over which banks are subject to what sets of regulations. One disadvantage is
that a wide array of bank characteristics are not considered when determining what regulation the
bank is subject. The efficacy of asset-based criteria depends in part on how closely correlated size
is to other bank characteristics. This section examines bank organizations and their differences in
activities and capital across asset sizes and compares the characteristics of banks that fall into
different classification thresholds.68
65 Letter from Rob Nichols, President and CEO of the American Bankers Association, to The Honorable Blaine
Luetkemeyer, Chairman of U.S. House of Representatives Subcommittee on Financial Institutions and Consumer
Credit, July 26, 2017, at https://www.aba.com/Advocacy/LetterstoCongress/Documents/
LuetkemeyerHR3312072617.pdf. 66 Editorial Board, “Keep the Line Bright in Dodd-Frank,” The Washington Post, May 19, 2015. 67 As mentioned in footnote 1, this report uses the term bank interchangeably to refer to FDIC-insured depository
institutions (IDIs) or organizations that own one or more IDIs, including bank holding companies (BHCs), financial
holding companies, intermediate holding companies, and savings and loan holding companies. Portions of this report
analyze data on holding companies that own one or more IDIs, and will refer to these as banking organizations. 68 Unless otherwise noted, data used in this analysis comes from Federal Reserve Y-9C and Y-9SP data, accessed on
July 24, 2017, at https://www.chicagofed.org/applications/bhc/bhc-home.
Tailoring Bank Regulations: Differences in Bank Size, Activities, and Capital Levels
Congressional Research Service 15
Characteristics Across Different Asset Sizes
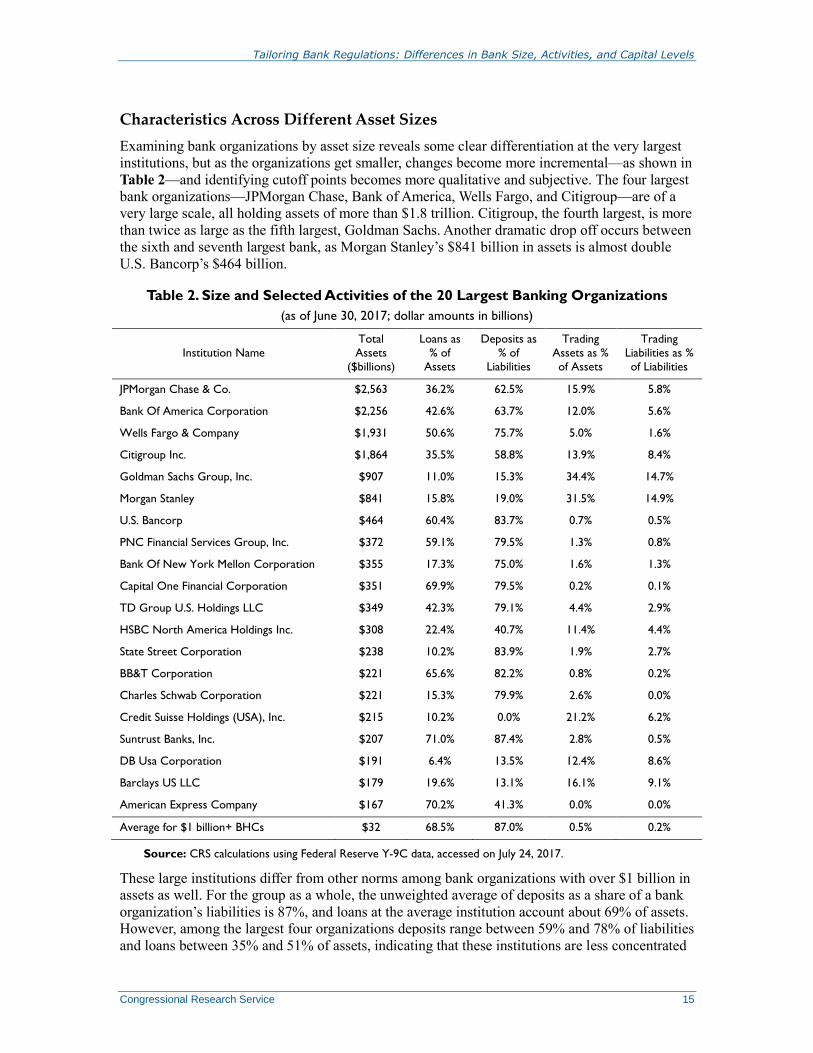
Examining bank organizations by asset size reveals some clear differentiation at the very largest
institutions, but as the organizations get smaller, changes become more incremental—as shown in
Table 2—and identifying cutoff points becomes more qualitative and subjective. The four largest
bank organizations—JPMorgan Chase, Bank of America, Wells Fargo, and Citigroup—are of a
very large scale, all holding assets of more than $1.8 trillion. Citigroup, the fourth largest, is more
than twice as large as the fifth largest, Goldman Sachs. Another dramatic drop off occurs between
the sixth and seventh largest bank, as Morgan Stanley’s $841 billion in assets is almost double
U.S. Bancorp’s $464 billion.
Table 2. Size and Selected Activities of the 20 Largest Banking Organizations
(as of June 30, 2017; dollar amounts in billions)
Institution Name
Total
Assets
($billions)
Loans as
% of
Assets
Deposits as
% of
Liabilities
Trading
Assets as %
of Assets
Trading
Liabilities as %
of Liabilities
JPMorgan Chase & Co. $2,563 36.2% 62.5% 15.9% 5.8%
Bank Of America Corporation $2,256 42.6% 63.7% 12.0% 5.6%
Wells Fargo & Company $1,931 50.6% 75.7% 5.0% 1.6%
Citigroup Inc. $1,864 35.5% 58.8% 13.9% 8.4%
Goldman Sachs Group, Inc. $907 11.0% 15.3% 34.4% 14.7%
Morgan Stanley $841 15.8% 19.0% 31.5% 14.9%
U.S. Bancorp $464 60.4% 83.7% 0.7% 0.5%
PNC Financial Services Group, Inc. $372 59.1% 79.5% 1.3% 0.8%
Bank Of New York Mellon Corporation $355 17.3% 75.0% 1.6% 1.3%
Capital One Financial Corporation $351 69.9% 79.5% 0.2% 0.1%
TD Group U.S. Holdings LLC $349 42.3% 79.1% 4.4% 2.9%
HSBC North America Holdings Inc. $308 22.4% 40.7% 11.4% 4.4%
State Street Corporation $238 10.2% 83.9% 1.9% 2.7%
BB&T Corporation $221 65.6% 82.2% 0.8% 0.2%
Charles Schwab Corporation $221 15.3% 79.9% 2.6% 0.0%
Credit Suisse Holdings (USA), Inc. $215 10.2% 0.0% 21.2% 6.2%
Suntrust Banks, Inc. $207 71.0% 87.4% 2.8% 0.5%
DB Usa Corporation $191 6.4% 13.5% 12.4% 8.6%
Barclays US LLC $179 19.6% 13.1% 16.1% 9.1%
American Express Company $167 70.2% 41.3% 0.0% 0.0%
Average for $1 billion+ BHCs $32 68.5% 87.0% 0.5% 0.2%
Source: CRS calculations using Federal Reserve Y-9C data, accessed on July 24, 2017.
These large institutions differ from other norms among bank organizations with over $1 billion in
assets as well. For the group as a whole, the unweighted average of deposits as a share of a bank
organization’s liabilities is 87%, and loans at the average institution account about 69% of assets.
However, among the largest four organizations deposits range between 59% and 78% of liabilities
and loans between 35% and 51% of assets, indicating that these institutions are less concentrated
Tailoring Bank Regulations: Differences in Bank Size, Activities, and Capital Levels
Congressional Research Service 16
in deposit-taking and lending. In addition, although less than 1% of the average bank’s assets are
trading assets and less than 1% of its liabilities are trading liabilities, the top four’s trading assets
account for between 5% and 16% of total assets and trading liabilities between 2% and 8% of
total liabilities. The fifth and sixth largest banks are even more focused in investment bank
activities as opposed to commercial bank deposit-taking and lending. Deposits make up 15% and
19% of Goldman Sachs and Morgan Stanley liabilities, respectively, and loans 11% and 16% of
assets. Meanwhile, trading assets account for 34% and 31% of their total assets, respectively, and
trading liabilities were 15% of total liabilities for both firms.
As mentioned above, identifying natural cutoffs points at lower asset sizes becomes more
subjective. Because these differences between assets become more incremental, there is no clear
differentiation between the business models of groups of banks. The seventh ($464 billion),
eighth ($372 billion), 10th ($351 billion), and 14
th ($220 billion) all are near industry averages in
deposits as a percentage of liabilities, loans as a percentage of assets, and trading assets as a
percentage of assets, but many of the organizations near these sizes are not. The largest bank to
exceed the average of funding with deposits and making loans is the 17th largest organization with
$207 billion in assets. The largest to exceed both these metrics and have less than average trading
assets is the 23rd
largest organization with $152 billion in assets. Just as large organizations have
significant variations in business models, smaller organizations also may deviate from the
industry norms across these metrics with notably large deviations at particular organizations
holding $125 billion, $59 billion, $48 billion, $43 billion, and $30 billion in assets.
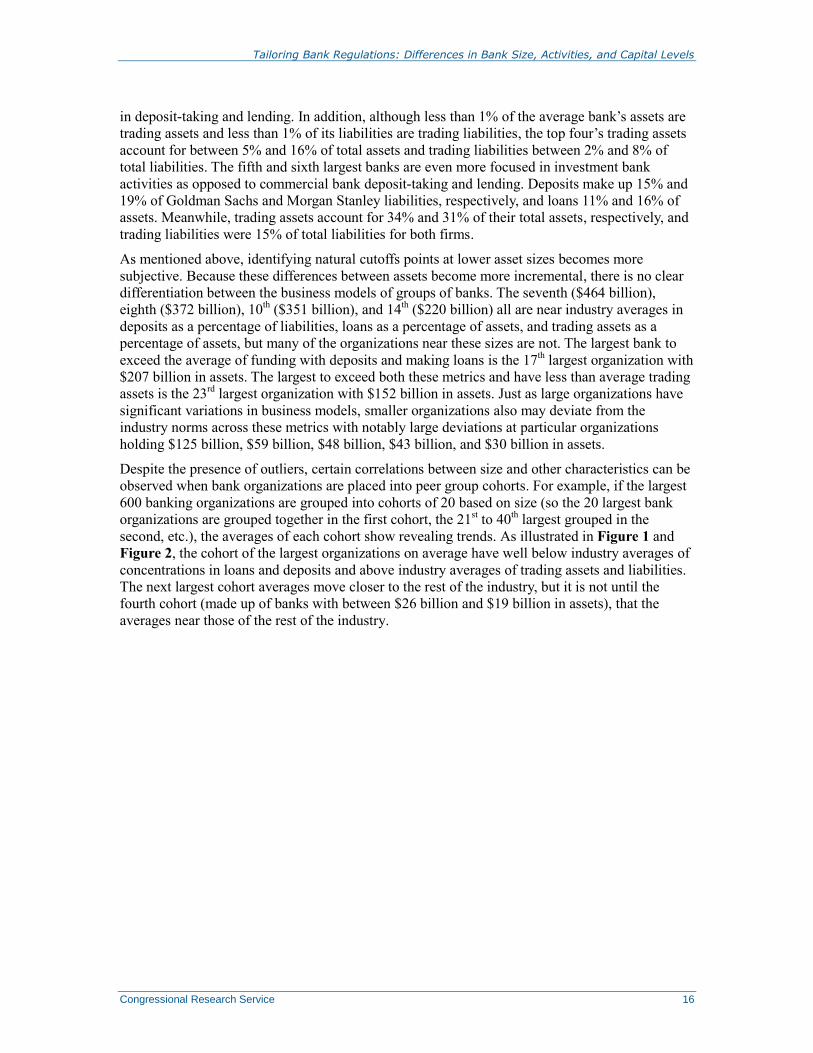
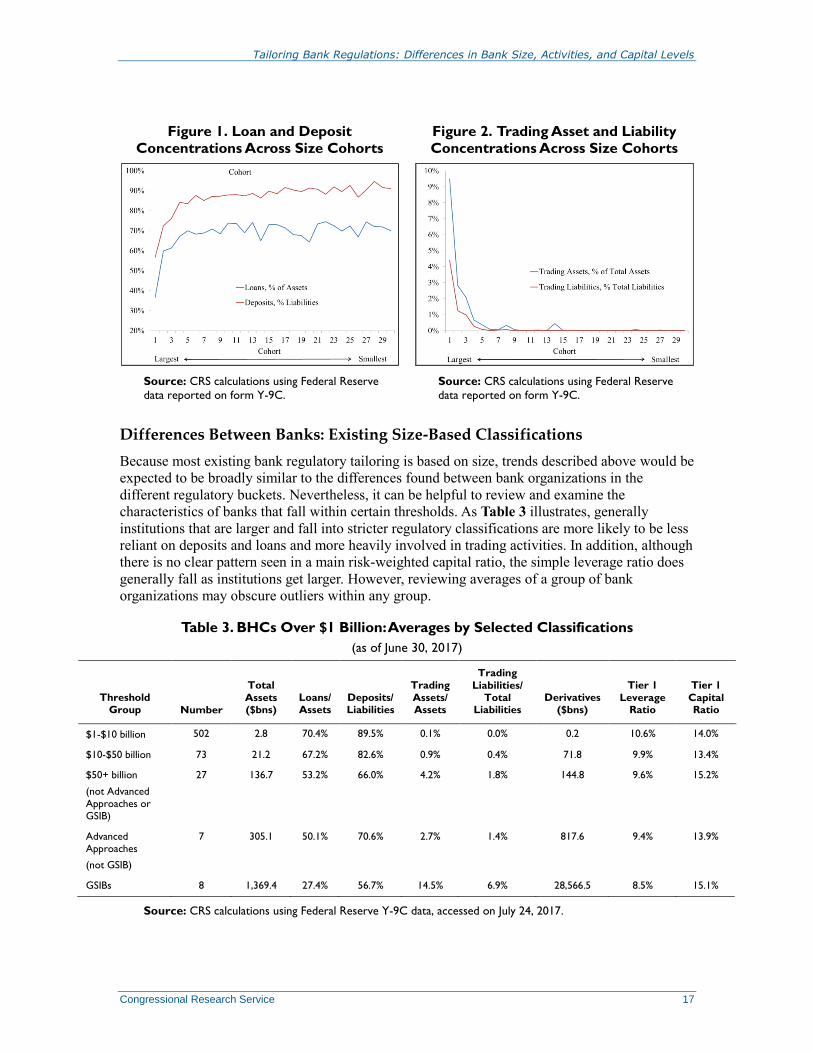
Despite the presence of outliers, certain correlations between size and other characteristics can be
observed when bank organizations are placed into peer group cohorts. For example, if the largest
600 banking organizations are grouped into cohorts of 20 based on size (so the 20 largest bank
organizations are grouped together in the first cohort, the 21st to 40
th largest grouped in the
second, etc.), the averages of each cohort show revealing trends. As illustrated in Figure 1 and
Figure 2, the cohort of the largest organizations on average have well below industry averages of
concentrations in loans and deposits and above industry averages of trading assets and liabilities.
The next largest cohort averages move closer to the rest of the industry, but it is not until the
fourth cohort (made up of banks with between $26 billion and $19 billion in assets), that the
averages near those of the rest of the industry.
Tailoring Bank Regulations: Differences in Bank Size, Activities, and Capital Levels
Congressional Research Service 17
Figure 1. Loan and Deposit
Concentrations Across Size Cohorts
Source: CRS calculations using Federal Reserve
data reported on form Y-9C.
Figure 2. Trading Asset and Liability
Concentrations Across Size Cohorts
Source: CRS calculations using Federal Reserve
data reported on form Y-9C.
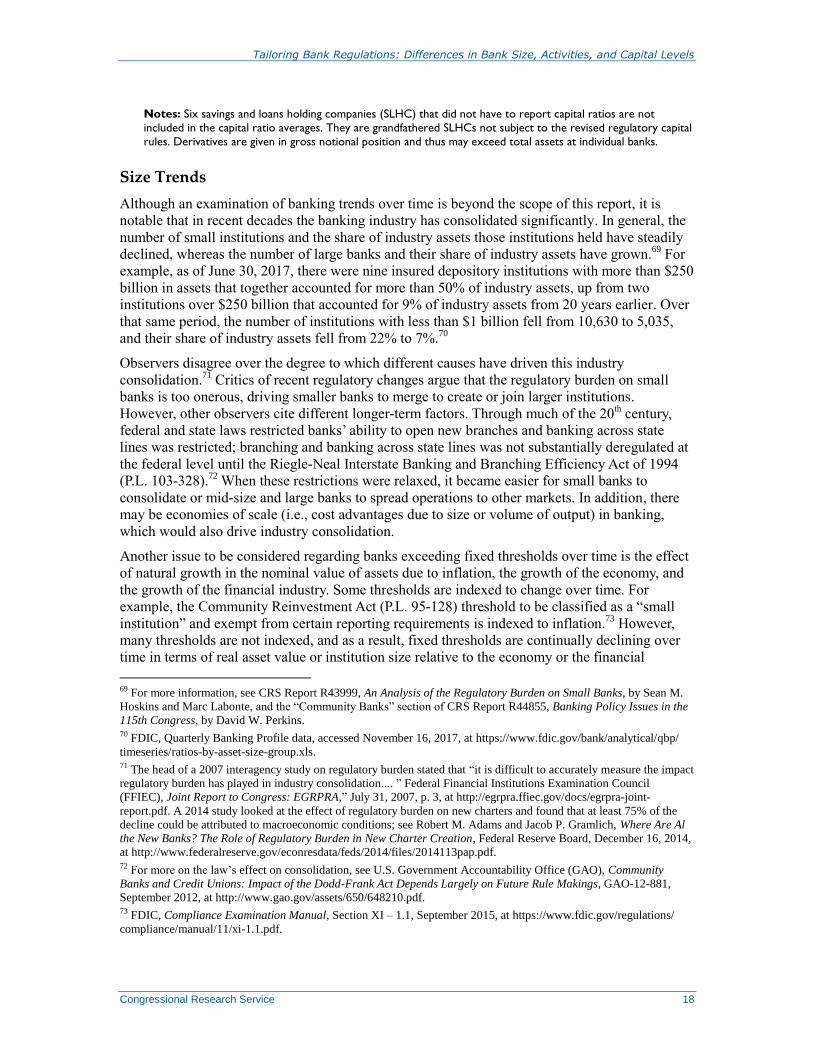
Differences Between Banks: Existing Size-Based Classifications
Because most existing bank regulatory tailoring is based on size, trends described above would be
expected to be broadly similar to the differences found between bank organizations in the
different regulatory buckets. Nevertheless, it can be helpful to review and examine the
characteristics of banks that fall within certain thresholds. As Table 3 illustrates, generally
institutions that are larger and fall into stricter regulatory classifications are more likely to be less
reliant on deposits and loans and more heavily involved in trading activities. In addition, although
there is no clear pattern seen in a main risk-weighted capital ratio, the simple leverage ratio does
generally fall as institutions get larger. However, reviewing averages of a group of bank
organizations may obscure outliers within any group.
Table 3. BHCs Over $1 Billion: Averages by Selected Classifications
(as of June 30, 2017)
Threshold Group Number
Total
Assets ($bns)
Loans/ Assets
Deposits/ Liabilities
Trading
Assets/ Assets
Trading
Liabilities/ Total
Liabilities Derivatives
($bns)
Tier 1
Leverage Ratio
Tier 1
Capital Ratio
$1-$10 billion 502 2.8 70.4% 89.5% 0.1% 0.0% 0.2 10.6% 14.0%
$10-$50 billion 73 21.2 67.2% 82.6% 0.9% 0.4% 71.8 9.9% 13.4%
$50+ billion
(not Advanced
Approaches or GSIB)
27 136.7 53.2% 66.0% 4.2% 1.8% 144.8 9.6% 15.2%
Advanced Approaches
(not GSIB)
7 305.1 50.1% 70.6% 2.7% 1.4% 817.6 9.4% 13.9%
GSIBs 8 1,369.4 27.4% 56.7% 14.5% 6.9% 28,566.5 8.5% 15.1%
Source: CRS calculations using Federal Reserve Y-9C data, accessed on July 24, 2017.
Tailoring Bank Regulations: Differences in Bank Size, Activities, and Capital Levels
Congressional Research Service 18
Notes: Six savings and loans holding companies (SLHC) that did not have to report capital ratios are not
included in the capital ratio averages. They are grandfathered SLHCs not subject to the revised regulatory capital
rules. Derivatives are given in gross notional position and thus may exceed total assets at individual banks.
Size Trends
Although an examination of banking trends over time is beyond the scope of this report, it is
notable that in recent decades the banking industry has consolidated significantly. In general, the
number of small institutions and the share of industry assets those institutions held have steadily
declined, whereas the number of large banks and their share of industry assets have grown.69
For
example, as of June 30, 2017, there were nine insured depository institutions with more than $250
billion in assets that together accounted for more than 50% of industry assets, up from two
institutions over $250 billion that accounted for 9% of industry assets from 20 years earlier. Over
that same period, the number of institutions with less than $1 billion fell from 10,630 to 5,035,
and their share of industry assets fell from 22% to 7%.70
Observers disagree over the degree to which different causes have driven this industry
consolidation.71
Critics of recent regulatory changes argue that the regulatory burden on small
banks is too onerous, driving smaller banks to merge to create or join larger institutions.
However, other observers cite different longer-term factors. Through much of the 20th century,
federal and state laws restricted banks’ ability to open new branches and banking across state
lines was restricted; branching and banking across state lines was not substantially deregulated at
the federal level until the Riegle-Neal Interstate Banking and Branching Efficiency Act of 1994
(P.L. 103-328).72
When these restrictions were relaxed, it became easier for small banks to
consolidate or mid-size and large banks to spread operations to other markets. In addition, there
may be economies of scale (i.e., cost advantages due to size or volume of output) in banking,
which would also drive industry consolidation.
Another issue to be considered regarding banks exceeding fixed thresholds over time is the effect
of natural growth in the nominal value of assets due to inflation, the growth of the economy, and
the growth of the financial industry. Some thresholds are indexed to change over time. For
example, the Community Reinvestment Act (P.L. 95-128) threshold to be classified as a “small
institution” and exempt from certain reporting requirements is indexed to inflation.73
However,
many thresholds are not indexed, and as a result, fixed thresholds are continually declining over
time in terms of real asset value or institution size relative to the economy or the financial
69 For more information, see CRS Report R43999, An Analysis of the Regulatory Burden on Small Banks, by Sean M.
Hoskins and Marc Labonte, and the “Community Banks” section of CRS Report R44855, Banking Policy Issues in the
115th Congress, by David W. Perkins. 70 FDIC, Quarterly Banking Profile data, accessed November 16, 2017, at https://www.fdic.gov/bank/analytical/qbp/
timeseries/ratios-by-asset-size-group.xls. 71 The head of a 2007 interagency study on regulatory burden stated that “it is difficult to accurately measure the impact
regulatory burden has played in industry consolidation.... ” Federal Financial Institutions Examination Council
(FFIEC), Joint Report to Congress: EGRPRA,” July 31, 2007, p. 3, at http://egrpra.ffiec.gov/docs/egrpra-joint-
report.pdf. A 2014 study looked at the effect of regulatory burden on new charters and found that at least 75% of the
decline could be attributed to macroeconomic conditions; see Robert M. Adams and Jacob P. Gramlich, Where Are Al
the New Banks? The Role of Regulatory Burden in New Charter Creation, Federal Reserve Board, December 16, 2014,
at http://www.federalreserve.gov/econresdata/feds/2014/files/2014113pap.pdf. 72 For more on the law’s effect on consolidation, see U.S. Government Accountability Office (GAO), Community
Banks and Credit Unions: Impact of the Dodd-Frank Act Depends Largely on Future Rule Makings, GAO-12-881,
September 2012, at http://www.gao.gov/assets/650/648210.pdf. 73 FDIC, Compliance Examination Manual, Section XI – 1.1, September 2015, at https://www.fdic.gov/regulations/
compliance/manual/11/xi-1.1.pdf.
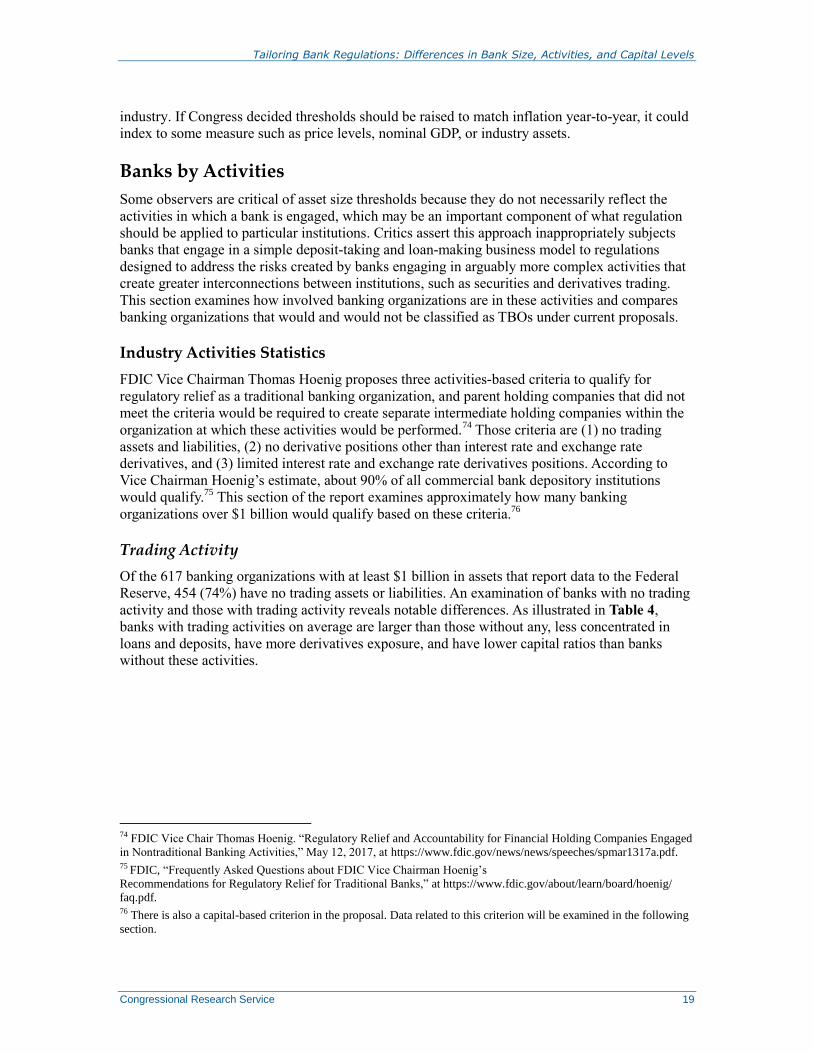
Tailoring Bank Regulations: Differences in Bank Size, Activities, and Capital Levels
Congressional Research Service 19
industry. If Congress decided thresholds should be raised to match inflation year-to-year, it could
index to some measure such as price levels, nominal GDP, or industry assets.
Banks by Activities
Some observers are critical of asset size thresholds because they do not necessarily reflect the
activities in which a bank is engaged, which may be an important component of what regulation
should be applied to particular institutions. Critics assert this approach inappropriately subjects
banks that engage in a simple deposit-taking and loan-making business model to regulations
designed to address the risks created by banks engaging in arguably more complex activities that
create greater interconnections between institutions, such as securities and derivatives trading.
This section examines how involved banking organizations are in these activities and compares
banking organizations that would and would not be classified as TBOs under current proposals.
Industry Activities Statistics
FDIC Vice Chairman Thomas Hoenig proposes three activities-based criteria to qualify for
regulatory relief as a traditional banking organization, and parent holding companies that did not
meet the criteria would be required to create separate intermediate holding companies within the
organization at which these activities would be performed.74
Those criteria are (1) no trading
assets and liabilities, (2) no derivative positions other than interest rate and exchange rate
derivatives, and (3) limited interest rate and exchange rate derivatives positions. According to
Vice Chairman Hoenig’s estimate, about 90% of all commercial bank depository institutions
would qualify.75
This section of the report examines approximately how many banking
organizations over $1 billion would qualify based on these criteria.76
Trading Activity
Of the 617 banking organizations with at least $1 billion in assets that report data to the Federal
Reserve, 454 (74%) have no trading assets or liabilities. An examination of banks with no trading
activity and those with trading activity reveals notable differences. As illustrated in Table 4,
banks with trading activities on average are larger than those without any, less concentrated in
loans and deposits, have more derivatives exposure, and have lower capital ratios than banks
without these activities.
74 FDIC Vice Chair Thomas Hoenig. “Regulatory Relief and Accountability for Financial Holding Companies Engaged
in Nontraditional Banking Activities,” May 12, 2017, at https://www.fdic.gov/news/news/speeches/spmar1317a.pdf. 75 FDIC, “Frequently Asked Questions about FDIC Vice Chairman Hoenig’s
Recommendations for Regulatory Relief for Traditional Banks,” at https://www.fdic.gov/about/learn/board/hoenig/
faq.pdf. 76 There is also a capital-based criterion in the proposal. Data related to this criterion will be examined in the following
section.
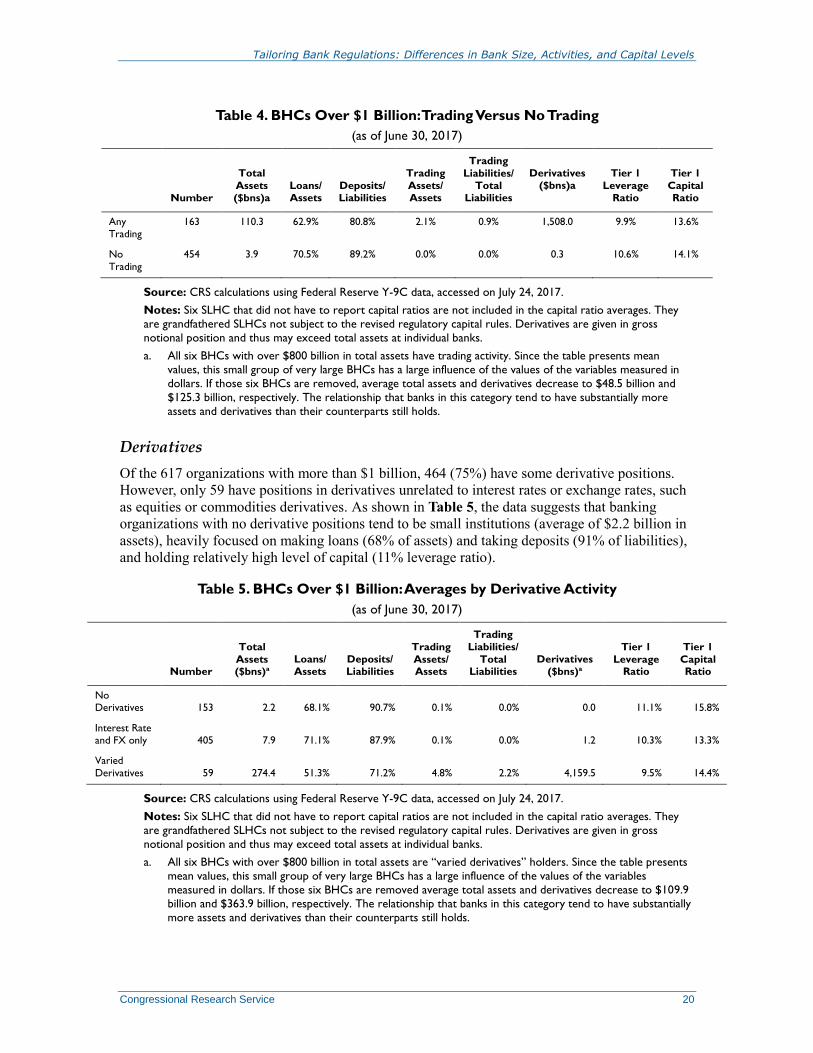
Tailoring Bank Regulations: Differences in Bank Size, Activities, and Capital Levels
Congressional Research Service 20
Table 4. BHCs Over $1 Billion: Trading Versus No Trading
(as of June 30, 2017)
Number
Total
Assets ($bns)a
Loans/ Assets
Deposits/ Liabilities
Trading
Assets/ Assets
Trading
Liabilities/Total
Liabilities
Derivatives ($bns)a
Tier 1
Leverage Ratio
Tier 1
Capital Ratio
Any Trading
163 110.3 62.9% 80.8% 2.1% 0.9% 1,508.0 9.9% 13.6%
No
Trading
454 3.9 70.5% 89.2% 0.0% 0.0% 0.3 10.6% 14.1%
Source: CRS calculations using Federal Reserve Y-9C data, accessed on July 24, 2017.
Notes: Six SLHC that did not have to report capital ratios are not included in the capital ratio averages. They
are grandfathered SLHCs not subject to the revised regulatory capital rules. Derivatives are given in gross
notional position and thus may exceed total assets at individual banks.
a. All six BHCs with over $800 billion in total assets have trading activity. Since the table presents mean
values, this small group of very large BHCs has a large influence of the values of the variables measured in
dollars. If those six BHCs are removed, average total assets and derivatives decrease to $48.5 billion and
$125.3 billion, respectively. The relationship that banks in this category tend to have substantially more
assets and derivatives than their counterparts still holds.
Derivatives
Of the 617 organizations with more than $1 billion, 464 (75%) have some derivative positions.
However, only 59 have positions in derivatives unrelated to interest rates or exchange rates, such
as equities or commodities derivatives. As shown in Table 5, the data suggests that banking
organizations with no derivative positions tend to be small institutions (average of $2.2 billion in
assets), heavily focused on making loans (68% of assets) and taking deposits (91% of liabilities),
and holding relatively high level of capital (11% leverage ratio).
Table 5. BHCs Over $1 Billion: Averages by Derivative Activity
(as of June 30, 2017)
Number
Total
Assets ($bns)a
Loans/Assets
Deposits/Liabilities
Trading
Assets/Assets
Trading
Liabilities/
Total Liabilities
Derivatives ($bns)a
Tier 1
Leverage Ratio
Tier 1
Capital Ratio
No Derivatives 153 2.2 68.1% 90.7% 0.1% 0.0% 0.0 11.1% 15.8%
Interest Rate and FX only 405 7.9 71.1% 87.9% 0.1% 0.0% 1.2 10.3% 13.3%
Varied
Derivatives 59 274.4 51.3% 71.2% 4.8% 2.2% 4,159.5 9.5% 14.4%
Source: CRS calculations using Federal Reserve Y-9C data, accessed on July 24, 2017.
Notes: Six SLHC that did not have to report capital ratios are not included in the capital ratio averages. They
are grandfathered SLHCs not subject to the revised regulatory capital rules. Derivatives are given in gross
notional position and thus may exceed total assets at individual banks.
a. All six BHCs with over $800 billion in total assets are “varied derivatives” holders. Since the table presents
mean values, this small group of very large BHCs has a large influence of the values of the variables
measured in dollars. If those six BHCs are removed average total assets and derivatives decrease to $109.9
billion and $363.9 billion, respectively. The relationship that banks in this category tend to have substantially
more assets and derivatives than their counterparts still holds.
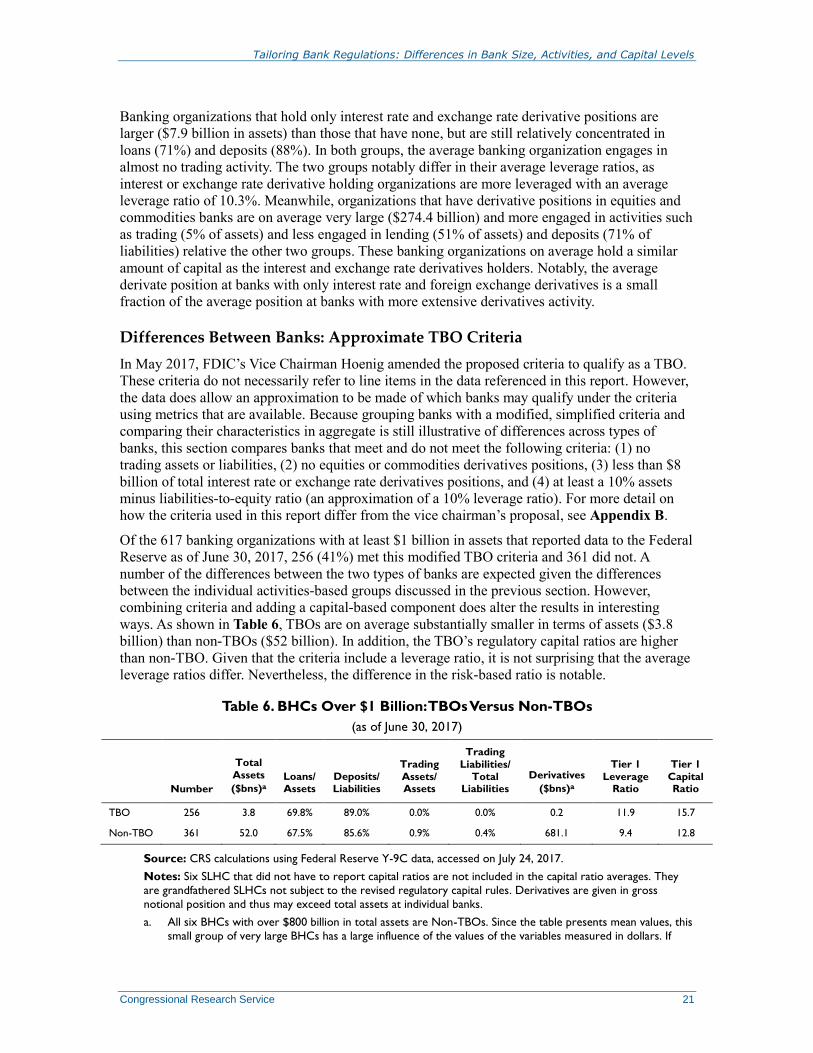
Tailoring Bank Regulations: Differences in Bank Size, Activities, and Capital Levels
Congressional Research Service 21
Banking organizations that hold only interest rate and exchange rate derivative positions are
larger ($7.9 billion in assets) than those that have none, but are still relatively concentrated in
loans (71%) and deposits (88%). In both groups, the average banking organization engages in
almost no trading activity. The two groups notably differ in their average leverage ratios, as
interest or exchange rate derivative holding organizations are more leveraged with an average
leverage ratio of 10.3%. Meanwhile, organizations that have derivative positions in equities and
commodities banks are on average very large ($274.4 billion) and more engaged in activities such
as trading (5% of assets) and less engaged in lending (51% of assets) and deposits (71% of
liabilities) relative the other two groups. These banking organizations on average hold a similar
amount of capital as the interest and exchange rate derivatives holders. Notably, the average
derivate position at banks with only interest rate and foreign exchange derivatives is a small
fraction of the average position at banks with more extensive derivatives activity.
Differences Between Banks: Approximate TBO Criteria
In May 2017, FDIC’s Vice Chairman Hoenig amended the proposed criteria to qualify as a TBO.
These criteria do not necessarily refer to line items in the data referenced in this report. However,
the data does allow an approximation to be made of which banks may qualify under the criteria
using metrics that are available. Because grouping banks with a modified, simplified criteria and
comparing their characteristics in aggregate is still illustrative of differences across types of
banks, this section compares banks that meet and do not meet the following criteria: (1) no
trading assets or liabilities, (2) no equities or commodities derivatives positions, (3) less than $8
billion of total interest rate or exchange rate derivatives positions, and (4) at least a 10% assets
minus liabilities-to-equity ratio (an approximation of a 10% leverage ratio). For more detail on
how the criteria used in this report differ from the vice chairman’s proposal, see Appendix B.
Of the 617 banking organizations with at least $1 billion in assets that reported data to the Federal
Reserve as of June 30, 2017, 256 (41%) met this modified TBO criteria and 361 did not. A
number of the differences between the two types of banks are expected given the differences
between the individual activities-based groups discussed in the previous section. However,
combining criteria and adding a capital-based component does alter the results in interesting
ways. As shown in Table 6, TBOs are on average substantially smaller in terms of assets ($3.8
billion) than non-TBOs ($52 billion). In addition, the TBO’s regulatory capital ratios are higher
than non-TBO. Given that the criteria include a leverage ratio, it is not surprising that the average
leverage ratios differ. Nevertheless, the difference in the risk-based ratio is notable.
Table 6. BHCs Over $1 Billion: TBOs Versus Non-TBOs
(as of June 30, 2017)
Number
Total
Assets
($bns)a Loans/ Assets
Deposits/ Liabilities
Trading
Assets/ Assets
Trading
Liabilities/ Total
Liabilities
Derivatives
($bns)a
Tier 1
Leverage Ratio
Tier 1
Capital Ratio
TBO 256 3.8 69.8% 89.0% 0.0% 0.0% 0.2 11.9 15.7
Non-TBO 361 52.0 67.5% 85.6% 0.9% 0.4% 681.1 9.4 12.8
Source: CRS calculations using Federal Reserve Y-9C data, accessed on July 24, 2017.
Notes: Six SLHC that did not have to report capital ratios are not included in the capital ratio averages. They
are grandfathered SLHCs not subject to the revised regulatory capital rules. Derivatives are given in gross
notional position and thus may exceed total assets at individual banks.
a. All six BHCs with over $800 billion in total assets are Non-TBOs. Since the table presents mean values, this
small group of very large BHCs has a large influence of the values of the variables measured in dollars. If

Tailoring Bank Regulations: Differences in Bank Size, Activities, and Capital Levels
Congressional Research Service 22
those six BHCs are removed, average total assets and derivatives decrease to $23.7 billion and $55.6 billion,
respectively. The relationship that banks in this category tend to have substantially more assets and
derivatives than their counterparts still holds.
Although the loans and deposits are a larger part of the TBO’s business than non-TBOs, the
difference is relatively small compared with the differences between banks differentiated by only
activity-based criteria without a capital-based criteria examined in the previous section and
illustrated in Table 4 and Table 5. This is partly because 184 of the 361 banking organizations in
the non-TBO category met all the activities-based criteria, but failed to meet the capital-based
criteria. Thus, more than half these banks are “traditional” in the sense that they do not have
trading activity and limited derivatives, and so many may have similar characteristics to banks in
the TBO category.
Banks by Capital Levels
Whatever a bank’s size or activities, the amount of capital it holds is an indicator of its ability to
absorb losses. For this reason, some observers have asserted that capital levels should play a
prominent role in how that bank is regulated. Proponents of this approach generally favor setting
a capital ratio threshold, with banks holding greater capital being provided with regulatory relief.
This section examines capital levels across the banking industry and compares banks above a
10% leverage ratio threshold, the level at which several proposals have put forward as the
threshold at which banks could qualify for regulatory relief.
Industry Capital Level Statistics
Banks are required to meet various capital ratios that differ based on which balance sheet items
are counted as capital in the calculation, which items are included in the measure of exposure, and
whether those exposure items are risk weighted. Examining the various technical aspects of these
measures is beyond the scope of this report.77
This section groups banking organizations using a
single measure of capital—the Tier 1 leverage ratio.78
This is an un-risk-weighted measure of
capital that all banks must report. The Tier 1 capital ratio defines capital in the same way but is a
risk-weighted measure. It is presented in the tables in this section to make a comparison between
banking organizations’ risk-weighted capital indicators.
Certain correlations appear when banking organizations are compared across leverage ratios. As
shown, less-capitalized banks generally are less concentrated in loans and increasingly involved
in trading activities. In addition, they generally become less concentrated in deposits, although the
most capitalized banks (more than 12%) are less concentrated in deposits than similar cohorts
(11-12% and 10-11%), and also have an exceptionally high risk-weighted ratio.
77 For more information about capital ratios, see CRS Report R44573, Overview of the Prudential Regulatory
Framework for U.S. Banks: Basel III and the Dodd-Frank Act, by Darryl E. Getter. 78 Tier 1 capital includes both Common Equity Tier 1 capital (e.g., common stock and retained earnings) and
Additional Tier 1 capital (e.g., noncumulative perpetual preferred stock). For a complete list of instruments included in
Tier 1 capital, see FDIC, Expanded Community Bank Guide to the New Capital Rule for FDIC-Supervised Banks, pp.
p. 5-11, at https://www.fdic.gov/regulations/capital/capital/community_bank_guide_expanded.pdf.
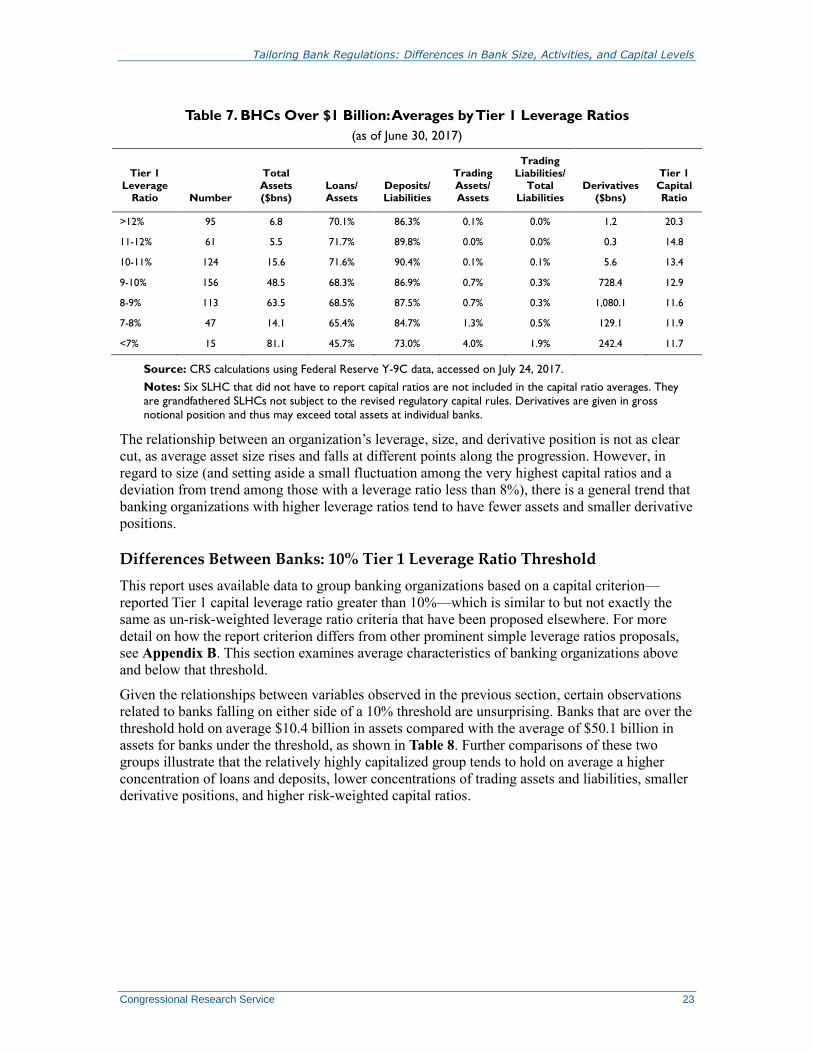
Tailoring Bank Regulations: Differences in Bank Size, Activities, and Capital Levels
Congressional Research Service 23
Table 7. BHCs Over $1 Billion: Averages by Tier 1 Leverage Ratios
(as of June 30, 2017)
Tier 1
Leverage Ratio Number
Total
Assets ($bns)
Loans/ Assets
Deposits/Liabilities
Trading
Assets/ Assets
Trading
Liabilities/ Total
Liabilities Derivatives
($bns)
Tier 1
Capital Ratio
>12% 95 6.8 70.1% 86.3% 0.1% 0.0% 1.2 20.3
11-12% 61 5.5 71.7% 89.8% 0.0% 0.0% 0.3 14.8
10-11% 124 15.6 71.6% 90.4% 0.1% 0.1% 5.6 13.4
9-10% 156 48.5 68.3% 86.9% 0.7% 0.3% 728.4 12.9
8-9% 113 63.5 68.5% 87.5% 0.7% 0.3% 1,080.1 11.6
7-8% 47 14.1 65.4% 84.7% 1.3% 0.5% 129.1 11.9
<7% 15 81.1 45.7% 73.0% 4.0% 1.9% 242.4 11.7
Source: CRS calculations using Federal Reserve Y-9C data, accessed on July 24, 2017.
Notes: Six SLHC that did not have to report capital ratios are not included in the capital ratio averages. They
are grandfathered SLHCs not subject to the revised regulatory capital rules. Derivatives are given in gross
notional position and thus may exceed total assets at individual banks.
The relationship between an organization’s leverage, size, and derivative position is not as clear
cut, as average asset size rises and falls at different points along the progression. However, in
regard to size (and setting aside a small fluctuation among the very highest capital ratios and a
deviation from trend among those with a leverage ratio less than 8%), there is a general trend that
banking organizations with higher leverage ratios tend to have fewer assets and smaller derivative
positions.
Differences Between Banks: 10% Tier 1 Leverage Ratio Threshold
This report uses available data to group banking organizations based on a capital criterion—
reported Tier 1 capital leverage ratio greater than 10%—which is similar to but not exactly the
same as un-risk-weighted leverage ratio criteria that have been proposed elsewhere. For more
detail on how the report criterion differs from other prominent simple leverage ratios proposals,
see Appendix B. This section examines average characteristics of banking organizations above
and below that threshold.
Given the relationships between variables observed in the previous section, certain observations
related to banks falling on either side of a 10% threshold are unsurprising. Banks that are over the
threshold hold on average $10.4 billion in assets compared with the average of $50.1 billion in
assets for banks under the threshold, as shown in Table 8. Further comparisons of these two
groups illustrate that the relatively highly capitalized group tends to hold on average a higher
concentration of loans and deposits, lower concentrations of trading assets and liabilities, smaller
derivative positions, and higher risk-weighted capital ratios.
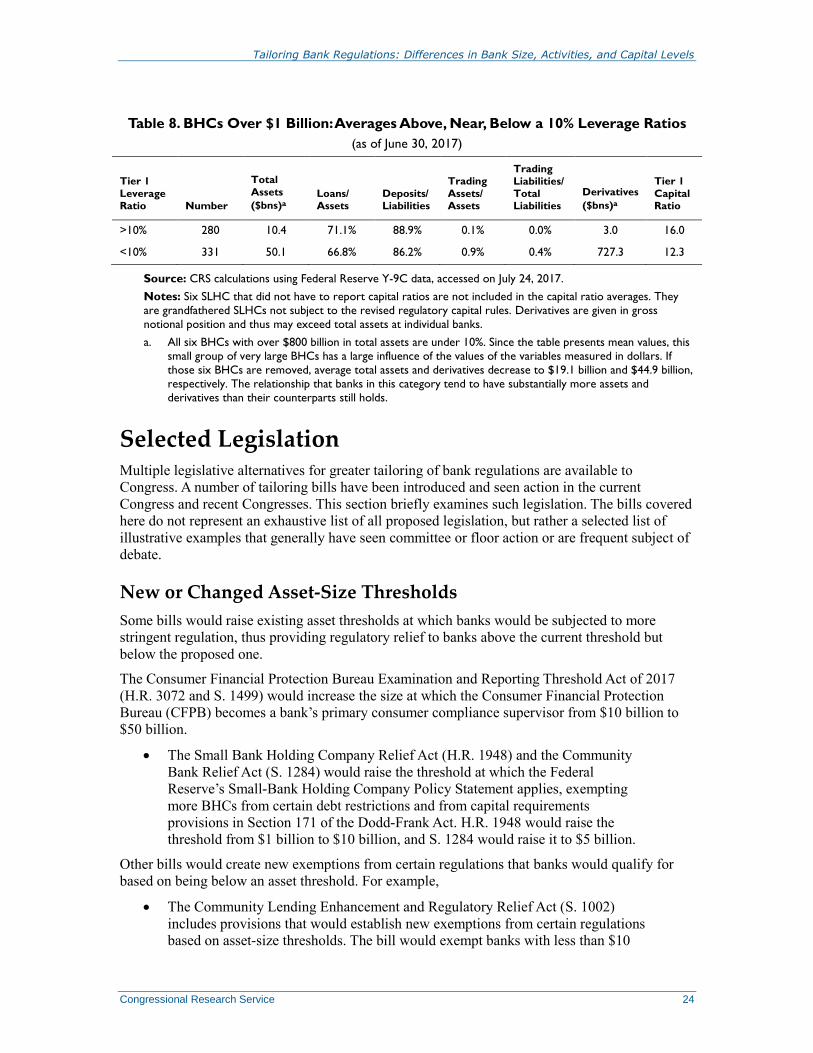
Tailoring Bank Regulations: Differences in Bank Size, Activities, and Capital Levels
Congressional Research Service 24
Table 8. BHCs Over $1 Billion: Averages Above, Near, Below a 10% Leverage Ratios
(as of June 30, 2017)
Tier 1
Leverage Ratio Number
Total
Assets
($bns)a Loans/ Assets
Deposits/Liabilities
Trading
Assets/ Assets
Trading
Liabilities/Total Liabilities
Derivatives
($bns)a
Tier 1
Capital Ratio
>10% 280 10.4 71.1% 88.9% 0.1% 0.0% 3.0 16.0
<10% 331 50.1 66.8% 86.2% 0.9% 0.4% 727.3 12.3
Source: CRS calculations using Federal Reserve Y-9C data, accessed on July 24, 2017.
Notes: Six SLHC that did not have to report capital ratios are not included in the capital ratio averages. They
are grandfathered SLHCs not subject to the revised regulatory capital rules. Derivatives are given in gross
notional position and thus may exceed total assets at individual banks.
a. All six BHCs with over $800 billion in total assets are under 10%. Since the table presents mean values, this
small group of very large BHCs has a large influence of the values of the variables measured in dollars. If
those six BHCs are removed, average total assets and derivatives decrease to $19.1 billion and $44.9 billion,
respectively. The relationship that banks in this category tend to have substantially more assets and
derivatives than their counterparts still holds.
Selected Legislation Multiple legislative alternatives for greater tailoring of bank regulations are available to
Congress. A number of tailoring bills have been introduced and seen action in the current
Congress and recent Congresses. This section briefly examines such legislation. The bills covered
here do not represent an exhaustive list of all proposed legislation, but rather a selected list of
illustrative examples that generally have seen committee or floor action or are frequent subject of
debate.
New or Changed Asset-Size Thresholds
Some bills would raise existing asset thresholds at which banks would be subjected to more
stringent regulation, thus providing regulatory relief to banks above the current threshold but
below the proposed one.
The Consumer Financial Protection Bureau Examination and Reporting Threshold Act of 2017
(H.R. 3072 and S. 1499) would increase the size at which the Consumer Financial Protection
Bureau (CFPB) becomes a bank’s primary consumer compliance supervisor from $10 billion to
$50 billion.
The Small Bank Holding Company Relief Act (H.R. 1948) and the Community
Bank Relief Act (S. 1284) would raise the threshold at which the Federal
Reserve’s Small-Bank Holding Company Policy Statement applies, exempting
more BHCs from certain debt restrictions and from capital requirements
provisions in Section 171 of the Dodd-Frank Act. H.R. 1948 would raise the
threshold from $1 billion to $10 billion, and S. 1284 would raise it to $5 billion.
Other bills would create new exemptions from certain regulations that banks would qualify for
based on being below an asset threshold. For example,
The Community Lending Enhancement and Regulatory Relief Act (S. 1002)
includes provisions that would establish new exemptions from certain regulations
based on asset-size thresholds. The bill would exempt banks with less than $10
Tailoring Bank Regulations: Differences in Bank Size, Activities, and Capital Levels
Congressional Research Service 25
billion in assets from the Volcker Rule (a ban on proprietary trading and certain
affiliations with investment funds) and certain lending escrow requirements, and
would add a relaxed compliance option for mortgages subject to Ability-to-Repay
standards. In addition, banks with less than $1 billion in assets would be exempt
from certain management assessments of internal controls requirements.
Activities-Based Proposals
Several bills would allow banks to qualify for exemption from certain regulations or change their
treatment under a regulation based on their nonparticipation or limited participation in certain
activities.
The Economic Growth, Regulatory Relief, and Consumer Protection Act (S.
2155) would exempt banks that have (1) less than $10 billion in assets and (2)
trading assets and liabilities less than 5% of total assets from the Volcker Rule.
The Traditional Banking Regulatory Relief Act of 2015 (H.R. 4647 in the 114th
Congress) would have created a definition of a traditional banking organization
that closely resembled the TBO criteria proposed by FDIC Vice Chairman
Thomas Hoenig discussed in an earlier section. A bank that met the classification
could have elected to meet a simple leverage ratio of 10% as the sole measure of
capital adequacy, and therefore would have exempted these banks from meeting
risk-weighted capital ratio requirements.
Other bills would classify banks based on their active involvement in certain activities, and
provide certain regulatory relief based on the particular needs of banks engaged in that activity.
The Pension, Endowment, and Mutual Fund Access to Banking Act (H.R. 2121)
directs bank regulators to define “custodial bank” based on certain activities-
based criteria, including “the percentage of total revenues generated by custodial
businesses and the level of assets under custody.” Banks meeting the definition
would not have to count deposits at a central bank, subject to certain limitations,
as an exposure for the purposes of meeting applicable supplementary leverage
ratios.
Capital-Based Proposals
Certain bills would allow banks to qualify for certain regulatory relief based on them holding a
requisite level of capital.
The Financial CHOICE Act of 2017 (FCA; H.R. 10) would allow a banking
organization to choose to be subject to a higher, 10% leverage ratio, and in
exchange would be exempt from risk-weighted capital ratios; liquidity
requirements; stress-test requirements; certain merger, acquisition, and
consolidation restrictions; limitations on dividends; and other regulations.79
Some
of the regulations from which a bank could receive relief apply to all banks, such
as the risk-weighted capital ratios set by Basel III. Other regulations from which
a bank could receive relief would apply only to larger banks, such as the Dodd-
79 Larger and more complex banks would be required to comply with the supplemental leverage ratio (which includes
off-balance-sheet exposures) and credit unions and more traditional banks would be required to comply with narrower
definitions of the leverage ratio.

Tailoring Bank Regulations: Differences in Bank Size, Activities, and Capital Levels
Congressional Research Service 26
Frank Act’s enhanced prudential regulations for banks with $50 billion or more in
assets.
Regulator Designations and Tailoring
Some bills would direct or grant authority to bank regulatory agencies to subject banks to or
exempt banks from particular regulations. In general, these bills also include provisions that
regulators perform and disclose certain analyses justifying their decisions and sometimes raise
existing thresholds.
The Systemic Risk Designation Improvement Act (H.R. 3312 and S. 1893) would
amend the provisions of the Dodd-Frank Act that subject banks with more than
$50 billion in assets to enhance prudential regulation. Instead of using this asset-
size threshold, the bills would subject banks that had been designated as globally
systemically important banks to the enhanced regulation and allow the Federal
Reserve to make a determination—provided certain factors were considered and
subject to approval by the Financial Stability Oversight Council—to extend the
enhanced regulation to certain additional banks.
The Taking Account of Institutions with Low Operation Risk Act of 2017 (H.R.
1116 and S. 366) would require federal bank regulators to consider the risk
profile and business models of individual institutions when implementing new
regulations and tailor those regulations to limit the regulatory burden. The
regulators would be required to perform certain analyses related to this tailoring
as part of the rulemaking process.
Conclusion Many policymakers and other observers generally agree that bank regulations should be tailored
to appropriately apply regulations across banks of different business models and risk profiles, and
thus increase the benefits and decreases the costs of regulation. In addition, they generally further
agree over broad characteristics of banks that would warrant greater or lesser regulatory
stringency (e.g., small and traditional banks serving the credit needs of a community should be
subject to less regulation than large and complex banks operating on a national or global scale).
However, determining how tailoring should be achieved is a contentious issue. Policymakers and
observers disagree over whether simple “bright line” rules based on certain criteria achieve
appropriate tailoring. In part, this stems from disagreement over the degree to which asset size,
business activities, and capital levels are appropriate indicators. Data presented in this report
suggests that these characteristics are correlated to each other, as asset size, trading activity, and
likelihood of holding significant derivative positions all tend to rise and fall together, whereas
capital levels move inversely to those characteristics. However, these correlations are not perfect
as any given bank may not reflect these tendencies. Because there are thousands of banks that can
vary in their business models and risk profiles in countless ways, identifying the best possible
method for achieving bank regulatory tailoring is likely to continue to be a debated issue.
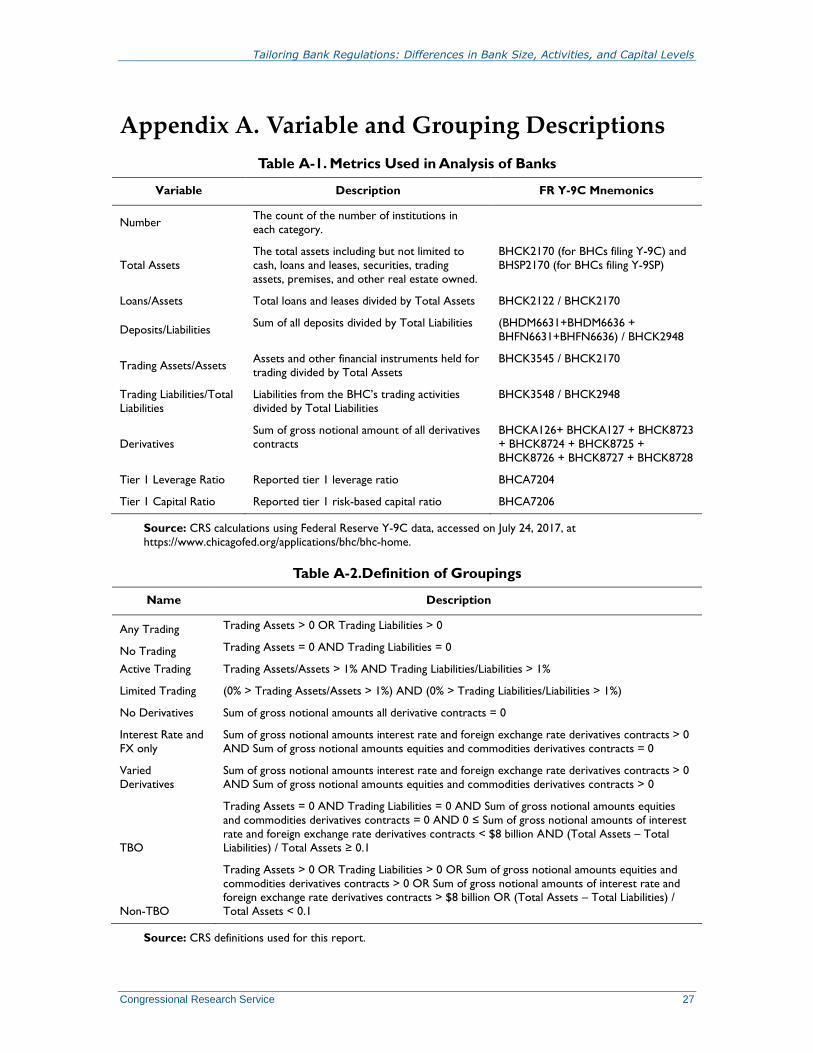
Tailoring Bank Regulations: Differences in Bank Size, Activities, and Capital Levels
Congressional Research Service 27
Appendix A. Variable and Grouping Descriptions
Table A-1. Metrics Used in Analysis of Banks
Variable Description FR Y-9C Mnemonics
Number The count of the number of institutions in
each category.
Total Assets
The total assets including but not limited to
cash, loans and leases, securities, trading
assets, premises, and other real estate owned.
BHCK2170 (for BHCs filing Y-9C) and
BHSP2170 (for BHCs filing Y-9SP)
Loans/Assets Total loans and leases divided by Total Assets BHCK2122 / BHCK2170
Deposits/Liabilities Sum of all deposits divided by Total Liabilities (BHDM6631+BHDM6636 +
BHFN6631+BHFN6636) / BHCK2948
Trading Assets/Assets Assets and other financial instruments held for
trading divided by Total Assets
BHCK3545 / BHCK2170
Trading Liabilities/Total
Liabilities
Liabilities from the BHC’s trading activities
divided by Total Liabilities
BHCK3548 / BHCK2948
Derivatives
Sum of gross notional amount of all derivatives
contracts
BHCKA126+ BHCKA127 + BHCK8723
+ BHCK8724 + BHCK8725 +
BHCK8726 + BHCK8727 + BHCK8728
Tier 1 Leverage Ratio Reported tier 1 leverage ratio BHCA7204
Tier 1 Capital Ratio Reported tier 1 risk-based capital ratio BHCA7206
Source: CRS calculations using Federal Reserve Y-9C data, accessed on July 24, 2017, at
https://www.chicagofed.org/applications/bhc/bhc-home.
Table A-2.Definition of Groupings
Name Description
Any Trading Trading Assets > 0 OR Trading Liabilities > 0
No Trading Trading Assets = 0 AND Trading Liabilities = 0
Active Trading Trading Assets/Assets > 1% AND Trading Liabilities/Liabilities > 1%
Limited Trading (0% > Trading Assets/Assets > 1%) AND (0% > Trading Liabilities/Liabilities > 1%)
No Derivatives Sum of gross notional amounts all derivative contracts = 0
Interest Rate and
FX only
Sum of gross notional amounts interest rate and foreign exchange rate derivatives contracts > 0
AND Sum of gross notional amounts equities and commodities derivatives contracts = 0
Varied
Derivatives
Sum of gross notional amounts interest rate and foreign exchange rate derivatives contracts > 0
AND Sum of gross notional amounts equities and commodities derivatives contracts > 0
TBO
Trading Assets = 0 AND Trading Liabilities = 0 AND Sum of gross notional amounts equities
and commodities derivatives contracts = 0 AND 0 ≤ Sum of gross notional amounts of interest
rate and foreign exchange rate derivatives contracts < $8 billion AND (Total Assets – Total
Liabilities) / Total Assets ≥ 0.1
Non-TBO
Trading Assets > 0 OR Trading Liabilities > 0 OR Sum of gross notional amounts equities and
commodities derivatives contracts > 0 OR Sum of gross notional amounts of interest rate and foreign exchange rate derivatives contracts > $8 billion OR (Total Assets – Total Liabilities) /
Total Assets < 0.1
Source: CRS definitions used for this report.

Tailoring Bank Regulations: Differences in Bank Size, Activities, and Capital Levels
Congressional Research Service 28
Appendix B. Traditional Banking Organization
Criteria and Leverage Ratios Compared The grouping of banks as Traditional Banking Organizations, or TBOs, in this report and the
grouping that would occur under FDIC Vice Chairman Hoenig’s proposal are not necessarily a 1-
to-1 match. As with all groupings in this report, the data comes from that reported as of June 30,
2017, but bank’s balance sheets continually change overtime. In addition, data considerations
necessitate altering the criteria for the purposes of this report.
The criteria in FDIC Vice Chairman Hoenig’s May 2017 proposal to classify banks as a TBO are
as follows:
1. The bank holds no trading assets or liabilities (other than permissible
derivatives);
2. The bank holds no derivative positions other than interest rate and foreign
exchange derivatives;
3. The total notional value of all the bank’s derivatives exposures—including
cleared and non-cleared derivatives—is less than $8 billion; and
4. The bank maintains a ratio of Generally Accepted Accounting Principles equity-
to-assets of at least 10% (there is a two-year transition period to meet this ratio).
The criteria used in this report to classify banks as TBO are as follows:
1. The bank holds no trading assets or liabilities;
2. The bank holds no derivative positions other than interest rate and foreign
exchange derivatives;
3. The total notional value of all its derivatives exposures—including cleared and
non-cleared derivatives—is less than $8 billion; and
4. The bank maintains a ratio of equity-to-assets ratio (with equity defined as assets
minus liabilities) of at least 10% (this ratio is as reported as of June 30, 2017).
Possible discrepancies for qualification under each criteria could occur when (1) a bank that has
trading assets and liabilities exclusively consisting of interest rate and foreign exchange
derivatives held for trading or (2) a bank could report the ratio of equity-to-assets under
Generally Accepted Accounting Principles differs from the ratio of asset minus liabilities-to-
equity and that difference is large enough so that the bank crosses the 10% threshold.
In addition, the leverage ratio data used in this report may be calculated differently than those
defined in different proposals. This report uses the Tier 1 leverage ratio reported by BHCs in the
Y-9C forms submitted to the Federal Reserve. Vice Chairman Hoenig’s proposal would use the
Generally Accepted Accounting Principles equity-to-assets ratio. The Financial CHOICE Act
(H.R. 10; the FCA) defines the leverage ratio for traditional banking organization as “total assets
(minus any items deducted from common equity tier 1 capital) as calculated in accordance with
generally accepted accounting principles and as reported on the traditional banking organization’s
applicable regulatory filing with the banking organization’s appropriate Federal banking agency”
divided by tangible equity. For banking organizations that do not qualify as TBOs, the FCA
Tailoring Bank Regulations: Differences in Bank Size, Activities, and Capital Levels
Congressional Research Service 29
defines the leverage ratio as the total leverage exposure as calculated by advanced approaches
banks in their supplementary leverage ratio requirement divided by tangible equity.80
Author Contact Information
David W. Perkins
Analyst in Macroeconomic Policy
[email protected], 7-6626
80 H.R. 10, Section 605.