Embed Size (px)
Citation preview
197
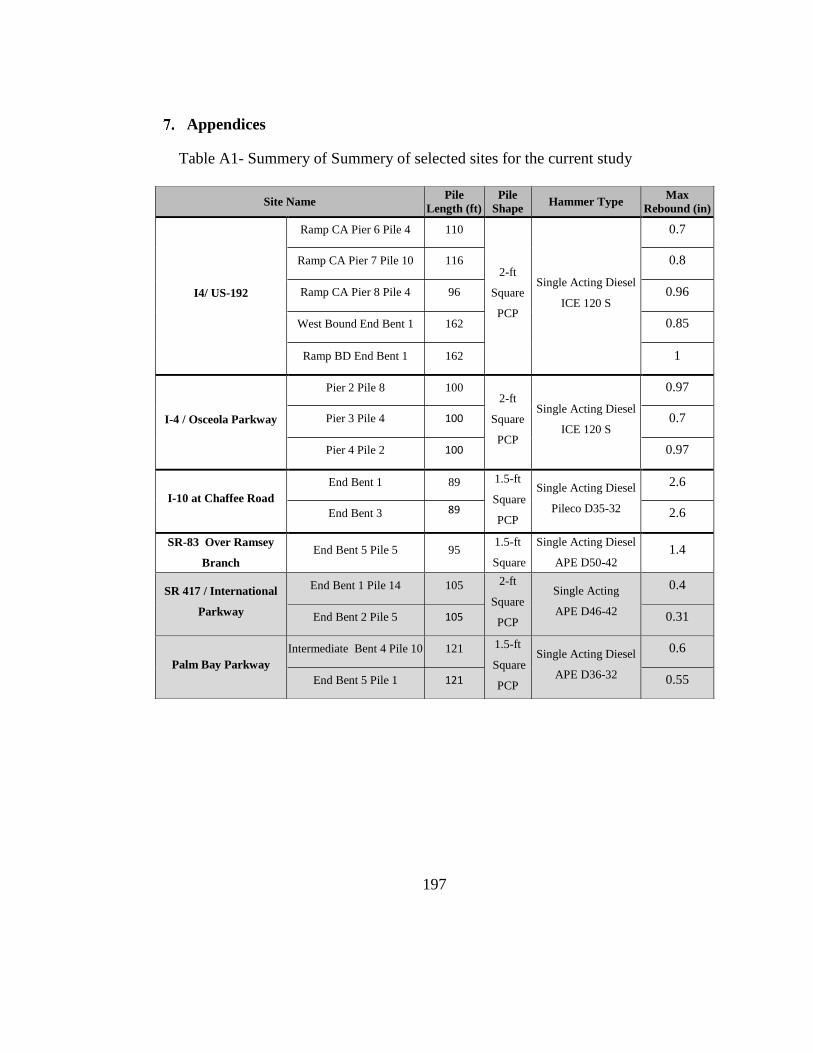
Appendices
Table A1- Summery of Summery of selected sites for the current study
Site Name Pile
Length (ft)
Pile
Shape Hammer Type
Max
Rebound (in)
I4/ US-192
Ramp CA Pier 6 Pile 4 110
2-ft
Square
PCP
Single Acting Diesel
ICE 120 S
0.7
Ramp CA Pier 7 Pile 10 116 0.8
Ramp CA Pier 8 Pile 4 96 0.96
West Bound End Bent 1 162 0.85
Ramp BD End Bent 1 162 1
I-4 / Osceola Parkway
Pier 2 Pile 8 100 2-ft
Square
PCP
Single Acting Diesel
ICE 120 S
0.97
Pier 3 Pile 4 100 0.7
Pier 4 Pile 2 100 0.97
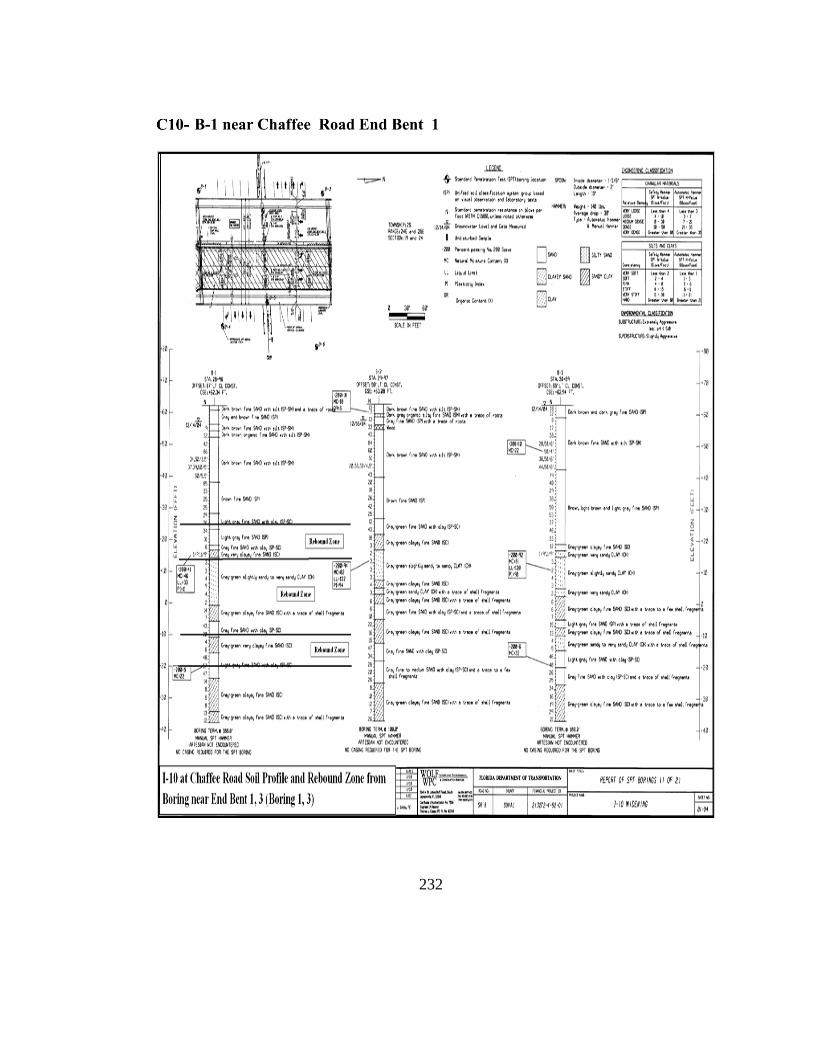
I-10 at Chaffee Road
End Bent 1 89 1.5-ft
Square
PCP
Single Acting Diesel
Pileco D35-32
2.6
End Bent 3 89
2.6
SR-83 Over Ramsey
Branch End Bent 5 Pile 5 95
1.5-ft
Square
PCP
Single Acting Diesel
APE D50-42 1.4
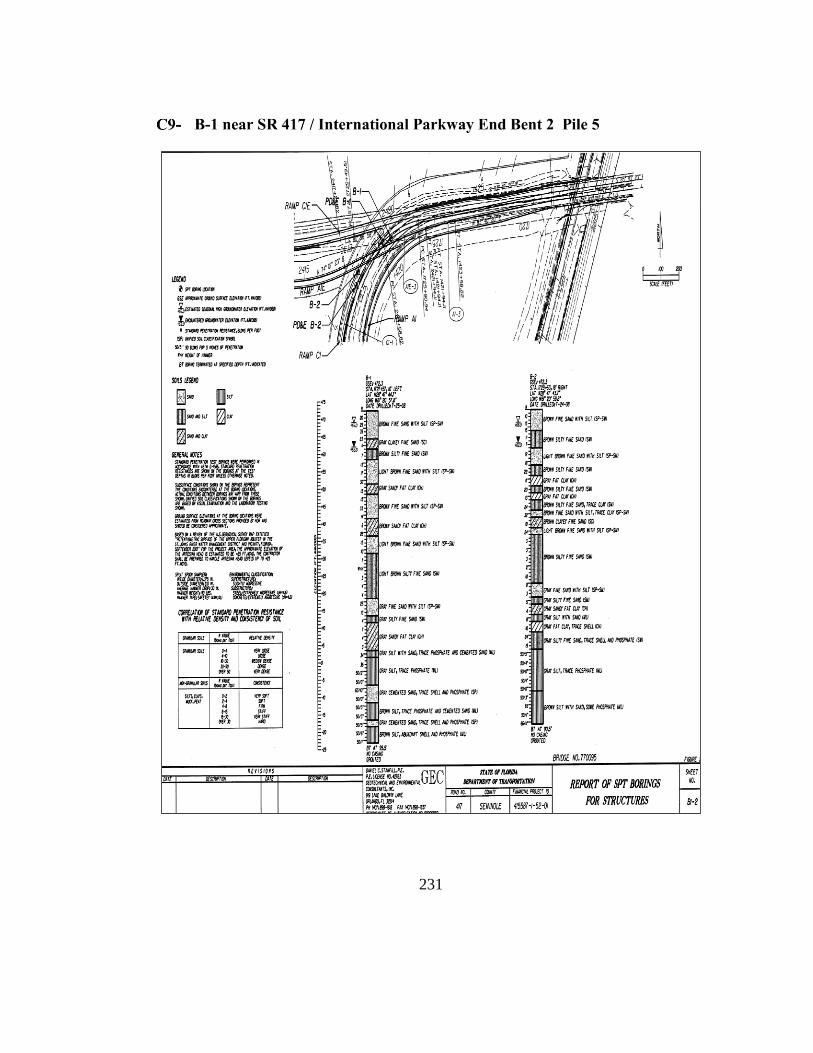
SR 417 / International
Parkway
End Bent 1 Pile 14 105 2-ft
Square
PCP
Single Acting
APE D46-42
0.4
End Bent 2 Pile 5 105 0.31
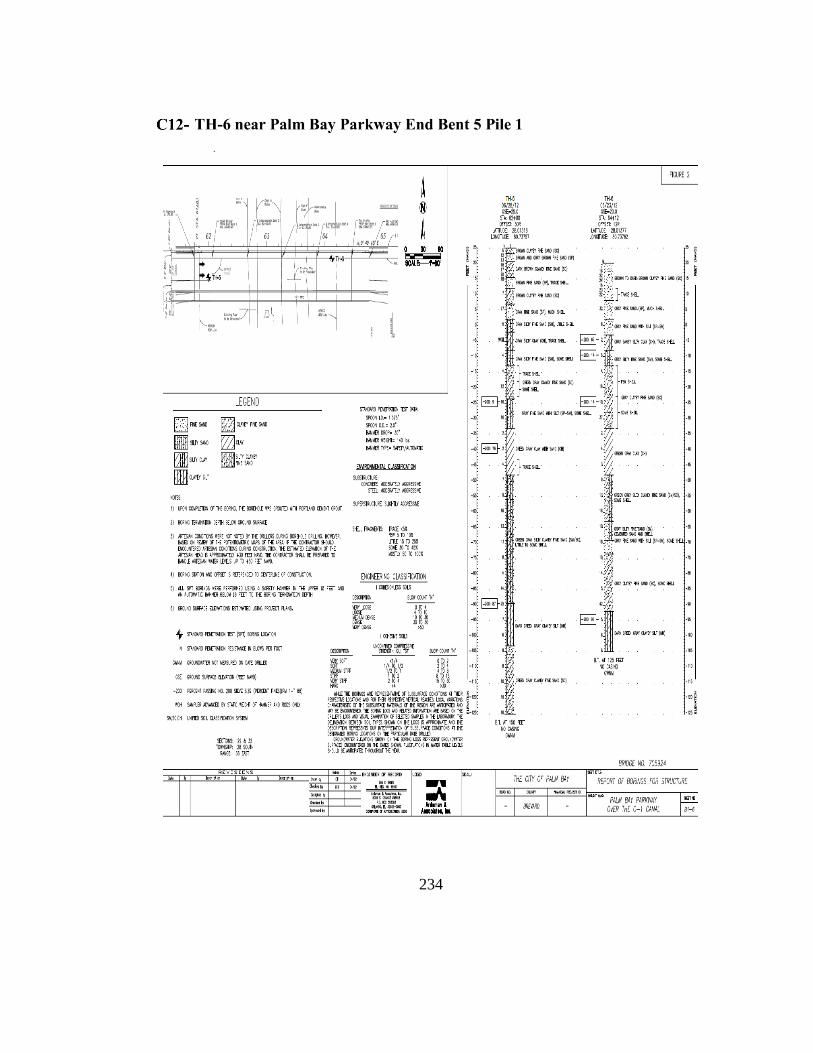
Palm Bay Parkway
Intermediate Bent 4 Pile 10 121 1.5-ft
Square
PCP
Single Acting Diesel
APE D36-32
0.6
End Bent 5 Pile 1 121 0.55
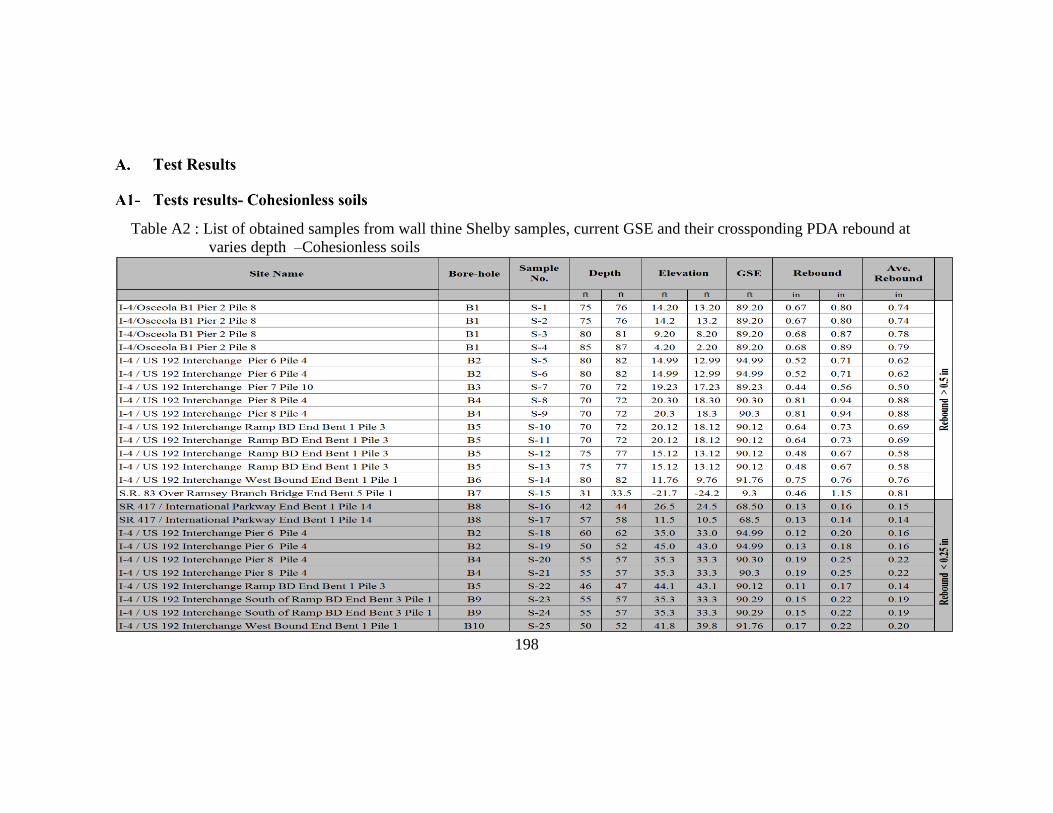
198
Table A2 : List of obtained samples from wall thine Shelby samples, current GSE and their crossponding PDA rebound at
varies depth –Cohesionless soils
199
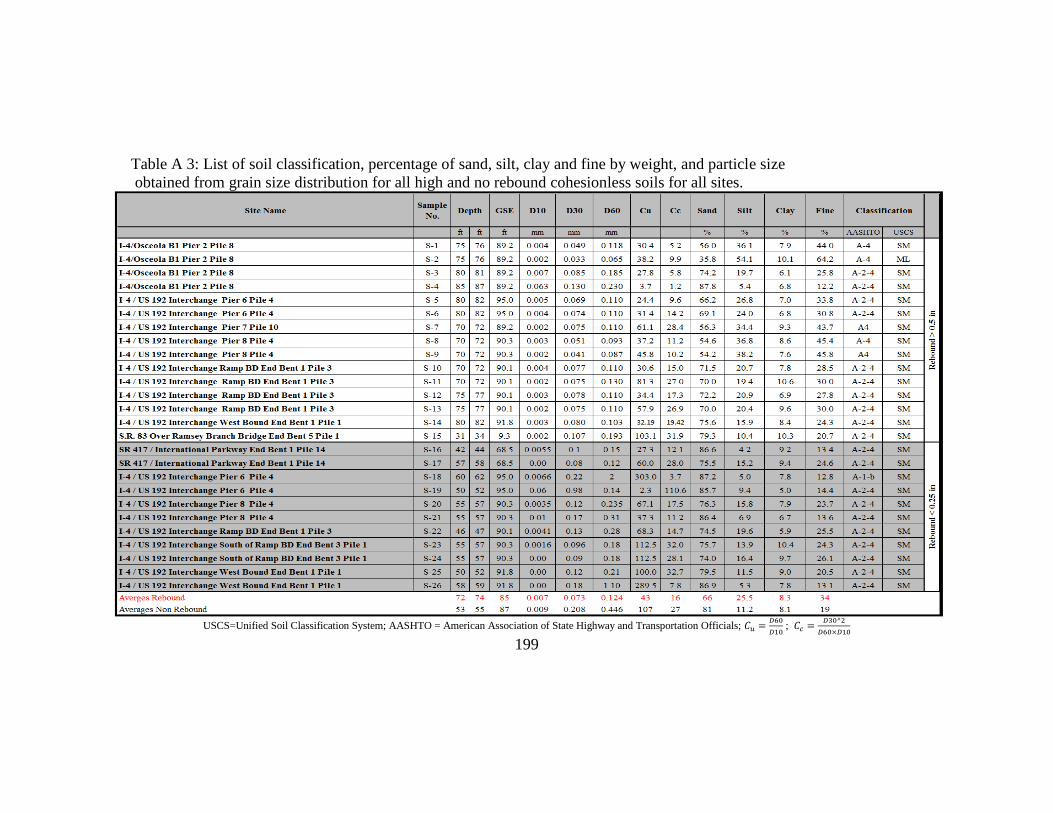
Table A 3: List of soil classification, percentage of sand, silt, clay and fine by weight, and particle size
obtained from grain size distribution for all high and no rebound cohesionless soils for all sites.
USCS=Unified Soil Classification System; AASHTO = American Association of State Highway and Transportation Officials; 𝐶𝑢 =
𝐷60
𝐷10 ; 𝐶𝑐 =
𝐷30^2
𝐷60×𝐷10
200
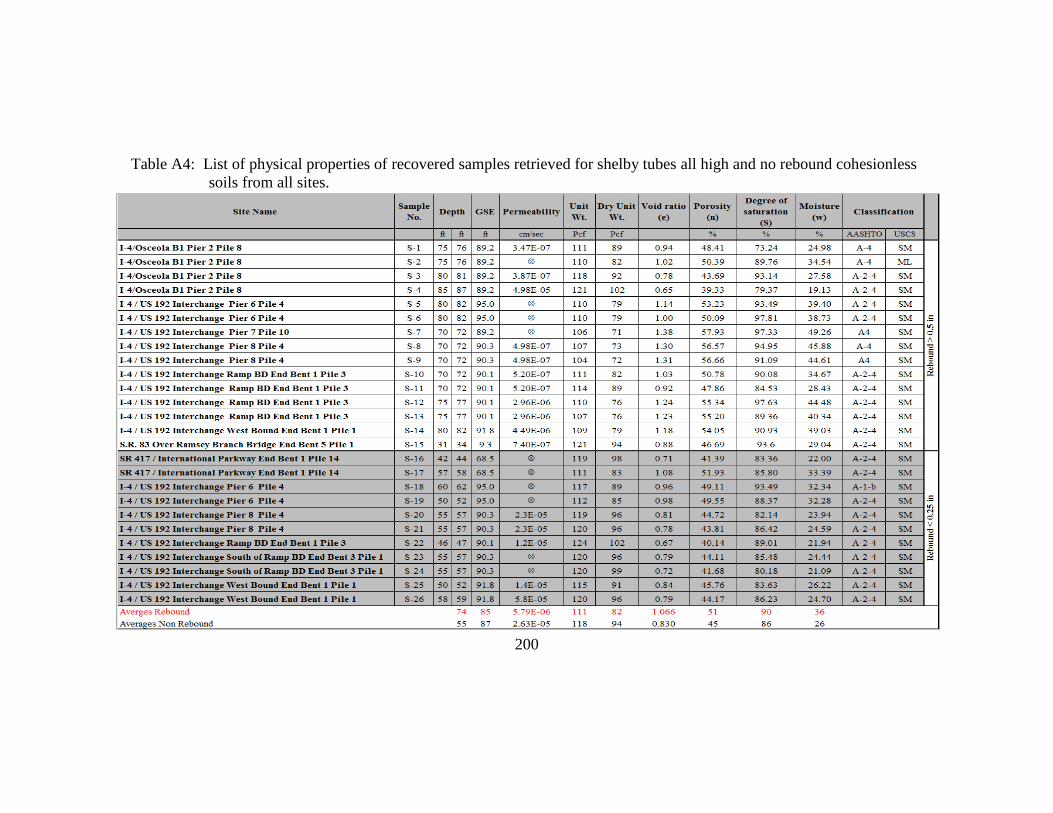
Table A4: List of physical properties of recovered samples retrieved for shelby tubes all high and no rebound cohesionless
soils from all sites.
201
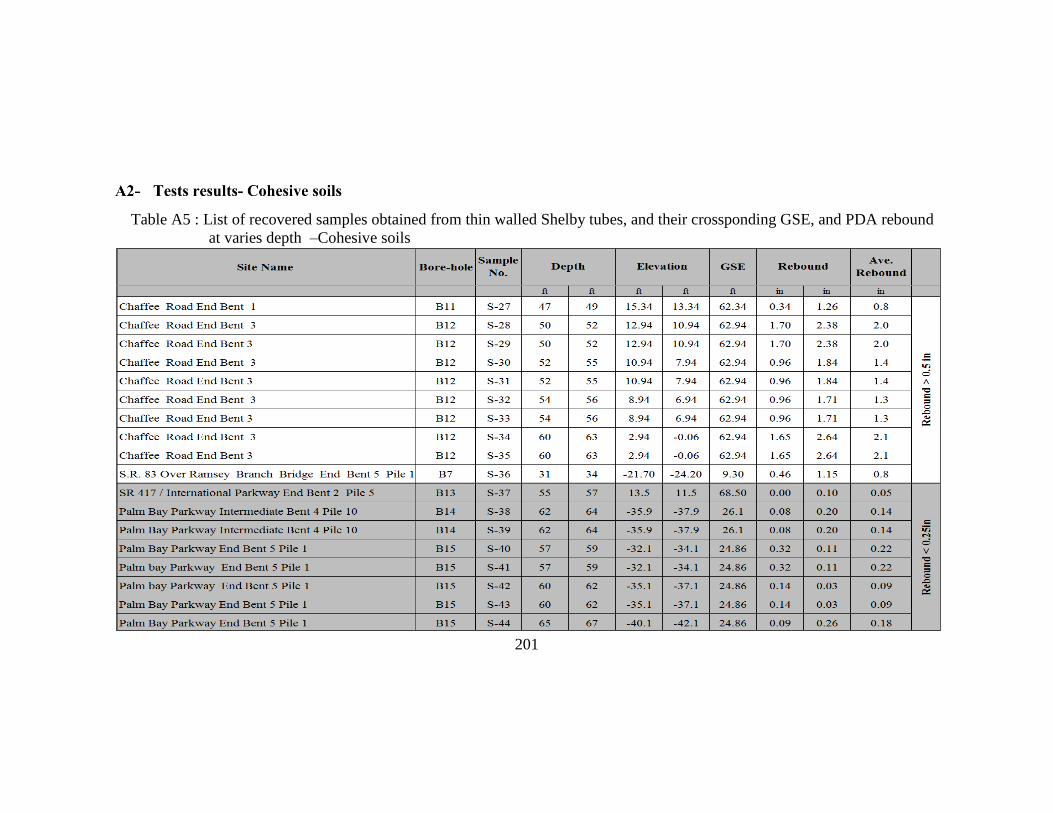
Table A5 : List of recovered samples obtained from thin walled Shelby tubes, and their crossponding GSE, and PDA rebound
at varies depth –Cohesive soils
202
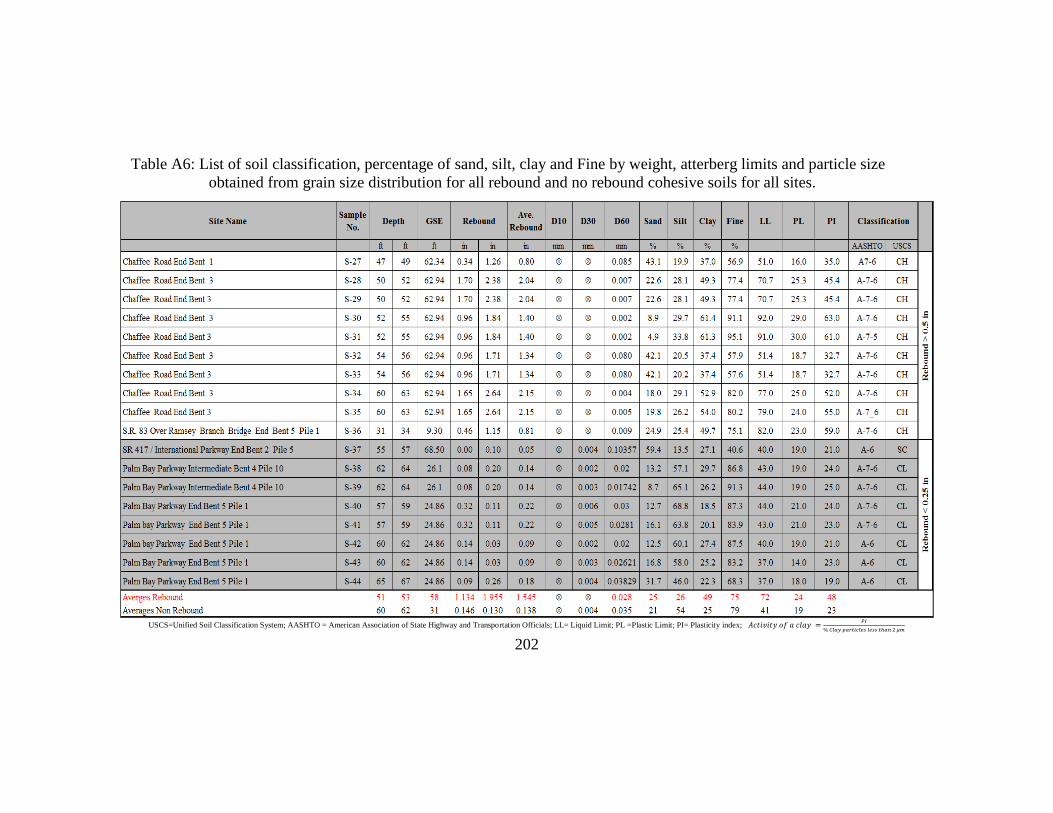
Table A6: List of soil classification, percentage of sand, silt, clay and Fine by weight, atterberg limits and particle size
obtained from grain size distribution for all rebound and no rebound cohesive soils for all sites.
USCS=Unified Soil Classification System; AASHTO = American Association of State Highway and Transportation Officials; LL= Liquid Limit; PL =Plastic Limit; PI= Plasticity index; 𝐴𝑐𝑡𝑖𝑣𝑖𝑡𝑦 𝑜𝑓 𝑎 𝑐𝑙𝑎𝑦 =𝑃𝐼
% 𝐶𝑙𝑎𝑦 𝑝𝑎𝑟𝑡𝑖𝑐𝑙𝑒𝑠 𝑙𝑒𝑠𝑠 𝑡ℎ𝑎𝑛 2 𝜇𝑚
203
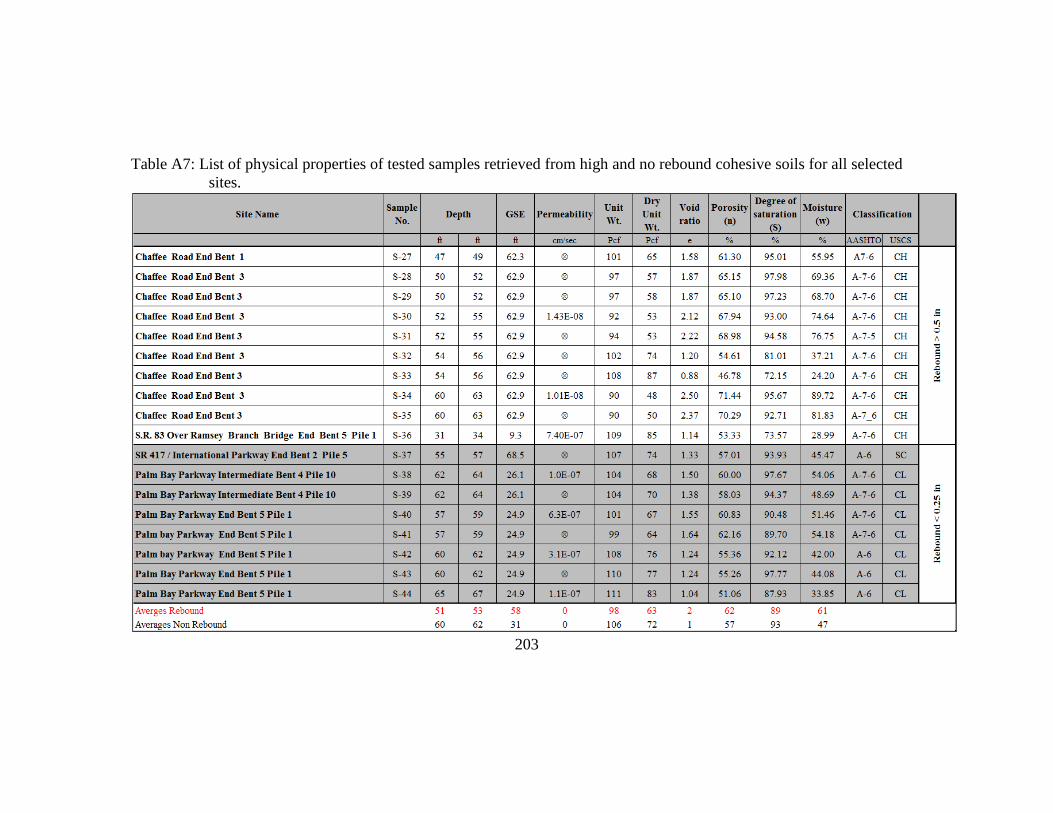
Table A7: List of physical properties of tested samples retrieved from high and no rebound cohesive soils for all selected
sites.
204
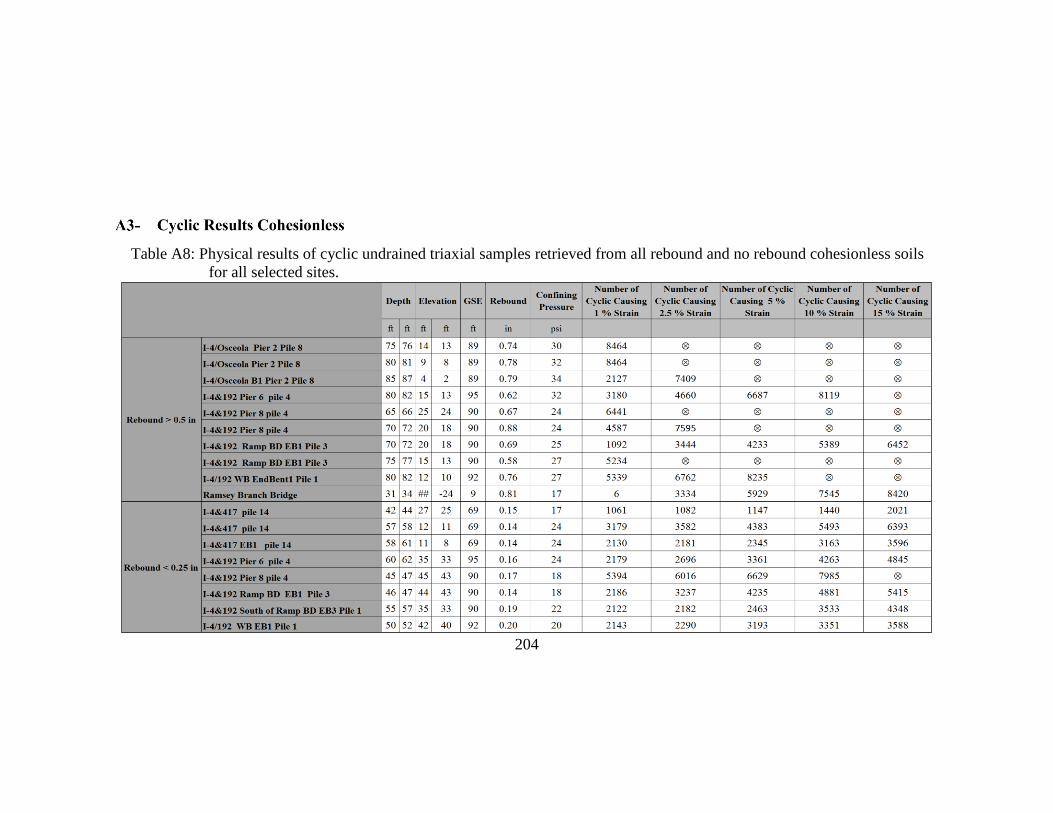
Table A8: Physical results of cyclic undrained triaxial samples retrieved from all rebound and no rebound cohesionless soils
for all selected sites.
205
Table A8: Continued-Cohesionless soils

206
Table A9: Physical results of cyclic undrained triaxial samples retrieved from all rebound and no rebound cohesive soils for
all selected sites.
207
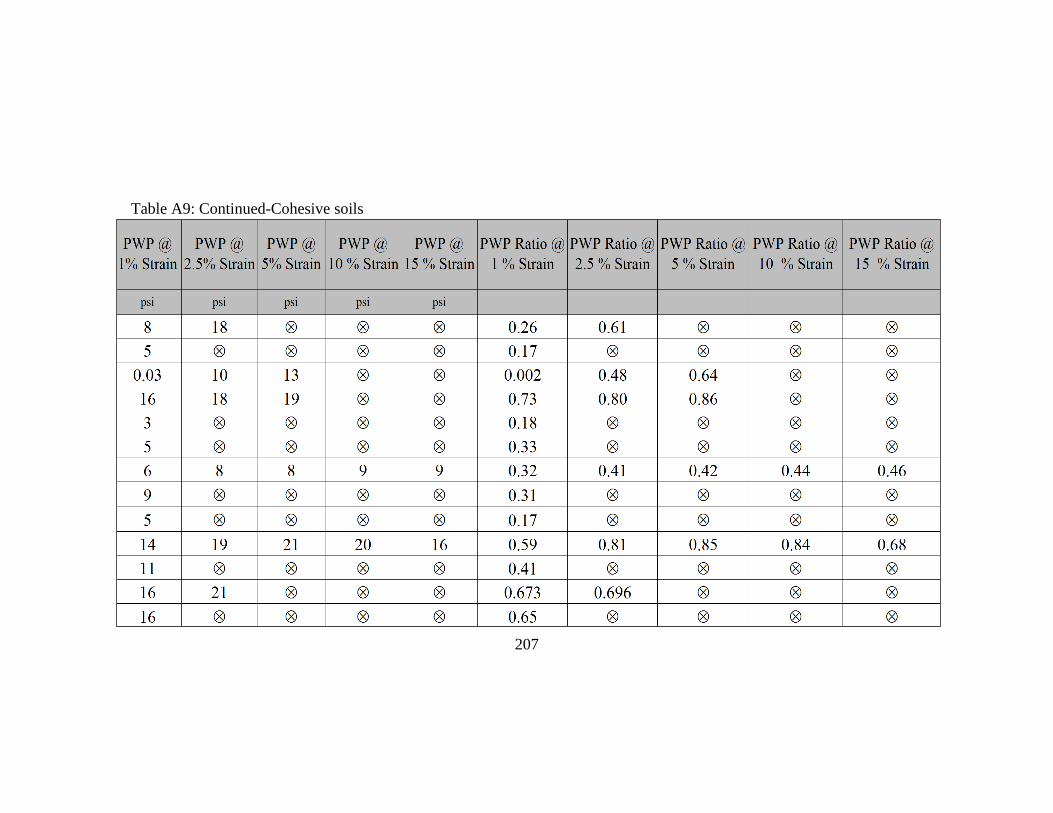
Table A9: Continued-Cohesive soils
208
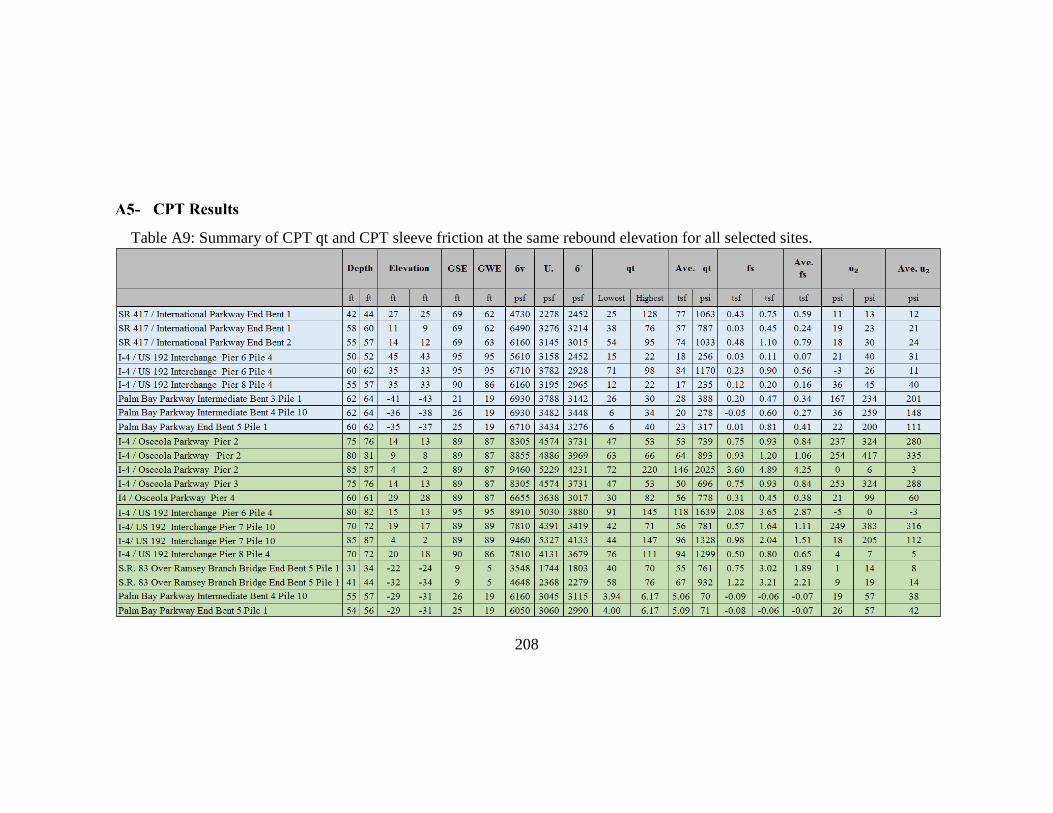
Table A9: Summary of CPT qt and CPT sleeve friction at the same rebound elevation for all selected sites.
209
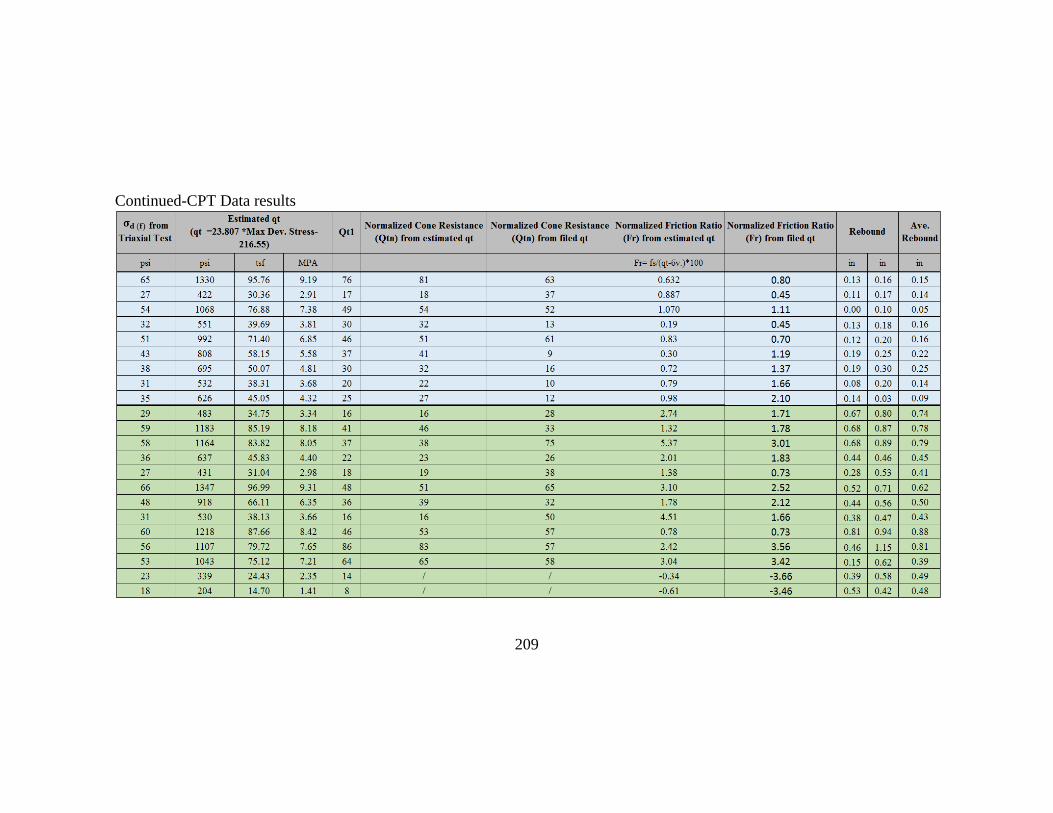
Continued-CPT Data results
210
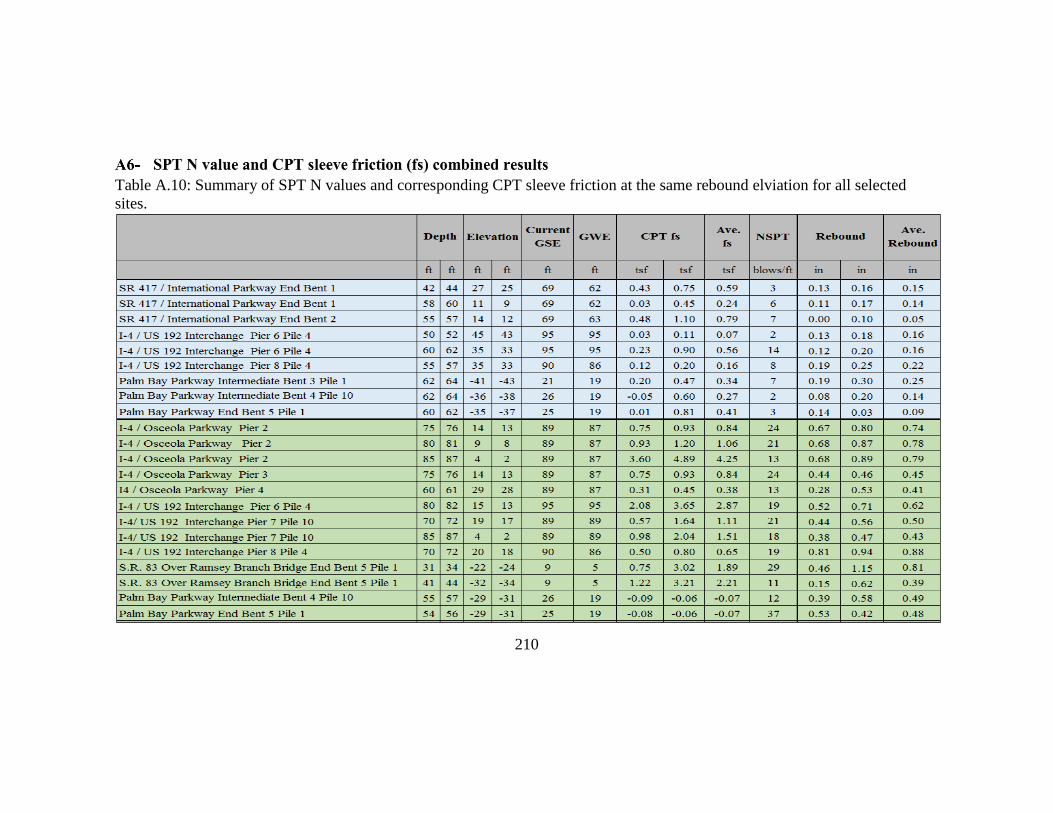
Table A.10: Summary of SPT N values and corresponding CPT sleeve friction at the same rebound elviation for all selected
sites.
211
0
10
20
30
40
50
0 0.2 0.4 0.6 0.8 1 1.2
NA
VD
Ele
vati
on
(ft
)
Maximum Displacement and Rebound (in)
Rebound
0.25 inch Rebound
Set
DMX
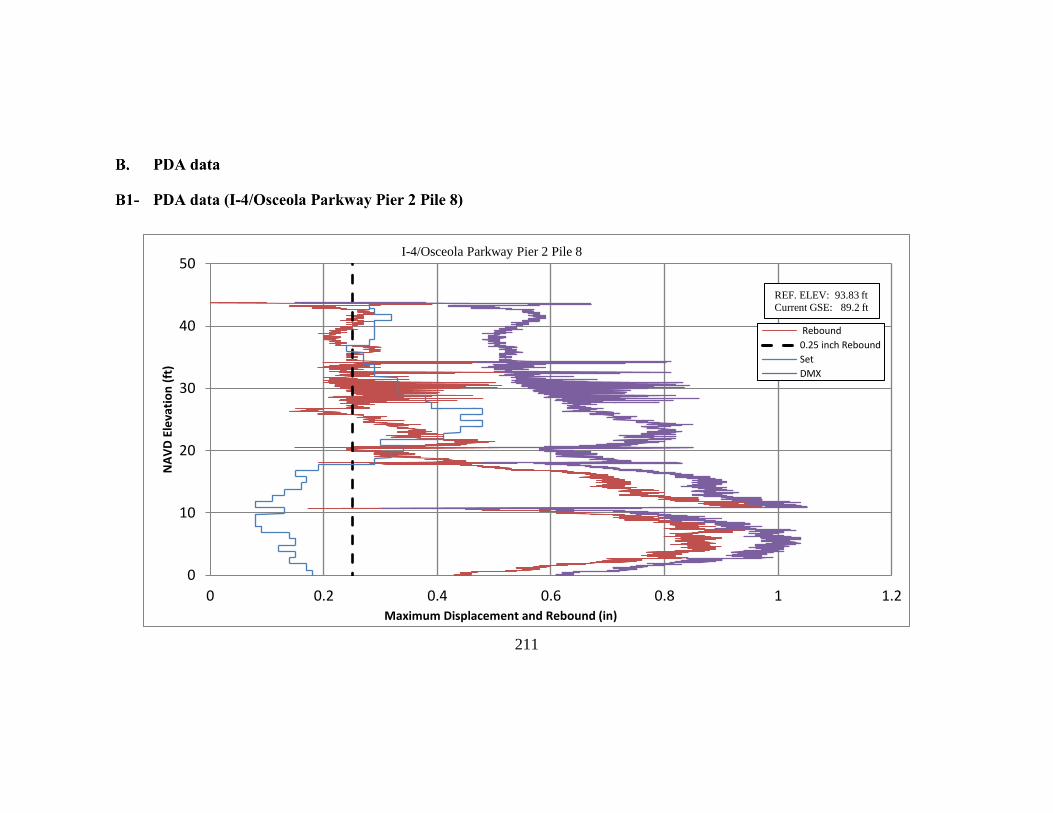
I-4/Osceola Parkway Pier 2 Pile 8
REF. ELEV: 93.83 ft
Current GSE: 89.2 ft
212
-15
-5
5
15
25
35
45
55
65
-0.1 0.1 0.3 0.5 0.7 0.9 1.1 1.3
NA
VD
Ele
vati
on
(ft
)
Maximum Displacement and Rebound (in)
DMX
Rebound PDA
0.25 inch Rebound
Set
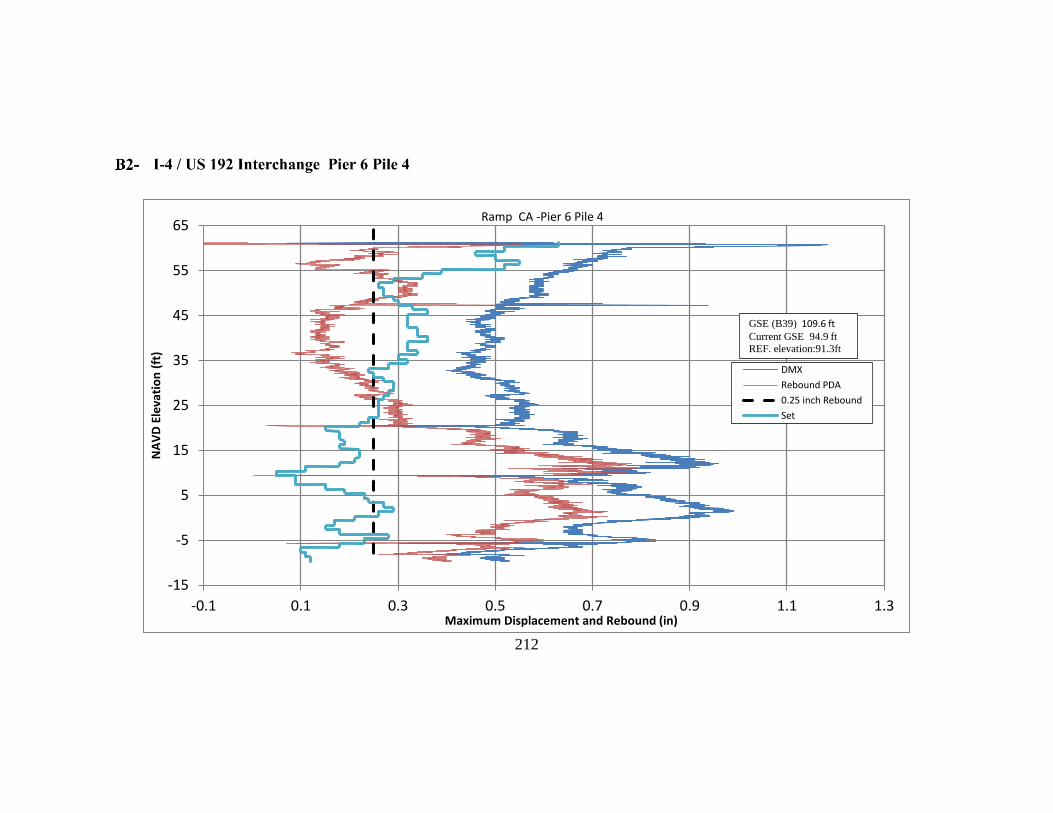
Ramp CA -Pier 6 Pile 4
GSE (B39) 109.6 ftCurrent GSE 94.9 ftREF. elevation:91.3ft
213
-10
0
10
20
30
40
50
60
70
-0.1 0 0.1 0.2 0.3 0.4 0.5 0.6 0.7 0.8 0.9
NA
VD
Ele
vati
on
(ft
)
Maximum Displacement and Rebound (in)
DMX
Rebound PDA
0.25 inch Rebound
Set
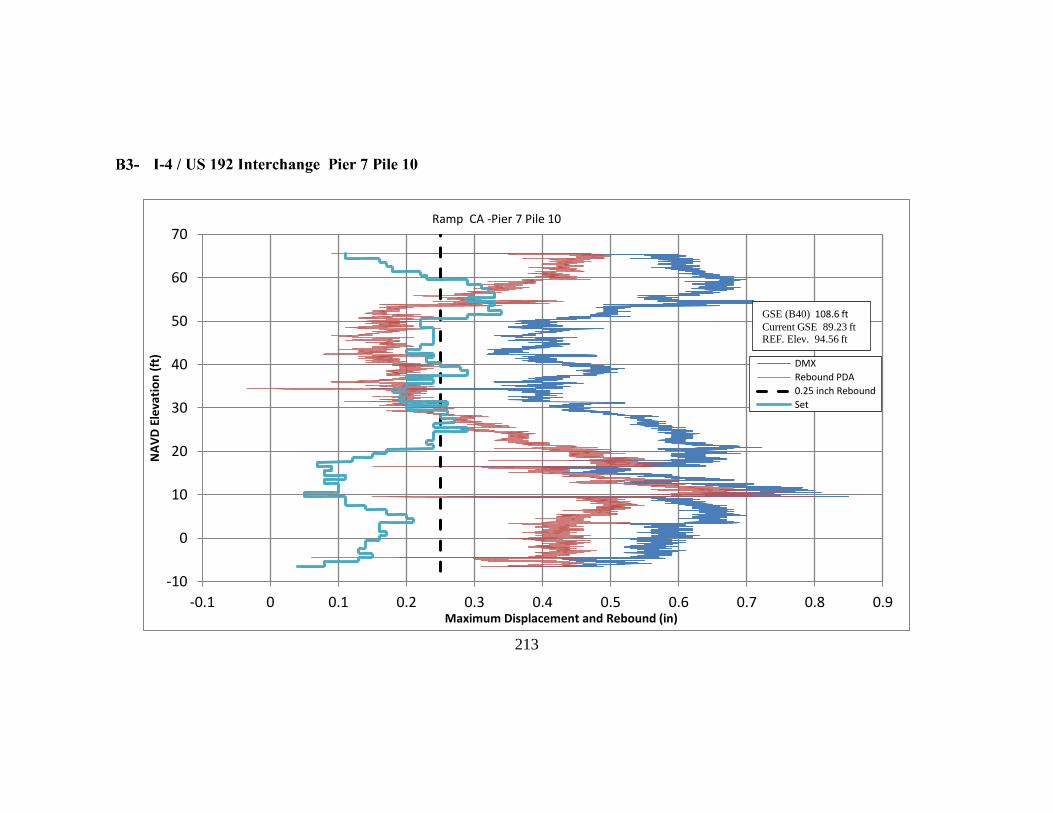
Ramp CA -Pier 7 Pile 10
GSE (B40) 108.6 ftCurrent GSE 89.23 ftREF. Elev. 94.56 ft
214
-5
5
15
25
35
45
55
65
75
0 0.2 0.4 0.6 0.8 1 1.2 1.4 1.6
NA
VD
Ele
vati
on
(ft
)
Maximum Displacement and Rebound (in)
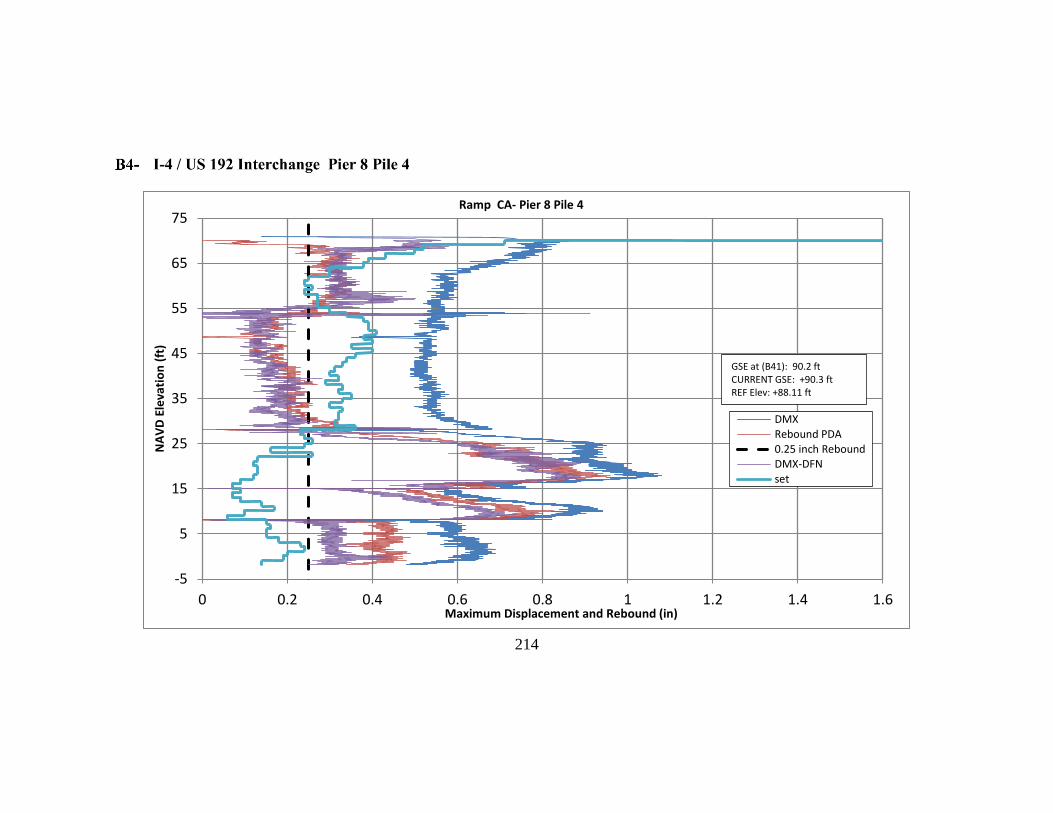
DMXRebound PDA0.25 inch ReboundDMX-DFNset
GSE at (B41): 90.2 ft CURRENT GSE: +90.3 ftREF Elev: +88.11 ft
Ramp CA- Pier 8 Pile 4
215
-5
5
15
25
35
45
55
65
75
0 0.2 0.4 0.6 0.8 1 1.2 1.4
NA
VD
Ele
vati
on
(ft
)
Maximum Displacement and Rebound (in)
DMX
Rebound PDA
0.25 inch Rebound
DMX-DFN
Set
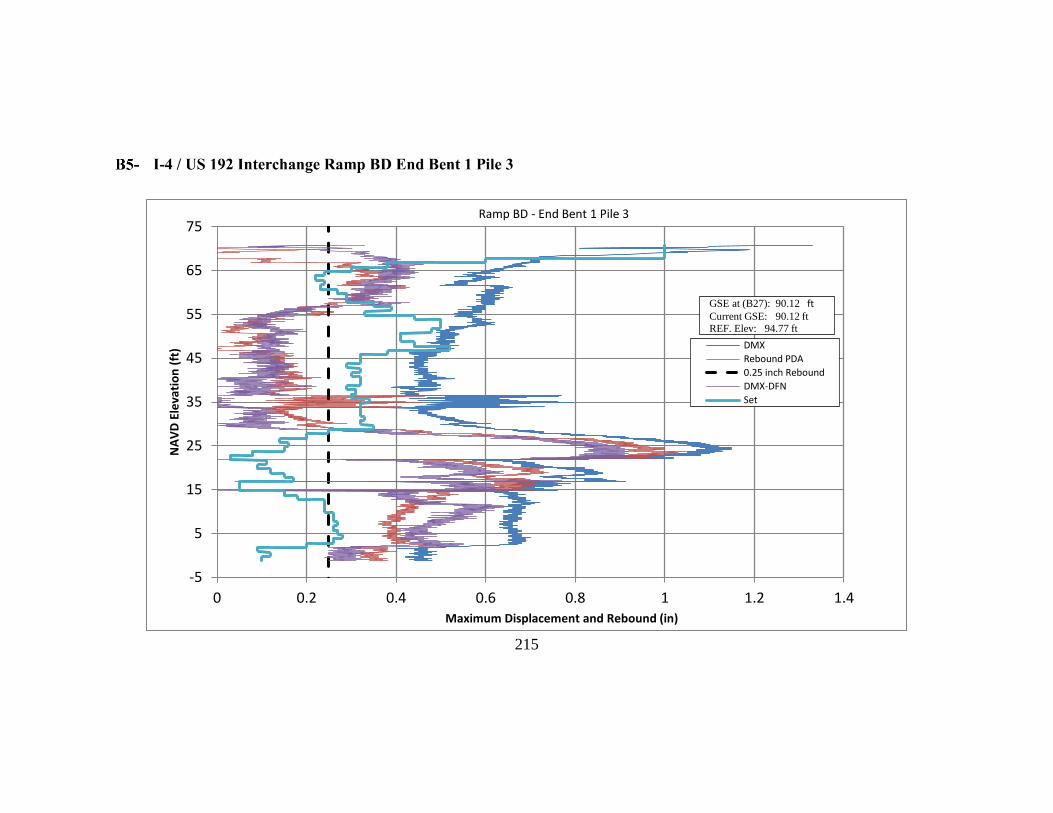
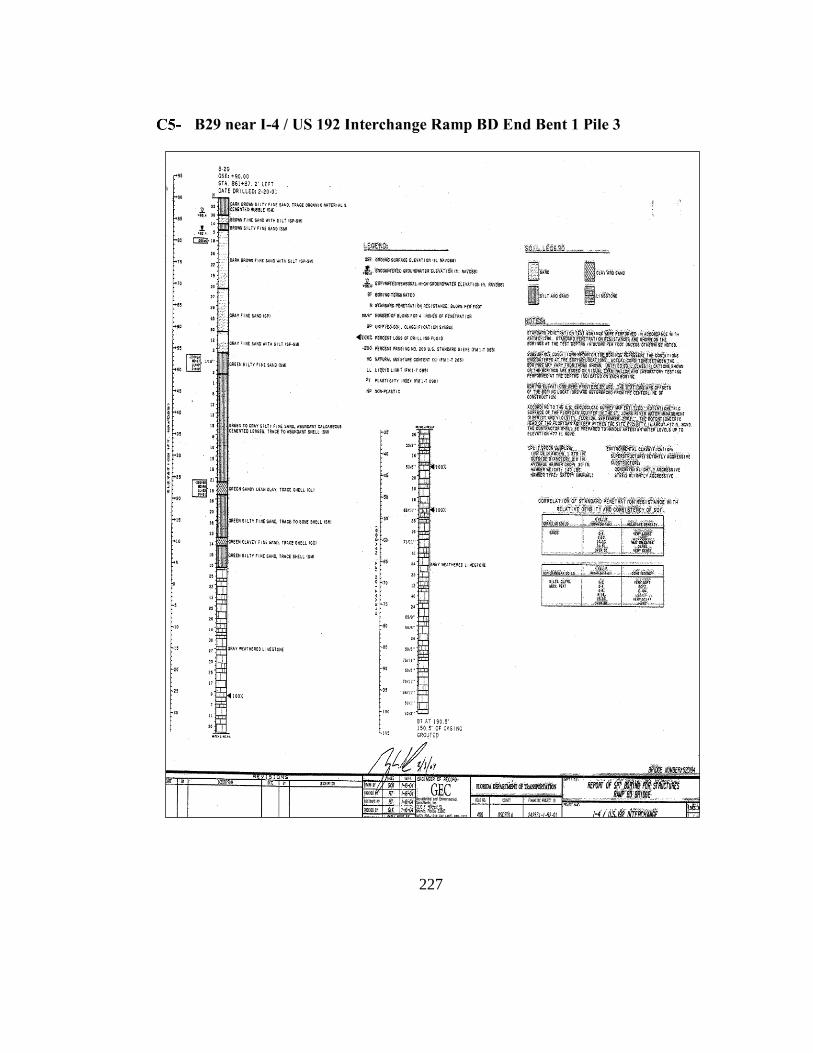
Ramp BD - End Bent 1 Pile 3
GSE at (B27): 90.12 ftCurrent GSE: 90.12 ftREF. Elev: 94.77 ft
216
0
10
20
30
40
50
60
70
0 0.2 0.4 0.6 0.8 1 1.2 1.4
NA
VD
Ele
vati
on
(ft
)
Maximum Displacement and Rebound (in)
DMX
Rebound PDA
0.25 inch Rebound
Set
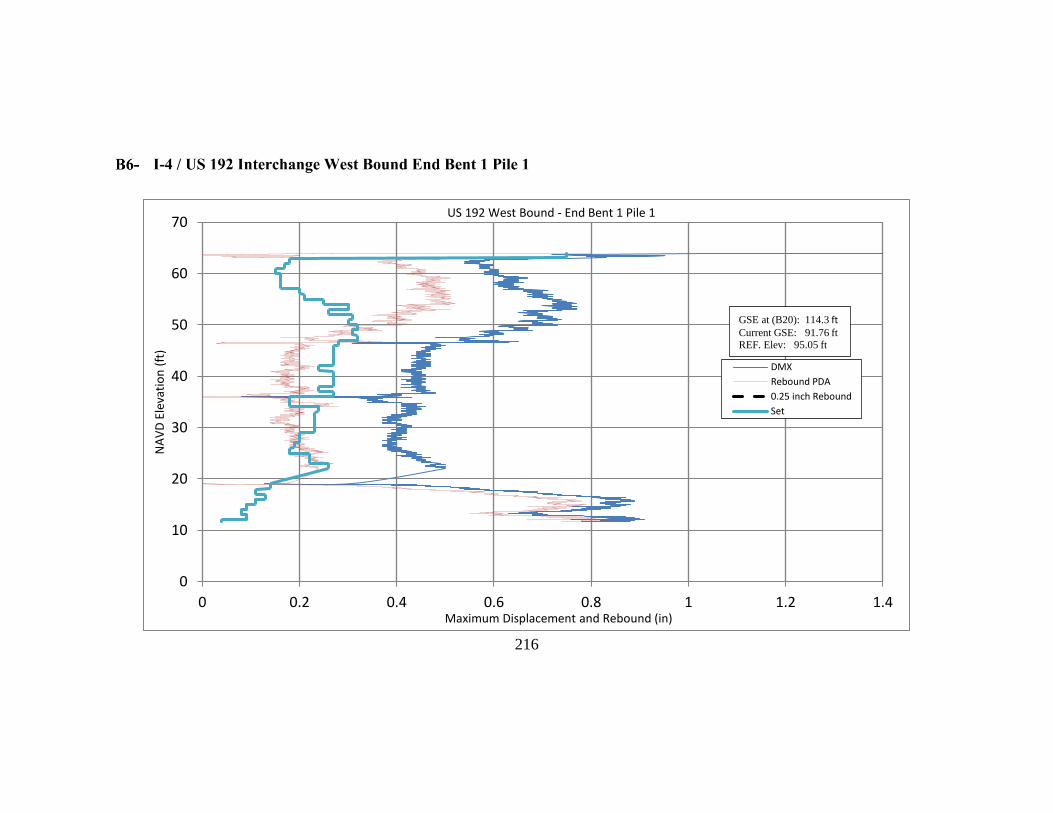
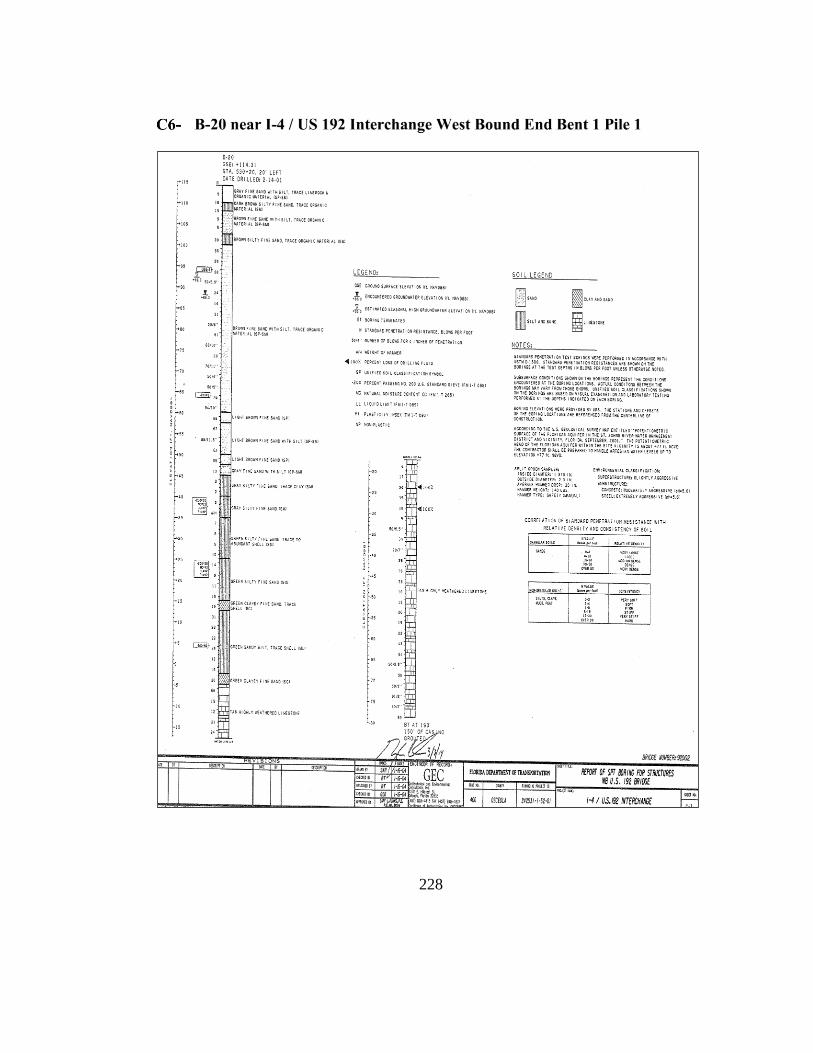
US 192 West Bound - End Bent 1 Pile 1
GSE at (B20): 114.3 ftCurrent GSE: 91.76 ftREF. Elev: 95.05 ft
217
-80
-70
-60
-50
-40
-30
-20
-10
0
0 0.5 1 1.5 2 2.5 3 3.5
NA
VD
Ele
vati
on
(ft
)
Maximum Displacement and Rebound (in)
DMX
Rebound PDA
0.25 inch Rebound
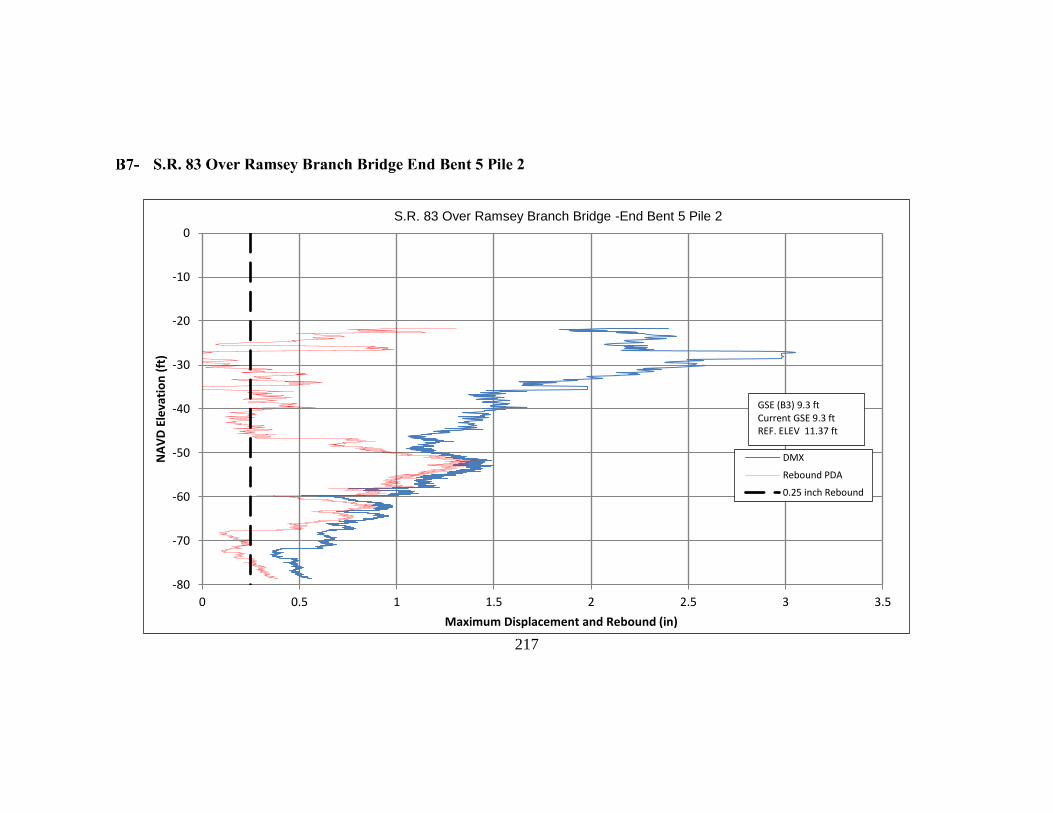
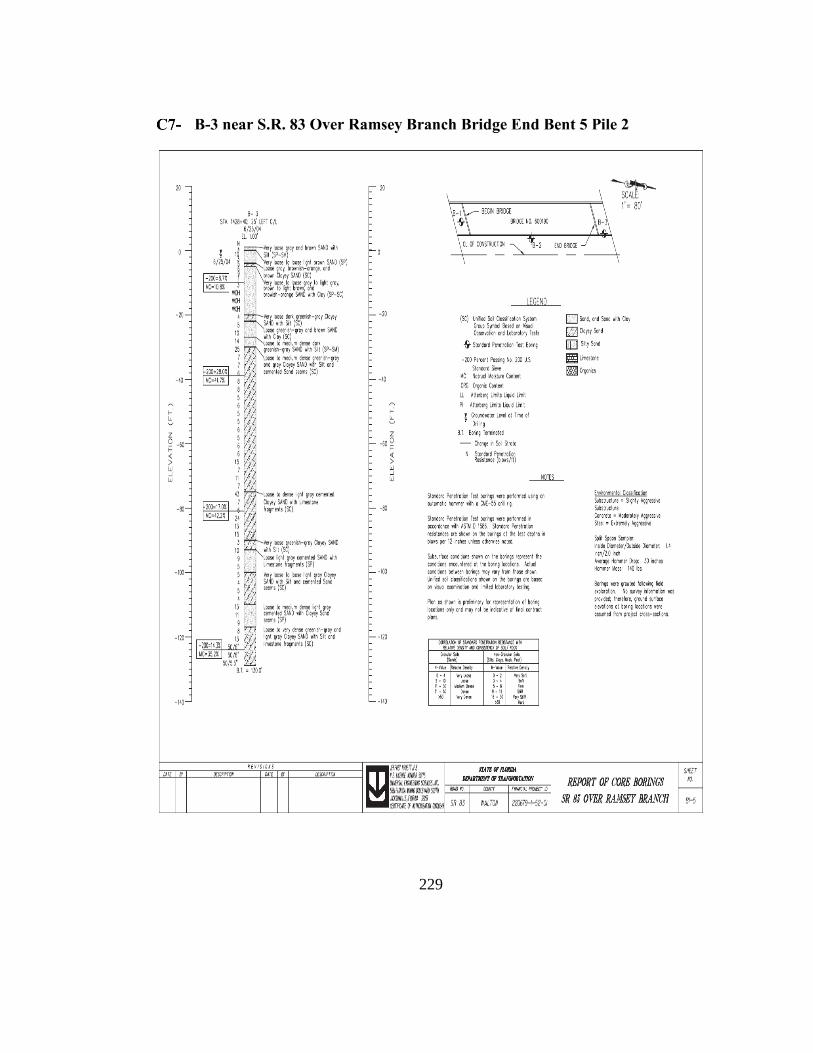
S.R. 83 Over Ramsey Branch Bridge -End Bent 5 Pile 2
GSE (B3) 9.3 ftCurrent GSE 9.3 ftREF. ELEV 11.37 ft
218
0
10
20
30
40
50
60
70
0 0.2 0.4 0.6 0.8 1 1.2 1.4 1.6 1.8 2
NA
VD
Ele
vati
on
(ft
)
Maximum Displacement and Rebound (in)
DMX
Rebound
0.25 inch Rebound
Set
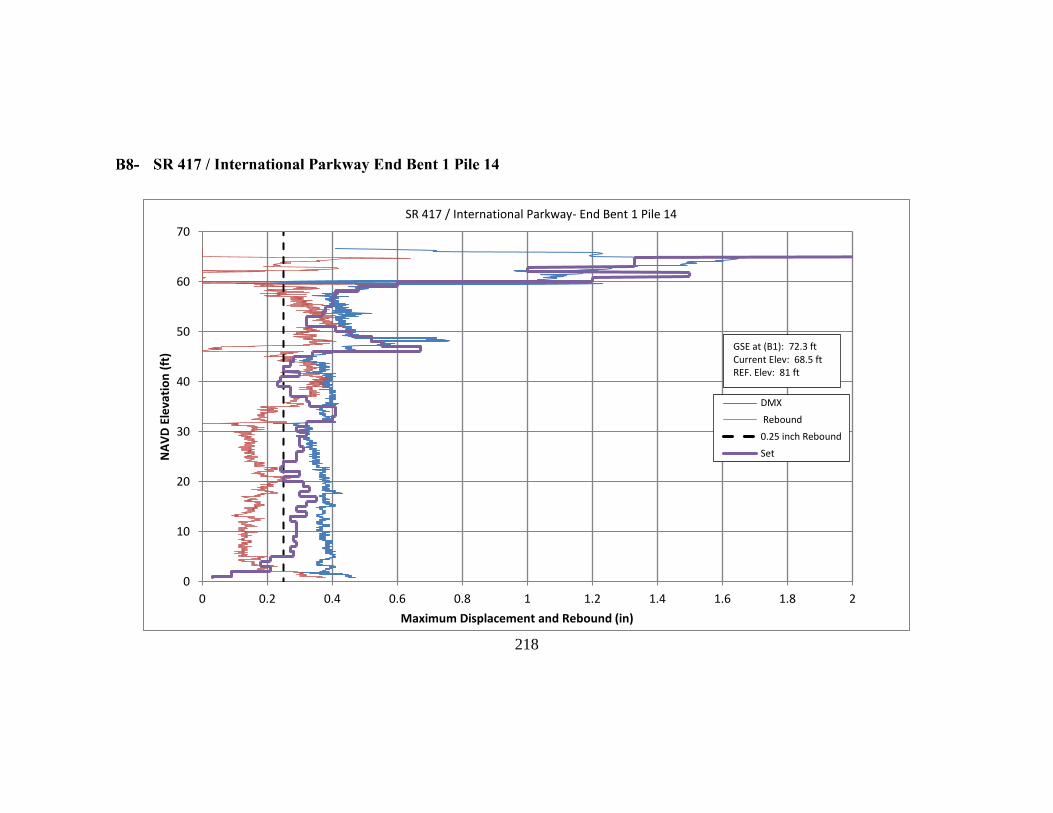
GSE at (B1): 72.3 ftCurrent Elev: 68.5 ftREF. Elev: 81 ft
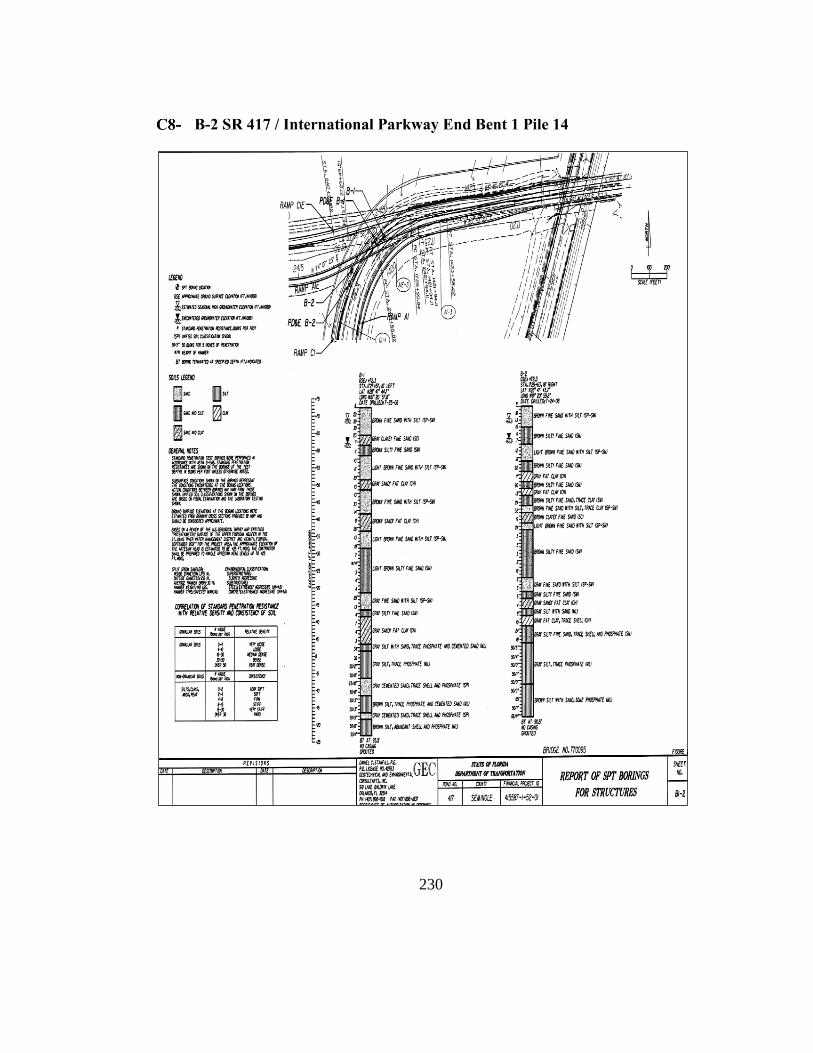
SR 417 / International Parkway- End Bent 1 Pile 14
219
-10
0
10
20
30
40
50
60
0 0.2 0.4 0.6 0.8 1 1.2 1.4
NA
VD
Ele
vati
on
(ft
)
Maximum Displacement and Rebound (in)
DMX
Rebound
0.25 inch Rebound
Set
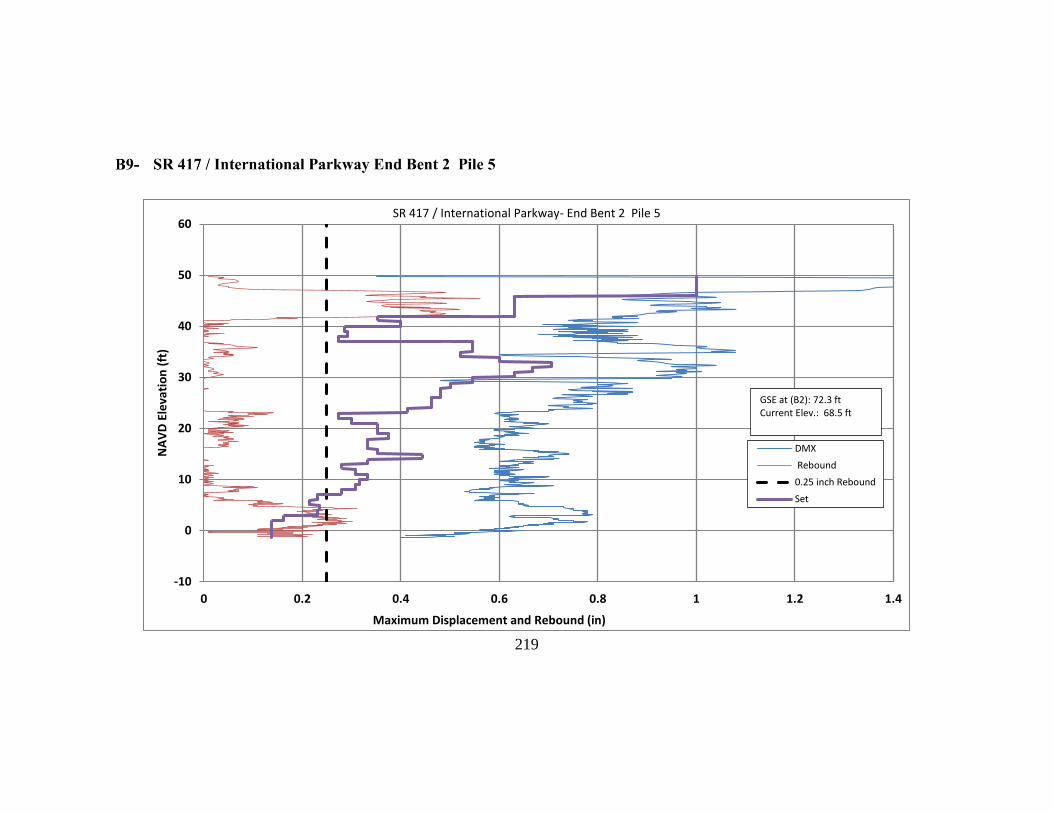
GSE at (B2): 72.3 ftCurrent Elev.: 68.5 ft
SR 417 / International Parkway- End Bent 2 Pile 5
220
-20
-10
0
10
20
30
40
0 0.5 1 1.5 2 2.5 3 3.5 4 4.5 5
NA
VD
Ele
vati
on
(ft
)
Maximum Displacement and Rebound (in)
Rebound PDA
0.25 inch Rebound
DMX
Set
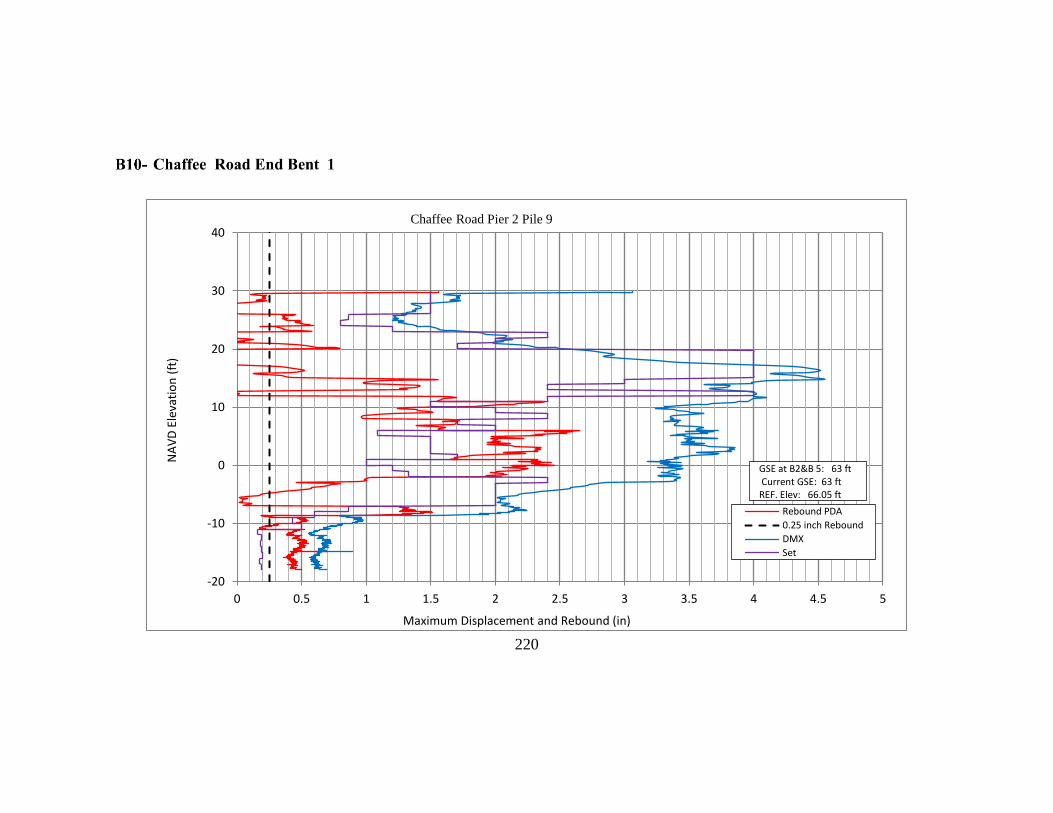
Chaffee Road Pier 2 Pile 9
GSE at B2&B 5: 63 ftCurrent GSE: 63 ft REF. Elev: 66.05 ft
221
-95
-85
-75
-65
-55
-45
-35
-25
-15
-5
5
15
0 0.2 0.4 0.6 0.8 1 1.2 1.4 1.6
NA
VD
Ele
vati
on
(ft
)
Maximum Displacement and Rebound (in)
Rebound
0.25 inch Rebound
Set
DMX
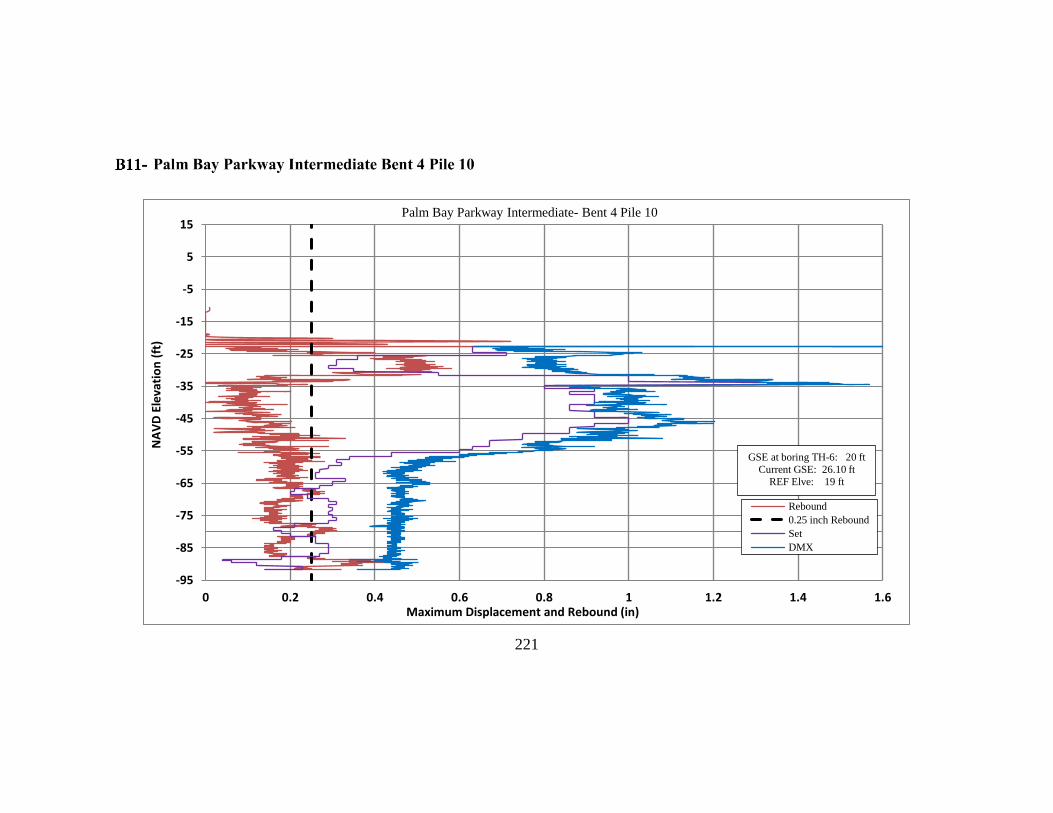
GSE at boring TH-6: 20 ft
Current GSE: 26.10 ft
REF Elve: 19 ft
Palm Bay Parkway Intermediate- Bent 4 Pile 10
222
-90
-80
-70
-60
-50
-40
-30
-20
-10
0
10
0 0.2 0.4 0.6 0.8 1 1.2 1.4 1.6 1.8 2
NA
VD
Ele
vati
on
(ft
)
Maximum Displacement and Rebound (in)
Rebound
0.25 inch Rebound
Set
DMx
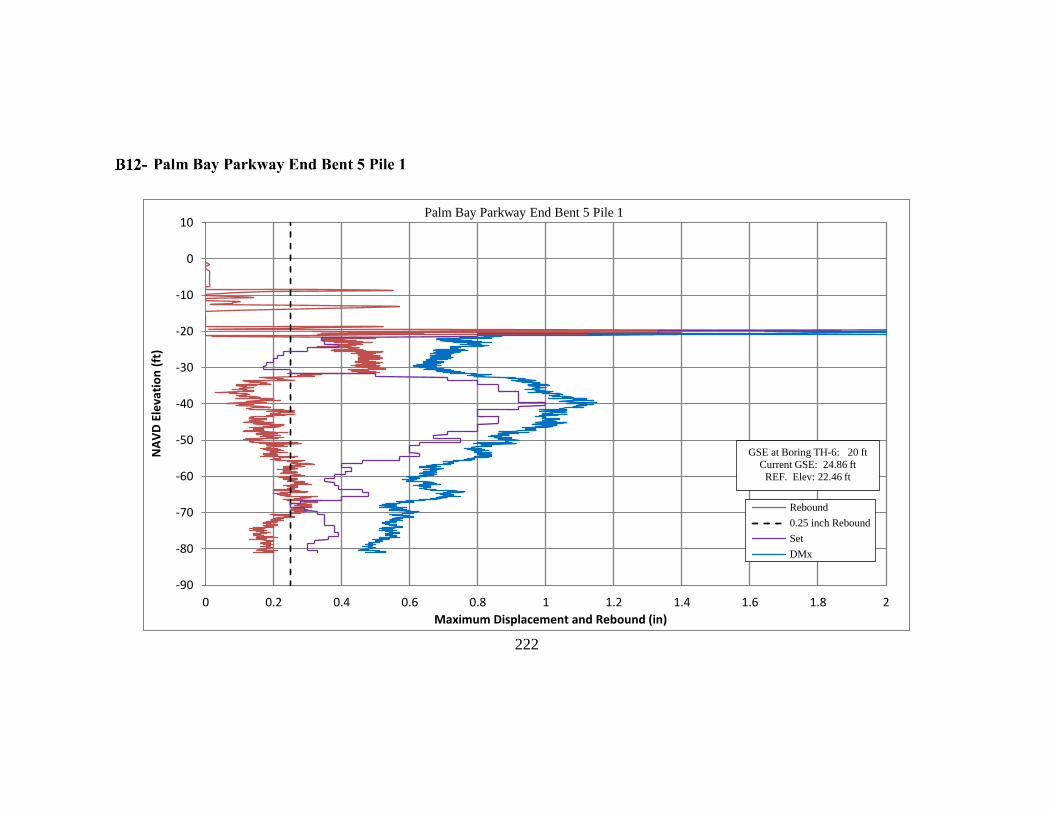
GSE at Boring TH-6: 20 ft
Current GSE: 24.86 ft
REF. Elev: 22.46 ft
Palm Bay Parkway End Bent 5 Pile 1
223
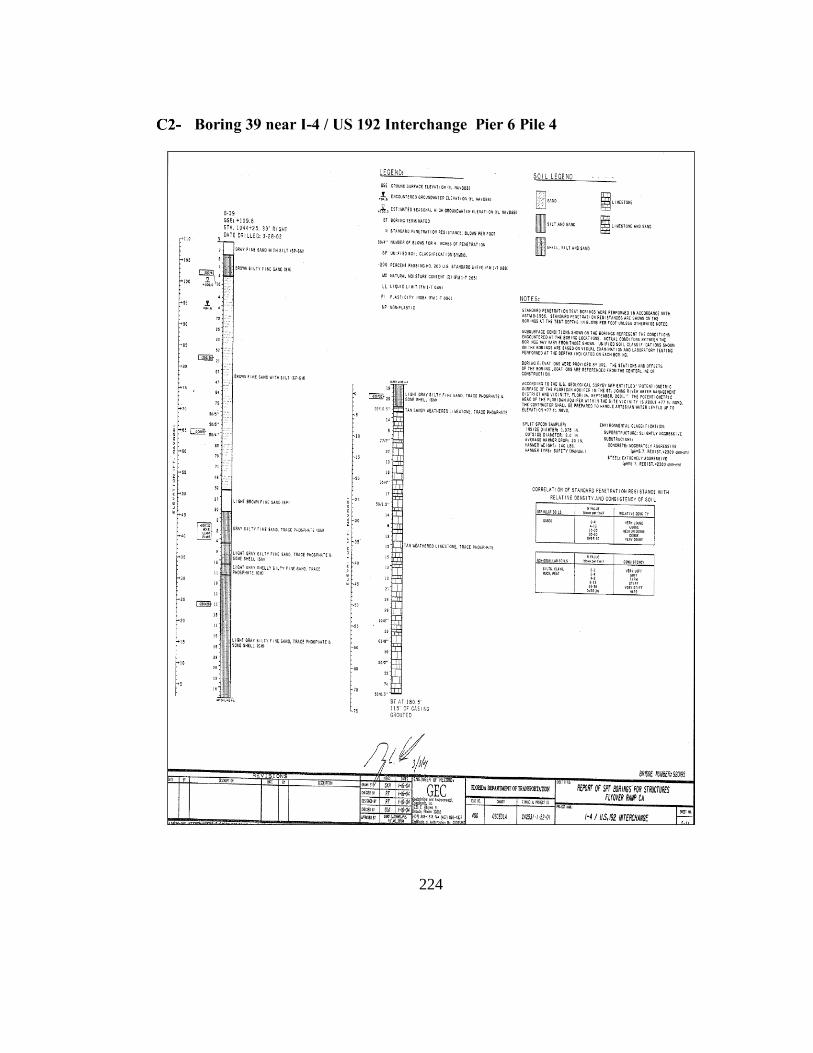
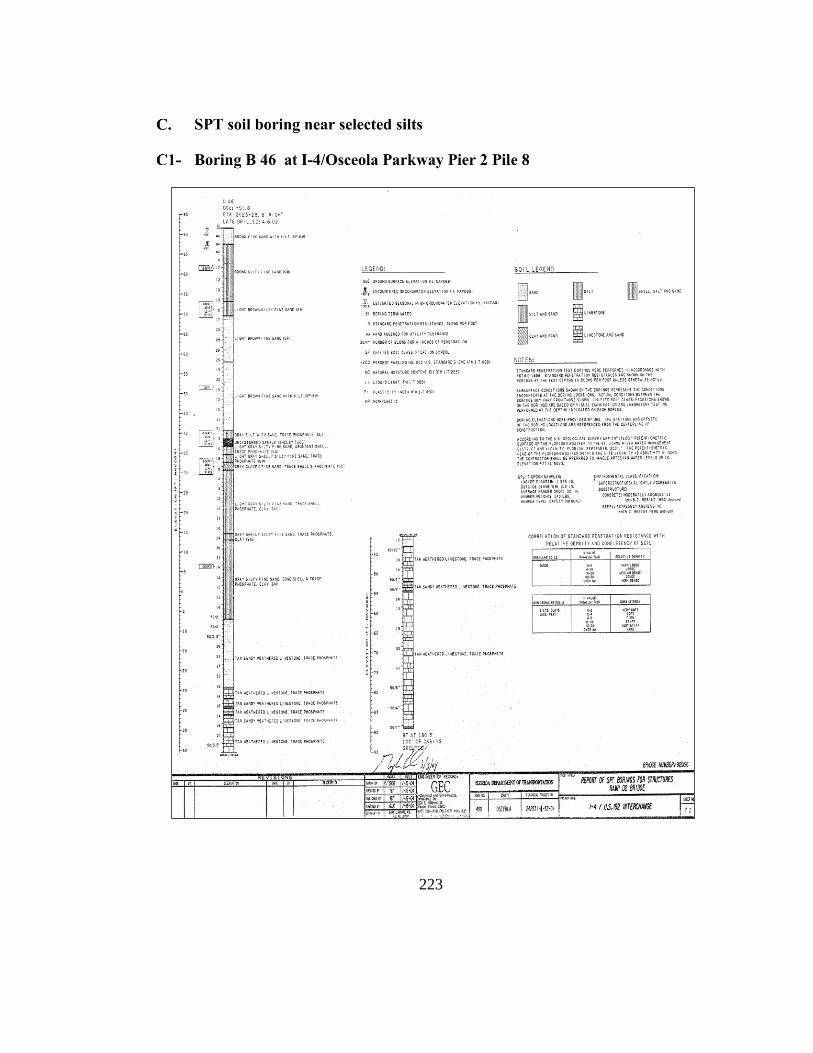
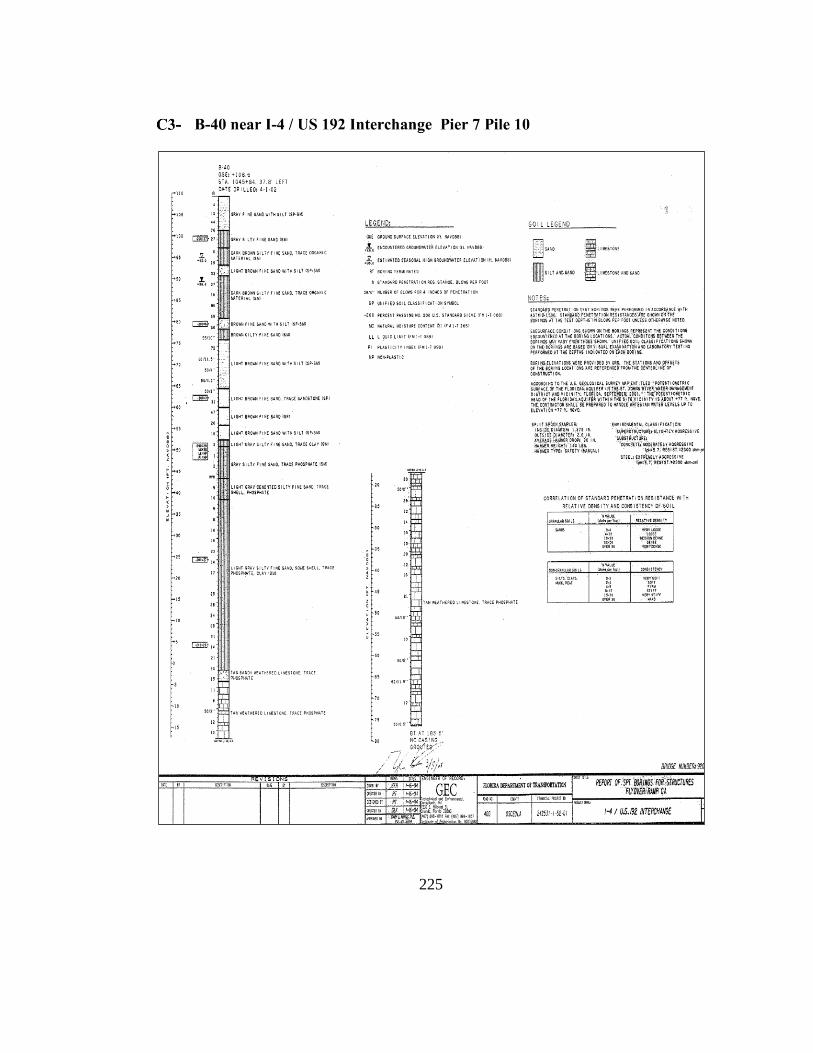
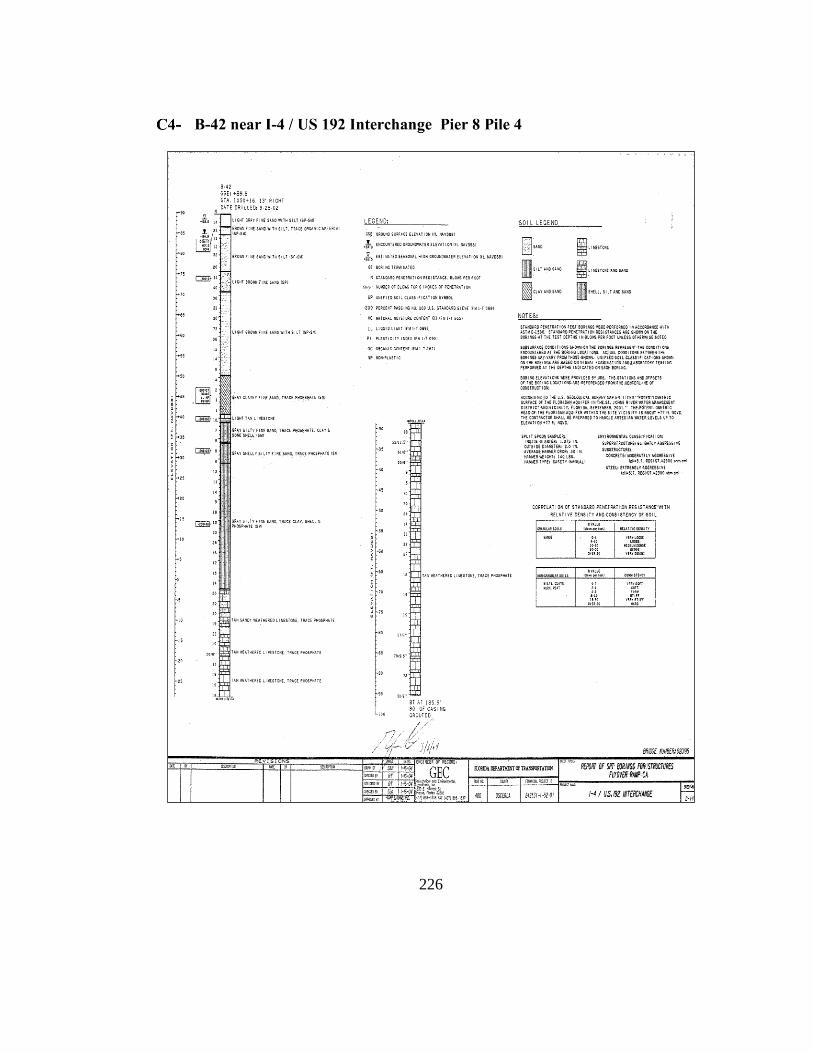
224
225
226
227
228
229
230
231
232

233
234
235
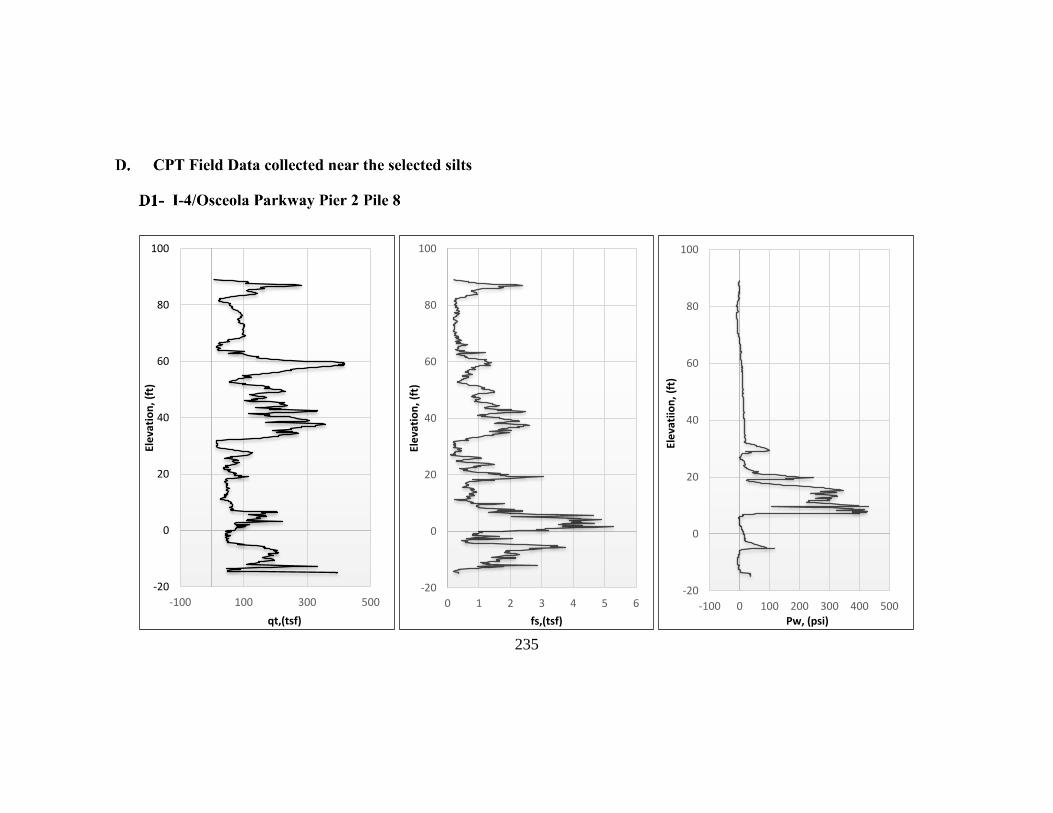
-20
0
20
40
60
80
100
-100 100 300 500
Ele
vati
on
, (f
t)
qt,(tsf)
-20
0
20
40
60
80
100
0 1 2 3 4 5 6
Ele
vati
on
, (f
t)
fs,(tsf)
-20
0
20
40
60
80
100
-100 0 100 200 300 400 500
Ele
vati
ion
, (f
t)
Pw, (psi)
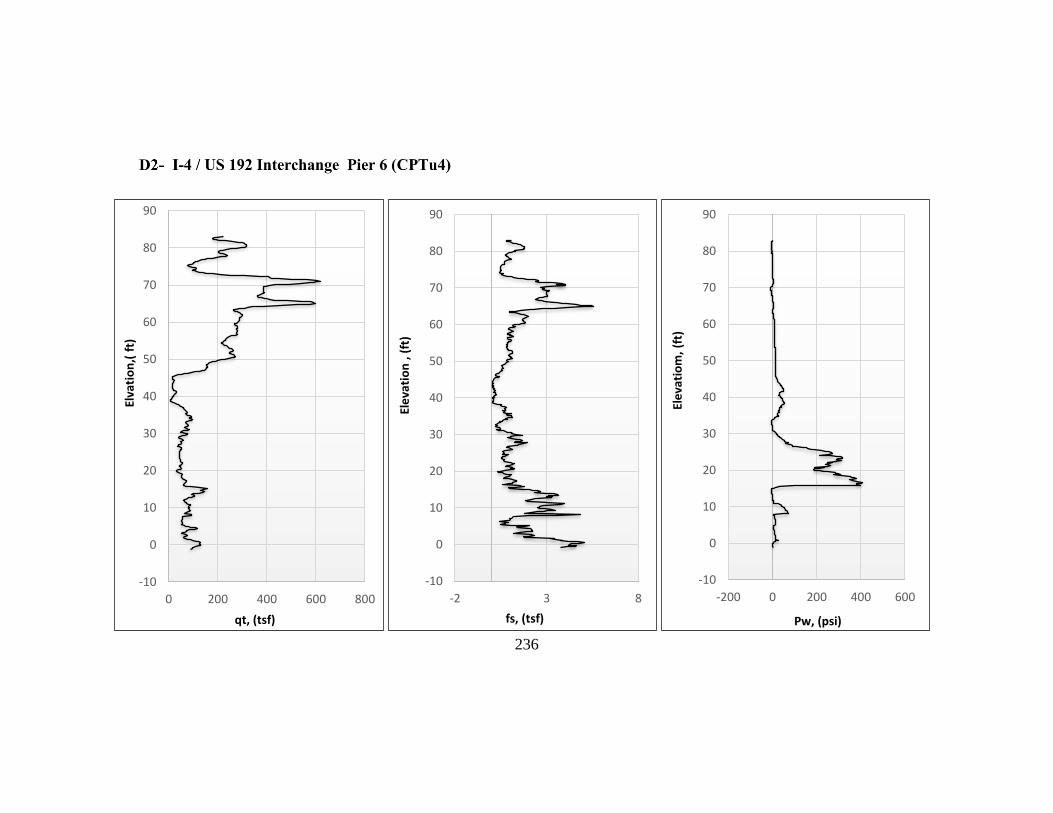
236
-10
0
10
20
30
40
50
60
70
80
90
0 200 400 600 800
Elva
tio
n,(
ft)
qt, (tsf)
-10
0
10
20
30
40
50
60
70
80
90
-2 3 8
Ele
vati
on
, (f
t)
fs, (tsf)
-10
0
10
20
30
40
50
60
70
80
90
-200 0 200 400 600
Ele
vati
om
, (f
t)
Pw, (psi)
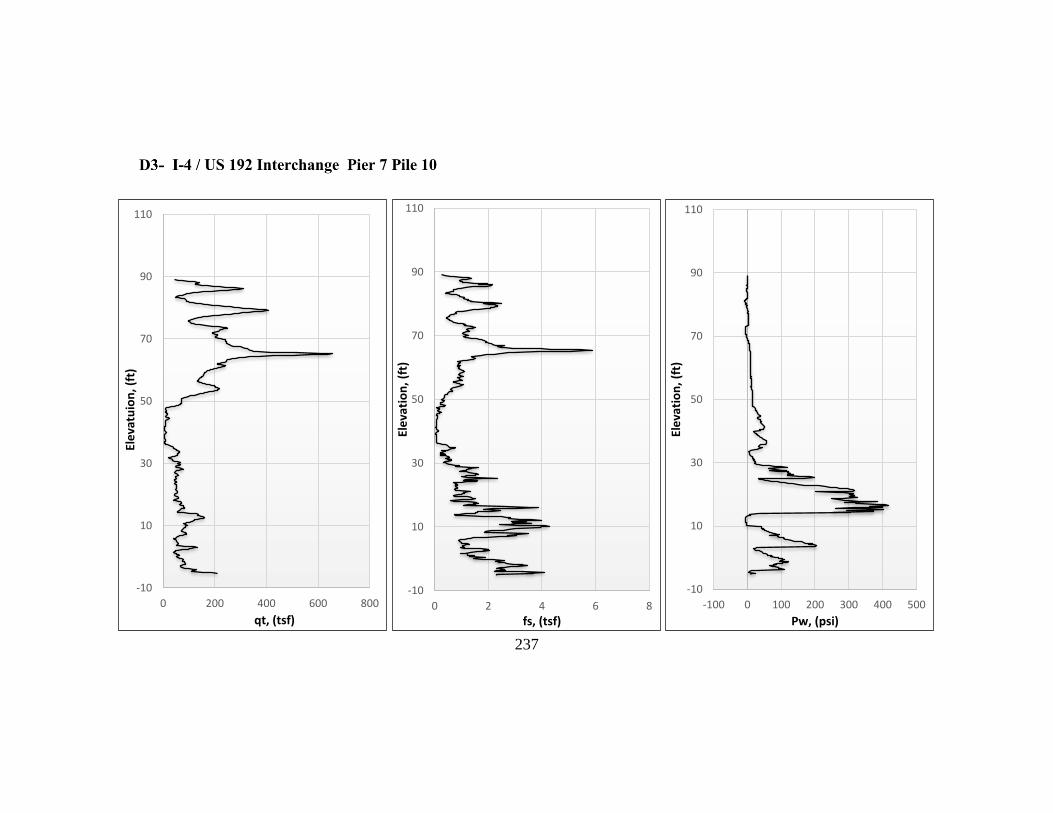
237
-10
10
30
50
70
90
110
0 200 400 600 800
Ele
vatu
ion
, (ft
)
qt, (tsf)
-10
10
30
50
70
90
110
0 2 4 6 8
Ele
vati
on
, (f
t)
fs, (tsf)
-10
10
30
50
70
90
110
-100 0 100 200 300 400 500
Ele
vati
on
, (f
t)
Pw, (psi)
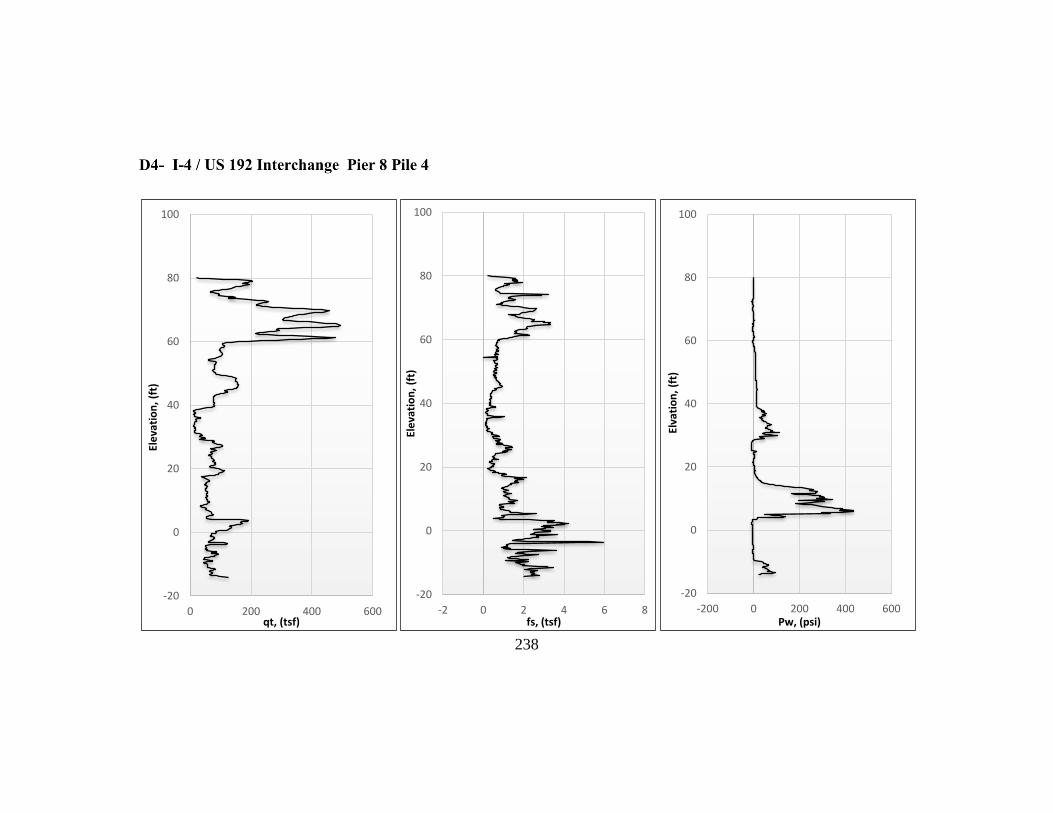
238
-20
0
20
40
60
80
100
0 200 400 600
Ele
vati
on
, (f
t)
qt, (tsf)
-20
0
20
40
60
80
100
-2 0 2 4 6 8
Ele
vati
on
, (f
t)
fs, (tsf)
-20
0
20
40
60
80
100
-200 0 200 400 600
Elva
tio
n,
(ft)
Pw, (psi)
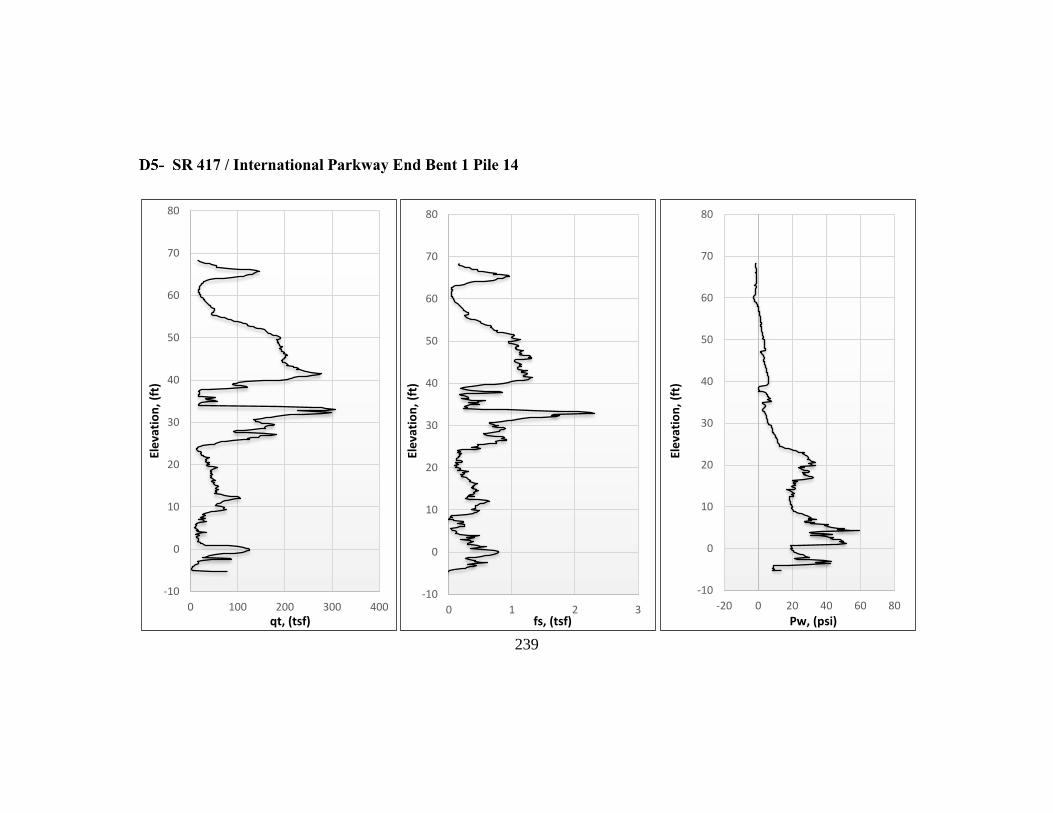
239
-10
0
10
20
30
40
50
60
70
80
0 100 200 300 400
Ele
vati
on
, (f
t)
qt, (tsf)
-10
0
10
20
30
40
50
60
70
80
0 1 2 3
Ele
vati
on
, (f
t)
fs, (tsf)
-10
0
10
20
30
40
50
60
70
80
-20 0 20 40 60 80
Ele
vati
on
, (f
t)
Pw, (psi)
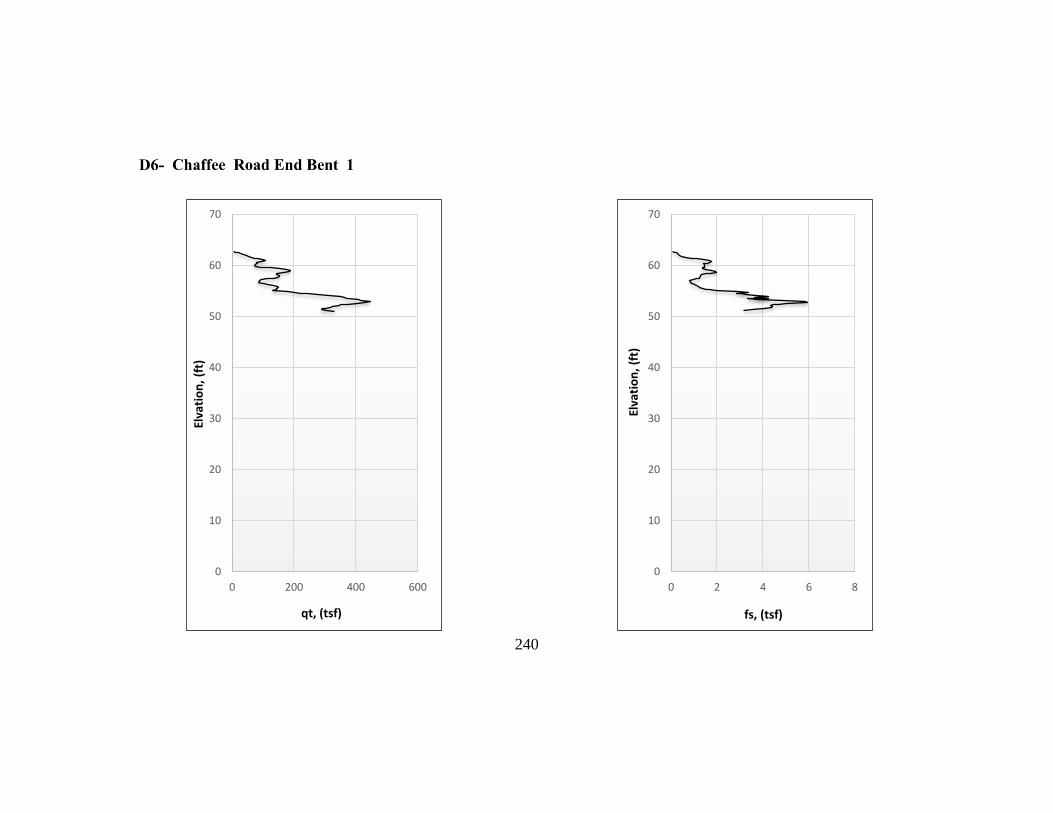
240
0
10
20
30
40
50
60
70
0 200 400 600
Elva
tio
n,
(ft)
qt, (tsf)
0
10
20
30
40
50
60
70
0 2 4 6 8
Elva
tio
n,
(ft)
fs, (tsf)

241
-70
-60
-50
-40
-30
-20
-10
0
10
20
30
0 200 400
Ele
vati
on
, ft
qt, (tsf)
-70
-60
-50
-40
-30
-20
-10
0
10
20
30
-0.5 0 0.5 1
Ele
vati
on
, (f
t)
fs, (tsf)
-70
-60
-50
-40
-30
-20
-10
0
10
20
30
-50 50 150 250
Ele
vati
on
, (f
t)
Pw, (psi)
242
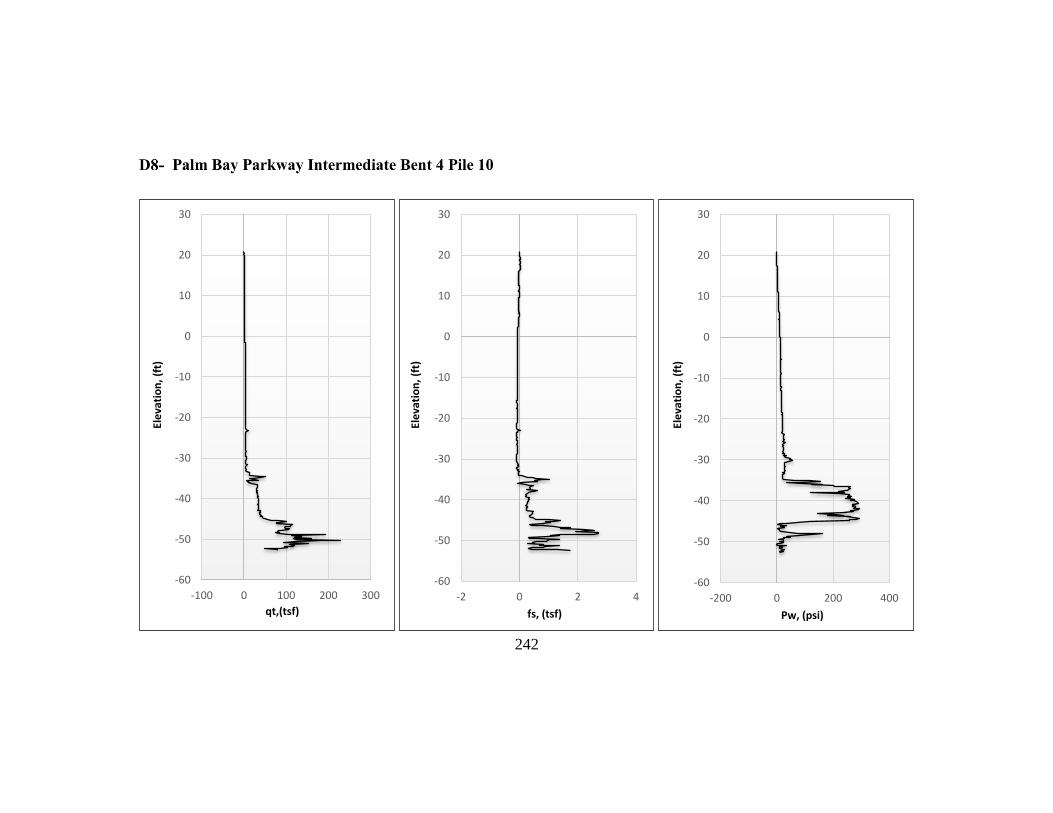
-60
-50
-40
-30
-20
-10
0
10
20
30
-100 0 100 200 300
Ele
vati
on
, (f
t)
qt,(tsf)
-60
-50
-40
-30
-20
-10
0
10
20
30
-2 0 2 4
Ele
vati
on
, (f
t)
fs, (tsf)
-60
-50
-40
-30
-20
-10
0
10
20
30
-200 0 200 400
Ele
vati
on
, (f
t)
Pw, (psi)
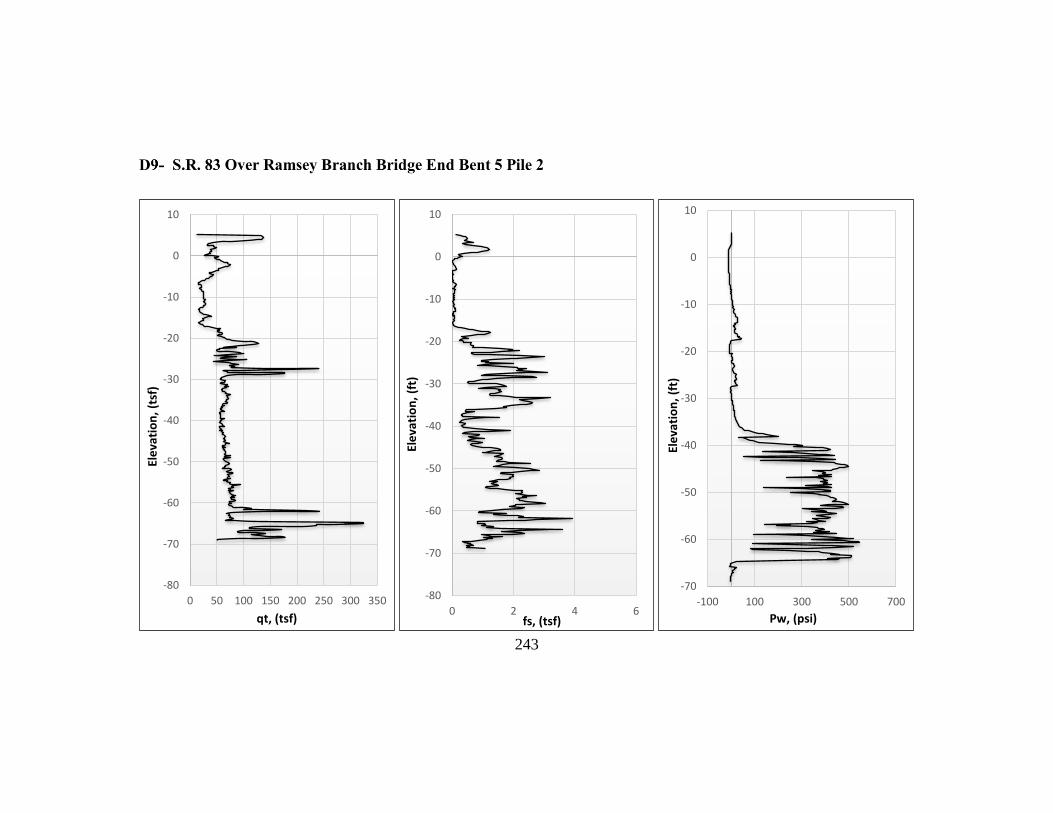
243
-80
-70
-60
-50
-40
-30
-20
-10
0
10
0 50 100 150 200 250 300 350
Ele
vati
on
, (t
sf)
qt, (tsf)
-80
-70
-60
-50
-40
-30
-20
-10
0
10
0 2 4 6
Ele
vati
on
, (f
t)
fs, (tsf)
-70
-60
-50
-40
-30
-20
-10
0
10
-100 100 300 500 700
Ele
vati
on
, (f
t)
Pw, (psi)
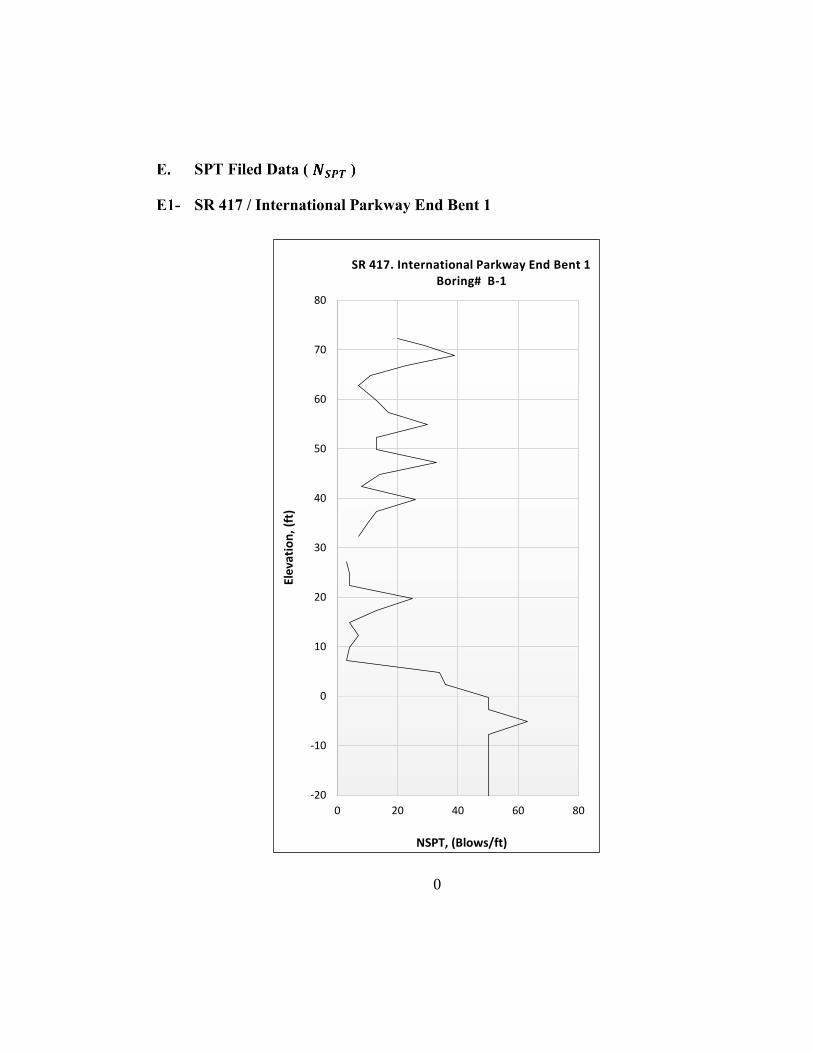
0
-20
-10
0
10
20
30
40
50
60
70
80
0 20 40 60 80
Ele
vati
on
, (f
t)
NSPT, (Blows/ft)
SR 417. International Parkway End Bent 1 Boring# B-1
1
-20
-10
0
10
20
30
40
50
60
70
80
0 20 40 60 80
NA
VD
Ele
vati
on
, (f
t)
NSPT, (Blows/ft)
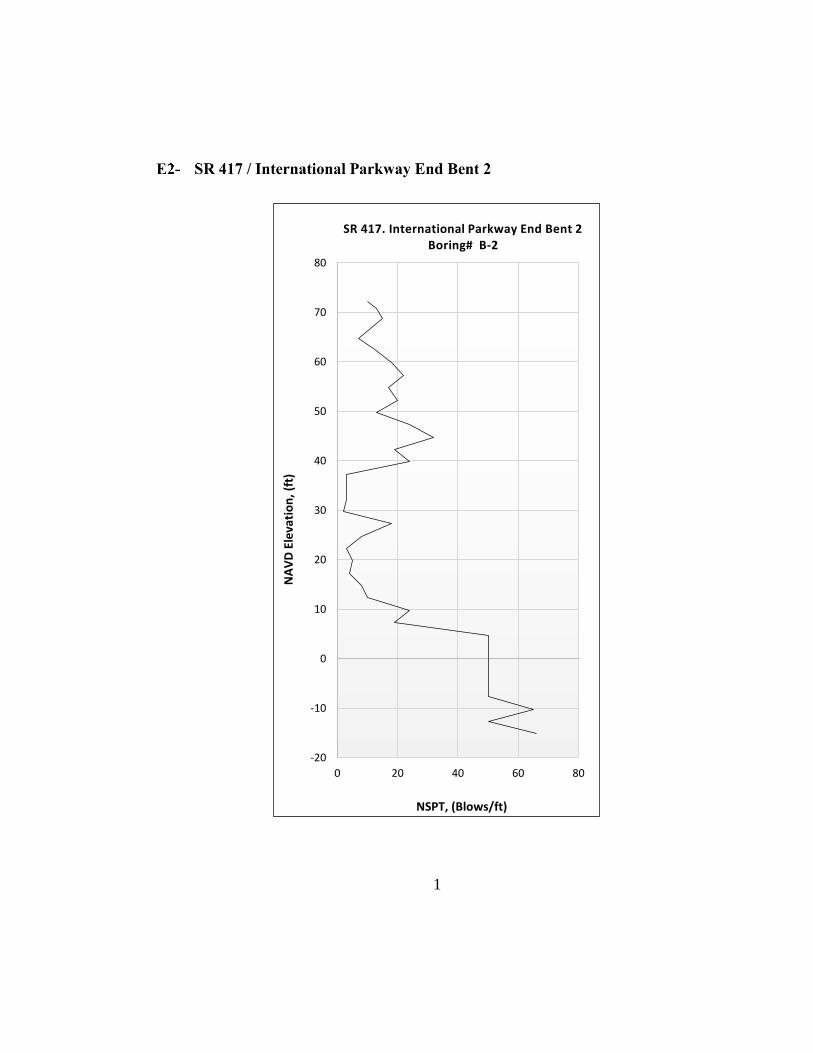
SR 417. International Parkway End Bent 2 Boring# B-2
2
-80
-60
-40
-20
0
20
40
60
80
100
120
0 20 40 60 80 100
NA
VD
Ele
vati
on
, (f
t)
NSPT, (Blows/ft)
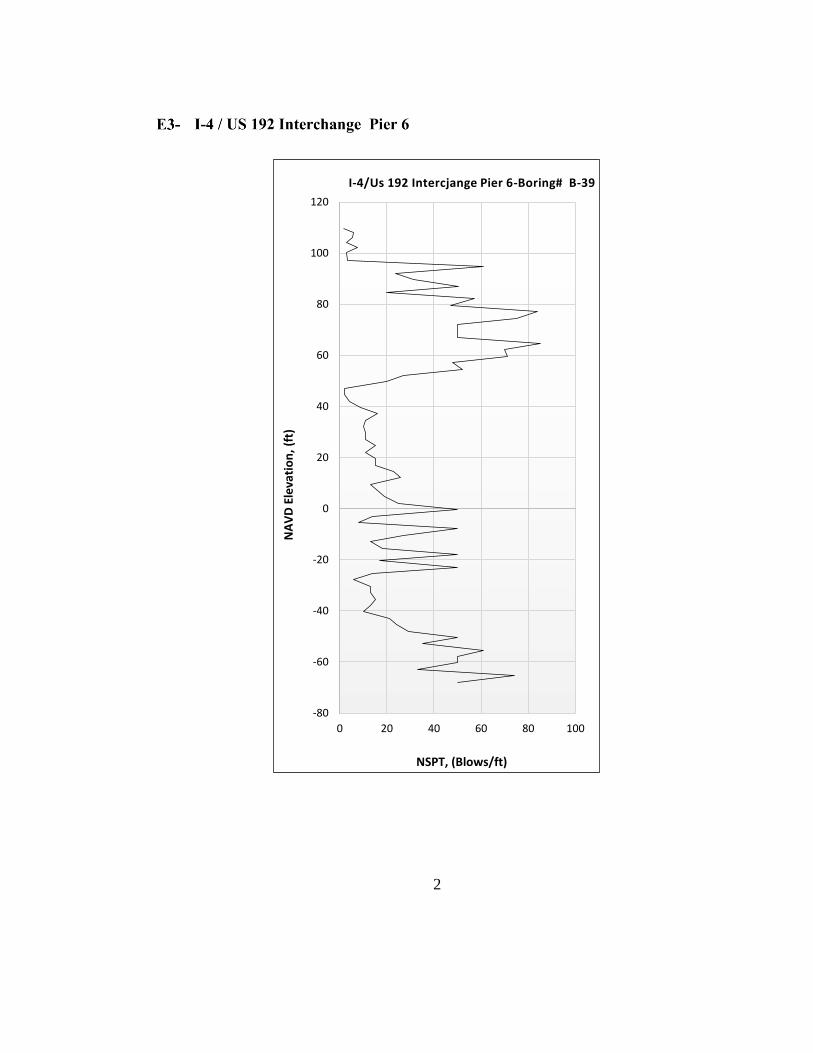
I-4/Us 192 Intercjange Pier 6-Boring# B-39
3
-100
-80
-60
-40
-20
0
20
40
60
80
100
120
0 20 40 60 80 100
NA
VD
Ele
vati
on
, (f
t)
NSPT, (Blows/ft)
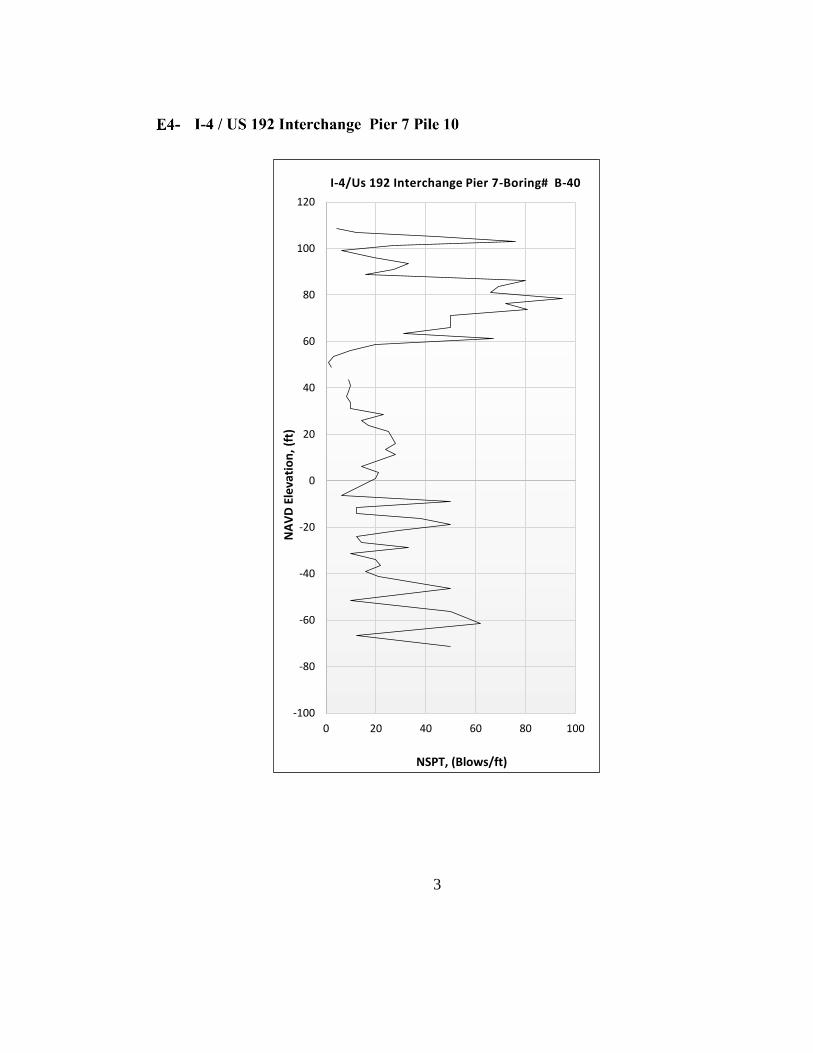
I-4/Us 192 Interchange Pier 7-Boring# B-40
4
-100
-80
-60
-40
-20
0
20
40
60
80
100
0 20 40 60 80 100
NA
VD
Ele
vati
on
, (f
t)
NSPT, (Blows/ft)
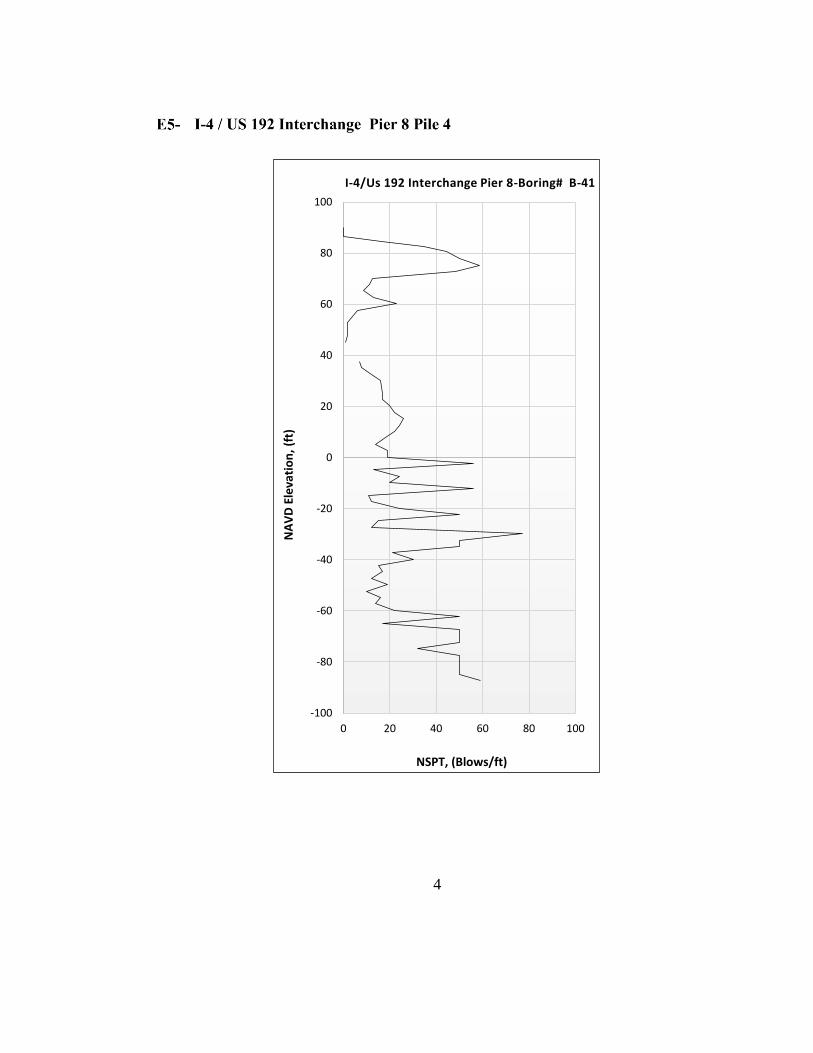
I-4/Us 192 Interchange Pier 8-Boring# B-41
5
-10
0
10
20
30
40
50
60
70
80
90
NA
VD
Ele
vati
on
, (f
t)
NSPT, (Blows/ft)
I-4/ Osceola Parkway- Boring# B-46
6
-70
-60
-50
-40
-30
-20
-10
0
10
20
0 5 10 15 20 25
NA
VD
Ele
vati
on
, (f
t)
NSPT, (Blows/ft)
Palm Bay Parkway Intermediate Bent 3 -Boring # B1
7
-120
-100
-80
-60
-40
-20
0
20
40
0 10 20 30 40 50
NA
VD
Ele
vati
on
, (f
t)
NSPT, (Blows/ft)
Palm Bay Parkway End Bent 5 -Boring # TH-6
8
-90
-80
-70
-60
-50
-40
-30
-20
-10
0
10
20
0 20 40 60 80
NA
VD
Ele
vati
on
, (f
t)
NSPT, (Blows/ft)
S.R. 83 Over Ramsey Branch Bridge Ened Bent 5-Boring # 3
9
10
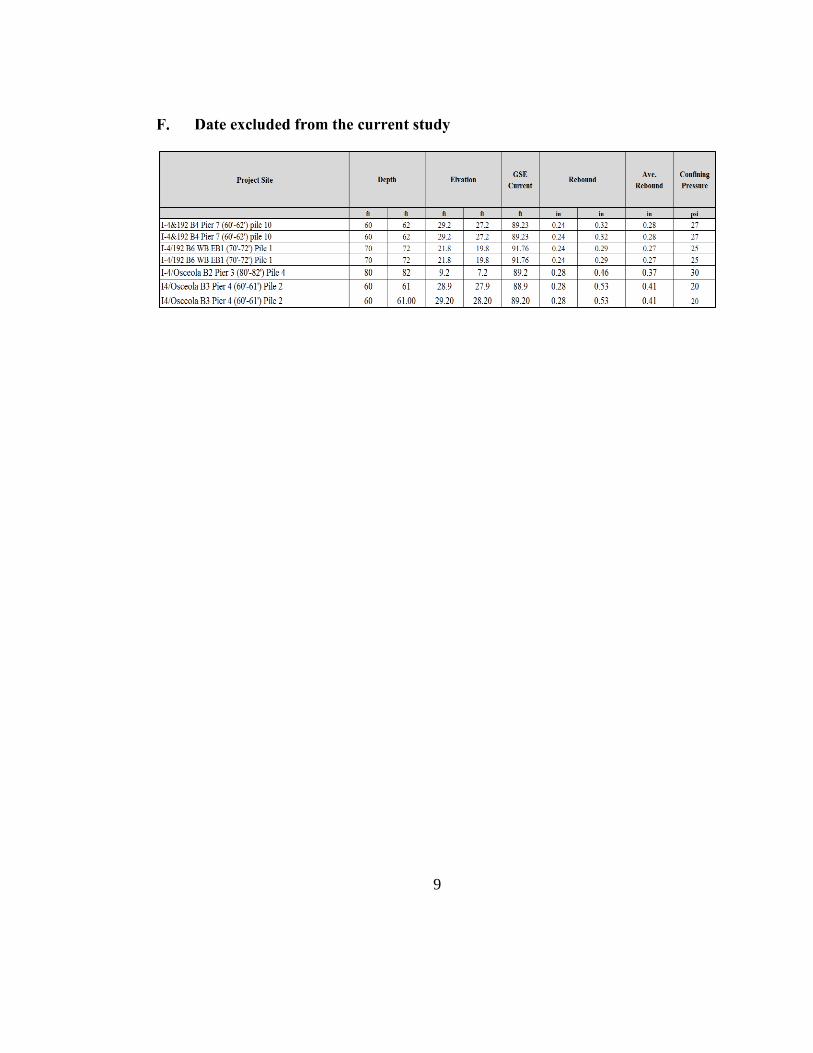
a) Cohesionless Soils
Figure G- 1: Physical Properties Analysis- Cohesionless Soils: Uniformity Coefficient,
(Cu) vs. Rebound (in).
0
0.1
0.2
0.3
0.4
0.5
0.6
0.7
0.8
0.9
1
0 50 100 150 200 250 300 350
PD
A R
ebo
un
d,
(in
)
Uniformity Coefficient, (Cu)
Rebound < 0.25 inRebound > 0.5 in
Sand % ( 35 %- 88 %)Clay % ( 5 % -12 %)Silt % ( 4% - 55 % )
Fine % ( 12 % - 65 %)Unit Weight (104 psi- 124 psi)
11
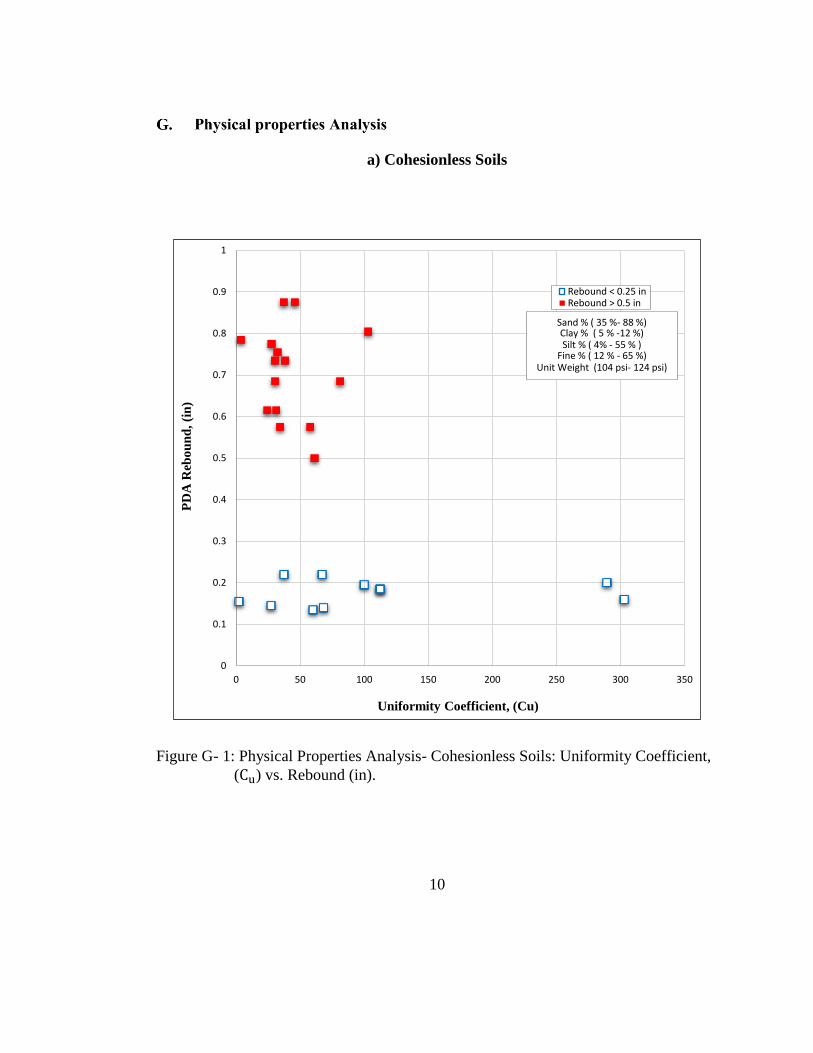
Figure G- 2: Physical Properties Analysis- Cohesionless Soils: Coefficient of Gradation
(Cc) vs. Rebound (in)
0
0.1
0.2
0.3
0.4
0.5
0.6
0.7
0.8
0.9
1
0 20 40 60 80 100 120
PD
A R
ebo
un
d,
(in
)
Coefficient of Gradation, (Cc)
Rebound < 0.25 inRebound > 0.5 in
Sand % ( 35 %- 88 %)Clay % ( 5 % -12 %)Silt % ( 4% - 55 % )
Fine % ( 12 % - 65 %)Unit Weight (104 psi- 124 psi)
12
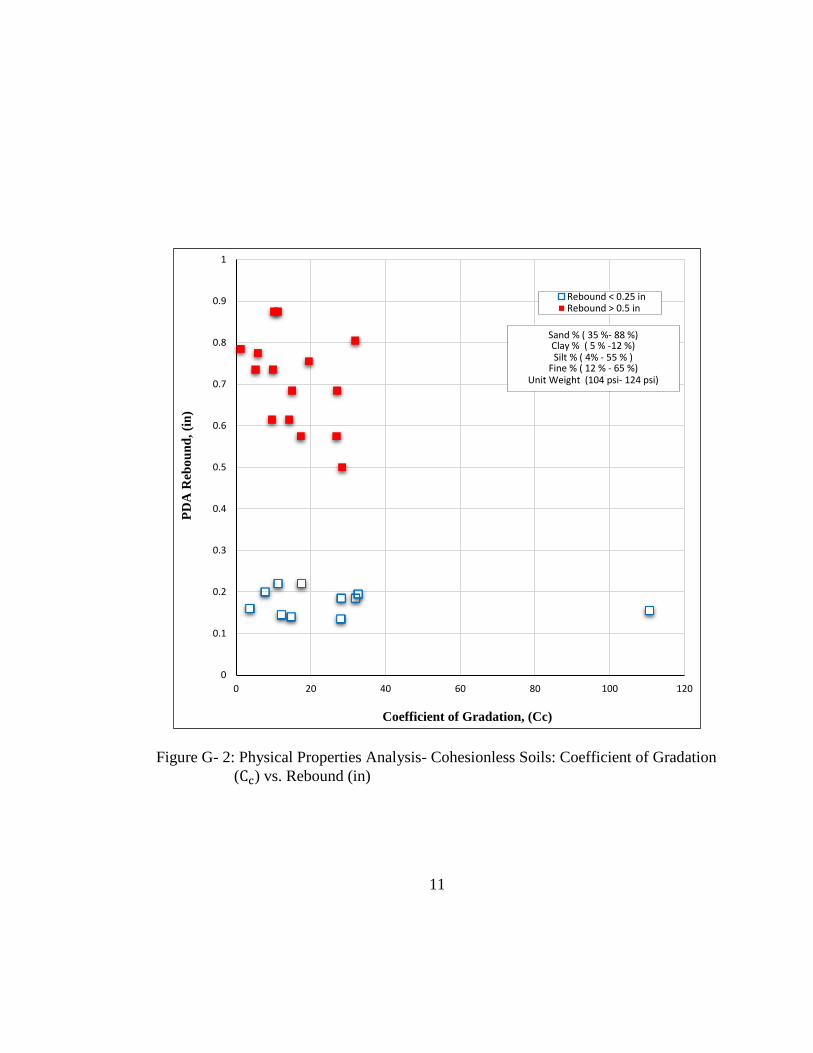
Figure G- 3: Physical Properties Analysis- Cohesionless Soils: Dry Unit Weight, (pcf)
vs. Rebound (in).
0
0.1
0.2
0.3
0.4
0.5
0.6
0.7
0.8
0.9
1
60 65 70 75 80 85 90 95 100 105
PD
A R
ebo
un
d,
(in
)
Dry Unit Weight, (pcf)
Rebound < 0.25 inRebound > 0.5 in
Sand % ( 35 %- 88 %)Clay % ( 5 % -12 %)Silt % ( 4% - 55 % )
Fine % ( 12 % - 65 %)Unit Weight (104 psi- 124 psi)
13
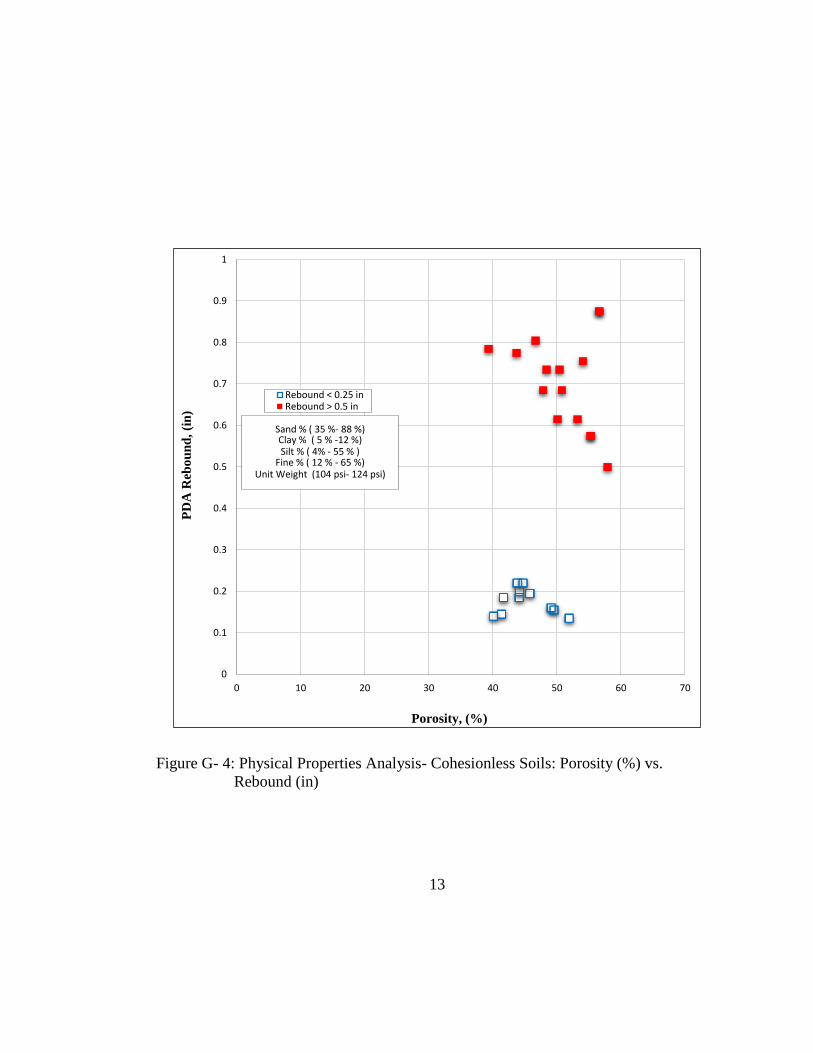
Figure G- 4: Physical Properties Analysis- Cohesionless Soils: Porosity (%) vs.
Rebound (in)
0
0.1
0.2
0.3
0.4
0.5
0.6
0.7
0.8
0.9
1
0 10 20 30 40 50 60 70
PD
A R
ebo
un
d,
(in
)
Porosity, (%)
Rebound < 0.25 inRebound > 0.5 in
Sand % ( 35 %- 88 %)Clay % ( 5 % -12 %)Silt % ( 4% - 55 % )
Fine % ( 12 % - 65 %)Unit Weight (104 psi- 124 psi)
14
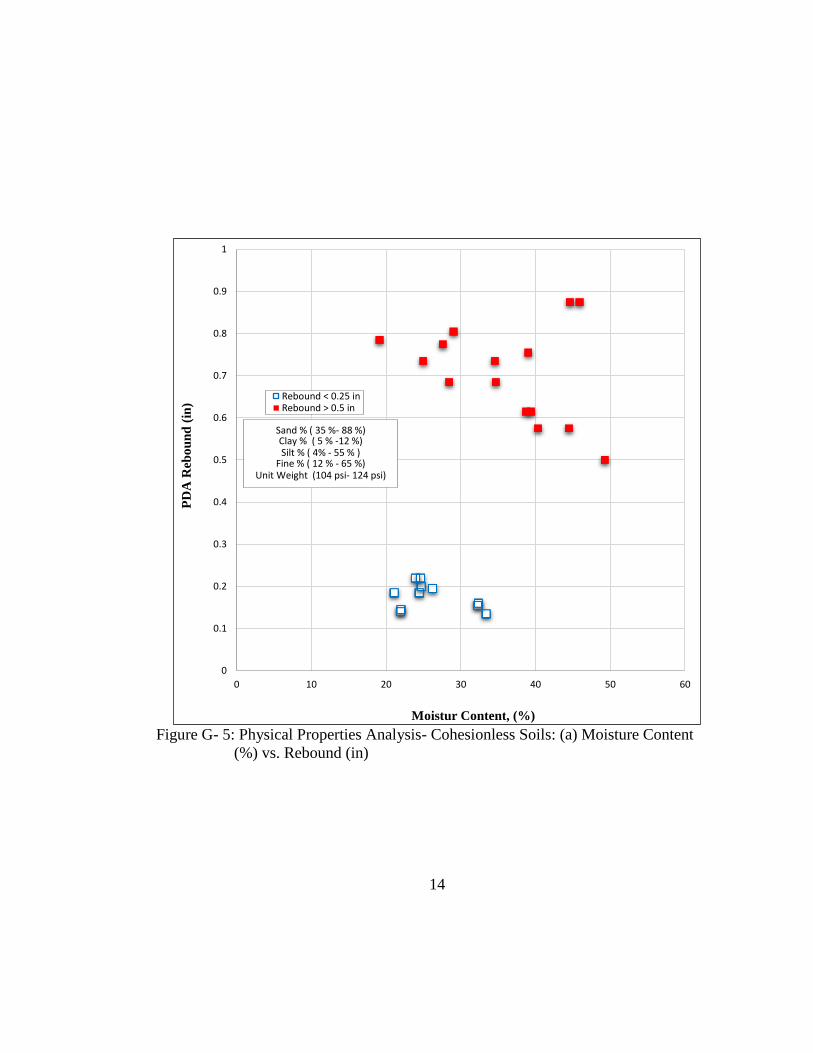
Figure G- 5: Physical Properties Analysis- Cohesionless Soils: (a) Moisture Content
(%) vs. Rebound (in)
0
0.1
0.2
0.3
0.4
0.5
0.6
0.7
0.8
0.9
1
0 10 20 30 40 50 60
PD
A R
ebo
un
d (
in)
Moistur Content, (%)
Rebound < 0.25 inRebound > 0.5 in
Sand % ( 35 %- 88 %)Clay % ( 5 % -12 %)Silt % ( 4% - 55 % )
Fine % ( 12 % - 65 %)Unit Weight (104 psi- 124 psi)
15
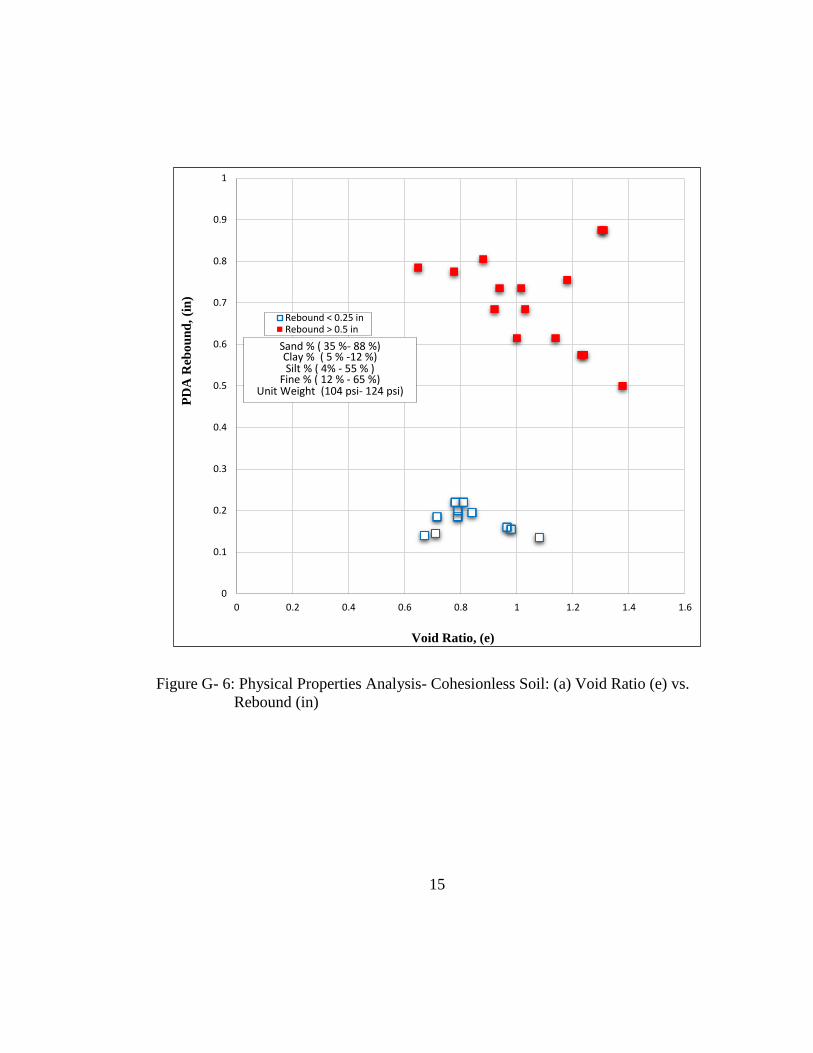
Figure G- 6: Physical Properties Analysis- Cohesionless Soil: (a) Void Ratio (e) vs.
Rebound (in)
0
0.1
0.2
0.3
0.4
0.5
0.6
0.7
0.8
0.9
1
0 0.2 0.4 0.6 0.8 1 1.2 1.4 1.6
PD
A R
ebo
un
d,
(in
)
Void Ratio, (e)
Rebound < 0.25 inRebound > 0.5 in
Sand % ( 35 %- 88 %)Clay % ( 5 % -12 %)Silt % ( 4% - 55 % )
Fine % ( 12 % - 65 %)Unit Weight (104 psi- 124 psi)
16
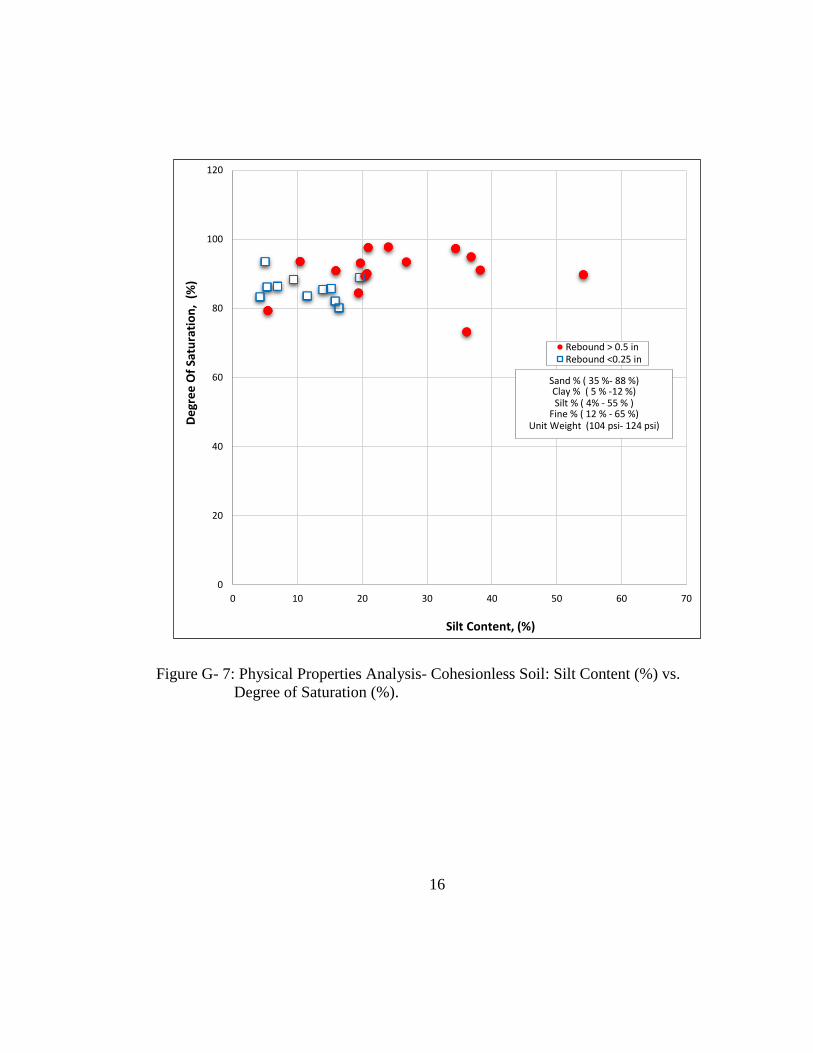
Figure G- 7: Physical Properties Analysis- Cohesionless Soil: Silt Content (%) vs.
Degree of Saturation (%).
0
20
40
60
80
100
120
0 10 20 30 40 50 60 70
De
gre
e O
f Sa
tura
tio
n,
(%)
Silt Content, (%)
Rebound > 0.5 inRebound <0.25 in
Sand % ( 35 %- 88 %)Clay % ( 5 % -12 %)Silt % ( 4% - 55 % )
Fine % ( 12 % - 65 %)Unit Weight (104 psi- 124 psi)
17
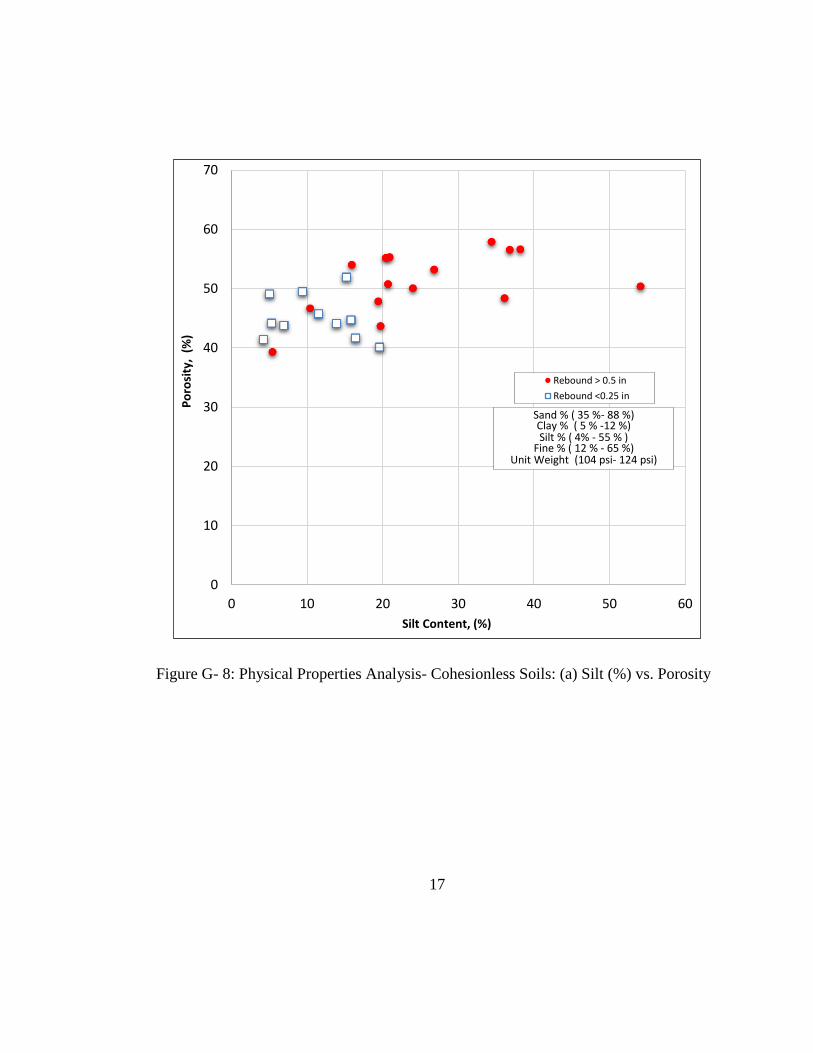
Figure G- 8: Physical Properties Analysis- Cohesionless Soils: (a) Silt (%) vs. Porosity
0
10
20
30
40
50
60
70
0 10 20 30 40 50 60
Po
rosi
ty,
(%)
Silt Content, (%)
Rebound > 0.5 in
Rebound <0.25 in
Sand % ( 35 %- 88 %)Clay % ( 5 % -12 %)Silt % ( 4% - 55 % )
Fine % ( 12 % - 65 %)Unit Weight (104 psi- 124 psi)
18
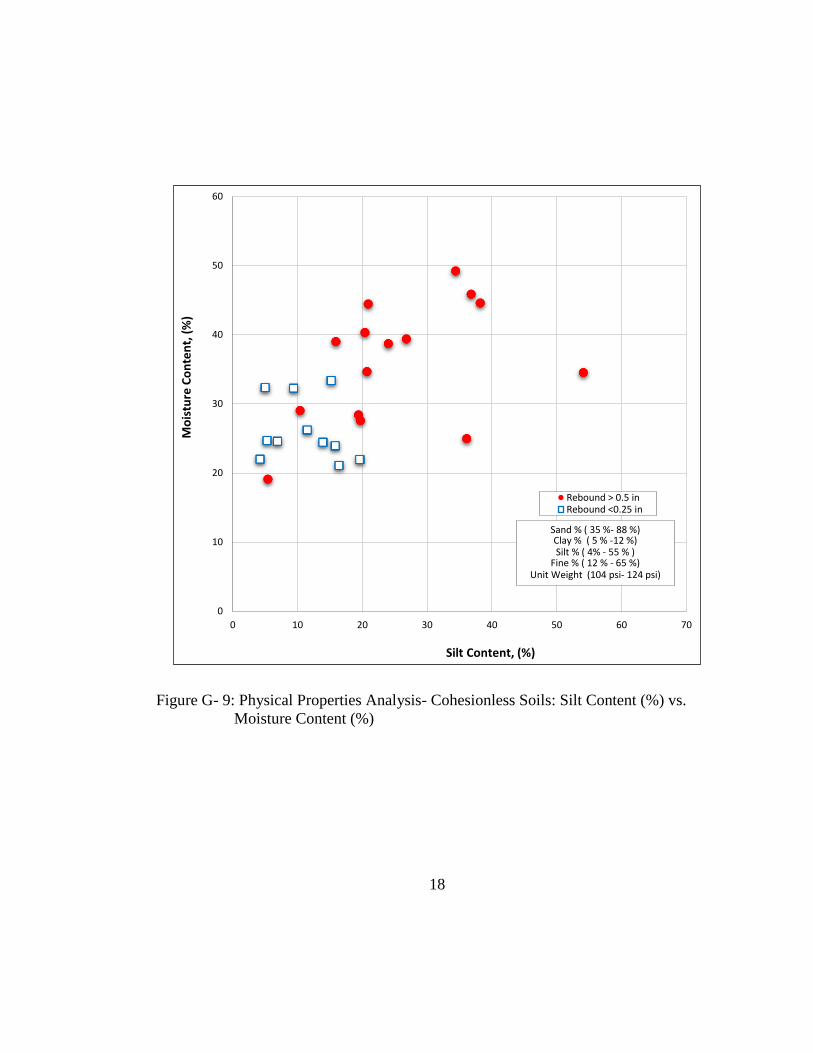
Figure G- 9: Physical Properties Analysis- Cohesionless Soils: Silt Content (%) vs.
Moisture Content (%)
0
10
20
30
40
50
60
0 10 20 30 40 50 60 70
Mo
istu
re C
on
ten
t, (
%)
Silt Content, (%)
Rebound > 0.5 inRebound <0.25 in
Sand % ( 35 %- 88 %)Clay % ( 5 % -12 %)Silt % ( 4% - 55 % )
Fine % ( 12 % - 65 %)Unit Weight (104 psi- 124 psi)

19
b) Cohesive soils
Figure G- 10: Physical Properties Analysis- Cohesive Soils: Dry Unit Weight (pcf) vs.
Rebound (in).
0
0.25
0.5
0.75
1
1.25
1.5
1.75
2
2.25
2.5
2.75
3
40 50 60 70 80 90 100
PD
A R
eb
ou
nd
, (i
n)
Dry Unit Weight , (pcf)
Rebound > 0.5Rebound <0.25 in
Sand (5%- 59.4%)Silt (13.5% - 68.8 %)Clay ( 18.50 % -61.40 %)Fine (40 % - 95 %)Unit Weight (90 pcf- 111 pcf)
20
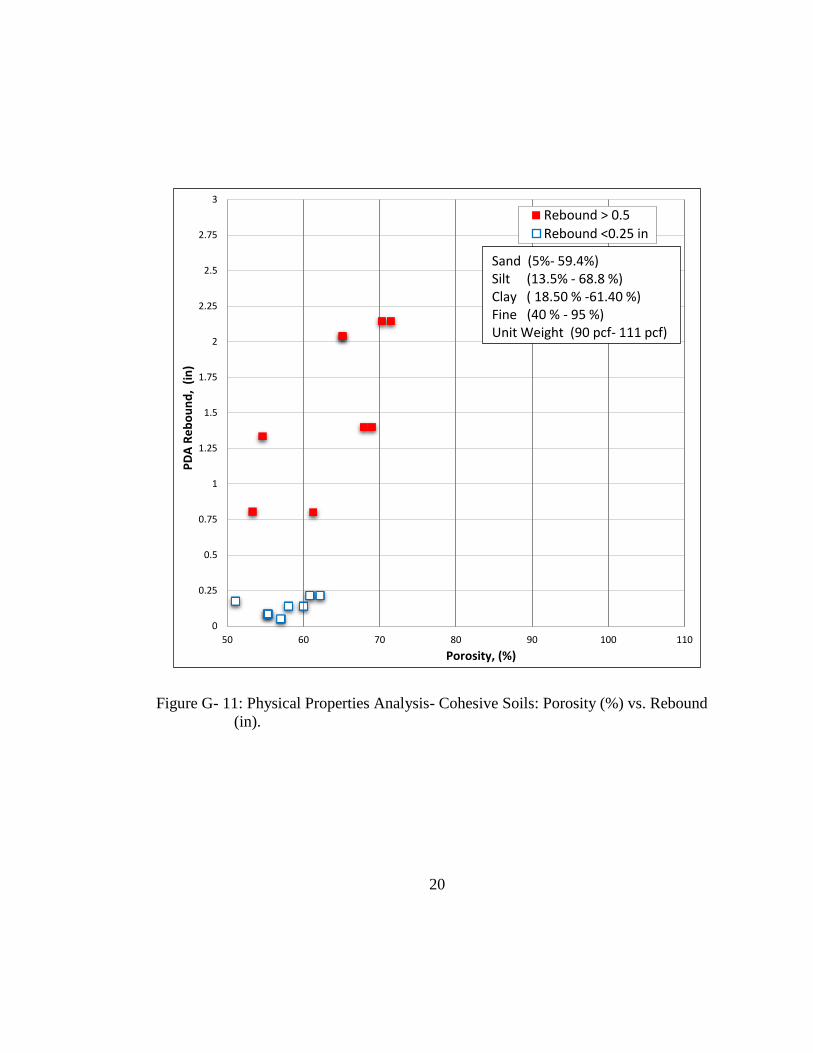
Figure G- 11: Physical Properties Analysis- Cohesive Soils: Porosity (%) vs. Rebound
(in).
0
0.25
0.5
0.75
1
1.25
1.5
1.75
2
2.25
2.5
2.75
3
50 60 70 80 90 100 110
PD
A R
eb
ou
nd
, (i
n)
Porosity, (%)
Rebound > 0.5
Rebound <0.25 in
Sand (5%- 59.4%)Silt (13.5% - 68.8 %)Clay ( 18.50 % -61.40 %)Fine (40 % - 95 %)Unit Weight (90 pcf- 111 pcf)
21
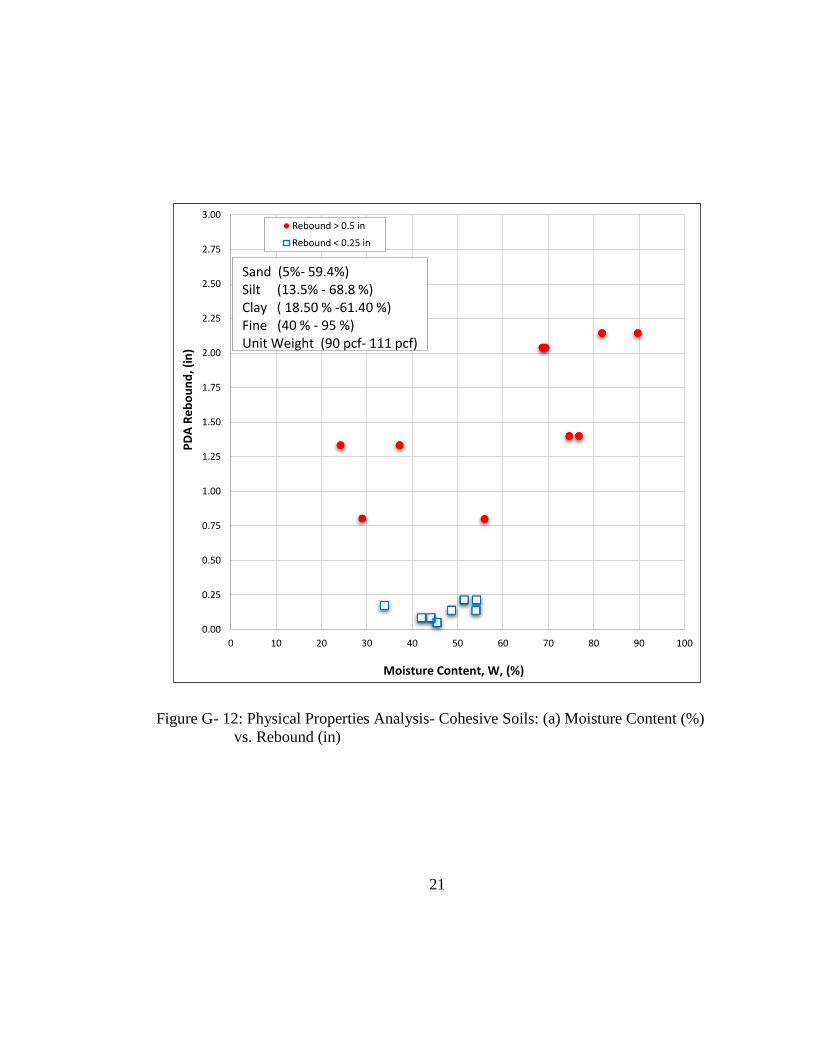
Figure G- 12: Physical Properties Analysis- Cohesive Soils: (a) Moisture Content (%)
vs. Rebound (in)
0.00
0.25
0.50
0.75
1.00
1.25
1.50
1.75
2.00
2.25
2.50
2.75
3.00
0 10 20 30 40 50 60 70 80 90 100
PD
A R
eb
ou
nd
, (in
)
Moisture Content, W, (%)
Rebound > 0.5 in
Rebound < 0.25 in
Sand (5%- 59.4%)Silt (13.5% - 68.8 %)Clay ( 18.50 % -61.40 %)Fine (40 % - 95 %)Unit Weight (90 pcf- 111 pcf)
22
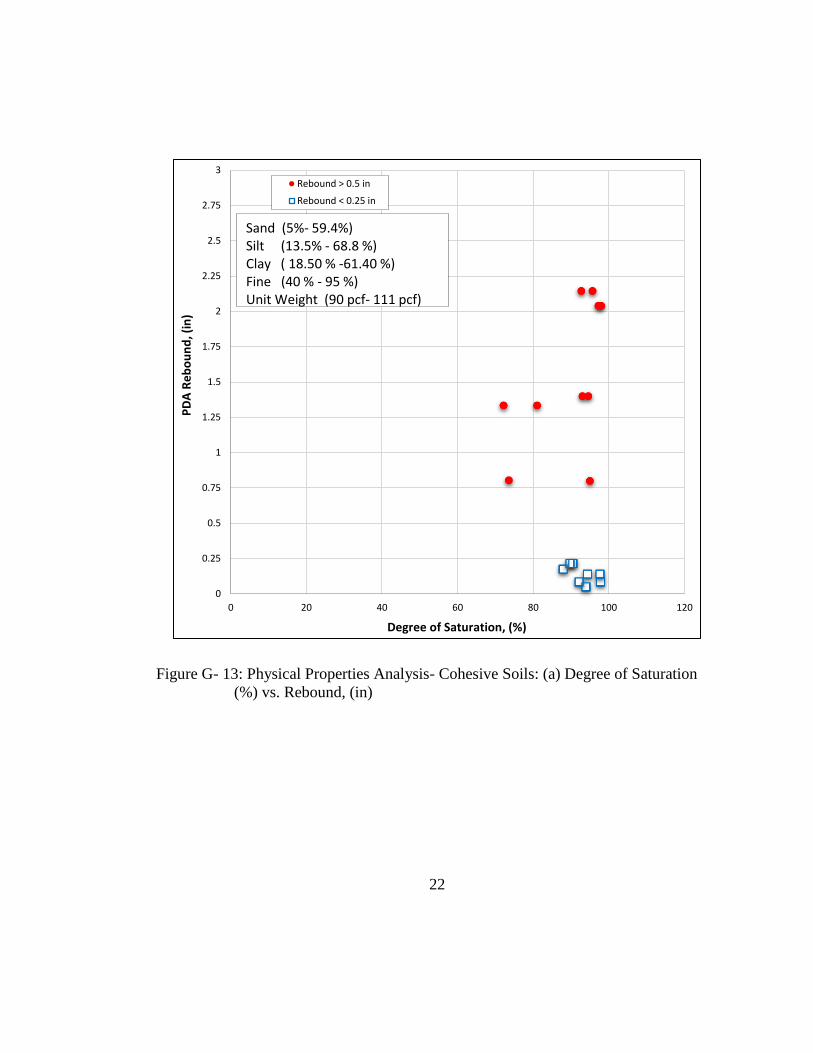
Figure G- 13: Physical Properties Analysis- Cohesive Soils: (a) Degree of Saturation
(%) vs. Rebound, (in)
0
0.25
0.5
0.75
1
1.25
1.5
1.75
2
2.25
2.5
2.75
3
0 20 40 60 80 100 120
PD
A R
eb
ou
nd
, (in
)
Degree of Saturation, (%)
Rebound > 0.5 in
Rebound < 0.25 in
Sand (5%- 59.4%)Silt (13.5% - 68.8 %)Clay ( 18.50 % -61.40 %)Fine (40 % - 95 %)Unit Weight (90 pcf- 111 pcf)
23
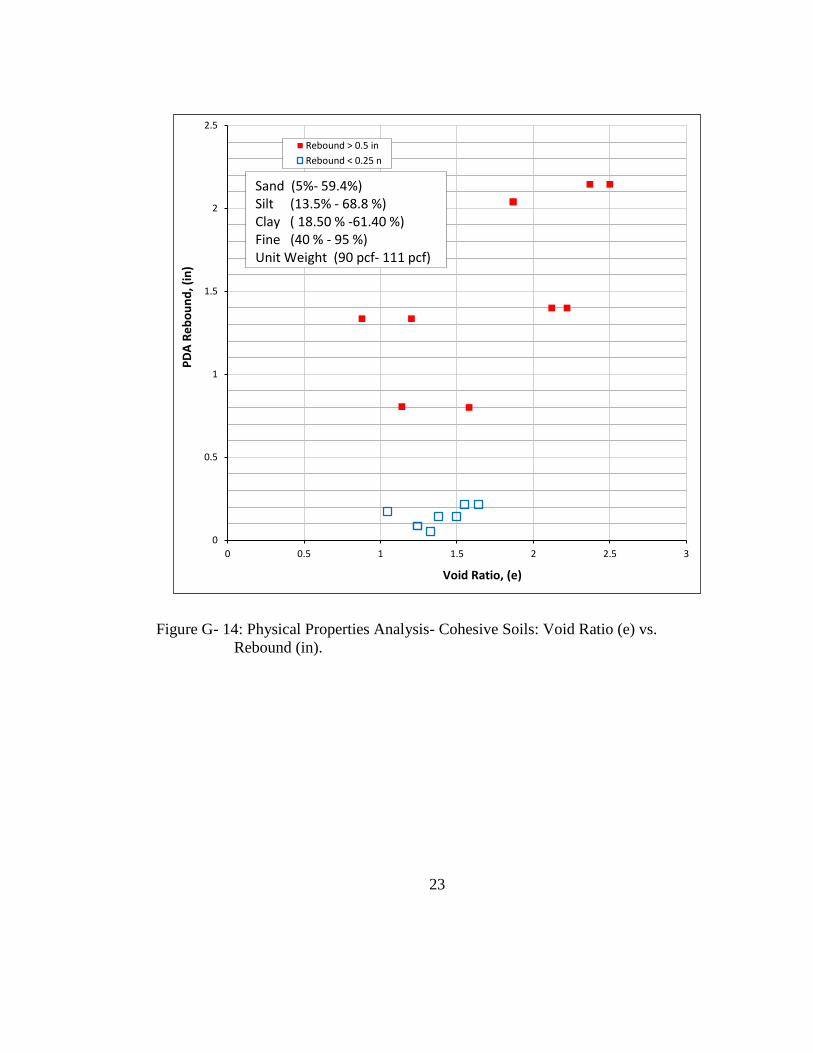
Figure G- 14: Physical Properties Analysis- Cohesive Soils: Void Ratio (e) vs.
Rebound (in).
0
0.5
1
1.5
2
2.5
0 0.5 1 1.5 2 2.5 3
PD
A R
eb
ou
nd
, (in
)
Void Ratio, (e)
Rebound > 0.5 in
Rebound < 0.25 n
Sand (5%- 59.4%)Silt (13.5% - 68.8 %)Clay ( 18.50 % -61.40 %)Fine (40 % - 95 %)Unit Weight (90 pcf- 111 pcf)
24
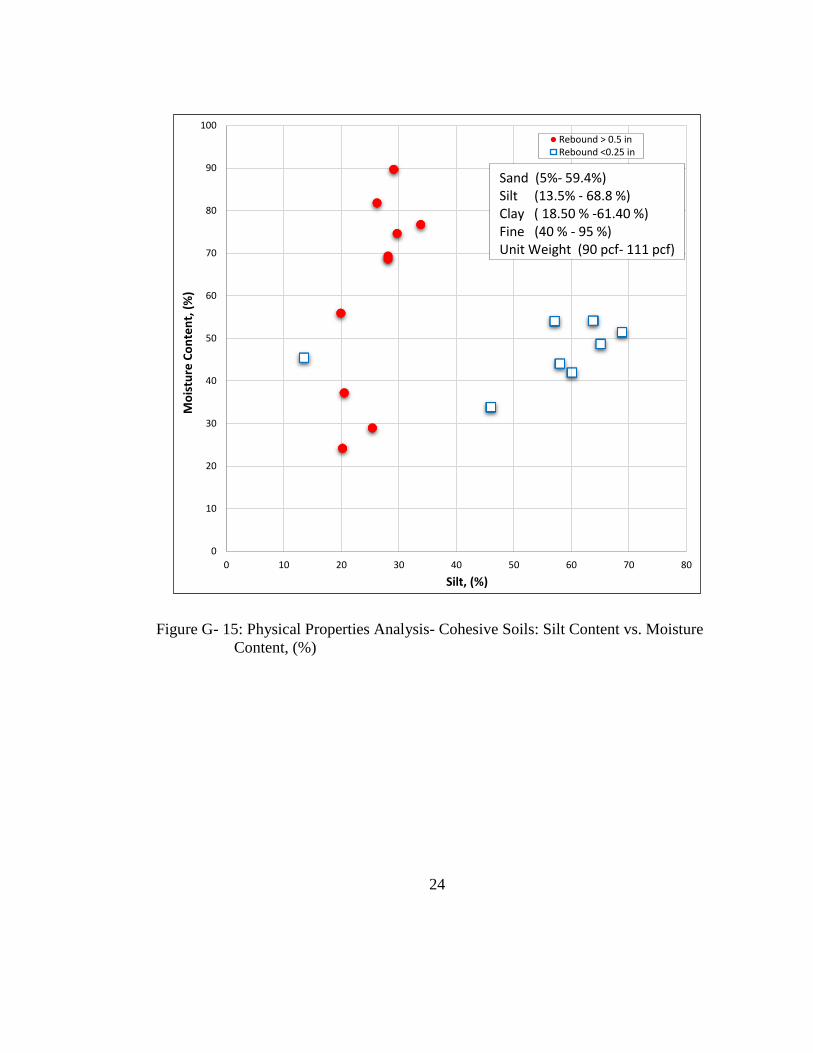
Figure G- 15: Physical Properties Analysis- Cohesive Soils: Silt Content vs. Moisture
Content, (%)
0
10
20
30
40
50
60
70
80
90
100
0 10 20 30 40 50 60 70 80
Mo
istu
re C
on
ten
t, (
%)
Silt, (%)
Rebound > 0.5 inRebound <0.25 in
Sand (5%- 59.4%)Silt (13.5% - 68.8 %)Clay ( 18.50 % -61.40 %)Fine (40 % - 95 %)Unit Weight (90 pcf- 111 pcf)
25
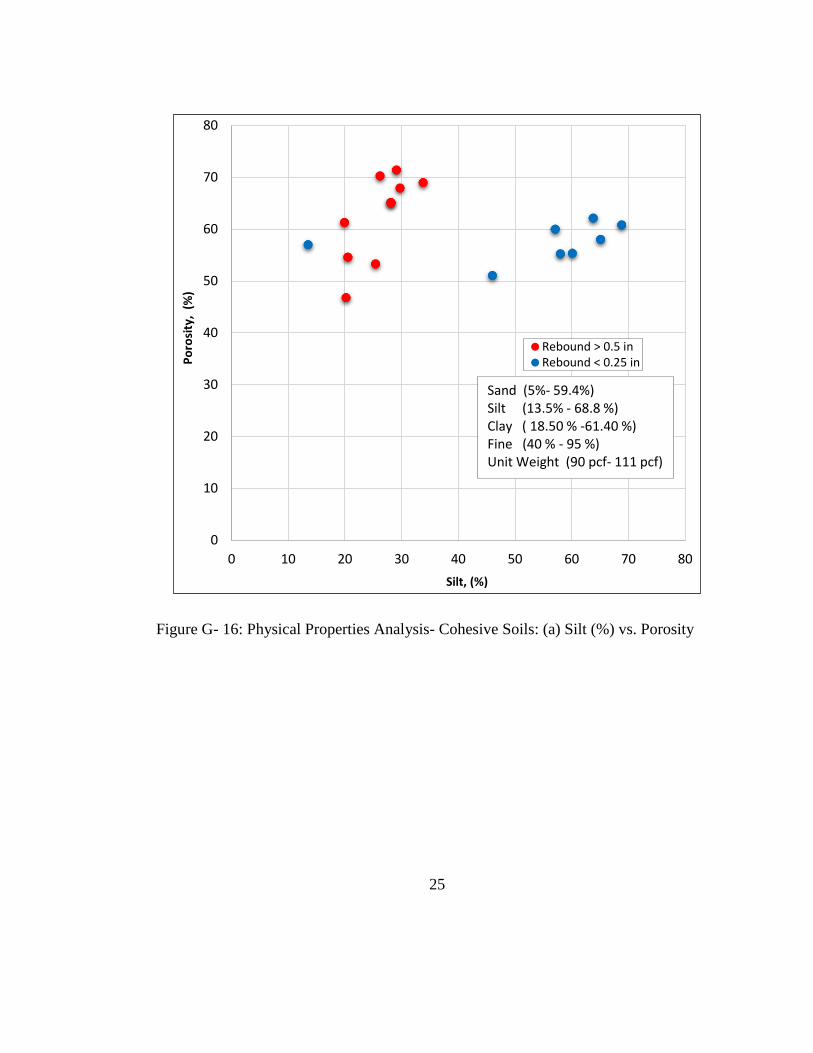
Figure G- 16: Physical Properties Analysis- Cohesive Soils: (a) Silt (%) vs. Porosity
0
10
20
30
40
50
60
70
80
0 10 20 30 40 50 60 70 80
Po
rosi
ty,
(%)
Silt, (%)
Rebound > 0.5 inRebound < 0.25 in
Sand (5%- 59.4%)Silt (13.5% - 68.8 %)Clay ( 18.50 % -61.40 %)Fine (40 % - 95 %)Unit Weight (90 pcf- 111 pcf)