Embed Size (px)
Citation preview

1 Draft version 15 (01-08-13)
Tabcorp Holdings Limited ABN 66 063 780 709
Investor Day
17 October 2013
For
per
sona
l use
onl
y

2 Tabcorp Investor Day 17 October 2013
Exec GM Commercial Development Doug Freeman
MD Fixed Odds Craig Nugent
CFO Damien Johnston
Exec GM Corporate Legal & Regulatory Kerry Willcock
COO Media & International
Brendan Parnell
TABCORP CEO & MD David Attenborough
Tabcorp senior leadership team
Exec GM Human Resources Merryl Dooley
CIO Kim Wenn
Exec GM Distribution
Adam Rytenskild
Exec GM Marketing
David Ginnane
For
per
sona
l use
onl
y
3 Tabcorp Investor Day 17 October 2013
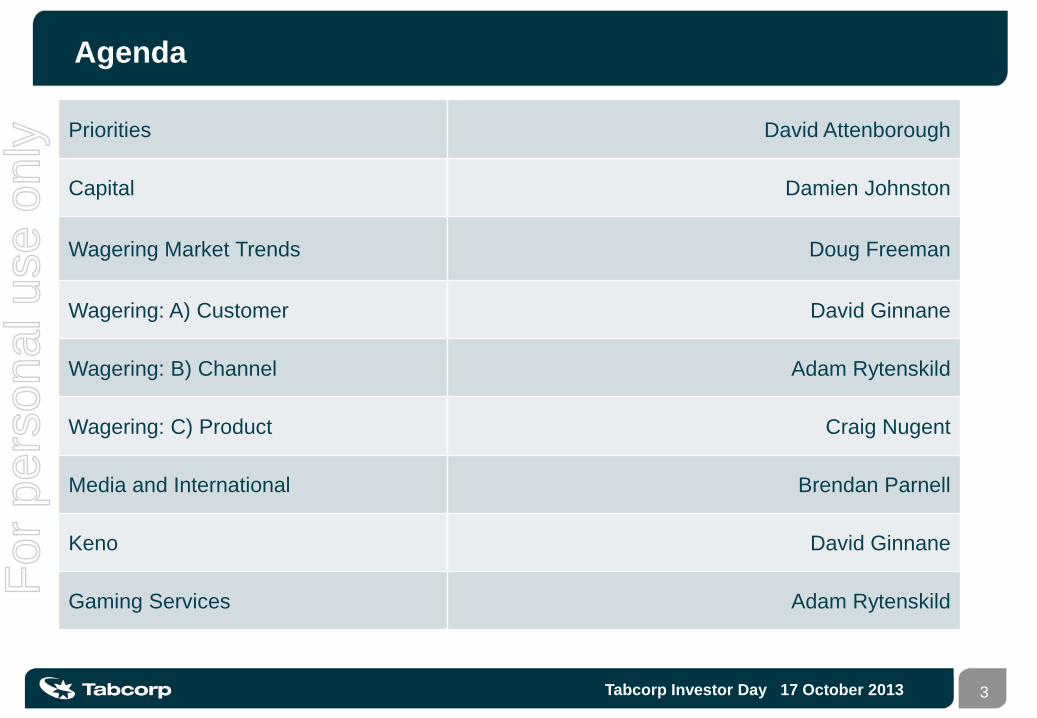
Agenda
Priorities David Attenborough
Capital Damien Johnston
Wagering Market Trends Doug Freeman
Wagering: A) Customer David Ginnane
Wagering: B) Channel Adam Rytenskild
Wagering: C) Product Craig Nugent
Media and International Brendan Parnell
Keno David Ginnane
Gaming Services Adam Rytenskild For
per
sona
l use
onl
y

4 Tabcorp Investor Day 17 October 2013
Quality integrated gambling entertainment businesses Long dated licences Strong trusted brands Unique multi-product / multi-channel distribution Geographic diversification
Strong cash generating businesses and defensive earnings profile
Product and technology innovation to lead both retail and digital channels
Driving growth from new investments
Business model underpinned by strong relationships with stakeholders
Tabcorp has an attractive investment case F
or p
erso
nal u
se o
nly

5 Tabcorp Investor Day 17 October 2013
Key priorities
Capital Optimise the use of and return on invested capital
Wagering Lead wagering transformation
Media & International Enhance integration with wagering
Keno Drive growth through product expansion
Gaming Services
Grow through venue, product and interstate expansion
Underpinned by the ability to attract, develop and retain talent For
per
sona
l use
onl
y

6 Tabcorp Investor Day 17 October 2013
Capital - Damien Johnston F
or p
erso
nal u
se o
nly

7 Tabcorp Investor Day 17 October 2013
Optimise the use of and return on invested capital
Returns
Increase return on invested capital
Productivity
Drive group-wide productivity improvement
Balance sheet
Maintain strong balance sheet
For
per
sona
l use
onl
y

8 Tabcorp Investor Day 17 October 2013
Tabcorp’s objective is ROIC of at least 14% by FY16
12%
14%+
FY13 FY16
Notes: 1. Return on Invested Capital (ROIC) is calculated as EBIT / Invested Capital (average of opening and closing Invested Capital for a year) 2. EBIT is Earnings Before Interest & Tax before significant items 3. Invested Capital comprises shareholders’ equity plus Net Debt. Invested Capital at 30 June 2013 was $2,529 million 4. Net Debt includes US$ debt at the A$ principal repayable under cross currency swaps 5. Assumes no material changes to current regulatory, taxation and racing industry arrangements
For
per
sona
l use
onl
y

9 Tabcorp Investor Day 17 October 2013
Productivity is a key focus: FY13 opex/revenue of 21% Target opex/revenue of 20-21%
Project “Future Fit” commenced in FY13 to identify opportunities to improve operating processes and practices. Initiatives identified include: Property optimisation Renegotiation of certain supplier contracts Continued focus on discretionary
expenses Enhancing our people capability in key
growth areas
Drive group-wide productivity improvement
Source: Income statement for the year ended 30 June 2013
36%
Advertising & promotions
9%
20% 10%
25%
Employment
Property
Other
Communications & technology
FY13 Operating Expenses $423m
For
per
sona
l use
onl
y

10 Tabcorp Investor Day 17 October 2013
400 400 400
150
284
250
84127
0
100
200
300
400
500
600
FY14 FY15 FY16 FY17 FY18 FY19 FY20 FY21 FY22
$m
Bank facilities Medium Term notes (May 2014)Tabcorp Retail bonds (May 2014) Tabcorp Subordinated notesUS Private Placement
Maintain strong balance sheet
Notes Tabcorp Subordinated Notes mature in March 2037, however illustrated above at the first call date in 2017
Well diversified debt structure Investment grade credit rating Refinancing underway with bank facility
extended. Focus on May 2014 bond maturities
For
per
sona
l use
onl
y

11 Tabcorp Investor Day 17 October 2013
Wagering market trends – Doug Freeman
For
per
sona
l use
onl
y

12 Tabcorp Investor Day 17 October 2013
The wagering market has shown consistent growth
Source: ARB Fact Books, internal Tabcorp data, includes some estimates
Australian Wagering Market
12
14
16
18
20
22
24
26
FY01 FY02 FY03 FY04 FY05 FY06 FY07 FY08 FY09 FY10 FY11 FY12 FY13
Annu
al T
urno
ver (
$b)
FY01 - FY07 FY08 - FY13CAGR 7.9% 4.1%
For
per
sona
l use
onl
y

13 Tabcorp Investor Day 17 October 2013
Tabcorp market share has remained relatively stable since the recent increase in competition
Tabcorp’s share of wagering turnover
Source: ARB Fact Books, internal Tabcorp data, includes some estimates
Share of turnover
42.8% 42.5% 44.3% 43.7% 44.4% 43.6%
57.2% 57.5% 55.7% 56.3% 55.6% 56.4%
FY08 FY09 FY10 FY11 FY12 FY13
TAH share OtherFor
per
sona
l use
onl
y

14 Tabcorp Investor Day 17 October 2013
Tabcorp total wagering revenue CAGR of 4.7% since 20081
700
900
1,100
1,300
1,500
1,700
1,900
FY08 FY09 FY10 FY11 FY12 FY13
Growth on pcp % 7.6% 5.2% 0.5% 4.2% 5.9%
Fixed odds expansion, yield improvement, Trackside, and international have contributed to the 4.7% CAGR
Notes 1 Total revenue includes the Victorian JV partner interest, NSW represents 100% of revenue
For
per
sona
l use
onl
y

15 Tabcorp Investor Day 17 October 2013
Lead wagering transformation
Customer Drive deep customer relationships
Channel Digital leadership, underpinned by exclusive retail network
Product Expand product and optimise yield
For
per
sona
l use
onl
y

16 Tabcorp Investor Day 17 October 2013
Wagering customer - David Ginnane F
or p
erso
nal u
se o
nly

17 Tabcorp Investor Day 17 October 2013
Drive deep customer relationships
Customer Base Channels Brands
TAB1
Luxbet
Trackside1
Sky Racing2
Total Est. customer base
Total Customers
1,850,000
40,000
220,000
1,500,000
2,000,000+
Unparalleled breadth of customers, channels and brands in the domestic category underpins comprehensive customer insights and relationships
Notes 1 Internal Tabcorp data, includes some estimates 2 Represents active viewers
For
per
sona
l use
onl
y

18 Tabcorp Investor Day 17 October 2013
Customer acquisition and engagement continues to grow
TAB account customers
Unique active customers: customers who placed a bet during the financial year Acquired customers: new customers who signed up to a TAB account and placed a bet during the financial year
0
50,000
100,000
150,000
200,000
250,000
300,000
350,000
FY10 FY11 FY12 FY13
Active customers Acquired customers
6.4%
CAGR
FY10 – FY13
5.7%
For
per
sona
l use
onl
y
19 Tabcorp Investor Day 17 October 2013
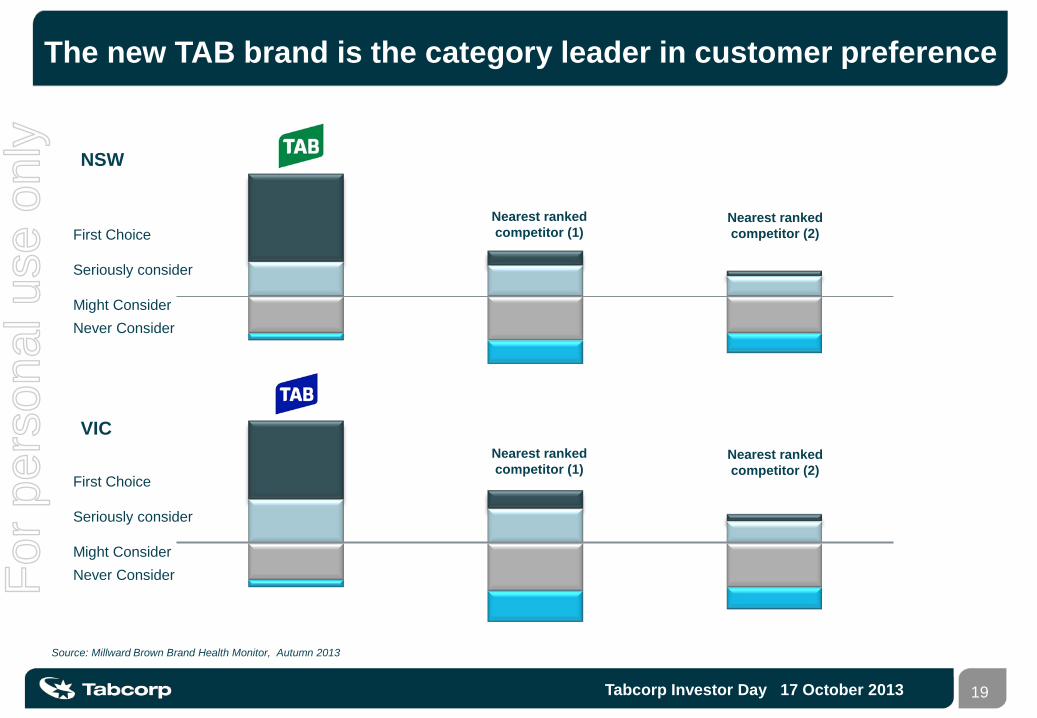
The new TAB brand is the category leader in customer preference
First Choice Seriously consider Might Consider Never Consider
First Choice Seriously consider Might Consider Never Consider
NSW
VIC
Nearest ranked competitor (1)
Nearest ranked competitor (2)
Nearest ranked competitor (1)
Nearest ranked competitor (2)
Source: Millward Brown Brand Health Monitor, Autumn 2013
For
per
sona
l use
onl
y

20 Tabcorp Investor Day 17 October 2013
Analytics, CRM and loyalty
Highly targeted messaging and content: Right offer Right channel Right time
Analytics CRM Loyalty
Sophisticated analytics, CRM and loyalty capabilities support Tabcorp’s leadership position
Scale and analytics tools driving a big data advantage
Talent sourced from a range of highly developed CRM categories, including the UK wagering sector
Expansive customer and transactional information: Products Customers Transactions
Expands depth and breadth of customer data: Retail and account NSW and VIC Brings CRM to retail
For
per
sona
l use
onl
y

21 Tabcorp Investor Day 17 October 2013
85%
88%
86%
61%
82% 81% 85%
83%
79%
82%
79% 81%
85%
85%
85%
90%
59%
84%
79%
86% 84%
80%
80%
82% 83% 86%
Sep Oct Nov Dec Jan Feb Mar Apr May Jun Jul Aug Sep
Customer retention rates
Customer retention rates improve as CRM accelerates
CY12 retention rate CY13 retention rate
Uplift in underlying retention despite increasing competition
Retained customers worth ~3 times value of new or reactivated customers
Note: seasonality applies Post-SRC effect
Retention rate: % contactable customers who placed a bet in a given month, as well as the preceding month
For
per
sona
l use
onl
y

22 Tabcorp Investor Day 17 October 2013
Loyalty program 1:1 communication to retail cash customers
TAB Rewards member base (est FY14)
Customer retention rates underpinned by account customer CRM program
New loyalty program brings CRM to retail cash customers
Newly identified customers are folded into the CRM program
0
50
100
150
200
250
300
Account members Retail cash members
For
per
sona
l use
onl
y

23 Tabcorp Investor Day 17 October 2013
Our social and digital platforms provide extensive reach
Facebook: translates retail and on-course experiences into digital experiences
Twitter: rapid communication of product, price, event and service information
YouTube: new TAB branded YouTube page launch
Social platforms driving extremely high and growing volumes of viewing impressions, further strengthening our customer insights and relationships
For
per
sona
l use
onl
y

24 Tabcorp Investor Day 17 October 2013
Wagering channel - Adam Rytenskild F
or p
erso
nal u
se o
nly

25 Tabcorp Investor Day 17 October 2013
Digital leadership, underpinned by exclusive retail network
Wagering distribution channels work together for overall growth
Customers enjoy the multi-channel offering with 66% of account deposits in cash in retail
Rapidly increasing digital turnover driving overall growth
Further integration of retail and digital will make both stronger
FY10 FY13
Retail Digital Call centre Other
63%
17%
11% 9%
58%
24%
8% 10%
Wagering Turnover by Channel
CAGR 3.5%
For
per
sona
l use
onl
y

26 Tabcorp Investor Day 17 October 2013
Digital and retail strategies
1. Digital strategy for TAB and Luxbet
Increase capability and scale
Enhance mobile
Digital pathway 2. Retail and digital integration
Self-service
Digital information displays
Digital incentive program 3. Retail
Extract full value from exclusive retail channel F
or p
erso
nal u
se o
nly

27 Tabcorp Investor Day 17 October 2013
Increase digital capability and scale
In-housing and increasing digital capability to accelerate speed to market
Digital team to build to 40 people by January 2014, offset by saving of third party expenses
Digital leadership roles recruited in Commercial, Marketing and Technology. Previous expertise:
3 Mobile, Telstra/Big Pond Media
Google and BT
REA Group (realestate.com.au)
Increased agility driving improved speed to market
External hire, previous experience: • REA Group / realestate.com.au
For
per
sona
l use
onl
y

28 Tabcorp Investor Day 17 October 2013
FY10 FY11 FY12 FY13Mobile device Desktop
Enhance mobile
Mobile platform in place, continued enhancement to drive future performance
Mobile driving digital growth
At least 6 major releases for iPhone, iPad and Android each year to drive continuous improvement
Luxbet and Sky Mobile integrated to development
CAGR 16%
Tabcorp digital turnover
Today
49% 51%
For
per
sona
l use
onl
y

29 Tabcorp Investor Day 17 October 2013
Digital pathway
Provide the best experience on chosen device across all TAB channels & Luxbet
Continue to enhance current TAB.com.au and Luxbet.com Speed to load on TAB.com.au improved more than 50% in last 12 months New Luxbet site released in September 2013
HTML pathway
Lite.TAB.com.au (racing only) website optimised for tablet released October 2013 TAB.com.au Mobile site Self-service and then operator terminals in Retail
Developing a consistent experience across all devices
Lite.TAB.com.au
For
per
sona
l use
onl
y

30 Tabcorp Investor Day 17 October 2013
FY10 FY13FY10 FY13
Retail and digital integration
Self-service acts as the middle ground for retail and digital transactions
Self Service Terminal (SST) expansion has extended reach and improved customer experience
Digital platform in place - self-service to be integrated and then operator terminals
Digital form/information integration pathway to paperless
Digital incentive for top-tier venues (pilot complete)
c 4,700
c 2,600
40% 48%
+80%
+126%
No. of SST’s SST % of retail turnover SST turnover $b
22%
30%
40%
48%
FY10 FY11 FY12 FY13
1.4
3.3
For
per
sona
l use
onl
y

31 Tabcorp Investor Day 17 October 2013
Extract full value from exclusive retail channel
Retail foundation secured – network expansion
complete increasing footprint 13% FY10-FY13
Tiered venue model, supported by an efficient Kiosk
offer, has enabled extended reach
Sales team re-structured to drive top tier performance
Improve channel margin via appropriate venue
incentives, e.g. venues ‘legends league’
Targeted top-tier refresh continues (partly venue funded)
For
per
sona
l use
onl
y

32 Tabcorp Investor Day 17 October 2013
Fixed odds wagering product - Craig Nugent F
or p
erso
nal u
se o
nly

33 Tabcorp Investor Day 17 October 2013
FY13 Fixed Odds Revenue Tabcorp NT Corporate Bookmakers
TAB Fixed Odds Luxbet 9 Wagering Operators $404m $39m *$500m
* TAH estimate, excludes Luxbet
Tabcorp is Australia’s largest bookmaker and is maintaining market leadership via its two brands TAB and Luxbet
Our dual brand strategy allows us to offer customers all wagering products, across all distribution channels
Tabcorp continues to be the fixed odds market leader F
or p
erso
nal u
se o
nly

34 Tabcorp Investor Day 17 October 2013
674
1,254
1,660
FY11 FY12 FY13
16
29
46
FY11 FY12 FY13
11.9% 12.4%
14.2%
FY11 FY12 FY13
80
156
236
FY11 FY12 FY13
Ticket and turnover growth shows the popularity of fixed odds racing
Fixed odds racing accounted for 25% of the ‘win and place’ racing revenue in FY13
Revenue growth is exceeding turnover growth
Tickets (millions) Turnover $m
Revenue $m Yield %
Fixed odds racing - growing tickets, turnover and yields F
or p
erso
nal u
se o
nly

35 Tabcorp Investor Day 17 October 2013
1,259 1,326
1,245
FY11 FY12 FY13
11.7% 12.4%
13.5%
FY11 FY12 FY13
147 165 168
FY11 FY12 FY13
28 30 31
FY11 FY12 FY13
Turnover performance impacted by shift in customer mix
Growth in yields driven by enhanced risk management
Tickets (millions) Turnover $m
Revenue $m Yield %
Fixed odds sport market remains competitive F
or p
erso
nal u
se o
nly

36 Tabcorp Investor Day 17 October 2013
Enhanced risk management structure driving more quality product at better yields
Fixed odds risk management employees have increased by over 50% since FY11
Algorithm based customer scoring system provides real time risk assessment
‘Intercept’ and ‘partialling’ selected bets across all channels
64 Employees
Racing Team Sport Team
Harn
ess,
Gre
yhou
nds &
In
tern
atio
nal
NSW
Vict
oria
Que
ensla
nd
Live
Dom
estic
Foo
tbal
l an
d O
ther
Socc
er
Tenn
is
US
Spor
ts
Analysts – Algorithm based scoring system
Risk Management Structure
TAB has increased people and technology capability F
or p
erso
nal u
se o
nly

37 Tabcorp Investor Day 17 October 2013
Expansion of fixed odds products - a key driver of revenue growth
FY14 fixed odds product expansion:
Expanded books in greyhounds and harness to maintain market leadership
Automated Market Management (AMM) – Sports books scaled to match global offering
18
28
36
-
5
10
15
20
25
30
35
40
FY11 FY12 FY13
thou
sand
s
No. of Racing Books
193
267 288
-
50
100
150
200
250
300
350
FY11 FY12 FY13
thou
sand
s
No. of Sport Books
Fixed odds products expansion F
or p
erso
nal u
se o
nly
38 Tabcorp Investor Day 17 October 2013
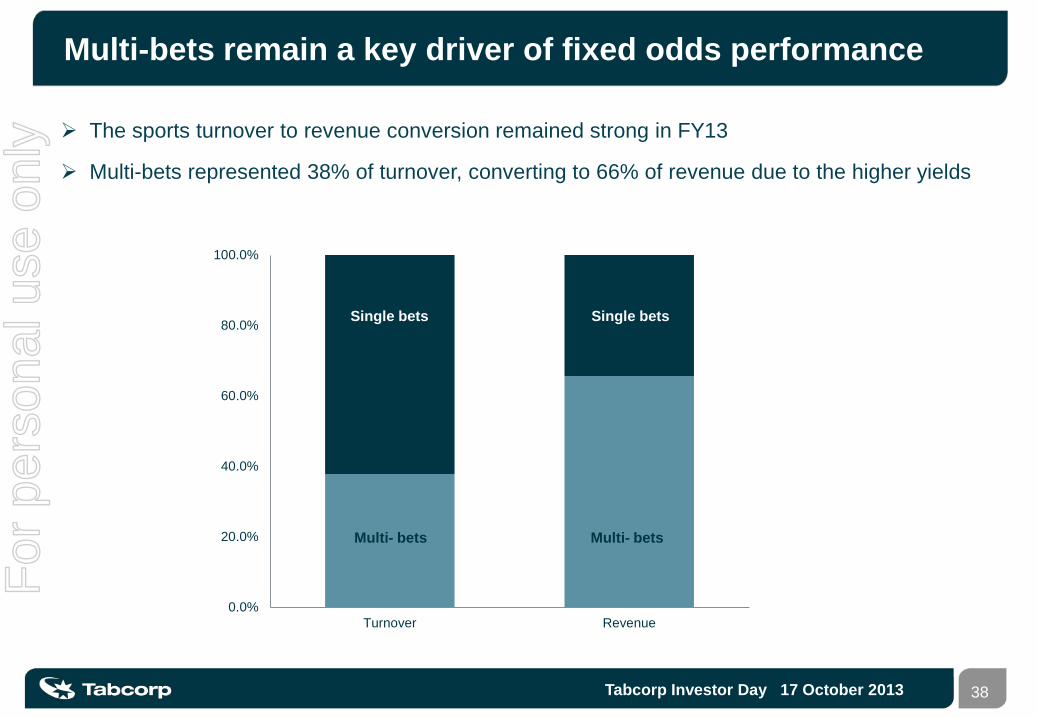
The sports turnover to revenue conversion remained strong in FY13
Multi-bets represented 38% of turnover, converting to 66% of revenue due to the higher yields
0.0%
20.0%
40.0%
60.0%
80.0%
100.0%
Turnover Revenue
Single bets Single bets
Multi- bets Multi- bets
Multi-bets remain a key driver of fixed odds performance F
or p
erso
nal u
se o
nly

39 Tabcorp Investor Day 17 October 2013
American sports growth is outperforming domestic sports
A diversified sports offering leaves Tabcorp less susceptible to a series of abnormal results in any one sport
Product fees to sports controlling bodies are payable on domestic sports
A key focus in FY14 will be the Soccer World Cup in partnership with Football Federation Australia and broadcaster SBS
TAB Sports Product Sales Share
0.0%
5.0%
10.0%
15.0%
20.0%
25.0%
AFL Rugby League Soccer Tennis US Sports Cross SportMulti
Other
FY12 FY13
International sports product continues to grow in popularity F
or p
erso
nal u
se o
nly

40 Tabcorp Investor Day 17 October 2013
71
115
50
<= $20 > $20 to <=$200 > $200
23.1%
16.2%
7.7%
<= $20 > $20 to <=$200 > $200
53
72
43
<= $20 > $20 to <=$200 > $200
27.3%
16.5%
6.9%
<= $20 > $20 to <=$200 > $200
Customer demand for fixed odds racing increasing
Higher levels of pari-mutuel substitution in < $20 range, with favourable impact on yields
< $20 bets made up 41% of pari-mutuel ‘win and place’ turnover in FY13
In sport, the yield for bets up to $20 is the highest at 27.3%, largely driven by multi bets
Fixed Odds Racing Revenue $m Yield
Fixed Odds Sport Revenue $m Yield
Yield optimisation will continue to be a focus F
or p
erso
nal u
se o
nly

41 Tabcorp Investor Day 17 October 2013
12
21
28
39
FY10 FY11 FY12 FY13
The Luxbet offering differs to TAB and growth is continuing
476
559 572 643
FY10 FY11 FY12 FY13
68% of Luxbet Sales are derived from Credit and Tote derivative products which are not able to be offered by TAB Wagering
42% Revenue growth in FY13 was best in Corporate Bookmaker category
Turnover $m Revenue $m
EBITDA $m Yield %
-6.3
0.0 0.2
1.5
FY10 FY11 FY12 FY13
2.5%
3.8%
4.9%
6.1%
FY10 FY11 FY12 FY13
For
per
sona
l use
onl
y
42 Tabcorp Investor Day 17 October 2013
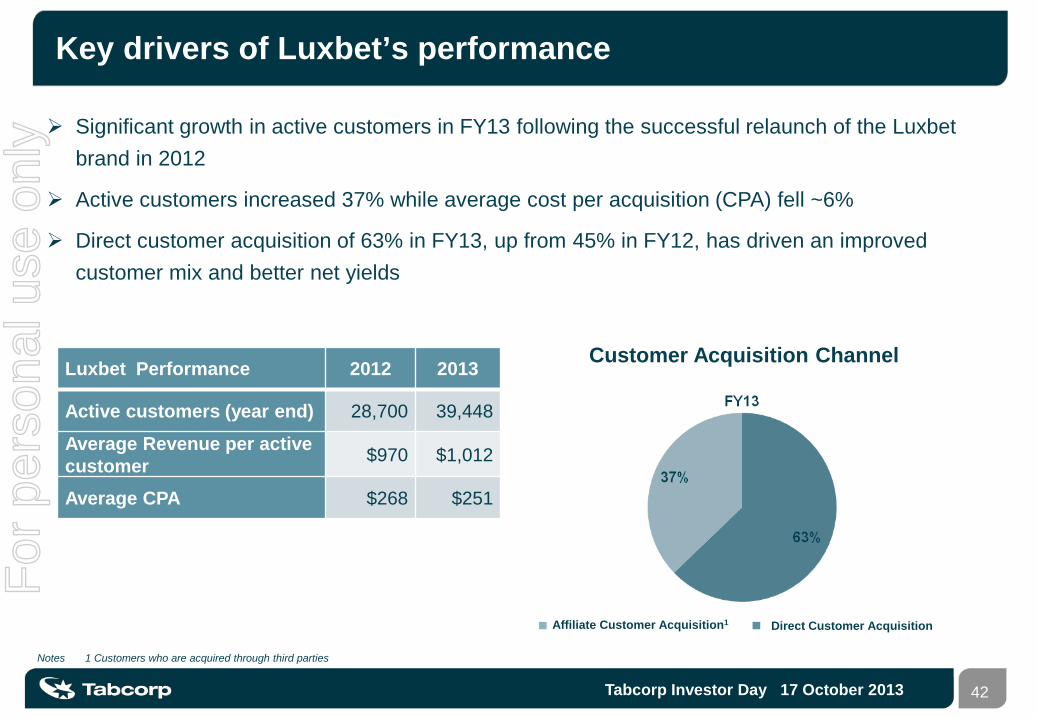
Significant growth in active customers in FY13 following the successful relaunch of the Luxbet brand in 2012
Active customers increased 37% while average cost per acquisition (CPA) fell ~6%
Direct customer acquisition of 63% in FY13, up from 45% in FY12, has driven an improved customer mix and better net yields
Luxbet Performance 2012 2013
Active customers (year end) 28,700 39,448
Average Revenue per active customer $970 $1,012
Average CPA $268 $251
Affiliate Customer Acquisition1 Direct Customer Acquisition
Key drivers of Luxbet’s performance
Customer Acquisition Channel
Notes 1 Customers who are acquired through third parties
For
per
sona
l use
onl
y
43 Tabcorp Investor Day 17 October 2013
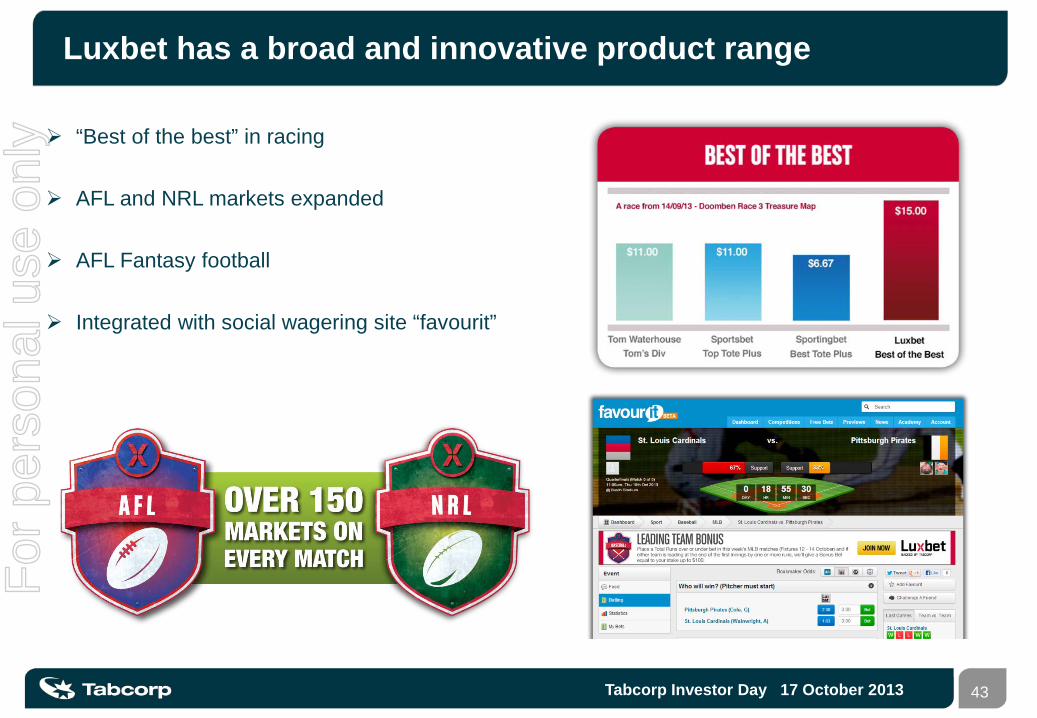
“Best of the best” in racing
AFL and NRL markets expanded
AFL Fantasy football
Integrated with social wagering site “favourit”
Luxbet has a broad and innovative product range F
or p
erso
nal u
se o
nly

44 Tabcorp Investor Day 17 October 2013
Media and International - Brendan Parnell F
or p
erso
nal u
se o
nly

45 Tabcorp Investor Day 17 October 2013
Enhance integration with wagering
Product Secure rights and broaden product base
Customer experience Expand digital media and optimise content
International Expand international co-mingling and export of racing
For
per
sona
l use
onl
y

46 Tabcorp Investor Day 17 October 2013
Sky Racing – world leader in race broadcasting
Business overview
Sky Racing: a multi-platform, multi-media network Sky Racing channels Sky Sports Radio Sky Racing digital (web, apps, media services)
Extensive network coverage 5,400 retail outlets – hotels, clubs and TABs Pay TV across 2.4 million homes
International growth Export to 51 countries Importing international race content from 10 countries Co-mingling
TV Channels
Retail Digital
Homes
Radio
Sky and Wagering – a symbiotic relationship
Betting stimulated by synchronised racing vision and commentary
Promoting betting through data, vision and audio display
International and local relationships – foster wagering and sustain racing
For
per
sona
l use
onl
y

47 Tabcorp Investor Day 17 October 2013
Aim to secure and extend rights Renew TVN media rights Extend media rights portfolio
Broaden base of product Expanded wagering day Sports betting content integration
Media Rights Overview
Type Race Meets
Rights Held New Media
Thoroughbred
QLD/NT 517
WA 259
SA 177
ACT 26
TAS 70
Internat’l 1,854
Greyhound & Harness
AUS & Internat’l 5761
NSW and VIC t’breds 11301
X2
Note: 1. TVN content is 16.6% of Australian race meetings FY13 (excludes International races) 2. Telstra currently holds TVN’s New Media rights.
Secure rights and broaden product base F
or p
erso
nal u
se o
nly

48 Tabcorp Investor Day 17 October 2013
Expand digital media Seeking TVN digital content Unique digital services - Watch & Bet Customisable products i.e. Dual screen player
Optimise content to support wagering
Race scheduling enhancement Wagering display enhancements Fixed odds integration
Weekly Digital Stats1 #’s1 Growth on pcp Internet Page Views 851k +33%
Internet Visits 153k +74%
Digital Visitors – All2 413k +4%
Note: 1. Weekly figures for w/c 29 September 2013; 2. App, web and Sky Form consumers
TAB-SKY Watch & Bet
Dual Screen Media Centre
Expand digital media and optimise content F
or p
erso
nal u
se o
nly

49 Tabcorp Investor Day 17 October 2013
Co-mingling includes Direct or Indirect as well as Hosting and Guesting. Benefits include: Increased pool liquidity Enhanced viability of product
Tabcorp International provides a 1 stop shop Integrated form, data & vision (multi-language, multi-media) Co-mingling
Co-mingling expansion plans PGI – the global tote gateway Expanded Hosting and Guesting Connecting Asia
Continued focus on strategic partnerships (HK, NZ, Sth Africa, Singapore)
Expand international co-mingling and export of racing
Chinese digital form guide
For
per
sona
l use
onl
y

50 Tabcorp Investor Day 17 October 2013
Keno - David Ginnane F
or p
erso
nal u
se o
nly

51 Tabcorp Investor Day 17 October 2013
Drive Keno growth through product expansion
Customer Increase participation by lotteries and EGM players
Product Extend and develop product range
Channel Drive optimal retail experience
For
per
sona
l use
onl
y

52 Tabcorp Investor Day 17 October 2013
Increase participation by lotteries and EGM players
Tabcorp’s Keno customers are awarded more than $68m per month in prizes Games are offered on average every 3 minutes Prizes range from $1 to multi million dollar jackpots
Source: Tabcorp estimates based on Annual Reports, internal data
6.9%
CAGR
FY07 – FY13
4.3%
4.8%
Total 5.1%
711 724
845 860 942 1,008
1,064
0
1,000
2,000
3,000
4,000
5,000
6,000
7,000
8,000
FY07 FY08 FY09 FY10 FY11 FY12 FY13
Turn
over
($m
)
Lotteries TAH Keno Non TAH Keno
Australian Lotteries FY13 Turnover ~$6.9 billion
For
per
sona
l use
onl
y

53 Tabcorp Investor Day 17 October 2013
There are opportunities to shift share of the ‘gambling wallet’ with a compelling Keno product and prize offers
Source: Millward Brown Health Monitor Spring 2012
Keno customer cross-product utilisation (%)
84%
60%
65%
14%
Play Lotto
Bought scratch cards
Play poker machines
Play Trackside
Increase participation by lotteries and EGM players F
or p
erso
nal u
se o
nly

54 Tabcorp Investor Day 17 October 2013
Product innovation is core to refreshing the Keno proposition to existing and new customers
Keno Racing Jackpot Pooling Keno Roulette
• NSW only • Traditional roulette bet types • Targets younger hotel patron
• Intention to pool jackpots • Accelerates win frequencies • Regulatory approvals being
sought
• Pilot underway in QLD • Animated racing offer • Fixed odds pay table
Extend and develop product range F
or p
erso
nal u
se o
nly
55 Tabcorp Investor Day 17 October 2013
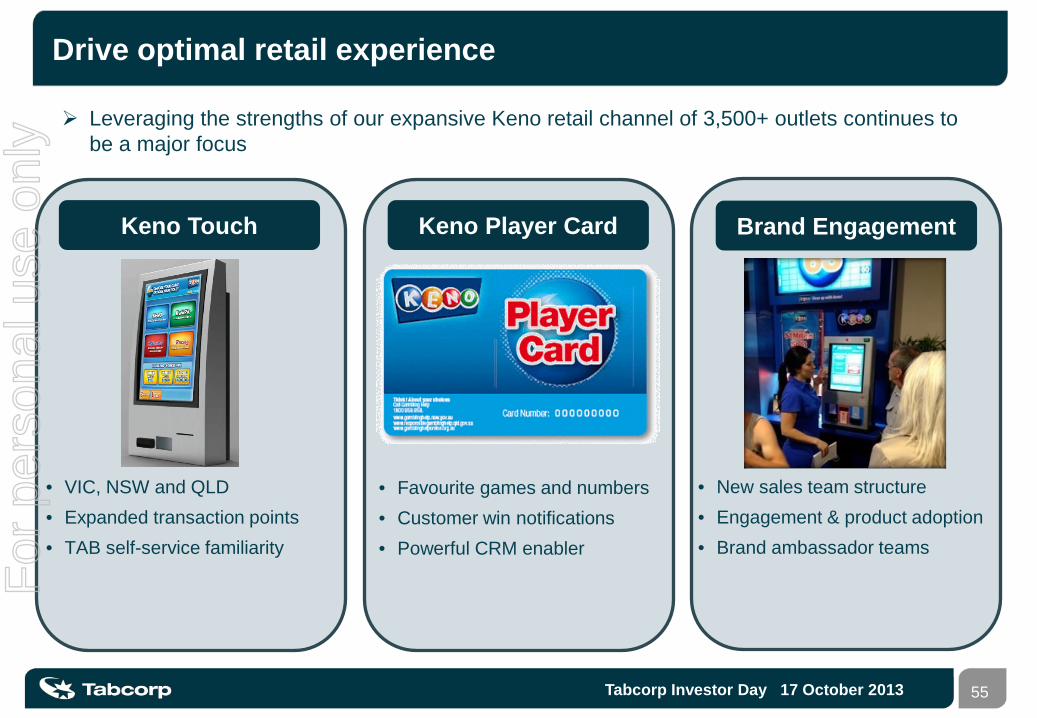
Leveraging the strengths of our expansive Keno retail channel of 3,500+ outlets continues to be a major focus
Keno Touch Keno Player Card Brand Engagement
• New sales team structure • Engagement & product adoption • Brand ambassador teams
• Favourite games and numbers • Customer win notifications • Powerful CRM enabler
• VIC, NSW and QLD • Expanded transaction points • TAB self-service familiarity
Drive optimal retail experience F
or p
erso
nal u
se o
nly

56 Tabcorp Investor Day 17 October 2013
Gaming Services - Adam Rytenskild F
or p
erso
nal u
se o
nly

57 Tabcorp Investor Day 17 October 2013
Grow through venue, product and interstate expansion
Customer Expand value added services
Expand in Victoria Drive performance to generate new venue sign-ups
Expand interstate Expand TGS into other jurisdictions, an initial focus on NSW
For
per
sona
l use
onl
y
58 Tabcorp Investor Day 17 October 2013
Solid foundation laid in first year
TGS Model: Built on core gaming expertise Long term contracts; 75% 10 years, 25% minimum 6 years Transportable to other jurisdictions, especially where other Tabcorp businesses exist
Product: over 3,000 new EGMs and Game upgrades deployed since April13
Loyalty: The Diamond Rewards program is unique, with 130,000 active members
Service offer: 30 TGS venues refurbished, supported by TGS
For
per
sona
l use
onl
y

59 Tabcorp Investor Day 17 October 2013
EGM procurement - large scale purchase and exclusivity of key machines EGM advice and business intelligence – floor analysis, product mix and predictive analytics Loyalty - Customer behaviour analytics - tailor product and service to local customer Venue design and project management Responsible Gambling - Dow Jones Sustainability global index leader
Value added services
Source: Tabcorp estimates
Provider EGMs Supply EGMs
Business Intelligence
Break Fix Loyalty BDMs Venue Design
RSG
TGS 8,440 Competitor 1 1,817 Competitor 2 1,793 Competitor 3 1,388 Competitor 4 1,024 Competitor 5 749 Competitor 6 298
For
per
sona
l use
onl
y

60 Tabcorp Investor Day 17 October 2013
In-EGM loyalty will further differentiate TGS
TGS expected to gain first-mover advantage in the Victorian market for in-EGM loyalty, with exclusive distribution of the IGT Advantage system
First with Voluntary Pre-Commitment capability in Victoria
The system provides differentiation for TGS via: Loyalty points for customers redeemable in-venue Advertising and messaging on EGMs Ability to promote offers to customers Provides platform for Voluntary Player Pre Commitment
Expand value added services F
or p
erso
nal u
se o
nly
61 Tabcorp Investor Day 17 October 2013
TGS growth levers include machine top ups, key account expansion and new account acquisition
Performance drivers in place and building Focus on value for Key Account partners to drive performance Product mix and speed to market Expert new machine/game advice and seamless deployment Diamond Rewards and in-EGM launch Loyalty Zone Customer service program Venue design expertise with a whole-of-venue focus
TGS targeted Victorian expansion
In-EGM Loyalty expansion a key initiative to capture increased market share Build scale and team capability to deliver growth post foundation year
Drive performance to generate new sign-ups F
or p
erso
nal u
se o
nly

62 Tabcorp Investor Day 17 October 2013
93,933 EGMs
42,730 EGMs
26,202 EGMs
12,744 EGM’s
0 EGM’s
NSW Key Milestones Status
Dealer’s Licence
Gaming Services Agreement
Industry Engagement
Venue Readiness
Formal approval pending
1,186 EGM’s
2,379 EGMs
EGMs do not include casinos
An initial focus on NSW
Well understood market due to existing wagering and keno business
Mid-sized Clubs a sizeable immediate market
2-3 TGS venues initially to demonstrate performance
Expand TGS into other jurisdictions F
or p
erso
nal u
se o
nly
63 Tabcorp Investor Day 17 October 2013
Long term licences
Unique multi product / multi channel customer proposition
Experienced management team
Focus on increasing returns
Conclusion F
or p
erso
nal u
se o
nly

64 Tabcorp Investor Day 17 October 2013
Appendix: Business overview
Above statistics are as at 30 June 2013, rounded % EBITDA based on FY13 results
Product Brands Licence expiry % EBITDA Retail distribution
Wagering NSW 2097Victoria 2024
NSW 2,130 outletsVictoria 750 outlets
260 with oncourse wagering facilities
NSW 2097Victoria 2024 57% NSW 2,100 outlets
Victoria 750 outlets
NT 2015
KenoNSW 2022
Queensland 2047Victoria 2022
16%Queensland 1,170 outlets
NSW 1,800 outletsVictoria 680 outlets
TGS n/a 13% 8,440 EGMs contracted166 outlets
Media n/a 14%5,400 retail outlets
Broadcasting from 200 Australian racetracksF
or p
erso
nal u
se o
nly

65 Tabcorp Investor Day 17 October 2013
Disclaimer This Presentation contains summary information about Tabcorp Holdings Limited (Tabcorp) and its subsidiaries (Tabcorp Group). It should be read in conjunction with the Tabcorp Group’s other periodic and continuous disclosure announcements lodged with the Australian Securities Exchange (ASX), which are available at www.asx.com.au. The information contained in this Presentation is of a general nature and has been prepared by Tabcorp in good faith and with due care but no representation or warranty, express or implied, is provided as to the correctness, quality, accuracy, timeliness, adequacy, reliability or completeness of any statements, estimates or opinions or other information contained in this Presentation. To the maximum extent permitted by law, each member of the Tabcorp Group and their respective directors, officers, partners, employees, advisers and agents and any other person involved in the preparation of this Presentation (each a Disclaiming Party) disclaim all liability and responsibility (including, without limitation, any liability arising from the fault or negligence on the part of any Disclaiming Party) for any direct, indirect or consequential loss or damages which may be suffered by a recipient through the use of or reliance on anything contained in or omitted from this Presentation. This Presentation is for information purposes only and is not a prospectus, product disclosure statement or other disclosure or offering document under Australian or any other law. This Presentation does not constitute an offer, invitation or recommendation to subscribe for or purchase any security and neither this Presentation nor anything contained in it shall form the basis of any contract or commitment. This Presentation is not a recommendation to acquire Tabcorp securities. The information provided in this Presentation is not financial product advice and has been prepared without taking into account any recipient's investment objectives, financial circumstances or particular needs, and should not be considered to be comprehensive or to comprise all the information a recipient may require in order to make an investment decision regarding Tabcorp securities. All dollar values are in Australian dollars (A$) unless otherwise stated. No Disclaiming Party warrants or guarantees the future performance of Tabcorp or any return on any investment made in Tabcorp. This Presentation may contain certain 'forward-looking statements'. The words 'anticipate', 'aim', 'believe', 'expect', 'project', 'forecast', 'estimate', 'will', 'likely', 'intend', 'should', 'could', 'may', 'target', 'plan' and other similar expressions (including indications of 'objectives') are intended to identify forward-looking statements. Indications of, and guidance on, financial position and performance are also forward-looking statements. These statements may involve significant elements of subjective judgement and analysis. No Disclaiming Party makes any representation or warranty, express or implied, as to the fairness, accuracy, completeness, correctness, likelihood of achievement or reasonableness of any forecasts, forward-looking statements or projections contained in this Presentation. Such forecasts, forward-looking statements or projections are not guarantees of future performance. Any such forecasts, forward-looking statements or projections contained in this Presentation have been based on Tabcorp's intent, belief or current expectations with respect to its business and operations, market conditions, results of operations and financial condition, risk management practices and other future events as at the date of this Presentation and are subject to significant uncertainties, risks and contingencies, many of which are beyond the control of the Tabcorp Group, that could cause actual results to differ materially from the intentions, beliefs and expectations expressed or implied. You are cautioned not to place undue reliance on forecasts, forward-looking statements or projections. Except as required by law or regulation (including the ASX Listing Rules), Tabcorp undertakes no obligation to publicly update these forward-looking statements. In particular, forward-looking statements are underpinned by certain market, operational, financial, regulatory and other assumptions. An investment in Tabcorp is also subject to investment risks including possible loss of income and principal invested. Certain key risks that may affect the Tabcorp Group, its financial and operating performance and the accuracy of any forward-looking statements included in this Presentation include (without limitation): (i) changes in the regulatory environment (including taxes and levies), (ii) changes to race field fees, (iii) the suspension, cancellation or termination of the Tabcorp Group's wagering, gaming and other licences, (iv) relevant racing industries failing to provide programs of events, (v) the minimum financial performance arrangements applying in favour of the Victorian racing industry under the Victorian joint venture, and (vi) Tabcorp being able to renegotiate its key broadcast arrangements on satisfactory terms. For further information, see section 5.3 (Risk factors associated with the Tabcorp Group) of the prospectus, dated 22 February 2012, relating to the issue of Tabcorp Subordinated Notes. Past performance information given in this Presentation is given for illustrative purposes only and should not be relied upon as (and is not) an indication of future performance.
For
per
sona
l use
onl
y

66 Tabcorp Investor Day 17 October 2013
For
per
sona
l use
onl
y