Embed Size (px)
Citation preview
T. cruzi Incidence Study in Blood Donors and its Implications for Selective Testing: Study Results
Susan L. Stramer, PhDAmerican Red Cross
BPAC Aug 2, 2011
1

Acknowledgements
• ARC – Rebecca Townsend– Ed Notari– Roger Dodd– Jaye Brodsky
• Community Blood Centers of FL– Bruce Lenes– Sharon Edie– Angelica Lynn
• BSI – Brian Custer– Hany Kamel– Mike Busch
2
Major Points
• No observed incidence• Observe low level reactivity
– False positivity– Remote prior infections
• < 1% observed rate of transfusion transmissions
• Retesting policy adds no value– Complex and resource intensive

Background• The Ortho T. cruzi EIA (Ab) is used for donor screening
– ARC and BSI implemented “universal testing” Jan 29, 2007• Repeat reactive (RR) donations are further tested using a
laboratory-derived test (LDT) RIPA (Quest Diagnostics) • RIPA-pos donors are considered confirmed
– whether at index, repeat of independent index sample or at donor follow-up
• Donors of RR donations are followed and tested by EIA/RIPA– RIPA pos donors also tested by parasitologic tests
• Hemoculture (HC) and PCR – RR donors are also asked to respond to a detailed
survey regarding demographics and risk factors• True pos “cases” and false pos “controls”
4

Retest Algorithm for T. cruzi Ab RR (Ortho EIA) Donors Independent Index or Donor follow-up (F/U) samples
Sample Type Licensed Ortho EIAInterpretation
RIPA Performed (Yes/No)
If RIPA Negative or Indeterminate:
Independent Index or Follow-up Repeat Reactive Yes
Independent Index or Follow-up Nonreactive No
If RIPA Positive:
Independent Index or Follow-up
Repeat Reactive Yes
Independent Index or Follow-up
Nonreactive Yes
5
PRISM added to algorithm following licensure (April 2010)
Background• Due to low rate of transfusion transmission identified by
lookback, and donor risk being remote (22-mo experience), selective T. cruzi Ab testing implemented by all ARC and BSI regions except those included in the “Incidence Study”– 8/10/09 ARC– 4/1/10 BSI– 1X nonreactive test result qualifies the donor for all future donations
• Regions having the highest prevalence in the Southwestern and South Central portion of the US (5-fold above “system”) remained on universal testing to represent “endemic travel” and “autochthonous” risk
• Assumption was that the highest prevalence sites would provide the greatest chance of observing donor incidence (if it were to occur)
• 3 ARC = S CA (Los Angeles; 006), OK/TX (049) and AR (055)
• Community Blood Centers of FL (S FL) • Central Coast UBS (CA)
6
Incidence Study Protocol
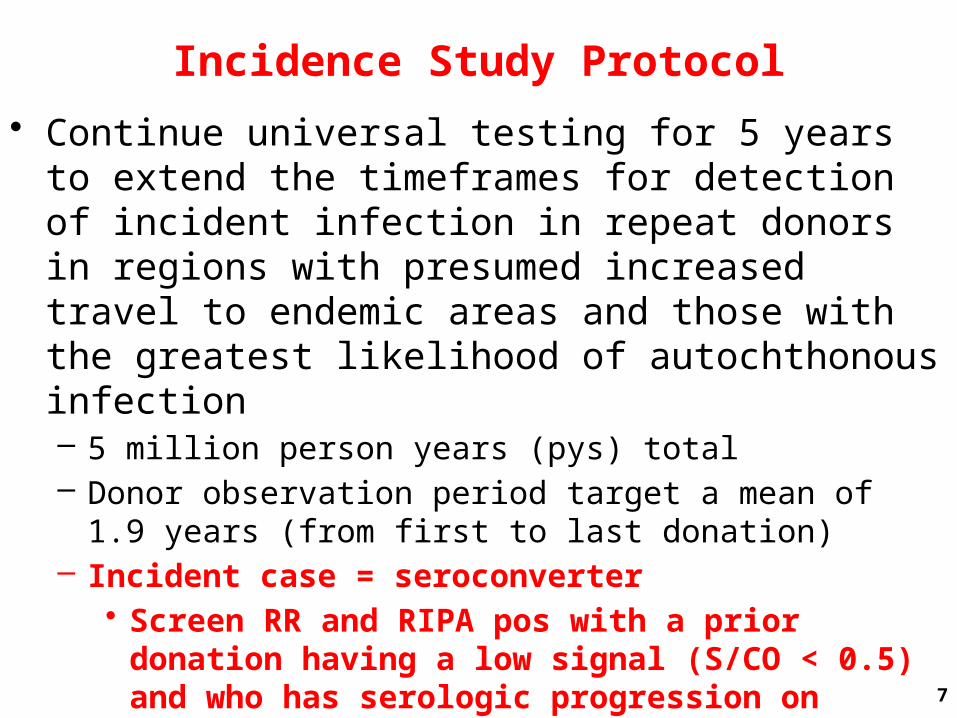
• Continue universal testing for 5 years to extend the timeframes for detection of incident infection in repeat donors in regions with presumed increased travel to endemic areas and those with the greatest likelihood of autochthonous infection– 5 million person years (pys) total– Donor observation period target a mean of 1.9 years (from
first to last donation)– Incident case = seroconverter
• Screen RR and RIPA pos with a prior donation having a low signal (S/CO < 0.5) and who has serologic progression on follow-up on EIA (S/CO > 2.0) while remaining RIPA pos; donor may be HC/PCR pos
7
Incidence Study Outcome
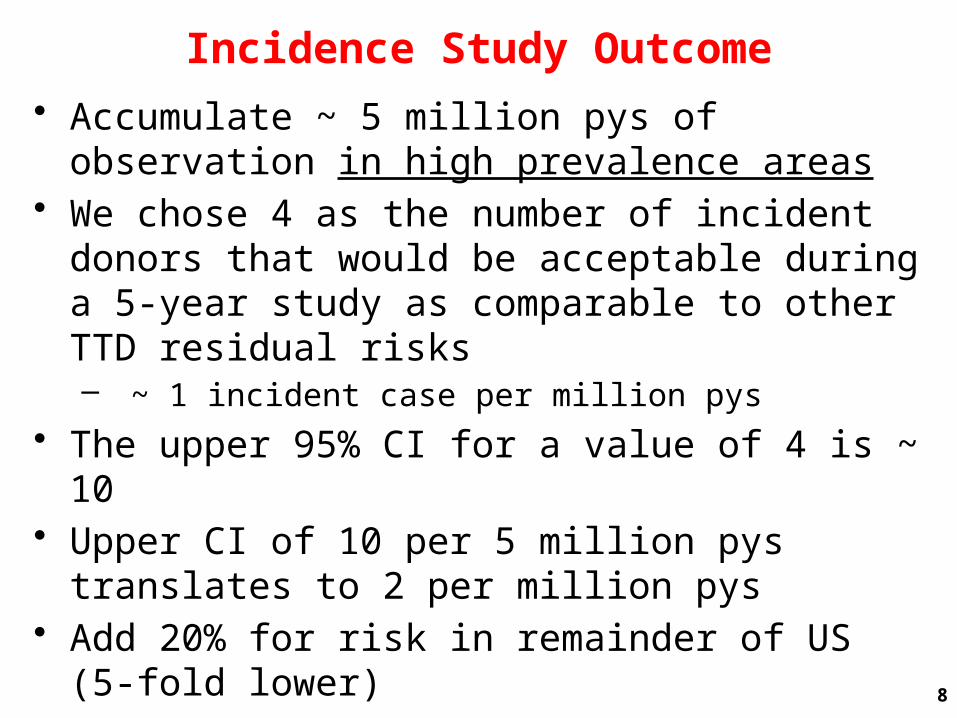
• Accumulate ~ 5 million pys of observation in high prevalence areas
• We chose 4 as the number of incident donors that would be acceptable during a 5-year study as comparable to other TTD residual risks– ~ 1 incident case per million pys
• The upper 95% CI for a value of 4 is ~ 10• Upper CI of 10 per 5 million pys translates to 2 per
million pys• Add 20% for risk in remainder of US (5-fold lower)• Criterion established for study: upper limit of
acceptable risk = 2.4 cases per million pys8
Incidence Study Completion• Study completed after 48 months
– 1/29/07-1/31/11• 54 months in one region, Los Angeles
– included in the IND prior to test kit licensure• No incident/seroconverting donors were identified
9

Red Cross Biomedical Services
10
35 Regions collecting in 43 states and Puerto Rico 7 Divisions 5 National Testing Laboratories

Blood Systems Collections Areas
3 CTS laboratories13 main regional areas collecting in UBS/BCP centers located in 18 states
11

Cumulative Universal Testing T. cruzi Reactive Donors by State of Residence (01/29/07 – 01/31/11)
4
514
233
56
22
116
2
17
17
69
1
3
2
8
488
2
PR
5
5
3
48
22
15
4
5
5
1
11
5
5
7
4
21
5
15
8
7
1
Total Cases
RIPA Pos RIPA Reported
Total 3975 1179 (30%) 3947
ARC + CBCF 2540 599 2540
BSI 1435* 580* 1407*
28.8 million donations screened0.014% RR rateRR from 48 states (-DE, HI)RIPA pos (30%) from 40 states (+PR, DC)
66% from FL and CA (1:5100-1:6800)Overall: 1:24,200
1
DC
1
1
1179
48 months
12
Region
# RIPA Pos Donors
48, 54*mos
# Donations Tested
IVD + IND*RIPA Pos
Prevalence
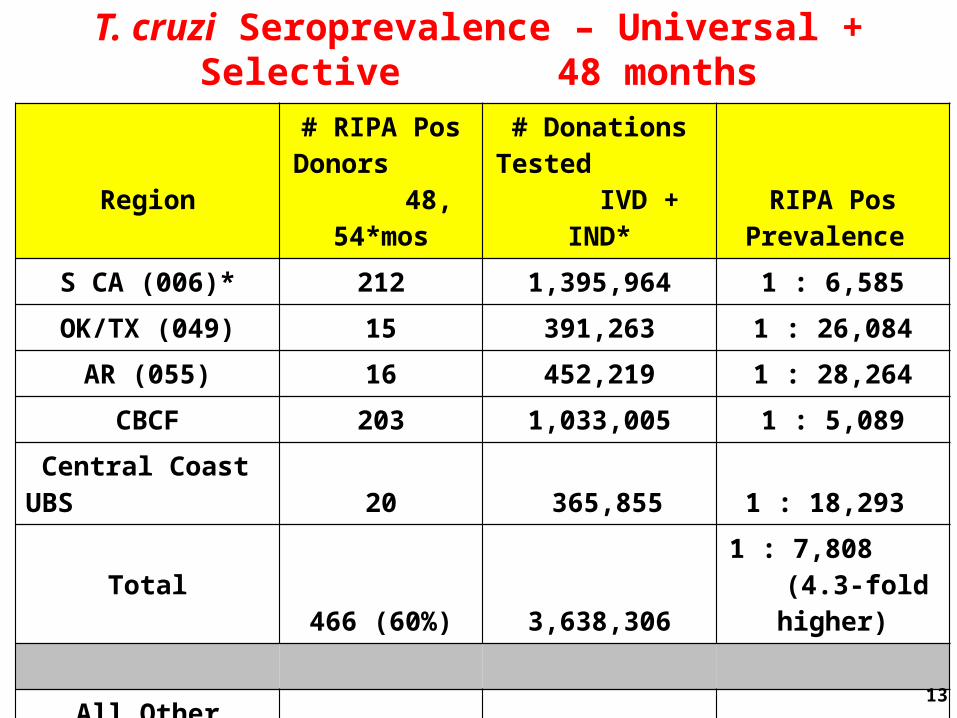
S CA (006)* 212 1,395,964 1 : 6,585
OK/TX (049) 15 391,263 1 : 26,084
AR (055) 16 452,219 1 : 28,264
CBCF 203 1,033,005 1 : 5,089
Central Coast UBS 20 365,855 1 : 18,293
Total466 (60%) 3,638,306
1 : 7,808 (4.3-fold higher)
All Other ARC+BSI 312 22,379,332 1 : 71,729
All Total 778 26,017,628 1 : 33,442
T. cruzi Seroprevalence – Universal + Selective 48 months
13
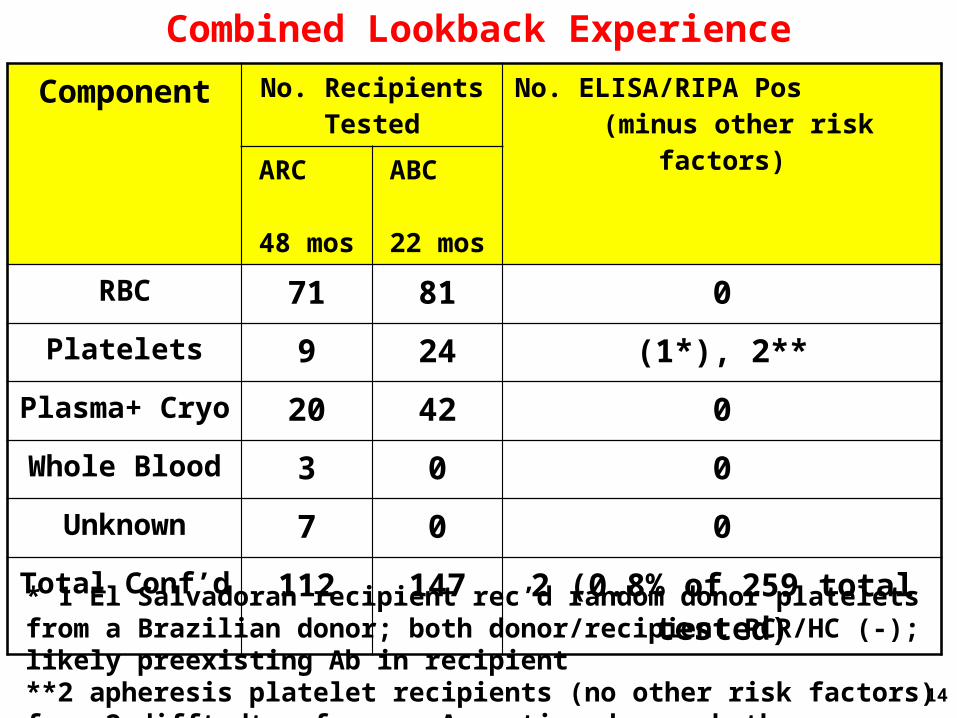
Combined Lookback Experience
Component No. Recipients Tested
No. ELISA/RIPA Pos (minus other risk factors)
ARC 48 mos
ABC 22 mos
RBC 71 81 0
Platelets 9 24 (1*), 2**
Plasma+ Cryo 20 42 0
Whole Blood 3 0 0
Unknown 7 0 0
Total Conf’d 112 147 2 (0.8% of 259 total tested)
* 1 El Salvadoran recipient rec’d random donor platelets from a Brazilian donor; both donor/recipient PCR/HC (-); likely preexisting Ab in recipient**2 apheresis platelet recipients (no other risk factors) from 2 difft dtns from an Argentine donor; both donor/recipient PCR/HC (+) 14
Combined Lookback Experience
• Risk of transfusion transmission in the US as determined by tracing prior donations from RIPA-positive donors since the initiation of widespread T. cruzi Ab testing using FDA licensed screening assays and contemporary methods of component manufacture/transfusion practice is < 1%
15
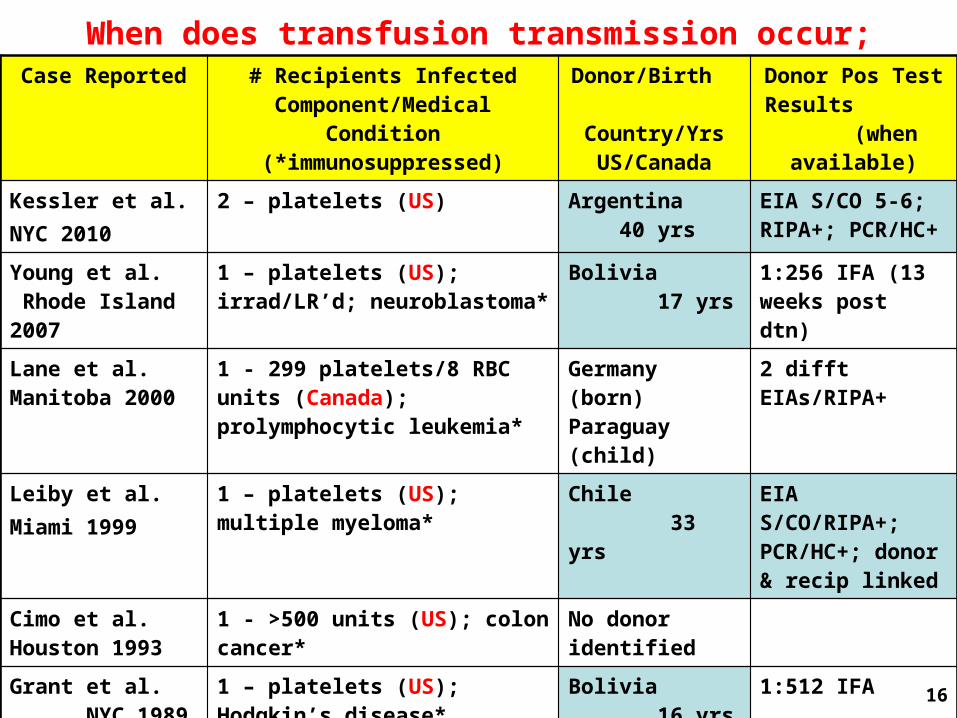
When does transfusion transmission occur; US/CanadaCase Reported # Recipients Infected
Component/Medical Condition (*immunosuppressed)
Donor/Birth Country/Yrs US/Canada
Donor Pos Test Results
(when available)
Kessler et al.NYC 2010
2 – platelets (US) Argentina 40 yrs
EIA S/CO 5-6; RIPA+; PCR/HC+
Young et al. Rhode Island 2007
1 – platelets (US); irrad/LR’d; neuroblastoma*
Bolivia 17 yrs
1:256 IFA (13 weeks post dtn)
Lane et al. Manitoba 2000
1 - 299 platelets/8 RBC units (Canada); prolymphocytic leukemia*
Germany (born) Paraguay (child)
2 difft EIAs/RIPA+
Leiby et al.Miami 1999
1 – platelets (US); multiple myeloma*
Chile 33 yrs
EIA S/CO/RIPA+; PCR/HC+; donor & recip linked
Cimo et al. Houston 1993
1 - >500 units (US); colon cancer*
No donor identified
Grant et al. NYC 1989
1 – platelets (US); Hodgkin’s disease*
Bolivia 16 yrs
1:512 IFA
Nickerson et al Manitoba 1989
1 – platelets (Canada); acute lymphocytic leukemia*
Paraguay 20 yrs
> 1:2000 ELISA
Geiseler et al Southern CA 1987
1 – blood products (US/endemic travel); acute leukemia*
Likely father (Mexico)
1:128 IFA
16
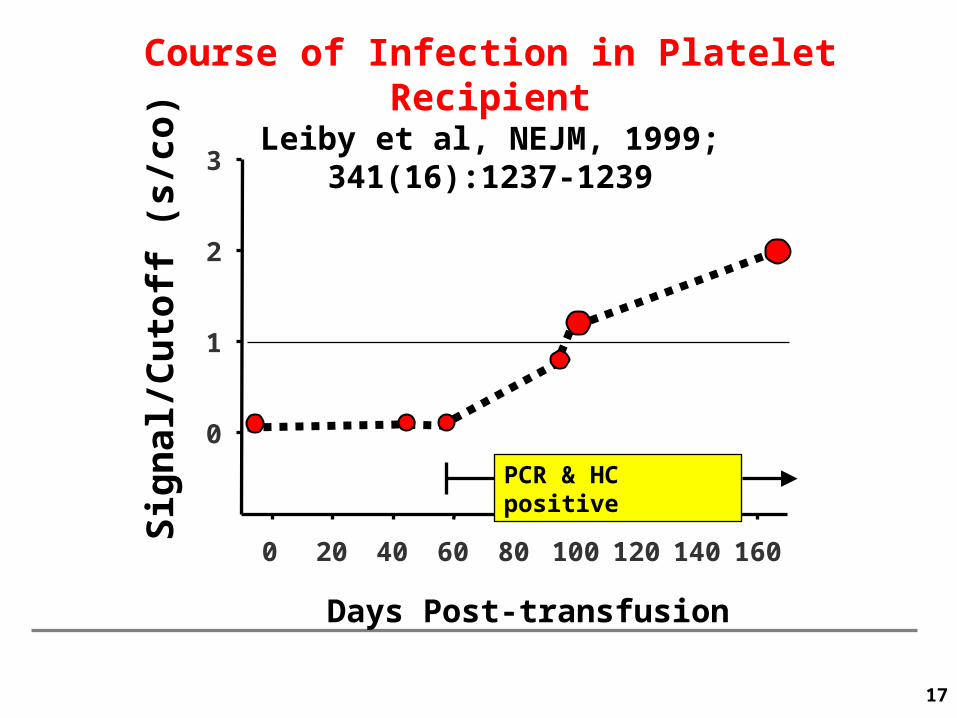
Course of Infection in Platelet RecipientLeiby et al, NEJM, 1999; 341(16):1237-1239
Days Post-transfusion
Sig
nal
/Cu
toff
(s/
co)
0 20 40 60 80 100 120 140 160
PCR & HC positive
0
1
2
3
17
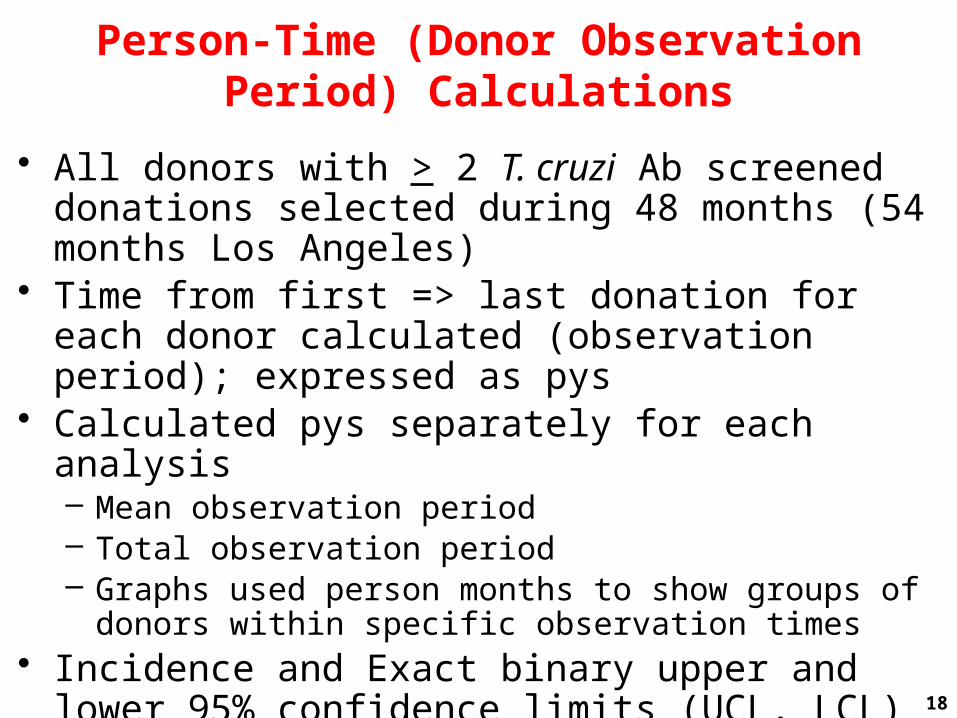
Person-Time (Donor Observation Period) Calculations
• All donors with > 2 T. cruzi Ab screened donations selected during 48 months (54 months Los Angeles)
• Time from first => last donation for each donor calculated (observation period); expressed as pys
• Calculated pys separately for each analysis– Mean observation period – Total observation period– Graphs used person months to show groups of donors
within specific observation times• Incidence and Exact binary upper and lower 95%
confidence limits (UCL, LCL) calculated
18
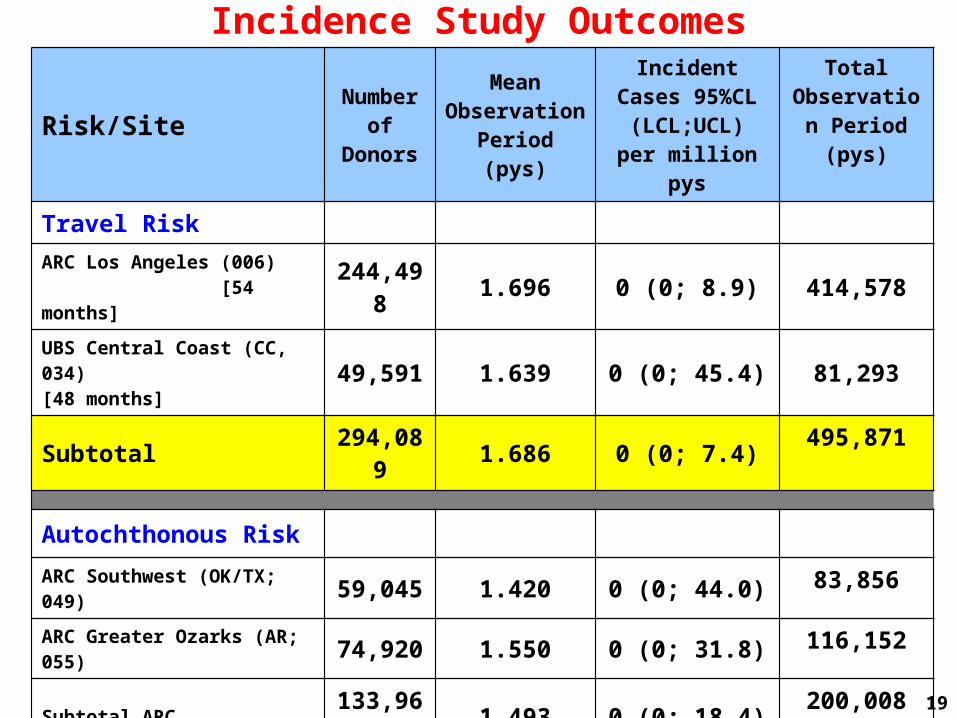
Risk/SiteNumber
of Donors
Mean Observation Period (pys)
Incident Cases 95%CL
(LCL;UCL)per million pys
Total Observation Period (pys)
Travel Risk
ARC Los Angeles (006) [54 months] 244,498 1.696 0 (0; 8.9) 414,578
UBS Central Coast (CC, 034)[48 months] 49,591 1.639 0 (0; 45.4) 81,293
Subtotal 294,089 1.686 0 (0; 7.4) 495,871
Autochthonous Risk
ARC Southwest (OK/TX; 049) 59,045 1.420 0 (0; 44.0) 83,856
ARC Greater Ozarks (AR; 055) 74,920 1.550 0 (0; 31.8) 116,152
Subtotal ARC 133,965 1.493 0 (0; 18.4) 200,008BSI Regions (11,16,20,26 & 31; TX, AR, MS, LA)Subtotal BSI
175,611 1.468 0 (0; 14.3) 257,773
Subtotal ARC + BSI[48 months]
309,576 1.479 0 (0; 8.1) 457,781
Incidence Study Outcomes
19

Risk/Site Number of Donors
Mean Observation Period (pys)
Incident Cases 95%CL
(LCL;UCL)per million pys
Total Observation Period (pys)
Overall Risk
ARC, all donations (universal + selective) [48-54 months]
3,523,894 1.402 0 (0; 0.75) 4,941,088
BSI, all donations (universal + selective) [48 months]
698,391 1.601 0 (0; 3.3) 1,118,274
Total 4,222,285 1.435 0 (0; 0.61) 6,059,362
Extended Observation Periods
ARC all apheresis donations [48-54 months]
492,020 1.643 0 (0; 4.6) 808,313
BSI all apheresis donations [48 months]
275,963 1.790 0 (0; 7.5) 494,095
Total Apheresis 767,983 1.696 0 (0; 2.8) 1,302,408
20

Distribution of Donor Observation Time for The Chagas Incidence Study54/48 Month Study Period, 08/01/2006 to 01/31/2011
Travel Risk, Region 006 [ARC, 54 Months] & Region 034 [BSI, 48 Months]Allogeneic Donors, 14 Person-Days or Greater
0
2,500
5,000
7,500
10,000
12,500
15,000
17,500
0 4 8 12 16 20 24 28 32 36 40 44 48 52
Cumulative Time of Observation (Months)
Nu
mb
er
of
Do
no
rs
Total Number of Donors294,089
Mean Person Years (95% CI)1.686 (1.690, 1.682)
Incidence per 100,000 PY (95% CI)0 (0.7439, 0)
Graph_Chagas_Travel_Both
21
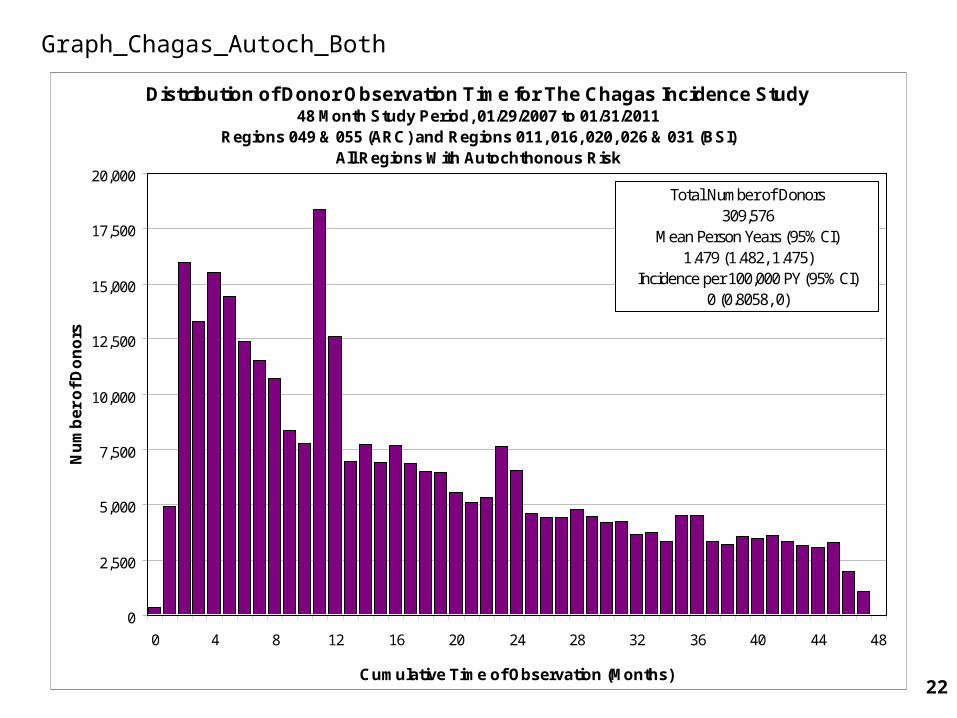
Distribution of Donor Observation Time for The Chagas Incidence Study48 Month Study Period, 01/29/2007 to 01/31/2011
Regions 049 & 055 (ARC) and Regions 011, 016, 020, 026 & 031 (BSI)All Regions With Autochthonous Risk
0
2,500
5,000
7,500
10,000
12,500
15,000
17,500
20,000
0 4 8 12 16 20 24 28 32 36 40 44 48
Cumulative Time of Observation (Months)
Nu
mb
er
of
Do
no
rs
Total Number of Donors309,576
Mean Person Years (95% CI)1.479 (1.482, 1.475)
Incidence per 100,000 PY (95% CI)0 (0.8058, 0)
Graph_Chagas_Autoch_Both
22
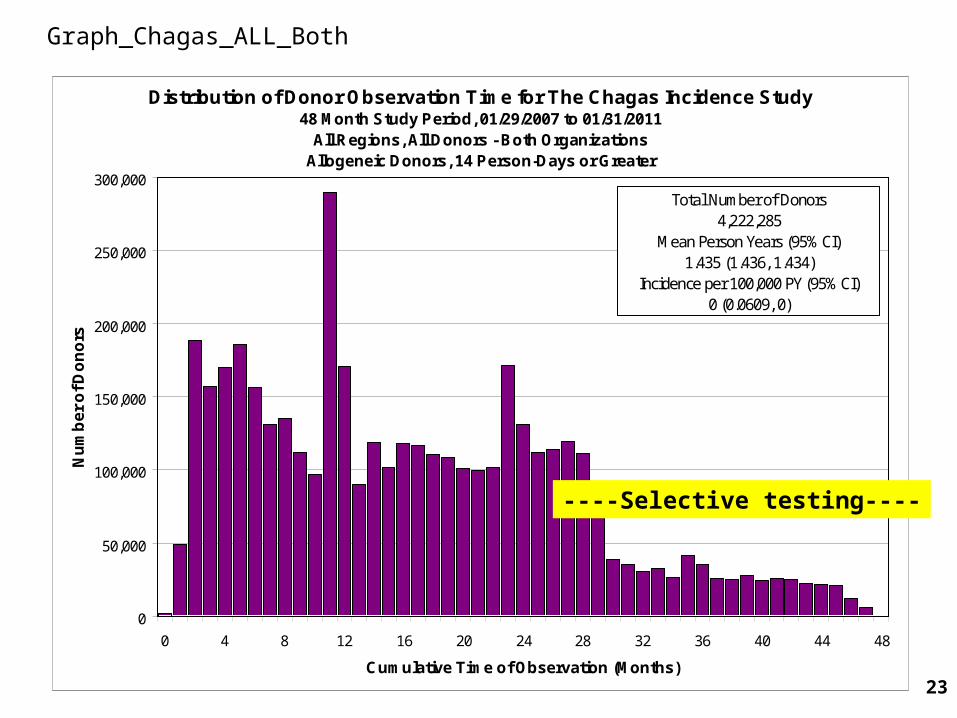
Distribution of Donor Observation Time for The Chagas Incidence Study48 Month Study Period, 01/29/2007 to 01/31/2011
All Regions, All Donors - Both OrganizationsAllogeneic Donors, 14 Person-Days or Greater
0
50,000
100,000
150,000
200,000
250,000
300,000
0 4 8 12 16 20 24 28 32 36 40 44 48
Cumulative Time of Observation (Months)
Nu
mb
er
of
Do
no
rs
Total Number of Donors4,222,285
Mean Person Years (95% CI)1.435 (1.436, 1.434)
Incidence per 100,000 PY (95% CI)0 (0.0609, 0)
Graph_Chagas_ALL_Both
----Selective testing----
23
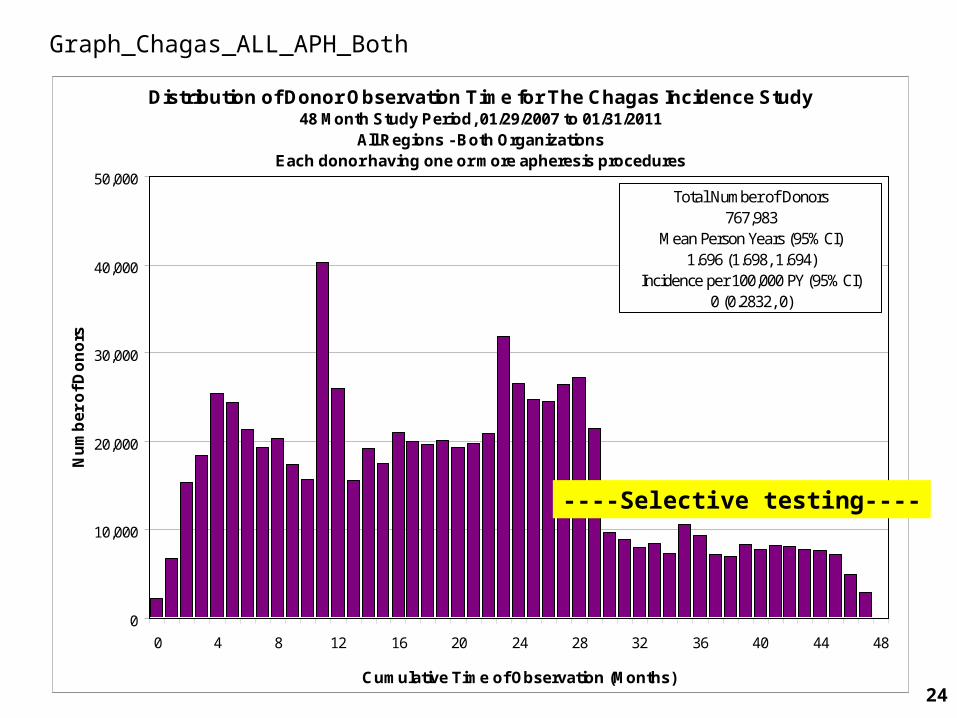
Distribution of Donor Observation Time for The Chagas Incidence Study48 Month Study Period, 01/29/2007 to 01/31/2011
All Regions - Both OrganizationsEach donor having one or more apheresis procedures
0
10,000
20,000
30,000
40,000
50,000
0 4 8 12 16 20 24 28 32 36 40 44 48
Cumulative Time of Observation (Months)
Nu
mb
er
of
Do
no
rs
Total Number of Donors767,983
Mean Person Years (95% CI)1.696 (1.698, 1.694)
Incidence per 100,000 PY (95% CI)0 (0.2832, 0)
Graph_Chagas_ALL_APH_Both
----Selective testing----
24
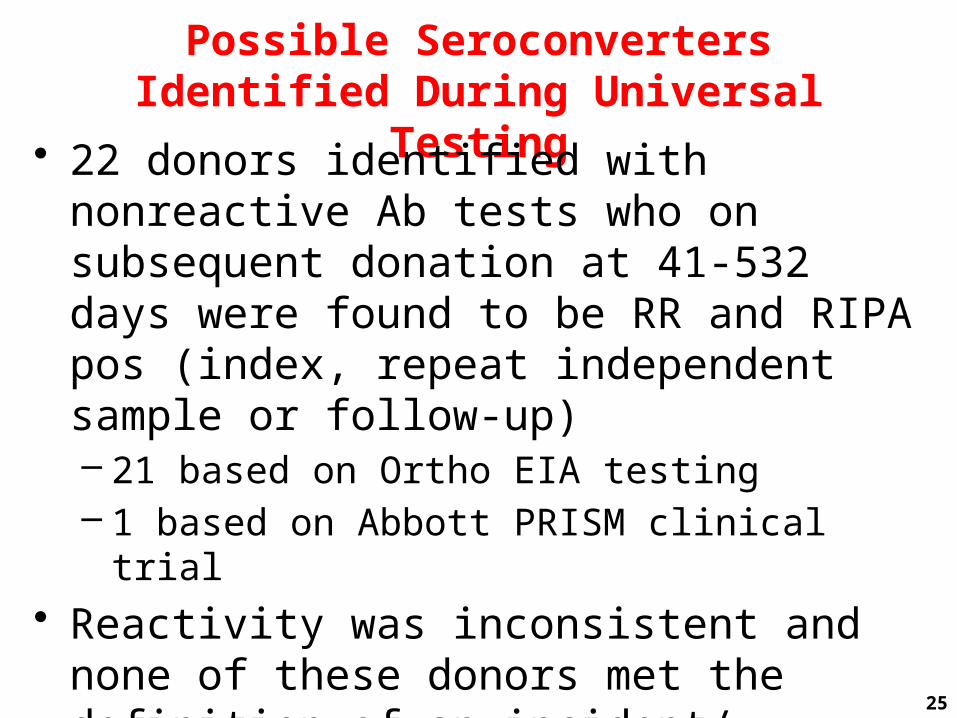
Possible Seroconverters Identified During Universal Testing
• 22 donors identified with nonreactive Ab tests who on subsequent donation at 41-532 days were found to be RR and RIPA pos (index, repeat independent sample or follow-up)– 21 based on Ortho EIA testing– 1 based on Abbott PRISM clinical trial
• Reactivity was inconsistent and none of these donors met the definition of an incident/ seroconverting donor
25
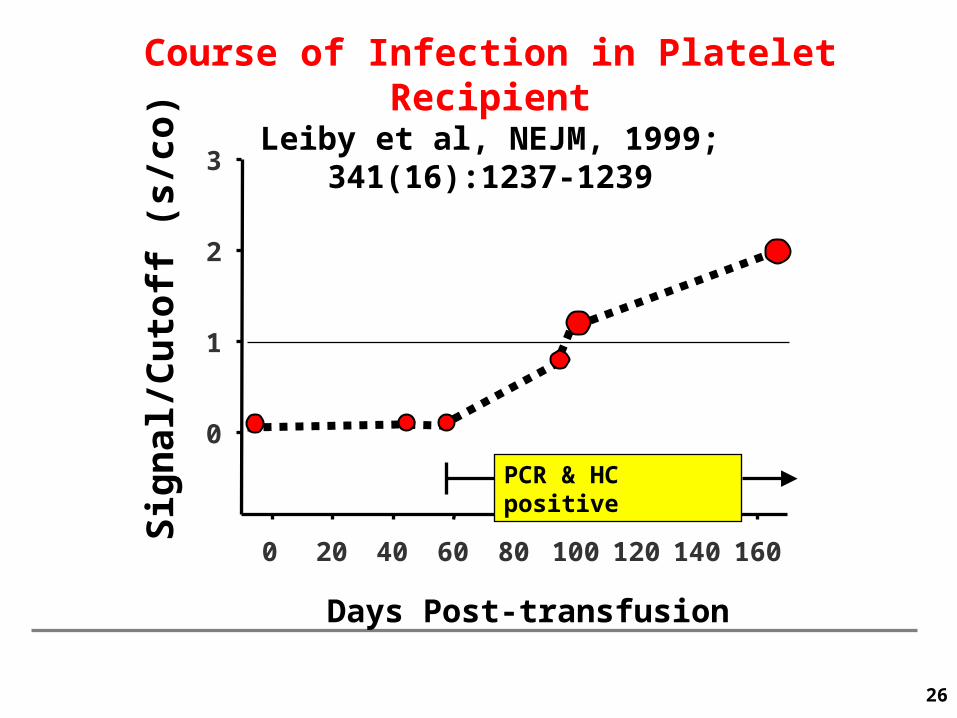
Course of Infection in Platelet RecipientLeiby et al, NEJM, 1999; 341(16):1237-1239
Days Post-transfusion
Sig
nal
/Cu
toff
(s/
co)
0 20 40 60 80 100 120 140 160
PCR & HC positive
0
1
2
3
26
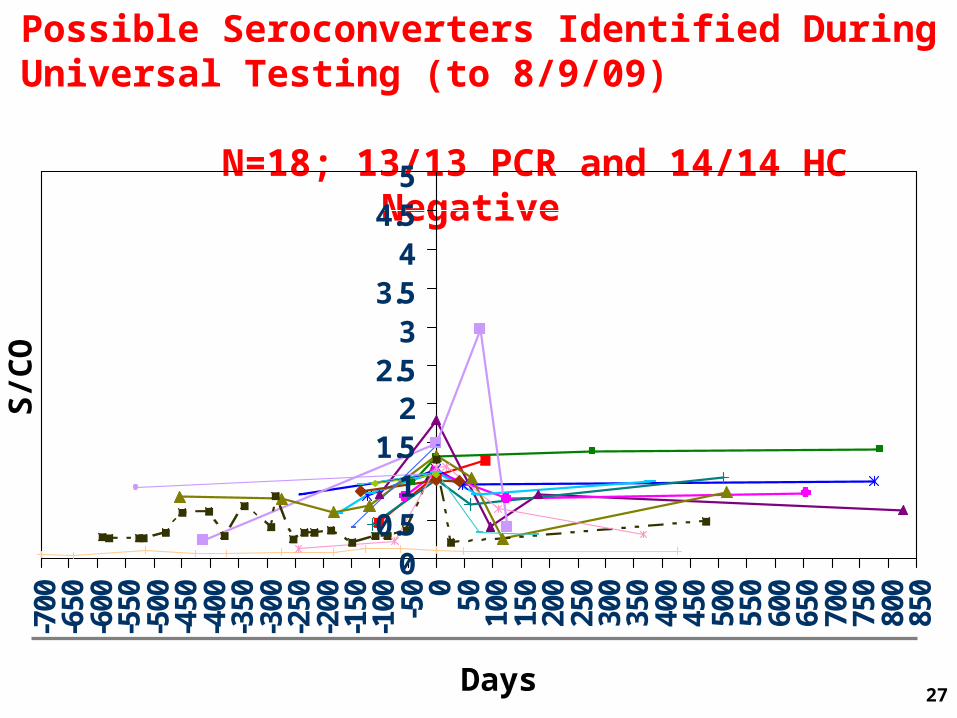
Possible Seroconverters Identified During Universal Testing (to 8/9/09)
N=18; 13/13 PCR and 14/14 HC Negative
00.5
11.5
22.5
33.5
44.5
5
-700
-650
-600
-550
-500
-450
-400
-350
-300
-250
-200
-150
-100 -5
0 0 50 100
150
200
250
300
350
400
450
500
550
600
650
700
750
800
850
Days
S/C
O
27
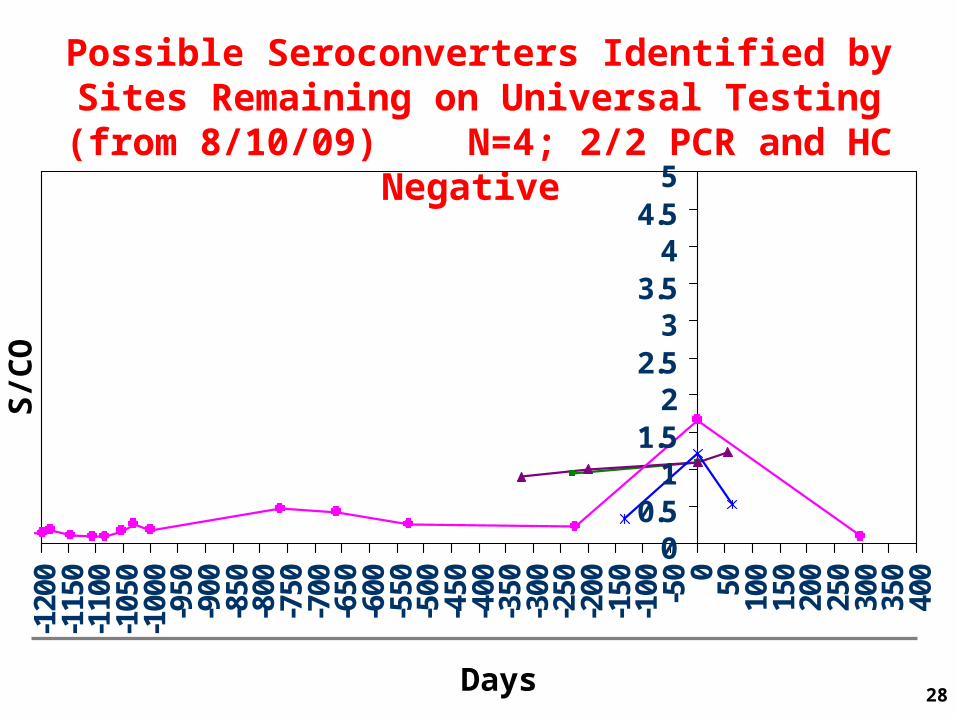
Possible Seroconverters Identified by Sites Remaining on Universal Testing (from 8/10/09)
N=4; 2/2 PCR and HC Negative
00.5
11.5
22.5
33.5
44.5
5
-120
0-1
150
-110
0-1
050
-100
0-9
50-9
00-8
50-8
00-7
50-7
00-6
50-6
00-5
50-5
00-4
50-4
00-3
50-3
00-2
50-2
00-1
50-1
00 -50 0 50 100
150
200
250
300
350
400
Days
S/C
O
28
WBN
Prior DonationIndex
Collect Date
Testing Interval (days)
State
Ab ELISA S/CO
RIPAPRISM S/COIndex
PCR HCCollect Date S/CO (Index, 2nd Index, F/U)
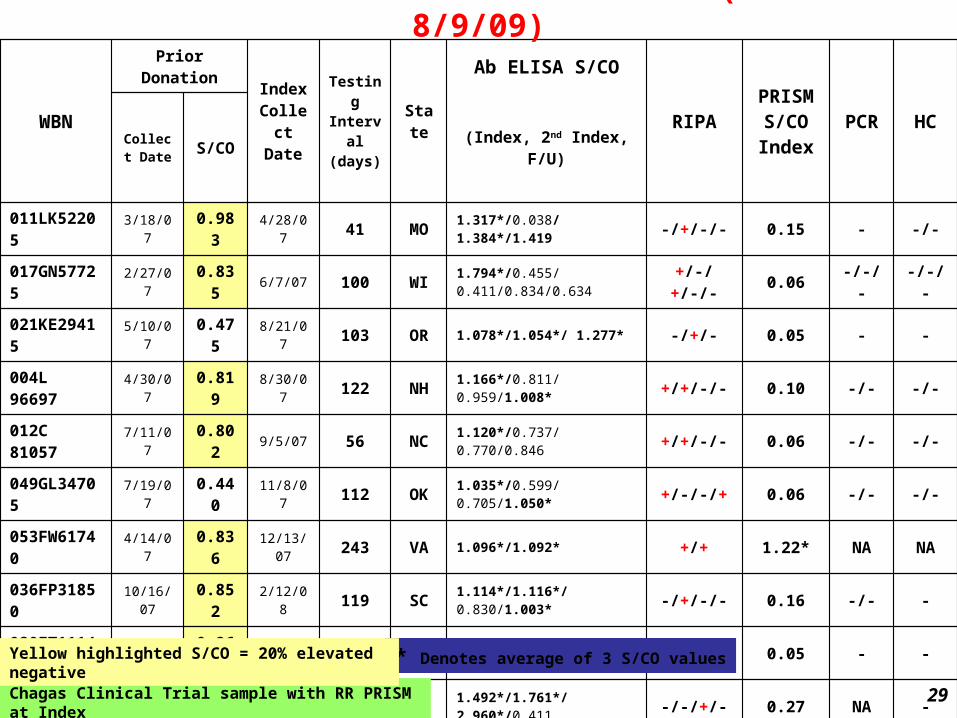
011LK52205 3/18/07 0.983 4/28/07 41 MO 1.317*/0.038/ 1.384*/1.419 -/+/-/- 0.15 - -/-
017GN57725 2/27/07 0.835 6/7/07 100 WI 1.794*/0.455/ 0.411/0.834/0.634 +/-/+/-/- 0.06 -/-/- -/-/-
021KE29415 5/10/07 0.475 8/21/07 103 OR 1.078*/1.054*/ 1.277* -/+/- 0.05 - -
004L 96697 4/30/07 0.819 8/30/07 122 NH 1.166*/0.811/ 0.959/1.008* +/+/-/- 0.10 -/- -/-
012C 81057 7/11/07 0.802 9/5/07 56 NC 1.120*/0.737/ 0.770/0.846 +/+/-/- 0.06 -/- -/-
049GL34705 7/19/07 0.440 11/8/07 112 OK 1.035*/0.599/ 0.705/1.050* +/-/-/+ 0.06 -/- -/-
053FW61740 4/14/07 0.836 12/13/07 243 VA 1.096*/1.092* +/+ 1.22* NA NA
036FP31850 10/16/07 0.852 2/12/08 119 SC 1.114*/1.116*/ 0.830/1.003* -/+/-/- 0.16 -/- -
020FT11144 11/19/07 0.869 4/2/08 135 UT 1.021*/0.931/ 1.010* +/-/- 0.05 - -
011GZ71884 4/4/07 0.239 5/21/08 413 MO 1.492*/1.761*/ 2.960*/0.411 -/-/+/- 0.27 NA -
020FW16929 1/31/08 0.689 5/29/08 119 UT 1.333*/0.749/ 1.041/0.251/0.857 -/- /+/-/- 0.13 -/- -/-
007FM15946 4/30/08 0.371 6/23/08 54 AZ 1.291*/0.523/ 0.222/0.485 +/+/-/- 0.07 - -/-
024GY39349 5/6/08 0.230 7/19/08 74 IN 1.178*/0.839/ 1. 187/0.641/0.309 -/- /+/-/- 0.48 -/- -/-
006FP69971 2/20/07 0.915 8/5/08 532 CA 1.110*/1.100* +/- 0.72 NA NA
006GS26670 6/4/08 0.124 8/6/08 63 CA 0.116/0.095/ 0.094/0.106 +/-/-/- 1.51*/0.81 -/- -/-
022GJ11661 3/12/08 0.399 8/8/08 149 PA 1.110*/0.113 +/- 0.06 NA NA
W0368 12/16/08 0.961 4/29/09 134 FL 1.123*/0.280/ 0.346 /0.316 +/-/Ind/- 0.14 -/- -/-
038GE30113 2/10/09 0.976 5/29/09 108 IN 1.083*/0.923 +/+ 0.45 NA NA
Possible Seroconverter Cases N=18 (1/29/07-8/9/09)
* Denotes average of 3 S/CO values
Chagas Clinical Trial sample with RR PRISM at Index
Yellow highlighted S/CO = 20% elevated negative
29

Possible Seroconverter Cases N=4 (8/10/09-1/31/11)3 regions and CBCF that continued
with Universal Testing
WBN
Prior DonationIndex
Collect Date
Testing Interval (days)
State
Ab ELISA S/CO
RIPAPRISM S/COIndex
PCR HCCollect Date S/CO (Index, 2nd Index, F/U)
006GG00723 01/04/09 0.941 08/21/2009 229 CA 1.086*/1.024* -/+ 3.06* NA NA
006GX87964 05/22/09 0.994 12/09/2009 201 CA 1.083*/0.046/1.217* +/-/- 0.06 - -
006LH19583 01/26/10 0.332 06/08/2010 133 CA 1.203*/1.009*/0.522 +/+/+ 2.64* - -
006KP44769 09/02/10 0.217 09/16/2010 14 CA 1.663*/0.344/0.087 +/-/- 0.17 pend pend
* Denotes average of 3 S/CO valuesYellow highlighted S/CO = 20% elevated negative
Of 18+4: 3 “yes” responses on risk questions; all followed with no seroconversion006LH19583 born and lived in Mexico 39 yrs006GX87964 Hispanic, born in US W036809203439 born and lived in Venezuela for 10 yrs
30

T. cruzi antibody reactivityPheresis donor 006KP44769
0
0.5
1
1.5
2
2.5
3
S/C
O
Date
18 prior nonreactive donations
RR/RIPA pos donationand retesting of regional
retention sample
Follow-up collected 298 days post index
Assay cutoff
31

US-Derived T. cruzi Study (USTC) 54 eligible RR/RIPA Pos donors (48 ARC and 8 UBS); 37 enrolled
15 Defined as Concordant (CG)/22 Discordant (DG)
Vector and reservoirN=28 and N=17Vector only
PR
32

WBN
Prior Donation
RIPAPRISM S/COIndex
CDC TestingLeish IFA
Focus, USA
Collect Date
S/CO
IFAEpi lysateCDC In house
Chagatest EIArDNA
Weiner, Argentina
TESATrypo lysate
bioMx, France
011LK52205 3/18/07 0.983 -/+/-/- 0.15 Neg Neg Neg Neg
017GN57725 2/27/07 0.835 +/-/+/-/- 0.06 Neg Neg Neg Neg
004L 96697 4/30/07 0.819 +/+/-/- 0.10 Neg Neg Neg Neg
012C 81057 7/11/07 0.802 +/+/-/- 0.06 Neg Neg Neg Neg
049GL34705 7/19/07 0.440 +/-/-/+ 0.06 Neg Neg Neg Neg
020FW16929 1/31/08 0.689 -/- /+/-/- 0.13 Neg Neg Neg Neg
007FM15946 4/30/08 0.371 +/+/-/- 0.07 Neg Neg Neg Neg
024GY39349 5/6/08 0.230 -/- /+/-/- 0.48 Neg Neg Neg Neg
006GS26670 6/4/08 0.124 +/-/-/-1.51* /0.81
Neg Neg Neg Neg
Possible Seroconverter Cases N=18 (1/29/07-8/9/09) enrolled in USTC
Chagas Clinical Trial sample with RR PRISM at IndexYellow highlighted S/CO = 20% elevated negative 33
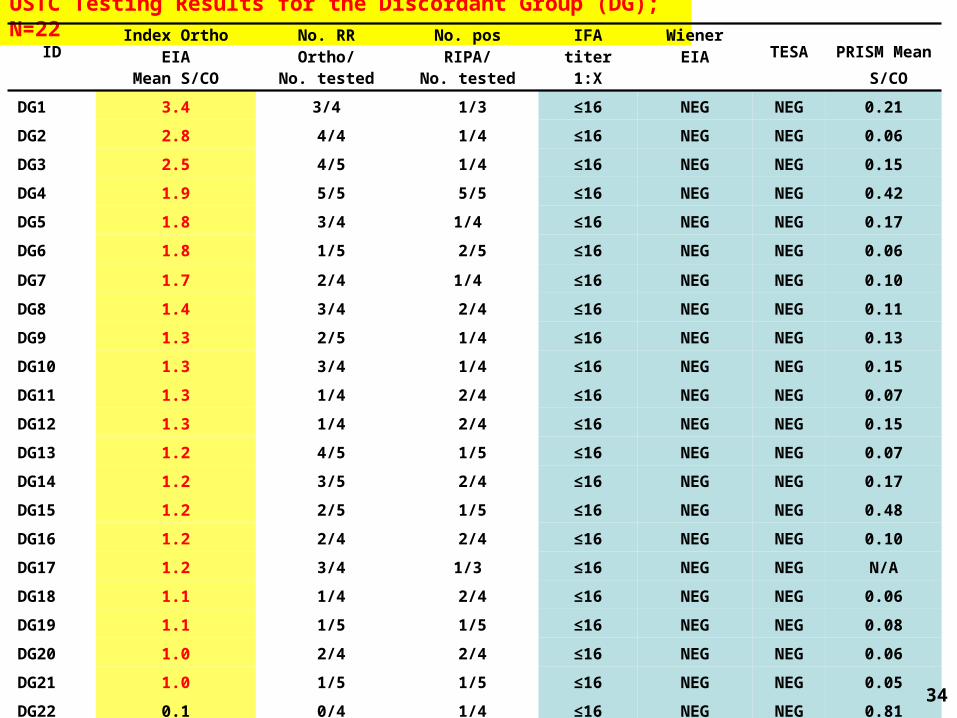
USTC Testing Results for the Discordant Group (DG); N=22ID Index Ortho EIA No. RR Ortho/ No. pos RIPA/ IFA titer Wiener EIA TESA PRISM Mean
Mean S/CO No. tested No. tested 1:X S/CO
DG1 3.4 3/4 1/3 ≤16 NEG NEG 0.21
DG2 2.8 4/4 1/4 ≤16 NEG NEG 0.06
DG3 2.5 4/5 1/4 ≤16 NEG NEG 0.15
DG4 1.9 5/5 5/5 ≤16 NEG NEG 0.42
DG5 1.8 3/4 1/4 ≤16 NEG NEG 0.17
DG6 1.8 1/5 2/5 ≤16 NEG NEG 0.06
DG7 1.7 2/4 1/4 ≤16 NEG NEG 0.10
DG8 1.4 3/4 2/4 ≤16 NEG NEG 0.11
DG9 1.3 2/5 1/4 ≤16 NEG NEG 0.13
DG10 1.3 3/4 1/4 ≤16 NEG NEG 0.15
DG11 1.3 1/4 2/4 ≤16 NEG NEG 0.07
DG12 1.3 1/4 2/4 ≤16 NEG NEG 0.15
DG13 1.2 4/5 1/5 ≤16 NEG NEG 0.07
DG14 1.2 3/5 2/4 ≤16 NEG NEG 0.17
DG15 1.2 2/5 1/5 ≤16 NEG NEG 0.48
DG16 1.2 2/4 2/4 ≤16 NEG NEG 0.10
DG17 1.2 3/4 1/3 ≤16 NEG NEG N/A
DG18 1.1 1/4 2/4 ≤16 NEG NEG 0.06
DG19 1.1 1/5 1/5 ≤16 NEG NEG 0.08
DG20 1.0 2/4 2/4 ≤16 NEG NEG 0.06
DG21 1.0 1/5 1/5 ≤16 NEG NEG 0.05
DG22 0.1 0/4 1/4 ≤16 NEG NEG 0.81 34
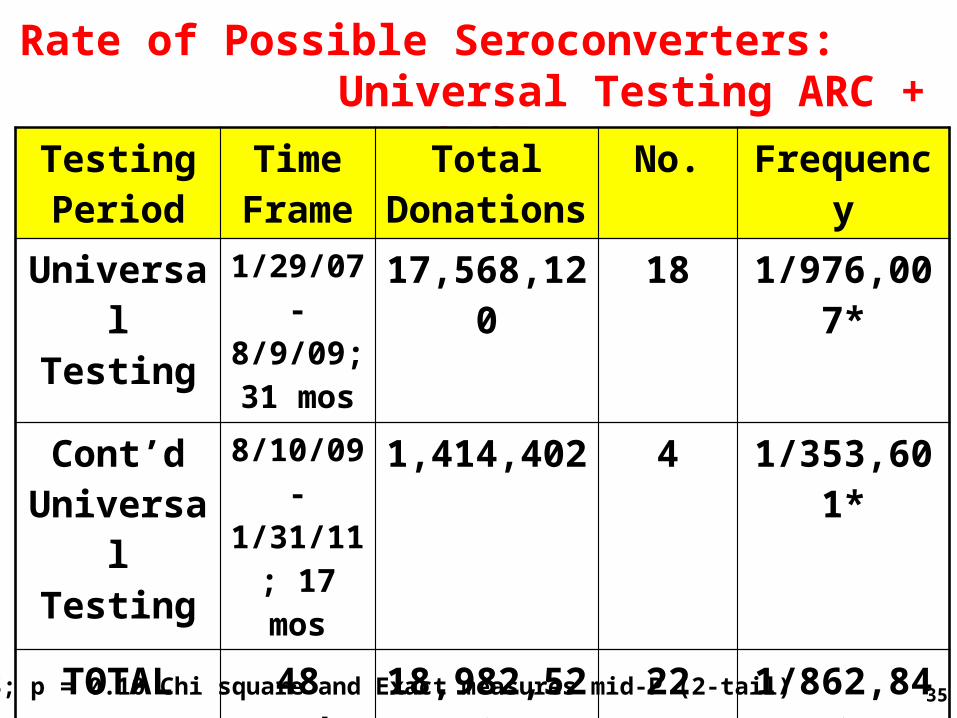
Rate of Possible Seroconverters: Universal Testing ARC + CBCF
Testing Period
Time Frame
Total Donations
No. Frequency
Universal Testing
1/29/07-8/9/09; 31 mos
17,568,120 18 1/976,007*
Cont’d Universal Testing
8/10/09-1/31/11; 17 mos
1,414,402 4 1/353,601*
TOTAL 48 months
18,982,522 22 1/862,842
* NS; p = 0.10 Chi square and Exact measures mid-P (2-tail) 35

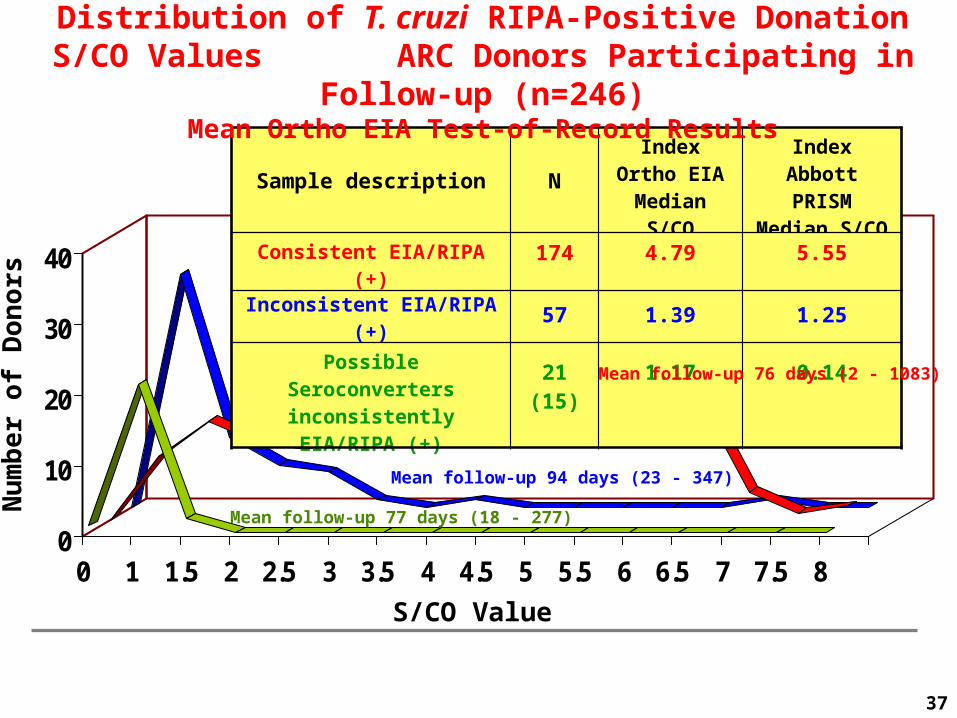
Assay VariabilityBiologic (test component or other agent, remote prior
infection)/Analytic (cutoff) • Donor follow-up of 3 donor populations derived from
246 RR/RIPA Pos ARC donors enrolled in follow-up during 48 months (651 total RIPA pos)– N=174 Consistent RR/RIPA Pos– N=57 Inconsistent RR/RIPA Pos
• Index Ortho EIA RR; RIPA pos index or follow up
– N=22 Possible Seroconverters with 16 donors followed (15 Ortho EIA/1 Abbott PRISM triggered)
• Demographic analysis of 3 populations• Analysis of Ortho EIA cutoff values for 3 populations• Relationship of Ab S/CO values with PCR positivity
– Higher S/CO values correlate with PCR positivity36
0
10
20
30
40
0 1 1.5 2 2.5 3 3.5 4 4.5 5 5.5 6 6.5 7 7.5 8
Nu
mb
er
of
Do
no
rs
S/CO Value
Sample description NIndex Ortho EIA Median
S/CO
Index Abbott PRISM Median
S/CO
Consistent EIA/RIPA (+) 174 4.79 5.55
Inconsistent EIA/RIPA (+) 57 1.39 1.25
Possible Seroconverters inconsistently EIA/RIPA (+)
21 (15) 1.17 0.14
Distribution of T. cruzi RIPA-Positive Donation S/CO Values ARC Donors Participating in Follow-up (n=246)
Mean Ortho EIA Test-of-Record Results
Mean follow-up 76 days (2 - 1083)
Mean follow-up 94 days (23 - 347)
Mean follow-up 77 days (18 - 277)
37
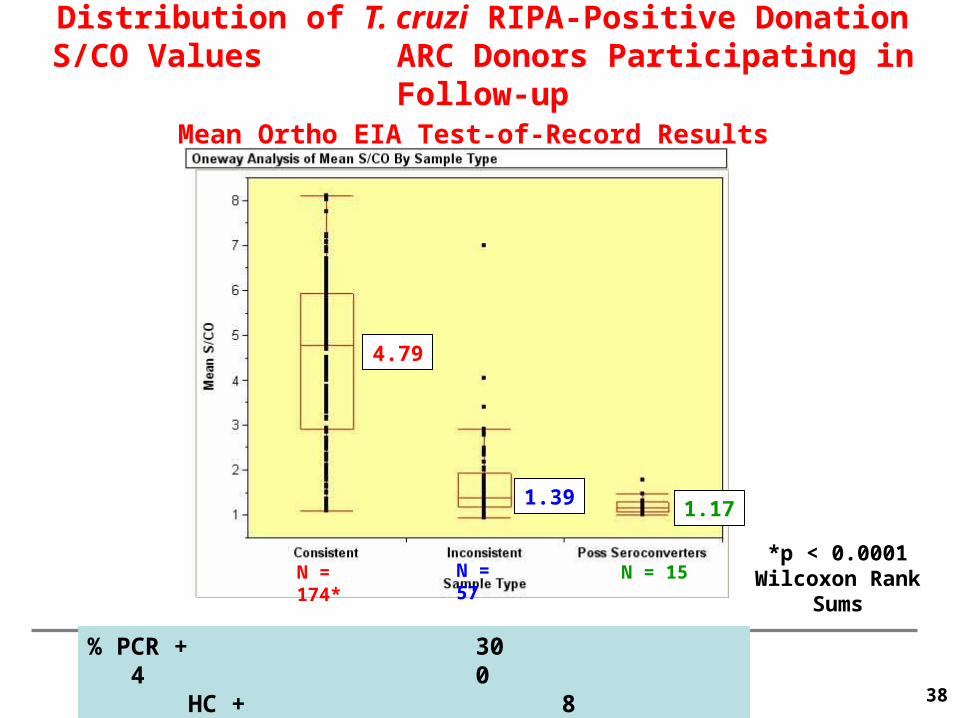
Distribution of T. cruzi RIPA-Positive Donation S/CO Values ARC Donors Participating in Follow-up
Mean Ortho EIA Test-of-Record Results
Jaye’s Box and Whisker graph4.79
1.39 1.17
N = 174* N = 57 N = 15*p < 0.0001 Wilcoxon
Rank Sums
38
% PCR + 30 4 0 HC + 8 0 0
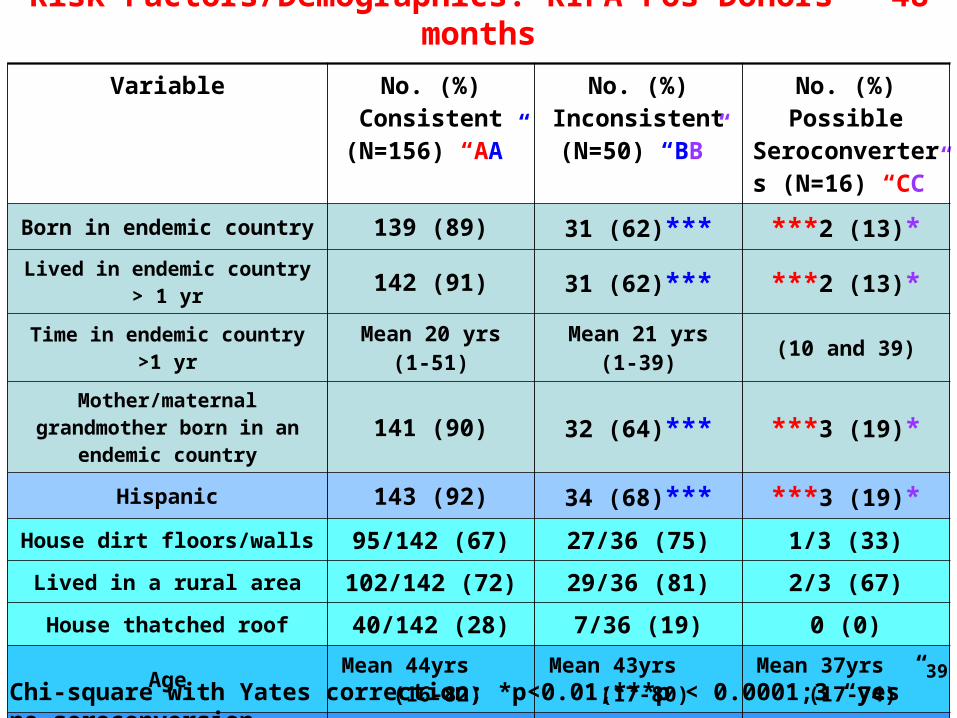
Variable No. (%) Consistent
(N=156) “AA”
No. (%) Inconsistent (N=50) “BB”
No. (%) Possible Seroconverters
(N=16) “CC”
Born in endemic country 139 (89) 31 (62)*** ***2 (13)*
Lived in endemic country > 1 yr 142 (91) 31 (62)*** ***2 (13)*
Time in endemic country >1 yr Mean 20 yrs (1-51) Mean 21 yrs (1-39) (10 and 39)
Mother/maternal grandmother born in an endemic country 141 (90) 32 (64)*** ***3 (19)*
Hispanic 143 (92) 34 (68)*** ***3 (19)*
House dirt floors/walls 95/142 (67) 27/36 (75) 1/3 (33)
Lived in a rural area 102/142 (72) 29/36 (81) 2/3 (67)
House thatched roof 40/142 (28) 7/36 (19) 0 (0)
Age Mean 44yrs (16-82)
Mean 43yrs (17-80)
Mean 37yrs (17-74)
Male 67 (43) 30 (60) 10 (63)
Female 89 (57) 20 (40) 6 (37)
Risk Factors/Demographics: RIPA-Pos Donors – 48 months
Chi-square with Yates correction; *p<0.01;***p < 0.0001;3 “yes” no seroconversion39
0
5000
10000
15000
20000
25000
30000
35000
40000
0.2
40
0.2
52
0.2
64
0.2
76
0.2
88
0.3
00
0.3
12
0.3
24
0.3
36
0.3
48
0.3
60
0.3
72
0.3
84
0.3
96
0.4
08
0.4
20
0.4
32
0.4
44
0.4
56
0.4
68
0.4
80
0.4
92
0.5
04
0.5
16
0.5
28
0.5
40
0.5
52
0.5
64
0.5
76
0.5
88
0.6
00
0.6
12
0.6
24
0.6
36
0.6
48
0.6
60
0.6
72
0.6
84
Cutoff midpoint
Fre
qu
en
cy
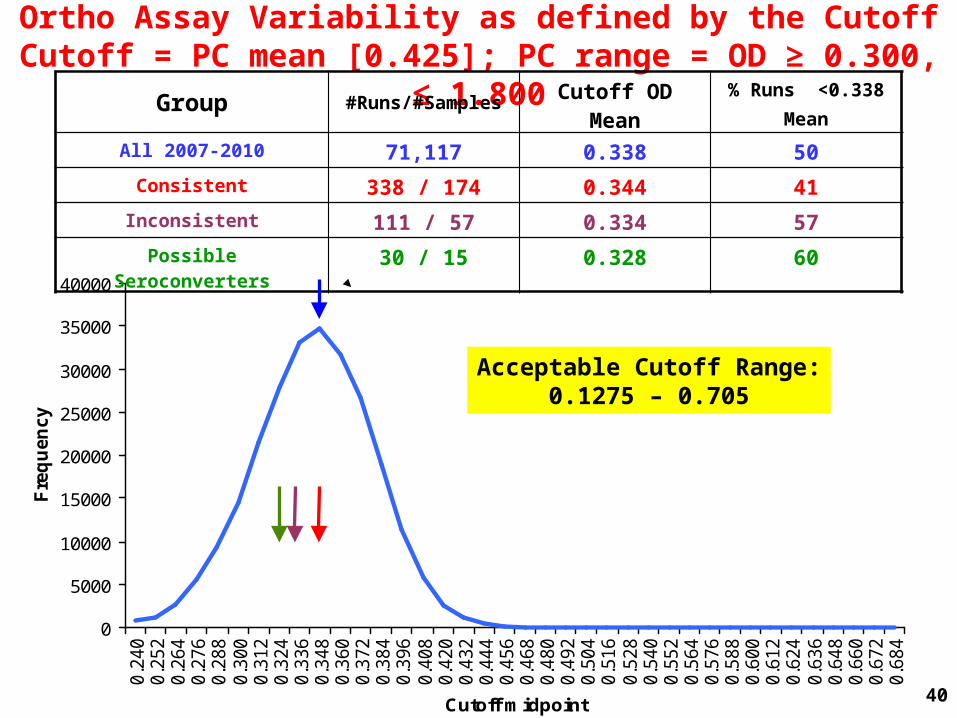
Ortho Assay Variability as defined by the CutoffCutoff = PC mean [0.425]; PC range = OD ≥ 0.300, ≤ 1.800
Group #Runs/#Samples Cutoff OD Mean% Runs <0.338
Mean
All 2007-2010 71,117 0.338 50
Consistent 338 / 174 0.344 41
Inconsistent 111 / 57 0.334 57
Possible Seroconverters 30 / 15 0.328 60
Acceptable Cutoff Range:0.1275 – 0.705
40

T. cruzi Ab reactivity (EIA) correlates with PCR positivity among seroreactive donors in Brazil, Honduras, US
Sabino et al., accepted 2011 AABB Annual Mtg
p<0.005p<0.001 p<0.0001
6.57
5.78
6.33
4.27
5.50
3.56
9 40 45 19 16 81N= 41
Impact of Retesting after 2 or 5 Years• 2005 donor cohort (~2.7 million donors) followed from first to last donation• 9-year donation data to model retest volume (~60 million donations) for a 2- or 5-year retest policy
42
Determination of Repeat Donation Patterns for ARC Donors in CY2005
• All donors with an initial donation in CY2005 who had subsequent donations through CY2010 included
• Time from first => last donation calculated• Plotted the number of donors within the
2005 cohort (2,678,057) who continued to donate (i.e., not yet had their last donation within the study period)
43
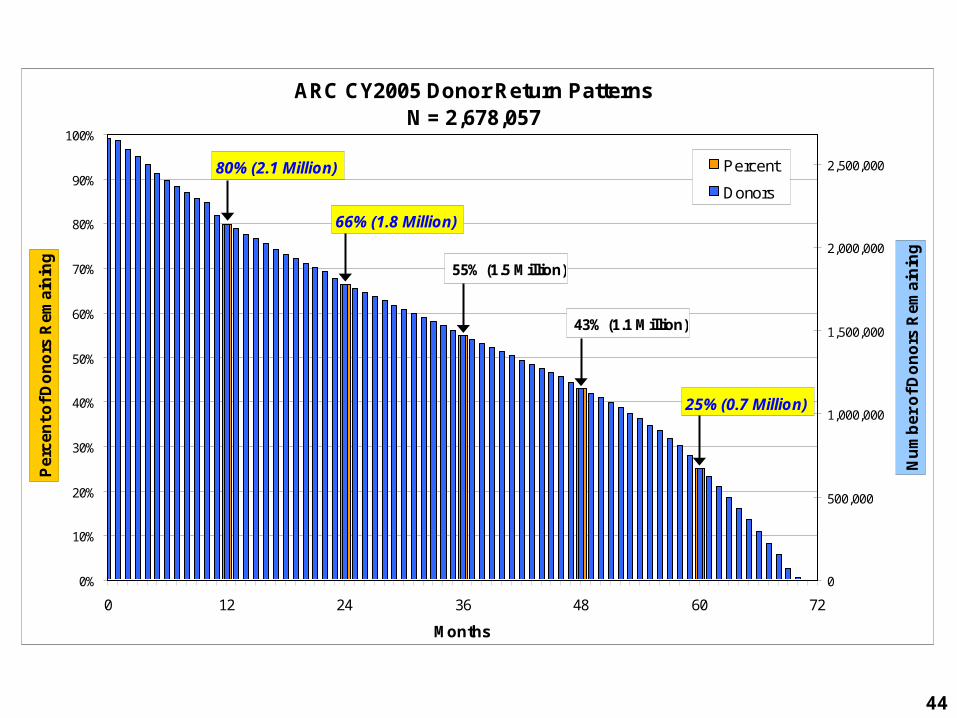
ARC CY2005 Donor Return PatternsN = 2,678,057
25% (0.7 Million)
43% (1.1 Million)
55% (1.5 Million)
66% (1.8 Million)
80% (2.1 Million)
0%
10%
20%
30%
40%
50%
60%
70%
80%
90%
100%
0 12 24 36 48 60 72
Months
Pe
rce
nt
of
Do
no
rs R
em
ain
ing
0
500,000
1,000,000
1,500,000
2,000,000
2,500,000
Nu
mb
er
of
Do
no
rs R
em
ain
ing
Percent
Donors
44
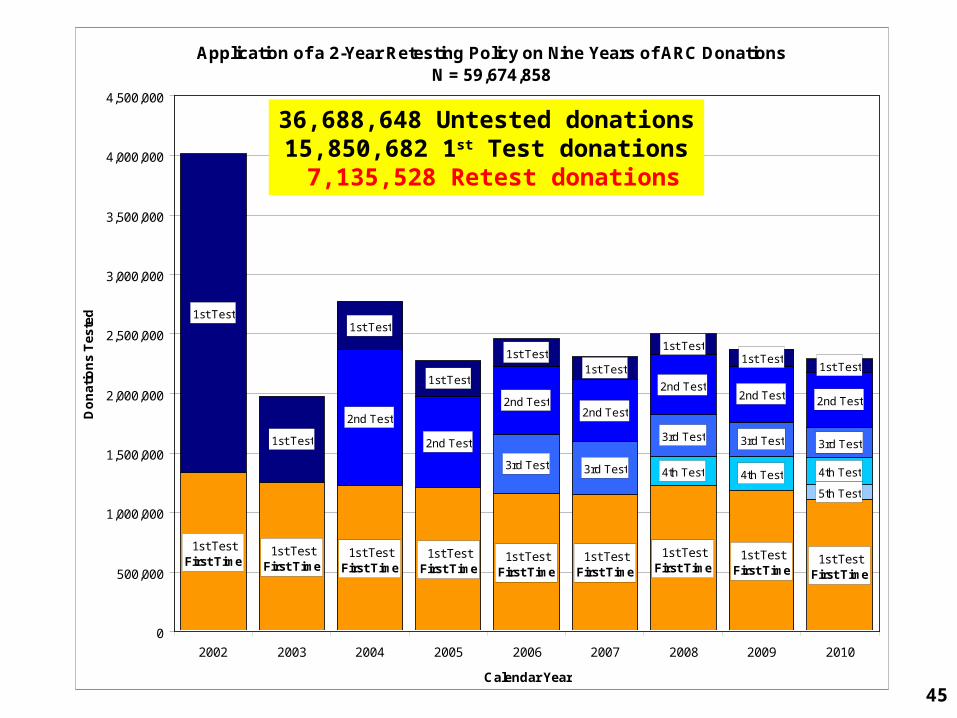
Application of a 2-Year Retesting Policy on Nine Years of ARC DonationsN = 59,674,858
5th Test
4th Test 4th Test 4th Test3rd Test 3rd Test
3rd Test 3rd Test 3rd Test
2nd Test
2nd Test
2nd Test2nd Test
2nd Test2nd Test 2nd Test
1st Test
1st Test
1st Test
1st Test
1st Test1st Test
1st Test1st Test
1st Test
1st TestFirst Time
1st TestFirst Time
1st TestFirst Time
1st TestFirst Time
1st TestFirst Time
1st TestFirst Time
1st TestFirst Time
1st TestFirst Time
1st TestFirst Time
0
500,000
1,000,000
1,500,000
2,000,000
2,500,000
3,000,000
3,500,000
4,000,000
4,500,000
2002 2003 2004 2005 2006 2007 2008 2009 2010
Calendar Year
Do
na
tio
ns
Te
ste
d
36,688,648 Untested donations15,850,682 1st Test donations 7,135,528 Retest donations
45
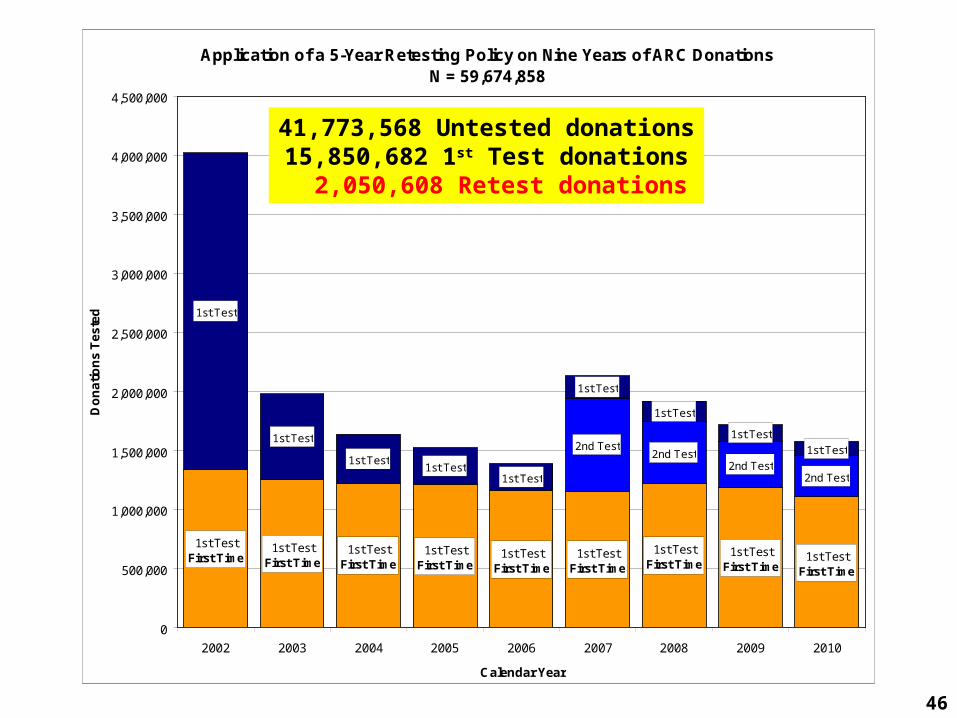
Application of a 5-Year Retesting Policy on Nine Years of ARC DonationsN = 59,674,858
2nd Test2nd Test
2nd Test2nd Test
1st Test
1st Test
1st Test1st Test
1st Test
1st Test
1st Test
1st Test
1st Test
1st TestFirst Time
1st TestFirst Time
1st TestFirst Time
1st TestFirst Time
1st TestFirst Time
1st TestFirst Time
1st TestFirst Time
1st TestFirst Time
1st TestFirst Time
0
500,000
1,000,000
1,500,000
2,000,000
2,500,000
3,000,000
3,500,000
4,000,000
4,500,000
2002 2003 2004 2005 2006 2007 2008 2009 2010
Calendar Year
Do
na
tio
ns
Te
ste
d
41,773,568 Untested donations15,850,682 1st Test donations 2,050,608 Retest donations
46
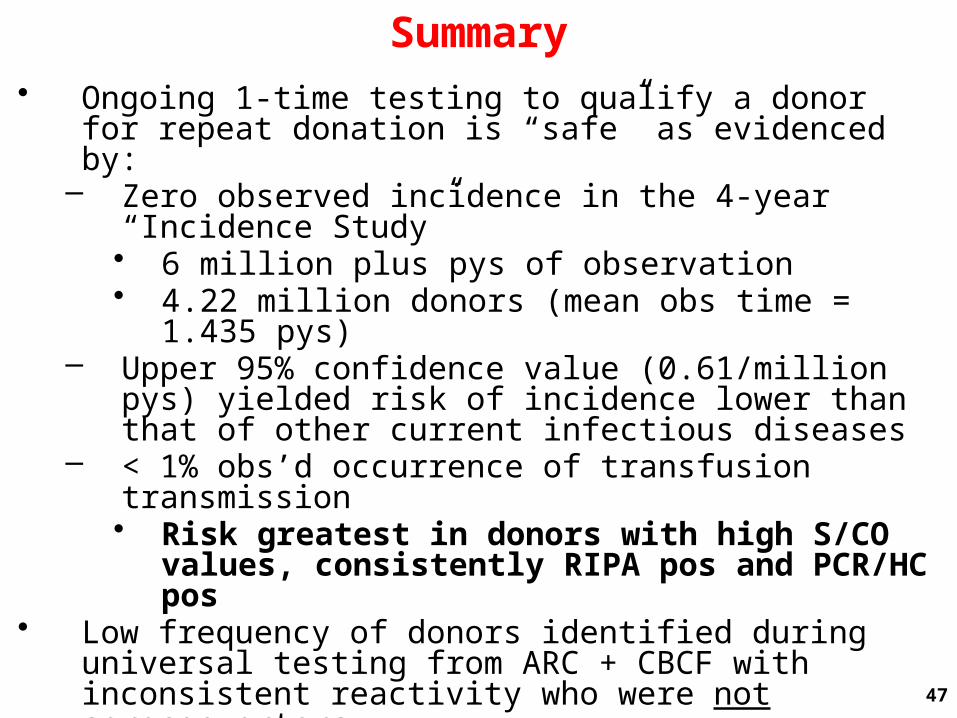
Summary• Ongoing 1-time testing to qualify a donor for repeat donation
is “safe” as evidenced by: – Zero observed incidence in the 4-year “Incidence Study”
• 6 million plus pys of observation• 4.22 million donors (mean obs time = 1.435 pys)
– Upper 95% confidence value (0.61/million pys) yielded risk of incidence lower than that of other current infectious diseases
– < 1% obs’d occurrence of transfusion transmission• Risk greatest in donors with high S/CO values,
consistently RIPA pos and PCR/HC pos • Low frequency of donors identified during universal testing
from ARC + CBCF with inconsistent reactivity who were not seroconverters
– 22/~19 million donations or 1/900,000– Biologic and analytic false positives, remote prior
infection?
47
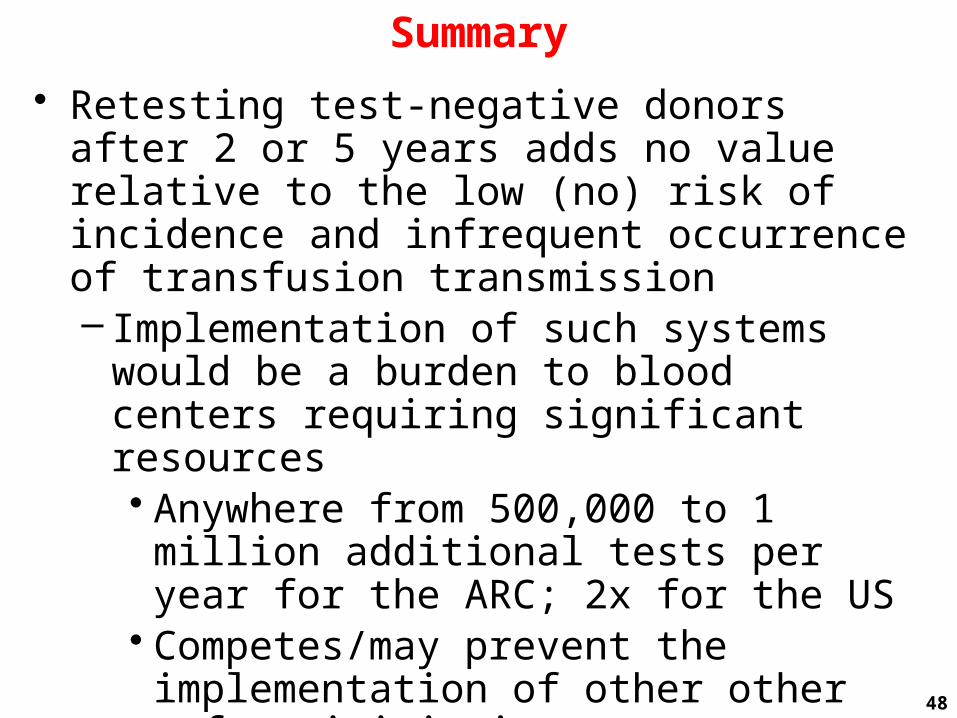
Summary
• Retesting test-negative donors after 2 or 5 years adds no value relative to the low (no) risk of incidence and infrequent occurrence of transfusion transmission– Implementation of such systems would be a
burden to blood centers requiring significant resources• Anywhere from 500,000 to 1 million
additional tests per year for the ARC; 2x for the US
• Competes/may prevent the implementation of other other safety initiatives–e.g., Babesia
48

Conclusion• A selective testing strategy based on qualifying a donor by a single negative donation has high sensitivity and has significantly reduced the amount of testing required without compromising recipient safety
49