Embed Size (px)
Citation preview
1 June 2017
Affin Hwang Investment Bank Bhd (14389-U)
Page 1 of 14
April 17 lacks positive surprises, some pullback
System loans saw flat growth in Apr17 after a strong month in Mar17 (+0.56% mom). On a yoy basis outstanding loans was up 6.1% yoy, with the stronger growth from the business loans (+7.5% yoy) while household loans grew by +5.1% yoy. The Apr17 statistics continue to reinforce our view of an improving earnings trend for the banking sector on a yoy basis, sustained by steady average lending rates and a higher CASA ratio, which underpins a better NIM. Notably, we see that an improving global economic outlook and stronger commodity prices could be in favour of a rebound in the banking sector’s 2017 earnings. We maintain our OVERWEIGHT stance with our top sector pick being Public Bank, CIMB and Maybank.
Disbursements reversed in Apr17 after a strong month in Mar17
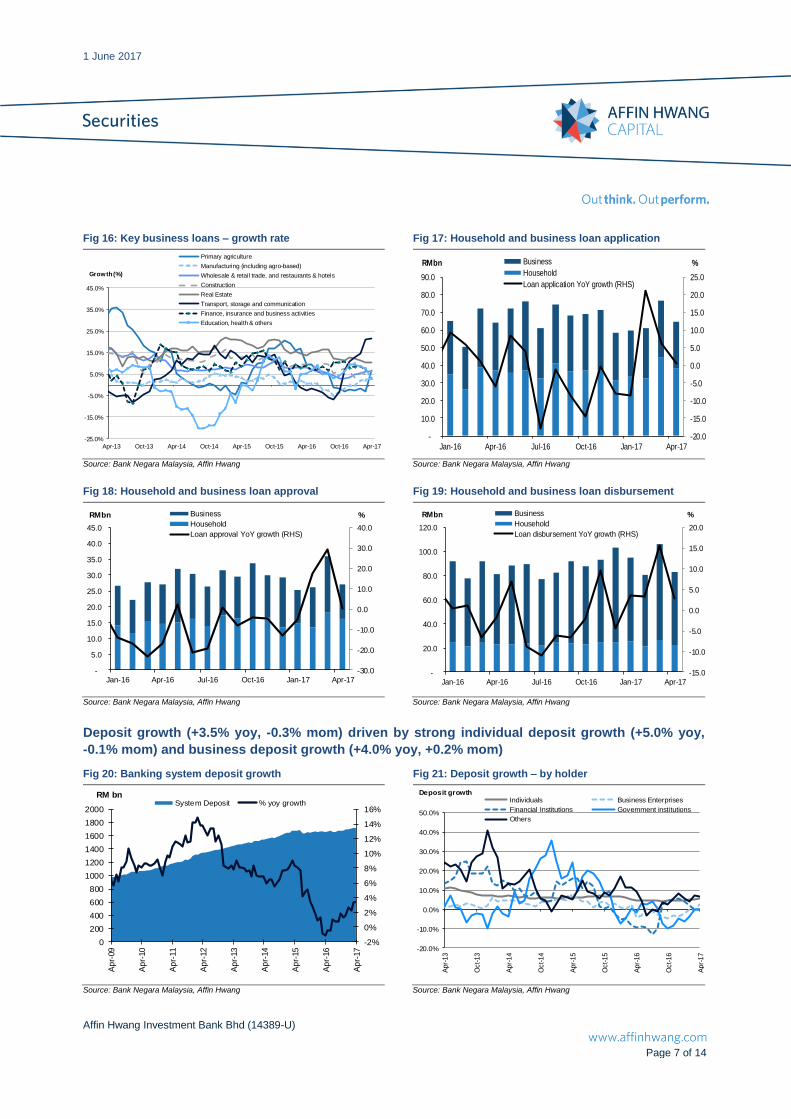
Subsequent to a strong March 2017 where we saw high disbursements especially for business loans, April 2017 witnessed a sharper pullback in loan disbursements (-21.7% mom), approvals (-24.4% mom) and applications (-15.6% mom) for both the household and business. In our view, the monthly fluctuation should normalize and we may see a more discernible growth trend in the coming months. On a yoy basis, the outstanding system loans were up 6.1% yoy (in-line with our 2017 target of 6.0%), with the household segment rising by 5.1% yoy and business (+7.5% yoy). Key sectors driving loan growth are the retail and trades, construction, real-estate and transportation. Domestic liquidity remains ample for credit growth as year-to-date system deposit was up 1.3%, driven by improved cash balances at government institutions (+6.3% ytd) and businesses (+0.16% mom). Domestic asset quality remains sound with a gross impaired loan ratio of 1.66% (Apr17), though there was an uptick of 4 bps mom while impaired loan cover declined marginally to 88.9% in Apr17 (from 89.1% Mar17).
NIM expected to remain steady going into 2Q17
The domestic banking system’s average lending rate has remained steady from Mar17 to Apr, hovering at 4.6% in Mar17 and 4.59% in Apr17. We believe this is due to an improved loan mix and higher loan pricing, most likely in the business-loan segment rather than consumer loans. In order to counter NIM compression, which had been weighing down on the sector badly from 2014-16, most industry players have resorted to higher risk-adjusted returns loans, repricing initiatives and improving funding-mix. Meanwhile, CASA ratio remained steady at 26.7% in Apr17 vs. 26.6-27% in Jan-Mar17 and 25.2% in Apr16, should also underpin lower cost of funding for the banks. Hence, this reinforces our view that NIM may start seeing some positive improvements in 2017E. Banks continue to operate with a high liquidity-coverage ratio (LCR) of 127% in Feb17 (Dec16: 125%) while the overall loan-to-fund ratio stood at 82.8% in Apr17 (flat vs. Mar17).
Peer Comparison
Stock Rating Price (RM) PT Bloomberg Mkt Cap
31-May (RM) Code (RMm) CY17E CY18E CY17E CY18E CY17E CY18E CY17E CY18E CY17E CY18E
AFG BUY 4.33 4.70 AFG MK 6,604 1.3 1.2 14.0 13.0 9.3 9.6 16.0 16.0 3.7 3.7
AMMB HOLD 5.21 5.20 AMM MK 15,704 0.9 0.9 10.5 10.2 9.2 8.9 17.6 20.0 3.4 3.8
CIMB BUY 6.40 7.00 CIMB MK 56,758 1.2 1.2 12.4 12.5 10.0 9.6 22.9 24.3 3.6 3.8
HLB BUY 14.02 15.68 HLBK MK 28,677 1.2 1.2 12.2 11.6 10.4 10.2 44.0 46.0 3.1 3.3
Maybank BUY 9.44 10.50 MAY MK 96,087 1.4 1.3 13.6 13.9 10.2 9.8 58.0 60.0 6.1 6.4
PBB BUY 20.06 23.25 PBK MK 77,462 2.1 1.9 14.6 13.9 14.9 14.4 60.0 62.0 3.0 3.1
RHB Bank HOLD 5.39 5.35 RHBBANK MK 21,614 0.9 0.9 11.1 10.7 8.7 8.5 12.0 12.0 2.2 2.2
Affin NR 2.66 - AHB MK 5,168 0.6 0.6 10.2 8.5 5.7 6.6 11.0 11.5 4.1 4.3
MBSB HOLD 1.28 1.25 MBS MK 7,422 1.1 1.0 19.7 13.9 5.5 7.5 3.0 3.0 2.3 2.3
Aeon Credit SELL 19.20 15.10 ACSM MK 2,765 2.4 2.1 10.5 10.1 24.6 22.1 66.8 73.1 3.5 3.8
Banks and Non-banks (Weighted Avg) 1.30 1.23 12.91 12.37 10.4 10.2 43.00 44.71 4.05 4.22
Banks Only (Weighted Average) 1.30 1.23 12.83 12.36 10.5 10.2 43.75 45.46 4.10 4.27
Net Yield (%)P/BV (x) P/E (x) ROE (%) Net DPS (sen)
Source: Bloomberg, Affin Hwang forecasts
Sector Update
Banking OVERWEIGHT (maintain) Absolute Performance (%)
1M 3M 12M
AFG +4.8 +13.4 +8.8
AMMB (4.9) +11.8 +20.9
CIMB +11.5 +25.7 +47.1
HLBB +1.6 +5.1 +5.4
Maybank (1.5) +9.5 +14.7
PBB +0.5 +0.6 +6.0
RHB (2.0) +9.1 +14.9
MBSB (2.3) +13.3 +16.0
AEONCS +17.5 +23.9 +39.9
Affin (Not rated) (9.2) +4.3 +20.4
BIMB (Not rated) +3.2 +0.9 +10.8
Relative Performance (%)
90
95
100
105
110
115
120
125
130
135
140
Jan-17 Feb-17 Mar-17 Apr-17 May-17
AFG AMMB CIMB
Hong Leong Bank Maybank MBSB
Public Bank RHB Capital BIMB
AeonCs
Source: Affin Hwang, Bloomberg
Tan Ei Leen (603) 2146 7543
Loh Jia Ying (603) 2146 7546
1 June 2017
Affin Hwang Investment Bank Bhd (14389-U)
Page 2 of 14
Underlying economic trends in favour of a rebound in the sector
We note an improving global economic outlook and stronger commodity prices are in favour of a rebound in banking sector earnings in 2017:
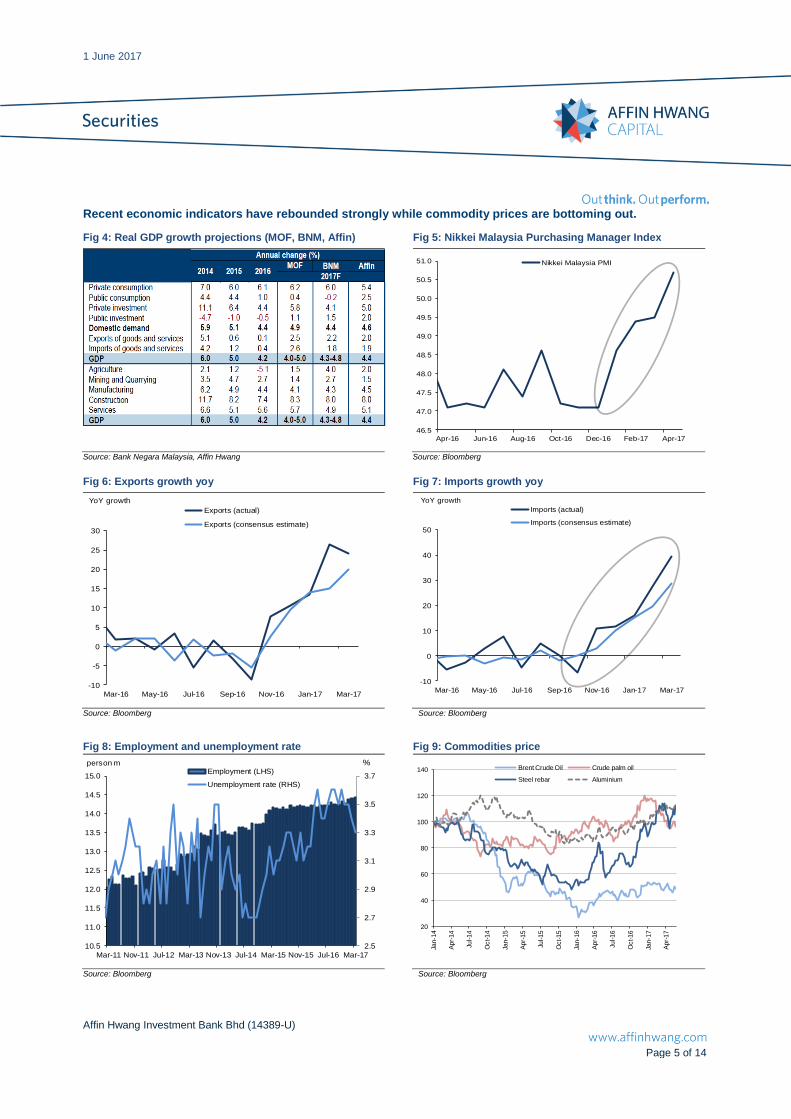
i) Improving economic indicators – Our 1Q16 GDP growth grew at a
strong 5.6% (vs. 1Q16: 4.1% and 4Q16: 4.5%). More encouragingly, we note that economic indicators such as Nikkei Malaysia Purchasing Manager Index, the export and import trade data have all shown an improving trend in recent months – hence, implying stronger economic growth ahead and rising business sentiment, which bodes well for business loans growth. Higher net export proceeds repatriated back to the country would also boost system deposit growth and liquidity.
ii) Robust labour market – While unemployment rate stood at 3.3%,
labour force participation rate remain high and number of workforce is still growing in tandem with population growth. A robust labour market would be supportive of increased consumer spending and demand for both big and small-ticket items.
iii) Stronger commodity prices – Based on our chart in Fig 9, commodity
prices are gradually turning around since 4Q16 as the industry supply-demand dynamics continue to improve. Recovery in commodity prices would help to justify a higher carrying value and writebacks in value of a related loan account of which previously has been written-down and recognized as an impairment charge.
Maintain sector OVERWEIGHT We maintain our sector OVERWEIGHT call. We foresee a sector earnings
growth of +10.9% yoy in 2017E, while subsequently growing by a modest 3.6% yoy in 2018E and 3.9% yoy in 2019E (EPS growth: +8.9% 2017E, +1.5% 2018E, +1.9% 2019E). Favourable domestic demographic trends (driving consumption and housing needs), ample infrastructure projects in the pipeline and accommodative monetary policy are supportive reasons for the growth. The sector’s overall valuation in 2017E still appears attractive at a 1.3x P/BV multiple (on a forward basis) against the 10-year average of 1.6x, 5-year average of 1.5x and a 3-year average of 1.34x. Key risks: new NPL formation, NIM compression, higher funding costs, weaker loan growth, much higher provisions on FRS 9 adoption. Top picks – Public Bank, CIMB Group, Maybank For sector exposure, we continue to like Public Bank (PBK MK, BUY, RM20.06; TP: RM23.25, based on a 2017E P/BV of 2.42x) given the
group’s more stringent credit underwriting standards and established franchise in the domestic retail financing markets. For CIMB Group (CIMB MK, RM6.40, BUY, TP at RM7.00 based on a 1.3x P/BV target) we expect 2017 earnings to continue improving from 2016
(+25% yoy), projected at a growth rate of 31% yoy, after a trough period in 2014-15. In our view, heightened provisions seen in 2014-16 may subside in 2017 while stronger loan growth (projected at 6.9% yoy) and steady NIM at 2.66% will be another key earnings driver. For Maybank (MAY MK, RM9.44, BUY, TP of RM10.50 based on a 1.5x P/BV target), we foresee a better year underpinned by robust fund-based
income generation, while NIM is expected to remain steady. Asset quality is also expected to improve as global headwinds ease, while its Indonesian unit is also showing signs of turnaround.
1 June 2017
Affin Hwang Investment Bank Bhd (14389-U)
Page 3 of 14
Focus Charts:
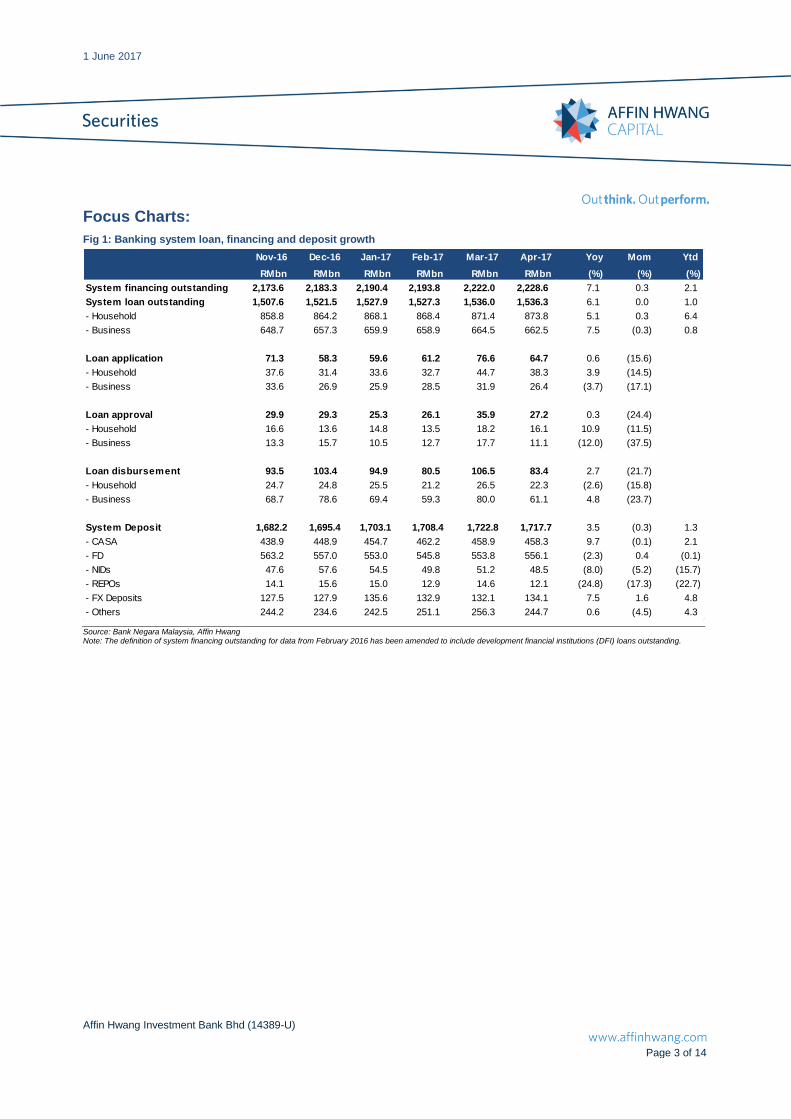
Fig 1: Banking system loan, financing and deposit growth
Nov-16 Dec-16 Jan-17 Feb-17 Mar-17 Apr-17 Yoy Mom Ytd
RMbn RMbn RMbn RMbn RMbn RMbnRMbn (%) (%) (%)
System financing outstanding 2,173.6 2,183.3 2,190.4 2,193.8 2,222.0 2,228.6 7.1 0.3 2.1
System loan outstanding 1,507.6 1,521.5 1,527.9 1,527.3 1,536.0 1,536.3 6.1 0.0 1.0
- Household 858.8 864.2 868.1 868.4 871.4 873.8 5.1 0.3 6.4
- Business 648.7 657.3 659.9 658.9 664.5 662.5 7.5 (0.3) 0.8
Loan application 71.3 58.3 59.6 61.2 76.6 64.7 0.6 (15.6)
- Household 37.6 31.4 33.6 32.7 44.7 38.3 3.9 (14.5)
- Business 33.6 26.9 25.9 28.5 31.9 26.4 (3.7) (17.1)
Loan approval 29.9 29.3 25.3 26.1 35.9 27.2 0.3 (24.4)
- Household 16.6 13.6 14.8 13.5 18.2 16.1 10.9 (11.5)
- Business 13.3 15.7 10.5 12.7 17.7 11.1 (12.0) (37.5)
Loan disbursement 93.5 103.4 94.9 80.5 106.5 83.4 2.7 (21.7)
- Household 24.7 24.8 25.5 21.2 26.5 22.3 (2.6) (15.8)
- Business 68.7 78.6 69.4 59.3 80.0 61.1 4.8 (23.7)
System Deposit 1,682.2 1,695.4 1,703.1 1,708.4 1,722.8 1,717.7 3.5 (0.3) 1.3
- CASA 438.9 448.9 454.7 462.2 458.9 458.3 9.7 (0.1) 2.1
- FD 563.2 557.0 553.0 545.8 553.8 556.1 (2.3) 0.4 (0.1)
- NIDs 47.6 57.6 54.5 49.8 51.2 48.5 (8.0) (5.2) (15.7)
- REPOs 14.1 15.6 15.0 12.9 14.6 12.1 (24.8) (17.3) (22.7)
- FX Deposits 127.5 127.9 135.6 132.9 132.1 134.1 7.5 1.6 4.8
- Others 244.2 234.6 242.5 251.1 256.3 244.7 0.6 (4.5) 4.3
Source: Bank Negara Malaysia, Affin Hwang Note: The definition of system financing outstanding for data from February 2016 has been amended to include development financial institutions (DFI) loans outstanding.
1 June 2017
Affin Hwang Investment Bank Bhd (14389-U)
Page 4 of 14
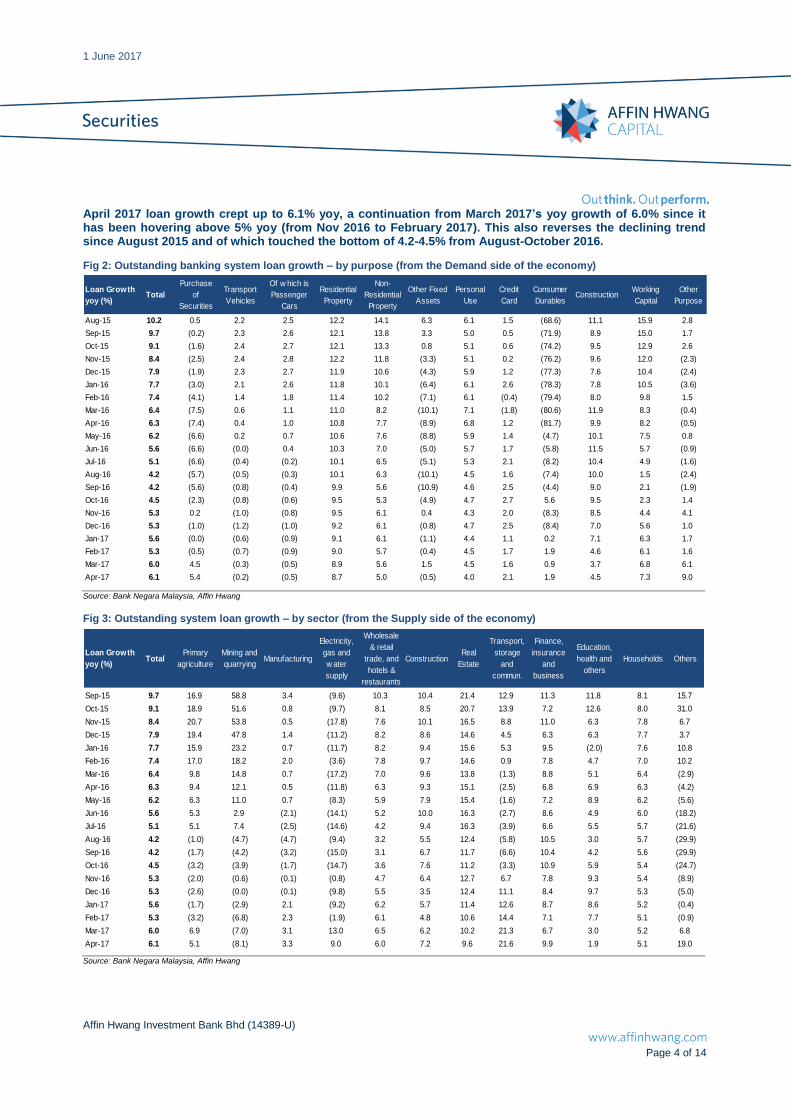
April 2017 loan growth crept up to 6.1% yoy, a continuation from March 2017’s yoy growth of 6.0% since it has been hovering above 5% yoy (from Nov 2016 to February 2017). This also reverses the declining trend since August 2015 and of which touched the bottom of 4.2-4.5% from August-October 2016.
Fig 2: Outstanding banking system loan growth – by purpose (from the Demand side of the economy)
Loan Growth
yoy (%)Total
Purchase
of
Securities
Transport
Vehicles
Of w hich is
Passenger
Cars
Residential
Property
Non-
Residential
Property
Other Fixed
Assets
Personal
Use
Credit
Card
Consumer
DurablesConstruction
Working
Capital
Other
Purpose
Aug-15 10.2 0.5 2.2 2.5 12.2 14.1 6.3 6.1 1.5 (68.6) 11.1 15.9 2.8
Sep-15 9.7 (0.2) 2.3 2.6 12.1 13.8 3.3 5.0 0.5 (71.9) 8.9 15.0 1.7
Oct-15 9.1 (1.6) 2.4 2.7 12.1 13.3 0.8 5.1 0.6 (74.2) 9.5 12.9 2.6
Nov-15 8.4 (2.5) 2.4 2.8 12.2 11.8 (3.3) 5.1 0.2 (76.2) 9.6 12.0 (2.3)
Dec-15 7.9 (1.9) 2.3 2.7 11.9 10.6 (4.3) 5.9 1.2 (77.3) 7.6 10.4 (2.4)
Jan-16 7.7 (3.0) 2.1 2.6 11.8 10.1 (6.4) 6.1 2.6 (78.3) 7.8 10.5 (3.6)
Feb-16 7.4 (4.1) 1.4 1.8 11.4 10.2 (7.1) 6.1 (0.4) (79.4) 8.0 9.8 1.5
Mar-16 6.4 (7.5) 0.6 1.1 11.0 8.2 (10.1) 7.1 (1.8) (80.6) 11.9 8.3 (0.4)
Apr-16 6.3 (7.4) 0.4 1.0 10.8 7.7 (8.9) 6.8 1.2 (81.7) 9.9 8.2 (0.5)
May-16 6.2 (6.6) 0.2 0.7 10.6 7.6 (8.8) 5.9 1.4 (4.7) 10.1 7.5 0.8
Jun-16 5.6 (6.6) (0.0) 0.4 10.3 7.0 (5.0) 5.7 1.7 (5.8) 11.5 5.7 (0.9)
Jul-16 5.1 (6.6) (0.4) (0.2) 10.1 6.5 (5.1) 5.3 2.1 (8.2) 10.4 4.9 (1.6)
Aug-16 4.2 (5.7) (0.5) (0.3) 10.1 6.3 (10.1) 4.5 1.6 (7.4) 10.0 1.5 (2.4)
Sep-16 4.2 (5.6) (0.8) (0.4) 9.9 5.6 (10.9) 4.6 2.5 (4.4) 9.0 2.1 (1.9)
Oct-16 4.5 (2.3) (0.8) (0.6) 9.5 5.3 (4.9) 4.7 2.7 5.6 9.5 2.3 1.4
Nov-16 5.3 0.2 (1.0) (0.8) 9.5 6.1 0.4 4.3 2.0 (8.3) 8.5 4.4 4.1
Dec-16 5.3 (1.0) (1.2) (1.0) 9.2 6.1 (0.8) 4.7 2.5 (8.4) 7.0 5.6 1.0
Jan-17 5.6 (0.0) (0.6) (0.9) 9.1 6.1 (1.1) 4.4 1.1 0.2 7.1 6.3 1.7
Feb-17 5.3 (0.5) (0.7) (0.9) 9.0 5.7 (0.4) 4.5 1.7 1.9 4.6 6.1 1.6
Mar-17 6.0 4.5 (0.3) (0.5) 8.9 5.6 1.5 4.5 1.6 0.9 3.7 6.8 6.1
Apr-17 6.1 5.4 (0.2) (0.5) 8.7 5.0 (0.5) 4.0 2.1 1.9 4.5 7.3 9.0
Source: Bank Negara Malaysia, Affin Hwang
Fig 3: Outstanding system loan growth – by sector (from the Supply side of the economy)
Loan Growth
yoy (%)Total
Primary
agriculture
Mining and
quarryingManufacturing
Electricity,
gas and
w ater
supply
Wholesale
& retail
trade, and
hotels &
restaurants
ConstructionReal
Estate
Transport,
storage
and
commun.
Finance,
insurance
and
business
Education,
health and
others
Households Others
Sep-15 9.7 16.9 58.8 3.4 (9.6) 10.3 10.4 21.4 12.9 11.3 11.8 8.1 15.7
Oct-15 9.1 18.9 51.6 0.8 (9.7) 8.1 8.5 20.7 13.9 7.2 12.6 8.0 31.0
Nov-15 8.4 20.7 53.8 0.5 (17.8) 7.6 10.1 16.5 8.8 11.0 6.3 7.8 6.7
Dec-15 7.9 19.4 47.8 1.4 (11.2) 8.2 8.6 14.6 4.5 6.3 6.3 7.7 3.7
Jan-16 7.7 15.9 23.2 0.7 (11.7) 8.2 9.4 15.6 5.3 9.5 (2.0) 7.6 10.8
Feb-16 7.4 17.0 18.2 2.0 (3.6) 7.8 9.7 14.6 0.9 7.8 4.7 7.0 10.2
Mar-16 6.4 9.8 14.8 0.7 (17.2) 7.0 9.6 13.8 (1.3) 8.8 5.1 6.4 (2.9)
Apr-16 6.3 9.4 12.1 0.5 (11.8) 6.3 9.3 15.1 (2.5) 6.8 6.9 6.3 (4.2)
May-16 6.2 6.3 11.0 0.7 (8.3) 5.9 7.9 15.4 (1.6) 7.2 8.9 6.2 (5.6)
Jun-16 5.6 5.3 2.9 (2.1) (14.1) 5.2 10.0 16.3 (2.7) 8.6 4.9 6.0 (18.2)
Jul-16 5.1 5.1 7.4 (2.5) (14.6) 4.2 9.4 16.3 (3.9) 6.6 5.5 5.7 (21.6)
Aug-16 4.2 (1.0) (4.7) (4.7) (9.4) 3.2 5.5 12.4 (5.8) 10.5 3.0 5.7 (29.9)
Sep-16 4.2 (1.7) (4.2) (3.2) (15.0) 3.1 6.7 11.7 (6.6) 10.4 4.2 5.6 (29.9)
Oct-16 4.5 (3.2) (3.9) (1.7) (14.7) 3.6 7.6 11.2 (3.3) 10.9 5.9 5.4 (24.7)
Nov-16 5.3 (2.0) (0.6) (0.1) (0.8) 4.7 6.4 12.7 6.7 7.8 9.3 5.4 (8.9)
Dec-16 5.3 (2.6) (0.0) (0.1) (9.8) 5.5 3.5 12.4 11.1 8.4 9.7 5.3 (5.0)
Jan-17 5.6 (1.7) (2.9) 2.1 (9.2) 6.2 5.7 11.4 12.6 8.7 8.6 5.2 (0.4)
Feb-17 5.3 (3.2) (6.8) 2.3 (1.9) 6.1 4.8 10.6 14.4 7.1 7.7 5.1 (0.9)
Mar-17 6.0 6.9 (7.0) 3.1 13.0 6.5 6.2 10.2 21.3 6.7 3.0 5.2 6.8
Apr-17 6.1 5.1 (8.1) 3.3 9.0 6.0 7.2 9.6 21.6 9.9 1.9 5.1 19.0 Source: Bank Negara Malaysia, Affin Hwang
1 June 2017
Affin Hwang Investment Bank Bhd (14389-U)
Page 5 of 14
Recent economic indicators have rebounded strongly while commodity prices are bottoming out.
Fig 4: Real GDP growth projections (MOF, BNM, Affin) Fig 5: Nikkei Malaysia Purchasing Manager Index
46.5
47.0
47.5
48.0
48.5
49.0
49.5
50.0
50.5
51.0
Apr-16 Jun-16 Aug-16 Oct-16 Dec-16 Feb-17 Apr-17
Nikkei Malaysia PMI
Source: Bank Negara Malaysia, Affin Hwang Source: Bloomberg
Fig 6: Exports growth yoy Fig 7: Imports growth yoy
-10
-5
0
5
10
15
20
25
30
Mar-16 May-16 Jul-16 Sep-16 Nov-16 Jan-17 Mar-17
YoY growth
Exports (actual)
Exports (consensus estimate)
-10
0
10
20
30
40
50
Mar-16 May-16 Jul-16 Sep-16 Nov-16 Jan-17 Mar-17
YoY growth
Imports (actual)
Imports (consensus estimate)
Source: Bloomberg Source: Bloomberg
Fig 8: Employment and unemployment rate
Fig 9: Commodities price
2.5
2.7
2.9
3.1
3.3
3.5
3.7
10.5
11.0
11.5
12.0
12.5
13.0
13.5
14.0
14.5
15.0
Mar-11 Nov-11 Jul-12 Mar-13 Nov-13 Jul-14 Mar-15 Nov-15 Jul-16 Mar-17
person mEmployment (LHS)
Unemployment rate (RHS)
%
20
40
60
80
100
120
140
Jan-1
4
Apr-
14
Jul-14
Oct-14
Jan-1
5
Apr-
15
Jul-15
Oct-15
Jan-1
6
Apr-
16
Jul-16
Oct-16
Jan-1
7
Apr-
17
Brent Crude Oil Crude palm oil
Steel rebar Aluminium
Source: Bloomberg Source: Bloomberg
1 June 2017
Affin Hwang Investment Bank Bhd (14389-U)
Page 6 of 14
Fig 10: Banking system financing and loan growth Fig 11: Annual incremental loan growth
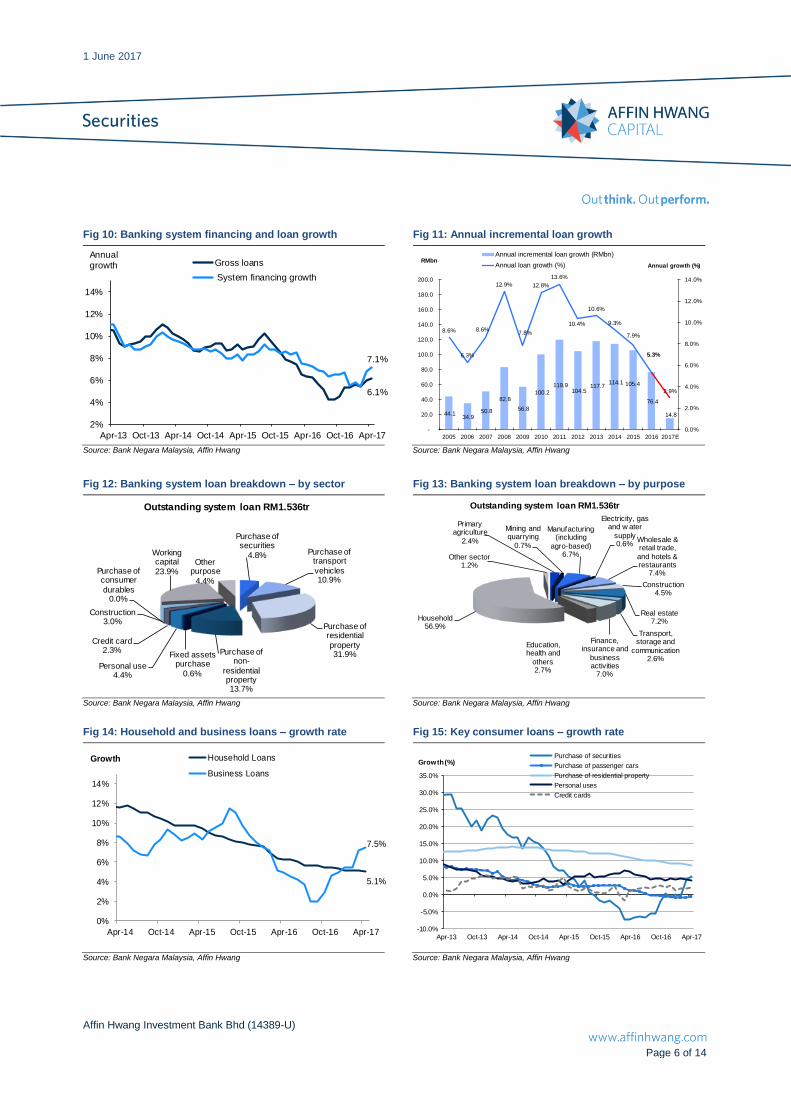
6.1%
7.1%
2%
4%
6%
8%
10%
12%
14%
Apr-13 Oct-13 Apr-14 Oct-14 Apr-15 Oct-15 Apr-16 Oct-16 Apr-17
Annual growth Gross loans
System financing growth
44.1 34.9
50.8
82.8
56.8
100.2
119.9 104.5
117.7 114.1 105.4
76.4
14.8
8.6%
6.3%
8.6%
12.9%
7.8%
12.8%
13.6%
10.4%
10.6%
9.3%
7.9%
5.3%
2.9%
0.0%
2.0%
4.0%
6.0%
8.0%
10.0%
12.0%
14.0%
-
20.0
40.0
60.0
80.0
100.0
120.0
140.0
160.0
180.0
200.0
2005 2006 2007 2008 2009 2010 2011 2012 2013 2014 2015 2016 2017E
Annual growth (%)RMbn
Annual incremental loan growth (RMbn)
Annual loan growth (%)
Source: Bank Negara Malaysia, Affin Hwang Source: Bank Negara Malaysia, Affin Hwang
Fig 12: Banking system loan breakdown – by sector Fig 13: Banking system loan breakdown – by purpose
Purchase of securities
4.8% Purchase of transport
vehicles10.9%
Purchase of residential
property31.9%Purchase of
non-
residential property13.7%
Fixed assets purchase
0.6%Personal use
4.4%
Credit card2.3%
Purchase of consumer
durables0.0%
Construction3.0%
Working capital
23.9%Other
purpose
4.4%
Outstanding system loan RM1.536tr
Primary agriculture
2.4%
Mining and quarrying
0.7%
Manufacturing (including
agro-based)6.7%
Electricity, gas and w ater
supply0.6%
Wholesale & retail trade,
and hotels & restaurants
7.4%
Construction4.5%
Real estate7.2%
Transport, storage and
communication2.6%
Finance, insurance and
business activities
7.0%
Education, health and
others2.7%
Household 56.9%
Other sector1.2%
Outstanding system loan RM1.536tr
Source: Bank Negara Malaysia, Affin Hwang Source: Bank Negara Malaysia, Affin Hwang
Fig 14: Household and business loans – growth rate Fig 15: Key consumer loans – growth rate
5.1%
7.5%
0%
2%
4%
6%
8%
10%
12%
14%
Apr-14 Oct-14 Apr-15 Oct-15 Apr-16 Oct-16 Apr-17
Growth Household Loans
Business Loans
-10.0%
-5.0%
0.0%
5.0%
10.0%
15.0%
20.0%
25.0%
30.0%
35.0%
Apr-13 Oct-13 Apr-14 Oct-14 Apr-15 Oct-15 Apr-16 Oct-16 Apr-17
Growth (%)Purchase of securities
Purchase of passenger cars
Purchase of residential property
Personal uses
Credit cards
Source: Bank Negara Malaysia, Affin Hwang Source: Bank Negara Malaysia, Affin Hwang
1 June 2017
Affin Hwang Investment Bank Bhd (14389-U)
Page 7 of 14
Fig 16: Key business loans – growth rate Fig 17: Household and business loan application
-25.0%
-15.0%
-5.0%
5.0%
15.0%
25.0%
35.0%
45.0%
Apr-13 Oct-13 Apr-14 Oct-14 Apr-15 Oct-15 Apr-16 Oct-16 Apr-17
Growth (%)
Primary agriculture
Manufacturing (including agro-based)
Wholesale & retail trade, and restaurants & hotels
Construction
Real Estate
Transport, storage and communication
Finance, insurance and business activities
Education, health & others
-20.0
-15.0
-10.0
-5.0
0.0
5.0
10.0
15.0
20.0
25.0
-
10.0
20.0
30.0
40.0
50.0
60.0
70.0
80.0
90.0
Jan-16 Apr-16 Jul-16 Oct-16 Jan-17 Apr-17
%RMbn Business
Household
Loan application YoY growth (RHS)
Source: Bank Negara Malaysia, Affin Hwang Source: Bank Negara Malaysia, Affin Hwang
Fig 18: Household and business loan approval Fig 19: Household and business loan disbursement
-30.0
-20.0
-10.0
0.0
10.0
20.0
30.0
40.0
-
5.0
10.0
15.0
20.0
25.0
30.0
35.0
40.0
45.0
Jan-16 Apr-16 Jul-16 Oct-16 Jan-17 Apr-17
%RMbn Business
Household
Loan approval YoY growth (RHS)
-15.0
-10.0
-5.0
0.0
5.0
10.0
15.0
20.0
-
20.0
40.0
60.0
80.0
100.0
120.0
Jan-16 Apr-16 Jul-16 Oct-16 Jan-17 Apr-17
%RMbn Business
Household
Loan disbursement YoY growth (RHS)
Source: Bank Negara Malaysia, Affin Hwang Source: Bank Negara Malaysia, Affin Hwang
Deposit growth (+3.5% yoy, -0.3% mom) driven by strong individual deposit growth (+5.0% yoy,
-0.1% mom) and business deposit growth (+4.0% yoy, +0.2% mom)
Fig 20: Banking system deposit growth Fig 21: Deposit growth – by holder
-2%
0%
2%
4%
6%
8%
10%
12%
14%
16%
0
200
400
600
800
1000
1200
1400
1600
1800
2000
Ap
r-09
Ap
r-10
Ap
r-11
Ap
r-12
Ap
r-13
Ap
r-14
Ap
r-15
Ap
r-16
Ap
r-17
System Deposit % yoy growthRM bn
-20.0%
-10.0%
0.0%
10.0%
20.0%
30.0%
40.0%
50.0%
Apr-
13
Oct-13
Apr-
14
Oct-14
Apr-
15
Oct-15
Apr-
16
Oct-16
Apr-
17
Deposit growthIndividuals Business Enterprises
Financial Institutions Government institutions
Others
Source: Bank Negara Malaysia, Affin Hwang Source: Bank Negara Malaysia, Affin Hwang
1 June 2017
Affin Hwang Investment Bank Bhd (14389-U)
Page 8 of 14
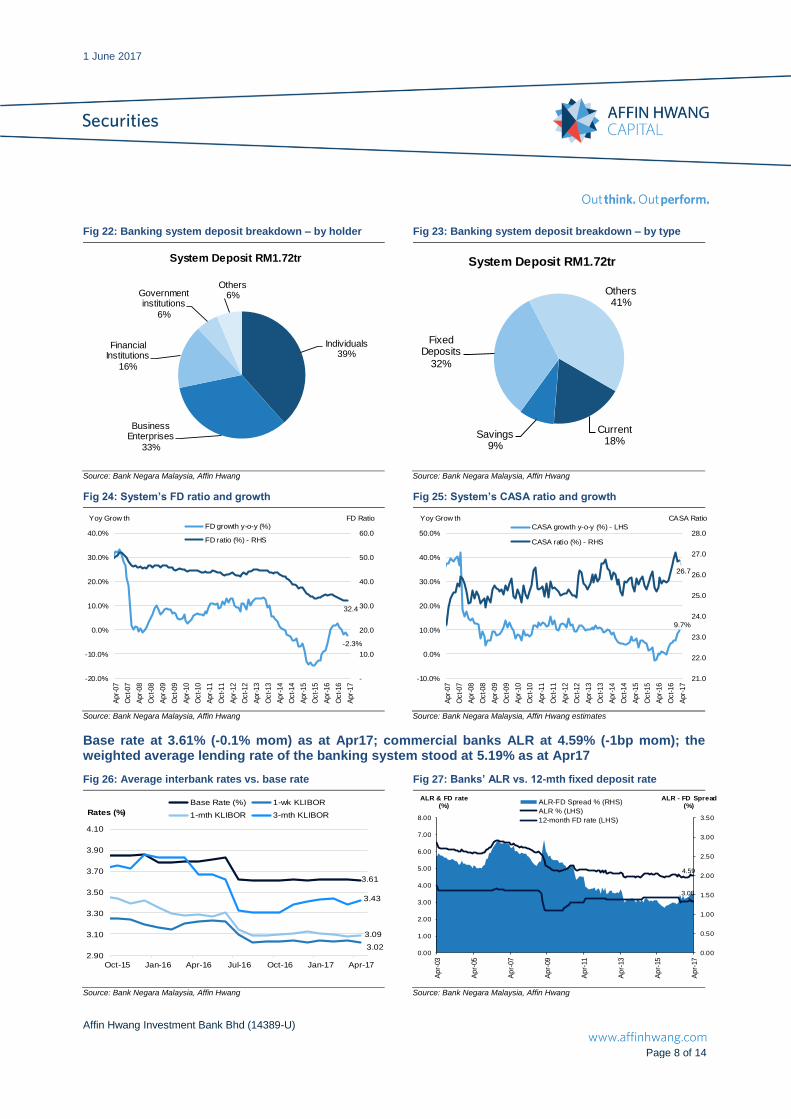
Fig 22: Banking system deposit breakdown – by holder Fig 23: Banking system deposit breakdown – by type
Individuals39%
Business Enterprises
33%
Financial Institutions
16%
Government institutions
6%
Others6%
System Deposit RM1.72tr
Current18%
Savings9%
Fixed Deposits
32%
Others41%
System Deposit RM1.72tr
Source: Bank Negara Malaysia, Affin Hwang Source: Bank Negara Malaysia, Affin Hwang
Fig 24: System’s FD ratio and growth Fig 25: System’s CASA ratio and growth
-2.3%
32.4
-
10.0
20.0
30.0
40.0
50.0
60.0
-20.0%
-10.0%
0.0%
10.0%
20.0%
30.0%
40.0%
Apr-
07
Oct-07
Apr-
08
Oct-08
Apr-
09
Oct-09
Apr-
10
Oct-10
Apr-
11
Oct-11
Apr-
12
Oct-12
Apr-
13
Oct-13
Apr-
14
Oct-14
Apr-
15
Oct-15
Apr-
16
Oct-16
Apr-
17
FD RatioYoy Grow thFD growth y-o-y (%)
FD ratio (%) - RHS
9.7%
26.7
21.0
22.0
23.0
24.0
25.0
26.0
27.0
28.0
-10.0%
0.0%
10.0%
20.0%
30.0%
40.0%
50.0%
Apr-
07
Oct-07
Apr-
08
Oct-08
Apr-
09
Oct-09
Apr-
10
Oct-10
Apr-
11
Oct-11
Apr-
12
Oct-12
Apr-
13
Oct-13
Apr-
14
Oct-14
Apr-
15
Oct-15
Apr-
16
Oct-16
Apr-
17
CASA RatioYoy Grow th
CASA growth y-o-y (%) - LHS
CASA ratio (%) - RHS
Source: Bank Negara Malaysia, Affin Hwang Source: Bank Negara Malaysia, Affin Hwang estimates
Base rate at 3.61% (-0.1% mom) as at Apr17; commercial banks ALR at 4.59% (-1bp mom); the weighted average lending rate of the banking system stood at 5.19% as at Apr17
Fig 26: Average interbank rates vs. base rate Fig 27: Banks’ ALR vs. 12-mth fixed deposit rate
3.61
3.02
3.09
3.43
2.90
3.10
3.30
3.50
3.70
3.90
4.10
Oct-15 Jan-16 Apr-16 Jul-16 Oct-16 Jan-17 Apr-17
Rates (%)
Base Rate (%) 1-wk KLIBOR
1-mth KLIBOR 3-mth KLIBOR
4.59
3.08
0.00
0.50
1.00
1.50
2.00
2.50
3.00
3.50
0.00
1.00
2.00
3.00
4.00
5.00
6.00
7.00
8.00
Ap
r-03
Ap
r-05
Ap
r-07
Ap
r-09
Ap
r-11
Ap
r-13
Ap
r-15
Ap
r-17
ALR - FD Spread
(%)
ALR & FD rate
(%)ALR-FD Spread % (RHS)
ALR % (LHS)
12-month FD rate (LHS)
Source: Bank Negara Malaysia, Affin Hwang Source: Bank Negara Malaysia, Affin Hwang
1 June 2017
Affin Hwang Investment Bank Bhd (14389-U)
Page 9 of 14
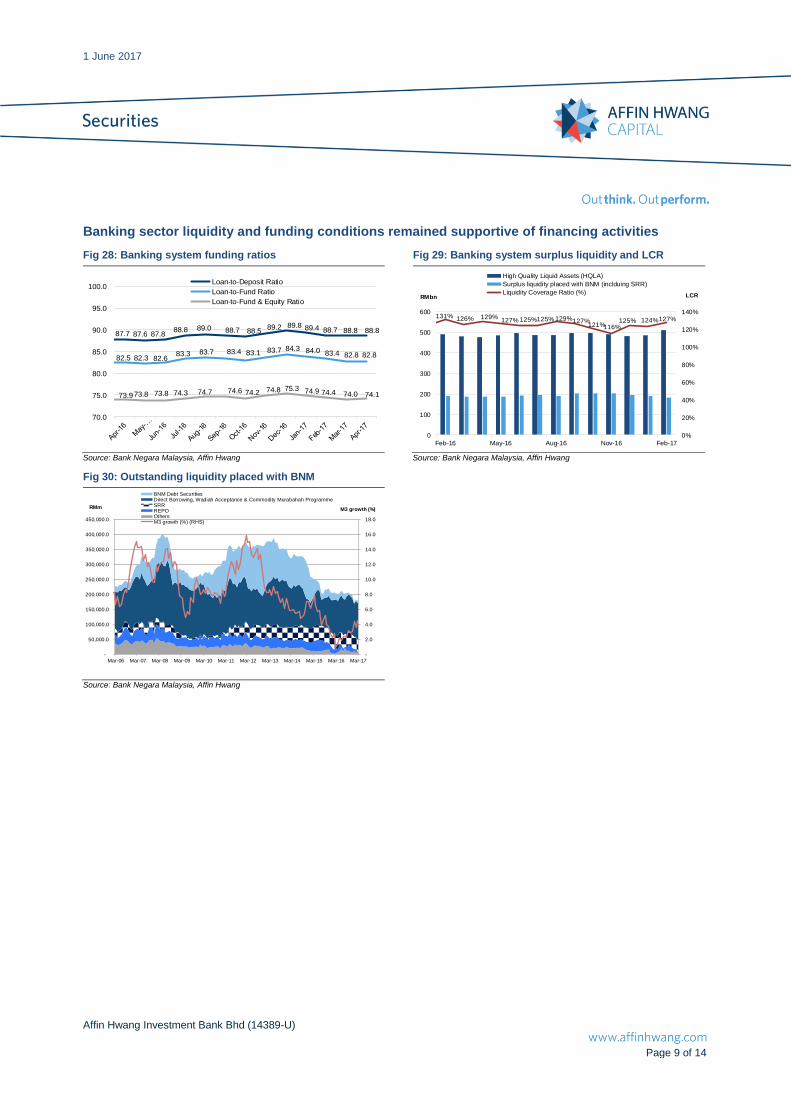
Banking sector liquidity and funding conditions remained supportive of financing activities
Fig 28: Banking system funding ratios Fig 29: Banking system surplus liquidity and LCR
87.7 87.6 87.8 88.8 89.0 88.7 88.5
89.2 89.8 89.4 88.7 88.8 88.8
82.5 82.3 82.6 83.3 83.7 83.4 83.1 83.7 84.3 84.0 83.4 82.8 82.8
73.9 73.8 73.8 74.3 74.7 74.6 74.2 74.8 75.3 74.9 74.4 74.0 74.1
70.0
75.0
80.0
85.0
90.0
95.0
100.0Loan-to-Deposit Ratio
Loan-to-Fund Ratio
Loan-to-Fund & Equity Ratio
131% 126% 129%127% 125%125% 129%127%
121%116%125% 124%127%
0%
20%
40%
60%
80%
100%
120%
140%
0
100
200
300
400
500
600
Feb-16 May-16 Aug-16 Nov-16 Feb-17
High Quality Liquid Assets (HQLA)
Surplus liquidity placed with BNM (inclduing SRR)
Liquidity Coverage Ratio (%)RMbn LCR
Source: Bank Negara Malaysia, Affin Hwang Source: Bank Negara Malaysia, Affin Hwang
Fig 30: Outstanding liquidity placed with BNM
-
2.0
4.0
6.0
8.0
10.0
12.0
14.0
16.0
18.0
-
50,000.0
100,000.0
150,000.0
200,000.0
250,000.0
300,000.0
350,000.0
400,000.0
450,000.0
Mar-06 Mar-07 Mar-08 Mar-09 Mar-10 Mar-11 Mar-12 Mar-13 Mar-14 Mar-15 Mar-16 Mar-17
M3 growth (%)RMm
Outstanding liquidity placed at Bank NegaraBNM Debt SecuritiesDirect Borrowing, Wadiah Acceptance & Commodity Murabahah ProgrammeSRRREPOOthersM3 growth (%) (RHS)
Source: Bank Negara Malaysia, Affin Hwang
1 June 2017
Affin Hwang Investment Bank Bhd (14389-U)
Page 10 of 14
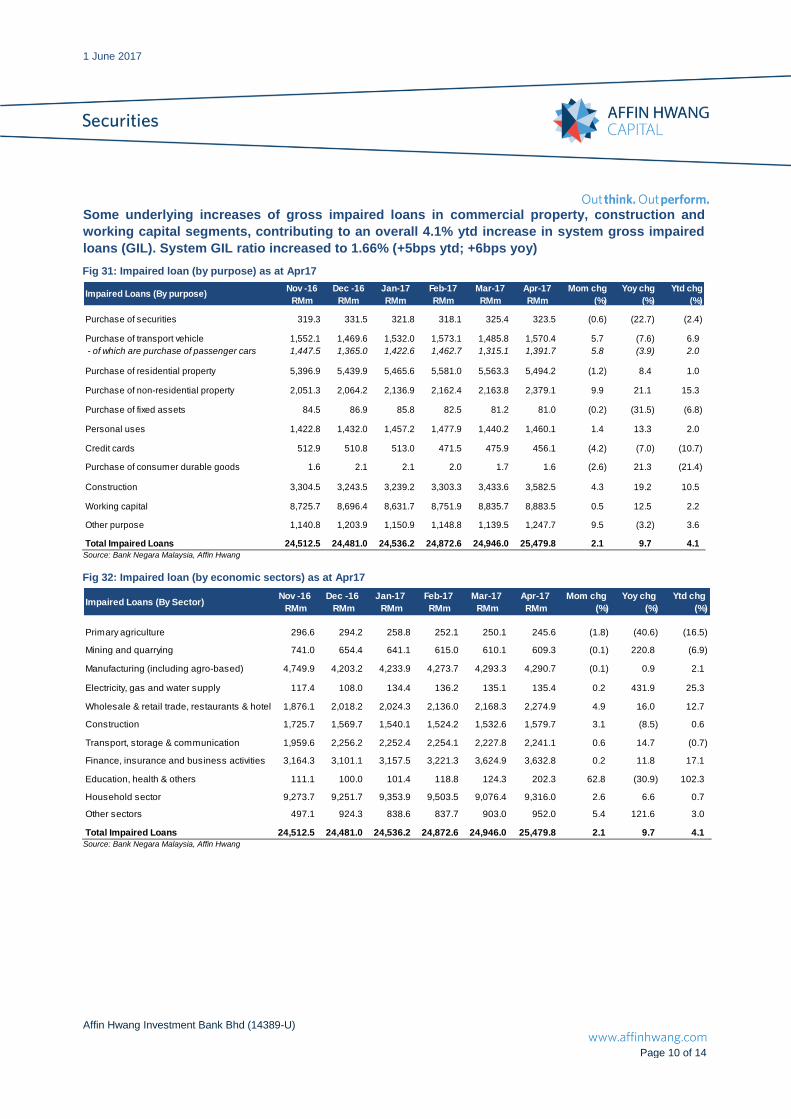
Some underlying increases of gross impaired loans in commercial property, construction and
working capital segments, contributing to an overall 4.1% ytd increase in system gross impaired
loans (GIL). System GIL ratio increased to 1.66% (+5bps ytd; +6bps yoy)
Fig 31: Impaired loan (by purpose) as at Apr17
Impaired Loans (By purpose)Nov -16
RMm
Dec -16
RMm
Jan-17
RMm
Feb-17
RMm
Mar-17
RMm
Apr-17
RMm
Mom chg
(%)
Yoy chg
(%)
Ytd chg
(%)
Purchase of securities 319.3 331.5 321.8 318.1 325.4 323.5 (0.6) (22.7) (2.4)
Purchase of transport vehicle 1,552.1 1,469.6 1,532.0 1,573.1 1,485.8 1,570.4 5.7 (7.6) 6.9
- of which are purchase of passenger cars 1,447.5 1,365.0 1,422.6 1,462.7 1,315.1 1,391.7 5.8 (3.9) 2.0
Purchase of residential property 5,396.9 5,439.9 5,465.6 5,581.0 5,563.3 5,494.2 (1.2) 8.4 1.0
Purchase of non-residential property 2,051.3 2,064.2 2,136.9 2,162.4 2,163.8 2,379.1 9.9 21.1 15.3
Purchase of fixed assets 84.5 86.9 85.8 82.5 81.2 81.0 (0.2) (31.5) (6.8)
Personal uses 1,422.8 1,432.0 1,457.2 1,477.9 1,440.2 1,460.1 1.4 13.3 2.0
Credit cards 512.9 510.8 513.0 471.5 475.9 456.1 (4.2) (7.0) (10.7)
Purchase of consumer durable goods 1.6 2.1 2.1 2.0 1.7 1.6 (2.6) 21.3 (21.4)
Construction 3,304.5 3,243.5 3,239.2 3,303.3 3,433.6 3,582.5 4.3 19.2 10.5
Working capital 8,725.7 8,696.4 8,631.7 8,751.9 8,835.7 8,883.5 0.5 12.5 2.2
Other purpose 1,140.8 1,203.9 1,150.9 1,148.8 1,139.5 1,247.7 9.5 (3.2) 3.6
Total Impaired Loans 24,512.5 24,481.0 24,536.2 24,872.6 24,946.0 25,479.8 2.1 9.7 4.1 Source: Bank Negara Malaysia, Affin Hwang
Fig 32: Impaired loan (by economic sectors) as at Apr17
Impaired Loans (By Sector)Nov -16
RMm
Dec -16
RMm
Jan-17
RMm
Feb-17
RMm
Mar-17
RMm
Apr-17
RMm
Mom chg
(%)
Yoy chg
(%)
Ytd chg
(%)
Primary agriculture 296.6 294.2 258.8 252.1 250.1 245.6 (1.8) (40.6) (16.5)
Mining and quarrying 741.0 654.4 641.1 615.0 610.1 609.3 (0.1) 220.8 (6.9)
Manufacturing (including agro-based) 4,749.9 4,203.2 4,233.9 4,273.7 4,293.3 4,290.7 (0.1) 0.9 2.1
Electricity, gas and water supply 117.4 108.0 134.4 136.2 135.1 135.4 0.2 431.9 25.3
Wholesale & retail trade, restaurants & hotel 1,876.1 2,018.2 2,024.3 2,136.0 2,168.3 2,274.9 4.9 16.0 12.7
Construction 1,725.7 1,569.7 1,540.1 1,524.2 1,532.6 1,579.7 3.1 (8.5) 0.6
Transport, storage & communication 1,959.6 2,256.2 2,252.4 2,254.1 2,227.8 2,241.1 0.6 14.7 (0.7)
Finance, insurance and business activities 3,164.3 3,101.1 3,157.5 3,221.3 3,624.9 3,632.8 0.2 11.8 17.1
Education, health & others 111.1 100.0 101.4 118.8 124.3 202.3 62.8 (30.9) 102.3
Household sector 9,273.7 9,251.7 9,353.9 9,503.5 9,076.4 9,316.0 2.6 6.6 0.7
Other sectors 497.1 924.3 838.6 837.7 903.0 952.0 5.4 121.6 3.0
Total Impaired Loans 24,512.5 24,481.0 24,536.2 24,872.6 24,946.0 25,479.8 2.1 9.7 4.1 Source: Bank Negara Malaysia, Affin Hwang
1 June 2017
Affin Hwang Investment Bank Bhd (14389-U)
Page 11 of 14
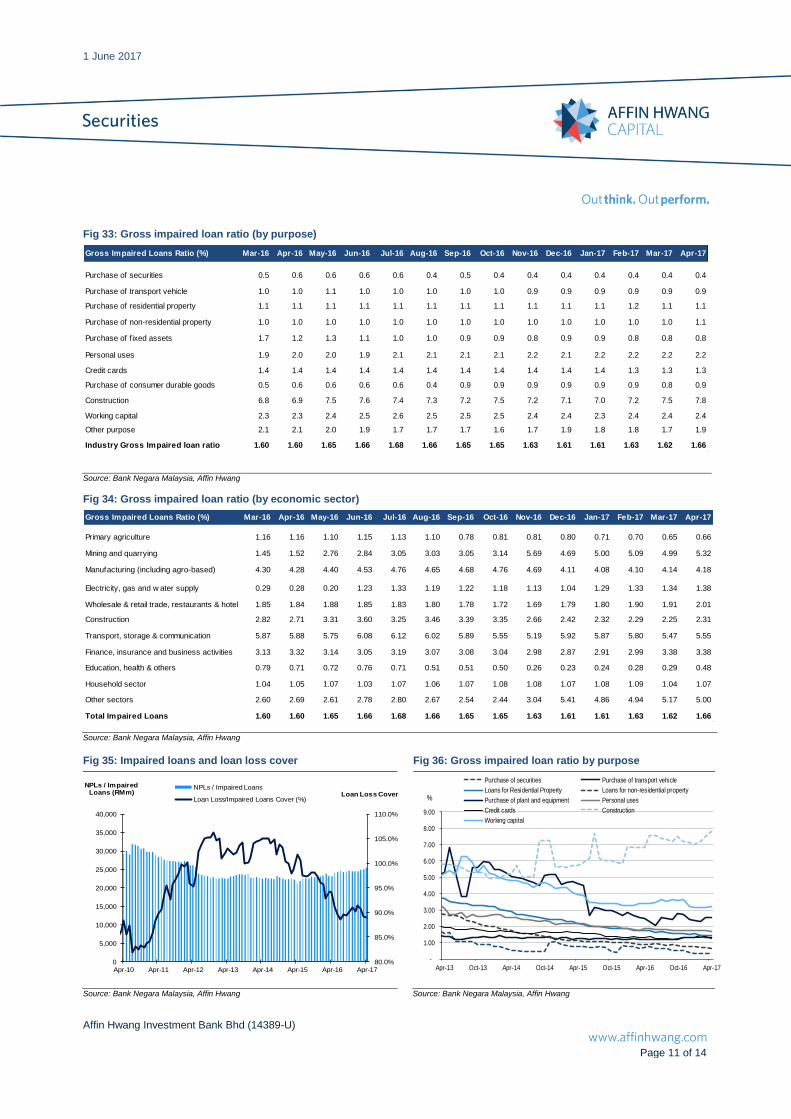
Fig 33: Gross impaired loan ratio (by purpose)
Gross Impaired Loans Ratio (%) Mar-16 Apr-16 May-16 Jun-16 Jul-16 Aug-16 Sep-16 Oct-16 Nov-16 Dec-16 Jan-17 Feb-17 Mar-17 Apr-17
Purchase of securities 0.5 0.6 0.6 0.6 0.6 0.4 0.5 0.4 0.4 0.4 0.4 0.4 0.4 0.4
Purchase of transport vehicle 1.0 1.0 1.1 1.0 1.0 1.0 1.0 1.0 0.9 0.9 0.9 0.9 0.9 0.9
Purchase of residential property 1.1 1.1 1.1 1.1 1.1 1.1 1.1 1.1 1.1 1.1 1.1 1.2 1.1 1.1
Purchase of non-residential property 1.0 1.0 1.0 1.0 1.0 1.0 1.0 1.0 1.0 1.0 1.0 1.0 1.0 1.1
Purchase of f ixed assets 1.7 1.2 1.3 1.1 1.0 1.0 0.9 0.9 0.8 0.9 0.9 0.8 0.8 0.8
Personal uses 1.9 2.0 2.0 1.9 2.1 2.1 2.1 2.1 2.2 2.1 2.2 2.2 2.2 2.2
Credit cards 1.4 1.4 1.4 1.4 1.4 1.4 1.4 1.4 1.4 1.4 1.4 1.3 1.3 1.3
Purchase of consumer durable goods 0.5 0.6 0.6 0.6 0.6 0.4 0.9 0.9 0.9 0.9 0.9 0.9 0.8 0.9
Construction 6.8 6.9 7.5 7.6 7.4 7.3 7.2 7.5 7.2 7.1 7.0 7.2 7.5 7.8
Working capital 2.3 2.3 2.4 2.5 2.6 2.5 2.5 2.5 2.4 2.4 2.3 2.4 2.4 2.4
Other purpose 2.1 2.1 2.0 1.9 1.7 1.7 1.7 1.6 1.7 1.9 1.8 1.8 1.7 1.9
Industry Gross Impaired loan ratio 1.60 1.60 1.65 1.66 1.68 1.66 1.65 1.65 1.63 1.61 1.61 1.63 1.62 1.66
Source: Bank Negara Malaysia, Affin Hwang
Fig 34: Gross impaired loan ratio (by economic sector)
Gross Impaired Loans Ratio (%) Mar-16 Apr-16 May-16 Jun-16 Jul-16 Aug-16 Sep-16 Oct-16 Nov-16 Dec-16 Jan-17 Feb-17 Mar-17 Apr-17
Primary agriculture 1.16 1.16 1.10 1.15 1.13 1.10 0.78 0.81 0.81 0.80 0.71 0.70 0.65 0.66
Mining and quarrying 1.45 1.52 2.76 2.84 3.05 3.03 3.05 3.14 5.69 4.69 5.00 5.09 4.99 5.32
Manufacturing (including agro-based) 4.30 4.28 4.40 4.53 4.76 4.65 4.68 4.76 4.69 4.11 4.08 4.10 4.14 4.18
Electricity, gas and w ater supply 0.29 0.28 0.20 1.23 1.33 1.19 1.22 1.18 1.13 1.04 1.29 1.33 1.34 1.38
Wholesale & retail trade, restaurants & hotel 1.85 1.84 1.88 1.85 1.83 1.80 1.78 1.72 1.69 1.79 1.80 1.90 1.91 2.01
Construction 2.82 2.71 3.31 3.60 3.25 3.46 3.39 3.35 2.66 2.42 2.32 2.29 2.25 2.31
Transport, storage & communication 5.87 5.88 5.75 6.08 6.12 6.02 5.89 5.55 5.19 5.92 5.87 5.80 5.47 5.55
Finance, insurance and business activities 3.13 3.32 3.14 3.05 3.19 3.07 3.08 3.04 2.98 2.87 2.91 2.99 3.38 3.38
Education, health & others 0.79 0.71 0.72 0.76 0.71 0.51 0.51 0.50 0.26 0.23 0.24 0.28 0.29 0.48
Household sector 1.04 1.05 1.07 1.03 1.07 1.06 1.07 1.08 1.08 1.07 1.08 1.09 1.04 1.07
Other sectors 2.60 2.69 2.61 2.78 2.80 2.67 2.54 2.44 3.04 5.41 4.86 4.94 5.17 5.00
Total Impaired Loans 1.60 1.60 1.65 1.66 1.68 1.66 1.65 1.65 1.63 1.61 1.61 1.63 1.62 1.66 Source: Bank Negara Malaysia, Affin Hwang
Fig 35: Impaired loans and loan loss cover Fig 36: Gross impaired loan ratio by purpose
80.0%
85.0%
90.0%
95.0%
100.0%
105.0%
110.0%
0
5,000
10,000
15,000
20,000
25,000
30,000
35,000
40,000
Apr-10 Apr-11 Apr-12 Apr-13 Apr-14 Apr-15 Apr-16 Apr-17
Loan Loss Cover
NPLs / Impaired Loans (RMm)
NPLs / Impaired Loans
Loan Loss/Impaired Loans Cover (%)
-
1.00
2.00
3.00
4.00
5.00
6.00
7.00
8.00
9.00
Apr-13 Oct-13 Apr-14 Oct-14 Apr-15 Oct-15 Apr-16 Oct-16 Apr-17
%
Purchase of securities Purchase of transport vehicle
Loans for Residential Property Loans for non-residential property
Purchase of plant and equipment Personal uses
Credit cards Construction
Working capital
Source: Bank Negara Malaysia, Affin Hwang Source: Bank Negara Malaysia, Affin Hwang
1 June 2017
Affin Hwang Investment Bank Bhd (14389-U)
Page 12 of 14
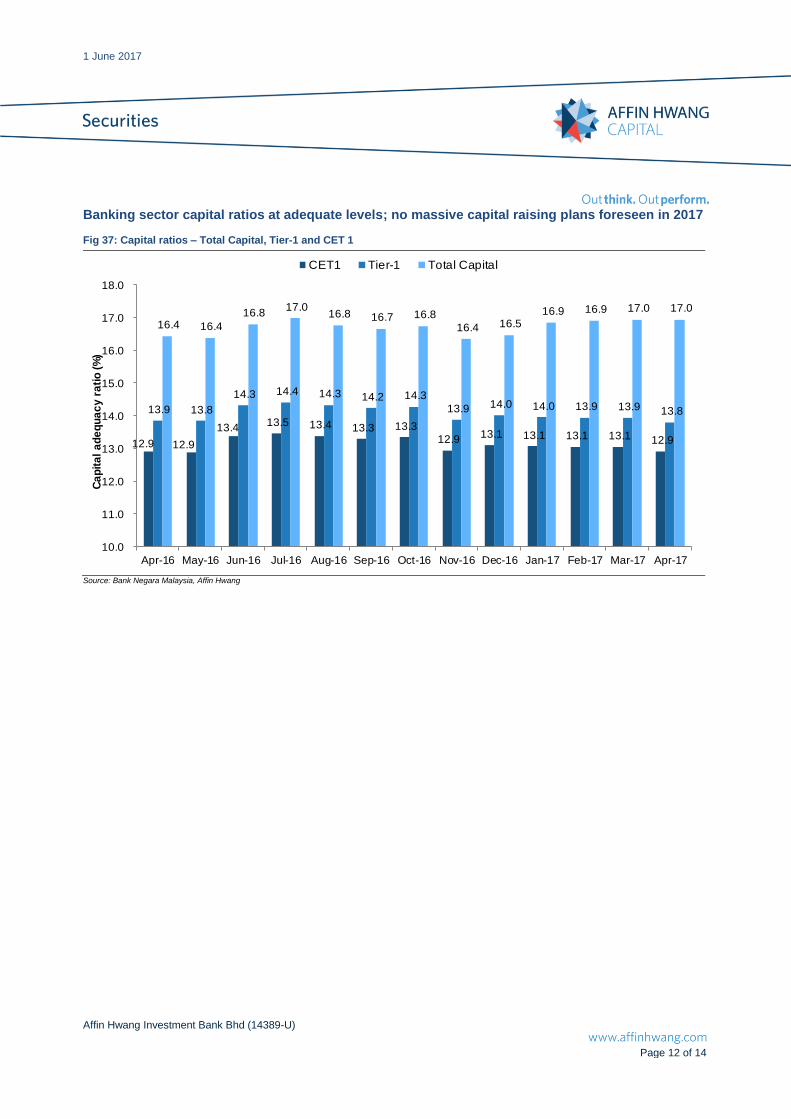
Banking sector capital ratios at adequate levels; no massive capital raising plans foreseen in 2017
Fig 37: Capital ratios – Total Capital, Tier-1 and CET 1
12.9 12.9
13.4 13.5 13.4 13.3 13.3
12.9 13.1 13.1 13.1 13.1 12.9
13.9 13.8
14.3 14.4 14.3 14.2 14.3
13.9 14.0 14.0 13.9 13.9 13.8
16.4 16.4
16.8 17.0
16.8 16.7 16.8
16.4 16.5 16.9 16.9 17.0 17.0
10.0
11.0
12.0
13.0
14.0
15.0
16.0
17.0
18.0
Apr-16 May-16 Jun-16 Jul-16 Aug-16 Sep-16 Oct-16 Nov-16 Dec-16 Jan-17 Feb-17 Mar-17 Apr-17
Ca
pit
al
ad
eq
ua
cy r
ati
o (
%)
CET1 Tier-1 Total Capital
Source: Bank Negara Malaysia, Affin Hwang
1 June 2017
Affin Hwang Investment Bank Bhd (14389-U)
Page 13 of 14
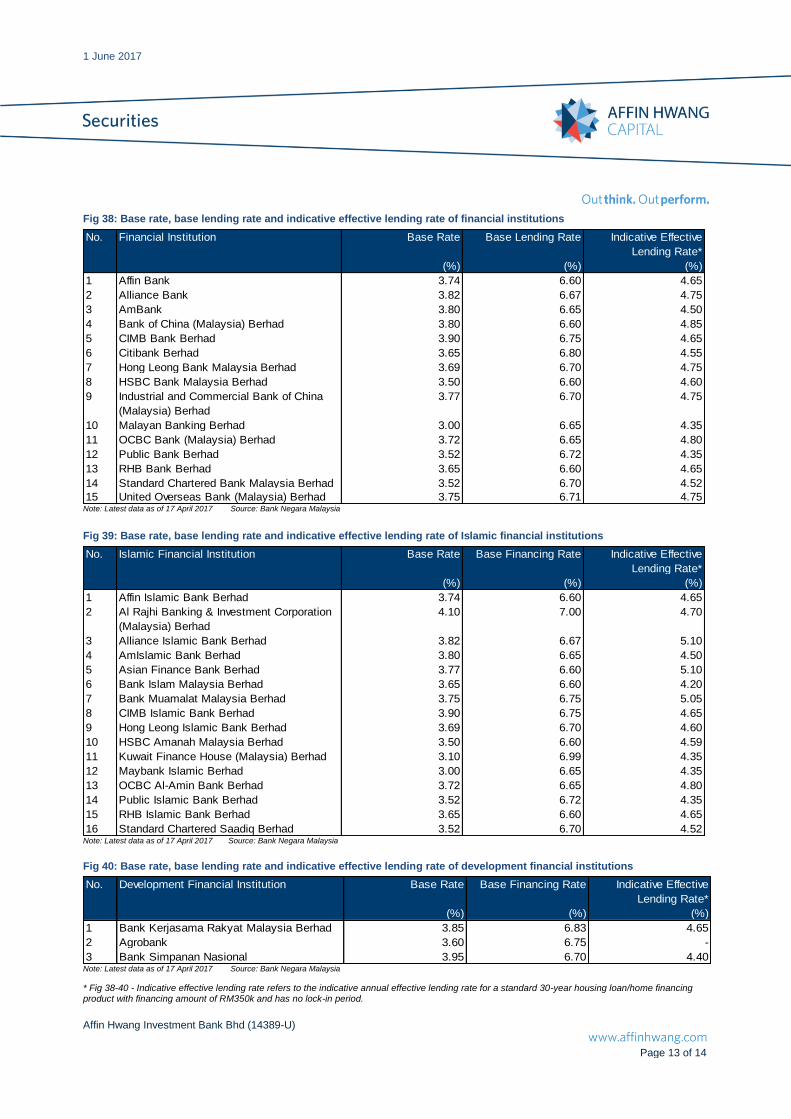
Fig 38: Base rate, base lending rate and indicative effective lending rate of financial institutions
No. Financial Institution Base Rate Base Lending Rate Indicative Effective
Lending Rate*
(%) (%) (%)
1 Affin Bank 3.74 6.60 4.65
2 Alliance Bank 3.82 6.67 4.75
3 AmBank 3.80 6.65 4.50
4 Bank of China (Malaysia) Berhad 3.80 6.60 4.85
5 CIMB Bank Berhad 3.90 6.75 4.65
6 Citibank Berhad 3.65 6.80 4.55
7 Hong Leong Bank Malaysia Berhad 3.69 6.70 4.75
8 HSBC Bank Malaysia Berhad 3.50 6.60 4.60
9 Industrial and Commercial Bank of China
(Malaysia) Berhad
3.77 6.70 4.75
10 Malayan Banking Berhad 3.00 6.65 4.35
11 OCBC Bank (Malaysia) Berhad 3.72 6.65 4.80
12 Public Bank Berhad 3.52 6.72 4.35
13 RHB Bank Berhad 3.65 6.60 4.65
14 Standard Chartered Bank Malaysia Berhad 3.52 6.70 4.52
15 United Overseas Bank (Malaysia) Berhad 3.75 6.71 4.75 Note: Latest data as of 17 April 2017 Source: Bank Negara Malaysia
Fig 39: Base rate, base lending rate and indicative effective lending rate of Islamic financial institutions
No. Islamic Financial Institution Base Rate Base Financing Rate Indicative Effective
Lending Rate*
(%) (%) (%)
1 Affin Islamic Bank Berhad 3.74 6.60 4.65
2 Al Rajhi Banking & Investment Corporation
(Malaysia) Berhad
4.10 7.00 4.70
3 Alliance Islamic Bank Berhad 3.82 6.67 5.10
4 AmIslamic Bank Berhad 3.80 6.65 4.50
5 Asian Finance Bank Berhad 3.77 6.60 5.10
6 Bank Islam Malaysia Berhad 3.65 6.60 4.20
7 Bank Muamalat Malaysia Berhad 3.75 6.75 5.05
8 CIMB Islamic Bank Berhad 3.90 6.75 4.65
9 Hong Leong Islamic Bank Berhad 3.69 6.70 4.60
10 HSBC Amanah Malaysia Berhad 3.50 6.60 4.59
11 Kuwait Finance House (Malaysia) Berhad 3.10 6.99 4.35
12 Maybank Islamic Berhad 3.00 6.65 4.35
13 OCBC Al-Amin Bank Berhad 3.72 6.65 4.80
14 Public Islamic Bank Berhad 3.52 6.72 4.35
15 RHB Islamic Bank Berhad 3.65 6.60 4.65
16 Standard Chartered Saadiq Berhad 3.52 6.70 4.52 Note: Latest data as of 17 April 2017 Source: Bank Negara Malaysia
Fig 40: Base rate, base lending rate and indicative effective lending rate of development financial institutions
No. Development Financial Institution Base Rate Base Financing Rate Indicative Effective
Lending Rate*
(%) (%) (%)
1 Bank Kerjasama Rakyat Malaysia Berhad 3.85 6.83 4.65
2 Agrobank 3.60 6.75 -
3 Bank Simpanan Nasional 3.95 6.70 4.40 Note: Latest data as of 17 April 2017 Source: Bank Negara Malaysia
* Fig 38-40 - Indicative effective lending rate refers to the indicative annual effective lending rate for a standard 30-year housing loan/home financing product with financing amount of RM350k and has no lock-in period.
1 June 2017
Affin Hwang Investment Bank Bhd (14389-U)
Page 14 of 14
Equity Rating Structure and Definitions
BUY Total return is expected to exceed +10% over a 12-month period
HOLD Total return is expected to be between -5% and +10% over a 12-month period
SELL Total return is expected to be below -5% over a 12-month period
NOT RATED Affin Hwang Investment Bank Berhad does not provide research coverage or rating for this company. Report is intended as information
only and not as a recommendation
The total expected return is defined as the percentage upside/downside to our target price plus the net dividend yield over the next 12 months.
OVERWEIGHT Industry, as defined by the analyst’s coverage universe, is expected to outperform the KLCI benchmark over the next 12 months
NEUTRAL Industry, as defined by the analyst’s coverage universe, is expected to perform inline with the KLCI benchmark over the next 12 months
UNDERWEIGHT Industry, as defined by the analyst’s coverage universe is expected to under-perform the KLCI benchmark over the next 12 months
This report is intended for information purposes only and has been prepared by Affin Hwang Investment Bank Berhad (14389-U) (“the Company”) based on sources believed to be reliable. However, such sources have not been independently verified by the Company, and as such the Company does not give any guarantee, representation or warranty (express or implied) as to the adequacy, accuracy, reliability or completeness of the information and/or opinion provided or rendered in this report. Facts, information, views and/or opinion presented in this report have not been reviewed by, may not reflect information known to, and may present a differing view expressed by other business units within the Company, including investment banking personnel. Reports issued by the Company, are prepared in accordance with the Company’s policies for managing conflicts of interest arising as a result of publication and distribution of investment research reports. Under no circumstances shall the Company, its associates and/or any person related to it be liable in any manner whatsoever for any consequences (including but are not limited to any direct, indirect or consequential losses, loss of profit and damages) arising from the use of or reliance on the information and/or opinion provided or rendered in this report. Any opinions or estimates in this report are that of the Company, as of this date and subject to change without prior notice. Under no circumstances shall this report be construed as an offer to sell or a solicitation of an offer to buy any securities. The Company and/or any of its directors and/or employees may have an interest in the securities mentioned therein. The Company may also make investment decisions or take proprietary positions that are inconsistent with the recommendations or views in this report. Comments and recommendations stated here rely on the individual opinions of the ones providing these comments and recommendations. These opinions may not fit to your financial status, risk and return preferences and hence an independent evaluation is essential. Investors are advised to independently evaluate particular investments and strategies and to seek independent financial, legal and other advice on the information and/or opinion contained in this report before investing or participating in any of the securities or investment strategies or transactions discussed in this report. Third-party data providers make no warranties or representations of any kind relating to the accuracy, completeness, or timeliness of the data they provide and shall not have liability for any damages of any kind relating to such data. The Company’s research, or any portion thereof may not be reprinted, sold or redistributed without the consent of the Company. The Company, is a participant of the Capital Market Development Fund-Bursa Research Scheme, and will receive compensation for the participation. This report is printed and published by: Affin Hwang Investment Bank Berhad (14389-U) A Participating Organisation of Bursa Malaysia Securities Berhad 22nd Floor, Menara Boustead, 69, Jalan Raja Chulan, 50200 Kuala Lumpur, Malaysia. T : + 603 2146 3700 F : + 603 2146 7630 [email protected] www.affinhwang.com