Embed Size (px)
Citation preview

European Scientific Journal May 2017 edition Vol.13, No.13 ISSN: 1857 – 7881 (Print) e - ISSN 1857- 7431
175
System Dynamics and KPI’s Definition in the Automotive Sector
Omar Villa Nevarez, PhD Universidad Popular Autónoma del Estado de Puebla, México
Maria Guadalupe Lopez Molina, PhD Universidad Iberoamericana Puebla, México
Juan Alfredo Lino Gamino, PhD Universidad de Colima, México
doi: 10.19044/esj.2017.v13n13p175 URL:http://dx.doi.org/10.19044/esj.2017.v13n13p175
Abstract In Mexico, the Automotive Industry is one of the most important sectors, based on the amount of sales, as well as for the number of people employed. The level of competition facing firms to win OEM programs requires having a very strict control over the whole company’s operation. System Dynamics is presented as a very powerful methodology for modeling the current and future situation of a company and combined with the Balanced scorecard concept, both provide a deep insight into the dynamics of the company. Based on this case of study a new methodology is proposed which provides a deeper insight on how the system works in such a way that the development of the company’s strategy has greater impact. Through the simulation of 24 months into the future it is possible to understand the system´s behavior in terms of the interrelation of the most critical variables which were defined as the main KPI´s.
Keywords: System Dynamics, Balanced Scorecard, KPI, Strategy Introduction In Mexico, the automotive sector is one of the strategical economic pillars, because it provides benefits such as jobs creation, tax revenues, staff training, development of suppliers and the related technological modernization. The development of the automotive industry in Mexico is the result of a series of events and transformations that include the evolution towards the globalization and the alignment to the industrial policy (Vicencio Miranda, 2007). In May 2014, 287,488 units were produced, higher in 12.5% regarding the 255,474 units produced in May 2013, whereas the annual cumulative was 1,310,250 units produced in Mexico on 2014, 7.2% more

European Scientific Journal May 2017 edition Vol.13, No.13 ISSN: 1857 – 7881 (Print) e - ISSN 1857- 7431
176
than the production of last year. In addition to the above mentioned, Mexico had the highest growth rate of 19.2% of exporting light vehicles to U.S.A. Between the years 2013 y 2014, such growth was compared with countries such as Japan, Germany and Korea among others (Asociación Mexicana de la Industria Automotriz, 2014). In this context, it should be stated that the automotive industry of terminal assembly and auto parts have gone in the last decades through a rapid process of productive integration and technological evolution. This industrial sector has processes which provide added value to its customers and at the same time provides the financial result to evaluate, among others, real profitability indicators of this business. The operational processes are the main subject regarding the steps of value creation in the organizations. These processes involve concepts such as efficiency, just in time delivery of the products or services, among others. Even though these activities could easily exist in any industrial sector, nowadays the key for an effective strategic planning shall be find in the identification of the indicators of the value chain, so they can really show what is happening in the business process. For the above mentioned, it is important to identify those indicators that allow to know in a quantifiable way the performance of the company. Having mentioned this, the proposal of this document is to define an indicator’s model using System Dynamics as the basis of the methodology to make a Balanced Scorecard with the purpose of identifying the variables that take part in the profit acquisition in a corporation of auto parts sector. The importance of the KPI (Key Performance Indicator) The auto parts industry is one of the more complex sectors and with a lot of variables hidden in the productive system. The information may not be available and it is necessary to search for it to know the process performance. It is necessary to identify for the different business processes those activities that add value and then decide how to measure every part through the identification of the indicators that provide real information about what is happening in the operation. Many corporations are working with the wrong measurements, which are wrongly named “Key Performance Indicators”. Only some enterprises really track their true KPIs. The reason is that the upper management, managers, research professionals and consultants have no knowledge about what really is a KPI (Parmenter, 2010). The system dynamics approach System Dynamics is the starting point to shift the view regarding the traditional management towards the development of strategies and the decision-making process, to understand the performance of a more complex system. System Dynamics focuses in the understanding of the feedback
European Scientific Journal May 2017 edition Vol.13, No.13 ISSN: 1857 – 7881 (Print) e - ISSN 1857- 7431
177
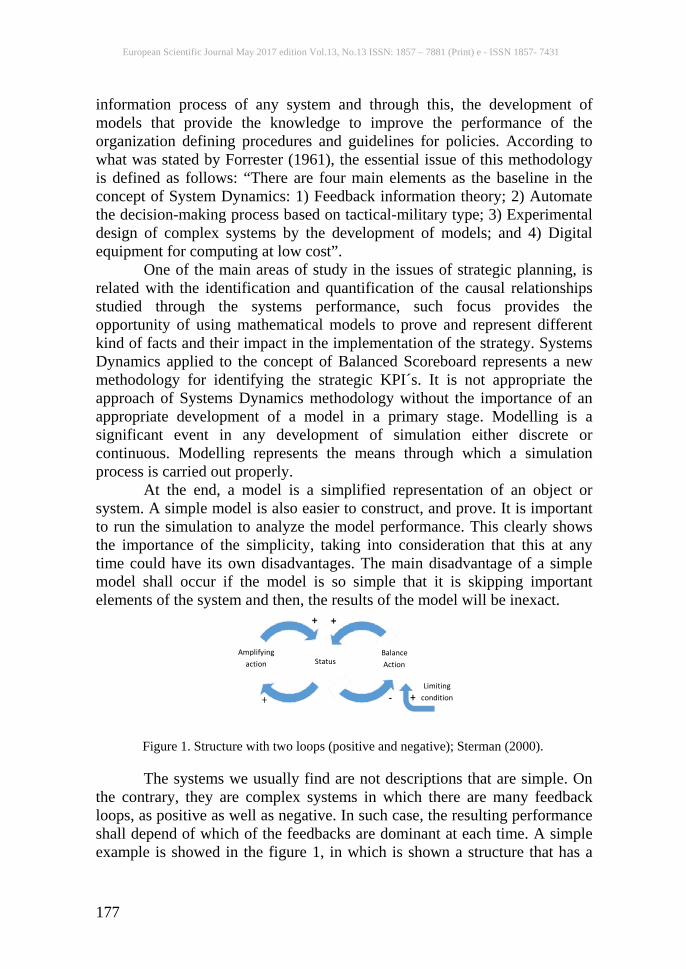
information process of any system and through this, the development of models that provide the knowledge to improve the performance of the organization defining procedures and guidelines for policies. According to what was stated by Forrester (1961), the essential issue of this methodology is defined as follows: “There are four main elements as the baseline in the concept of System Dynamics: 1) Feedback information theory; 2) Automate the decision-making process based on tactical-military type; 3) Experimental design of complex systems by the development of models; and 4) Digital equipment for computing at low cost”. One of the main areas of study in the issues of strategic planning, is related with the identification and quantification of the causal relationships studied through the systems performance, such focus provides the opportunity of using mathematical models to prove and represent different kind of facts and their impact in the implementation of the strategy. Systems Dynamics applied to the concept of Balanced Scoreboard represents a new methodology for identifying the strategic KPI´s. It is not appropriate the approach of Systems Dynamics methodology without the importance of an appropriate development of a model in a primary stage. Modelling is a significant event in any development of simulation either discrete or continuous. Modelling represents the means through which a simulation process is carried out properly. At the end, a model is a simplified representation of an object or system. A simple model is also easier to construct, and prove. It is important to run the simulation to analyze the model performance. This clearly shows the importance of the simplicity, taking into consideration that this at any time could have its own disadvantages. The main disadvantage of a simple model shall occur if the model is so simple that it is skipping important elements of the system and then, the results of the model will be inexact.
Figure 1. Structure with two loops (positive and negative); Sterman (2000).
The systems we usually find are not descriptions that are simple. On the contrary, they are complex systems in which there are many feedback loops, as positive as well as negative. In such case, the resulting performance shall depend of which of the feedbacks are dominant at each time. A simple example is showed in the figure 1, in which is shown a structure that has a
Figura 1 Estructura formada por dos bucles (positivo y negativo)
Amplifyingaction Status
Balance Action
Limitingcondition
Figure 1. Structure with two loops (positive and negative); Sterman (2000)

European Scientific Journal May 2017 edition Vol.13, No.13 ISSN: 1857 – 7881 (Print) e - ISSN 1857- 7431
178
positive feedback with a negative feedback. With the help of the systems dynamics, it is possible to represent a system through flows, levels and auxiliaries diagram. By abstracting the system, the corresponding equations should be established to study its performance, which are represented as follows:
𝑁(𝑡) = 𝑁(𝑡 − 𝑑𝑡) + [𝐸 − 𝑆]𝑑𝑡 Equation 1 This equation shows the amount of units that a level has according with previous amount and the differences among the ratios of inputs and outputs. The difference is that, in a strict way, it is the calculation of the actual level of accumulation from the last level. Advantages of Systems Dynamics versus the empiric BSC model Traditionally, the normal procedure for the strategic planning was that each functional area of business establishes its own plan, based in the financial measurements. The scope of the BSC is to implement and to explain the strategy of the enterprise through four perspectives (Kaplan, & Norton, 2004). In the last two decades, the development and implementation of measurement systems of multidimensional performance and strategic management systems have been subject of study and analysis in relation to the concept of system thinking. Specially, the Balanced Scorecard has become increasingly a recognized relevance in the business organizations. (Barnabé, 2011) The empiric BSC has some advantages, as follows (Akkermans, 2002): • Checking with few numbers: To check the development of the Enterprise
by means of few indicators (three to five) to every one of the four viewpoints.
• Closing different issues: Link financial and non-financial measurements by joining together the performance of different areas of the Enterprise.
However, Akkermans (2002) also has mentioned the disadvantages of implementing by itself the BSC, as follows: • The unidirectional causality is too simplified. • There is no time separation between cause and effect. This is because the time doesn’t take part in the process, for what it is not considered the delay existing between them. • There is no mechanism to validate: The event to check few indicators reduces the possibility to identify the measurable parameters and relevant for performance. • Insufficient links between the strategy and the operations: There is no integration between the high-level strategy and the operative level; in

European Scientific Journal May 2017 edition Vol.13, No.13 ISSN: 1857 – 7881 (Print) e - ISSN 1857- 7431
179
addition to visualize the performance as a vertical process, instead of a multidirectional. The main purpose of this document is to present a methodology to develop a Balanced Scorecard using System Dynamics in a sequential and logical approach. This methodology can bring substantial benefits if applied correctly to the private sector, industrial or services, to governments as well as the academic institutions. Methodology Levels and Flows diagram formulation There are several alternatives to model System Dynamics; within the most complete for the development of these models, for the specific case of this study, it was used iThink software to simulate the dynamic process of a tier 2 automotive company that manufactures cable protection systems. The following is the model proposed for this company in terms of a level, flows and auxiliaries diagram (Diagram 1):
Diagram 1. Flows and Levels Diagram of TIER 2 Automotive Plant. Own source (2016). Along with the design, is the formulation of the equations, which depends on the type of variable that represents based on System Dynamics, for example: • In the case of level variables

European Scientific Journal May 2017 edition Vol.13, No.13 ISSN: 1857 – 7881 (Print) e - ISSN 1857- 7431
180
The level variables are a numerical integrator or accumulator, because it performs a series of sums for the level value versus time. Notation described in iThink for numerical integration process is as follows (IseeSystems, 2015): 𝑁(𝑡) = 𝑁(𝑡 − 𝑑𝑡) + (𝐸 − 𝑆)𝑑𝑡 Equation 2 The above equation means that the level in each time is equivalent to the previous time plus the difference in its flows. • In the case of flow variables Flow variables feed or discharge levels based on time and depending also in other flow variables as well as auxiliary variables, which can be expressed as follows (Zill, 2009):
𝐹(𝑡,𝑋) = �𝐴 𝑠𝑖 𝑥𝑖 < 𝑎𝐵 𝑠𝑖 𝑎 ≤ 𝑥𝑗 ≤ 𝑏
⋮ Equation 3
Where F (t) is the flow in terms of time, A and B are values of the flow depending on the condition and X: = {x1, x2, ..., xi, xj, ...} are variables that determine the flows, which can be level or auxiliary variables. In the case of auxiliary variables The auxiliary variables have different formulas, as they may represent indexes (ratios), variations or binary operations, therefore a specific equation cannot be assigned. The next step in the proposed methodology is to break the model in its different parts according to the Balanced scorecard subsystems (perspectives) and the variables though which each subsystem interacts with the others. Identification of the KPI´s with system dynamics. The strategic map is the systemic way for showing the balanced scoreboard. It must be identified which KPI correspond to which perspective, this can be known through the nature and units of the variable. In addition, every model has a starting point, which for this study problem is the sales forecast. Business Process Perspective The model starts from the historical sales information from the company for the past 24 months. The data was adjusted through a nonlinear model to find its behavior. The adjusted equation as mentioned corresponds to a nonlinear model, which is expressed in the sales forecast (Zill, 2009): 𝑃𝑉 = asin(𝑏𝑡 + 𝑐) + 𝑑 cos(𝑓𝑡 + 𝑔) + 𝑃𝑉0 Equation 4 The adjustment model is based on the harmonic behavior of the trigonometric functions "sine" and "cosine", because the data are oscillations, which can be represented using these functions. By emptying the information of the total sales of the last 24 months in Polymath, which is a software tool

European Scientific Journal May 2017 edition Vol.13, No.13 ISSN: 1857 – 7881 (Print) e - ISSN 1857- 7431
181
that can perform the least-squares adjustment, the following equation (Shacham, Cutlip, & Elly, 2004) was obtained: 𝑃𝑉 = 2 ∗ 105 sin(0.2758836𝑡 + 1.092328) + 2.02
∗ 105 cos(−10.54324𝑡 + 98.25961) + 2.842∗ 106
Equation 5
Diagram 2. Subsystem of sales forecast and pending orders. Own source (2016).
The flow of sales forecast is the input for the production schedule which is expressed as an auxiliary variable or converter, likewise, it is intended to allow the transition to the subsystem perspective of business process, feeding two streams: the acceptable product and the rejected product (Diagram 3).
Diagram 3. Representation of a link model between sales forecasting and the information
input to the subsystem of business process perspective. Own Source (2016). Once in this subsystem, based on the number of meters produced in past, the performance of the business perspective based on the simulation on the upcoming 24 months can be explained by the following graph (Figure 2):

European Scientific Journal May 2017 edition Vol.13, No.13 ISSN: 1857 – 7881 (Print) e - ISSN 1857- 7431
182
Figure 2. Inventory level. Own Source (2016).
The historical information used the inventory level initiates at 1,000,000 meters which is about 50% of the historical average monthly production of the last 24 months (Figure 2). The model suggests that the scrap level, initially, should accumulate between 2 and 5 months before taking the decision to recycle, this is to ensure a steady flow of recycling of plastic tubes. Scrap level under these conditions, starting from the first 24 months and extrapolating the next 24 months, this level would range between 217314 and 403710 meters of product (Figure 3).
Figure 3. Comparison between the Scrap level and its flows. Own source (2016).
Based on iThink notation, the equation describing the dynamic behavior of Scrap level is as follows (IseeSystems, 2015): 𝑆𝐶𝑅𝐴𝑃(𝑡) = 𝑆𝐶𝑅𝐴𝑃(𝑡 − 𝑑𝑡) + �𝑃𝑅𝑒𝑗𝑒𝑐𝑡𝑒𝑑 − 𝑃𝑅𝑒𝑝𝑟𝑜𝑐𝑒𝑠𝑠𝑒𝑑 − 𝑃𝑅𝑒𝑐𝑦𝑐𝑙𝑒𝑑�𝑑𝑡 Equation 6 Customer perspective The model defined for the simulation has 7 elements in it and one transition variable, the latter is the rate of compliance (Diagram 4). The items are classified as follows:
European Scientific Journal May 2017 edition Vol.13, No.13 ISSN: 1857 – 7881 (Print) e - ISSN 1857- 7431
183
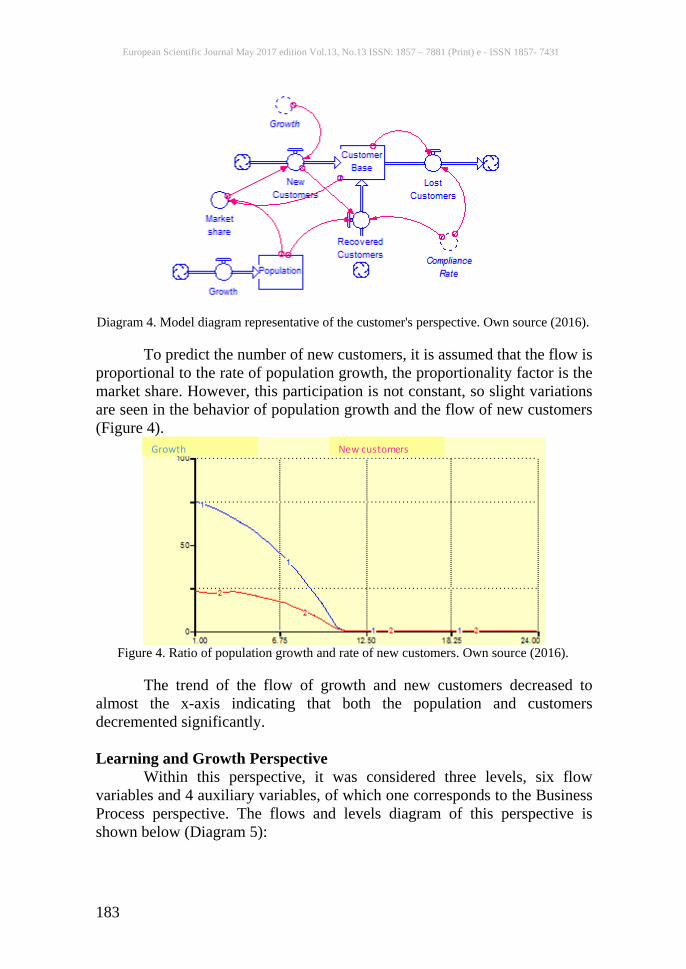
Diagram 4. Model diagram representative of the customer's perspective. Own source (2016). To predict the number of new customers, it is assumed that the flow is proportional to the rate of population growth, the proportionality factor is the market share. However, this participation is not constant, so slight variations are seen in the behavior of population growth and the flow of new customers (Figure 4).
Figure 4. Ratio of population growth and rate of new customers. Own source (2016).
The trend of the flow of growth and new customers decreased to almost the x-axis indicating that both the population and customers decremented significantly. Learning and Growth Perspective Within this perspective, it was considered three levels, six flow variables and 4 auxiliary variables, of which one corresponds to the Business Process perspective. The flows and levels diagram of this perspective is shown below (Diagram 5):
Growth New customers

European Scientific Journal May 2017 edition Vol.13, No.13 ISSN: 1857 – 7881 (Print) e - ISSN 1857- 7431
184
Diagram 5 Learning and Growth Perspective. Own source (2016).
The subsystem begins with the flow of personnel update, which refers to the number of workers who have been trained and require refresher training to keep their skills; said flow fed to level with the same name. In turn, flows of hiring and firing are linked to it, with input and output, respectively. The flow of recruitments feeds at this level because new staff is placed before receiving training, this flow allows the entry of a limited number of people, until it reaches the limit of the capacity of staff; while layoffs are due to those who do not possess the required skills and, as a last resort, they are dismissed. The last flow, called "untrained personnel" are those who are sent to be trained (represented by the level of staff training) to meet the needs of the company, as is to lower the rate of rejection. After the training, it leaves a certain number of employees (those who have successfully completed training and have developed their skills) which feed the level of "trained personnel".

European Scientific Journal May 2017 edition Vol.13, No.13 ISSN: 1857 – 7881 (Print) e - ISSN 1857- 7431
185
Financial Perspective
Diagram 6. Financial Perspective. Own source (2016).
The subsystem in reference to this perspective is linked to the perspective of business process through the flow of total deliveries, which represents the total sales multiplied by sales price, this information enters the flow of gross margin which is given in terms of total sales minus the cost of production. This flow feeds the only defined level in this perspective which is profit, this accumulator is the result of gross margin flow minus the sum of the flows of fixed expenses, taxes and investments. In each of these last three flows the values taken are given from the historical data of the company. Results Based on the structure and operation of the SD-based model, it is necessary to return to the concepts of levels, flows and auxiliaries to determine the KPIs that should be in the Balanced Scorecard. The first thing that needs to be noted is the concept of Level, which, seen from the development of this model represents the accumulation at any time of the units of each of the perspectives. However, level variables are not the only KPIs that can be seen in the model. Flow and auxiliary variables can also be presented as key indicators to provide accurate information about what happens in the company. Once the KPIs are identified following the System Dynamics methodology through the levels, flows and auxiliares diagram, they should be translated into the Balanced Scorecard based on Kaplan and Norton, which are shown in the table below (Table 1):

European Scientific Journal May 2017 edition Vol.13, No.13 ISSN: 1857 – 7881 (Print) e - ISSN 1857- 7431
186
Table 1. Balanced Scorecard, Own source (2016).
Based on Kaplan and Norton (2004), it is necessary to formulate a strategy with the KPIs mentioned above. The strategy to be developed must be in the form of a map, which should show: 1. Cause-and-effect relationships: Defines the chain of logic by which intangible assets would be transformed into tangible value. 2. Value proposal for the customer: Clarifies the conditions that will create value for the client. 3. Value Creation Processes: Defines the processes that will transform intangible assets into customer and financial outflows. 4. Asset and Activity Grouping: Defines intangible assets that must be aligned and integrated to create the value. However, according to Akkermans (2002), one of the disadvantages of the Balanced Scorecard is the unidirectional causality that is too simplified, that is, the verticality of the KPIs does not simulate the actual behavior of the company. Therefore, when using SD, we can indicate the causality flows with feedback, since this describes the behavior better. Based on the decisions to be taken by the management of the company, in relation to the behavior and identification of causalities, it can be said that the best way to structure a strategic map is not the Kaplan and Norton proposal, but a map which contains the same as those authors expressed in 2004, but which represents what was established by the SD. The proposal of this document is given in four steps for the development of a SD model that can be applied in
Objectives Indicator [Units] Objectives Indicator [Units]Increase the value of the company's profits
Profit [$]
Improve gross margin Gross margin [$/month] Increase or maintain forecasts Rejection rate (m/month)Sales forecast (m/month)
Deliver the required amount of product on time Total deliveries (m/month)
Reduce production cost Production cost [$/month]
Increase income Income [$]
Vision and strategy
Objectives Indicator [Units] Objectives Indicator [Units]
Increase or maintain business customers
Keep trained staff
Reduce rejection rateMaintain 200 employees
Stabilize ordersKeep inventory stableReduce or eliminate the defective product
Financial Perspective Internal Processes Perspective
Learning and Growth PerspectiveCustomer Perspective
New customers [customers/month]
Recovered Customers [customers/month]
Employees [employees]Lost customers[customers/month]
Customer base [customers]
Training staff [employees]
Pending orders (m)Inventory (m)Scrap (m)

European Scientific Journal May 2017 edition Vol.13, No.13 ISSN: 1857 – 7881 (Print) e - ISSN 1857- 7431
187
detail to the automotive sector and will allow the development of a Balanced Scorecard. Therefore, four steps are proposed to develop a strategic map from the System Dynamics approach (Diagram 7):
Diagram 7. Four steps for the formulation of a strategic map, Own source (2016).
Conclusion By using a System Dynamics based model, it was determined the variables that should be defined as indicators and transferred to a strategic map, which is the systemic representation of a Balanced Scorecard. In this way it is possible to see with complete clarity the multidirectional influences that have the variables between them independently to the perspective that they belong. By adjusting the model in terms of the Balanced Scorecard the four perspectives allow to lay the foundations for joining the two methodologies, seeking an assertive interpretation of the variables, so that more information and better quality are available for effective decision-making. A key step for this methodological proposal is to break with the verticality of the concept of the strategic map, into a multidirectional influences between the four perspectives that exist in the model. Another key element in this whole process is the identification of transition variables from one perspective to another. Based on the proposed methodology and the simultation of the upcoming 24 months the following strategic map was obtained from the simulation and describes the Balanced Scorecard and its corresponding KPIs for company (Table 2):

European Scientific Journal May 2017 edition Vol.13, No.13 ISSN: 1857 – 7881 (Print) e - ISSN 1857- 7431
188
Table 2. Balanced Scorecard of the company, Own source (2016).
The previous diagram represents the Balanced Scorecard, which takes three out of four elements that should be included according to Kaplan and Norton (1996), such as the KPI, the objective and the goal. Having simulated the upcoming 24 months, it is important to look for a more detailed into the data obtained. Within the financial perspective, total sales represent how successful the company has been in achieving the targets, based on the sales forecast defined. As the following graph shows sales are being met in general, but within a delay of 2 months from the forecasted number. This is reflecting the system´s capacity to react in terms of processing open orders.
Indicator [Units] Objectives Target Indicator [Units] TargetSales [$/month] Increase income U.L.: $8’147,660 U.L.: 1 (Maximum)
: $7’688,582 : 0.92L.L.: $7’249,640 (Minimum) L.L.: 0.813
Production cost [$/month] Reduce production cost U.L.: $4’380,671 (Maximum) U.L.: 2’996,093 (Maintain stable) : $4’134,928 : 2’846,910L.L.: $3’865,294 L.L.: 2’707,138
Gross Margin [$/month] Maintain gross margin U.L. $4’161,215 U.L.:2’993,533 :$3’551,407 : 2’849,827 (Maintain stable)L.L. : $2’967,590 (Minimum) L.L.: 2’703,847
Profit [$] U.L.: $1’474,095 U.L.:381,353 : $1’058,511 : 285,134L.L.: $699,803 (Minimum) L. I.: 160,629 (Maintain stable)
U.L.: 0.1 : 0.075L.L.: 0.05 (Maintain stable)U.L.: 973,033 : 808,881L.L.:646,875 (Minimum)U.L.: 928,192 : 763,299L.L.: 589,803 (Maintain stable)
Vision and Strategy
Indicator [Units] Objectives Target Indicator [Units] TargetU.L.:272 (Maintain stable) U.L.: 35 : 232 : 28 (Maintain stable)L.L.: 30 L.L.: 22U.L.: 16 : 3 (Maintain stable)L.L.: 0U.L.: 6 U.L.: 200 : 3 (Maintain stable) : 200 (Maintain stable)L.L.: 0 L.L.: 198
U.L.: 2
: 1L.L.: 0 (Maintain stable)
Recovered customers [customers/month]
Employees [employees]Maintain 200 employees within the company
Lost customers [customers/month]
Reduce or eliminate the number of lost customers
Increase company's profits
Customer Perspective Learning and Growth PerspectiveObjectives
Customer Based [customers]
Increase or maintain company´s customers
Training staff[employees]
Keep trained staff
New customers [customers/month]
Reduce rejection rate
Reduce or eliminate defective product
Rejection Rate
Invetory [m] Keep inventory stable
Pending orders [m]Deliver the required amount of product on time
Financial Perspective Internal Processes PerspectiveObjectives
Delivery Rate
Stabilize ordersTotal Delivery [m/month]
Sales Forecast [m/month]
Increase or maintain forecasts
Scrap [m]

European Scientific Journal May 2017 edition Vol.13, No.13 ISSN: 1857 – 7881 (Print) e - ISSN 1857- 7431
189
Figure 5. Sales Forecast and Total Sales correlation. Own source (2016).
The simulation reflects that if no decision is made within the business processes there will be no change at all in the behavior of the total sales vs the forecasted number within the next 24 months. Therefore, as the Balanced Scorecard methodology describes it is important to define the activities that can improve the internal processes to meet the sales forecasted or at least be as close as possible. Another important insight in terms of the financial results of the company are given by the Profit expected in the upcoming months in correlation with the Total sales and Gross margin. The following graph shows that if the gross margin keeps in an average of $ 3,536,500.88 and without any other decision to improve it, the profit level will remain as shown for the following 24 months.
Figure 6. Profit, Total Sales and Gross Margin correlation. Own source (2016).
5,000,000.00
5,500,000.00
6,000,000.00
6,500,000.00
7,000,000.00
7,500,000.00
8,000,000.00
8,500,000.00
9,000,000.00
1 2 3 4 5 6 7 8 9 10 11 12 13 14 15 16 17 18 19 20 21 22 23 24
Sales forecast and Total sales correlation
Sales Forecast ($) Total sales ($)
2 months
2 months
Months
0
1000000
2000000
3000000
4000000
5000000
6000000
7000000
8000000
9000000
10000000
1 2 3 4 5 6 7 8 9 10 11 12 13 14 15 16 17 18 19 20 21 22 23 24
Profit, Total Sales and Gross Margin correlation
Profit Total sales Gross Margin
Lineal (Profit) Polinómica (Total sales) Polinómica (Gross Margin)

European Scientific Journal May 2017 edition Vol.13, No.13 ISSN: 1857 – 7881 (Print) e - ISSN 1857- 7431
190
Figure 7. Total Sales and Customer base correlation. Own source (2016).
It is important to analyze the simulation in terms of the sales trend with the customer base for the upcoming 24 months. The previous graph shows how sales will keep its trend between a minumin level of $6,648,959.04 and a maximum of $8,721,296.33 as long as the customer base remains steady at an average of 200 customer base. Going forward it is important to define a better and more robust sales strategy, which should have two approaches: 1. increase the customer base, 2. offer new products to the current customers. To go one step ahead in following the Balanced scorecard methodology it is to defined action plans that can improved the current system behavior. This specific document is not focusing on the actions taken to influence the system, but into the understanding of how the interrelation of the variables should bring important insight in terms of the strategy definition and the decision making process based on the insights provided by the simulation results. Different authors in recent years have stated that the Balanced Scorecard methodology can be completed using the System Dynamics methodology, which has not been clearly described in these studies, how to detail that idea in a case study. The way to implement this methodology as described above is to develop a diagram of levels, flows and auxiliaries to identify the variables of the systems as well as their multidirectional relationships. One of the key concepts to be able to construct a strategic map is the identification of the transition variables, that is, the definition of how one perspective is linked to the others in a multidirectional way. It is in the four main steps referred before that gives the original contribution of this document and manages to assemble two methodologies from a systemic approach.

European Scientific Journal May 2017 edition Vol.13, No.13 ISSN: 1857 – 7881 (Print) e - ISSN 1857- 7431
191
References: 1. Akkermans, H. &. (2002). Developing a Balanced Scorecard with
System Dynamics. The Netherlands: Department of Technology Management. Eindhoven University of Technology.
2. Aracil, J. (1995). Systems Dinamics. ISDEFE. 3. Mexican Automotive Industry Association. (2014). Production and
Export: May and first five month of 2014. Mexico: World Bank. 4. Barnabé, F. (2011). A "System dynamics-based Balanced Scorecard"
to support strategic decision making. International Journal of Productivity and Performance Management".
5. Barnabe, F., & Busco, C. (2012). The causal relationships between performance drivers and outcomes. Journal of Accounting and Organizational Change.
6. Chavan, M. (2009). The balanced scorecard: a new challenge. Journal of Management Development, Vol. 28. Iss 5 pp. 393-406. Macquarie University, North Ryde, Australia.
7. Christopher B. Bingham, K. M. (2011). Which Strategy When? MIT Sloan Mangement Review.
8. Dror, S. (2008). The Balance Scorecard versus quality award models as strategic framework. Total Quality Management.
9. Forrester, J. (1961). Industrial Dynamics. MIT Press. 10. Grobler, A. (2010). An exploratory system dynamics model of
strategic capabilities in manufacturing. Journal of Manufacturing Technology Management.
11. Hoque, Z. (2014). 20 years of studies on the balanced scorecard: Trends, ccomplishments, gaps and opportunities for future research. La Trobe University, Melbourne, Australia.
12. IseeSystems. (2015). iThink 10.1 for Windows. USA. 13. ITAM. (2004). ITAM. (2004).The Auto parts Sector in Mexico:
Diagnosis, Futurology and Strategy. Competitiveness Study Center. 14. Kaplan, R. S., & Norton, D. P. (1996). The balanced scorecard:
translating strategy into action. Boston, Massachusetts: Harvard Business Review Press.
15. Kaplan, R. S, & Norton, D. P. (2004). Strategy Maps: Converting intangible assets into tangible outcomes. Harvard Business Review. Bostom, Massachusetts.
16. Khakbaz, S. B., & Hajiheydari, N. (2015). Proposing a basis methodology for developing balanced scorecard by system dynamics approach. . Faculty of Management, University of Tehran, Theran, Iran.
17. Nielsen, S., & Nielsen, E. H. (2008). System dynamics modelling for a balanced scorecard. Management research news.
European Scientific Journal May 2017 edition Vol.13, No.13 ISSN: 1857 – 7881 (Print) e - ISSN 1857- 7431
192
18. Parmenter, D. (2010). Key Performance Indicators: Developing, Implementing, and Using Winnings KPIs. New Jersey: John Wiley & Sons.
19. Sharma, A. (2009). Implementing Balance Scorecard for Performance Meaurment. The Icfai University Press.
20. Sterman, J. D. (2000). Business Dynamics. McGraw Hill. 21. Vicencio Miranda, A. (2007). The automotive industry in Mexico:
Background, actual status and perspectives. In A. Vicencio Miranda, The consequence of quality and productiveness in the competitiveness of the organizations (pages 211-248). Mexico: National