Embed Size (px)
Citation preview
Home Care KPI’s
Grant Corderoy - Senior PartnerJune 2018
www.stewartbrown.com.au / 2
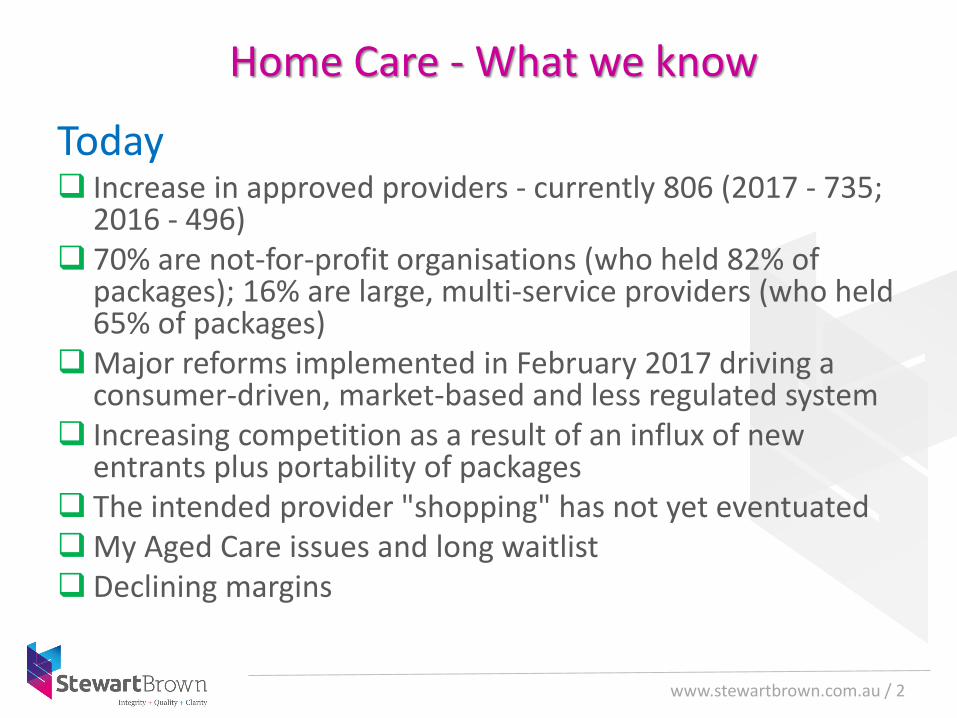
Home Care - What we know
Today Increase in approved providers - currently 806 (2017 - 735;
2016 - 496) 70% are not-for-profit organisations (who held 82% of
packages); 16% are large, multi-service providers (who held 65% of packages)
Major reforms implemented in February 2017 driving a consumer-driven, market-based and less regulated system
Increasing competition as a result of an influx of new entrants plus portability of packages
The intended provider "shopping" has not yet eventuatedMy Aged Care issues and long waitlist Declining margins
www.stewartbrown.com.au / 3
Home Care - What we know
Future Demand and supply: there were over 100,000 consumers on
the My Aged Care waitlist (including those receiving services below their assessed level of need as at December 2017 -this bottleneck should be cleared eventually
Number of packages set to expand significantly to ~140,000 by FY22 (74,205 care recipients at September 2017)
Integration of HCP and CHSP programs expected from 2020 Future reforms expected following the Aged Care Legislated
Review (Tune) Focus on value proposition essential but challenging for
providers
www.stewartbrown.com.au / 4
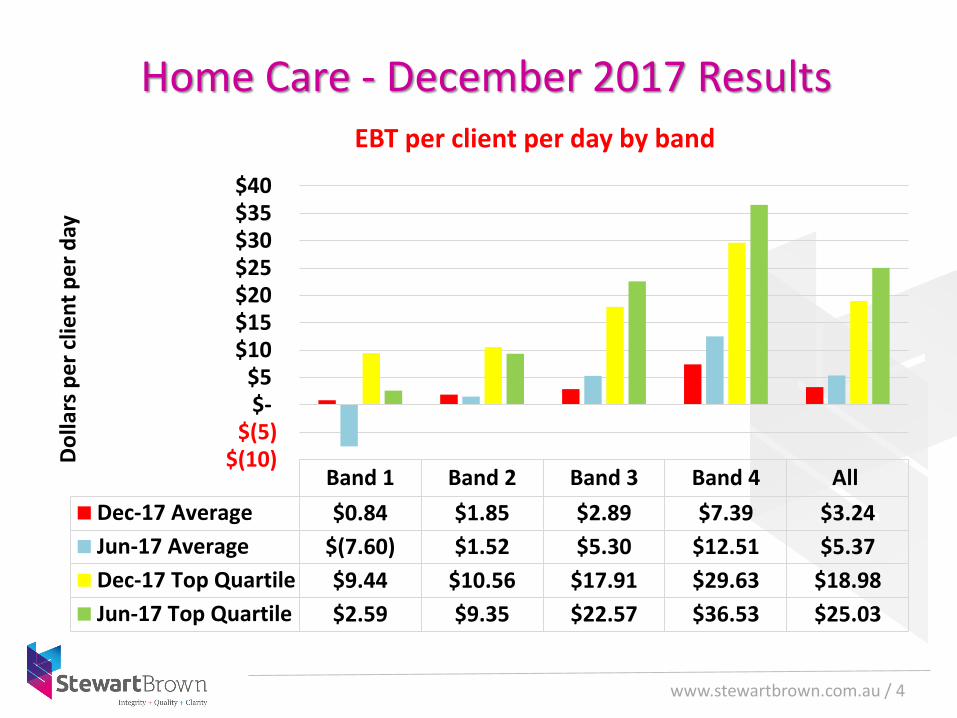
Home Care - December 2017 Results
Band 1 Band 2 Band 3 Band 4 All
Dec-17 Average $0.84 $1.85 $2.89 $7.39 $3.24
Jun-17 Average $(7.60) $1.52 $5.30 $12.51 $5.37
Dec-17 Top Quartile $9.44 $10.56 $17.91 $29.63 $18.98
Jun-17 Top Quartile $2.59 $9.35 $22.57 $36.53 $25.03
$(10) $(5)
$- $5
$10 $15 $20 $25 $30 $35 $40
Do
llars
pe
r cl
ien
t p
er
day
EBT per client per day by band
www.stewartbrown.com.au / 5
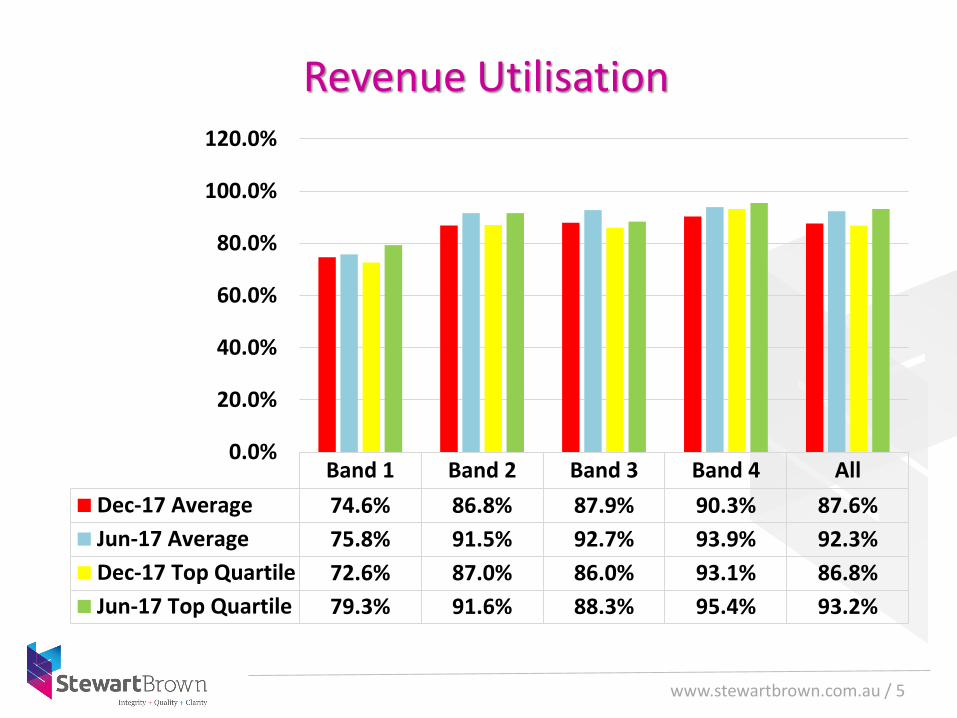
Revenue Utilisation
Band 1 Band 2 Band 3 Band 4 All
Dec-17 Average 74.6% 86.8% 87.9% 90.3% 87.6%
Jun-17 Average 75.8% 91.5% 92.7% 93.9% 92.3%
Dec-17 Top Quartile 72.6% 87.0% 86.0% 93.1% 86.8%
Jun-17 Top Quartile 79.3% 91.6% 88.3% 95.4% 93.2%
0.0%
20.0%
40.0%
60.0%
80.0%
100.0%
120.0%

www.stewartbrown.com.au / 6
Average Unspent Funds
Band 1 Band 2 Band 3 Band 4 All
Dec-17 Average $3,642 $3,849 $5,210 $8,812 $5,412
Jun-17 Average $4,552 $2,866 $3,548 $7,380 $4,255
Dec-17 Top Quartile $2,540 $3,330 $4,801 $6,638 $5,780
Jun-17 Top Quartile $3,453 $2,181 $5,995 $5,945 $6,288
$-
$1,000
$2,000
$3,000
$4,000
$5,000
$6,000
$7,000
$8,000
$9,000
$10,000
Do
llars
pe
r cl
ien
t p
er
day

www.stewartbrown.com.au / 7
Home Care KPI’s
KPI’s established through our assessment, client interviews and home care projects
These metrics can be provided in a number of ways based on location, region or on a program by program basis
Providers now looking to break down a number of these KPIs by Case Manager including profitability of packages under their control
www.stewartbrown.com.au / 8
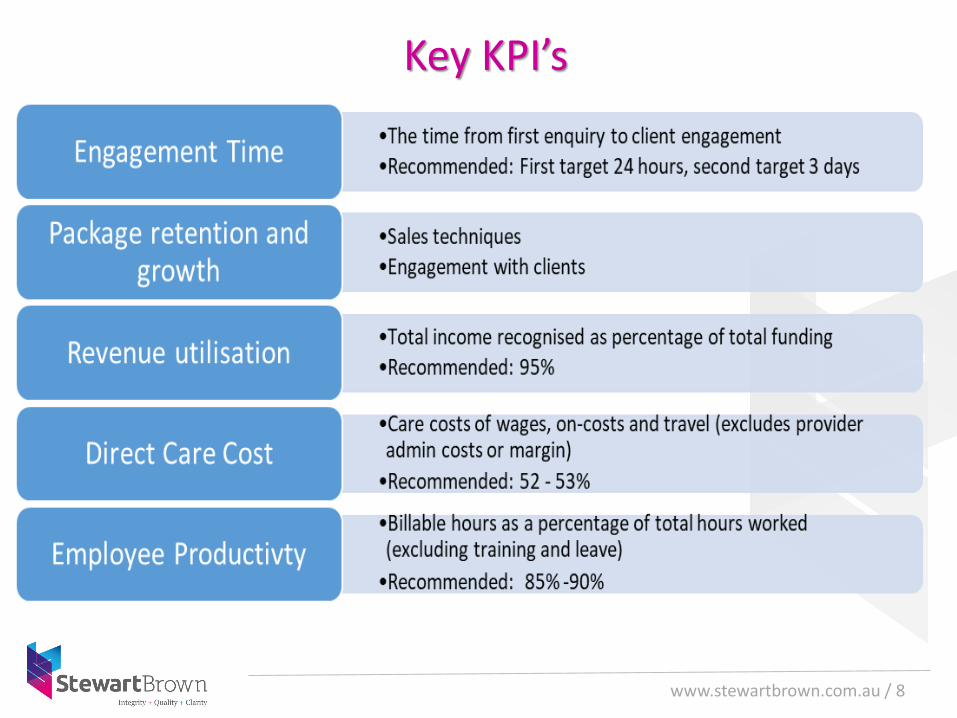
Key KPI’s
www.stewartbrown.com.au / 9
Financial KPI’s
Revenue
Direct Services
Case Management
Client purchases & brokered services
Administration
Margins on revenue items above
EBT total & EBT per package
Variances (budget/forecasts)
www.stewartbrown.com.au / 10
Financial KPI’s
Percentages
Direct services expenses as % of revenue
Case manager cost as a % of revenue
Administration cost as a % of revenue
$ available per package
Forecast based on subsidies
Forecast to include client fees and top up
www.stewartbrown.com.au / 11
Financial KPI’s
Unspent funds
Total $ unspent
No. of clients with an underspend
Ave underspend per client
No. of clients & total $ over a target threshold (e.g. 10%)
% unspent as a proportion of available revenue
Overspend of funds
Total $, No. of clients, average overspend
www.stewartbrown.com.au / 12
Financial KPI’s
Exit fees Total clients discharged
No. of exit fees
% of total discharged
Total exit fees $
Ave exit fee $
Revenue repaid to Department $
Revenue repaid to clients $
Revenue paid to other providers $
www.stewartbrown.com.au / 13
KPI’s - metrics relating to volume & value
Client numbers, by location & package level
No. of private clients
No. of clients receiving dementia supplement
Profile moving clients – incoming clients, moving clients and exiting clients From CHSP, ILU
To provider, new package, between package
To RAC, internal, external
Deceased
www.stewartbrown.com.au / 14
KPI’s - Staff Metrics
Staff profile and recruitment
Care workers, recruited, leaving, total
Workforce growth rate
Total available hours
No. of casual workers
Agency Usage
Total agency hours
% agency of total hours
Backfill or consumer choice
www.stewartbrown.com.au / 15
KPI’s - Staff Metrics
Productivity & efficiency
Total hours worked by staff category
Billable hours by staff category
Packages/clients per case manager
Billable hours as % of total hours – productivity rate
Overtime worked – total hours paid, % of total
Travel - kms travelled, paid $, travel time paid, ave kms per hour, ave kms travelled per client visit
www.stewartbrown.com.au / 16
KPI’s - Client Satisfaction
Waiting time on calls to co-ordinators
No. calls hanging up, incoming calls, missed calls
No. of missed visits
No. of cancelled visits
No. of complaints
No. of compliments
www.stewartbrown.com.au / 17
KPI’s - Business Development
Client engagement time
Client conversion rates – calls, enquiry, website
Growth/retention rates
Actual compared to targets
By location and by package
Case manger/sales team
www.stewartbrown.com.au / 18
Conclusion
Increased competition
Declining margins
Pricing issue
KPI’s are a necessity
Systems to measure and report
Starting out - Keep it simple
Business Development, Staff productivity & profitability