Embed Size (px)
Citation preview

SYNTHESIS AND CHARACTERIZATION OF ZSM-35
A THESIS SUBMITTED TO THE GRADUATE SCHOOL OF NATURAL AND APPLIED SCIENCES
OF THE MIDDLE EAST TECHNICAL UNIVERSITY
BY
ZUHAL COŞKUN
IN PARTIAL FULFILLMENT OF THE REQUIREMENTS FOR THE DEGREE OF
MASTER OF SCIENCE
IN
THE DEPARTMENT OF CHEMICAL ENGINEERING
JULY 2003

Approval of the Graduate School of Natural and Applied Sciences.
Prof. Dr. Canan Özgen Director
I certify that this thesis satisfies all the requirements as a thesis for the degree of Master of Science.
Prof. Dr. Timur Doğu Head of Department
This is to certify that we have read this thesis and that in our opinion it is fully adequate, in scope and quality, as a thesis and for the degree of Master of Science.
Prof. Dr. Ali Çulfaz Co-Supervisor Prof. Dr. Hayrettin Yücel
Supervisor
Examining Committee Members
Assoc. Prof. Dr. Gürkan Karakaş
Prof. Dr. Suna Balcı
Asst. Prof. Dr. Halil Kalıpçılar
Prof. Dr. Ali Çulfaz
Prof. Dr. Hayrettin Yücel

iii
ABSTRACT
SYNTHESIS AND CHARACTERIZATION OF ZSM-35
Coşkun, Zuhal
M.Sc., Department of Chemical Engineering
Supervisor: Prof. Dr. Hayrettin Yücel
Co-Supervisor: Prof. Dr. Ali Çulfaz
July 2003, 102 pages
ZSM-35, a medium pore size, high silica zeolite of ferrierite structure has
been synthesized using hydrothermal methods. ZSM-35 was synthesized from an
aqueous gel of composition 1.85 Na2O. Al2O3. x SiO2. 592 H2O. 19.7 R. The
parameters of the syntheses were SiO2/Al2O3 ratio (10 < x < 25), crystallization
temperature (150 °C < T < 225 °C), crystallization time (0 < t < 480 h) and the
type of organic template (R: pyrrolidine or ethylenediamine).
ZSM-35 was synthesized as pure phase from the experiments which were
carried out with the batch composition having SiO2/Al2O3 ratio of 20 and 25 at

iv
177 °C, in presence of pyrrolidine. Then, the experiments were performed at
SiO2/Al2O3 ratio of 20 with pyrrolidine or ethylenediamine at temperatures 150,
177, 200 and 225 °C. At temperatures 150, 177 and 200 °C, ZSM-35 synthesis
was achieved as pure phase with both templates. In the experiments performed at
225 °C, ZSM-35 was synthesized with ethylenediamine as the only crystalline
phase. In the synthesis carried out with pyrrolidine, there exist a minor mordenite
phase along with ZSM-35.
ZSM-35 crystals synthesized with pyrrolidine at 150, 177 and 200 °C were
observed to be spherical crystal agglomerates of 15-20 µm size with crystallites
smaller than 1 µm. The morphology of the zeolites synthesized with
ethylenediamine at temperatures 150, 177, 200 and 225 °C exhibits spherical
crystal agglomerates composed of platelet crystallites.
The methanol sorption capacity of ZSM-35 synthesized with pyrrolidine at
25 °C and at the relative pressure P/P0 = 0.5 was 0.1380 cm3/g corresponding to
88.4 % the total pore volume. In the sorption experiments carried out at 0 °C,
sample synthesized with pyrrolidine was measured to sorb methanol with higher
capacity than the one synthesized with ethylenediamine. The methanol sorption
capacity of ZSM-35 sample synthesized with ethylenediamine at 0 °C and at the
relative pressure P/P0 = 0.4 was measured as 0.1363 cm3/g corresponding to 87.3
% of the total pore volume.
Keywords: ZSM-35, Synthesis, Pyrrolidine, Ethylenediamine, Methanol Sorption.

v
ÖZ
ZSM-35 SENTEZİ VE KARAKTERİZASYONU
Coşkun, Zuhal
Yüksek Lisans, Kimya Mühendisliği Bölümü
Tez Yöneticisi: Prof. Dr. Hayrettin Yücel
Yardımcı Tez Yöneticisi: Prof. Dr. Ali Çulfaz
Temmuz 2003, 102 sayfa
Hidrotermal sentez yöntemleri kullanılarak, orta boyut gözenekli, yüksek
silikalı, ferrierit yapısında bir zeolit olan ZSM-35 üretimi gerçekleştirilmiştir.
ZSM-35, kompozisyonu 1.85 Na2O. Al2O3. x SiO2. 592 H2O. 19.7 R olan sulu
jelden üretilmiştir. Sentez parametreleri SiO2/Al2O3 oranı (10 < x < 25),
kristalleşme sıcaklığı (150 °C < T < 225 °C), kristalleşme zamanı (0 < t < 480
saat) ve organik şablon çeşitleridir (R: pirolidin ya da etilendiamin).
ZSM-35, başlangıç kompozisyonundaki SiO2/Al2O3 oranı 20 ve 25 olan,
177 °C de ve pirolidin kullanılarak yapılan deneylerde saf faz olarak elde
edilmiştir. Daha sonra deneyler SiO2/Al2O3 oranı 20 alınarak, pirolidin ya da

vi
etilendiamin kullanılarak 150, 177, 200 ve 225 °C de yapılmıştır. ZSM-35 150,
177 ve 200 °C de her iki şablonla da tek faz olarak üretilmiştir. 225 °C de
etilendiamin kullanılarak yapılan deneylerde ZSM-35 tek faz olarak elde
edilmiştir. Aynı sıcaklıkta pirolidin kullanılarak yapılan deneylerde ZSM-35’in
yanında az miktarda mordenit fazı bulunmuştur.
150, 177 ve 200 °C pirolidinle sentezlenen ZSM-35 kristallerinin 15-20 µm
büyüklüğünde küresel kristal yığınları şeklinde, büyüklüğü 1 µm den küçük olan
kristalitlerden oluştuğu gözlemlenmiştir. Etilendiamin kullanılarak 150, 177, 200
ve 225 °C de sentezlenen zeolitlerin morfolojisi tabaka şeklinde kristalitlerden
oluşan küresel kristal yığınları şeklinde kendini göstermektedir.
Pirolidinle üretilen ZSM-35’in metanol sorpsiyon kapasitesi 25 °C de ve
relatif basınç P/P0 = 0.5 te gözenek hacminin % 88.4’üne tekabül eden 0.1380
cm3/g olarak ölçülmüştür. 0 °C de yapılan deneylerde, pirolidinle üretilen örneğin
etilendiaminle üretilen örneğe göre daha fazla metanol sorpsiyon kapasitesine
sahip olduğu ölçülmüştür. Etilendiaminle üretilen ZSM-35 örneğinin metanol
sorpsiyon kapasitesi 0 °C ve relatif basınç P/P0 = 0.4 te gözenek hacminin
% 87.3’üne tekabül eden 0.1363 cm3/g olarak ölçülmüştür.
Anahtar Kelimeler: ZSM-35, Sentez, Pirolidin, Etilendiamin, Metanol
Sorpsiyonu.

vii
To My Parents
Nazife & Mehmet Coşkun
and
To My Grandmother
The Late Münevver Dirlik

viii
ACKNOWLEDGEMENTS
I wish to express my deepest gratitude to my supervisors, Prof. Dr.
Hayrettin Yücel and Prof. Dr. Ali Çulfaz for their outstanding guidance and
encouragement throughout this study.
I am very grateful for the techinal assistance provided by Kerime Güney and
Mihrican Açıkgöz for the chemical and thermogravimetric analyses. I also would
like to thank Cengiz Tan from Metallurgical Engineering Department of METU
for arranging electron microscopy.
I wish to thank my family for their great support, encouragement and
unshakable faith in me.
Finally, my special thanks go to Yusuf Göğebakan, for his understanding,
endless patience and encouragement on me.
.

ix
TABLE OF CONTENTS ABSTRACT .......................................................................................................... iii
ÖZ....... .....................................................................................................................v
DEDICATION.......................................................................................................vii
ACKNOWLEDGEMENTS................................................................................. viii
TABLE OF CONTENTS .......................................................................................ix
LIST OF TABLES.................................................................................................xii
LIST OF FIGURES ...............................................................................................xv
CHAPTER
1 INTRODUCTION ...........................................................................................1
1.1. Introduction to Zeolites and ZSM-35 .......................................................1
1.2 Scope of the Study .....................................................................................3
2 LITERATURE SURVEY................................................................................4
2.1 Ferrierite Structure and Synthesis..............................................................4
2.1.1 Crystal Structure of Ferrierite...........................................................4
2.1.2 Synthesis Studies ..............................................................................5
2.1.3 Sorption Studies..............................................................................12
3 EXPERIMENTAL.........................................................................................16
3.1 Synthesis of ZSM-35 ...............................................................................16
3.2 Batch Preparation.....................................................................................18

x
3.3 Characterization by X-Ray Diffraction (XRD) .......................................21
3.4 Characterization by Scanning Electron Microscope (SEM)....................25
3.5 Characterization by Thermo Gravimetric Analysis (TGA) .....................25
3.6 Thermal Stability Test .............................................................................26
3.7 Sorption Capacity Measurements ............................................................26
4 RESULTS AND DISCUSSIONS..................................................................29
4.1 Synthesis of ZSM-35 ...............................................................................29
4.2 Crystallization Results .............................................................................31
4.2.1 Crystallization Results of the Experiments Performed at
Different SiO2/Al2O3 Ratios ...........................................................32
4.2.2 Crystallization Results of the Experiments Performed at
Different Temperatures with Templates Pyrrolidine or
Ethylenediamine .............................................................................39
4.3 Characterization by SEM.........................................................................46
4.4 Characterization by TGA.........................................................................53
4.5 Thermal Stability Test .............................................................................56
4.6 Sorption Capacity Measurements ............................................................60
5 CONCLUSIONS ...........................................................................................62
5.1 Recommendations....................................................................................63
REFERENCES ......................................................................................................64
APPENDICES
A SYNTHESIS CALCULATIONS .................................................................68
A.1 Crystallinity Index Calculation..............................................................68
A.2 Yield Calculation ...................................................................................71

xi
A.3 Maximum Yield Calculation .................................................................71
A.4 Conversion Calculation..........................................................................73
A.5 Crystallinity Results................................................................................74
B CHARACTERIZATION ..............................................................................81
B.1 X-Ray Diffraction Patterns .....................................................................81
B.2 Scanning Electron Micrographs..............................................................84
C X-RAY DIFFRACTION DATA ..................................................................87

xii
LIST OF TABLES 3.1 Molar Batch Compositions and Crystallization Temperatures Used in
ZSM-35 Synthesis ........................................................................................17
3.2 XRD Scanning Conditions ...........................................................................21
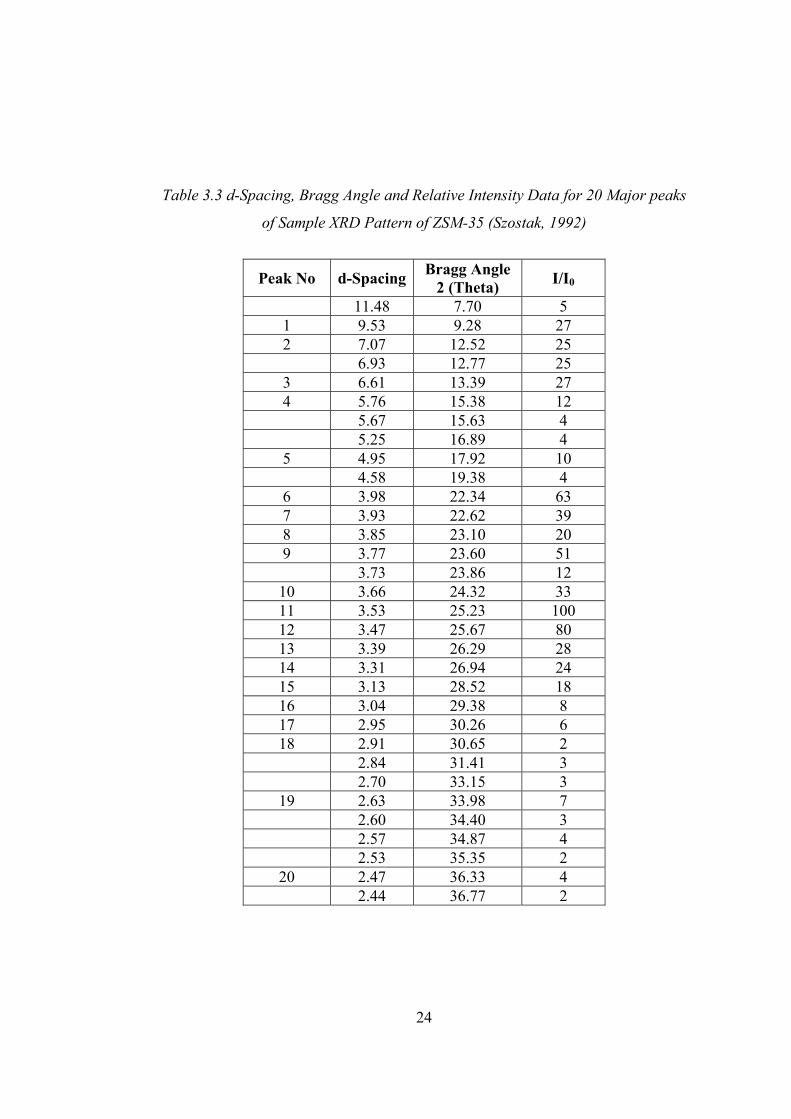
3.3 d-Spacing, Bragg Angle and Relative Intensity Data for 20 Major
peaks of Sample XRD Pattern of ZSM-35 (Szostak, 1992).........................24
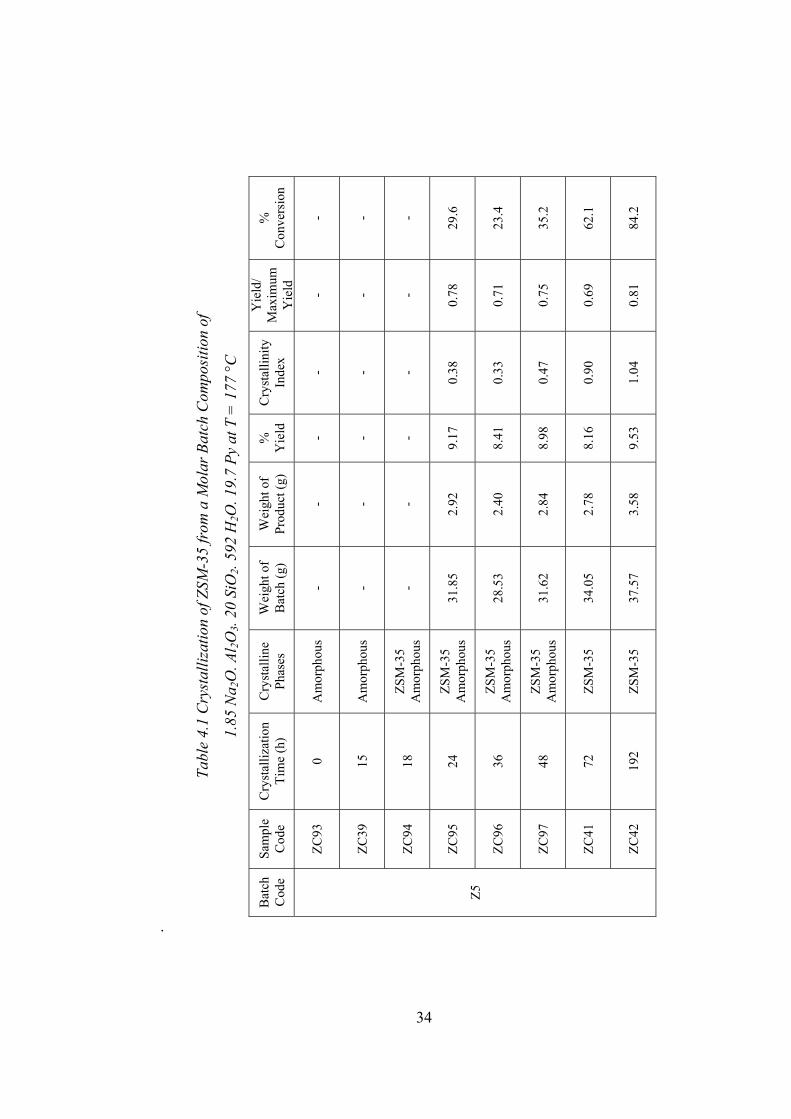
4.1 Crystallization of ZSM-35 from a Molar Batch Composition of 1.85
Na2O. Al2O3. 20 SiO2. 592 H2O. 19.7 Py at T = 177 °C..............................34
4.2 Crystallization of ZSM-35 from a Molar Batch Composition of 1.85
Na2O. Al2O3. 25 SiO2. 592 H2O. 19.7 Py at T = 177 °C..............................36
4.3 Crystallization of ZSM-35 from a Molar Batch Composition of 1.85
Na2O. Al2O3. 15.2 SiO2. 592 H2O. 19.7 Py at T = 177 °C...........................37
4.4 Crystallization of ZSM-35 from a Molar Batch Composition of 1.85
Na2O. Al2O3. 20 SiO2. 592 H2O. 19.7 Py at T = 150 °C..............................41
4.5 Crystallization of ZSM-35 from a Molar Batch Composition of 1.85
Na2O. Al2O3. 20 SiO2. 592 H2O. 19.7 ED at T = 150 °C.............................42
4.6 EDAX Analysis Results of the Samples Coded As ZC55, ZC59,
ZC17, ZC83 and ZC86.................................................................................52
4.7 Thermal Stability Test Crystallinity Results.................................................58

xiii
4.8 Comparison of Methanol Sorption Capacities of Synthesized ZSM-35
Samples with Previous Studies ....................................................................61
A.1 Intensity Data and Crystallinity Index Calculation of the Most
Crystalline ZSM-35 Samples .......................................................................69
A.2 Intensity Data and Crystallinity Index Calculation of ZSM-35
Samples Having Competing Phase Mordenite.............................................70
A.3 Crystallization of ZSM-35 from a Molar Batch Composition of 1.85
Na2O. Al2O3. 10 SiO2. 592 H2O. 19.7 Py at T = 177 °C..............................74
A.4 Crystallization of ZSM-35 from a Molar Batch Composition of 1.85
Na2O. Al2O3. 20 SiO2. 592 H2O. 19.7 ED at T = 177 °C.............................75
A.5 Crystallization of ZSM-35 from a Molar Batch Composition of 1.85
Na2O. Al2O3. 20 SiO2. 592 H2O. 19.7 Py at T = 200 °C..............................76
A.6 Crystallization of ZSM-35 from a Molar Batch Composition of 1.85
Na2O. Al2O3. 20 SiO2. 592 H2O. 19.7 ED at T = 200 °C.............................77
A.7 Crystallization of ZSM-35 from a Molar Batch Composition of 1.85
Na2O. Al2O3. 20 SiO2. 592 H2O. 19.7 Py at T = 225 °C..............................78
A.8 Crystallization of ZSM-35 from a Molar Batch Composition of 1.85
Na2O. Al2O3. 20 SiO2. 592 H2O. 19.7 ED at T = 225 °C.............................79
C.1 Peak Listing of Natural Ferrierite from Kamloops Given by Kibby et
al. (1974) ......................................................................................................87
C.2 Peak Listing of Natural Ferrierite from Aqoura Given by Kibby et al.
(1974) ...........................................................................................................88
C.3 Peak Listing of Natural Ferrierite from Sonora Pass Given by Kibby
et al. (1974) ..................................................................................................89

xiv
C.4 Peak Listing of Natural Ferrierite Given by Vaughan (1966) .....................90
C.5 Peak Listing of Natural Ferrierite of PDF # 39-1382 ..................................91
C.6 Peak Listing of Synthetic Ferrierite Given by Barrer and Marshall
(1965) ...........................................................................................................92
C.7 Peak Listing of Synthetic Ferrierite of Hawkins Given by Kibby et al.
(1974) ...........................................................................................................93
C.8 Peak Listing of Synthetic Ferrierite of Senderov Given by Kibby et al.
(1974) ...........................................................................................................94
C.9 Peak Listing of Synthetic Ferrierite Given by Kibby et al.(1974) ...............95
C.10 Peak Listing of Synthetic Ferrierite Given by Plank et al. (1977) ...............96
C.11 Peak Listing of Synthetic Ferrierite Given by Çulfaz and Yılmaz
(1985) ...........................................................................................................97
C.12 Peak Listing of Synthetic Ferrierite Given by Wenyang et al. (1989).........98
C.13 Peak Listing of Synthetic Ferrierite Given by Borade and Clearfield
(1994) ...........................................................................................................99
C.14 Peak Listing of Synthetic Ferrierite Given by Robson (1998)...................100
C.15 Peak Listing of Synthetic Ferrierite Given by Tütüncü (2003)..................101
C.16 Peak Listing of Synthetic Ferrierite Synthesized in This Study ................102

xv
LIST OF FIGURES 2.1 Three Dimensional Ferrierite Framework Having 10 Membered Rings
(MRs) in x-y Direction and 8 Membered Rings (MRs) in x-z Direction
(Tütüncü, 2003)..............................................................................................6
2.2 Schematic Representation of Channel System of Ferrierite (Jacobs and
Martens, 1987) ...............................................................................................7
2.3 Correlations between the Effective Pore Size of Industrially Important
Zeolites and the Kinetic Molecular Diameter of Selected Compounds
at Room Temperature (Elvers and Hawkins, 1996) .....................................13
3.1 Front View of the Autoclave Used in Syntheses ..........................................19
3.2 Flowchart of Synthesis Procedure ................................................................20
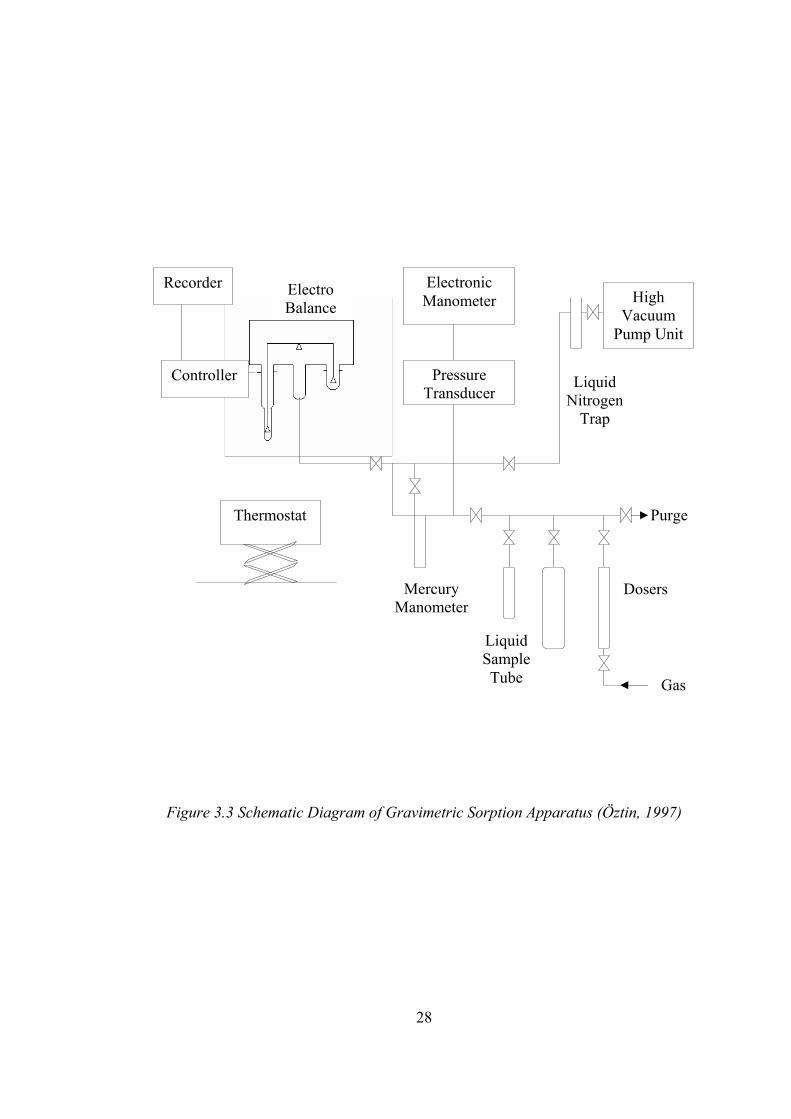
3.3 Schematic Diagram of Gravimetric Sorption Apparatus (Öztin, 1997) .......28
4.1 X- Ray Diffraction Data of (a) Natural (b) Synthetic Ferrierites ................30
4.2 XRD Pattern of ZSM-35 Sample Synthesized from a Molar Batch
Composition of 1.85 Na2O. Al2O3. 25 SiO2. 592 H2O. 19.7 Py at 177
°C 120 h........................................................................................................33
4.3 X-Ray Diffraction Patterns of the Samples Synthesized at Different
Time Periods from the Batch Composition of 1.85 Na2O. Al2O3. 20
SiO2. 592 H2O. 19.7 Py at T = 177 °C .........................................................35

xvi
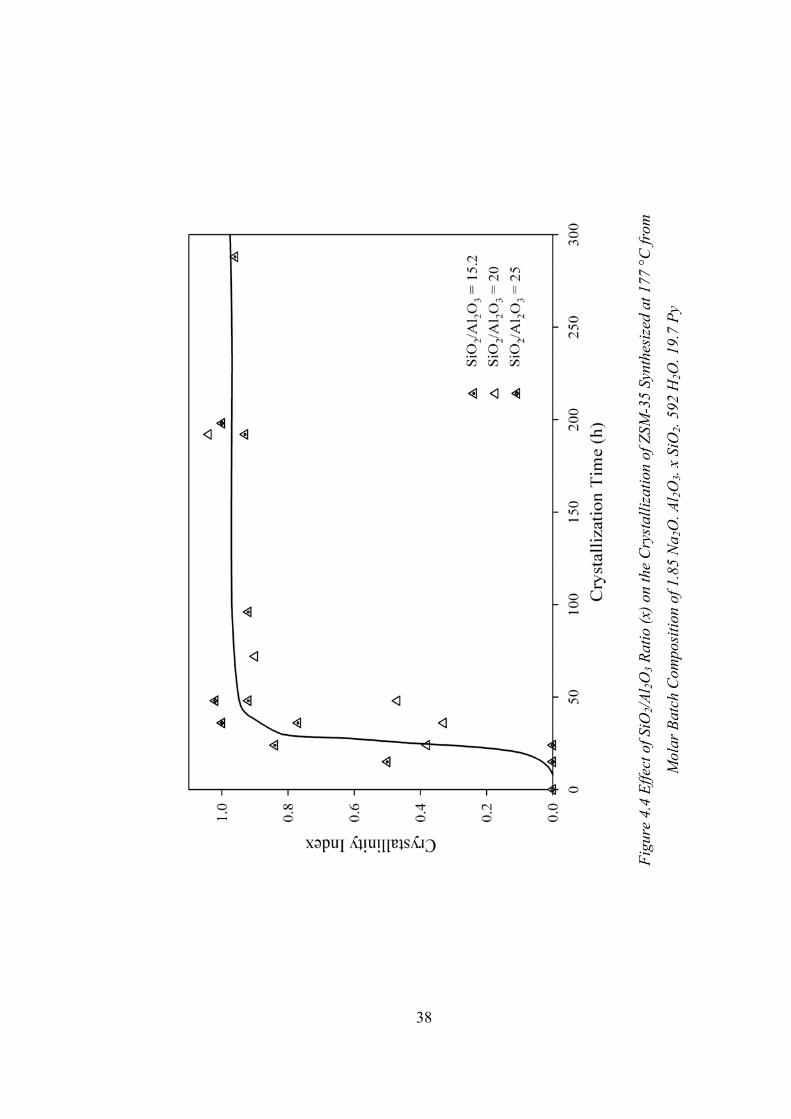
4.4 Effect of SiO2/Al2O3 Ratio (x) on the Crystallization of ZSM-35
Synthesized at 177 °C from Molar Batch Composition of 1.85 Na2O.
Al2O3. x SiO2. 592 H2O. 19.7 Py .................................................................38
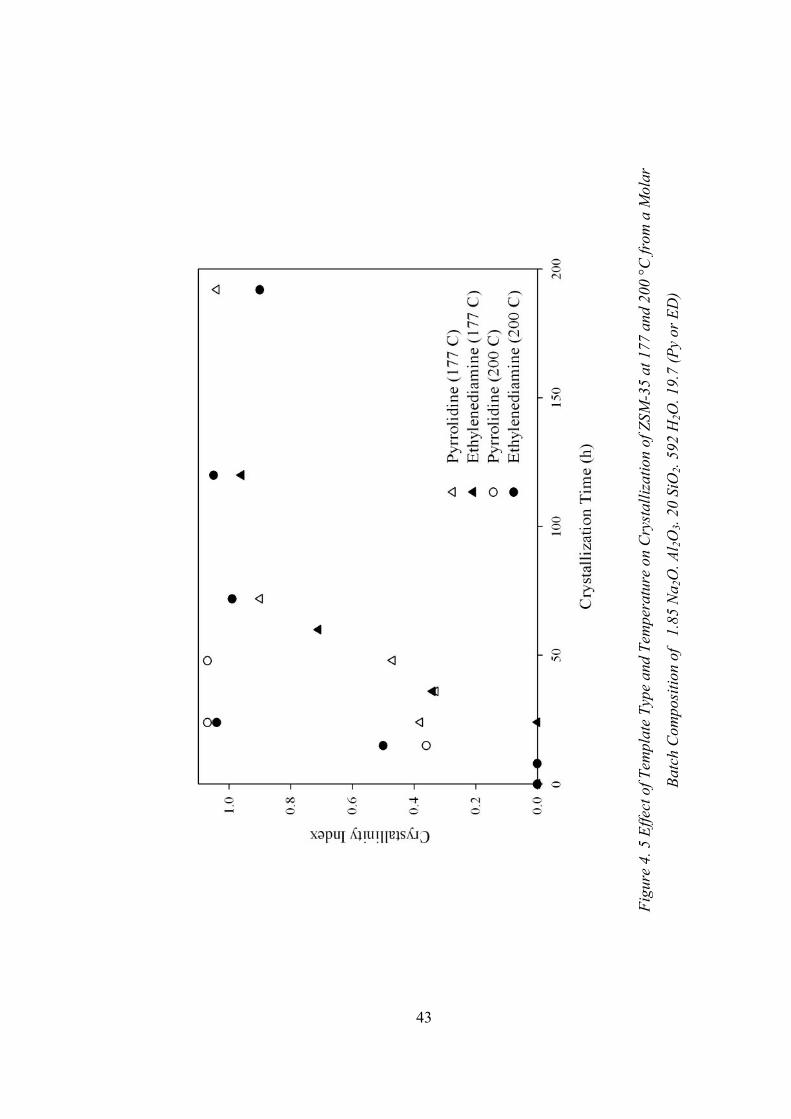
4.5 Effect of Template Type and Temperature on Crystallization of ZSM-
35 at 177 and 200 °C from a Molar Batch Composition of 1.85 Na2O.
Al2O3. 20 SiO2. 592 H2O. 19.7 (Py or ED) ..................................................43
4.6 Effect of Temperature on Crystallization of ZSM-35 from a Molar
Batch Composition of 1.85 Na2O. Al2O3. 20 SiO2. 592 H2O. 19.7 ED .......44
4.7 Comparison of the ZSM-35 Samples Synthesized from Molar Batch
Composition of 1.85 Na2O. Al2O3. 20 SiO2. 592 H2O. 19.7 Py or ED
(F Denotes ZSM-35, M Denotes Mordenite Phase).....................................45
4.8 SEM Micrograph of Sample ZC78 (Batch Code Z13, Part 2)
Synthesized at 150 °C for 10 Days with Template Pyrrolidine ...................47
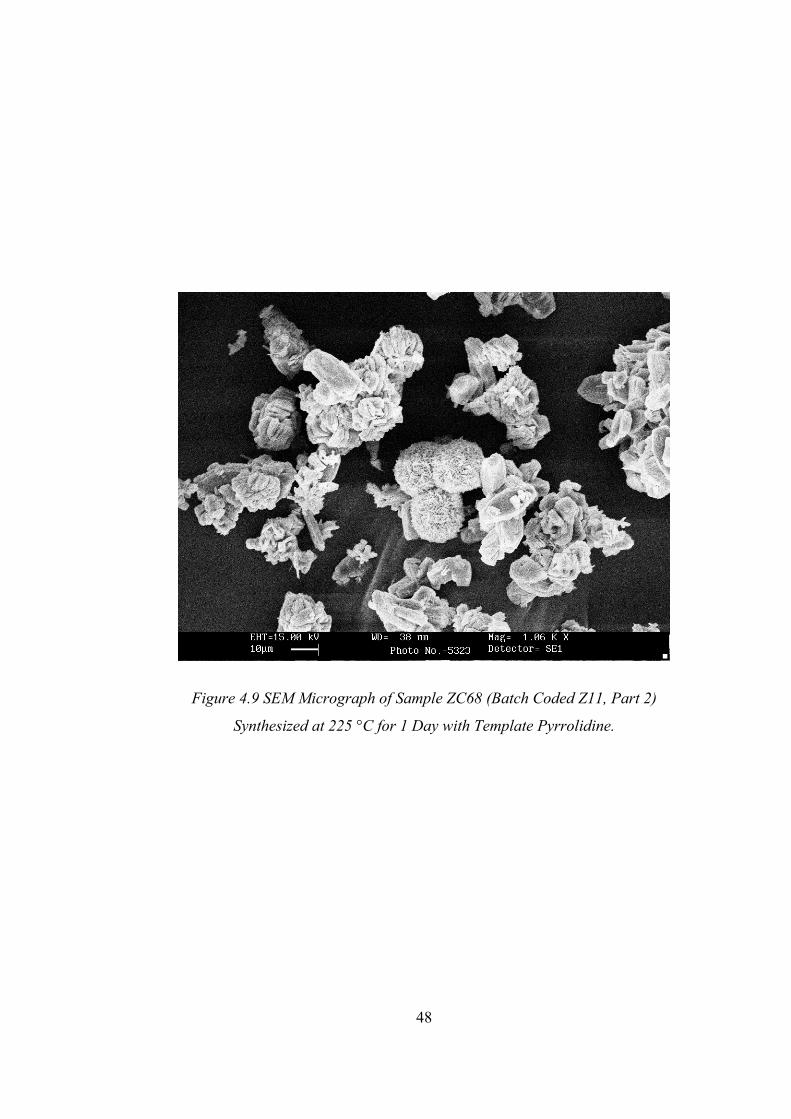
4.9 SEM Micrograph of Sample ZC68 (Batch Coded Z11, Part 2)
Synthesized at 225 °C for 1 Day with Template Pyrrolidine.......................48
4.10 SEM Micrograph of Sample ZC83 (Batch Coded Z14, Part 3)
Synthesized at 200 °C for 5 Days with Template Ethylenediamine ............49
4.11 TGA Graphs of the Sample Synthesized with Pyrrolidine (ZC42, Part
1) (a) under Nitrogen Flow (b) under Air Flow ..........................................54
4.12 TGA Graph of Sample ZC83 (Part 3) Synthesized with
Ethylenediamine under Nitrogen Flow ........................................................55
4.13 Comparison of XRD Scans of Sample ZC42 Treated at Temperatures
600 (0.5 h), 900 (0.5 h), 1000 (2 h), 1050 (2 h) and 1100 °C (2 h)..............59

xvii
A.1 Effect of Temperature on Crystallization of ZSM-35 from a Molar
Batch Composition of 1.85 Na2O. Al2O3. 20 SiO2. 592 H2O. 19.7 Py ........80
B.1 Comparison of XRD Patterns of Samples Synthesized with
Pyrrolidine (Bottom) and Ethylenediamine (Top) at the SiO2/Al2O3
ratio of 20 at 150 °C .....................................................................................81
B.2 Comparison of XRD Patterns of Samples Synthesized with
Pyrrolidine (Bottom) and Ethylenediamine (Top) at the SiO2/Al2O3
Ratio of 20 at 177 °C....................................................................................82
B.3 Comparison of XRD Patterns of Samples Synthesized with
Pyrrolidine (Bottom) and Ethylenediamine (Top) at the SiO2/Al2O3
Ratio of 20 at 200 °C....................................................................................83
B.4 SEM Micrograph of Sample ZC42 (Batch Code Z5, Part 1)
Synthesized at 177 °C for 8 Days with Template Pyrrolidine .....................84
B.5 SEM Micrograph of Sample ZC86 (Batch Code Z15, Part 3)
Synthesized at 225 °C for 1 Days with Template Ethylenediamine ............85
B.6 SEM Micrograph of Sample ZC83 (Batch Code Z14, Part 3)
Synthesized at 200 °C for 5 Days with Template Ethylenediamine ............86

1
CHAPTER 1
INTRODUCTION
1.1. Introduction to Zeolites and ZSM-35
Zeolites are microporous, crystalline, hydrated alumina silicates with a
framework structure. Their three-dimensional, polyanionic networks are
constructed of SiO4 and AlO4 tetrahedra linked through shared oxygen atoms. The
tetrahedral units join together in order to form several ring and cage structures.
Depending on the structure type, they contain regular channels or interlinked
voids whose aperture diameters are in micropore range. These pores contain water
molecules and the cations necessary to balance the negative charge of the
framework.
Zeolites may naturally occur or they can be synthesized. More than 150
zeolite types have been synthesized and 40 zeolite types are known to occur in
nature as minerals.
Zeolite synthesis can be defined as a kind of art. The crucial step in
synthesis process is the preparation of the synthesis mixture (gel). The feasibility
and ability to tune the gel composition according to the product requirements

2
makes this step so important. This means that the synthesis process is easy to
handle but any variation in process parameters changes the product properties and
even the product. The factors affecting the zeolite synthesis can be ordered as the
composition of the synthesis mixture (e.g. SiO2/Al2O3 ratio in gel composition
constraints the framework of zeolite and as this ratio increases thermal stability,
hyrophobicity of the zeolites increase), the homogeneity of the synthesis mixture,
the nature of the reactants, initial and final pH of the system, crystallization
temperature and the template molecules. There are many facilities of using
templating agents such as balancing the framework charge, governing the zeolite
morphology and pore size, also affecting phase purity and product yield.
Zeolites are microporous materials with uniform pore dimensions that
certain molecules may enter these pores while others are rejected. This property
leads to selective adsorption processes. For that reason, they are referred as
molecular sieves.
Ferrierites are considered as one of the most siliceous zeolites. They can be
found in nature as mineral or they can be synthesized artificially. Mineral
ferrierite occur in cavities of volcanic rocks or in sedimentary deposits at Si/Al
ratio between 4 and 7. Ferrierites can be synthesized at higher Si/Al ratios in
single phase form. Several synthetic zeolites were patented as distinct zeolite
phases all having a framework structure closely related to the ferrierite type. Fu-9
(Seddon and Whittam, 1985), Nu-23 (Whittam, 1986), ISI-6 (Morimoto et al.,
1984) and ZSM-35 (Plank et al., 1977) have ferrierite framework topology.
ZSM-35 is a high silica zeolite having ferrierite structure. Its synthesis can
be carried out hydrothermally in an aqueous or a nonaqueous medium with or

3
without the presence of templating agents. Because of its high Si/Al ratio, it
remains thermally stable even at high temperatures. Its unique pore structure is
highly selective that it is mostly used in sorption processes. It is a good candidate
to be used as a shape selective catalyst in chemical processes like hydrocarbon
conversion, isomerization, aromatization and cracking.
1.2 Scope of the Study
The aim of this study is synthesizing ZSM-35 in pure phase and
investigating the limits of crystallization of ZSM-35 by changing synthesis
parameters. The products are to be further characterized in terms of crystallinities,
morphologies, thermal behavior and adsorption properties.
The synthesis of ZSM-35 is to be carried out with hydrothermal methods
under autogeneous pressure. The products are to be characterized by XRD, SEM,
EDAX and TGA methods. Thermal stabilities of the products are to be
determined from heat treatment experiments. Also, the sorption capacities of
ZSM-35 samples are to be measured for methanol in a gravimetric sorption
apparatus at 0 °C and 25 °C.

4
CHAPTER 2
LITERATURE SURVEY
2.1 Ferrierite Structure and Synthesis
The zeolite ferrierite is known both as a mineral as well as a synthetic
material. Mineral ferrierite was firstly discovered by Graham (1918) near
Kamloops Lake in British Columbia, Canada. It was firstly believed as a rare
mineral until its abundant occurrence was reported in the studies of the period
1965 to 1971. The formula of the natural ferrierite is given as (Na,K)4.
Mg2(Si30Al6)O72. (OH)20. 18 H2O. Ferrierite was firstly synthesized unknowingly
by Coombs et al. (1959). It was synthesized hydrothermally from a lime-soda-
alumina-silicate system at 330 °C in association with mordenite. (Kibby et al.,
1974).
2.1.1 Crystal Structure of Ferrierite
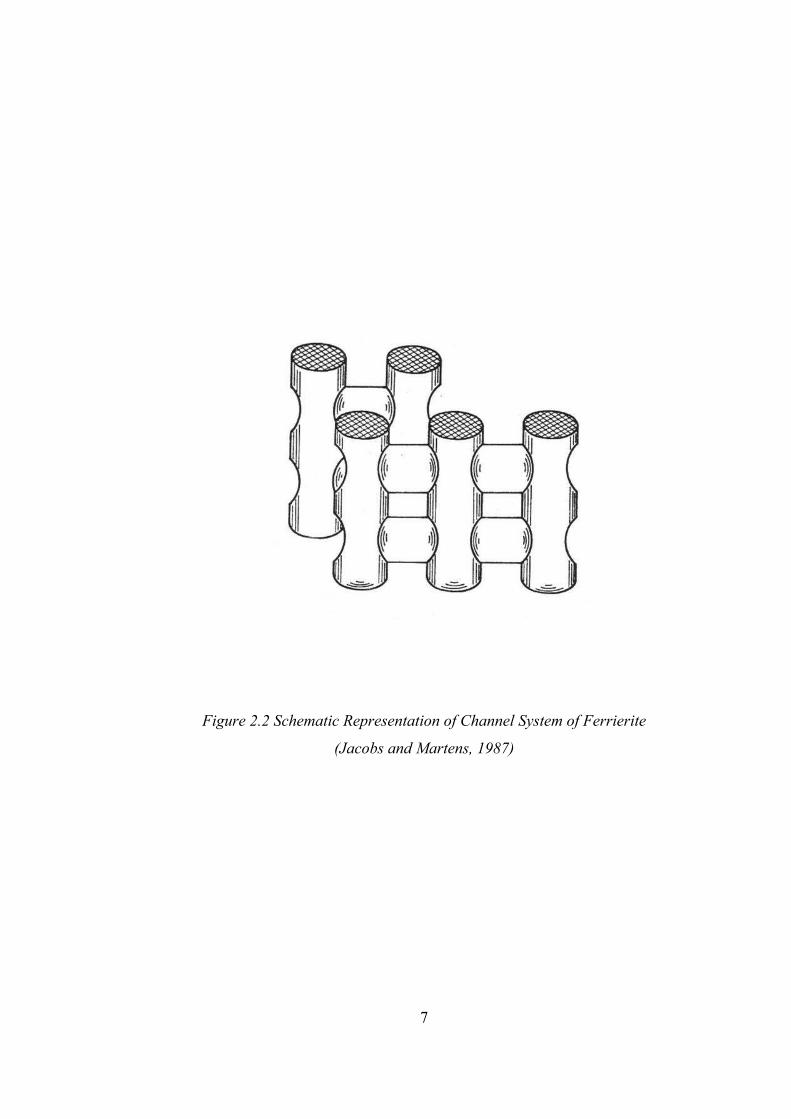
The crystal structure of ferrierite was determined by Vaughan (1966) and by
Kerr (1967). The structure consists of two mutually perpendicular channels
formed by ten and eight membered rings (MRs). The aluminosilicate lattice of

5
ferrierite contains parallel channels formed by 10 membered rings (MRs) having
major and minor axes of size 5.5 and 4.3 Å respectively. They are intersected with
parallel channels formed by 8 MRs of size 4.8 x 3.4 Å. Ferrierite crystals differ
morphologically from other zeolites in having a layer structure. The FER
framework topology is shown in Figure 2.1 and the channel system of ferrierite is
schematically shown in Figure 2.2.
2.1.2 Synthesis Studies
After the initial synthesis by Coombs (1959), Barrer and Marshall (1965)
synthesized a strontium zeolite, Sr-D. X-ray powder diffraction pattern of their
product was closely related to that of natural ferrierite. The synthesis was carried
out from an aqueous gel composition of (1-1.2) SrO. Al2O3. (7-9) SiO2 at 340-380
°C. Cormier and Sand (1967) synthesized Na and K forms of ferrierite
hydrothermally from alumina-silica gel at temperatures of 230- 310 °C.
Kibby et al. (1974) synthesized sodium and sodium-tetramethylammonium
ferrierites under hydrothermal conditions at 300- 325 °C. They produced pure
phase Na- ferrierite using sodium aluminate and colloidal silica sol from a batch
composition of Na2O. Al2O3. 12 SiO2. 250 H2O both in the presence or absence of
tetramethylammonium hydroxide solution.

6
Figure 2.1 Three Dimensional Ferrierite Framework Having 10 Membered Rings
(MRs) in x-y Direction and 8 Membered Rings (MRs) in x-z Direction (Tütüncü,
2003)
y x
z x
10 MRs
8 MRs
7
Figure 2.2 Schematic Representation of Channel System of Ferrierite
(Jacobs and Martens, 1987)

8
ZSM-35 which is a high silica zeolite with ferrierite topology was firstly
synthesized by Plank et al. (1977) in a system containing organic template
ethylenediamine or pyrrolidine. The gel composition of ZSM-35 in the anhydrous
state was expressed in terms of mole ratios of oxides as (0.3-2.5) R2O. (0-0.8)
Na2O. Al2O3. >8 SiO2. R represents the organic nitrogen-containing cation.
ZSM-35 synthesis can be achieved in the presence or absence of organic
templates. Araya and Lowe (1985) have investigated the synthesis of novel
zeolites from a template free system composed of K2O. Al2O3. SiO2.
NH2(CH2)6NH2. The nature of final product was primarily determined by the
SiO2/Al2O3 ratio of reactant gel. ZSM-5 was obtained using reactant gels with
SiO2/Al2O3 ratios of 60:1 whereas ferrierite formation was favored with reactant
gels having SiO2/Al2O3 ratios of 30:1. Phases containing both ferrierite and ZSM-
5 were obtained from reactant gels with SiO2/Al2O3 between these two values.
In the study of Çulfaz and Yılmaz (1985), the same system is used as in
Cormier and Sand (1967). Ferrierite was synthesized from an aqueous template
free gel having molar composition of 1.6 Na2O. 1.6 K2O. Al2O3. 13.5 SiO2. 130
H2O. 0.8 CO2. 2.4 (HCO2)2 at 250 °C.
In most of the studies organic templating agents were used in the synthesis
mixtures. Fjellvag et al. (1989), synthesized ferrierite from Na-TMA (tetra methyl
ammonium) containing gel. X-ray diffraction analysis showed that the basic
framework for natural and synthetic ferrierite is to be similar but some distinctions
occur with respect to non-framework atoms. This study also compared the
structural and thermal properties of Na-TMA (calcined)- Ferrierite, H- Ferrierite

9
and natural ferrierite. H- Ferrierite structure was obtained to be stable up to 952
°C.
In the study of Valyocsik et al. (1985) the crystallization of high silica
zeolites in the presence of α, ω-diamines at pH< 12 were investigated. The molar
composition of the gel for obtaining pure ferrierite formation was 4.2 C3-4DN.
0.09 Na2O. Al2O3. 30 SiO2. 7.8 H2O. The experiments were performed in 300 cm3
stainless steel autoclaves at 170 °C with stirring at 200 rpm. It is found that the
ferrierite structure forms most readily from reaction mixtures having SiO2/ Al2O3
ratio of 12 to 60, whereas MFI structure forms readily even in the absence of
alumina. As the carbon amount in diamine functional group increases in gel
composition, the zeolite framework changes from FER ( 8 and 10 MRs, both are
straight and perpendicular) to a MFI (10 MRs, one straight, other sinusoidal and
perpendicular) and to a MEL (10 MRs, both are straight and perpendicular)
structural type. A correlation between the dimensions of the respective diamines
and the sorption properties of the synthesized zeolites is given. Also, it is
proposed that protonated amines exert a templating effect on crystallization.
Gies and Gunawardane (1987) have synthesized aluminum-free form of
ferrierite using ethylenenediamine and boric acid as templates in aqueous
medium. Almost 100 % yield of aluminum-free ferrierite was obtained at 180 °C
in 8 weeks. The product was obtained to be stable up to 1000 °C. Over that
temperature the product was turned out to cristobalite.
Workdone by Forbes et al. (1995), showed the importance of SiO2/Al2O3
ratio in synthesis. They have synthesized Theta-1, ZSM-5, and ferrierite and
mordenite type of zeolites together with a dense phase of cristobalite from

10
aqueous gels containing potassium / sodium hydroxide / chloride, diethanolamine
as structure-directing agent at different SiO2/Al2O3 ratios. OH-/SiO2 ratio for
ferrierite synthesis was reported to be in the range of 0.075 to 0.105 and
SiO2/Al2O3 ratio was between 10 and 30. The phase boundaries were found to be
generally discrete with the exception of the boundary between ferrierite and ZSM-
5. On increasing the SiO2/Al2O3 ratio approximately from 16 to 25 (at OH/SiO2
ratio of 0.13), the product altered gradually from ferrierite to ZSM-5 via a
continuous series of mixed phases.
In the study of Borade and Clearfield (1994), batch composition of Na2O.
Al2O3. 20 SiO2. 8 R. 448.5 H2O was used for synthesizing ZSM-35 where R
represents the structure-directing agent trimethylcetylammonium hydroxide
(TMCAH). ZSM-35 was obtained at 160 °C and 144 h with mordenite as a minor
phase. The crystal structure of ZSM-35 synthesized by using TMCAH is stable up
to 1000 °C.
Robson (1998) synthesized ZSM-35 from an aqueous gel composition of
1.85 Na2O. Al2O3. 15.2 SiO2. 592 H2O. 19.7 R system. R represents the organic
template ethylenediamine. The crystallization temperature was 177 °C and the
crystallization of the product was completed in 10 days. The product was reported
as ferrierite (FER), the crystalline phase, and competing phases were quartz, MOR
and MFI. From the elemental analysis of the products, SiO2/Al2O3 ratio was
obtained as 13.
Long et al. (2000) studied synthesis, structural characterization and
adsorption properties of K, Na-FER synthesized from the system composed of
(6.55K2O+4.21Na2O). Al2O3. 13.5 SiO2. 6.5 HCO3. 116 H2O. Sodium silicate,

11
silica sol and fumed silica were tested as silica sources, and sodium aluminum
sulfate, aluminum hydroxide and meta kaolin were tested as alumina sources.
Pure K, Na-FER was obtained at 208 °C from the gel prepared with sodium
silicate and sodium aluminum sulfate. It was stated that the starting materials, gel
composition and crystallization temperature affects products in great manner. The
product structure was totally collapsed and transformed to cristobalite at 1019 °C.
ZSM-35 can also be synthesized in non-aqueous reaction medium. For
instance, ZSM-35 was synthesized by Wenyang et al. (1989) from non-aqueous
system composed of (20-45) Ethylenediamine (ED). (1-8) Na2O. (15-50) SiO2.
Al2O3. (40-420) (C2H5)3N. The synthesis was carried out at temperatures from
150 to 200 °C for 96 hours. It was shown that the position and intensity of ZSM-
35 peaks synthesized from non-aqueous and aqueous systems are identical. In
non aqueous system instead of water triethylamine is used in batch composition.
The crystallization mechanisms of non-aqueous and aqueous systems were
completely different since ZSM-35 crystallizes from an aqueous system by a
liquid transformation and it crystallizes from a non-aqueous system by a solid
transformation. The crystallization of ZSM-35 from non-aqueous system is
strongly depending on the molar percent of triethylamine and SiO2 and the molar
ratio of Na2O/triethylamine. The advantages of non-aqueous synthesis include
higher product yields, better control of the molar ratio of SiO2 to Al2O3 in the
products.
Also in the study of Kanno et al. (1994) ferrierite, ZSM-48 and ZSM-5 were
synthesized from a non-aqueous system where glycerol was used as the solvent
and the products encapsulated glycerol molecules in their framework. The

12
crystallization temperature was 210 °C. The crystallization fields of these three
zeolites were obtained. Ferrierite and ZSM-48 retained their zeolitic structure up
to 1000 °C whereas ZSM-5 structure was destroyed at 950 °C. The optimum
starting gel composition for synthesizing ferrierite was estimated as (3- 15) Na2O.
Al2O3. (12- 48) SiO2. (57- 213) Glycerol.
2.1.3 Sorption Studies
The regular nature of the pores and their apertures, whose dimensions are of
the same order of magnitude as molecular diameters, enables the zeolites to
function as molecular sieves. This is the outstanding property of zeolites that
gives them their value as selective adsorbents for separating substances and as
shape-selective catalysts. Depending on the zeolite type and its pore system,
molecules can penetrate into the cavity system or be excluded from it.
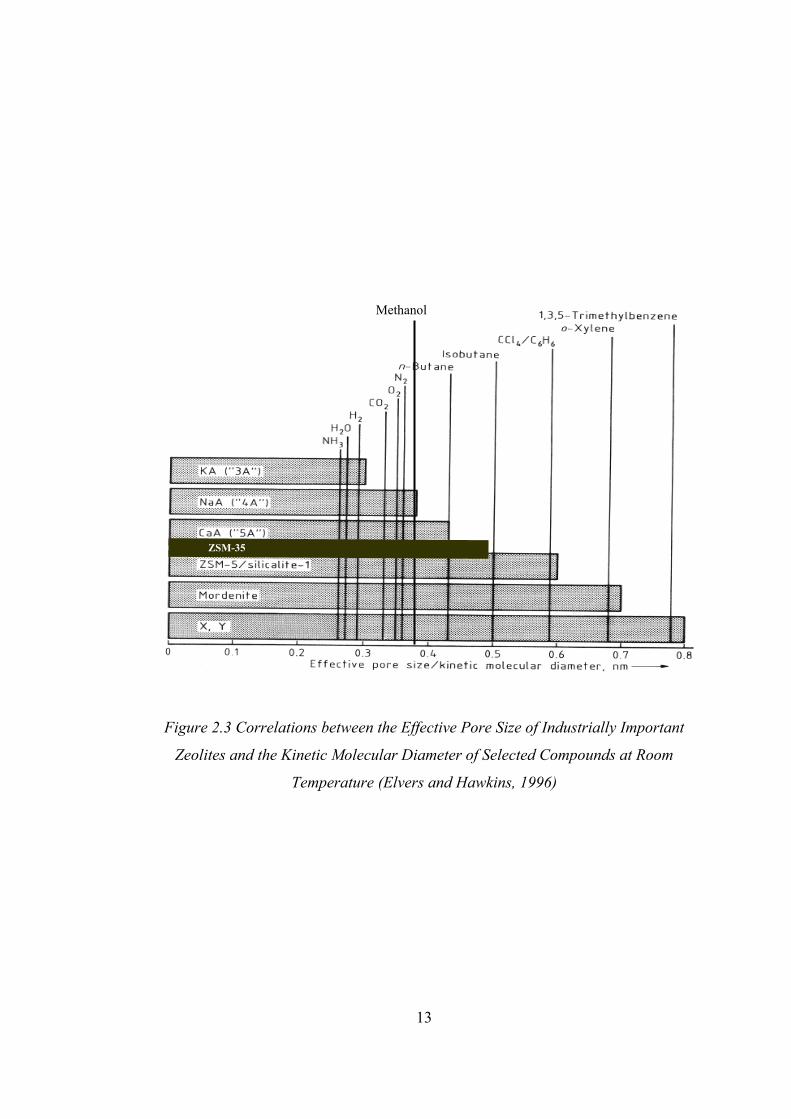
Figure 2.3 shows some of the sorbate zeolites and the possible sorbents.
Methanol and ZSM-35 are also added to the original figure.
As it is seen from Figure 2.3, ZSM-35 pore structure is able to sorb many
molecules such as NH3, H2O, H2, CO2, O2, N2, methanol, n-butane and ethanol.
There are many studies on sorption measurements of ferrierites for many sorbates
including methanol. Methanol is known to fill both 8 and 10 membered rings of
ZSM-35. Its high packing density within the pores of ZSM-35 and rapid
equilibrium in the order of several minutes makes it a suitable probe molecule for
ZSM-35 characterization.
In the study of Harrison et al. (1987) the shape selective properties of
ferrierite, ZSM-5 and ZSM-11 were compared and the effect of mixed zeolitic
13
Figure 2.3 Correlations between the Effective Pore Size of Industrially Important
Zeolites and the Kinetic Molecular Diameter of Selected Compounds at Room
Temperature (Elvers and Hawkins, 1996)
Methanol
ZSM-35

14
phases on the catalysts were investigated. Characterization of the pore structures
was performed by measuring the rates and extents of adsorption of molecules with
different kinetic diameter. The sorption data of ferrierite revealed that water and
methanol are more rapidly adsorbed than n-pentane, n-hexane, benzene, p-xylene,
o-xylene and cyclohexane. This arose in part from the decreased hydrophobicity
of ferrierite relative to ZSM-5 and ZSM-11, moreover from the ability of the
water and methanol molecules to diffuse into both 8 and 10 MRs of ferrierite. The
methanol sorption capacity of pure phase ferrierite products were reported to be
86.9 % of the total pore volume.
Kıvanç (1992) studied on the sorption measurements of synthetic and
natural ferrierites for water, ethanol, methanol, hexane and toluene molecules at
25 °C. Ferrierites were synthesized from a Na, K containing gel (Çulfaz and
Yılmaz, 1985). The sorption measurements were investigated on H-ferrierites.
Synthetic ferrierite observed to have higher sorption capacities. Methanol and
water molecules were sorbed with the highest capacity. 50.7 % of the total pore
volume was measured to fill with methanol. Ethanol and toluene sorbents were
totally excluded from 8 MR channels.
Karslı et al. (2003) also searched the sorption properties of synthetic
ferrierite used in the study of Kıvanç (1992). They determined the limiting
sorption volumes of H-ferrierite for sorbates; water, methanol, propane, hexane
and ortho-meta-para-xylenes. They obtained isotherms for mentioned liquid
vapors and gases at 25°C and at a relative pressure of P/P0=0.5 by using a
gravimetric sorption apparatus. Methanol which has a kinetic diameter
significantly smaller than the pore dimensions was sorbed relatively rapidly and

15
filled 77 % of the total pore volume of the zeolite. It is reported that hexane is able
to fill only 10 MR channels whereas propane is able to fill both 10 and 8 MR
channels and among the xylene isomers, para-xylene having the smallest kinetic
diameter of three isomers is sorbed to a greater extent than the others.
Öztin (1997) studied on the sorption capacities and rates of Na and H forms
of ZSM-35. Measurements were performed at room temperature for water,
methanol, hexane, benzene, o/m/p-xylene and ethylbenzene. ZSM-35 samples
sorbed methanol and water with the highest capacity. 73.7 % of the total pore
volume was reported to be filled with methanol.
Long et al. (2000) studied the sorption of nitrogen, n-hexane and methanol
and on K, Na-ferrierite at room temperature. Comparing the pore size with the
sorbent molecule size, they estimated that nitrogen was adsorbed by both 10 and 8
MRs whereas n-hexane and methanol were adsorbed by only 10 MRs. The
sorption volume of methanol was observed to be lower than that of n-hexane at
P/P0 < 0.05. On the other hand methanol sorption is evidently greater than n-
hexane on the samples at low partial pressure. The filling of methanol was given
as 54.5 % at P/P0 = 0.6. It was also stated that the micropore volume and loading
of methanol increase with the removal of K+ and Na+ cations from the structure.
Tütüncü (2003) worked on the sorption of Na and H ZSM-35 for methanol
and ethanol. Na form of ZSM-35 showed higher sorption capacity than H form.
Also, the sorption capacity of ZSM-35 for ethanol was observed to be higher than
that for methanol. 73.7 % of the total pore volume was filled with methanol at
P/P0 =0.5.
16
CHAPTER 3
EXPERIMENTAL
3.1 Synthesis of ZSM-35
This partial study on crystallization field of ZSM-35 was carried out for the
purpose of synthesizing pure and highly crystalline products from an aqueous gel
composition of 1.85 Na2O. Al2O3. x SiO2. 592 H2O. 19.7 R, where 10< x < 25 and
R is pyrrolidine (Py) or ethylenediamine (ED). The temperature range of
crystallization was from 150 to 225 °C and the crystallization period was in the
range of 0 to 480 hours. The basis of these conditions was described by Robson
(1998) as a procedure. The synthesis conditions for that particular batch were x =
15.2, T = 177 °C and t = 240 hours and the template was ethylenediamine.
All the experiments performed in this study are shown in Table 3.1 in
detailed form, with the batch codes, molar batch compositions and crystallization
temperatures.

17
Table 3.1 Molar Batch Compositions and Crystallization Temperatures
Used in ZSM-35 Synthesis
Batch Code
Part No Molar Batch Composition T ( ºC)
Z3 1 1.85 Na2O. Al2O3. 15.2 SiO2. 592 H2O. 19.7 Py 177
Z5 1-2 1.85 Na2O. Al2O3. 20 SiO2. 592 H2O. 19.7 Py 177
Z8 1 1.85 Na2O. Al2O3. 25 SiO2. 592 H2O. 19.7 Py 177
Z9 1 1.85 Na2O. Al2O3. 10 SiO2. 592 H2O. 19.7 Py 177
Z11 2 1.85 Na2O. Al2O3. 20 SiO2. 592 H2O. 19.7 Py 225
Z12 2 1.85 Na2O. Al2O3. 20 SiO2. 592 H2O. 19.7 Py 200
Z13 2 1.85 Na2O. Al2O3. 20 SiO2. 592 H2O. 19.7 Py 150
Z14 3 1.85 Na2O. Al2O3. 20 SiO2. 592 H2O. 19.7 ED 200
Z15 3 1.85 Na2O. Al2O3. 20 SiO2. 592 H2O.19.7 ED 225
Z16 3 1.85 Na2O. Al2O3. 20 SiO2. 592 H2O. 19.7 ED 177
Z17 3 1.85 Na2O. Al2O3. 20 SiO2. 592 H2O. 19.7 ED 150

18
3.2 Batch Preparation
The raw materials used in the synthesis were colloidal silica (LUDOX AS-
30, 30 wt. % SiO2, Aldrich, lot no: 02302DO), sodium hydroxide (pure pellets,
Merck, lot no: B102362 802), aluminum hydroxide (pure powder, Merck, lot no:
K24826491 817), pyrrolidine (99 %, Aldrich, lot no: S05094-061) and
ethylenediamine (99.5 %, Aldrich, lot no: 01746DI-081).
The synthesis gel was prepared by mixing sodium aluminate solution
(Solution A) with the mixture composed of colloidal silica and template (Solution
B) which were prepared separately. Solution A was prepared by adding aluminum
hydroxide powder on sodium hydroxide solution. This mixture was heated on
hot plate and stirred for about 1 h in order to dissolve alumina particles. After a
clear sodium aluminate solution was obtained, the evaporated amount of water
was added to the solution. Solution B was prepared by adding the template on
colloidal silica. This solution was also stirred by magnetic stirrer. Next, solution B
was put on to solution A and the mixture was stirred further for about half an hour
at room temperature. Gelation occurred immediately upon mixing. At this stage,
the reaction mixture had a molar composition of 1.85 Na2O. Al2O3. x SiO2. 592
H2O. 19.7 R. The gel was poured into stainless steel autoclaves with PTFE inserts
of 30-35 ml capacity (Figure 3.1). The autoclaves were then heated in an oven at
temperatures ranging from 150 to 225 °C. To stop the crystallization process, the
autoclaves were removed from the oven and quenched with cold water. The
resultant solid product was recovered by washing with distilled water and filtering
until the pH was 8. Finally, the products were dried at 100 °C overnight and kept
over saturated potassium sulfate solution placed in a desiccator vessel. Both the

19
Cap
Plunger
Teflon Insert
Teflon Seal
Vessel
gel that was poured into the autoclaves and the dry product were weighed.
Flowchart of the synthesis process is shown in Figure 3.2.
Figure 3.1 Front View of the Autoclave Used in Syntheses.

20
Figure 3.2 Flowchart of Synthesis Procedure
Colloidal Silica
Template
Distilled Water
NaOH Solution
Stirring
Stirring
Stirring
Solution A
Solution B
GEL
NaOH Pellets
AUTOCLAVECrystallization at
Specified T under
Autogeneous P
Washing and
Filtering
pH = 8 ?
Yes
No
Drying at 100 °C overnight
Al(OH)3 Powder
DesiccatorPRODUCT

21
3.3 Characterization by X-Ray Diffraction (XRD)
The products were identified qualitatively from their X-ray diffraction
patterns taken by a Phillips PW1840 diffractometer using CuKα radiation. The
samples were placed either in depression mounts or smear mounts depending on
the quantity available for scanning. The scanning conditions are given in Table
3.2
Table 3.2 XRD Scanning Conditions
Anode Cu
Filter Ni
Radiation CuKα (1.5405 Å)
Tube Potential 30 kV
Tube Current 24 mA
Step Size 0.01 °
Angle (2 Theta) 5-40 °
Scan Speed 0.1 ° /s
Intensity Range 10000 counts/s
Time Constant 1 s
Slit 0.2 mm

22
In order to quantify the crystallinity of the products, a reference pattern was
selected. Crystallinity index of samples were calculated by intensity summation
method. For this calculation in the X-ray diffraction pattern, 20 intense peaks that
form the characteristics of ZSM-35 structure were selected. These peaks are
described in Table 3.3 on a sample ZSM-35 pattern data given by Szostak (1992).
The crystallinity index was calculated by Equation 3.1.
20
n,sn=1
20
n,0n=1
I
Crystallinity Index =
I
∑
∑ (3.1)
In the equation, In,s represents the peak intensity data of the synthesized
sample and In,0 represents the peak intensity data of the reference sample.
Reference sample peak intensity data was formed by averaging the intensity
summations of 20 peaks of the most crystalline ZSM-35 samples. The reference
pattern is described in detail in Appendix A1.
% Yield of the syntheses processes were calculated from the weights of gels
forming the batch and the products.
The yield of particular run was calculated from Equation 3.2.
Weight of Product (g)
% Yield = 100 Weight of Batch (g)
× (3.2)
23
SiO2/ Al2O3 ratio of the products were obtained from EDAX (Energy
Dispersive X-Ray Analysis) results. Maximum yield can be defined as the
maximum amount of zeolite that can be synthesized from a certain molar batch
composition. For the calculation of maximum yield for each batch SiO2/ Al2O3
ratio in zeolite structure should be known. In our case, SiO2/ Al2O3 ratios in the
structure were taken as 20 for the batches having SiO2/Al2O3 ratio of 20 and 25,
13 for the batches having SiO2/Al2O3 ratio of 15.2 and 10 for the batch having
SiO2/Al2O3 ratio of 10. Sample calculation for maximum yield is given in
Appendix A3.
The percent conversions based on the limiting reactant were calculated by
Equation 3.3.
Yield
% Conversion = Crystallinity Index Maximum Yield
× (3.3)
24
Table 3.3 d-Spacing, Bragg Angle and Relative Intensity Data for 20 Major peaks
of Sample XRD Pattern of ZSM-35 (Szostak, 1992)
Peak No d-Spacing Bragg Angle 2 (Theta) I/I0
11.48 7.70 5 1 9.53 9.28 27 2 7.07 12.52 25 6.93 12.77 25 3 6.61 13.39 27 4 5.76 15.38 12 5.67 15.63 4 5.25 16.89 4 5 4.95 17.92 10 4.58 19.38 4 6 3.98 22.34 63 7 3.93 22.62 39 8 3.85 23.10 20 9 3.77 23.60 51 3.73 23.86 12
10 3.66 24.32 33 11 3.53 25.23 100 12 3.47 25.67 80 13 3.39 26.29 28 14 3.31 26.94 24 15 3.13 28.52 18 16 3.04 29.38 8 17 2.95 30.26 6 18 2.91 30.65 2 2.84 31.41 3 2.70 33.15 3
19 2.63 33.98 7 2.60 34.40 3 2.57 34.87 4 2.53 35.35 2
20 2.47 36.33 4 2.44 36.77 2

25
3.4 Characterization by Scanning Electron
Microscope (SEM)
The morphologies and crystal sizes of the synthesized samples were
observed by Leo 435VP (Variable Pressure Scanning) Zeiss-Leica Scanning
Electron Microscope in Turkish Cement Manufacturers Association. The initial
observations were also done by optical microscopy. The micrographs of SEM
were taken in the magnification range of 1,000 to 10,000 times. During the SEM
study, EDAX (Energy Dispersive X-Ray Analysis) method was applied in order
to get a semi- quantitative data of the Si/Al atomic ratio of the synthesized
samples. EDAX analyses of the products were performed by JSM-6400 Electron
Microscope (JEOL) in Metallurgical Engineering Department of METU.
3.5 Characterization by Thermo Gravimetric
Analysis (TGA)
The hydration behavior of ZSM-35 was investigated by Thermo
Gravimetric Analysis (TGA) which was performed with Du Pont 2000 thermal
gravimetric analyzer under nitrogen or air flow between temperatures of 30- 900
°C. The heating rate of the process was 5 or 10 °C/min. From TGA data the
removal temperature of templates pyrrolidine and ethylenediamine, water contents
of the products were determined.

26
3.6 Thermal Stability Test
Thermal stability test was applied in order to obtain the structure breakdown
temperature of the synthesized ZSM-35 samples. For this purpose, about 0.6 g of
samples was placed in crucibles. This was the minimum amount needed for smear
mount scan of XRD. Then, they were exposed to a heat treatment in the oven for
0.5, 1 and 2 hours. Samples were treated at different temperatures in the range of
200 to 1100 °C. The heating rate was 20 °C/min. Up to 1000 °C treatments, the
samples were putting in the oven after it has reached the treatment temperature
and then they left in the oven for the desired lengths of time. But, for higher
temperatures the crucibles were placed in oven at the beginning of the heating
process. After the treatment the crucibles were taken from the oven and kept in
dry desiccator until analysis. The changes in the structure of the treated products
were observed by XRD analysis and the changes in XRD patterns were
investigated.
3.7 Sorption Capacity Measurements
Sorption capacities of some high crystallinity ZSM-35 samples for sorbate
methanol at 0 °C and 25 °C were measured in a conventional gravimetric
adsorption system which was used in the study of Öztin (1997). This system was
consisted of an electronic balance enclosed in a vacuum chamber, a high-vacuum
pump unit, doser chambers and valves. The pressures were recorded by a pressure
transducer and electronic manometer. The sorbate was loaded with the aid of
doser chambers containing methanol (Fluka). 30-40 mg of the sample was placed

27
in an aluminum sample pan and in order to remove water from zeolite structure, it
was treated at 673 K under vacuum of less than 10-2 Pa for about 4 h. Then, the
sample was cooled to 0 or 25 °C in a thermostat and methanol was given to the
system. The schematic diagram of sorption apparatus is shown in Figure 3.4.
28
Figure 3.3 Schematic Diagram of Gravimetric Sorption Apparatus (Öztin, 1997)
Recorder
Controller
Electronic Manometer High
Vacuum Pump Unit
Thermostat
Electro Balance
Mercury Manometer
Liquid Nitrogen
Trap
Liquid Sample Tube
Dosers
Pressure Transducer
Gas
Purge

29
CHAPTER 4
RESULTS AND DISCUSSIONS
4.1 Synthesis of ZSM-35
In this study synthesis and characterization of ZSM-35 was carried out.
ZSM-35 was synthesized from a sodium and pyrrolidine (Py) or ethylenediamine
(ED) containing gel with molar composition of 1.85 Na2O. Al2O3. x SiO2. 592
H2O. 19.7 R under hydrothermal conditions and autogeneous pressure. For
synthesizing pure ZSM-35 and also investigating the limits of crystallization of
ZSM-35, process parameters were changed in the system. The parameters of the
synthesis processes were SiO2/Al2O3 ratio, crystallization temperature,
crystallization time and type of the organic template (R).
The X-ray diffraction data for a sample ZSM-35 (ZC42) synthesized in this
study is compared with the published X-ray diffraction data for several natural
and synthetic ferrierites in the form of a line chart indicating the diffraction
intensity in Figure 4.1. Peak listing of the samples are given in Appendix C.

30
Figure 4.1 X- Ray Diffraction Data of (a) Natural (b) Synthetic Ferrierites
Bragg Angle (2 Theta)
5 10 15 20 25 30 35 40
(a)
(b)
Kamloops
Aqoura
Sonora Pass
Vaughan
Ferrierite (PDF# 39-1382)
Barrer and Marshall
Hawkins
Senderov
Kibby et al.
Plank et al.
Çulfaz and Yılmaz
Szostak
Wenyang et al.
Borade and Clearfield
Robson
Tütüncü
This Study (ZC42)
31
All the peaks of the synthesized sample are consistent with the published X-
ray diffraction data of synthetic ferrierites. The peak at d-spacing 11.3 has seen
mostly in natural ferrierites.
4.2 Crystallization Results
The experiments were carried out mainly in three groups. In the first group
named as Part 1, SiO2/Al2O3 ratio was changed in the range of 10 to 25 for
achieving pure phase synthesis. Another aim of investigation in this group of
experiments was to determine the limits of SiO2/Al2O3 ratio for synthesizing of
pure phase product ZSM-35 at 177 °C in the presence of template pyrrolidine. The
limits of this ratio to be attempted in Part 1 were planned by considering the
previous studies on ferrierite synthesis under similar experimental conditions. For
instance, Forbes et al. (1995) offer a SiO2/Al2O3 ratio range for ferrierite synthesis
between 10 and 20 and noticed that as this range was increased the products were
turn out to be different zeolites. Araya and Lowe (1985) proposed the ratio of 30.
Also Jacobs and Martens (1987) noted this range between 15 and 35. The
crystallization field of ferrierites was estimated between SiO2/Al2O3 ratio of 12
and 48 by Kanno et al. (1994). In the starting molar batch composition this ratio
was given as 15.2 (Robson, 1998).
In the other groups namely Part 2 and Part 3, the SiO2/Al2O3 ratio of the
batch composition was fixed at 20 and the behavior of crystallization with respect
to temperature and time was investigated in the presence of two common organic
templates for synthesizing ZSM-35, pyrrolidine (Part 2) and ethylenediamine

32
(Part 3). Temperature range for ferrierite synthesis was given from 180 to 250 °C
in the studies of Gies and Gunawardane (1987) and Long et al., (2000). Syntheses
were accomplished in this study at temperatures 150, 177, 200 and 225°C.
4.2.1 Crystallization Results of the Experiments
Performed at Different SiO2/Al2O3 Ratios
Table 4.1 shows the results that were calculated for the first group of
experiments that were performed at SiO2/Al2O3 ratio of 20. In Table 4.2 and Table
4.3 the crystallinity results for the second and third groups that were performed at
SiO2/Al2O3 ratio of 25 and 15.2 were also given. The results table for the last
group (SiO2/Al2O3 ratio 10) was submitted in Table A3. The experimental
conditions for syntheses were also submitted in the table headings.
Figure 4.2 gives the sample XRD pattern of pure phase synthesized ZSM-35
pattern at the SiO2/Al2O3 ratio of 25 (ZC55). Figure 4.3 shows the XRD patterns
of the products synthesized at different time periods within the same batch
composition having SiO2/Al2O3 ratio of 20. Figure 4.4 shows the effect of
SiO2/Al2O3 ratio on crystallization of ZSM-35.
The crystallinity and percent conversion data tabulated in Table 4.3 was
calculated by considering only the pure peaks of ZSM-35 in XRD patterns. The
sample calculation of such cases was shown in Appendix A1.

33
Figu
re 4
.2 X
RD P
atte
rn o
f ZSM
-35
Sam
ple
Synt
hesi
zed
from
a M
olar
Bat
ch C
ompo
sitio
n of
1.85
Na 2
O. A
l 2O3.
25 S
iO2.
592
H2O
. 19.
7 Py
at 1
77 °C
for 1
20 h
.
34
%
Con
vers
ion
- - -
29.6
23.4
35.2
62.1
84.2
Yie
ld/
Max
imum
Y
ield
- - -
0.78
0.71
0.75
0.69
0.81
Cry
stal
linity
In
dex
- - -
0.38
0.33
0.47
0.90
1.04
%
Yie
ld
- - -
9.17
8.41
8.98
8.16
9.53
Wei
ght o
f Pr
oduc
t (g)
- - -
2.92
2.40
2.84
2.78
3.58
Wei
ght o
f B
atch
(g)
- - -
31.8
5
28.5
3
31.6
2
34.0
5
37.5
7
Cry
stal
line
Phas
es
Am
orph
ous
Am
orph
ous
ZSM
-35
Am
orph
ous
ZSM
-35
Am
orph
ous
ZSM
-35
Am
orph
ous
ZSM
-35
Am
orph
ous
ZSM
-35
ZSM
-35
Cry
stal
lizat
ion
Tim
e (h
)
0 15
18
24
36
48
72
192
Sam
ple
Cod
e
ZC93
ZC39
ZC94
ZC95
ZC96
ZC97
ZC41
ZC42
Tabl
e 4.
1 C
ryst
alliz
atio
n of
ZSM
-35
from
a M
olar
Bat
ch C
ompo
sitio
n of
1.85
Na 2
O. A
l 2O3.
20 S
iO2.
592
H2O
. 19.
7 Py
at T
= 1
77 °C
Bat
ch
Cod
e
Z5
.

35
Bragg Angle (2 Theta)
5 10 15 20 25 30 35 40
Figure 4.3 X-Ray Diffraction Patterns of the Samples Synthesized at Different
Time Periods from the Batch Composition of 1.85 Na2O. Al2O3. 20 SiO2. 592 H2O.
19.7 Py at T = 177 °C
192 h
72 h
48 h
36 h
24 h

36
%
Con
vers
ion
-
84.0
83.6
88.0
Yie
ld/
Max
imum
Y
ield
-
0.84
0.82
0.88
Cry
stal
linity
In
dex
-
1.00
1.02
1.00
%
Yie
ld
-
9.73
9.45
10.1
2
Wei
ght o
f Pr
oduc
t (g)
-
2.58
2.96
2.82
Wei
ght o
f B
atch
(g)
-
26.5
2
31.3
1
27.8
7
Cry
stal
line
Phas
es
Am
orph
ous
ZSM
-35
ZSM
-35
ZSM
-35
Cry
stal
lizat
ion
Tim
e (h
)
0 36
48
168
Sam
ple
Cod
e
ZC52
ZC53
ZC54
ZC55
Tabl
e 4.
2 C
ryst
alliz
atio
n of
ZSM
-35
from
a M
olar
Bat
ch C
ompo
sitio
n of
1.85
Na 2
O. A
l 2O3.
25 S
iO2.
592
H2O
. 19.
7 Py
at T
= 1
77 °C
Bat
ch
Cod
e
Z8

37
%
Con
vers
ion
-
47.0
78.1
73.2
88.3
80.0
83.7
91.2
Yie
ld/
Max
imum
Y
ield
-
0.94
0.93
0.95
0.96
0.87
0.90
0.95
Cry
stal
linity
In
dex
-
0.50
0.84
0.77
0.92
0.92
0.93
0.96
%
Yie
ld
-
7.53
7.49
7.58
7.69
6.95
7.22
7.64
Wei
ght o
f Pr
oduc
t (g)
-
2.33
2.54
2.70
2.61
2.43
2.67
2.71
Wei
ght o
f B
atch
(g)
-
30.9
4
33.9
0
35.6
1
33.9
6
34.9
7
36.9
7
35.4
6
Cry
stal
line
Phas
es
Gib
bsite
Maj
or
Am
orph
ous M
inor
Gib
bsite
A
mor
phou
s ZS
M-3
5 M
orde
nite
ZSM
-35
Maj
or
Mor
deni
te M
inor
ZSM
-35
Maj
or
Mor
deni
te M
inor
ZSM
-35
Maj
or
Mor
deni
te M
inor
ZSM
-35
Maj
or
Mor
deni
te M
inor
ZSM
-35
Maj
or
Mor
deni
te M
inor
ZSM
-35
Maj
or
Mor
deni
te M
inor
Cry
stal
lizat
ion
Tim
e (h
)
0 15
24
36
48
96
192
288
Sam
ple
Cod
e
ZC33
ZC34
ZC35
ZC36
ZC17
ZC18
ZC19
ZC20
Tabl
e 4.
3 C
ryst
alliz
atio
n of
ZSM
-35
from
a M
olar
Bat
ch C
ompo
sitio
n of
1.85
Na 2
O. A
l 2O3.
15.2
SiO
2. 59
2 H
2O. 1
9.7
Py a
t T =
177
°C
Bat
ch
Cod
e
Z3
38
Figu
re 4
.4 E
ffect
of S
iO2/A
l 2O3 R
atio
(x) o
n th
e C
ryst
alliz
atio
n of
ZSM
-35
Synt
hesi
zed
at 1
77 °C
from
Mol
ar B
atch
Com
posi
tion
of 1
.85
Na 2
O. A
l 2O3.
x Si
O2.
592
H2O
. 19.
7 Py

39
ZSM-35 synthesis strongly depends on SiO2/Al2O3 ratio. Phase purity
increases with an increase in this ratio. As it is seen from Table 4.1 and Table 4.2,
the experiments performed at SiO2/Al2O3 ratio of 20 and 25 at 177 °C and with
the template pyrrolidine, single phase ZSM-35 synthesis was achieved. In the
experiments performed at lower ratios where SiO2/Al2O3 ratio ≤ 15.2, mordenite
was observed to appear as the impurity phase along with ZSM-35.
SiO2/Al2O3 ratio of the batch composition does not have a significant effect
on crystallization rate.
4.2.2 Crystallization Results of the Experiments Performed
at Different Temperatures with Templates Pyrrolidine
or Ethylenediamine
The limits of crystallization with respect to temperature were investigated in
a range from 150 to 225 °C. The SiO2/Al2O3 ratio of the batch composition in
these experiments was selected as 20 such that ZSM-35 can be crystallized as a
single phase.
The results of the experiments that were performed at 150 °C with the
templates pyrrolidine or ethylenediamine are tabulated in Table 4.4 and Table 4.5.
The results belonging to the remaining sets are given in Appendix A5. Figure 4.5
shows the effect of template type on the crystallization rate for the samples
synthesized at 177 °C and 200 °C. Figure 4.6 shows the effect of temperature on
the crystallization rate of the samples synthesized in the presence of
ethylenediamine. The effect of temperature on the crystallization rate in the case
of pyrrolidine is given in Figure A1. The last figure in this section, Figure 4.7,

40
gives two sample XRD patterns of ZSM-35 synthesized at 225 °C with two
templates.
Both pyrrolidine and ethylenediamine seemed to be effective structure
directing agents in ZSM-35 synthesis.
In the experiments performed at temperatures 150, 177 and 200 °C with
templates pyrrolidine or ethylenediamine, ZSM-35 was synthesized as a single
phase product. At 150 °C synthesis for pyrrolidine and ethylenediamine cases,
crystallinity Index, yield and percent conversion data were found to be similar to
each other. (Table 4.4, Table 4.5).
In the products of synthesized with pyrrolidine at 177 °C, the crystallization
rate was higher than the ones synthesized with ethylenediamine under the same
conditions. However, at 200 °C synthesis, the crystallization rate of the products
synthesized with ethylenediamine was observed to be higher than the ones
synthesized with pyrrolidine (Figure 4.5).
It is observed from Figure 4.6 that an increase in temperature causes a
decrease in nucleation period of synthesis and an increase in crystallization rate.
At 225 °C, in the experiment performed with pyrrolidine, mordenite was
observed as a minor phase along with major phase ZSM-35. But, in the case of
template ethylenediamine, ZSM-35 synthesis was achieved without the presence
of impurity phases (Figure 4.7) and also in shorter crystallization periods (Table
A7, Table A8).

41
%
Con
vers
ion
- -
27.0
37.2
45.2
61.4
Yie
ld/
Max
imum
Y
ield
- -
0.54
0.62
0.58
0.69
Cry
stal
linity
In
dex
- -
0.50
0.60
0.78
0.89
%
Yie
ld
- -
6.32
7.34
6.84
8.12
Wei
ght o
f Pr
oduc
t (g)
- -
1.85
2.05
2.16
2.56
Wei
ght o
f B
atch
(g)
- -
29.2
5
27.7
5
31.5
7
31.5
4
Cry
stal
line
Phas
es
Am
orph
ous
Am
orph
ous
ZSM
-35
Am
orph
ous
ZSM
-35
ZSM
-35
ZSM
-35
Cry
stal
lizat
ion
Tim
e (h
)
0 24
72
108
192
240
Sam
ple
Cod
e
ZC73
ZC74
ZC75
ZC76
ZC77
ZC78
Tabl
e 4.
4 C
ryst
alliz
atio
n of
ZSM
-35
from
a M
olar
Bat
ch C
ompo
sitio
n of
1.85
Na 2
O. A
l 2O3.
20 S
iO2.
592
H2O
. 19.
7 Py
at T
= 1
50 °C
Bat
ch
Cod
e
Z13

42
%
Con
vers
ion
- - -
22.8
30.7
34.7
63.9
77.4
Yie
ld/
Max
imum
Y
ield
- - -
0.76
0.57
0.62
0.71
0.79
Cry
stal
linity
In
dex
- - -
0.30
0.53
0.56
0.90
0.98
%
Yie
ld
- - -
9.14
6.80
7.45
8.50
9.45
Wei
ght o
f Pr
oduc
t (g)
- - -
2.15
1.65
1.82
2.15
2.84
Wei
ght o
f B
atch
(g)
- - -
23.5
2
24.2
5
24.4
4
25.2
9
30.0
6
Cry
stal
line
Phas
es
Am
orph
ous
Am
orph
ous
Am
orph
ous
Am
orph
ous M
ajor
ZS
M-3
5 M
inor
ZSM
-35
Maj
or
Am
orph
ous M
inor
ZSM
-35
ZSM
-35
ZSM
-35
Cry
stal
lizat
ion
Tim
e
0 24
36
48
96
144
240
480
Sam
ple
Cod
e
ZC10
6
ZC10
7
ZC10
8
ZC10
9
ZC11
0
ZC11
1
ZC11
2
ZC11
3
Tabl
e 4.
5 C
ryst
alliz
atio
n of
ZSM
-35
from
a M
olar
Bat
ch C
ompo
sitio
n of
1.85
Na 2
O. A
l 2O3.
20 S
iO2.
592
H2O
. 19.
7 ED
at T
= 1
50 °C
Bat
ch
Cod
e
Z17
43
Figu
re 4
. 5 E
ffect
of T
empl
ate
Type
and
Tem
pera
ture
on
Cry
stal
lizat
ion
of Z
SM-3
5 at
177
and
200
°C fr
om a
Mol
ar
Batc
h C
ompo
sitio
n of
1.
85 N
a 2O
. Al 2O
3. 20
SiO
2. 59
2 H
2O. 1
9.7
(Py
or E
D)

44
Figu
re 4
.6 E
ffect
of T
empe
ratu
re o
n C
ryst
alliz
atio
n of
ZSM
-35
from
a M
olar
Bat
ch C
ompo
sitio
n of
1.85
Na 2
O. A
l 2O3.
20 S
iO2.
592
H2O
. 19.
7 ED

45
Figu
re 4
.7 C
ompa
riso
n of
the
ZSM
-35
Sam
ples
Syn
thes
ized
from
Mol
ar B
atch
Com
posi
tion
of
1.85
Na 2
O. A
l 2O3.
20 S
iO2.
592
H2O
. 19.
7 Py
or E
D (F
Den
otes
ZSM
-35,
M D
enot
es M
orde
nite
Pha
se)

46
XRD patterns of the samples synthesized with pyrrolidine and
ethylenediamine do not show major differences between the relative peak
intensities but, at 150 and 200 °C (Figure B1 and Figure B3), the peaks at 2 theta
angle of 22.2 and 22.5 differed in such a way that in XRD pattern of the sample
synthesized with pyrrolidine two peaks were observed to overlap. In the other
pattern they were seen as two splitted peaks. Such difference was also detected in
ZSM-35 patterns given by Robson (1998) and Szostak (1992) that the peaks were
seen in separated form whereas in patterns given by Kanno et al. (1994) and
Borade and Clerafield (1994) these two peaks were overlapped and shown as one
broad peak.
One of the autoclaves used for synthesis with ethylenediamine (Batch Code
Z17) was left in the oven for 20 days to investigate the stability of crystal phase.
The XRD data indicated that ZSM-35 phase is stable under the existing
hydrothermal conditions for at least 20 days.
4.3 Characterization by SEM
The morphology and the size of the synthesized ZSM-35 crystals were
observed by scanning electron microscope. The sample micrographs were shown
in the following figures (Figure 4.8- 4.10).

47
Figure 4.8 SEM Micrograph of Sample ZC78 (Batch Code Z13, Part 2)
Synthesized at 150 °C for 10 Days with Template Pyrrolidine.
48
Figure 4.9 SEM Micrograph of Sample ZC68 (Batch Coded Z11, Part 2)
Synthesized at 225 °C for 1 Day with Template Pyrrolidine.

49
Figure 4.10 SEM Micrograph of Sample ZC83 (Batch Coded Z14, Part 3)
Synthesized at 200 °C for 5 Days with Template Ethylenediamine.

50
From Figure 4.8, it is seen that ZSM-35 crystals was formed as spherical
crystal agglomerates of 15-20 µm size with individual crystallites smaller than 1
µm. The similar morphology with larger crystal size about 30-40 µm was
observed in ZSM-35 sample used in the study of Tütüncü (2003) where the half
amount of pyrrolidine used in our study was applied in batch composition.
At 225 °C synthesis, the crystal size was decreased to 5-10 µm. This sample
contained minor phase mordenite. Existence of mordenite is not clearly detectable
from the micrograph. This sample was also observed to have two different
morphologies of ZSM-35. The spherical agglomerates of 5-10 µm in size were
dispersed among the platelet shaped crystallites of 5-10 µm in size (Figure 4.9).
The platelet shaped crystallites were known for natural ferrierite morphology
which was reported to exhibit needle as well as platelet shape crystallites.
Figure 4.10 belongs to ZSM-35 sample synthesized in Part 3 where the
syntheses were carried out in the presence of ethylenediamine. The morphology in
this case exhibits spherical agglomerates having 5-15 µm size, composed of
platelet crystallites. This is a probable morphology as ferrierites are known to
have layered structure. It also resembles to the observation reported by Kibby et
al. (1974) where the crystals of ferrierite was seen to be octagonal platelets
stacked like a deck of cards. The similar morphology was reported in the study of
Shashikala et al. (1991) and Kanno et al. (1994) that ferrierite crystallites were in
the form of platelets 1-15 µm in size.
The size of the crystallite agglomerates synthesized in the presence of
pyrrolidine were observed to decrease with an increase in crystallization
51
temperature whereas in the case of ethylenediamine the size of crystallite
agglomerates increased with increasing the crystallization temperature.
During SEM analysis, EDAX method was applied to some of the samples to
determine the SiO2/Al2O3 ratio of the products semi-quantitatively. In the
previous studies some other SiO2/Al2O3 ratio determining methodologies were
given. For instance, Jacobs and Martens (1987) showed a plot of SiO2/Al2O3 ratio
in the synthesis mixture against the same ratio in ferrierite structure. They claimed
that up to SiO2/Al2O3 ratio of 35 in batch composition, the same ratio in the
structure can be obtained and it was possible to synthesize ferrierites in the
SiO2/Al2O3 range 15 to 35. Suzuki et al. (1986) synthesized ZSM-35 with
SiO2/Al2O3 ratio 24 from a gel of having this ratio 28. Also in the starting batch
composition (Robson, 1998) SiO2/Al2O3 ratio was 15.2 in synthesis mixture and
13 in zeolite structure. The SiO2/Al2O3 ratios in ZSM-35 structure used during the
calculations of the maximum yield and conversion were mentioned previously in
Section 3.5. Table 4.6 gives the EDAX analysis results and the used SiO2/Al2O3
ratios of some synthesized samples. EDAX analyses (Table 4.6) support the
argument that SiO2/Al2O3 ratios in gel composition and in the structure of the
synthesized products are similar.

52
Table 4.6 EDAX Analysis Results of the Samples Coded As
ZC55, ZC59, ZC17, ZC83 and ZC86
Sample Code
Batch Code
SiO2/Al2O3 Molar Ratio
in Batch Composition
SiO2/Al2O3 Molar Ratio in The
Product EDAX Results
SiO2/Al2O3 Molar Ratio Used in
Maximum Yield and Conversion Calculations
ZC55 Z8 25 19 20
ZC59 Z9 10 9 10
ZC17 Z3 15.2 13 13
ZC83 Z14 20 20 20
ZC86 Z15 20 20 20
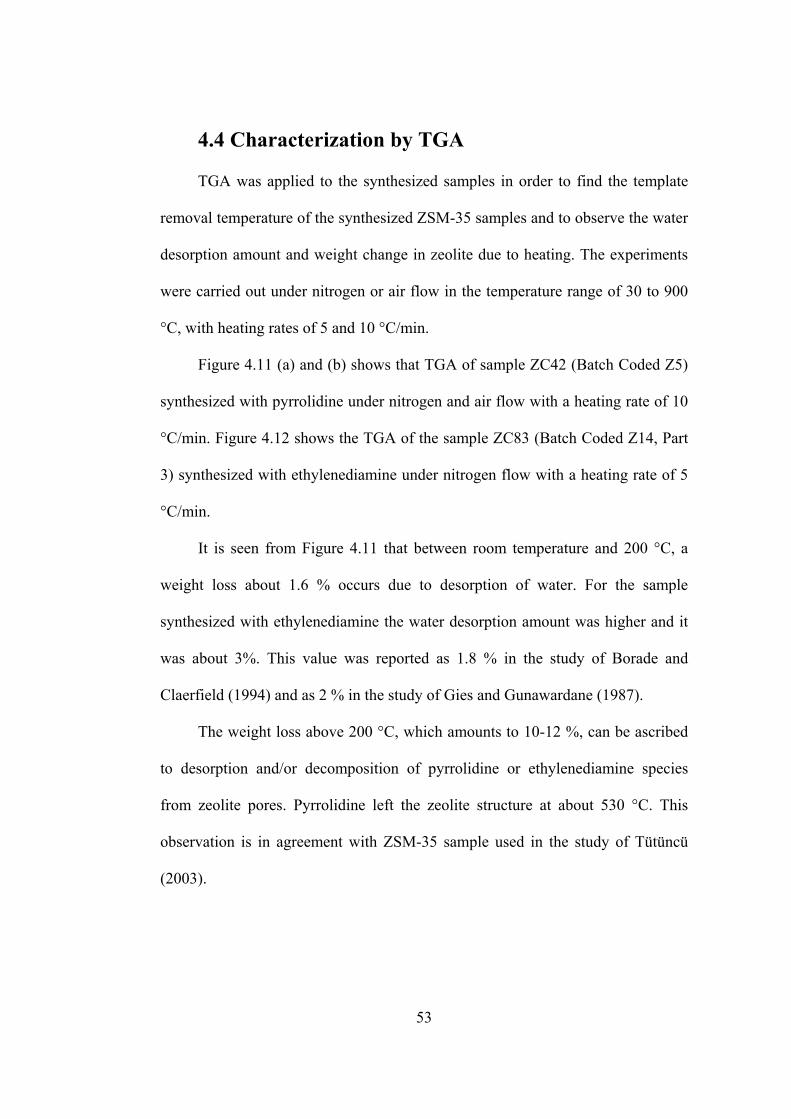
53
4.4 Characterization by TGA
TGA was applied to the synthesized samples in order to find the template
removal temperature of the synthesized ZSM-35 samples and to observe the water
desorption amount and weight change in zeolite due to heating. The experiments
were carried out under nitrogen or air flow in the temperature range of 30 to 900
°C, with heating rates of 5 and 10 °C/min.
Figure 4.11 (a) and (b) shows that TGA of sample ZC42 (Batch Coded Z5)
synthesized with pyrrolidine under nitrogen and air flow with a heating rate of 10
°C/min. Figure 4.12 shows the TGA of the sample ZC83 (Batch Coded Z14, Part
3) synthesized with ethylenediamine under nitrogen flow with a heating rate of 5
°C/min.
It is seen from Figure 4.11 that between room temperature and 200 °C, a
weight loss about 1.6 % occurs due to desorption of water. For the sample
synthesized with ethylenediamine the water desorption amount was higher and it
was about 3%. This value was reported as 1.8 % in the study of Borade and
Claerfield (1994) and as 2 % in the study of Gies and Gunawardane (1987).
The weight loss above 200 °C, which amounts to 10-12 %, can be ascribed
to desorption and/or decomposition of pyrrolidine or ethylenediamine species
from zeolite pores. Pyrrolidine left the zeolite structure at about 530 °C. This
observation is in agreement with ZSM-35 sample used in the study of Tütüncü
(2003).
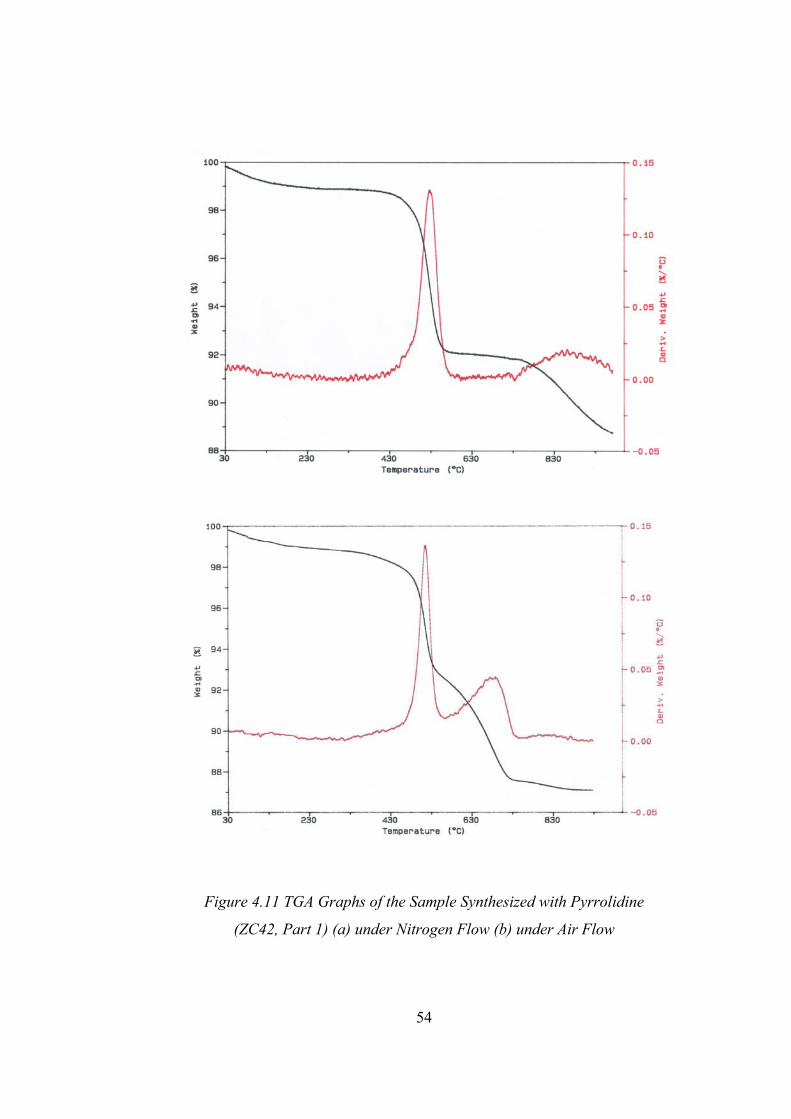
54
Figure 4.11 TGA Graphs of the Sample Synthesized with Pyrrolidine
(ZC42, Part 1) (a) under Nitrogen Flow (b) under Air Flow

55
Figure 4.12 TGA Graph of Sample ZC83 (Part 3) Synthesized with
Ethylenediamine under Nitrogen Flow

56
Ethylenediamine left the structure in a temperature range from 260 to 800
°C. Similar situation was also implied in the study of Gies and Gunawardane
(1987) that the removal of ethylenediamine was given in the temperature range
from 350 to 800 °C.
Figure 4.11 (a) and (b) compares the TGA results of the same sample under
nitrogen and air flow. In both cases similar results were observed for template
removal temperature, water desorption amount and total weight loss. Under
nitrogen flow one peak belonging to pyrrolidine removal was observed at about
530 °C. However, under air flow at about 700 °C a second broad peak was
observed. This situation probably happened because of volatilization of the coked
residuals of pyrrolidine in the structure under air atmosphere.
In Figure 4.11 (a), weight loss was observed to continue at about 900 °C,
this situation was clarified in Figure 4.11 (b) that under nitrogen flow as coked
organic particles left the structure at higher temperatures than they do under air
flow and they imply their existence as weight loss. They would most probably
leave the structure above 900 °C in nitrogen flow because in the TGA graph of
ZSM-35 sample used in the study of Tütüncü (2003) weight loss increment was
seen to be finished at about 950 °C and above this temperature it was stayed at a
constant value. In the case of TGA under air flow, after the coked residuals left
the structure at about 700 °C, the weight loss was almost stayed constant.
4.5 Thermal Stability Test
Thermal stability test was applied in order to obtain the structure breakdown
temperature of the synthesized ZSM-35 samples. Samples were treated at

57
different temperatures in the range of 200 to 1100 °C. The heating rate was 20
°C/min. The changes in the structure of the treated products were observed by
XRD analysis and the differences in XRD patterns were investigated.
This test was applied on completely crystallized samples ZC42, ZC71 which
were synthesized in the presence of pyrrolidine and ZC81 which was synthesized
with ethylenediamine. ZC42 was again scanned by XRD with smear mount before
applying heat treatment and its crystallinity index was obtained as 0.95. The
crystallinity results of the samples after heat treatments are shown in Table 4.7.
The XRD patterns of ZC42 at different treatment temperatures were shown in
Figure 4.13.
It was observed from Table 4.7 that the crystallinities of the product were
reduced as the treating temperature increased for the samples synthesized with
both templates. Also, the intensity of the first peak at 2 theta angle of 9.2 was
seemed to be intensified with increasing temperature. The other intensities were
observed to decrease relative to each other.
The analyses showed that the structure of the synthesized ZSM-35 samples
were stable up even at 1050 °C. At 1100 °C the structure was totally collapsed.
This temperature is greater than the ones given in previous studies. For example,
the thermal stability of ZSM-35 was reported as 952 °C by Fjellvag et al. (1989),
as 1000 °C by Gies and Gunawardane (1987), Borade and Clearfield (1994),
Kanno et al. (1994) and as 1019 °C by Long et al. (2000).

58
Table 4.7 Thermal Stability Test Crystallinity Results
Sample No Treating
Temperature (°C)
Treatment Time (h)
Cyrstallinity Index
ZC42-1 200 0.5 0.88
ZC42-2 300 0.5 0.85
ZC42-3 400 0.5 0.67
ZC42-4 500 0.5 0.71
ZC42-5 600 0.5 0.76
ZC42-6 700 0.5 0.57
ZC42-7 800 0.5 0.81
ZC42-8 900 0.5 0.59
ZC42-9 950 0.5 0.71
ZC42-10 950 1.0 0.69
ZC42-11 950 2.0 0.69
ZC42-12 1000 0.5 0.70
ZC42-13 1000 1.0 0.52
ZC42-14 1000 2.0 0.42
ZC42-15 1050 0.5 0.68
ZC42-16 1050 1.0 0.80
ZC42-17 1050 2.0 0.55
ZC42-18 1100 2.0 0.00
ZC71-1 600 2.0 0.67
ZC71-2 900 2.0 0.65
ZC71-3 1050 2.0 0.51
ZC81-1 600 2.0 0.66
ZC812 900 2.0 0.63
ZC81-3 1050 2.0 0.39
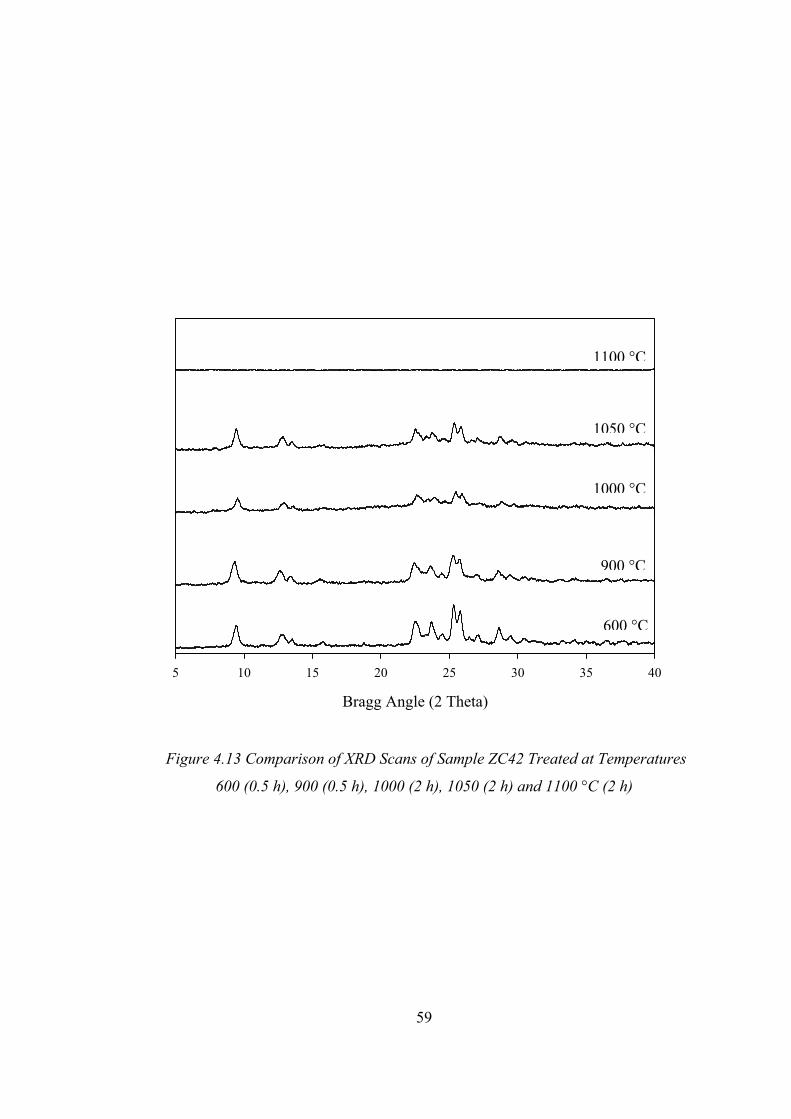
59
Figure 4.13 Comparison of XRD Scans of Sample ZC42 Treated at Temperatures
600 (0.5 h), 900 (0.5 h), 1000 (2 h), 1050 (2 h) and 1100 °C (2 h)
Bragg Angle (2 Theta)
5 10 15 20 25 30 35 40
600 °C
900 °C
1000 °C
1050 °C
1100 °C

60
4.6 Sorption Capacity Measurements
Total sorption volume of ZSM-35 was reported by Jacobs and Martens
(1987) as 0.1561 cm3/g of which 0.1000 cm3/g is the pore volume of 10
membered rings. Previous studies (Harrison et al. (1987) and Tütüncü (2003)) has
shown that that methanol can penetrate both 10 and 8 membered ring channels of
ferrierite and limiting methanol sorption capacities can be taken as an indication
of purity of the samples. For this purpose, equilibrium sorption capacities of some
high crystallinity samples of were measured in a gravimetric sorption apparatus.
Measurements were carried out at 0 and 25 °C and at different relative pressures
(P/P0) where P is the equilibrium pressure and P0 is the vapor pressure of
methanol at 0 °C ( 28.12 mmHg) and 25 °C (109.86 mmHg) (Perry and Green,
1999). Volumetric methanol sorption capacities are calculated from the weight
absorbed assuming that methanol exists as a normal liquid at the temperature of
adsorption. Liquid densities of methanol at 0 °C and 25 °C are taken as 0.8102
and 0.7893 g/cm3 respectively (Perry and Green, 1999). Table 4.8 gives the data
of this study and some previous studies for comparison. It is shown that sorption
under comparable conditions, ZSM-35 samples synthesized by templates
pyrrolidine and ethylenediamine have high volumetric sorption capacities
approaching to the theoretical intracrystalline volume of ZSM-35. The volumetric
sorption capacities calculated at 0 °C are higher than those calculated at 25 °C
under comparable relative pressures. This is probably due to more favorable
packing of methanol molecules in the channels of ZSM-35 at the lower
temperature.

61
Table 4.8 Comparison of Methanol Sorption Capacities of Synthesized ZSM-35
Samples with Previous Studies
Reference T (°C) P/P0 Sorbent
Absorbed Volume of Methanol (cm3/g)
% Filling of Total Pore Volume
25 0.5 Na ZSM-35 (Py) 0.1380 88.4
0 0.5 Na ZSM-35 (Py) 0.1495 95.8
0 0.4 Na ZSM-35 (ED) 0.1363 87.3 This Study
0 0.8 Na ZSM-35 (ED) 0.1518 97.2
Harrison et al. (1987) 23 0.5 H Ferrierite 0.1357 86.9
Öztin (1997) 25 0.5 Na ZSM-35 0.1218 78
Karslı et al. (2003) 25 0.5 H Ferrierite 0.1200 77
Tütüncü (2003) 23 0.5 Na ZSM-35 0.1150 73.7
Long et al. (2000) 25 0.6 Na,K ZSM-35 0.0850 54.5
Kıvanç et al. (1992) 25 0.5 Na Ferrierite 0.0792 50.7

62
CHAPTER 5
CONCLUSIONS
1. From the experiments performed in the presence of template pyyrolidine at
SiO2/Al2O3 ratio 25 at 177 °C and the experiments performed at SiO2/Al2O3
ratio of 20, at temperatures 150, 177 and 200 °C, ZSM-35 was synthesized
as a single phase product.
At 225 °C, mordenite was observed as a minor phase along with major
phase ZSM-35.
2. From the experiments performed in the presence of template
ethylenediamine at SiO2/Al2O3 ratio of 20, at temperatures 150, 177, 200
and 225 °C, pure phase ZSM-35 was synthesized.
3. ZSM-35 crystals synthesized with pyrrolidine were observed to be spherical
crystal agglomerates of 15-20 µm size with individual crystallites smaller
than 1 µm. The morphology of the products synthesized with
ethylenediamine at temperatures exhibits spherical agglomerates composed
of platelet crystallites.
63
4. The thermal stability analyses showed that the structure of the synthesized
ZSM-35 samples is stable up even at 1050 °C. At 1100 °C the structure
totally collapses.
5. The volumetric sorption capacities for methanol at 0 and 25 °C approached
to the theoretical pore volume reported for ZSM-35.
5.1 Recommendations
In this study the crystallizatiıon field of ZSM-35 was investigated by
changing the synthesis parameters in certain ranges. This investigation can further
be extented by enlarging the parameter ranges or by applying different synthesis
parameters such as the H2O amount, the template amount or Na2O/Al2O3 ratio to
see their effects on the synthesis of ZSM-35.
The methanol sorption capacity of the synthesized samples can be measured
at higher temperatures in order to observe the effect of temperature on the sorption
capacity. Also, sorption capacity measurements can be performed in hydrogen
form ZSM-35 to observe the capacity differences in sodium and hydrogen forms
of ZSM-35. The adsorptive properties of ZSM-35 can further be extented by using
different sorbates.
64
REFERENCES
Araya A., Lowe B. M., ‘A Partial Determination of the Stability Fields of
Ferrierite and Zeolites ZSM-5, ZSM-48, and NU-10 in the K2O- Al2O3- SiO2-
NH2[CH2] 6NH2 System’, J. Chem. Res. 6, 192-193, 1985.
Barrer R. M., Marshall D., ‘Hydrothermal Chemistry of Silicates. Part XIII.
Synthetic Barium Aluminosilicates’, J., Amer. Mineral. 50, 484, 1965.
Breck D.W., ‘Zeolite Molecular Sieves’, Wiley, Newyork, 1974.
Borade, R.B., Clearfield, A., ‘Synthesis of ZSM-35 Using Trimethylcetyl-
ammonium Hydroxide as a Template’, Zeolites 14, 458-461, 1994.
Cormier W. E., Sand L. B., ‘Synthesis and Metastable Phase-Transformations of
Na- Ferrierites, Na,K- Ferrierites and K-Ferrierites’, Amer. Mineral. 52, 1259-
1266, 1976.
Çulfaz A., Yılmaz K.A., ‘Synthesis and Characterization of Ferrierite’, Crystal
Res. & Technol. 20, 11-19, 1985.
Elvers B., Hawkins S., ed, ‘Ullmann’s Encylopedia of Industrial Chemistry’, Vol.
A 28, 475-504, Weinheim, New York, 1996.
Fjellvag H., Lillerud K.P., Norby P., Sorby K. ‘Structural Properties on Some
Ferrierite-Type Zeolites’, Zeolites 9, 1989.

65
Forbes N.R., Rees L.V., ‘The Synthesis of Ferrierite, ZSM-5 and Theta-1 in the
Presence of Diethanolamine: Experimental’, Zeolites 15, 444-451, 1995.
Gies H., Gunawardene R. P., ‘One-Step Synthesis, Properties and Crystal
Structure of Aluminum-Free Ferrierite’, Zeolites 7, 442-445, 1987.
Harrison I.D., Leach H.F., Whan D.A., ‘Comparison of Shape Selective
Properties of Ferrierite, ZSM-5 and ZSM-11, Zeolites 7, 21-27, 1987.
Jacobs P.A., Martens J.A., ‘High Silica Zeolites of the Ferrierite Family’ Stud.
Surf. Sci. Catal. 33, 217-232, 1987.
Kanno N., Miyake M., Sato M., ‘Synthesis of Ferrierite, ZSM-48 and ZSM-5 in
Glycerol Solvent’, Zeolites 14, 625-628, 1994.
Karslı H., Çulfaz A., Yücel H., ‘Sorption Properties of Synthetic Ferrierite’,
Chemical Engineering Communications, 190, 643-704, 2003.
Kerr I.S., ‘ Structure of Ferrierite’, Nature 210, London, 294, 1967.
Kibby C. L. , Perrotta A. J., Massoth F. E., ‘Composition and Catalytic Properties
of Synthetic Ferrierite’, J. Catal. 35, 256-272, 1974.
Kıvanç, A.N., ‘Adsorption Properties of Synthetic and Natural Ferrierite’, M.Sc.
Thesis, METU, Ankara, 1992.
Long Y., Ma M., Sun Y., Jiang H., ‘Synthesis, Ion-exchange, Structural
Characterization and Adsorption of K,Na-FER Type Zeolite’, Journal of Inclusion
Phenomena and Macrocyclic Chemistry 37, 103-120, 2000.
Morimoto N., Takatsu K., Sugimoto M., US Patent 4,578,259, 1986.

66
Öztin A., ‘Sorption Properties of a High Silica Zeolite ZSM-35’, M.Sc. Thesis,
METU, Ankara, 1997.
Perry R.H., Green D.W., ed., ‘Perry’s Chemical Engineering Handbook’, 7th
Ed., 2-41, 2-70, 2-111, McGraw-Hill, New York, 1999.
Plank C.J., Rosinski E.J., Rubin M.K., US Pat. 4,016,245, assigned to Mobil Oil
Corp., 1977.
Robson H., ‘ How to Read a Patent’, Microporous Materials 22, 551-666, 1998.
Seddon D., Whittam T.V.E., Patent B-55, 529, 1985. Shashikala J.R., Satyanarayana C.V.V., Chakrabarty D.K., ‘Shape Selective
Catalysis by ZSM-35 Zeolites, Disproportion of Ethylbenzene and Isomerization
of m-Xylene’, Appl. Catal 69, 177-186, 1991.
Suzuki K., Kiyozumi Y., Shin S., Fjuisawa K., Watanabe H., Saita K., Noguchi
K., ‘Zeolite Synthesis in the System Pyrrolidine-Na2O-Al2O3-SiO2-H2O’, Zeolites
6, 290-298, 1986.
Szostak R., ‘Handbook of Molecular Sieves’, Van Nostrand Reinhold, New York,
1992.
Tütüncü G., ‘Sorption Properties of High Silica Zeolites’, M.Sc. Thesis, METU,
Ankara, 2003.
Valyocsic E.W., Rollmann L.D., ‘ Diamines as Template in Zeolite
Crystallization’, Zeolites 5, 123-125, 1985.
Vaughan P.A., ‘The Crystal Structure of the Zeolite Ferrierite’, Acta Crystallogr.
21, 983, 1966.

67
Wenyang X., Jianquan L.,Wenyuan L., Huiming Z., Bingchang L., ‘Nonaqueous
Synthesis of ZSM-35 and ZSM-5’, Zeolites 9 , 468-473, 1989.
Whittam T.V.E., Patent A-103, 981, 1984.
68
APPENDIX A
SYNTHESIS CALCULATIONS
A.1 Crystallinity Index Calculation
Crystallinity index of the samples were calculated from the following
equation,
20
n,sn=1
20
n,0n=1
I
Crystallinity Index =
I
∑
∑
In,s represents the peak intensity data of the synthesized sample and In,0
represents the peak intensity data of the reference sample. In order to form a
reference sample, 20 major peaks were selected from the XRD patterns of highly
crystalline, pure ZSM-35 samples. The intensity data of these 20 peaks were
summed up for all the samples. These summations were then averaged for
determining the intensity summation data of 20 peaks of the reference sample.
The crystallinity index calculation method applied on the 9 selected samples is
shown in Table A1.

69
Table A.1 Intensity Data and Crystallinity Index Calculation of the Most
Crystalline ZSM-35 Samples Intensity (I)
Peak No
Bragg Angle ZC41 ZC54 ZC65 ZC68 ZC71 ZC83 ZC86 ZC92 ZC105 AVG RI
1 9.28 800 1180 850 1000 1040 1100 950 1000 1000 991±110 53
2 12.52 350 400 350 370 450 450 470 450 450 416±45 22
3 13.39 250 300 350 400 350 320 350 250 300 319±47 17
4 15.38 100 200 200 200 200 170 120 150 120 162±39 9
5 17.92 200 200 200 200 240 170 120 150 100 176±42 9
6 22.34 1350 1450 1420 1550 1560 1250 1250 1100 1250 1353±146 72
7 22.62 1200 1250 1070 1150 1260 1250 1170 1100 1100 1172±68 62
8 23.10 500 550 520 500 600 600 550 500 580 544±39 29
9 23.60 900 1000 950 850 1020 1250 1100 1000 1050 1013±110 54
10 24.32 500 650 580 550 590 650 620 550 630 591±48 31
11 25.23 1850 1900 1690 1750 1900 2050 2060 1950 1750 1878±124 100
12 25.67 1520 1650 1800 1800 1750 1700 1550 1550 1670 1666±101 89
13 26.29 270 400 400 500 360 350 450 350 350 381±63 20
14 26.94 400 450 430 400 470 390 450 350 350 410±41 22
15 28.52 500 600 600 600 650 650 700 650 700 628±58 33
16 29.38 300 320 310 350 400 400 370 350 450 361±46 19
17 30.26 150 250 230 350 220 200 230 250 200 231±51 12
18 30.65 100 150 230 250 220 170 170 200 200 188±43 10
19 33.98 150 150 150 150 220 200 200 200 220 182±30 10
20 36.33 120 100 150 150 220 200 200 200 220 173±42 9
20
n,sn 1
I=
∑ 11510 13150 12480 13070 13720 13520 13080 12300 12690 12836±637 -
Crystallinity Index
20
n,sn=1
20
n,0n 1
I
CI =
I=
∑
∑
0.90 1.03 0.97 1.02 1.07 1.05 1.02 0.96 0.99 1.00±0.05 -

70
For determining crystallinity indices of the samples having competing phase
mordenite in their structure, a similar method was applied on 5 peaks which are
not overlapping or existing very near to the mordenite peaks in XRD pattern. The
intensity summation of both samples were calculated for only the 5 selected
peaks. The crystallinity index of the pure sample was calculated by dividing the
intensity summation of 20 peaks to the same value of the reference sample as
described in Table A1. The crystallinity index of the two phase samples were
calculated by dividing the intensity summation of 5 peaks to the intensity
summation of 5 peaks of the pure phase sample (ZC92). Here, pure phase sample
was used as a new reference having crystallinity index of 0.96. Sample calculation
for this case is shown in Table A2.
Table A.2 Intensity Data and Crystallinity Index Calculation of ZSM-35 Samples
Having Competing Phase Mordenite
Intensity Peak No Bragg
Angle ZC59 ZC92
2 12.52 230 450
3 13.39 100 250
5 17.92 100 150
10 24.20 450 550
14 26.94 150 350 5
n,sn 1
I=
∑ 1030 1750
Crystallinity Index 1030
0.96 = 0.571750
× 0.96

71
A.2 Yield Calculation
In the sample calculations of % yield, maximum yield and % conversion,
pure phase ZSM-35 sample ZC92 (Batch Code Z16) was used. It was synthesized
at the SiO2/Al2O3 ratio of 20, at 177 °C for 120 h.
Weight of Batch = 34.35 g
Weight of product = 2.52 g
Weight of Product (g) % Yield = 100
Weight of Batch (g)×
2.52 g% Yield = 100
34.35 g× = 7.33 %
A.3 Maximum Yield Calculation
Sample batch composition for ZSM-35 synthesis:
1.85 Na2O. Al2O3. 20 SiO2. 592 H2O. 19.7 ED
In maximun yield calculations all the reactants were assumed to stay in solid
phase product during removal from the autoclaves.
Molecular Weights of Components (g/gmole):
Na2O 61.99
Al2O3 101.96
SiO2 60.09
H2O 18.01
ED (Ethylenediamine) 59.8
72
Weight of Batch :
61.99 × 1.85 + 101.96 + 60.09 × 20 + 18.01 × 592 + 59.8 × 19.7 = 13258.4 g
Formula ZSM-35 (EDAX) :
Na2O. Al2O3. 20 SiO2
Formula Weight of ZSM-35 (Water and Template Free):
61.99 + 101.96 + 60.09 × 20 = 1365.75 g
The amount of water and template in zeolite structure were determined from
TGA results as 14 %.
Formula Weight of ZSM-35 = 1365.75/ 0.86 = 1588.08 g
Maximum yield per 100 g Batch:
2 3
2 3
1 mole Al O1 mole BatchMaximum Yield = 100 g Batch
13258.4 g 1 mole Batch
1588.08 g1 mole ZSM-35
1 mole Al O 1 mole ZSM-35
= 11.
× × ×
×
98

73
A.4 Conversion Calculation
In this sample, ZC92, Al2O3 or SiO2 can be defined as the limiting reactant
since both of them have the same molar amount in batch composition and in the
structure of the product
Yield % Conversion = Crystallinity Index
Maximum Yield×
7.33 % Conversion = 0.96 100
11.98× × = 58.7 %

74
A.5 Crystallinity Results
%
Con
vers
ion
-
25.6
42.8
45.6
Yie
ld/
Max
imum
Y
ield
-
0.71
0.75
0.80
Cry
stal
linity
In
dex
-
0.36
0.57
0.57
%
Yie
ld
-
4.90
5.16
5.55
Wei
ght o
f Pr
oduc
t (g)
-
1.39
1.58
1.68
Wei
ght o
f B
atch
(g)
-
28.3
5
30.6
0
30.2
5
Cry
stal
line
Phas
es
Am
orph
ous
Am
orph
ous M
ajor
ZS
M-3
5 M
inor
ZSM
-35
Mor
deni
te
ZSM
-35
Mor
deni
te
Cry
stal
lizat
ion
Tim
e (h
)
0 36
48
168
Sam
ple
Cod
e
ZC56
ZC57
ZC58
ZC59
Tabl
e A.
3 C
ryst
alliz
atio
n of
ZSM
-35
from
a M
olar
Bat
ch C
ompo
sitio
n of
1.85
Na 2
O. A
l 2O3.
10 S
iO2.
592
H2O
. 19.
7 Py
at T
= 1
77 °C
Bat
ch
Cod
e
Z9

75
%
Con
vers
ion
- - -
26.5
50.4
58.7
Yie
ld/
Max
imum
Y
ield
- - -
0.78
0.71
0.61
Cry
stal
linity
In
dex
- - -
0.34
0.71
0.96
%
Yie
ld
- - -
9.38
8.53
7.33
Wei
ght o
f Pr
oduc
t (g)
- - -
2.88
2.56
2.52
Wei
ght o
f B
atch
(g)
- - -
30.1
7
30.0
0
34.3
5
Cry
stal
line
Phas
es
Am
orph
ous
Am
orph
ous
ZSM
-35
Am
orph
ous
ZSM
-35
Am
orph
ous
ZSM
-35
ZSM
-35
ZSM
-35
Cry
stal
lizat
ion
Tim
e (h
)
0 18
24
36
60
120
Sam
ple
Cod
e
ZC87
ZC88
ZC89
ZC90
ZC91
ZC92
Tabl
e A.
4 C
ryst
alliz
atio
n of
ZSM
-35
from
a M
olar
Bat
ch C
ompo
sitio
n of
1.85
Na 2
O. A
l 2O3.
20 S
iO2.
592
H2O
. 19.
7 ED
at T
= 1
77 °C
Bat
ch
Cod
e
Z16

76
%
Con
vers
ion
-
27.7
74.9
82.3
Yie
ld/
Max
imum
Y
ield
-
0.77
0.70
0.77
Cry
stal
linity
In
dex
-
0.36
1.07
1.07
%
Yie
ld
-
9.12
8.25
9.02
Wei
ght o
f Pr
oduc
t (g)
-
2.45
2.27
2.49
Wei
ght o
f B
atch
(g)
-
26.7
8
27.5
2
27.6
1
Cry
stal
line
Phas
es
Am
orph
ous
Am
orph
ous
ZSM
-35
ZSM
-35
ZSM
-35
Cry
stal
lizat
ion
Tim
e (h
)
8 15
24
48
Sam
ple
Cod
e
ZC69
ZC70
ZC71
ZC72
Tabl
e A.
5 C
ryst
alliz
atio
n of
ZSM
-35
from
a M
olar
Bat
ch C
ompo
sitio
n of
1.85
Na 2
O. A
l 2O3.
20 S
iO2.
592
H2O
. 19.
7 Py
at T
= 2
00 °C
Bat
ch
Cod
e
Z12

77
%
Con
vers
ion
- 36
73.8
70.3
74.5
48.6
Yie
ld/
Max
imum
Y
ield
-
0.72
0.71
0.71
0.71
0.54
Cry
stal
linity
In
dex
-
0.50
1.04
0.99
1.05
0.90
%
Yie
ld
-
8.65
8.47
8.55
8.44
6.46
Wei
ght o
f Pr
oduc
t (g)
-
2.63
2.46
2.48
2.74
1.89
Wei
ght o
f B
atch
(g)
-
30.4
2
29.0
4
29.0
0
32.4
8
29.2
4
Cry
stal
line
Phas
es
Am
orph
ous
Am
orph
ous
ZSM
-35
ZSM
-35
ZSM
-35
ZSM
-35
ZSM
-35
Cry
stal
lizat
ion
Tim
e (h
)
0 15
24
72
120
192
Sam
ple
Cod
e
ZC79
ZC80
ZC81
ZC82
ZC83
ZC84
Tabl
e A.
6 C
ryst
alliz
atio
n of
ZSM
-35
from
a M
olar
Bat
ch C
ompo
sitio
n of
1.85
Na 2
O. A
l 2O3.
20 S
iO2.
592
H2O
. 19.
7 ED
at T
= 2
00 °C
Bat
ch
Cod
e
Z14

78
%
Con
vers
ion
- -
25.6
75
71
76.5
Yie
ld/
Max
imum
Y
ield
- -
0.80
0.75
0.71
0.75
Cry
stal
linity
In
dex
- -
0.32
1.00
1.00
1.02
%
Yie
ld
- -
9.39
8.81
8.35
8.80
Wei
ght o
f Pr
oduc
t (g)
- -
2.65
2.33
2.34
2.48
Wei
ght o
f B
atch
(g)
- -
28.2
2
26.4
4
28.0
2
28.1
8
Cry
stal
line
Phas
es
Am
orph
ous
Am
orph
ous
Am
orph
ous M
ajor
ZS
M-3
5 M
inor
ZSM
-35
ZSM
-35
Maj
or
Mor
deni
te M
inor
ZSM
-35
Maj
or
Mor
deni
te m
inor
Cry
stal
lizat
ion
Tim
e (h
)
0 3 6 10
15
24
Sam
ple
Cod
e
ZC98
ZC99
ZC10
0
ZC10
1
ZC67
ZC68
Tabl
e A.
7 C
ryst
alliz
atio
n of
ZSM
-35
from
a M
olar
Bat
ch C
ompo
sitio
n of
1.85
Na 2
O. A
l 2O3.
20 S
iO2.
592
H2O
. 19.
7 Py
at T
= 2
25 °C
Bat
ch
Cod
e
Z11

79
%
Con
vers
ion
-
44.3
68
67.6
63
71
Yie
ld/
Max
imum
Y
ield
-
0.75
0.82
0.76
0.67
0.70
Cry
stal
linity
In
dex
-
0.59
0.83
0.89
0.94
1.02
%
Yie
ld
-
9.02
9.86
9.06
7.97
8.32
Wei
ght o
f Pr
oduc
t (g)
-
2.08
2.89
2.55
2.37
2.45
Wei
ght o
f B
atch
(g)
-
23.0
7
29.3
2
28.1
6
29.7
4
29.4
4
Cry
stal
line
Phas
es
Am
orph
ous
ZSM
-35
Maj
or
Am
orph
ous M
inor
ZSM
-35
ZSM
-35
ZSM
-35
ZSM
-35
Cry
stal
lizat
ion
Tim
e (h
)
0 5 8 12
15
24
Sam
ple
Cod
e
ZC10
2
ZC10
3
ZC11
04
ZC10
5
ZC85
ZC86
Tabl
e A.
8 C
ryst
alliz
atio
n of
ZSM
-35
from
a M
olar
Bat
ch C
ompo
sitio
n of
1.85
Na 2
O. A
l 2O3.
20 S
iO2.
592
H2O
. 19.
7 ED
at T
= 2
25 °C
Bat
ch
Cod
e
Z15
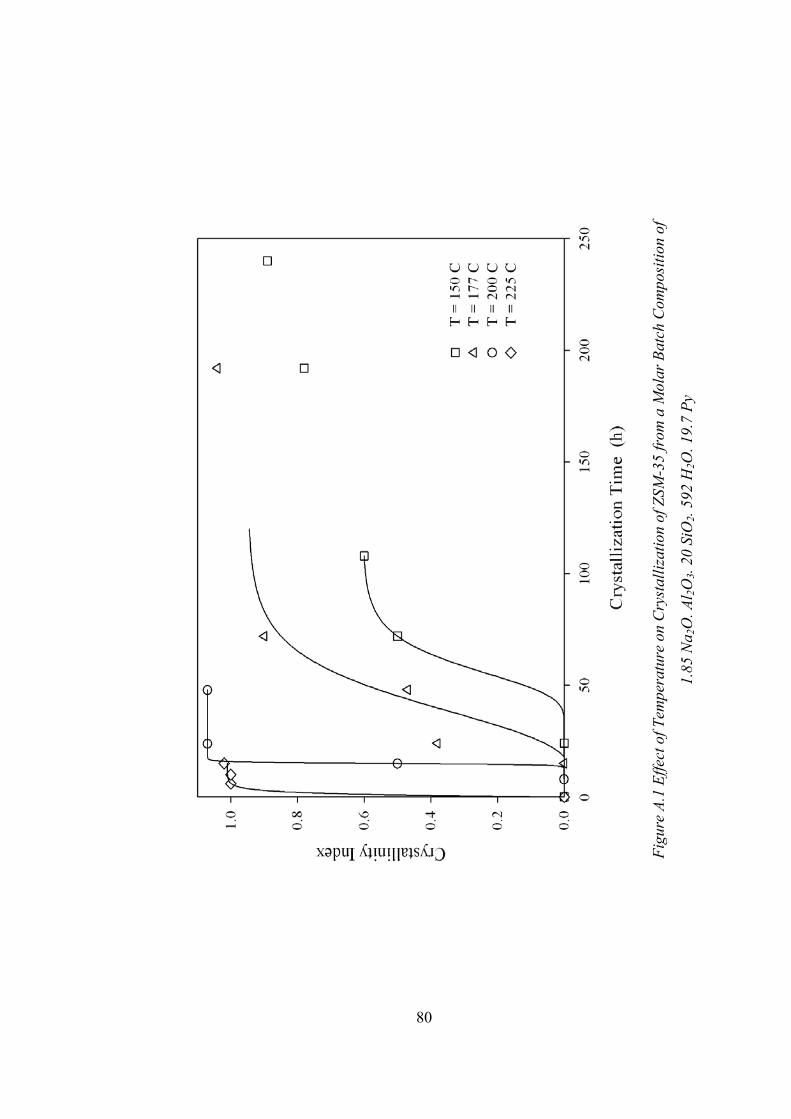
80
Figu
re A
.1 E
ffect
of T
empe
ratu
re o
n C
ryst
alliz
atio
n of
ZSM
-35
from
a M
olar
Bat
ch C
ompo
sitio
n of
1.85
Na 2
O. A
l 2O3.
20 S
iO2.
592
H2O
. 19.
7 Py

81
APPENDIX B
CHARACTERIZATION
B.1 X-Ray Diffraction Patterns
Bragg Angle (2 Theta)
5 10 15 20 25 30 35 40
Figure B.1 Comparison of XRD Patterns of Samples Synthesized with Pyrrolidine
(Bottom) and Ethylenediamine (Top) at the SiO2/Al2O3 ratio of 20 at 150 °C

82
Bragg Angle (2 Theta)
5 10 15 20 25 30 35 40
Figure B.2 Comparison of XRD Patterns of Samples Synthesized with Pyrrolidine
(Bottom) and Ethylenediamine (Top) at the SiO2/Al2O3 Ratio of 20 at 177 °C

83
Bragg Angle (2 Theta)
5 10 15 20 25 30 35 40
Figure B.3 Comparison of XRD Patterns of Samples Synthesized with Pyrrolidine
(Bottom) and Ethylenediamine (Top) at the SiO2/Al2O3 Ratio of 20 at 200 °C

84
B.2 Scanning Electron Micrographs
Figure B.4 SEM Micrograph of Sample ZC42 (Batch Code Z5, Part 1)
Synthesized at 177 °C for 8 Days with Template Pyrrolidine.
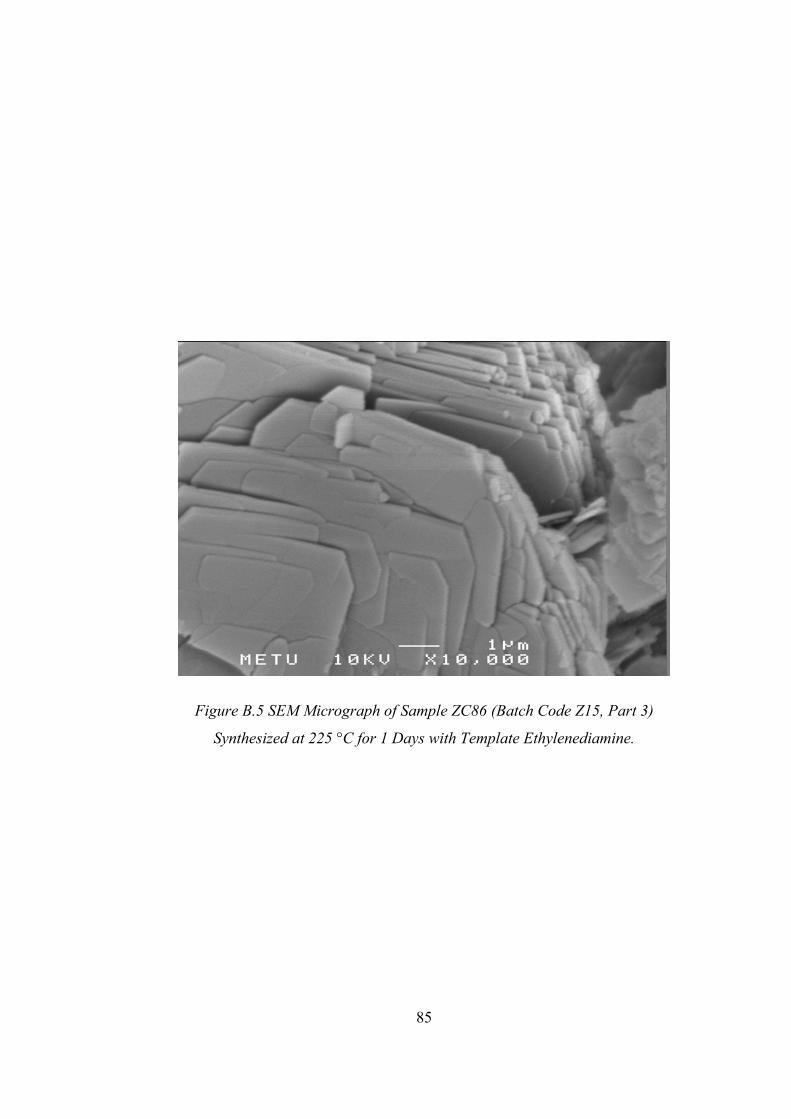
85
Figure B.5 SEM Micrograph of Sample ZC86 (Batch Code Z15, Part 3)
Synthesized at 225 °C for 1 Days with Template Ethylenediamine.

86
Figure B.6 SEM Micrograph of Sample ZC83 (Batch Code Z14, Part 3)
Synthesized at 200 °C for 5 Days with Template Ethylenediamine.

87
APPENDIX C
X-RAY DIFFRACTION DATA
Table C.1 Peak Listing of Natural Ferrierite from Kamloops Given by Kibby et al.
(1974)
Peak No d-Spacing Bragg Angle 2 (Theta) I/I0
11.3 7.82 20 1 9.61 9.2 100 2 7.00 12.65 30 3 6.61 13.42 20 4 5.84 15.17 50 3.99 22.28 90 7 3.88 22.92 10 9 3.79 23.47 20 3.69 24.12 50
11 3.54 25.16 80 12 3.49 25.52 80 14 3.31 26.94 20 15 3.15 28.33 30 3.07 29.09 30 2.97 30.09 30 2.90 30.83 20 2.58 34.77 30
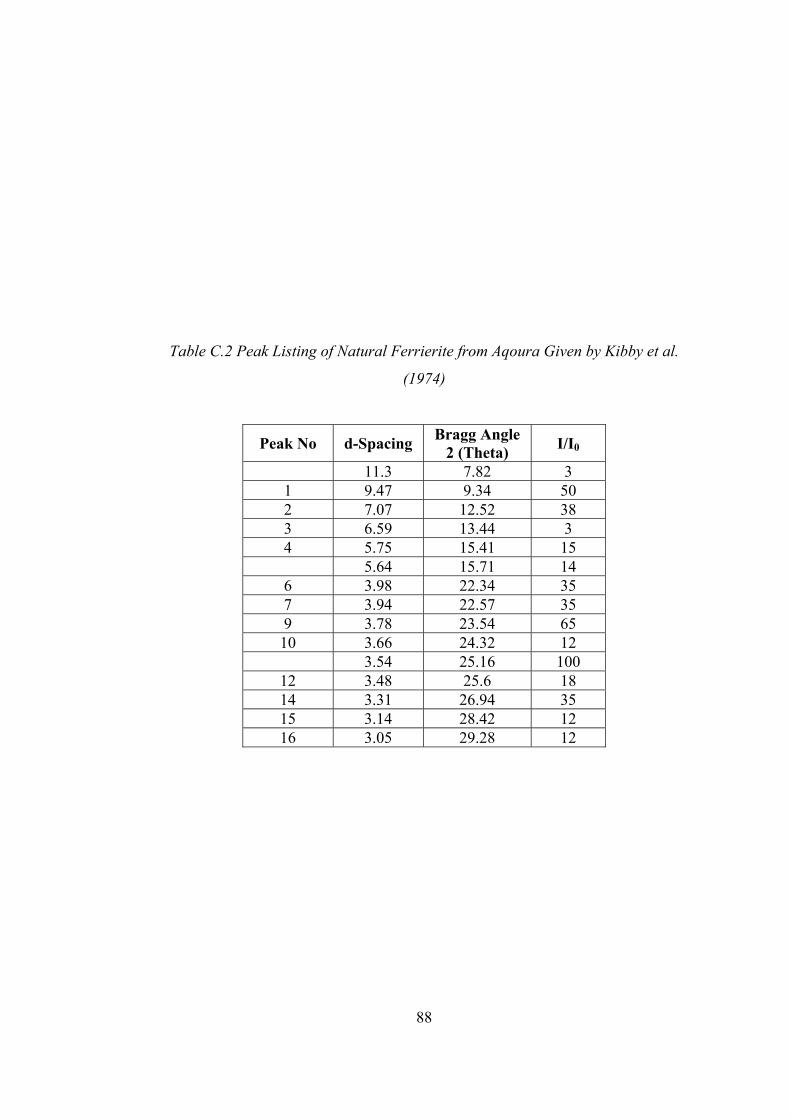
88
Table C.2 Peak Listing of Natural Ferrierite from Aqoura Given by Kibby et al.
(1974)
Peak No d-Spacing Bragg Angle 2 (Theta) I/I0
11.3 7.82 3 1 9.47 9.34 50 2 7.07 12.52 38 3 6.59 13.44 3 4 5.75 15.41 15 5.64 15.71 14 6 3.98 22.34 35 7 3.94 22.57 35 9 3.78 23.54 65 10 3.66 24.32 12 3.54 25.16 100
12 3.48 25.6 18 14 3.31 26.94 35 15 3.14 28.42 12 16 3.05 29.28 12

89
Table C.3 Peak Listing of Natural Ferrierite from Sonora Pass Given by Kibby et
al. (1974)
Peak No d-Spacing Bragg Angle 2 (Theta) I/I0
1 9.56 9.25 80 2 7.06 12.54 12 3 6.61 13.39 8 4 5.83 15.2 21 5.71 15.52 8 6 3.99 22.28 29 3.97 22.39 60 3.79 23.47 55 3.70 24.05 37
11 3.53 25.23 100 12 3.49 25.52 50 14 3.32 26.85 13 3.15 28.33 9 3.07 29.09 13 2.98 29.98 22

90
Table C.4 Peak Listing of Natural Ferrierite Given by Vaughan (1966)
Peak No
d-Spacing
Bragg Angle
2 (Theta)I/I0
Peak No
d-Spacing
Bragg Angle
2 (Theta) I/I0
11.36 7.78 58.80 19 2.64 33.91 4.20 1 9.58 9.23 100.00 2.63 34.08 0.70 2 7.06 12.53 9.20 2.58 34.72 2.80 6.98 12.69 13.70 2.57 34.91 0.70 3 6.62 13.38 7.90 2.57 34.92 1.10 5.82 15.23 26.10 2.49 36.04 0.80 5.68 15.59 2.50 2.48 36.20 1.30 5.44 16.28 0.20 20 2.48 36.29 0.20 5 4.96 17.87 5.50 2.43 37.00 2.80 4.86 18.26 0.50 2.42 37.22 0.60 4.79 18.53 2.20 2.39 37.56 0.20 4.57 19.41 1.80 2.37 37.99 0.20 4.00 22.21 26.20 2.37 38.03 3.30 6 3.99 22.30 7.70 2.34 38.54 0.60 3.96 22.43 21.10 2.32 38.73 0.20 3.88 22.92 15.00 2.31 38.91 2.20 9 3.79 23.47 16.80 2.30 39.21 0.40 3.74 23.76 3.60 2.29 39.41 0.20 3.70 24.07 6.70 2.27 39.63 0.20 3.56 25.04 15.70 2.27 39.75 0.30
11 3.53 25.22 29.20 2.26 39.81 1.10 12 3.49 25.54 35.60 3.41 26.13 6.10 3.31 26.91 6.80
14 3.31 26.95 0.60 3.19 27.95 1.20 3.15 28.32 1.60 3.15 28.34 13.58
15 3.13 28.54 1.80 3.07 29.07 9.20 3.06 29.15 0.10 2.97 30.07 7.60
17 2.95 30.30 2.30 18 2.91 30.73 0.20 2.90 30.86 5.10 2.88 31.10 0.80 2.86 31.31 0.20 2.84 31.47 0.80 2.80 32.02 0.40 2.72 32.90 3.60 2.69 33.35 0.90
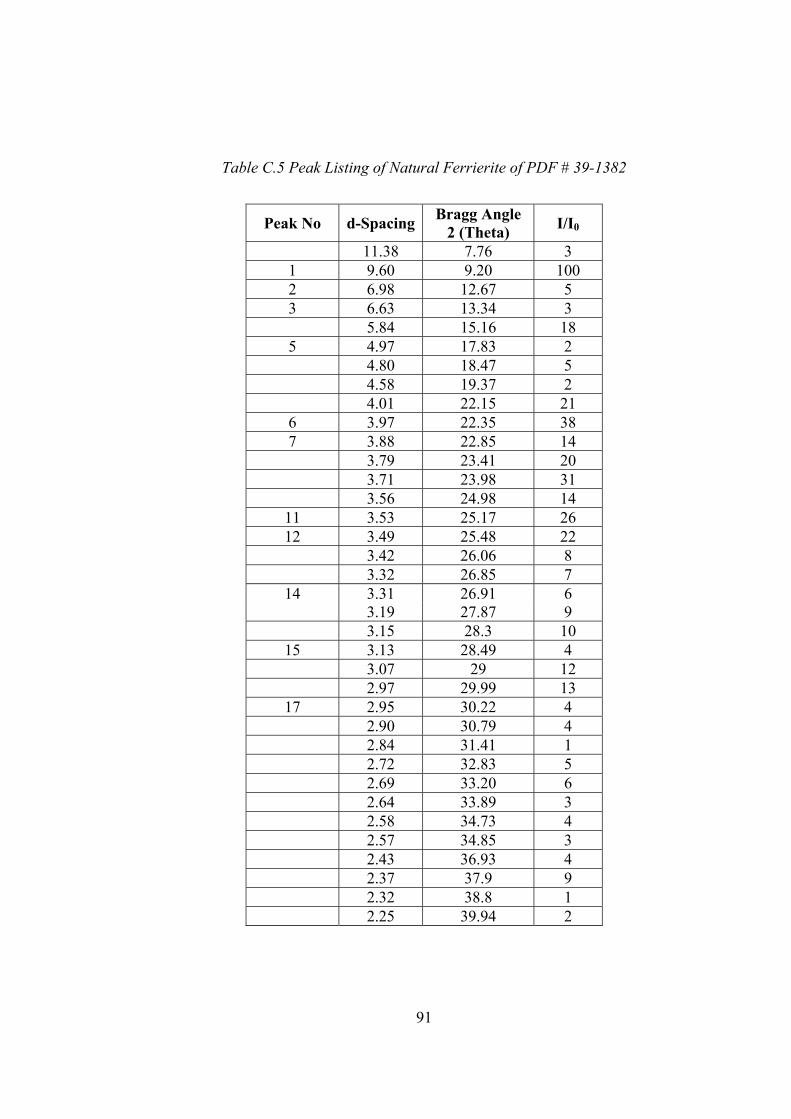
91
Table C.5 Peak Listing of Natural Ferrierite of PDF # 39-1382
Peak No d-Spacing Bragg Angle 2 (Theta) I/I0
11.38 7.76 3 1 9.60 9.20 100 2 6.98 12.67 5 3 6.63 13.34 3 5.84 15.16 18 5 4.97 17.83 2 4.80 18.47 5 4.58 19.37 2 4.01 22.15 21 6 3.97 22.35 38 7 3.88 22.85 14 3.79 23.41 20 3.71 23.98 31 3.56 24.98 14
11 3.53 25.17 26 12 3.49 25.48 22 3.42 26.06 8 3.32 26.85 7
14 3.31 26.91 6 3.19 27.87 9 3.15 28.3 10
15 3.13 28.49 4 3.07 29 12 2.97 29.99 13
17 2.95 30.22 4 2.90 30.79 4 2.84 31.41 1 2.72 32.83 5 2.69 33.20 6 2.64 33.89 3 2.58 34.73 4 2.57 34.85 3 2.43 36.93 4 2.37 37.9 9 2.32 38.8 1 2.25 39.94 2

92
Table C.6 Peak Listing of Synthetic Ferrierite Given by Barrer and Marshall
(1965)
Peak No d-Spacing Bragg Angle 2 (Theta) I/I0
1 9.49 9.32 75 2 7.07 12.52 20 3 6.61 13.39 55 4 5.77 15.36 15 6 3.99 22.28 45 7 3.94 22.57 35 3.86 23.04 25 9 3.78 23.54 50 3.67 24.25 30
11 3.54 25.16 90 12 3.48 25.6 100 14 3.31 26.94 20 15 3.14 28.42 55 3.06 29.18 45
17 2.96 30.19 25 2.90 30.83 35 2.58 34.77 10
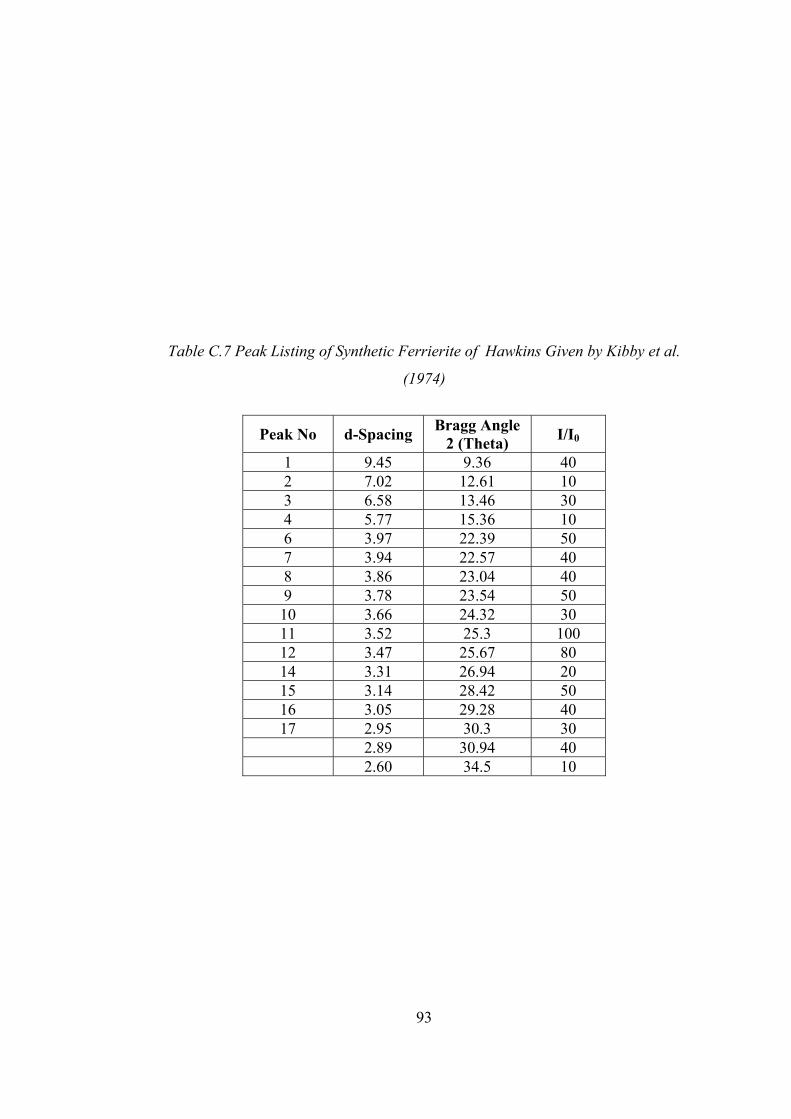
93
Table C.7 Peak Listing of Synthetic Ferrierite of Hawkins Given by Kibby et al.
(1974)
Peak No d-Spacing Bragg Angle 2 (Theta) I/I0
1 9.45 9.36 40 2 7.02 12.61 10 3 6.58 13.46 30 4 5.77 15.36 10 6 3.97 22.39 50 7 3.94 22.57 40 8 3.86 23.04 40 9 3.78 23.54 50 10 3.66 24.32 30 11 3.52 25.3 100 12 3.47 25.67 80 14 3.31 26.94 20 15 3.14 28.42 50 16 3.05 29.28 40 17 2.95 30.3 30 2.89 30.94 40 2.60 34.5 10

94
Table C.8 Peak Listing of Synthetic Ferrierite of Senderov Given by Kibby et al.
(1974)
Peak No d-Spacing Bragg Angle 2 (Theta) I/I0
1 9.57 9.24 100 2 7.12 12.43 20 3 6.70 13.21 20 4 5.68 15.6 40 6 4.00 22.22 80 9 3.76 23.66 60 10 3.66 24.32 40 3.57 24.94 50
12 3.49 25.52 70 3.33 26.77 10 3.15 28.33 40 3.06 29.18 20 2.91 30.72 10 2.57 34.91 10

95
Table C.9 Peak Listing of Synthetic Ferrierite Given by Kibby et al.(1974)
Peak No d-Spacing Bragg Angle 2 (Theta) I/I0
1 9.41 9.4 100 2 7.00 12.65 24 3 6.56 13.5 24 4 5.72 15.49 12 5.61 15.8 12 6 3.97 22.39 45 7 3.92 22.68 37 8 3.83 23.22 27 3.75 23.73 40
10 3.65 24.39 34 11 3.52 25.3 65 12 3.47 25.67 58 14 3.30 27.02 15 3.15 28.33 28
16 3.04 29.38 20 2.94 30.4 10 2.88 31.05 10 2.56 35.05 3

96
Table C.10 Peak Listing of Synthetic Ferrierite Given by Plank et al. (1977)
Peak No d-Spacing Bragg Angle 2 (Theta) I/I0
11.33 7.80 1 1 9.59 9.22 124 2 7.08 12.50 26 6.98 12.68 38 3 6.63 13.35 22 6.44 13.75 1 4 5.78 15.34 10 5.68 15.60 6 5 4.97 17.85 6 4.83 18.35 1 4.74 18.72 3 4.57 19.42 1 5 3.99 22.29 77 7 3.93 22.60 50 8 3.85 23.12 28 9 3.78 23.55 55 3.74 23.80 6
10 3.66 24.32 33 11 3.54 25.14 100 12 3.48 25.61 83 13 3.38 26.39 15 14 3.31 26.92 17 15 3.14 28.45 15 16 3.05 29.30 17 17 2.95 30.30 8 2.89 30.90 7 2.84 31.50 3 2.71 33.09 4
19 2.65 33.88 7 2.61 34.37 2 2.58 34.79 3 2.54 35.30 2
20 2.48 36.29 6 2.45 36.70 1 2.41 37.35 4 2.39 37.65 1

97
Table C.11 Peak Listing of Synthetic Ferrierite Given by Çulfaz and Yılmaz
(1985)
Peak No d-Spacing Bragg Angle 2 (Theta) I/I0
9.38 9.43 86 2 7.05 12.56 48 6.90 12.83 35 6.51 13.6 25 4 5.73 15.46 24 5.65 15.68 31 6 3.98 22.34 45 7 3.90 22.8 33 3.83 23.22 26 9 3.77 23.6 55 3.64 24.45 27
11 3.53 25.23 100 12 3.46 25.75 71 14 3.32 26.85 29 15 3.12 28.61 36 16 3.04 29.38 28 2.89 30.94 12 2.70 33.18 11

98
Table C.12 Peak Listing of Synthetic Ferrierite Given by Wenyang et al. (1989)
Peak No d-Spacing Bragg Angle 2 (Theta) I/I0
1 9.51 9.30 129 2 7.1 12.47 28 6.99 12.66 22 3 6.66 13.29 16 4 5.79 15.30 10 5.68 15.60 8 5 4.98 17.81 4 4.52 19.64 10 6 4 22.22 59 7 3.95 22.51 44 3.87 22.98 37 3.79 23.47 72 3.75 23.73 23
10 3.66 24.32 33 11 3.53 25.23 100 12 3.47 25.67 80 13 3.39 26.29 28 14 3.31 26.94 24 15 3.13 28.52 18 17 2.95 30.30 6 2.91 30.72 2 2.7 33.18 3

99
Table C.13 Peak Listing of Synthetic Ferrierite Given by Borade and Clearfield
(1994)
Peak No d-Spacing Bragg Angle (2 Theta) I/Io
1 9.5 9.31 78 2 7.03 12.59 21 6.97 12.70 24 3 6.6 13.42 26 4 5.77 15.36 13 5.67 15.63 12 5 4.96 17.88 22 6 3.98 22.34 54 7 3.94 22.57 39 8 3.85 23.10 50 9 3.77 23.60 30 10 3.66 24.32 33 11 3.53 25.23 100 12 3.48 25.60 68 13 3.38 26.37 19 14 3.31 26.94 22 15 3.14 28.42 26 16 3.05 29.28 13 18 2.89 30.94 11

100
Table C.14 Peak Listing of Synthetic Ferrierite Given by Robson (1998)
Peak No d-Spacing Bragg Angle (2 Theta) I/Io
1 9.53 9.28 36 2 7.07 12.52 8 3 6.61 13.39 17 4 5.76 15.38 8 5 4.95 17.92 8 4.48 19.8 4 6 3.98 22.34 65 7 3.93 22.62 43 8 3.85 23.1 29 9 3.77 23.6 52 10 3.66 24.32 29 11 3.53 25.23 100 12 3.47 25.67 98 13 3.39 26.29 17 14 3.31 26.94 17 15 3.13 28.52 32 16 3.04 29.38 14 17 2.95 30.26 10 18 2.92 30.65 14 2.71 33 4
19 2.64 33.98 9 2.57 34.9 3
20 2.47 36.33 12 2.43 37 6
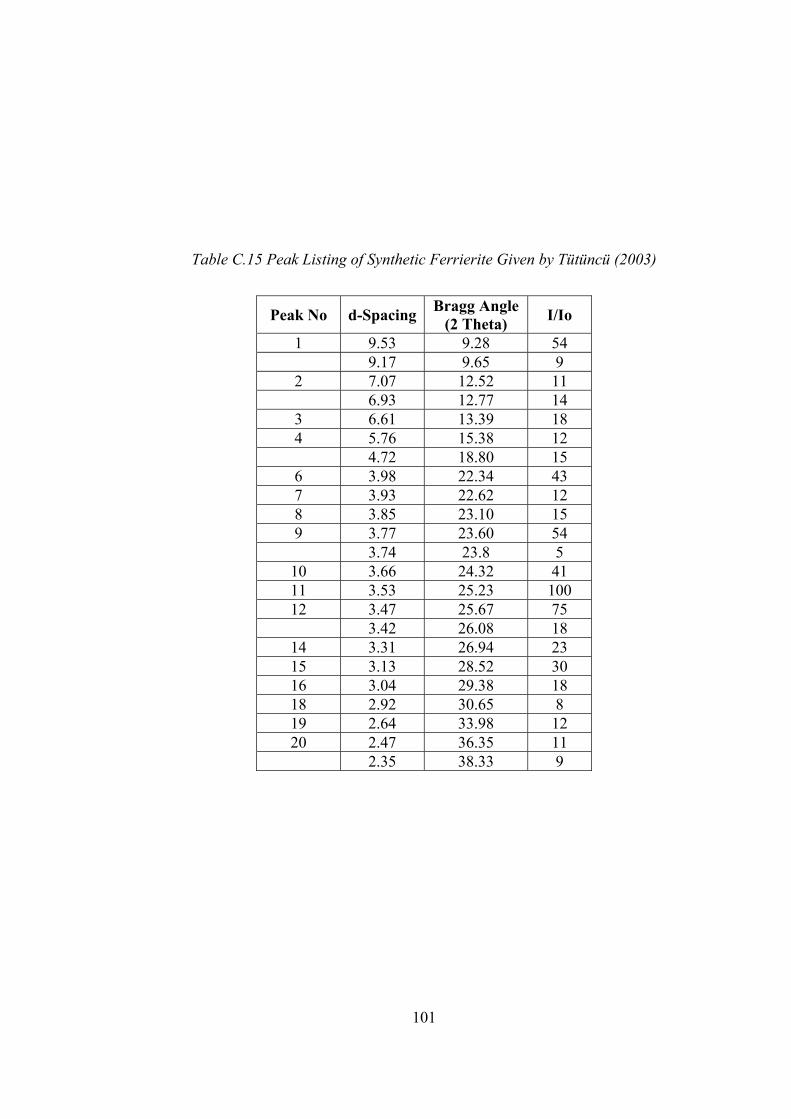
101
Table C.15 Peak Listing of Synthetic Ferrierite Given by Tütüncü (2003)
Peak No d-Spacing Bragg Angle (2 Theta) I/Io
1 9.53 9.28 54 9.17 9.65 9 2 7.07 12.52 11 6.93 12.77 14 3 6.61 13.39 18 4 5.76 15.38 12 4.72 18.80 15 6 3.98 22.34 43 7 3.93 22.62 12 8 3.85 23.10 15 9 3.77 23.60 54 3.74 23.8 5
10 3.66 24.32 41 11 3.53 25.23 100 12 3.47 25.67 75 3.42 26.08 18
14 3.31 26.94 23 15 3.13 28.52 30 16 3.04 29.38 18 18 2.92 30.65 8 19 2.64 33.98 12 20 2.47 36.35 11 2.35 38.33 9
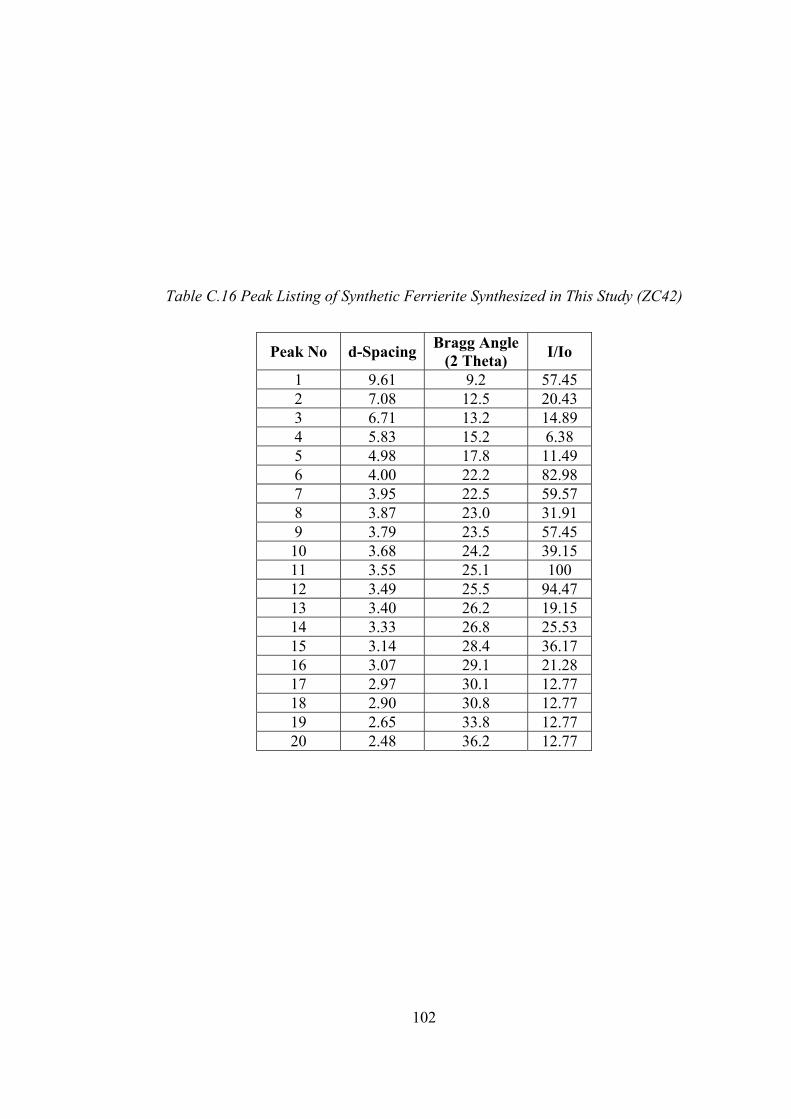
102
Table C.16 Peak Listing of Synthetic Ferrierite Synthesized in This Study (ZC42)
Peak No d-Spacing Bragg Angle (2 Theta) I/Io
1 9.61 9.2 57.45 2 7.08 12.5 20.43 3 6.71 13.2 14.89 4 5.83 15.2 6.38 5 4.98 17.8 11.49 6 4.00 22.2 82.98 7 3.95 22.5 59.57 8 3.87 23.0 31.91 9 3.79 23.5 57.45 10 3.68 24.2 39.15 11 3.55 25.1 100 12 3.49 25.5 94.47 13 3.40 26.2 19.15 14 3.33 26.8 25.53 15 3.14 28.4 36.17 16 3.07 29.1 21.28 17 2.97 30.1 12.77 18 2.90 30.8 12.77 19 2.65 33.8 12.77 20 2.48 36.2 12.77


![N-[3-(Trimethoxysilyl)propyl]ethylenediamine](https://img.pdfslide.us/doc/110x75/62493197db8cd85f1f3f67f5/n-3-trimethoxysilylpropylethylenediamine-.jpg)
