Embed Size (px)
Citation preview
RESEARCH ARTICLE
Syndrome-Specific Growth Charts for 22q11.2Deletion Syndrome in Caucasian ChildrenAlex Habel,1* Michael-John McGinn II,2 Elaine H. Zackai,2 Nancy Unanue,3
and Donna M. McDonald-McGinn2
1North Thames Cleft Unit, Great Ormond Street Hospital for Children, London, UK2The Children’s Hospital of Philadelphia, University of Pennsylvania School of Medicine, Philadelphia, Pennsylvania3Institute of Maternal and Child Research, School of Medicine, University of Chile, Santiago, Chile
Manuscript Received: 29 November 2011; Manuscript Accepted: 26 March 2012
Growth faltering occurs frequently in infancy in the 22q11
Deletion syndrome (22q11 DS). The subsequent course of
growth in childhood and outcome for final adult height lacks
consensus. We analyzed 5,149 growth data points from 812
Caucasian subjects with 22q11 DS, from neonates to 37 years
old.Chartswere constructed forheight,weight, bodymass index,
and head circumference (OFC) using the LMS Chart Maker
program. These charts were compared with the WHO birth to
4 years growth standard and US CDC 2000 growth reference
between 5 and 20 years. Starting from the 50th centile at birth, by
6–9months of age boysmean height andweight had fallen to the
9th centile, as did girls height but their weight fell less markedly,
to the25th centile. Feedingdifficultieswerenon-contributory. In
children under 2 years old with congenital heart disease (CHD)
meanweight was�0.5 SD lighter than noCHD.Catch up growth
occurred, more rapid in weight than height in boys. Up to 10
years old both sexes tracked between the 9th and 25th centiles. In
adolescence, the trend was to overweight rather than obesity.
At 19 years mean height was �0.72 SD for boys, �0.89 SD girls.
OFC was significantly smaller than the WHO standard in
infancy, between the 9th and 25th centile, rising to the 25th
centile by 5 years old. Thereafter the mean was close to the 9th
centile of the OFC UK growth reference, more prolonged and
marked than in previous studies. � 2012 Wiley Periodicals, Inc.
Key words: 22q11 deletion syndrome; velocardiofacial syn-
drome; Di George syndrome; growth charts
INTRODUCTION
The 22q11 deletion syndrome (22q11 DS) is the most common
autosomal microdeletion syndrome in man with an incidence of
one in 4,000 [Botto et al., 2003]. The prevalence of major cardiac
anomalies requiring surgery (30–40%), developmental delay/
learning disorders (90%), immune deficiency with recurrent
infections (40%), hypoparathyroidism (60%), hypothyroidism
and growth hormone insufficiency, and early feeding difficulties
(70%) including forms of cleft palate, are individually and cumu-
latively potential causes of growth impairment [Bassett et al., 2011].
Additionally, a direct effect of thedeletedDNAongrowth cannot be
discounted [Shprintzen and Golding-Kushner, 2008]. Individuals
with 22q11 DS have an increased prevalence of impaired growth
in childhood, with reports of variable degrees of recovery by
adulthood [Ryan et al., 1997; Digilio et al., 2001; Bassett et al.,
2005; Shprintzen and Golding-Kushner, 2008]. The present retro-
spective study of mixed cross-sectional and longitudinal growth
data of a Caucasian population aims to provide reference growth
charts showing how such children are growing.
PATIENTS AND METHODS
We studied 818 (412 boys, 52%) subjects, newborn to 37 years.
Height, weight, and head circumference (OFC) measurements
recorded during outpatient attendances in two tertiary children’s
hospitals, The Children’s Hospital of Philadelphia (CHOP), Phil-
adelphia, PA,USA, andGreatOrmond StreetHospital for Children
(GOSH) London, England, were retrospectively gleaned from the
records of Caucasian individuals with 22q11.2 deletion confirmed
by fluorescent in situ hybridization (FISH). None were character-
ized as having an atypical deletion. Exclusions comprised clinically
significant scoliosis, hemiplegia, and genetic co-morbidities. Thy-
roid disorders and growth hormone deficiency were investigated
*Correspondence to:
Alex Habel, MD, FRCP, MRCPCH, Great Ormond Street Hospital for
Children, Great Ormond Street, London WC1N 3JH, UK.
E-mail: [email protected]
Article first published online in Wiley Online Library
(wileyonlinelibrary.com): 18 June 2012
DOI 10.1002/ajmg.a.35426
How to Cite this Article:Habel A,McGinnM-J, Zackai EH,UnanueN,
McDonald-McGinn DM. 2012. Syndrome-
specific growth charts for 22q11.2 deletion
syndrome in Caucasian children.
Am J Med Genet Part A 158A:2665–2671.
� 2012 Wiley Periodicals, Inc. 2665
and treated on an individual basis where clinically appropriate
[Weinzimmer et al., 1998] and these subjects’ measurements
included. Observationsweremade and recorded by trained nursing
staff. Ethical committee approved protocols were followed for data
analysis by note case review as applied in each hospital.
The LMS statistical program was used to derive growth curves
from the data. It summarizes the reference data in terms of three
curves, the median (M), coefficient of variation (S), and skewness
(L). Each of the latter two is expressed as a Box-Cox power trans-
formation, with age the independent variable. These curves are
fitted as cubic splines using penalised likelihood (a trade-off
between roughness and goodness of fit) by non-linear regression
and the extent of smoothing required can be expressed in terms of
smoothing parameters or equivalent degrees of freedom (EDF).
Raising and lowering the EDF changes the deviance. The LMS
Chart Maker Light version 2.4 [Pan and Cole, 2007] program
allows choice of the variables, and fit can be improved by rescaling
the age.
The construction of a population growth reference, �2 SD
in range, requires approximately 50 measurements per year [Cole,
002].Where<50, constructing a chart using the 9th to 91st centiles,
within the ‘‘tails’’ of the normal Gaussian distribution, �1.33 SD
from themean is robust [Cole et al., 2007]. It was therefore decided
to produce charts with 5 centile lines, each 0.67 SD apart, the 9th,
25th, 50th, 75th, and 91st centiles (available from the authors). For
illustrative purposes the 9th, 50th, and 91st centiles are shown. The
international growth references for height, weight, bodymass index
(BMI) as weight/height2, and OFC comparison wereWorld Health
Organization (WHO) charts from birth to 4 years [WHO, 2006],
combined with the US Centres for Disease Control 2000 charts
from 5 years upwards for height, weight and BMI [CDC, 2000].
Combining the WHO chart with the US CDC 2000 growth
reference for comparison in older age groups has been reviewed
[de Onis et al., 2007].
OFCwas compared with the US reference which stops at 3 years,
and the WHO-UK combined reference chart which covered the
age range of the subjects. The combined reference charts were
overlaid on the derived 22q11 DS curves to allow comparison with
normal populations.
The Growth Comparator [Pan and Cole, 2007] was used to
derive standard deviation scores (z scores) of the growth references,
and values reported as z scores.
Numbers for each growth variable were: height in centimetres
(cm) for boys 1,027, girls 1,138; weight in kilograms (kg) for boys
820, girls 966; BMI (kg/m2) 828 boys, 825 girls; OFC in cm for boys
542, girls 627. 59% of data were of subjects attending CHOP, 41%
GOSH. The proportion prematurely born was not accurately
known, but is thought not to be significantly increased in 22q11
DS compared with the general population.
The number of measurements per year up to 5 years old ranged
from 222 in the first year to 56 at 4 years for height and weight,
149–37 forOFC; from5to10years between33and75per year for all
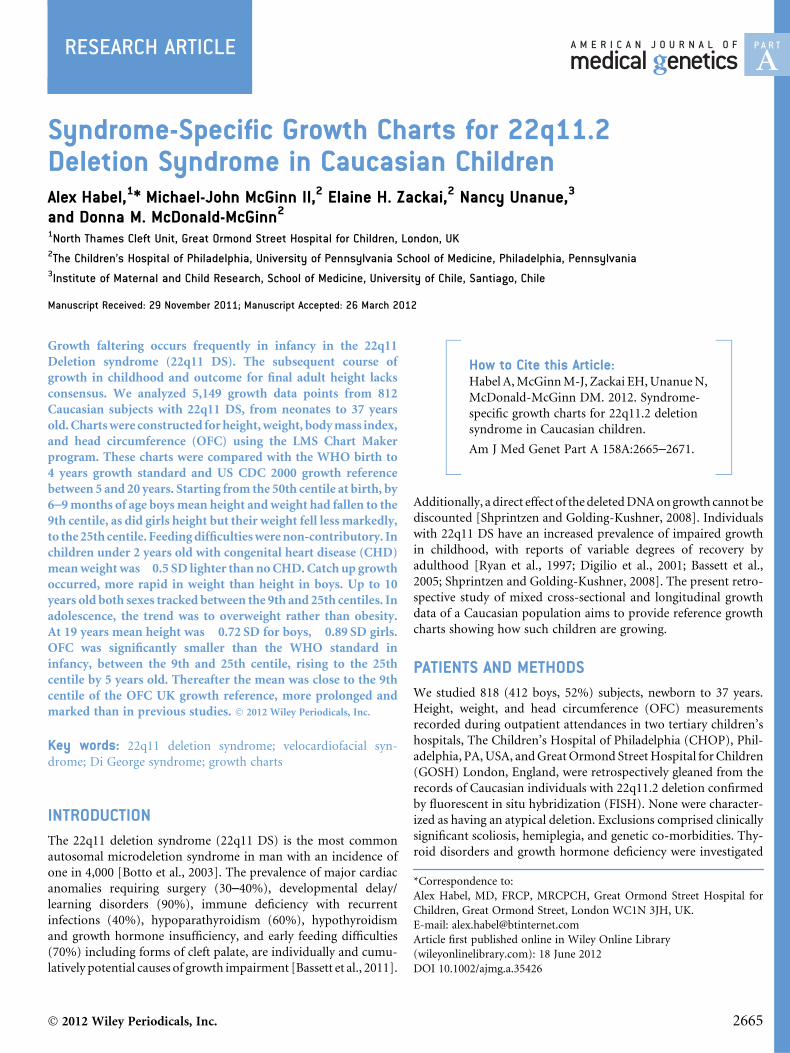
FIG. 1. Boys and girls height. Birth to 20 years. 9th, 50th, and 91st centile lines for 22q11 DS (solid) and composite Reference (dashed).
2666 AMERICAN JOURNAL OF MEDICAL GENETICS PART A
parameters; from 11 to 20 years between 21 and 42 per year for
height and weight, and 7 to 53 for OFC.
The proportion of subjects with one data set was 27%, 2–3 14%,
and a maximum of 15 data sets in 1%. Of 818 (412 males, 52%)
subjects, 38 (16males) were over 19 years old, whose data were time
frozen at 19.9 years. From5,149 data, 29 (0.5%)were excluded after
cleansing and modelling.
RESULTS
HeightMean height for both sexes fell from theWHO 50th centile at birth
to 9th centile by 9months of age, and tracked the 9th centile up to 5
years old. Thereafter the 22q11 DS 50th centile lay between the US
9thand25th centiles, approximately�1 SD (range�0.6 to�1.4 SD).
The pubertal growth spurt was not delayed. Growth curves leveled
out at 17 years for boys, mean height 172� 8 cm, (�0.72 SD), and
16 years for girls, mean height 158� 6 cm (�0.89 SD; Fig. 1).
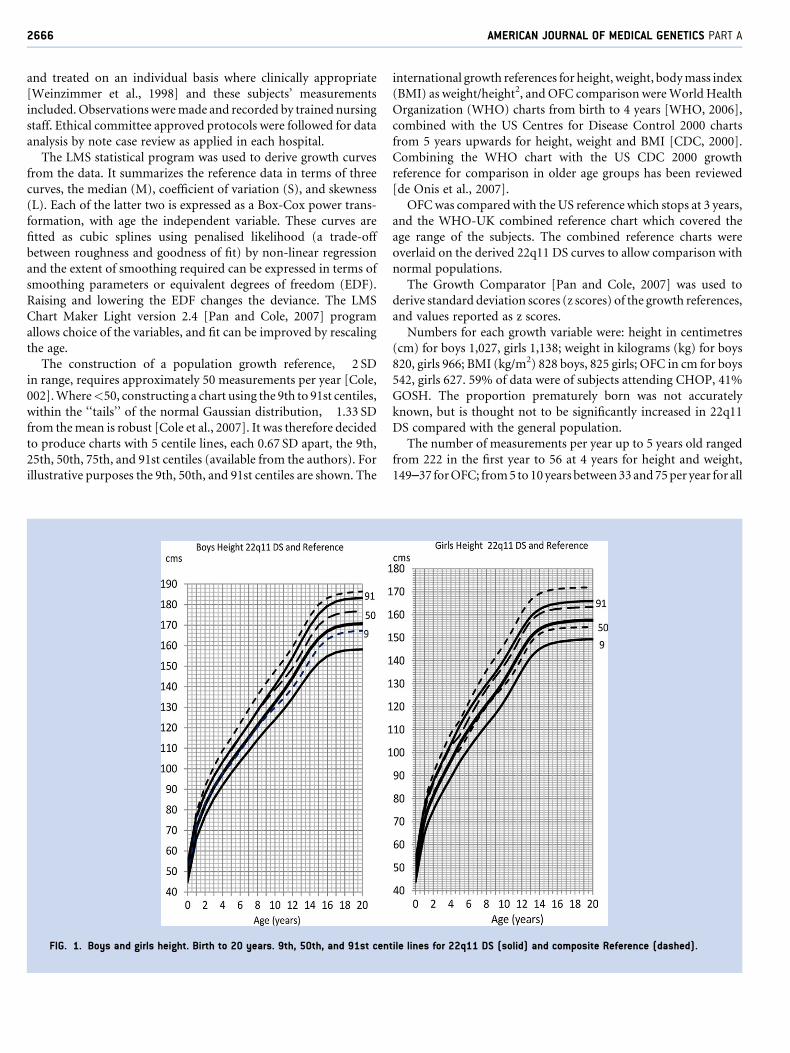
WeightIn the first 2 years boys’meanweight fell frombetween the 25th and
50th centile at birth to below the 9th by 6 months, and returned
towards the 25th by 2 years; girls showed less severeweight faltering,
falling from the 50th to the 25th centile. The year of agemean z score
between 3 and 10 years for both sexes averaged �0.65 SD (range
�0.02 to �1.02), in adolescence the mean of �0.22 SD (�0.97 to
0.23) was closer to the reference population (Fig. 2).
In the first 2 years wide z score SD’s in height (boys mean
z score �1.82, SD 1.42; girls mean z score �1.66, SD 1.44) and
weight (boysmean z score�1.63, SD 1.21; girlsmean z score�1.34,
SD 1.33) were consistent with a broad spectrum of growth or two
populations. Comparison between the North American and
British subjects identified only small mean z score differences of
0.05–0.27 SD, for height, weight, and OFC.
Growth impairment was then assessed applying WHO criteria
for the prevalence of low height for age, underweight for age, and
thinness as lowweight for height expressed asBMI. Impairmentwas
defined aspresentwhen�2 SDand severe if�3 SD.All data of those
<5 years old were analyzed, comprising 226 boys and 207 girls. The
prevalence of growth failurewas highest under 2 years of age.Under
a year, 39% were low height for age which was severe in 16%,
underweight for age in 43% and severe in 14%. Thinness was less
prevalent, total 24%, severe in 9%. By 5 years recovery was taking
place, height lagging behind that of weight, with the prevalence of
�2 SD for height 28% compared with weight at 16%. The severely
FIG. 2. Boys and girls weight. Birth to 20 years. 9th, 50th, and 91st centile lines for 22q11 DS (solid) and composite Reference (dashed).
HABEL ET AL. 2667
affected, as reflected in those below�3 SD, fell to 5% for height and
2% for weight; thinness below �2 SD fell to 4% in total, close to
expected.
Factors potentially associated with undernutrition in under 2
years old, feeding difficulties and CHD, were scrutinized in a
subgroup of GOSH subjects, by comparing mean weight z scores.
Those with feeding problems (98 subjects) showed a small differ-
ence in mean weight z scores, �1.79, SD 1.13, from those without
(35 subjects)�1.70, SD 0.95. In the presence of CHD (97 subjects),
independent of whether cyanotic or non-cyanotic, there was a
mean �0.55 SD difference in weight compared with no CHD
(36 subjects), the mean z scores being �2.06 SD versus �1.51 SD.
Above 2 years of age no differences in mean z scores were found
between subjects with or without CHD.
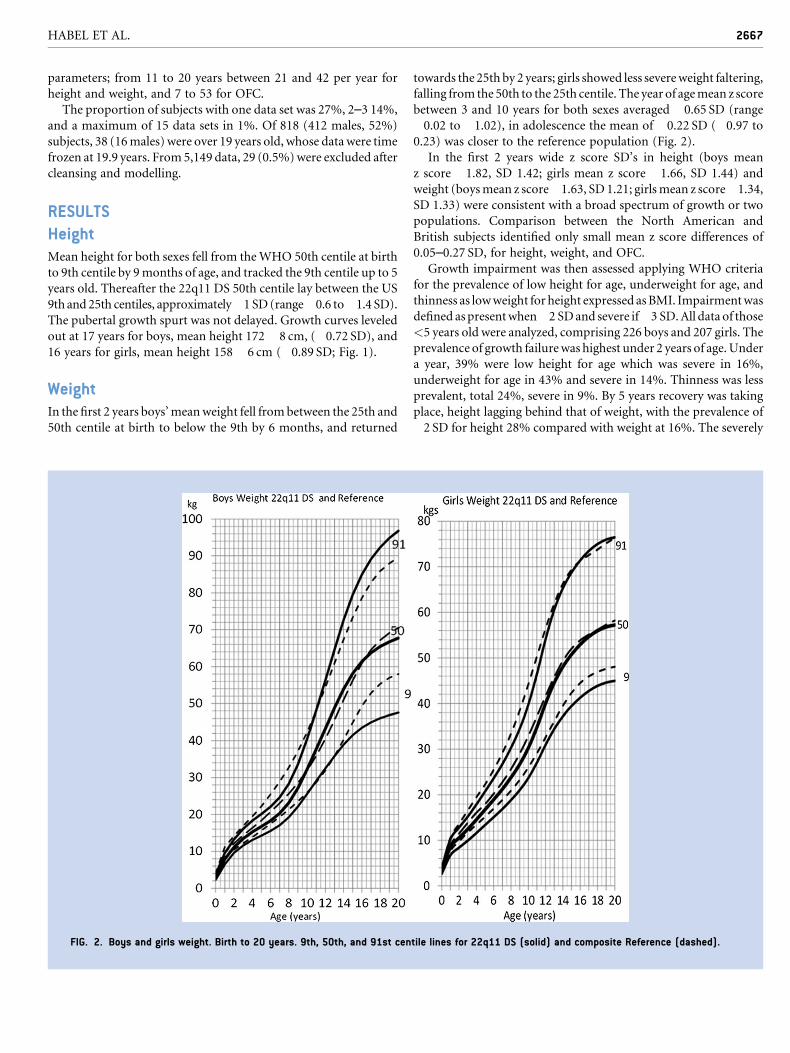
BMIIn the first 1–2 years of life BMI showed a delayed peak compared
with the normal population, with a staggered curve up to age 6
years. The maintenance of the mean BMI and range close to the
reference population over 2 years old reflected the earlier recovery
in weight than height. Between the ages of 10 and 19 years over-
weight, >85th centile, was 21% in boys, 27% in girls, and obesity
>95th centile was 7% in boys, 8% in girls (Fig. 3).
Head Circumference (OFC)Compared with the WHO standard the 50th centile was �1.21 SD
below the mean in the first year, and remained a little less than
�0.5 SDup to 5 years. TheUSCDC2000 reference provided similar
mean z scores,�1.39 SD in the first year,�0.65 SD second year, and
�0.62 SD in the third year. The prevalence of microcephaly below
the WHO �2 SD centile in boys was 30% (44/149), and girls 24%
(27/114) in the first year. This prevalence persisted in both sexes up
to 5 years old. The US CDC 2000 reference, restricted to the first 3
years of life, provided prevalence rates for�2 SD of 25% in the first
year falling to 12% by 3 years. An increase in values at the interface
between the compositeWHO standard and UK reference at 5 years
created a chart disjunction. This shifted the 22q11 DS 50th centile
close to theWHO-UKChart 9th centile,�1.33 SD below themean,
where it remained until late adolescence (Fig. 4).
Although the number of data over 10 years old were less than
optimal, the plot of the growth curves and intercentile line distances
were similar to the reference, except the outer centile lines for boys
weight, which was reflected in the BMI curves, in late adolescence.
DISCUSSION
Growth faltering is a significant problem in22q11DS in infancy and
the preschool years. Ryan et al. [1997] in a large multicenter
European study of children found the weight to be below the
50th centile in 83%, and the 3rd centile in 36%. Similarly, Shprint-
zen and Golding-Kushner [2008] in a large study lacking stand-
ardized growth measurements and demographics found mean
height and weight to be below the 10th centile under 1 year of
age. They found mean height and weight rose to the 25th centile
prior to the adolescent growth spurt. Subsequent mean height and
FIG. 3. Boys and girls BMI. Birth to 20 years. 9th, 50th, and 91st centile lines for 22q11 DS (solid) and composite Reference (dashed).
2668 AMERICAN JOURNAL OF MEDICAL GENETICS PART A

weight in adult females were on the 25th centile, and rose to the
50th centile in adult males. Digilio et al. [2001] found in 73 Italian
children aged 0.3–16 years only 10% had short stature, all aged
under 10 years old. The height distribution in 16 adolescents was
within the normal range, with 31% obese. Among 78 Canadian
adults Bassett et al. [2005] found a 20% prevalence of short stature
below the 3rd centile, and obesity in 35%. The present study
confirms the marked growth faltering in the first 6–9 months of
age. Weight recovered more quickly than height, especially in girls.
Height velocity continued to be reduced up to adult life, which
resulted in below average final height.
The infant growth data are consistent with early undernutrition,
of high (30–39%) to very high >40% prevalence [Golden, 1994].
The subsequent growth is characteristic of catch up [Prader et al.,
1963]. Investigating this phenomenon, Costello [1989] found that
the nutritional impact on long-term growth was limited to those
aged <2 years old at the time of restricted food intake. When
undernutrition is followed into adult life, 65–70% of the difference
in height is linked to being �2 SD in height under 18 months old
[Waterlow, 1988], the remainder due to continued impaired
growth in later phases [Luo and Karlberg, 2000].
The cause of the early period of growth failure is uncertain at
present. If it were attributable to reduced muscle mass [Shprintzen
and Golding-Kushner, 2008] then one would not anticipate height
tobe affected. Feedingdifficulties andCHDappear toplay relatively
little part, though optimising treatment to minimize the effects of
incoordinate feeding, gastroesophageal reflux, gut dysmotility,
and maximize cardiac function remains paramount An under
researched factor in this context could be recurrent infection in
altered immune states impacting on intestinal function. From the
present study 12 symptomatic children were investigated [Tomar
et al., 2010]. Low total immunoglobulins were found in 73%, one
needing IgG and IgM supplementation, and 11 had normal lym-
phocyte counts. T cells were absent in one and slightly low in two.
Themost common features on gut biopsymicroscopy were plasma
cell and lymphocyte infiltration in nine, ranging from gastritis to
pan enteric inflammation, and one had eosinophilic esophagitis.
These findings support the possibility that they represent the more
severe end of a spectrum of gastrointestinal dysfunction whichmay
be common. Further, the reduction in frequency and severity of
infections with age which occur in 22q11DS childrenmay facilitate
the catch up growth.
The prevalence of thyroid and growth hormone deficiency is
increased [Weinzimmer et al., 1998]. However the onset of growth
faltering we observed is earlier than the usual presentation of
growth hormone deficiency, which occurs after the age of 1 year.
FIG. 4. Boys and girls head circumference birth to 20 years. 9th, 50th, and 91st centile lines for 22q11 DS (solid) and composite Reference (dashed).
HABEL ET AL. 2669
Although the prevalence of hypothyroidism is increased it is
routinely screened for and treated in our patients and would not
have contributed in a major way.
Some report the prevalence ofmicrocephaly is increased [Digilio
et al., 2001; Bassett et al., 2005; Shprintzen and Golding-Kushner,
2008], others do not [Ryan et al., 1997]. Its prevalence of �2 SD
(3rd centile) was 10% in Italian subjects, and 6% in Canadian
adults. The WHO-UK OFC growth standard in the present study
found a higher proportion; 30% were �2 SD, up to 5 years of age,
and the mean was significantly below the reference population.
TheUSCDC 2000OFC reference prevalence ofmicrocephaly was a
half that of the WHO growth standard, a potentially significant
underestimate for misclassified individuals. Disjunction about the
age of 5 years between the WHO and UK head circumference
references, combined in the WHO-UK chart, requires interpreta-
tion [Royal College of Paediatrics and Child Health, 2007]. In
addition, variation in head measurement technique may account
for some discrepancy between reference charts, and affect conclu-
sions [Wright et al., 2011]. As craniosynostosis is increased in 22q11
DS[McDonald-McGinn et al., 2005] a considered approach to skull
and brain imaging is appropriate when developmental and neuro-
logical symptoms or signs are present. The OFC findings in 22q11
DS reflect reduction in brain volume and neural connections
[Barnea-Goraly et al., 2005; Campbell et al., 2006]. Although
generally considered the consequence of the loss of genetic material
in the deletion, early growth faltering may contribute.
The prevalence of obesity in the 22q11 DS adolescents in this
study was 7–8%, half the present rate of non-Hispanic Caucasian
American boys of 17%and girls 15%[Ogden et al., 2010].However,
their overall prevalence of 32% for overweight including obesity is
similar to the study population of 28–35%. The trend towards
overweight rather than obesity in 22q11 DS suggests early feeding
difficulties may leave a legacy modifying dietary intake. This is
beneficial as physical activity is limited in 22q11 DS by hypotonia,
leg pains on exercise, and reduced exercise tolerance from heart or
respiratory difficulties that the individual’s clinical condition
impose.
CONCLUSION
The 22q11 growth reference is representative of how such Cauca-
sian children are growing compared with the WHO growth stand-
ard combined with the US CDC 2000 reference. Growth faltering is
common in the first year of life and is most evident under 5 years
of age. Recovery in height is incomplete, unlike weight gain. OFC is
reduced from birth to 20 years compared with the WHO-UK
growth reference. Investigation of microcephaly should be on a
caseby case basis. Further investigationof theperiodof early growth
faltering may identify treatable causes.
Supplementary Growth Charts22q11 DS five centile reference charts for height, weight, BMI, and
head circumference overlaid with theWHO standard from birth to
5 years, or combinedwith the USCD 2000 reference birth to 20 years,
can be downloaded: http://www.gosh.nhs.uk/medical-conditions/
search-for-medical-conditions/digeorge-syndrome/di-george-
syndrome-information/. The PDF can be found beneath the sub-
heading ‘‘Glands, hormones and growth’’ and at the bottom of the
‘‘Useful documents’’ box on the right-hand of the webpage.
ACKNOWLEDGMENTS
The advice of Tim Cole in constructing the charts is gratefully
acknowledged.This studywouldnothavebeenpossiblewithout the
help of the nurses, administrative, and secretarial staff of the North
Thames Cleft Unit andCytogenetics Department of Great Ormond
Street Hospital and Genetics Department of The Children’s
Hospital of Philadelphia.
REFERENCES
Barnea-Goraly N, Eliez S, Menon V, Bammer R, Reiss AL. 2005.Arithmetic ability and parietal alterations: A diffuse tensor imagingstudy in Velocardiofacial syndrome. Brain Res Cogn Brain Res 25:735–740.
BassettAS,McDonald-McGinnDM,DevriendtK,DigilioMC,GoldenbergP, Habel A, Marino B, Oskarsdottir S, Philip N, Sullivan K, Swillen A,Vorstman J. International 22q11.2. Deletion Syndrome Consortium.2011. Practical guidelines for managing patients with 22q11.2 deletionsyndrome. J Pediatr 159:332–339.
Bassett AS, Chow EWC, Husted J, Weksberg R, Caluseriu O, Webb GD,Gatzoulis MA. 2005. Clinical features of 78 adults with 22q11 deletionsyndrome. Am J Med Genet 138:307–313.
Botto LD, May K, Fernhoff PM, Correa A, Coleman K, Rasmussen SA,Merritt RK, O’Leary LA, Wong LY, Elixson EM. 2003. A population-based study of the 22q11.2 deletion: Phenotype, incidence, andcontribution to major birth defects in the population. Pediatrics112:101–117.
Campbell LE, Daly E, Toal F, Stevens A, Azuma R, Catani M, Ng V, vanAmelsvoort T, Chitnis X, Cutter W, Murphy DGM, Murphy KC. 2006.Brain and behaviour in children with 22q11.2 deletion syndrome: Avolumetric and voxel-based morphometry MRI study. Brain 129:1218–1228.
Centers for Disease Control and Prevention. 2000. CDC Growth Charts:United States. Centers for Disease Control and Prevention [website].Available at: www.cdc.gov/growthcharts
Cole TJ. 2002. Growth references and standards. In: Cameron N, editor.Lectures on human growth. London: Academic Press. pp 383–413.
Cole TJ, Flegal KM,Nicholls D, JacksonAA. 2007. Bodymass index cut offsto define thinness in children and adolescents: International survey. BMJ335:194–204.
Costello AM. 1989. Growth velocity and stunting in rural Nepal. Arch DisChild 64:1478–1482.
de Onis M, Garza C, Onyango AW, Borghi E. 2007. Comparison of theWHOChildGrowth Standards and theCDC2000GrowthCharts. JNutr137:144–148.
Digilio MC, Marino B, Cappa M, Cambiaso P, Gianotti A, Dallapiccola B.2001. Auxiological evaluation in patients with DiGeorge/Velocardio-facial syndrome (deletion 22q11.2 syndrome). Genet Med 3:30–33.
Golden MMN. 1994. Is complete catch-up possible for stunted malnour-ished children? Eur J Clin Nutr 48:58–71.
Luo ZC, Karlberg J. 2000. Critical growth phases for adult shortness. Am JEpidemiol 152:125–131.
2670 AMERICAN JOURNAL OF MEDICAL GENETICS PART A

McDonald-McGinn DM, Gripp KW, Kirschner RE, Maisenbacher MK,Hustead V, Schauer GM, Keppler-Noreuil KM, Ciprero KL, PasquarielloP Jr, LaRossa D, Bartlett SP, Whitaker LA, Zackai EH. 2005. Craniosy-nostosis: Another feature of the 22q11.2 deletion syndrome. Am J MedGenet Part A 136A:358–362.
OgdenCL,CarrollMD,CurtinLR, LambMM,FlegalKM. 2010. Prevalenceof high body mass index in US children and adolescents 2007–2008.JAMA 303:242–249.
Pan H, Cole TJ. 2007. LMS Chartmaker 2.4. Medical Research Council.www.healthcareforallchildren.co.uk/
Prader A, Tanner JM, von Harnack GA. 1963. Catch-up growth followingillness or starvation: An example of developmental canalization inman. JPediatr 62:646–649.
Royal College of Paediatrics and Child Health. 2007. Application of WHOgrowth standards in the UK. Report prepared by the Joint SACN/RCPCExpert Group on Growth Standards. www.sacn.gov.uk/. . ./sacn.rcpch_who_growth_standards_report_final
Ryan AK, Goodship JA, Wilson DI, Philip N, Levy A, Seidel H,Schuffenhauer S, Oechsler H, Belohradsky B, Prieur M, et al., 1997.Spectrum of clinical features associated with interstitial chromosome
22q11 deletions: A European collaborative study. J Med Genet 34:798–804.
Shprintzen R, Golding-Kushner K. 2008. Velo-cardio-facial syndrome,Vol. 1. San Diego: Plural Publishing. pp 238–247.
Tomar R, Hassan AS, Kiparissi F, Foryth A, Habel A, Elawad MA. 2010.Gastrointestinal inflammation in children with Di George Syndrome.Coventry, UK: Seventh Biennial International 22q11.2 Deletion Syn-drome Conference.
Waterlow JC. 1988. Linear growth retardation in less developed countries.Nestle Nutrition Workshop Series, vol 14. New York: Raven Press. pp1–116.
WeinzimmerSA,McDonald-McGinnDM,DriscollDA,EmanuelBS,ZackaiEH, Moshang T. 1998. Growth hormone deficiency in patients with a22q11.2 deletion: Expanding the phenotype. Pediatrics 101:929–932.
WHO. 2006. Growth Standards for weight, length/height and BMI centiles(boys and girls) http://www.who.int/childgrowth/standards/en/
Wright CM, Inskip HM, Godfrey K, Williams AF, Ong KK. 2011 Mon-itoring head size and growth using the new UK-WHO growth standard.Arch Dis Child 96:386–388.
HABEL ET AL. 2671


![Association between phenotype and deletion size in 22q11.2 ......deletion in 43 of them [13]. Hwang et al. (2014) included 80 individuals from a neurodevelopmental clinic in the United](https://img.pdfslide.us/doc/110x75/6131b9161ecc51586944ea4f/association-between-phenotype-and-deletion-size-in-22q112-deletion-in-43.jpg)